Attached files
| file | filename |
|---|---|
| 8-K - 8-K - CF Industries Holdings, Inc. | a11-26335_18k.htm |
Exhibit 99.1
|
|
Corporate Development Supply Chain Sales Finance Legal Operations Human Resources Dv Sc Sa Fi Le Op Hr CF Industries NYSE: CF KeyBanc Basic Materials & Packaging Conference September 13, 2011 |
|
|
Certain statements contained in this communication may constitute "forward-looking statements." All statements in this communication, other than those relating to historical information or current condition, are forward-looking statements. These forward-looking statements are subject to a number of risks and uncertainties, many of which are beyond our control, which could cause actual results to differ materially from such statements. Important factors that could cause actual results to differ materially from our expectations include, among others: the volatile cost of natural gas in the areas where our production facilities are principally located; the cyclical nature of our business and the agricultural sector; the global commodity nature of our fertilizer products, the impact of global supply and demand on our selling prices, and the intense global competition in the consolidating markets in which we operate; conditions in the U.S. agricultural industry; reliance on third party transportation providers; our ability to integrate the Terra businesses promptly and effectively and to achieve the cost savings and synergies we anticipate from the acquisition within the expected time frame or at all, the potential for disruption from the acquisition to make it more difficult for us to maintain relationships with customers, employees or suppliers, and the impact of system integration efforts, including the implementation of a new enterprise resource planning (ERP) system; weather conditions; risks associated with expansion of our business, including unanticipated adverse consequences and the significant resources that could be required; potential liabilities and expenditures related to environmental and health and safety laws and regulations; our potential inability to obtain or maintain required permits and governmental approvals or to meet financial assurance requirements; future regulatory restrictions and requirements related to greenhouse gas emissions and climate change; our inability to predict seasonal demand for our products accurately; the impact of changing market conditions on our forward sales programs; risks involving derivatives and the effectiveness of our risk measurement and hedging activities; the reliance of our operations on a limited number of key facilities and the significant risks and hazards against which we may not be fully insured; risks associated with joint ventures; acts of terrorism and regulations to combat terrorism; difficulties in securing the supply and delivery of raw materials we use and increases in their costs; risks associated with international operations; the concentration of our sales with certain large customers; losses on our investments in securities; deterioration of global market and economic conditions; our substantial indebtedness and the limitations on our operations imposed by the terms of our indebtedness; our ability to comply with the covenants under our indebtedness and to make payments under such indebtedness when due; potential inability to refinance our indebtedness in connection with any change of control affecting us; and loss of key members of management and professional staff. Forward-looking statements are given only as of the date of this release and we disclaim any obligation to update or revise the forward-looking statements, whether as a result of new information, future events or otherwise, except as required by law. Safe Harbor Statement |
|
|
Tony Will Vice President, Manufacturing and Distribution |

|
|
Manufacturing and Distribution Locations Medicine Hat Courtright Port Neal Woodward Verdigris Yazoo City Donaldsonville Plant City Hardee (Mine) Ritzville Velva Grand Forks Glenwood Pine Bend Blair Garner Aurora Fremont Spencer Tampa Palmyra Mt. Vernon Cowden Terre Haute Frankfort Huntington Kingston Mines Seneca Peru Terminals Manufacturing Complex Albany |
|
|
Nitrogen Leadership Sales Volume (000 st) North America’s leading producer of all four primary nitrogen products World’s leading producer of UAN Segment size doubled with acquisition of Terra Industries in April 2010 6.5 million nutrient tons annual nitrogen capacity (converted to 14.0 million product tons) Seven nitrogen production complexes in North America, plus three 50%-owned joint venture plants in Trinidad and the U.K. Extensive transportation and storage capability supporting highly seasonal agriculture business 2008 2009 2010 2011 Terra acquisition |
|
|
Phosphate Operations Advantages World scale operation 3.5 million tons of phosphate rock annually 1 million tons of P2O5 2 million tons DAP/MAP Well balanced, fully integrated system 12 years fully permitted reserves at current rates; permitting process begun for additional 10 years of reserves Excellent location and Keytrade relationship support nimble export capability |
|
|
Record Profits and Cash Flow Any-quarter record Second quarter record 2006 2007 2008 2009 2010 2011 Earnings per Share Operating Cash Flow (millions) Terra acquisition improved earnings power and cash flow |
|
|
Capital Deployment Quadrupling of regular quarterly dividend to $0.40 Project investments of up to $1.0 to $1.5 billion over the next four years Debottlenecking Increased upgrading of ammonia Expenditure of up to $1.5 billion to repurchase shares through December 31, 2013 Focused on shareholder value |
|
|
USDA Corn Supply Revision WASDE Report Jun. 9, 2011 Jul. 12, 2011 Aug.11, 2011 Sep. 12, 2011 Sep. vs. Aug. Planted Acres (millions) 90.7 92.3 92.3 92.3 - Harvested Acres (millions) 83.2 84.9 84.4 84.4 - Yield (Bu/acre) 158.7 158.7 153.0 148.1 (4.9) Production (million Bu) 13,200 13,470 12,914 12,497 (417) Total Supply (million Bu) 13,950 14,370 13,874 13,432 (442) Excessive heat in July reduced yield potential |
|
|
USDA Corn Demand/Stocks Revision Million Bushels except Ratio WASDE Report Jun. 9, 2011 Jul. 12, 2011 Aug. 11, 2011 Sep. 12, 2011 Sep. vs. Aug. Feed Use 5,000 5,050 4,900 4,700 (200) Ethanol 5,050 5,150 5,100 5,000 (100) Food/Seed/Other Ind. 1,405 1,400 1,410 1,410 - Exports 1,800 1,900 1,750 1,650 (100) Total Usage 13,255 13,500 13,160 12,760 (400) Ending Stocks 695 870 714 672 (42) Stocks-to-Use Ratio 5.2% 6.4% 5.4% 5.3% (0.1)% Average Farm Price $6.50 $6.00 $6.70 $7.00 $0.30 Average farm price rises to ration demand |
|
|
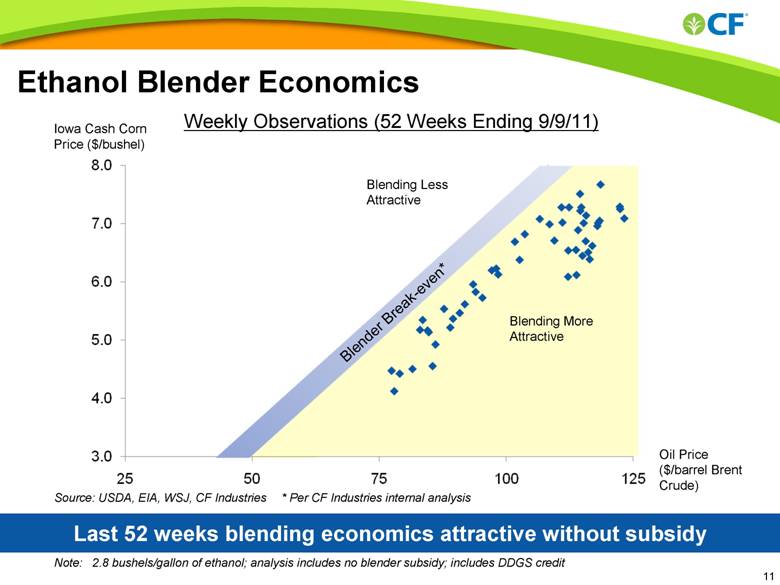
Ethanol Blender Economics Note: 2.8 bushels/gallon of ethanol; analysis includes no blender subsidy; includes DDGS credit Iowa Cash Corn Price ($/bushel) Oil Price ($/barrel Brent Crude) Weekly Observations (52 Weeks Ending 9/9/11) Source: USDA, EIA, WSJ, CF Industries * Per CF Industries internal analysis Last 52 weeks blending economics attractive without subsidy Approximate Blender Break-even* Blending More Attractive Blending Less Attractive |
|
|
U.S. Corn Demand and Stocks (Billion bushels, marketing year basis) Source: USDA, CF |
|
|
Crop Nutrient Prices Source: Green Markets 2010 2011 Ammonia Urea UAN-32 Mid-Cornbelt Prices Prices have risen gradually but persistently Demand has risen with crop prices and acreage response Supply has been limited by lower urea and DAP exports from China DAP Supply/demand balance continues to be tight |
|
|
China Urea Export Tariff Year High Season Tariff Low Season Tariff Months in Low Season Est. Exports (MMT) Aug. 31 Producer Inv. (MMT) 2008 135%-185% 10%-35% 4.5 4.4 2009 110% 10% 5.5 3.4 2010 110% 7% 6.0 7.0 1.3 2011 110% 21%-28%* 4.0 3.2* 0.7 Source: China Fertilizer Market Week, other industry sources * CF Industries estimate/forecast Government goals: domestic fertilizer availability and energy security |
|
|
N.A. Natural Gas Volatility Reduced Three consecutive extreme weather seasons Summer ’10 was 2nd hottest in last 25 years for continental U.S. Winter ’10-’11 was 4th coldest in 25 years July ‘11 hottest in over 50 years In 2011, Texas and Oklahoma recorded the hottest summers ever by any state Little upward price pressure and low volatility Supply responded to demand surges 2007 2008 2009 2010 2011 Ample supply, little upward price pressure, lower volatility Source: Bloomberg |
|
|
Favorable Outlook for Corn and Natural Gas Source: USDA, EIA, Bloomberg, CF Industries *CF Industries projection 2012-2015 U.S. Corn Plantings* Projected U.S. Corn Plantings (million acres) Avg. Natural Gas Cost per MMBtu at Henry Hub Several years of large plantings and favorable gas costs expected |
|
|
An Execution Story Operational integration of Terra complete Completed major upgrading project at Woodward in Q1 High plant utilization Leveraged plant/terminal network and all modes of transport to overcome spring logistical challenges Strong profitability and cash flow Favorable industry conditions and excellent company performance |
|
|
[LOGO] |