Attached files
| file | filename |
|---|---|
| 8-K - FORM 8-K - WASTE MANAGEMENT INC | h84575e8vk.htm |
Exhibit 99.1
| Waste Management, Inc. Investor Meetings September 2011 |
| Cautionary Statement Certain statements provided in this presentation are "forward-looking statements" within the meaning of Section 27A of the Securities Act of 1933 and Section 21E of the Securities Exchange Act of 1934. Forward-looking statements are often identified by the words, "will," "may," "should," "continue," "anticipate," "believe," "expect," "plan," "forecast," "project," "estimate," "intend" and words of similar nature, and such statements generally contain projections about accounting and finances; plans and objectives for the future; projections or estimates about assumptions relating to our performance; or our opinions, views or beliefs about the effects of current or future events, circumstances or performance. You should view these statements with caution. These statements are not guarantees of future performance, circumstances or events. They are based on the facts and circumstances known to us as of the date the statements are made. All phases of our business are subject to uncertainties, risks and other influences, many of which we do not control. Any of these factors, either alone or taken together, could have a material adverse effect on us and could cause actual results to be materially different from those set forth in such forward-looking statement. We assume no obligation to update any forward-looking statement, including financial estimates, whether as a result of future events, circumstances or developments or otherwise. Some of these risks and uncertainties are described in greater detail in Waste Management's Form 10-K for the year ended December 31, 2010, as filed with the Securities and Exchange Commission. 2 |
| Non-GAAP Financial Measures This presentation contains non-GAAP financial measures under Regulation G of the Securities Exchange Act of 1934, as amended. The Company believes that these non-GAAP financial measures are useful to investors to assess the Company's performance, results of operations and cash available for the Company's capital allocation program. These non-GAAP measures are meant to supplement, not replace, comparable GAAP measures, and such non-GAAP measures may be different from similarly titled measures used by other companies. A reconciliation of these non-GAAP financial measures to their most directly comparable financial measures calculated and presented in accordance with generally accepted accounting principles can be found in the Annex at the end of this presentation and under the Investor Relations tab on our website: www.wm.com. 3 |
| Key Industry Strengths 4 Disciplined pricing Improving return on invested capital is a primary focus A significant portion of revenue has annuity-like characteristics Capital expenditures are controllable and predictable Cash flow is strong and predictable |
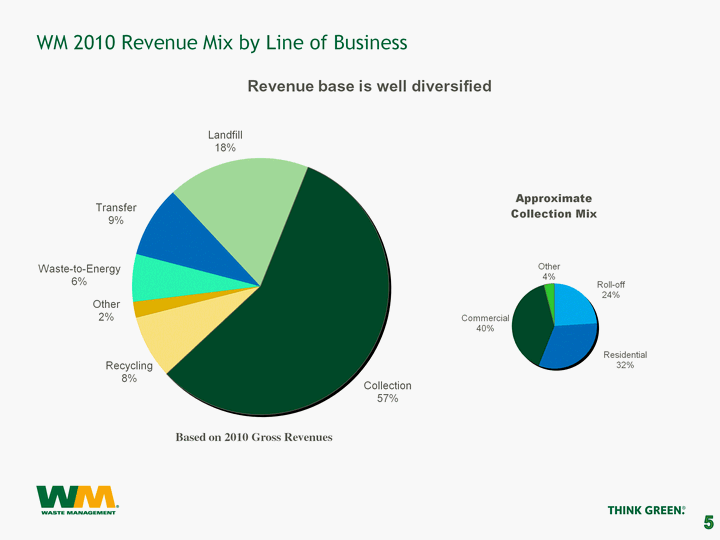
| WM 2010 Revenue Mix by Line of Business 5 (CHART) (CHART) Revenue base is well diversified Based on 2010 Gross Revenues |
| Our Strategy Continue to focus on price, targeting 50 to 100 basis points above CPI Know more about our customers and how to service them better than anyone else in the industry, through the use of customer focused segmentation and technology Manage the waste stream to extract more value from the material than anyone else Focus on efficiency and cost reduction 6 |
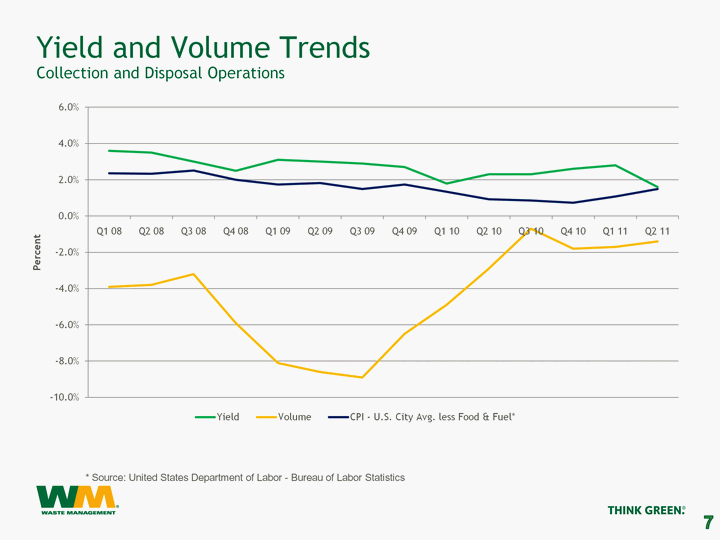
| Yield and Volume Trends Collection and Disposal Operations 7 * Source: United States Department of Labor - Bureau of Labor Statistics (CHART) |
| Why Customer Focused Growth through Segmentation is Right for WM Customer focused growth through segmentation presents an opportunity to drive significant incremental value by: Improving sales effectiveness with focused and specialized reps that understand customer needs, i.e. one point of contact Increasing penetration within the most profitable segments by establishing better relationships with customers within segments Better aligning pricing strategies with segment-specific economics and Customer Lifetime Value Expanding the market size by identifying and adding new service offerings Differentiating WM offerings to better meet the specific segment needs 8 |
| Acquisition of Oakleaf 9 Acquired Oakleaf effective July 28, 2011 for $425 million* The acquired operations generated approximately $580 million of revenue in 2010 Oakleaf has a substantial base of national accounts customers and these service relationships provide a growth opportunity for WM to increase volumes into our post-collection network As North America's leading outsourced waste service provider, Oakleaf has a North America vendor network of 2,500 preferred haulers Expands our service footprint to new geographies Opportunity for vendors to market unique WM services to their customer base We issued $500 million of debt to finance this acquisition We expect to achieve $80 million in annual run-rate EBITDA * The purchase price was subject to working capital and other adjustments. |
| How We Extract Value from Material Waste-to-energy (energy from waste) Curbside and commercial recycling Landfill-gas-to-energy or to fuel C&D recycling Roof shingle recycling Greenopolis (r) Recycling kiosks and on-line rewards WM LampTracker (r) Fluorescent light bulb recycling ThinkGreenFromHome (r).com Batteries and universal waste recycling MicroGREEN Expansion technology for plastics 10 eCycling Electronics recycling New technologies in organics processing Garrick Corporation Organic compost for retail market Harvest Power Aerobic and anaerobic digestion Terrabon L.L.C. Waste-to-fuel conversion technology Enerkem, Inc. Gasification and catalysis technology S4 Energy Solutions Plasma gasification technology Genomatica Syngas conversion technology |
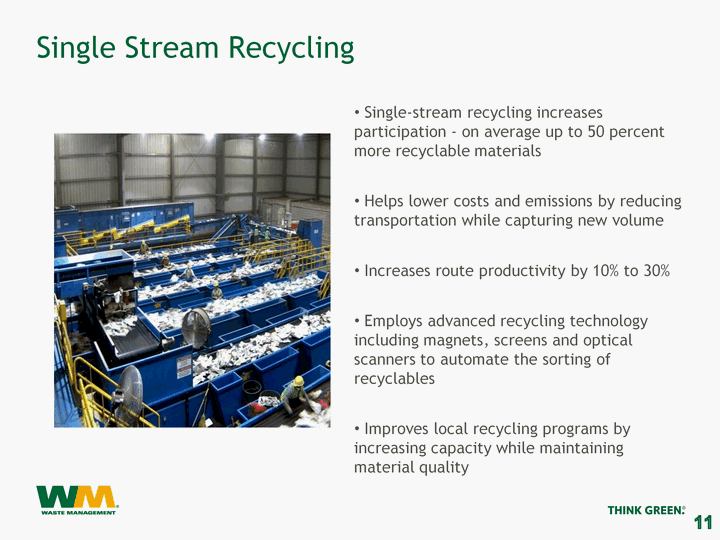
| Single Stream Recycling Single Stream Recycling Single-stream recycling increases participation - on average up to 50 percent more recyclable materials Helps lower costs and emissions by reducing transportation while capturing new volume Increases route productivity by 10% to 30% Employs advanced recycling technology including magnets, screens and optical scanners to automate the sorting of recyclables Improves local recycling programs by increasing capacity while maintaining material quality 11 |
| Cost Savings Initiatives 12 Investing today to provide long-term benefits Temporarily using consultants to assist with cost reductions and operational efficiencies while we build internal capabilities Focused on: Procurement Routing and Logistics Centralization of Dispatch |
| Financial Performance and Outlook |
| How We Measure Ourselves Returns are our primary focus In 2005 we made return on invested capital our key long-term focus, changing our Long-Term Incentive Plan accordingly At 10.5% in 2010, our return on invested capital is the best in the industry* Improving margins in each of our businesses Improving margins is a performance measure for our Annual Incentive Plan awards 14 * See the annex at the end of this presentation for a reconciliation of this non-GAAP financial measure to the most directly comparable GAAP measure |
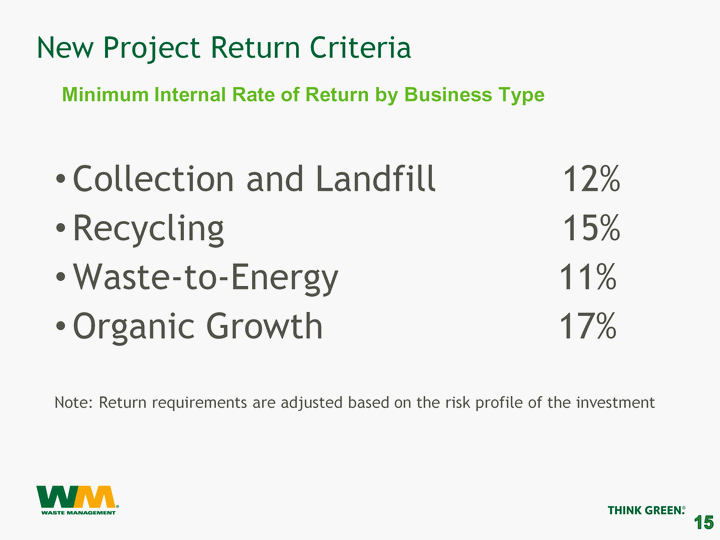
| New Project Return Criteria Collection and Landfill 12% Recycling 15% Waste-to-Energy 11% Organic Growth 17% Note: Return requirements are adjusted based on the risk profile of the investment 15 Minimum Internal Rate of Return by Business Type |
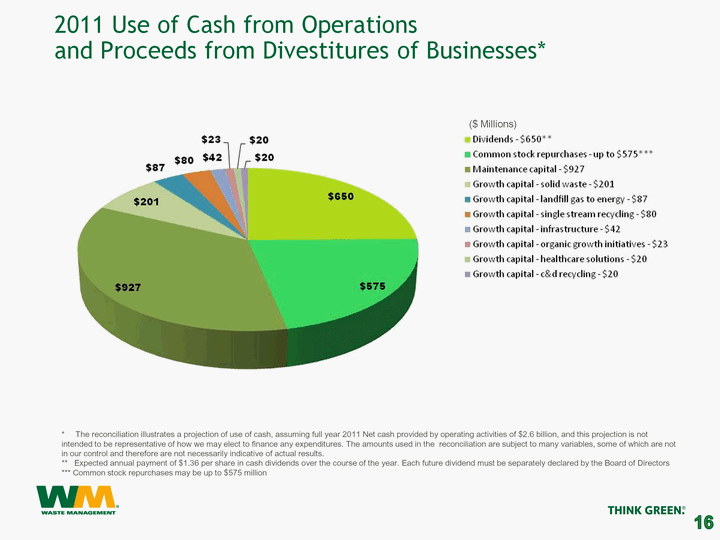
| 2011 Use of Cash from Operations and Proceeds from Divestitures of Businesses* 16 * The reconciliation illustrates a projection of use of cash, assuming full year 2011 Net cash provided by operating activities of $2.6 billion, and this projection is not intended to be representative of how we may elect to finance any expenditures. The amounts used in the reconciliation are subject to many variables, some of which are not in our control and therefore are not necessarily indicative of actual results. ** Expected annual payment of $1.36 per share in cash dividends over the course of the year. Each future dividend must be separately declared by the Board of Directors *** Common stock repurchases may be up to $575 million ($ Millions) |
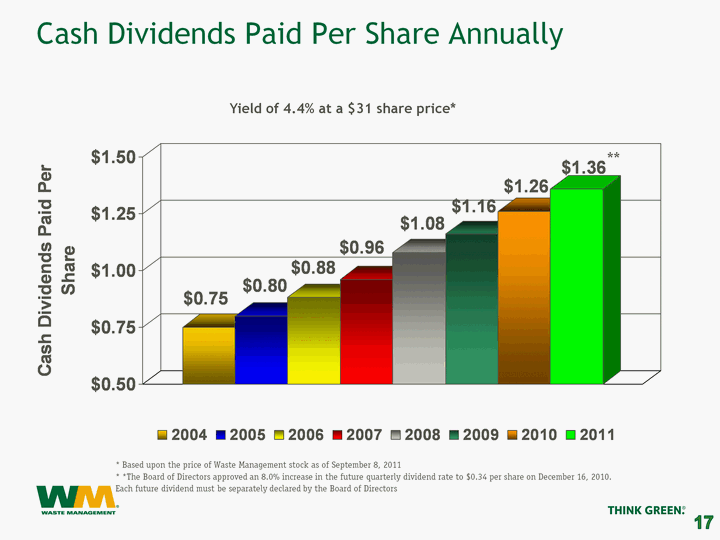
| Cash Dividends Paid Per Share Annually 17 Year 2004 0.75 2005 0.8 2006 0.88 2007 0.96 2008 1.08 2009 1.16 2010 1.26 2011 1.36 * Based upon the price of Waste Management stock as of September 8, 2011 * *The Board of Directors approved an 8.0% increase in the future quarterly dividend rate to $0.34 per share on December 16, 2010. Each future dividend must be separately declared by the Board of Directors ** Yield of 4.4% at a $31 share price* |
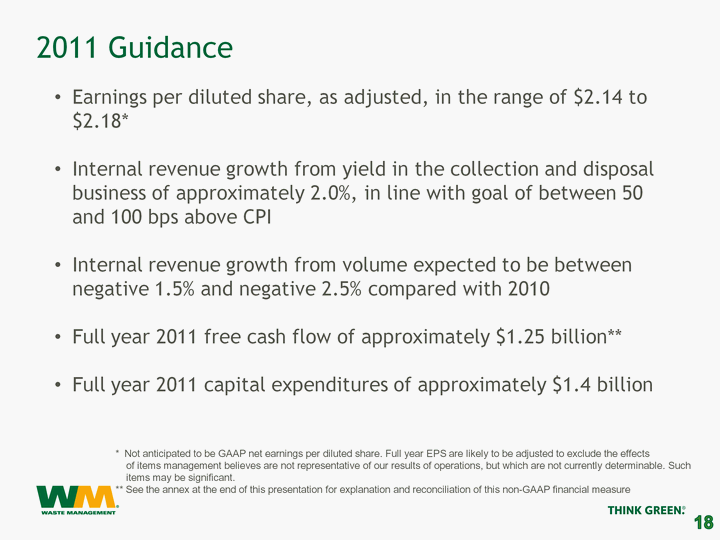
| 2011 Guidance Earnings per diluted share, as adjusted, in the range of $2.14 to $2.18* Internal revenue growth from yield in the collection and disposal business of approximately 2.0%, in line with goal of between 50 and 100 bps above CPI Internal revenue growth from volume expected to be between negative 1.5% and negative 2.5% compared with 2010 Full year 2011 free cash flow of approximately $1.25 billion** Full year 2011 capital expenditures of approximately $1.4 billion 18 * Not anticipated to be GAAP net earnings per diluted share. Full year EPS are likely to be adjusted to exclude the effects of items management believes are not representative of our results of operations, but which are not currently determinable. Such items may be significant. ** See the annex at the end of this presentation for explanation and reconciliation of this non-GAAP financial measure |
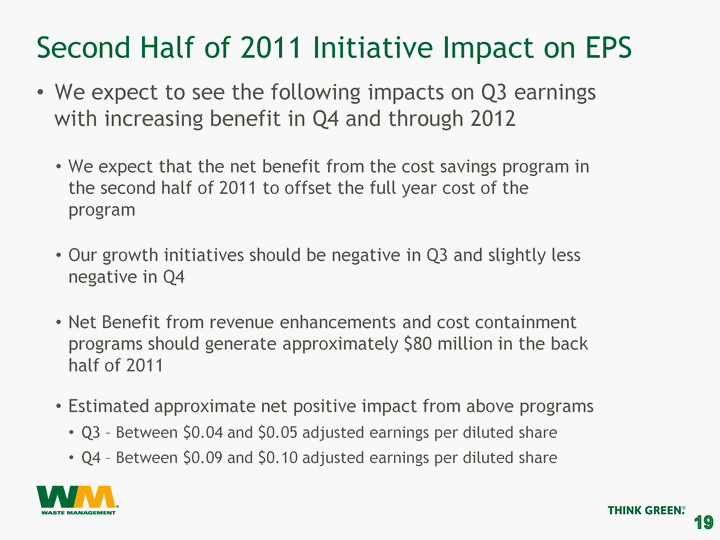
| Second Half of 2011 Initiative Impact on EPS We expect to see the following impacts on Q3 earnings with increasing benefit in Q4 and through 2012 We expect that the net benefit from the cost savings program in the second half of 2011 to offset the full year cost of the program Our growth initiatives should be negative in Q3 and slightly less negative in Q4 Net Benefit from revenue enhancements and cost containment programs should generate approximately $80 million in the back half of 2011 Estimated approximate net positive impact from above programs Q3 - Between $0.04 and $0.05 adjusted earnings per diluted share Q4 - Between $0.09 and $0.10 adjusted earnings per diluted share 19 |
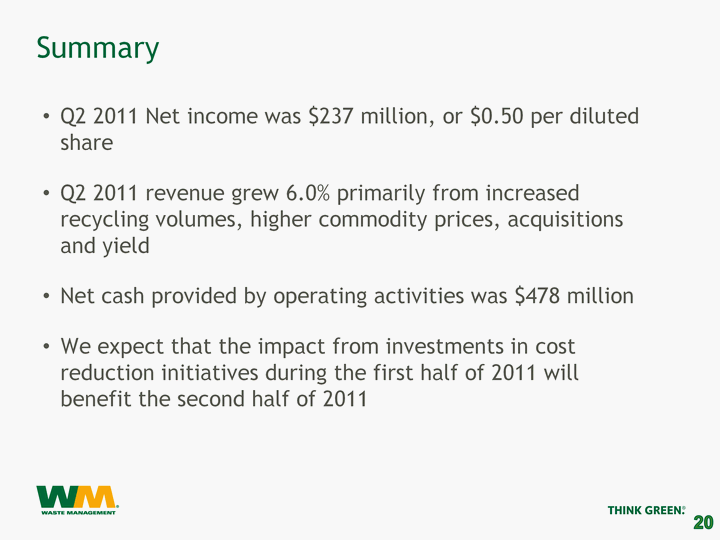
| Summary Q2 2011 Net income was $237 million, or $0.50 per diluted share Q2 2011 revenue grew 6.0% primarily from increased recycling volumes, higher commodity prices, acquisitions and yield Net cash provided by operating activities was $478 million We expect that the impact from investments in cost reduction initiatives during the first half of 2011 will benefit the second half of 2011 20 |
| Annex Reconciliation of Certain Non-GAAP Measures 21 |
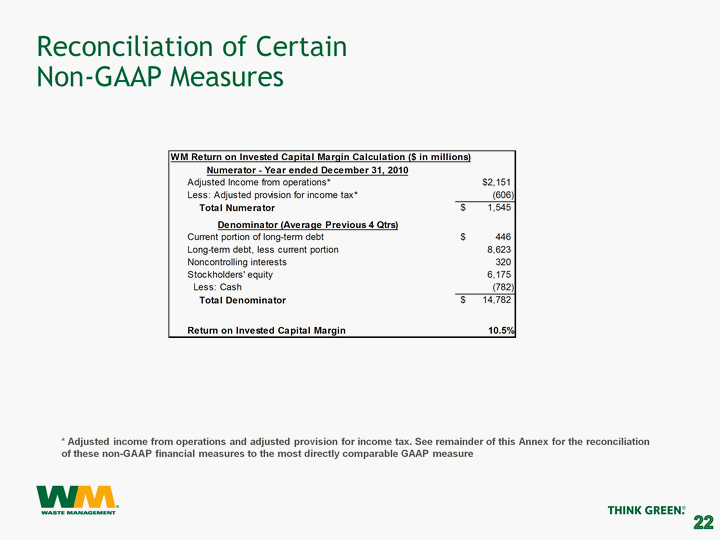
| Reconciliation of Certain Non-GAAP Measures 22 * Adjusted income from operations and adjusted provision for income tax. See remainder of this Annex for the reconciliation of these non-GAAP financial measures to the most directly comparable GAAP measure |
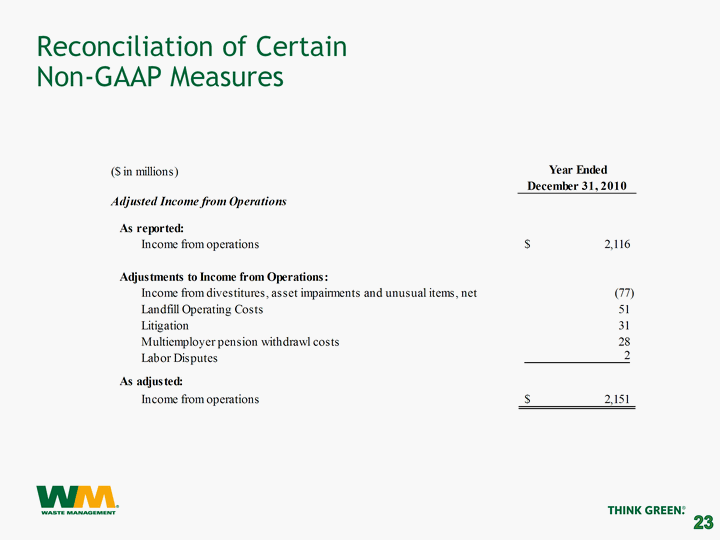
| Reconciliation of Certain Non-GAAP Measures 23 |
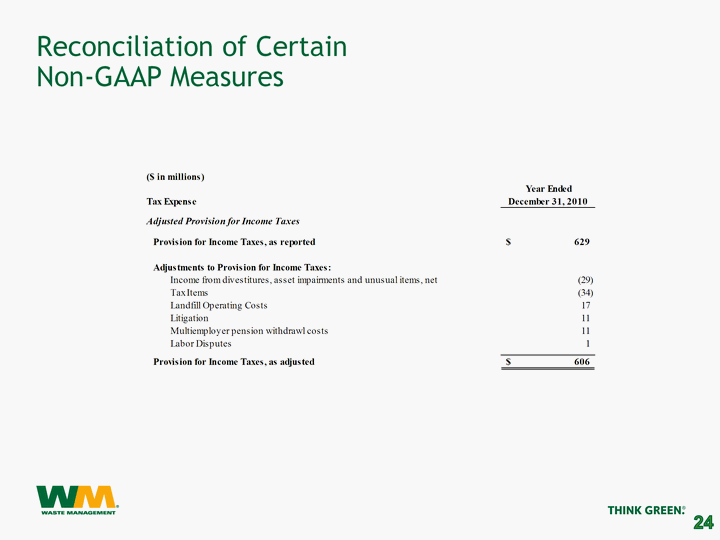
| Reconciliation of Certain Non-GAAP Measures 24 |
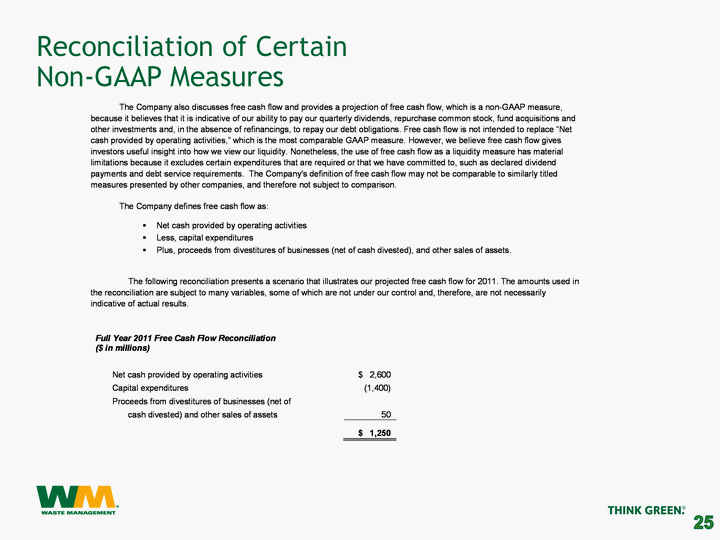
| Reconciliation of Certain Non-GAAP Measures 25 |
| Waste Management, Inc. Investor Meetings September 2011 |
