Attached files
| file | filename |
|---|---|
| 8-K - 8-K - EMRISE Corp | a11-26217_18k.htm |
Exhibit 99.1
|
|
OTC BB: EMRI EMRISE CORPORATION A multi-national manufacturer of electronic devices and communications equipment for the aerospace, defense and industrial markets in North America, Europe and Asia September 13, 2011 Rodman & Renshaw Annual Global Investment Conference New York, NY Growth/Special Situations Track |
|
|
Safe Harbor Statement The matters discussed in this presentation, including any oral comments that accompany the presentation or given in response to questions, may contain forward-looking statements within the meaning of the Private Securities Litigation Reform Act of 1995. Forward-looking statements include, but are not limited to, orders, backlog, financial results, products, and/or other events that have not yet occurred. Actual results may differ materially from those forward-looking statements. Factors that could contribute to such differences include, but are not limited to, variations in forecasted growth rate of markets for the company’s products, changes in EMRISE’s financial condition and financial results, the company’s ability to distinguish itself and it’s products from current and future competitors and those factors contained in the “Risk Factors” Section of the Company’s most recent filings with the U.S. Securities and Exchange Commission on Forms 10-K, Forms 10-Q and Forms 8-K. 2 September 2011 |
|
|
Overview International electronics and communications company Established customer and business base Focused on organic growth Opportunities for strategic acquisitions and alliances Strong and growing backlog Promising outlook 3 |
|
|
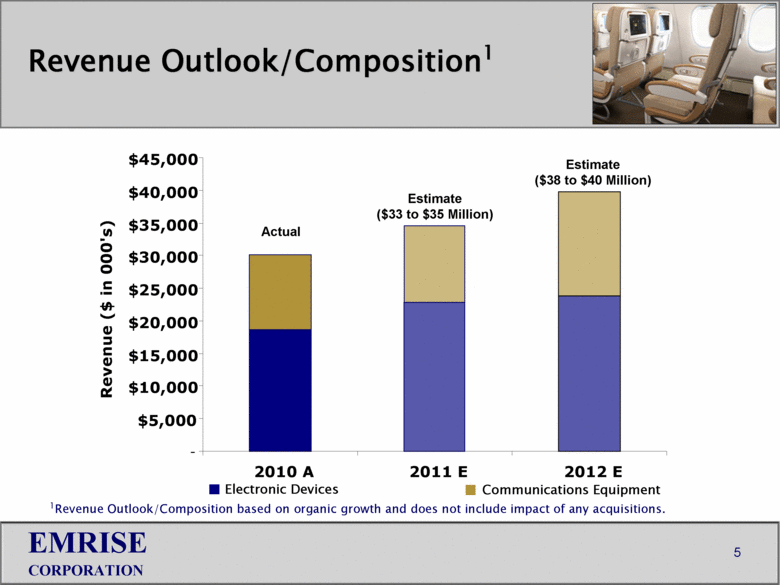
Growth Performance improving following major organizational, operational and financial changes in Q3 and Q4 2010 Forecast $33 million to $35 million revenue in 2011 Improved balance sheet Backlog at 6/30/11 up 83% to $31million from 6/30/10 Last half 2011 shipment ramp-up driving Q4 profitability Positioned for higher future growth rates of up to 15% 4 |
|
|
Revenue Outlook/Composition1 5 - $5,000 $10,000 $15,000 $20,000 $25,000 $30,000 $35,000 $40,000 $45,000 2010 A 2011 E 2012 E Revenue ($ in 000's) Electronic Devices Communications Equipment 1Revenue Outlook/Composition based on organic growth and does not include impact of any acquisitions. Estimate ($33 to $35 Million) Actual Estimate ($38 to $40 Million) |
|
|
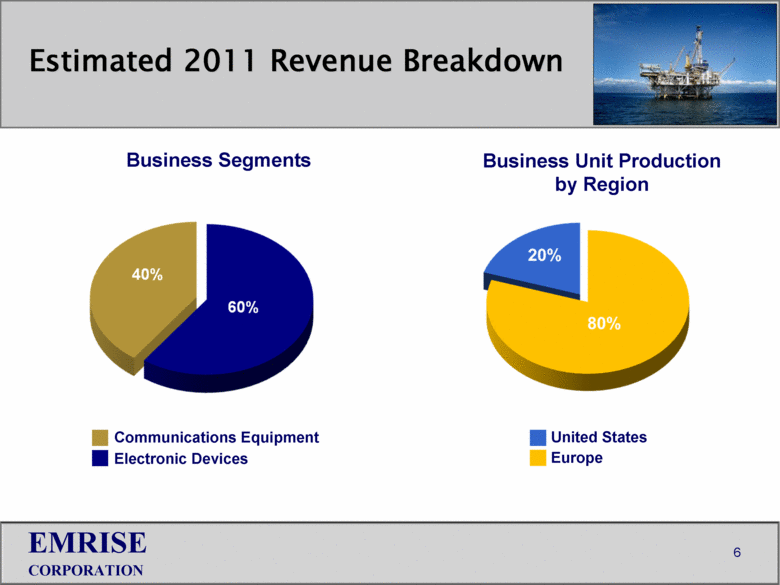
6 Estimated 2011 Revenue Breakdown Business Unit Production by Region Electronic Devices Business Segments Europe Communications Equipment United States |
|
|
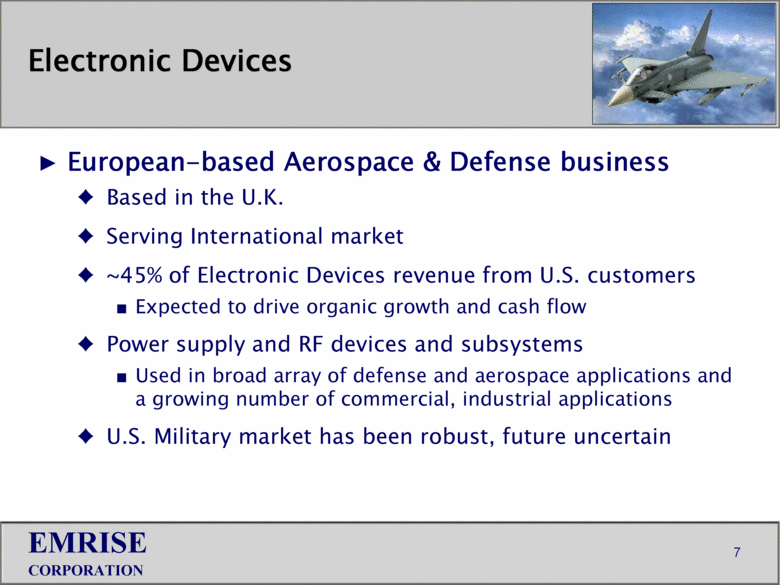
Electronic Devices European-based Aerospace & Defense business Based in the U.K. Serving International market ~45% of Electronic Devices revenue from U.S. customers Expected to drive organic growth and cash flow Power supply and RF devices and subsystems Used in broad array of defense and aerospace applications and a growing number of commercial, industrial applications U.S. Military market has been robust, future uncertain 7 |
|
|
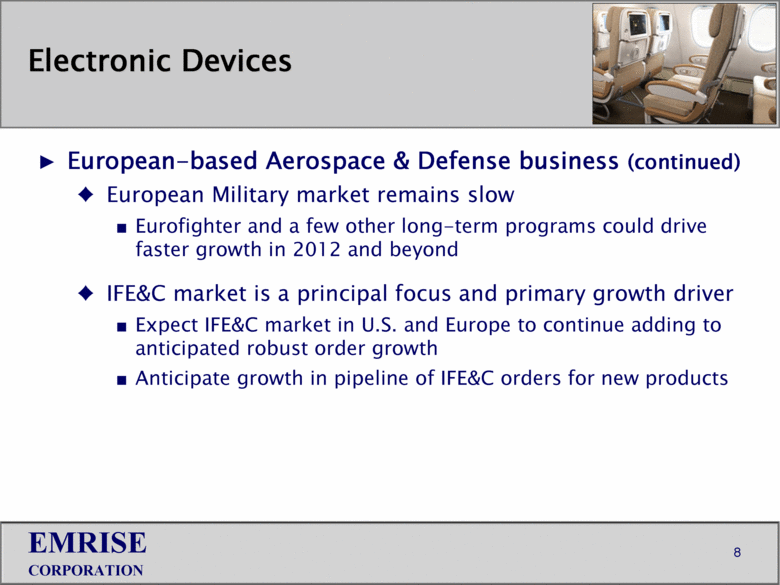
Electronic Devices European-based Aerospace & Defense business (continued) European Military market remains slow Eurofighter and a few other long-term programs could drive faster growth in 2012 and beyond IFE&C market is a principal focus and primary growth driver Expect IFE&C market in U.S. and Europe to continue adding to anticipated robust order growth Anticipate growth in pipeline of IFE&C orders for new products 8 |
|
|
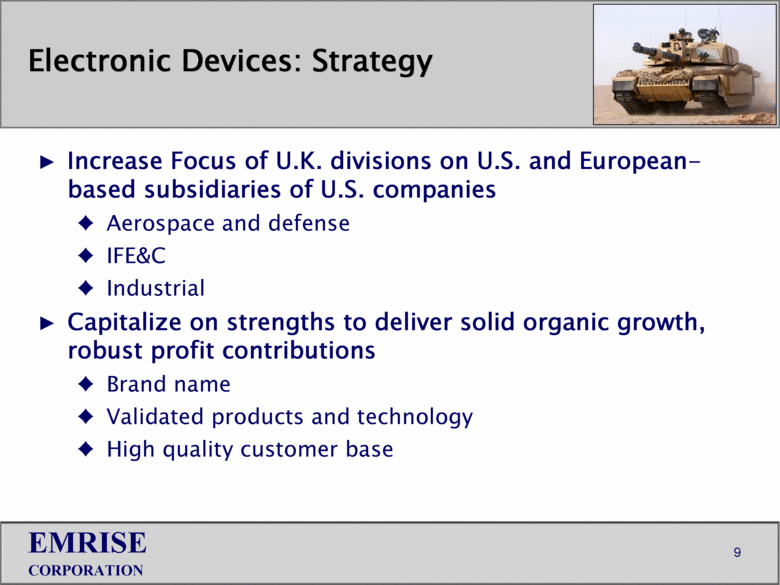
Electronic Devices: Strategy Increase Focus of U.K. divisions on U.S. and European-based subsidiaries of U.S. companies Aerospace and defense IFE&C Industrial Capitalize on strengths to deliver solid organic growth, robust profit contributions Brand name Validated products and technology High quality customer base 9 |
|
|
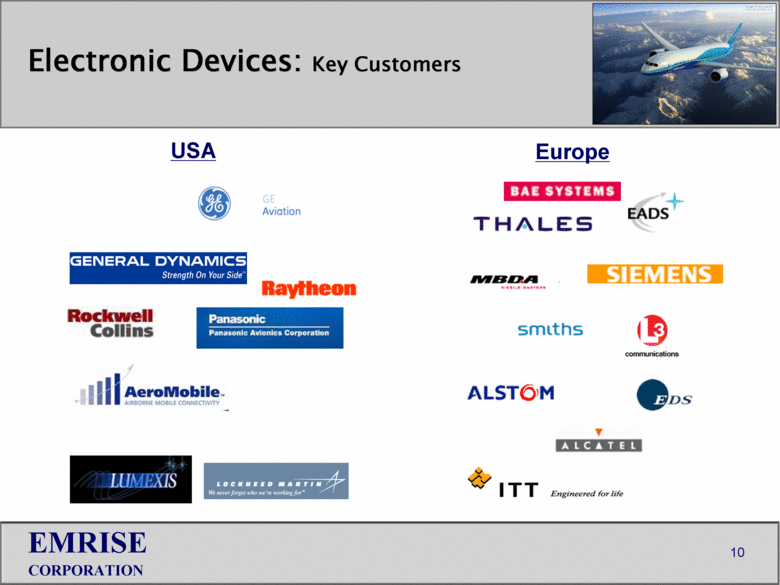
10 Electronic Devices: Key Customers Europe USA |
|
|
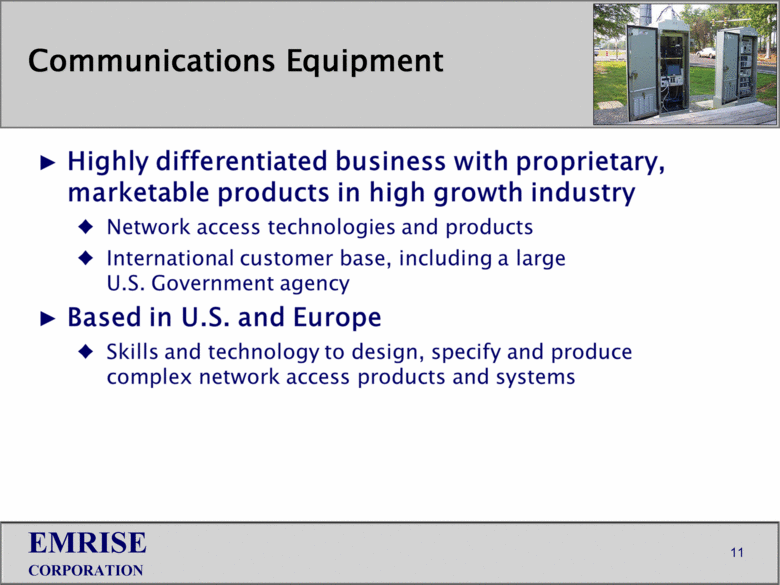
11 Communications Equipment |
|
|
12 Communications Equipment: Strategy Capitalize on product line, technology and customer base to drive sale of network access products Expanding mobile, backhaul, video, data and security needs driving industry growth Expand business through Organic growth Strategic alliance/partnership transactions Focus on growing US market share |
|
|
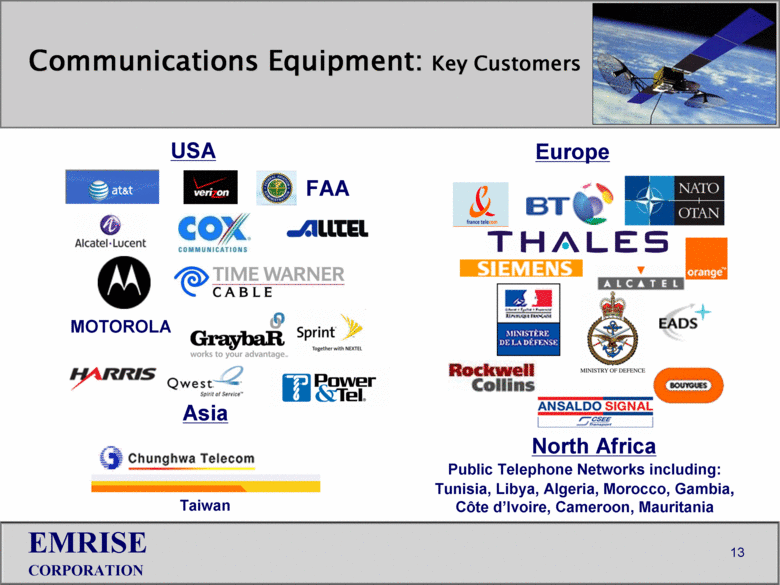
13 Europe FAA MOTOROLA USA Taiwan Asia North Africa Public Telephone Networks including: Tunisia, Libya, Algeria, Morocco, Gambia, Côte d’Ivoire, Cameroon, Mauritania Communications Equipment: Key Customers |
|
|
14 Organic Growth Drivers Electronic Devices Focus on higher-margin products Invest in standard products Broader product range Increased IFE&C penetration Communications Equipment Network Access market growing rapidly in U.S. and Europe Increased penetration within existing customers Invest in and focus on developing U.S. Market Backlog for network access products highest in 10 years |
|
|
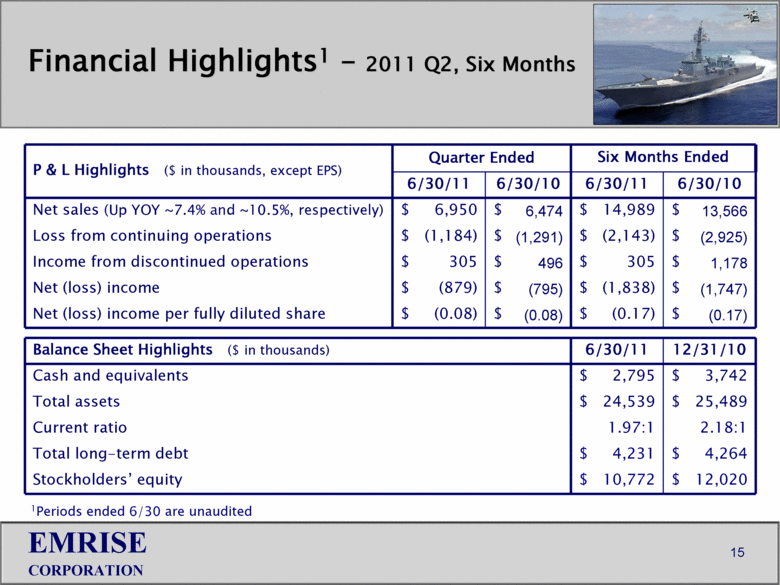
15 Financial Highlights1 – 2011 Q2, Six Months P & L Highlights ($ in thousands, except EPS) Quarter Ended Six Months Ended 6/30/11 6/30/10 6/30/11 6/30/10 Net sales (Up YOY ~7.4% and ~10.5%, respectively) $ 6,950 $ 6,474 $ 14,989 $ 13,566 Loss from continuing operations $ (1,184) $ (1,291) $ (2,143) $ (2,925) Income from discontinued operations $ 305 $ 496 $ 305 $ 1,178 Net (loss) income $ (879) $ (795) $ (1,838) $ (1,747) Net (loss) income per fully diluted share $ (0.08) $ (0.08) $ (0.17) $ (0.17) Balance Sheet Highlights ($ in thousands) 6/30/11 12/31/10 Cash and equivalents $ 2,795 $ 3,742 Total assets $ 24,539 $ 25,489 Current ratio 1.97:1 2.18:1 Total long-term debt $ 4,231 $ 4,264 Stockholders’ equity $ 10,772 $ 12,020 1Periods ended 6/30 are unaudited |
|
|
16 Stock Information Common shares OTC BB: EMRI 52-week closing price range $0.52 - $0.91 Recent price (9/1/11) $0.68 Average daily trading volume (90-day) 7,989 Common shares 10.7 million Market capitalization $7.28 million Insider ownership (officers, directors) 7.3%1 1Does not include the holdings of the CEO/Founder’s non-insider family members of ~5.5% |
|
|
Focused on high-growth-potential businesses Excellent brands and products, validated technologies Experienced management/engineering, world class customers Strengthened balance sheet Significantly reduced cost structure 2011 revenue estimate of $33 million to $35 million Delivery of growing backlog driving profitability for Q4 2011 Company positioned for sustainable future growth Turnaround with good growth and upside potential 17 EMRISE Strengths/Investment Thesis |
|
|
OTC BB: EMRI EMRISE CORPORATION September 2011 A multi-national manufacturer of electronic devices and communications equipment for the aerospace, defense and industrial markets in North America, Europe and Asia |

