Attached files
| file | filename |
|---|---|
| 8-K - 8-K - AGILYSYS INC | d231303d8k.htm |
 September 2011
1
Company Overview
Company Overview
Exhibit 99.1 |
 Forward-looking statements & non-GAAP financial
information
Forward-looking statements & non-GAAP financial
information
2
Forward-Looking Language
This Quarterly Report contains certain management expectations, which may
constitute forward-looking information within the meaning of Section
27A of the Securities Act of 1933, Section 21E of the Securities and Exchange Act of 1934, and the Private Securities Reform Act of
1995.
Forward-looking
information
speaks
only
as
to
the
date
of
this
Quarterly
Report
and
may
be
identified
by
use
of
words
such
as
“may,”
“will,”
“believes,”
“anticipates,”
“plans,”
“expects,”
“estimates,”
“projects,”
“targets,”
“forecasts,”
“continues,”
“seeks,”
or the negative of those
terms
or
similar
expressions.
Many
important
factors
could
cause
actual
results
to
be
materially
different
from
those
in
forward-looking
information,
including,
without
limitation,
competitive
factors,
disruption
of
supplies,
changes
in
market
conditions,
pending
or
future
claims
or
litigation, or technology advances. No assurances can be provided as to the
outcome of cost reductions, expected benefits and outcomes from our recent
ERP implementation, business strategies, future financial results, unanticipated downturns to our relationships with
customers
and
macroeconomic
demand
for
IT
products
and
services,
unanticipated
difficulties
integrating
acquisitions,
new
laws
and
government regulations, interest rate changes, consequences related to the
concentrated ownership of our outstanding shares by MAK Capital,
unanticipated deterioration in economic and financial conditions in the United States and around the world or the consequences
associated with the sale of the Company’s TSG business, and uncertainties
regarding restructuring actions and the relocation of the Company’s
corporate headquarters. The Company does not undertake to update or revise any forward-looking information, even if events
make it clear that any projected results, actions, or impact, express or implied,
will not be realized. Other potential risks and uncertainties that may cause
actual results to be materially different from those in forward-looking information are
described in “Risk Factors,”
which is included in Part I, Item 1A of the Company’s Annual Report for the
fiscal year ended March 31, 2011. Use of Non-GAAP Financial
Information To supplement the unaudited condensed consolidated financial
statements presented in accordance with U.S. GAAP in this presentation,
certain non-GAAP financial measures as defined by the SEC rules are
used. Management
believes
that
such
information
can
enhance
investors'
understanding
of
the
Company's
ongoing
operations.
The
non-GAAP
measures included in this presentation have been reconciled to the comparable GAAP
measures within an accompanying table, shown on the last page of this
presentation. |
 Agilysys: overview
Agilysys: overview
Quick Facts
Summary
•
Leading developer and marketer of proprietary enterprise software, services and
solutions to the hospitality and retail industries
•
Two
reportable
businesses:
Hospitality
Solutions
Group
(“HSG”)
develops
and
markets
proprietary
software
for
hospitality
markets
and
Retail
Solutions
Group
(“RSG”)
is a system integrator of store front technology for retailers
Formed:
1963
Ticker symbol:
AGYS (NASDAQ)
Market capitalization:
~$200 million
Capital structure as of 6/30/11:
Debt-free
Fiscal 2011 sales
1
:
$201 million
Markets served as % of revenue:
94% North America
6% Asia and Europe
Employees:
800
Corporate HQ:
Solon, Ohio (relocating to Alpharetta, GA)
(1) March 31
st
fiscal year: excludes TSG which was divested 7/31/11
3 |
 Vision and Mission
•
Extend customer brand through effective business system
design, implementation and support
•
End-to-end guest centric business system
•
Win guest recruitment against competition
•
Maximize guest experience and revenue opportunity
•
Extend on-premise experience to pre/post stay
4 |
 We
Are An Exciting Company We Are An Exciting Company
•
Big enough to be a relevant, credible competitor
•
Small enough to make quick decisions, execute and disrupt the market to
our
advantage
and
in
the
customers’
favor
•
Intriguing partner for our customers
•
Board and management team commitment to business and product strategy
•
Operating plan, business strategy and use of capital
•
Personnel have deep understanding of technology in hospitality and retail
verticals
•
Keen understanding of how our markets use technology in their businesses
•
Our personnel are tops in their field, we are investing behind this
expertise 5 |
 Focused Strategy
•
Closed divestiture of Technology Solutions Group (TSG) business to OnX
Enterprise Solutions on August 1st
•
Net proceeds expected to be $55.7M
•
Net proceeds remain subject to downward working capital adjustment
•
Strategic emphasis focuses on improving business performance, making
select investments and returning capital to shareholders
•
Streamlining operations and reducing corporate expenses, including
facilities’ footprint
•
Relocating corporate headquarters to Alpharetta, Georgia
•
Reduce corporate costs and reposition support closer to key revenue-producing
locations
•
Executing
plan
to
reduce
annual
“run-rate”
SG&A
by
$14M
to
$16M,
expected
to
be realized beginning in FY13
•
Estimated
restructuring
costs
are
$16M
to
$18M
—
expect
to
be
primarily
recognized in FY12
•
Announced repurchase up to 1.6 million (approximately 7%) of outstanding
shares 6
Shareholder value to be driven by improved operating performance while focusing on
the market opportunities in the hospitality and retail industries
|
 Agilysys Hospitality Solutions
•
Hospitality customers can rely
on HSG to deliver:
•
Enterprise applications
•
Hardware enabling our complete
array of enterprise applications
•
Recurring services such as
software maintenance and
hosting or SaaS offerings
•
Implementation and training
services as well as help desk
support
7 |
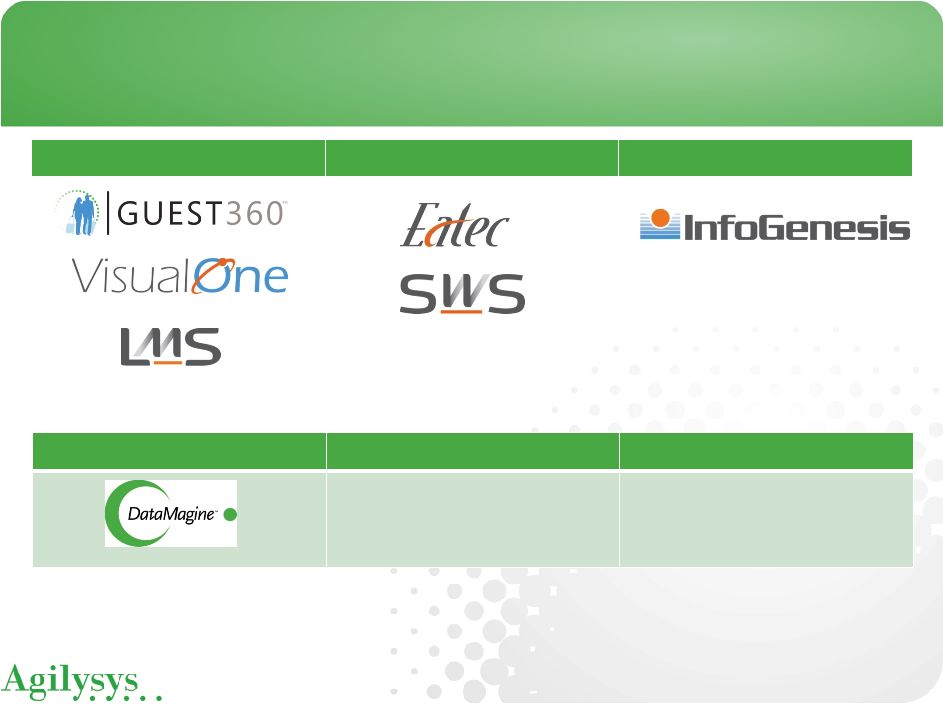 Document
Management Central Reservation
Mobility
•
G360 capabilities
•
Acquisition
•
POS (IG Roam)
•
PMS (iPad enabled)
•
RSG (mPOS)
Titles We Own
Titles We Own
Property Management
Inventory & Procurement
Point of Sale
8 |
 Product challenges
•
Current state
•
Complete business system composed of discrete products from single
or multiple vendors, integration is interface dependent
•
Customer data housed in disparate data sources, integrated via
reporting, limited actionable outcomes
•
Future state —
opportunity for convergence of point products
to an enterprise solution including:
•
Application featuring CRS/PMS/POS/IP/Sales & Catering/Spa/Golf
•
Platform with common elements used by all applications
•
Mobility
becomes
part
of
the
platform,
with
capability
to
extend
guest
reach beyond the property
9 |
 HSG
Markets Served HSG Markets Served
Gaming
Hotels & Resorts
Restaurants
Cruise Lines
Food Service
Stadiums & Arenas
10 |
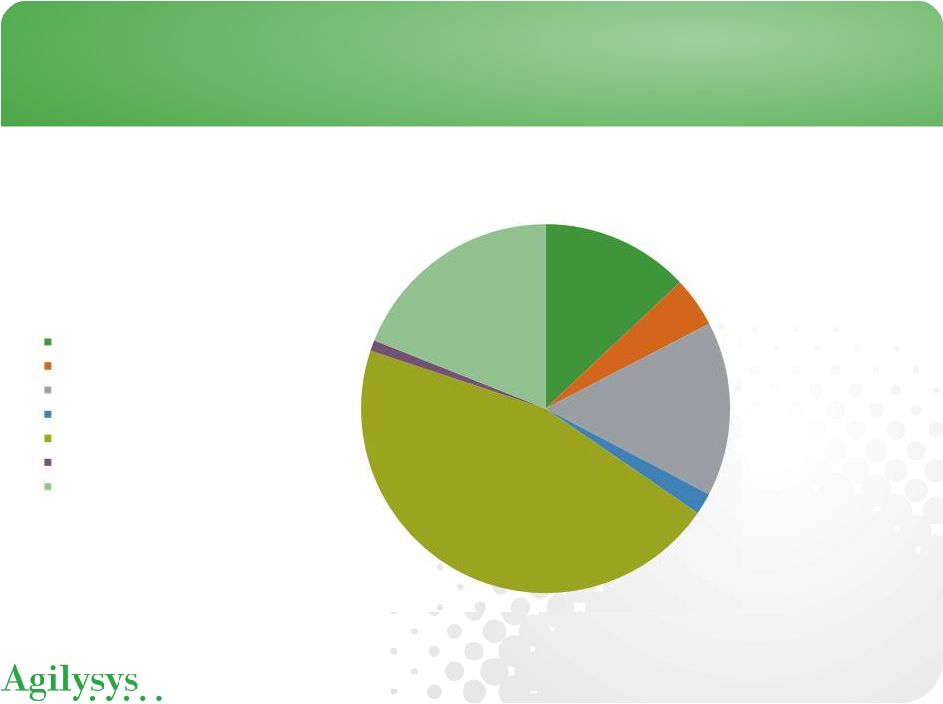 HSG
Revenue Profile HSG Revenue Profile
11
13%
4%
15%
2%
46%
1%
19%
HSG Revenue Mix
Software
-
Proprietary
Software
-
Remarketed
Services
-
Proprietary
Services
-
Remarketed
Support
-
Proprietary
Support
-
Remarketed
Hardware |
 Agilysys Retail Solutions
•
Agilysys Retail Solutions provides:
•
Integration of end-to-end in-store technology solutions
•
Unparalleled expertise in POS and Mobility solutions
•
Personnel with an average of 18 years experience in the retail market
•
Agilysys Retail Solutions is:
•
Solution partner for IBM Retail Store Solutions receiving the IBM RSS
Excellence Award for 16 consecutive years (since the award’s
inception)
•
Large Motorola Enterprise Mobility Solutions Partner and also one of
Motorola’s largest Enterprise Mobility Wireless (WLAN) Partners
•
Verifone Premier Partner
12 |
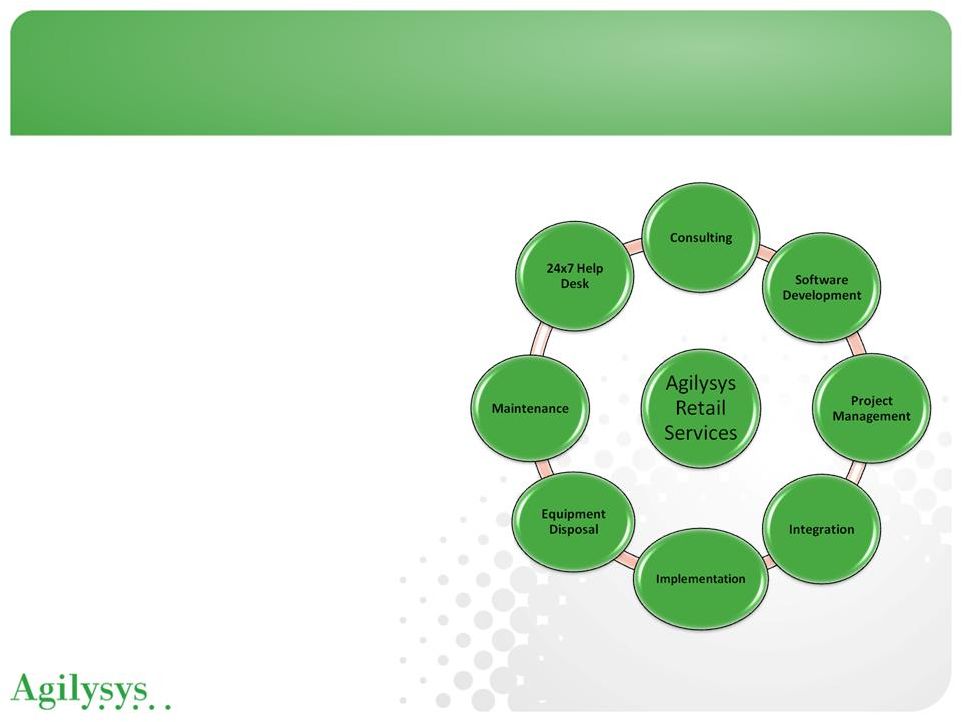 Agilysys Retail Solutions
•
Lifecycle management of
store-centric business
systems
•
Higher ROI and lower TCO
•
Servicing the needs of
smart consumers
•
Point-of-Sale
•
Customer Self-Service
•
Mobile Point-of-Service
•
Mobile Store Managers
•
Mobile Store Associates
13 |
 RSG
Markets Served RSG Markets Served
Grocery
Chain Drug Stores
General and Specialty Retail
Quick Serve Restaurants
Convenience Stores
14 |
 RSG
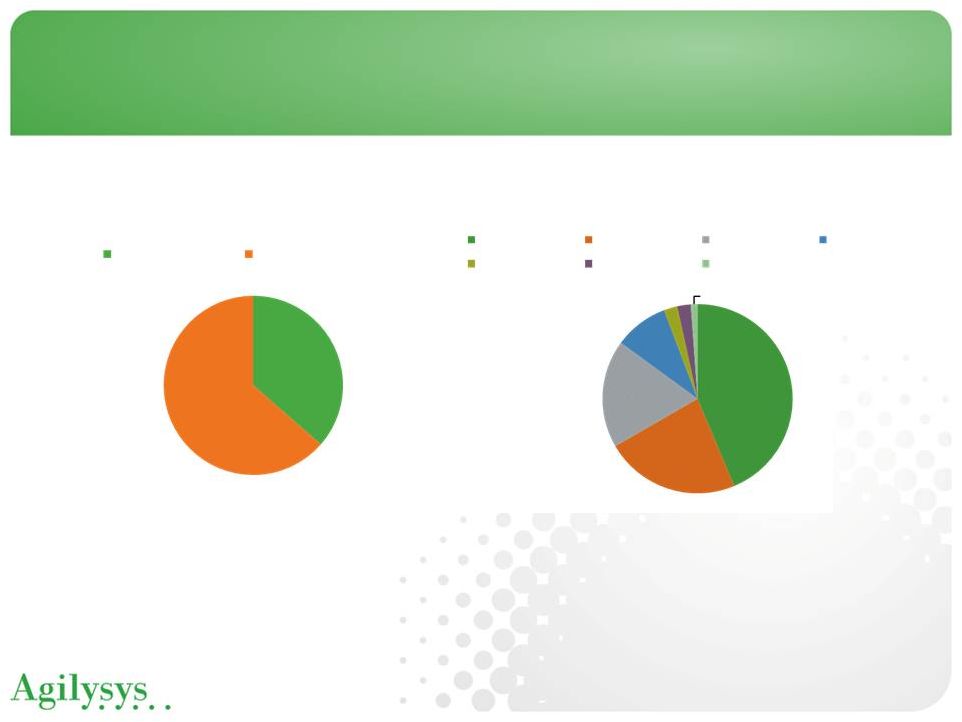
Revenue Profile RSG Revenue Profile
15
44%
23%
19%
9%
2%
2%
1%
Proprietary Services Revenue Mix
Dedicated Support
System Integration
Managed Services
Contracted R&D
Depot Support
Help desk
Consulting
36%
64%
RSG Revenue Mix
Proprietary services
Re
-
market HW/SW/Services
The percentages represented on this chart are approximate values based on TTM revenue. |
 Strategic Opportunity
•
Hoteliers and retailers demand lower operating costs, while enhancing
guest experience, driven by their investments in business systems
•
Deliver deeper value through “personalization”
of guest experience
•
No clear end-to-end hospitality solution exists
•
Hotels and resorts desire to be hub of guest travel experience
•
Retailers seeking mobility solutions to drive richer guest experience
•
Key strategic initiatives
•
Product integration
•
Capability development
•
Investment prioritization
•
Partner expansion
16 |
 Appendix
17 |
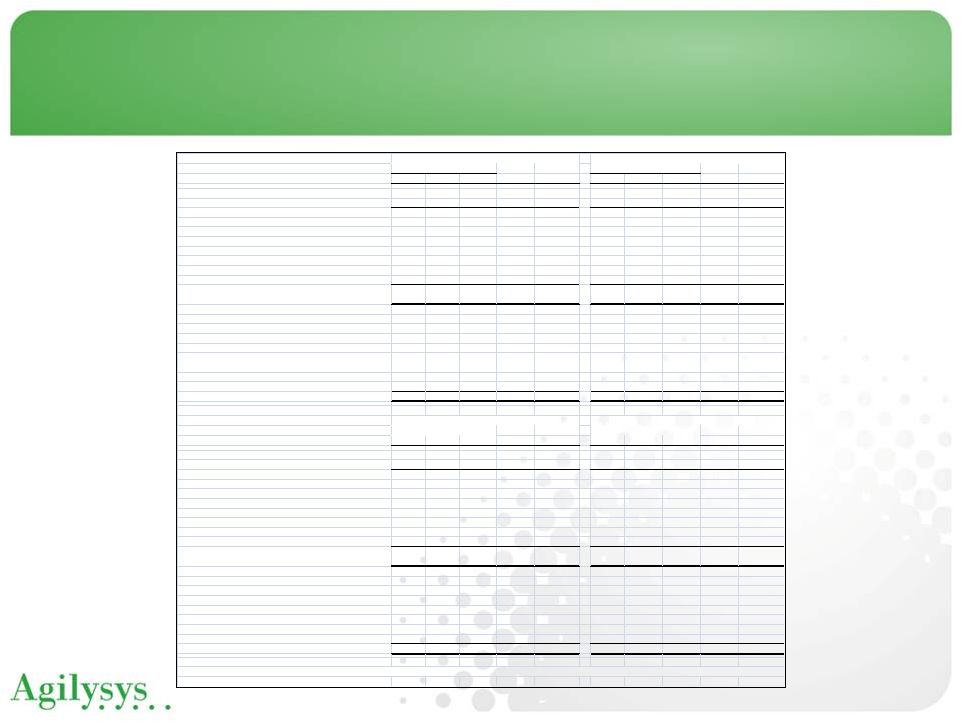 FY
2011 & 2010 Segment Financial Information FY 2011 & 2010 Segment
Financial Information 18
Corporate/
Corporate/
(In thousands)
HSG
RSG
TSG
Other
Consolidated
HSG
RSG
TSG
Other
Consolidated
Total revenue
$24,814
$22,015
$ 97,145
$ -
$ 143,974
$92,839
$109,147
$474,052
$ -
$ 676,038
Elimination of intersegment revenue
(26)
(171)
-
-
(197)
(92)
(476)
-
-
(568)
Revenue from external customers
$24,788
$21,844
$ 97,145
$ -
$ 143,777
$92,747
$108,671
$474,052
$ -
$ 675,470
Gross margin
$15,821
$ 3,958
$ 16,546
$ -
$ 36,325
$54,669
$ 20,970
$ 82,052
$ -
$ 157,691
Gross margin percentage
63.8%
18.1%
17.0%
25.3%
58.9%
19.3%
17.3%
23.3%
Operating income (loss)
$ 1,622
$ (520)
$(41,288)
$ (6,763)
$ (46,949)
$ 6,030
$ 3,369
$(31,736)
$(32,099)
$ (54,436)
Other income, net
-
-
-
(43)
(43)
-
-
-
(2,320)
(2,320)
Interest expense, net
-
-
-
352
352
-
-
-
1,171
1,171
Income (loss) from continuing operations before income taxes
$ 1,622
$ (520)
$(41,288)
$ (7,072)
$ (47,258)
$ 6,030
$ 3,369
$(31,736)
$(30,950)
$ (53,287)
Other information:
Capital expenditures
$ 1,249
$ 1
$ 45
$ 26
$ 1,321
$ 3,760
$ 623
$ 914
$ 1,694
$ 6,991
Other charges:
Depreciation and amortization - non-cash (1)
$ 1,091
$ 203
$ 329
$ 1,771
$ 3,394
$ 4,297
$ 449
$ 2,881
$ 5,987
$ 13,614
Asset impairment charges - non-cash
900
-
36,762
-
37,662
959
-
36,762
-
37,721
Restructuring charges
-
-
790
(1)
789
-
-
790
405
1,195
Total
$ 1,991
$ 203
$ 37,881
$ 1,770
$ 41,845
$ 5,256
$ 449
$ 40,433
$ 6,392
$ 52,530
Corporate/
Corporate/
HSG
RSG
TSG
Other
Consolidated
HSG
RSG
TSG
Other
Consolidated
Total revenue
$21,313
$25,373
$ 89,295
$ -
$ 135,981
$83,361
$110,506
$440,887
$ -
$ 634,754
Elimination of intersegment revenue
(33)
(91)
(9)
-
(133)
(206)
(155)
(73)
-
(434)
Revenue from external customers
$21,280
$25,282
$ 89,286
$ -
$ 135,848
$83,155
$110,351
$440,814
$ -
$ 634,320
Gross margin
$13,374
$ 5,840
$ 16,613
$ -
$ 35,827
$51,463
$ 23,326
$ 87,501
$ (763)
$ 161,527
Gross margin percentage
62.8%
23.1%
18.6%
26.4%
61.9%
21.1%
19.8%
25.5%
Operating income (loss)
$ 2,220
$ 737
$ (1,531)
$ (7,639)
$ (6,213)
$ 7,666
$ 5,759
$ 9,407
$(29,669)
$ (6,837)
Other income, net
-
-
-
(213)
(213)
-
-
-
(6,176)
(6,176)
Interest expense, net
-
-
-
278
278
-
-
-
939
939
Income (loss) from continuing operations before income taxes
$ 2,220
$ 737
$ (1,531)
$ (7,704)
$ (6,278)
$ 7,666
$ 5,759
$ 9,407
$(24,432)
$ (1,600)
Other information:
Capital expenditures
$ 1,041
$ -
$ 41
$ 2,552
$ 3,634
$ 4,694
$ 31
$ 103
$ 8,478
$ 13,306
Non-cash charges:
Depreciation and amortization (1)
$ 1,029
$ 55
$ 839
$ 1,266
$ 3,189
$ 4,337
$ 198
$ 6,418
$ 4,876
$ 15,829
Asset impairment charges
-
-
55
-
55
90
-
55
148
293
Restructuring charges
-
-
-
78
78
-
-
-
823
823
Total
$ 1,029
$ 55
$ 894
$ 1,344
$ 3,322
$ 4,427
$ 198
$ 6,473
$ 5,847
$ 16,945
(1) Does not include the amortization of deferred financing fees totaling $131 and $139 for the three
months ended March 31, 2011 and 2010, respectively, and $524 and $485 for the year
ended March 31, 2011 and 2010, respectively.
Year Ended March 31, 2011 (Unaudited)
Reportable Segments
Year Ended March 31, 2010
Reportable Segments
Reportable Segments
Reportable Segments
Three Months Ended March 31, 2011 (Unaudited)
Three Months Ended March 31, 2010 (Unaudited) |