Attached files
| file | filename |
|---|---|
| 8-K - EASTERN INSURANCE HOLDINGS INC--FORM 8-K - Eastern Insurance Holdings, Inc. | d8k.htm |
 Keefe,
Bruyette & Woods 2011 Insurance Conference September 7, 2011
Eastern Insurance Holdings, Inc.
NASDAQ: EIHI
Michael Boguski
President and Chief Executive Officer
and
Kevin Shook
Executive Vice President, Treasurer and Chief Financial Officer
Exhibit 99.1 |
 Page
2 Michael
Boguski
President
and
Chief
Executive
Officer |
 Page
3 Review of 2010 EIHI Strategic Initiatives
•
EIHI strategic plan focused on driving the organization to a pure specialty
workers’
compensation platform
•
A.M. Best Company financial rating upgrade of workers’
compensation
companies to “A”
(excellent) with a stable outlook in a very difficult
insurance
market
place
(Q2
–
2010)
•
Closed sale of the group benefits insurance subsidiary, Eastern Life and
Health
to
Security
Life
Insurance
Company
of
America
(Q2
–
2010)
$34.0 million transaction value
•
Closed
sale
of
the
run-off
specialty
reinsurance
segment
(Q4
–
2010)
Net loss of $14.5 million
•
Announced CEO succession management plan and implemented an
organizational structure to support the specialty workers’
compensation
platform
(Q3
–
2010) |
 Page
4 EAIG Workers’
Compensation Highlights –
Quarter Ended June 30, 2011
•
Direct written premium of $32.9 million for the three months ended June 30, 2011, and
$26.6 million for the three months ended June 30, 2010
•
GAAP Workers’
Compensation Insurance Segment combined ratio –
90.4%
•
Consolidated net income -
$2.0 Million
•
Focused and disciplined state expansion –
regional office combined ratios range from 87.1
percent to 91.6 percent for the quarter ended June 30, 2011
•
Regional/Satellite Office Expansion
–
Lancaster, PA (opened in 1997)
Nashville, TN (opened in 2010)
–
Charlotte, NC (opened in 2008)
Wexford, PA (opened in 2010)
–
Indianapolis, IN (acquisition in
2008)
Richmond, VA (opened in May 2011)
•
Strong Capital Position
–
A.M.
Best
“A”
(Excellent)
for
Eastern
Alliance
Insurance
Group
–
Stable
Outlook
(Upgrade
in
June
2010
and
affirmed in May 2011)
–
A.M.
Best
“A”
(Excellent)
for
Eastern
Re
Ltd.,
SPC
–
Stable
Outlook
(Upgrade
in
June
2011)
•
Select Agency Partnerships
–
113 contracts / 330 locations |
 Page
5 EAIG Geographic Footprint
Alabama
Arkansas
District of Columbia
Delaware
Florida
Georgia
Illinois
Indiana
Iowa
Kentucky
Louisiana
Maryland
Michigan
Minnesota
Mississippi
Missouri
New Jersey
New York
North Carolina
Ohio
Oklahoma
Pennsylvania
South Carolina
Tennessee
Texas
Virginia
West Virginia
Wisconsin
•
Direct written premium of
$126.8 million for the year
ended 12.31.10, and $110.1
million for the year ended
12.31.09
•
Direct written premium of
$79.5 million for the six
months ended 6.30.11 and
$65.5 million for the six
months ended 6.30.10
•
Licensed –
28 states
•
2011 Certificates of Authority
received for Minnesota,
Louisiana, Oklahoma and
Texas in Q2
•
Pending state license
applications in New Mexico
and Arizona |
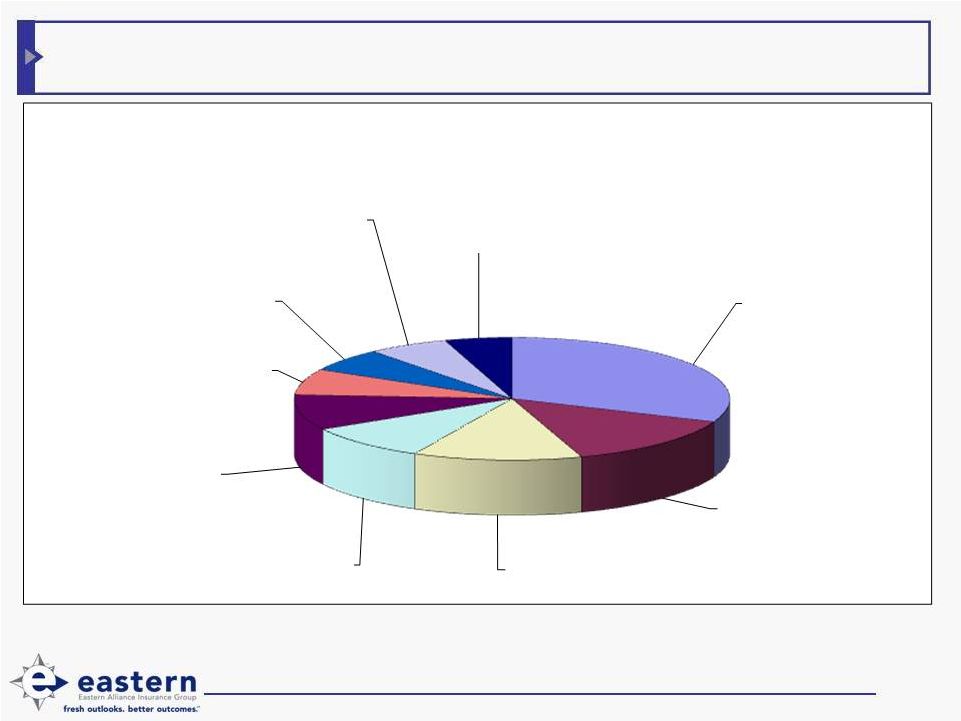
 Page
6 EAIG Workers’
Compensation Geography Diversification
•Opened
Southeast
regional
office
(Charlotte,
NC)
–
February
2008
•Acquired
Employers
Security
Insurance
Company
(Indianapolis,
IN)
–
September
2008
to
serve
as
Midwest
regional
office
•Opened
Nashville,
TN
satellite
office
–
April
2010
•Opened
Wexford,
PA
satellite
office
–
June
2010
•Opened
Richmond,
VA
satellite
office
–
May
2011
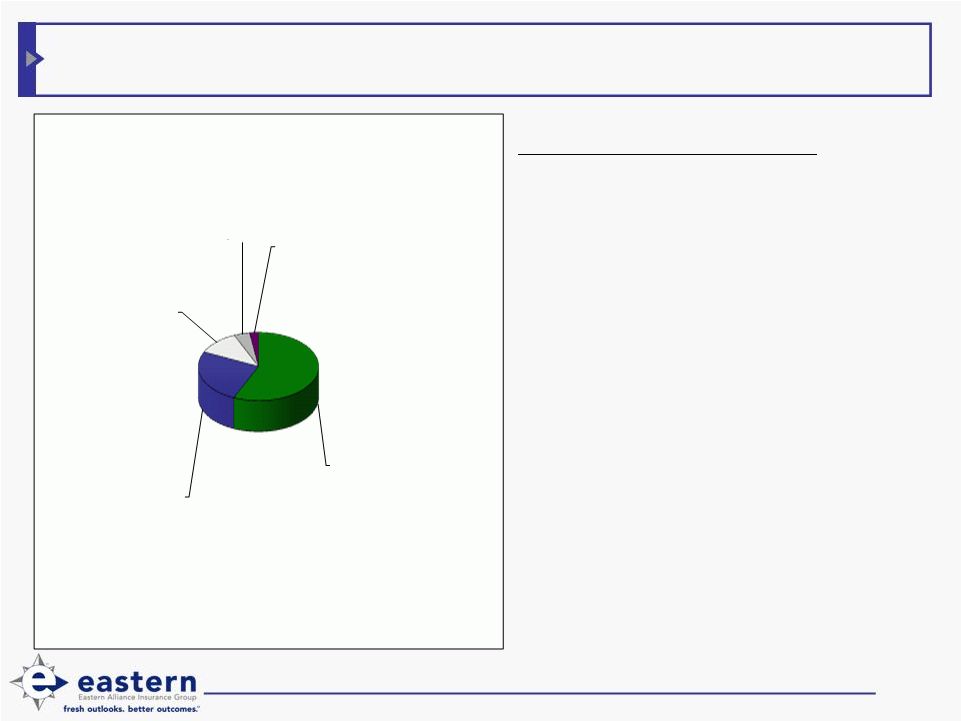
Percentages as of
June 30, 2006
Percentages as of
June 30, 2011
70.9%
Indiana, 12.5%
North
Carolina, 5.1%
Virginia, 3.5%
Maryland, 2.4%
Delaware, 1.5%
Tennessee, 1.3%
Other, 2.7%
Pennsylvania,
Pennsylvania, 98.9%
Maryland, 0.4%
Delaware, 0.7% |
 Payroll Exposure as of June 30, 2011
Clerical / Office 18.7%
Doctors / Dentists
8.2%
Hospital 7.5%
Auto Dealers 5.6%
Colleges/Schools
5.6%
Salesmen -
Outside
4.1%
Nursing Homes
Skilled 3.7%
Restaurant 3.6%
Retirement/Life Care
Community 3.0%
Top 10 Classes (Traditional)
Exposure Base: PA, DE, MD, VA, NC, SC
-
EAIG Workers’
Compensation Risk Diversification
Page 7
•Active Policies = 5,721
•Over 500 Class Codes Actively Written |
 Page
8 EAIG Workers’
Compensation Risk Diversification
•Active Policies = 1,584
•Over 300 Class Codes Actively Written
Payroll Exposure as of June 30, 2011
Clerical / Office 16.8%
Auto Dealers 8.2%
Doctors / Dentists
6.6%
Social Rehabiliation
6.1%
6.1%
Nursing Homes -
Skilled 4.0%
3.7%
Ambulance Service -
Non-Volunteer 2.3%
Colleges / Schools
2.0%
Top 10 Classes (Alternative Markets)
Exposure Base: PA, DE, MD, VA, NC, SC
Grocery Store -
Retail
Salesmen -
Outside |
 Page
9 Workers’
Compensation Product Line Diversification
Broad Product Spectrum
•
Guaranteed Cost Policies
•
Loss-Sensitive Dividend Plans
•
Large and Medium Deductible
Plans
•
Retrospective Rating Plans
•
ParallelPay®
(Pay As You
Go)
•
Alternative Market Programs
•
TPA Services, including
Claims Administration and
Risk Management
Percentages as of June 30, 2011
Guaranteed
Cost, 56.7%
Alternative
Markets, 25.3%
Policyholder
Dividend, 11.4%
Deductible, 4.2%
Retrospective
Rating, 2.4% |
 •
ParallelPay®
program has been very well received by
agents and customers since its release in April of 2009
•
Direct written premium of $32.4 million (908 individual
policies) from the inception of the product to June 30, 2011
•
New business writings represent $12.2 million of the $32.4
million and 391 of the 908 accounts
•
For the six months ended June 30, 2011, recorded direct
written premium of $8.8 million (287 individual policies)
•
New business writings represent $2.5 million of the $8.8
million and 93 of the 287 accounts
Page 10
ParallelPay®
(Pay As You Go) |
 Page
11 EAIG Business Model
•
Disciplined individual account underwriting with focus on rate adequacy in rural
territories
•
Broad product spectrum
•
Broad underwriting diversification by class code and market segment
•
Extensive medical cost containment strategies
•
Proactive claims management and strategic use of return-to-work initiatives
•
Value-added risk management services
•
Strategic partnerships with select independent agencies that share
philosophies
on
controlling
workers’
compensation
costs
•
Geographic diversification strategies
–
Opened
Southeast
Regional
Office
(Charlotte,
NC)
–
February
2008
–
Acquired
Employers
Security
Insurance
Company
(Indianapolis,
IN)
–
September
2008
–
Opened
Nashville,
TN
satellite
office
–
April
2010
–
Opened
Western
PA
satellite
office
–
June
2010
–
Opened
Richmond,
VA
satellite
office
–
May
2011 |
 Page
12 Workers’
Compensation Key Operating Statistics for the Six Months Ended June 30, 2011
Underwriting
(1)
:
Workers’
Compensation combined ratio
91.3%
Workers’
Compensation calendar year loss ratio
66.4%
Direct written premium
$79.5 million
Direct written premium growth
21.5%
Premium renewal retention
88.1%
New business premium writings
$17.1 million
Select business growth (accounts under $20,000)
9.9%
Large Deductible / Retro premium writings
$7.0 million
Alternative Market premium writings
$21.3 million
High experience modifications premium writings
$13.4 million
ParallelPay premium writings
$8.8 million
Claims
(36
months
average
maturity):
EAIG
Pennsylvania
Variance
Average total cost per claim
$ 4,222
$ 7,935
-46.8%
Average benefit payment per claim
$ 3,612
$ 6,946
-48.0%
Average medical payment per claim
$ 1,934
$ 3,190
-39.4%
Average duration of disability
19.5 weeks
25.3 weeks
-5.8 weeks
Average compromised and release
$ 33,862
$ 59,031
-42.6%
Risk Management
•
Traditional in-force exposure -
$6.2 billion
•
Claims severity –
2 claims over
$300,000
•
No change in lost time claims
frequency on an exposure basis
•
Staffing model –
22 risk
management professionals
(1)
Premium writings include Pennsylvania Employers Assessment
|
 Page
13 Pennsylvania Workers’
Compensation Market Share (Top 20)
(dollars in thousands)
2010 Gross Written
Premium
Five Year Average
Loss Ratio
Three Year Average
Loss Ratio
1.
Liberty Mutual Insurance Company
$
193,142 76.97%
72.11%
2.
American International Group
153,488
86.78%
95.29%
3.
Old Republic Insurance Group
135,420
74.32%
75.69%
4.
Zurich Financial Services NA Group
130,565
80.09%
73.81%
5.
Travelers Group
129,971
73.41%
66.63%
6.
Erie Insurance Group
101,610
47.68%
41.15%
7.
Hartford Insurance Group
100,236
73.15%
62.75%
8.
Eastern Alliance Insurance Group
93,964
45.14%
46.82%
9.
Lackawanna Insurance Group
68,500
51.72%
53.96%
10.
ACE INA Group
50,250
37.90%
45.50%
11.
Highmark Casualty Group
49,830
55.01%
54.30%
12.
Companion Property and Casualty Group
48,289
59.76%
67.38%
13.
Selective Insurance Group
47,801
75.76%
78.55%
14.
Cincinnati Insurance Companies
45,475
82.32%
87.45%
15.
Penn National Insurance
42,834
57.36%
54.25%
16.
Chubb Group of Insurance Companies
38,157
41.42%
39.44%
17.
W. R. Berkley Group
35,329
68.64%
70.50%
18.
Fairfax Financial (USA) Group
32,230
54.74%
56.96%
19.
Argo Group
31,573
49.40%
49.32%
20.
CNA Insurance Companies
30,634
102.09%
92.87%
Source: 2010 Best’s State/Line (P/C Lines). |
 Page
14 Indiana Workers’
Compensation Market Share (Top 20)
(dollars in thousands)
2010 Gross Written
Premium
Five Year Average
Loss Ratio
Three Year Average
Loss Ratio
1.
Liberty Mutual Insurance Company
$
91,671 62.02%
68.05%
2.
Travelers Group
44,298
56.46%
54.85%
3.
American International Group
35,861
70.10%
79.04%
4.
Accident Fund Group
31,171
76.39%
87.31%
5.
Zurich Financial Services NA Group
27,173
74.54%
89.45%
6.
Auto-Owners Insurance Group
25,054
93.14%
109.33%
7.
Cincinnati Insurance Group
23,835
77.89%
85.80%
8.
Hartford Insurance Group
21,794
66.21%
53.93%
9.
Amerisure Companies
19,591
55.94%
59.43%
10.
QBE Americas Group
15,520
50.58%
38.94%
11.
Old Republic Insurance Group
14,561
72.97%
72.40%
12.
W. R. Berkley Group
13,352
69.67%
73.22%
13.
ACE INA Group
11,766
21.77%
20.66%
14.
Eastern Alliance Insurance Group
11,186
50.58%
57.92%
15.
FCCI Insurance Group
10,421
82.35%
91.54%
16.
United Farm Bureau of Indiana Group
9,710
71.35%
84.89%
17.
ACUITY A Mutual Insurance Company
9,708
75.45%
94.30%
18.
Selective Insurance Group
9,493
57.52%
62.73%
19.
Westfield Group
9,306
64.01%
70.82%
20.
CNA Insurance Companies
9,292
74.90%
57.60%
Source: 2010 Best’s State/Line (P/C Lines). |
 Page
15 North Carolina Workers’
Compensation Market Share (Top 20)
Source: 2010 Best’s State/Line (P/C Lines).
(dollars in thousands)
2010 Gross Written
Premium
Five Year Average
Loss Ratio
Three Year Average
Loss Ratio
1.
Liberty Mutual Insurance Company
$
126,752 76.26%
75.70%
2.
Hartford Insurance Group
92,343
66.88%
65.69%
3.
Travelers Group
77,119
63.28%
57.21%
4.
American International Group
74,148
83.11%
101.81%
5.
W. R. Berkley Group
70,859
67.83%
65.87%
6.
Zurich Financial Services NA Group
56,937
79.78%
79.01%
7.
Builders Mutual Insurance Group
47,187
41.13%
39.55%
8.
Franklin Holdings Group
31,148
52.21%
53.65%
9.
Old Republic Insurance Group
27,659
84.13%
84.42%
10.
Accident Fund Group
25,446
65.15%
62.71%
11.
ACE INA Group
24,858
55.25%
60.36%
12.
Cincinnati Insurance Companies
20,536
78.93%
81.34%
13.
Auto-Owners Insurance Group
17,948
80.06%
88.64%
14.
Chubb Group of Insurance Companies
17,278
52.64%
58.41%
15.
Erie Insurance Group
16,873
40.02%
50.34%
16.
Amerisafe Insurance Group
16,672
68.76%
84.59%
17.
North Carolina FB Insurance Group
16,012
66.50%
67.76%
18.
AmTrust Financial Group
15,864
53.10%
54.38%
19.
Great American P & C Insurance Group
14,402
79.05%
79.11%
20.
Companion Property and Casualty Group
11,769
72.14%
56.88%
33
Eastern Alliance Insurance Group
6,487
48.19%
48.23% |
 Page
16 Kevin Shook
Executive Vice President, Treasurer
and Chief Financial Officer |
 Page
17 Eastern Insurance Holdings, Inc. Financial Model
•
Active Capital
Management
–
Geographic expansion
–
Stock repurchases
–
Shareholder dividends
–
M&A opportunities
•
Underwriting Profit
–
Underwriting, risk
management and claims
philosophy
–
Financial underwriting
–
Low expense ratio
•
Investment Results
•
Strong Balance Sheet
–
Asset quality
–
Credit risk management
–
Reserves |
 Page
18 EAIG Balance Sheet Strength
•
67.4% of June 30, 2011 assets are in cash and invested
assets
•
Excellent collection history on premiums receivable
•
Strong reinsurer security
•
Unpaid loss and loss adjustment expense
–
Reserves recorded near high end of actuarial range
–
History of favorable workers’
compensation loss reserve
development
–
Strong base case reserves |
 Page
19 Investment Portfolio Mix
Total Cash and Invested Assets: $227.4 Million
as of June 30, 2011
•Conservative investment
strategy (76% fixed income and cash) •Preservation of capital strategy
•High quality
securities 21%
5%
11%
8%
Fixed Income Securities
Convertible Bonds
Equity Securities
Other Long-Term Investments
Cash and Cash Equivalents
55% |
 Page
20 EIHI Fully Diluted Book Value Performance |
 Page
21 EAIG Workers’
Compensation Combined Ratio History
0.0%
10.0%
20.0%
30.0%
40.0%
50.0%
60.0%
70.0%
80.0%
90.0%
100.0%
2006
2007
2008
2009
2010
Q1 2011
Q2 2011
79.1%
65.6%
80.2%
87.7%
96.0%
92.2%
90.4%
•2010 A.M. Best composite
projected combined ratio 121.5 percent |
 Page
22 EAIG Direct Written Premium Growth Rates
•United States workers’ compensation industry
direct written premium writings decreased from $55
billion in 2005 to $36 billion in 2009
•Projected 2010 = $32
billion $-
$20.0
$40.0
$60.0
$80.0
$100.0
$120.0
$140.0
10.4%
7.7%
8.9%
13.6%
20.6%
8.0%
15.2%
19.8%
23.7%
Percentages as of June 30, 2011 |
 Page
23 EAIG Workers’
Compensation Claim Closing Patterns
Results as of June 30, 2011 |
 Page
24 Eastern Insurance Holdings, Inc. Capital Position
Reported
Implied
Target
Implied Capital
6/30/2011
Book Value
Book Value
Unallocated
Tangible BV
NPW
(1)
NPW/ Surplus
Requirement
GAAP Equity
Per Share
Per Share
Capital
Per Share
Workers' compensation insurance
101,582
$
1.25
81,266
$
91,717
$
11.14
$
9.87
$
1.27
$
11.14
$
Specialty reinsurance
6,000
9,987
1.21
0.73
0.48
1.21
Total required capital
87,266
101,704
12.35
10.60
1.75
12.35
Goodwill and other
14,428
14,428
1.75
1.75
-
-
Total allocated capital
101,693
116,132
14.11
12.35
1.75
12.35
Holding company tangible equity
-
13,403
1.63
-
1.63
1.63
Total shareholders' equity
129,534
129,534
15.73
$
12.35
$
3.38
$
13.98
$
Stock option dilution
(0.22)
(0.06)
Diluted earnings per share
15.51
$
13.93
$
Total unallocated capital
27,841
$
3.38
$
(1)
Net written premium represents a rolling twelve months. |
 |