Attached files
| file | filename |
|---|---|
| EX-31.2 - EX-31.2 - TRC COMPANIES INC /DE/ | exhibit312certificationpur.htm |
| EX-32.1 - EX-32.1 - TRC COMPANIES INC /DE/ | exhibit321certificationpur.htm |
| EX-21 - EX-21 - TRC COMPANIES INC /DE/ | exhibit21subsidiariesofthe.htm |
| EX-32.2 - EX-32.2 - TRC COMPANIES INC /DE/ | exhibit322certificationpur.htm |
| EX-23.1 - EX-23.1 - TRC COMPANIES INC /DE/ | exhibit231consentofregiste.htm |
| EX-31.1 - EX-31.1 - TRC COMPANIES INC /DE/ | exhibit311certificationpur.htm |
UNITED STATES
SECURITIES AND EXCHANGE COMMISSION
Washington, D.C. 20549
FORM 10-K
ý | Annual Report Pursuant to Section 13 or 15(d) of the Securities Exchange Act of 1934 | |
for the fiscal year ended June 30, 2011
or
o | Transition Report Pursuant to Section 13 or 15(d) of the Securities Exchange Act of 1934 | |
for the transition period from to
Commission file number 1-9947
TRC COMPANIES, INC.
(Exact name of registrant as specified in its charter)
Delaware (State or other jurisdiction of incorporation or organization) | 06-0853807 (I.R.S. Employer Identification No.) |
21 Griffin Road North Windsor, Connecticut (Address of principal executive offices) | 06095 (Zip Code) |
Registrant's telephone number, including area code: (860) 298-9692
Securities registered pursuant to Section 12(b) of the Act:
Title of each class | Name of each exchange on which registered | |
Common Stock, $0.10 par value | New York Stock Exchange | |
Securities registered pursuant to Section 12(g) of the Act: None
Indicate by check mark if the registrant is a well-known seasoned issuer, as defined by Rule 405 of the Securities Act. Yes o No ý.
Indicate by check mark if the registrant is not required to file reports pursuant to Section 13 or Section 15(d) of the Act. Yes o No ý.
Indicate by check mark whether the registrant (1) has filed all reports required to be filed by Section 13 or 15 (d) of the Securities Exchange Act of 1934 during the preceding 12 months (or for such shorter period that the registrant was required to file such reports), and (2) has been subject to such filing requirements for the past 90 days. Yes ý No o
Indicate by check mark whether the Registrant has submitted electronically and posted on its corporate Web site, if any, every Interactive Data File required to be submitted and posted pursuant to Rule 405 of Regulation S-T (§232.405 of this chapter) during the preceding 12 months (or for such shorter period that the Registrant was required to submit and post such files). YES o NO o
Indicate by check mark if disclosure of delinquent filers pursuant to Item 405 of Regulation S-K is not contained herein, and will not be contained, to the best of registrant's knowledge, in definitive proxy or information statements incorporated by reference in Part III of this Form 10-K or any amendment to this Form 10-K. ý
Indicate by check mark whether the registrant is a large accelerated filer, an accelerated filer, a non-accelerated filer or a smaller reporting company. See the definitions of "large accelerated filer," "accelerated filer" and "smaller reporting company" in Rule 12b-2 of the Exchange Act (Check one):
Large accelerated filer o | Accelerated filer o | Non-accelerated filer ý (Do not check if a smaller reporting company) | Smaller reporting company o |
Indicate by check mark whether the registrant is a shell company (as defined in Rule 12b-2 of the Exchange Act). Yes o No ý.
The aggregate market value of the registrant's common stock held by non-affiliates on December 24, 2010 was approximately $46,386,000.
On August 31, 2011, there were 27,538,446 shares of common stock of the registrant outstanding.
TRC Companies, Inc.
Index to Annual Report on Form 10-K
Fiscal Year Ended June 30, 2011
Page | ||
2
Forward-Looking Statements
Certain information included in this report, or in other materials we have filed or will file with the Securities and Exchange Commission (the "SEC") (as well as information included in oral statements or other written statements made or to be made by us), contains or may contain forward-looking statements within the meaning of the Private Securities Litigation Reform Act of 1995 (the "1995 Act"). Such statements are being made pursuant to the 1995 Act and with the intention of obtaining the benefit of the "Safe Harbor" provisions of the 1995 Act. Forward-looking statements are based on information available to us and our perception of such information as of the date of this report and our current expectations, estimates, forecasts and projections about the markets in which we operate and the beliefs and assumptions of our management. You can identify these statements by the fact that they do not relate strictly to historical or current facts. They contain words such as "anticipate," "estimate," "expect," "project," "intend," "plan," "believe," "may," "can," "could," "might," or variations of such wording, and other words or phrases of similar meaning in connection with a discussion of our future operating or financial performance, and other aspects of our business, including growth, trends in our business and other characterizations of future events or circumstances. From time to time, forward-looking statements are also included in our other periodic reports on Forms 10-Q and 8-K, in press releases, in our presentations, on our website and in other material released to the public. Any or all of the forward-looking statements included in this report and in any other reports or public statements made by us are only predictions and are subject to risks, uncertainties and assumptions, including those identified below in the "Risk Factors" section, the "Management's Discussion and Analysis of Financial Condition and Results of Operations" section, and other sections of this report and in other reports filed by us from time to time with the SEC as well as in press releases. Such risks, uncertainties and assumptions are difficult to predict and beyond our control and may cause actual results to differ materially from those that might be anticipated from our forward-looking statements. We undertake no obligation to publicly update any forward-looking statements, whether as a result of new information, future events or otherwise. However, any further disclosures made on related subjects in our subsequent reports on Forms 10-K, 10-Q, and 8-K should be consulted.
Part I
Item 1. Business
General Description
TRC Companies, Inc. (hereinafter collectively referred to as "we" "our" or "us"), was incorporated in 1971. We are a national engineering, consulting and construction management firm that provides integrated services to the environmental, energy, and infrastructure markets, primarily in the United States. A broad range of commercial and governmental clients depend on us to design solutions to their toughest business challenges. Our multidisciplinary project teams help our clients (i) implement complex projects from initial concept to delivery and commissioning, (ii) maintain and operate their facilities in compliance with regulatory standards and (iii) manage their assets through decommissioning, demolition, restoration and disposition.
We are headquartered in Windsor, Connecticut, and our corporate website is www.trcsolutions.com (information on our website has not been incorporated by reference into this Form 10-K). Through a link on the investor center section of our website, we make available the following filings as soon as reasonably practicable after they are electronically filed with or furnished to the SEC: our Annual Report on Form 10-K, Quarterly Reports on Form 10-Q, Current Reports on Form 8-K and any amendments to those reports filed or furnished pursuant to Section 13(d) or 15(d) of the Securities and Exchange Act of 1934 (the "Exchange Act") as well as reports filed pursuant to Section 16 of the Exchange Act. All such filings are available free of charge. Under applicable SEC rules, because the aggregate market value of our stock held by non-affiliates was below $50.0 million as of December 24, 2010, the end of our second fiscal quarter, we could have foregone the auditor reporting requirements of Section 404 of the Sarbanes Oxley Act of 2002 for the fiscal year ended June 30, 2011. Nonetheless, we decided to proceed with that process, and the auditors' report on the effectiveness of our internal controls is included in Item 9A. Controls and Procedures.
Financial Highlights
We incurred net losses applicable to our common shareholders of $16.6 million, $22.9 million and $24.1 million for fiscal years 2011, 2010 and 2009, respectively. The net loss applicable to our common shareholders for fiscal year 2011 included a $17.3 million charge related to the Arena Towers litigation reserve and $7.3 million of accretion charges related to preferred stock. The net loss applicable to our common shareholders for fiscal year 2010 included $20.2 million for a goodwill impairment charge and $6.4 million of accretion charges related to preferred stock which were partially offset by a net tax benefit of $4.2 million and a $1.7 million gain on extinguishment of debt. The preferred stock converted to common stock on December 1, 2010, and, as of that date, no further preferred stock accretion charges will be recorded. The net loss applicable to
3
our common shareholders for fiscal year 2009 included a $21.4 million charge for goodwill and intangible asset write-offs and a charge of $3.9 million related to the provision for income taxes.
Business Strategy
We understand our clients' goals and embrace them as our own, applying creativity, experience, integrity and dedication to deliver superior solutions to the world's energy, environmental, and infrastructure challenges. We have continued to unify the Company on a national basis within our operating segments and national sales and marketing organization, giving us the ability to respond to customer challenges and current, dynamic market conditions. We are committed to safety, quality, client satisfaction, excellence in project management, and financial performance to help us win work in areas where our success rate is highest and maintain a growing presence in the future direction of our markets.
In support of our clients and shareholders, we maintain our focus on technical excellence and excellence in all areas of the project cycle including bidding, sales, performance, quality and collections.
Our objectives for fiscal year 2012 are:
• | Continue profitable growth in our operating segments. During fiscal year 2011 we successfully transitioned to a nationally focused sector model for each operating segment. Our Energy and Infrastructure service offerings have been managed and marketed on a national basis since fiscal year 2010, and we are continuing the national integration for our Environmental service offerings in fiscal year 2012. Our national operating platform is linked to our corporate sales and marketing organization, providing information exchange on project execution, regulatory trends and market feedback to better deliver and communicate to our markets. |
• | Continue focus on improvement of operating margins and increase positive operating cash flow. Evolving economic conditions require us to continue our disciplined focus on efficiency and effectiveness by controlling and reducing operating costs. In the past several years, we have taken steps to consolidate and reduce our general and administrative expenses as well as improve our project margins through increased productivity and more efficient execution. These enhancements have created a foundation for maintaining or exceeding our current levels of operating margins in the midst of adverse economic conditions. |
• | Attract and retain top talent. We continue to add top performers to expand our expertise and depth. Our objective is to maintain a workplace where top performers in our industry will be challenged by meaningful projects, rewarded for successful performance, and motivated to develop their entrepreneurial and project management skills for the benefit of the entire company. Our acquisition of the Environmental Business Unit ("RMT-EBU") of RMT, Inc., a subsidiary of Alliant Energy in fiscal year 2011 has added over 200 professional and support staff, expanding our resource base, technical expertise and market services. |
Services
Our services are focused on three operating segments: Energy, Environmental, and Infrastructure.
In the course of providing our services we routinely subcontract services. Generally these subcontractor costs are passed through to our clients and, in accordance with accounting principles generally accepted in the United States of America (“U.S. GAAP”) and consistent with industry practice, are included in gross revenue. Because subcontractor services can change significantly from project to project, changes in gross revenue may not be indicative of business trends. Accordingly, we also report net service revenue ("NSR"), which is gross revenue less subcontractor costs and other direct reimbursable charges, and our discussion and analysis of financial condition and results of operations uses NSR as a primary point of reference.
Energy
The Energy operating segment is strategically positioned to serve key areas within the energy market which is currently investing in modernization, expansion, enhancement and replacement of outdated facilities. Currently within the United States, 70% of transmission lines and larger transformers are 25 years or older, and 60% of circuit breakers are more than 30 years old. The country has recently seen shifts in public policy intended to stimulate renewable energy development, development of a smarter and more robust power grid, and end-user demand management. TRC is one of the leading firms supporting the significant investment associated with the development of new sources of energy and the infrastructure required to deliver new and existing energy sources to consumers. This market, like all other markets dependent upon large capital investment, is influenced by cost and access to capital. Access to private sources of credit and capital were somewhat constrained through calendar 2010, but we have observed a more favorable capital investment environment during 2011 for many of the customers we serve. The American Recovery and Reinvestment Act of 2009 ("ARRA" or "stimulus bill"), targeted, among other
4
investments, those specific areas in which we concentrate our Energy service offerings: energy efficiency, renewable generation, and transmission and distribution. While we believe ARRA may have helped bridge the gap observed in 2010, the credit markets for new energy-related capital projects must be carefully monitored in coming years to maintain confidence in the health of these markets.
Services we provide to energy companies have evolved over the past decade to include support in the licensing and engineering design of new sources of power generation, electrical transmission system upgrades, and natural gas and liquid products pipelines and terminals. Approximately 30% of our total employee base is dedicated to providing energy services to our customers. As major investor owned utilities continue to consolidate and downsize their engineering and environmental staffs, we expect to continue to see long-term growth in these service areas. In addition, we expect to see continued expansion of our expertise in energy efficiency and demand management programs.
Key markets for our Energy operating segment are:
• | Energy Efficiency. An integral part of the nation's energy plan will consist of more effectively managing our use of finite resources through efficiency, conservation, load management and shifting to renewable energy sources. |
We develop and manage statewide energy efficiency programs in New York and New Jersey that reduce energy use and cost-effectively manage demand. We provide comprehensive services including program design, program management, quality control, engineering, financial tracking and reporting. In addition to our statewide programs, we also design and manage portfolio energy efficiency programs including a broad range of services from program management to engineering, quality control and construction inspection for a broad spectrum of end users including commercial office buildings, hospitality chains, educational facilities, residential complexes and military installations.
We are also actively focused on the relationship of energy conservation measures to the reduction in carbon footprints, and we are assisting a number of utilities in "greening" their operations against quantifiable objectives.
• | Electric Transmission. Investment in electric transmission and distribution infrastructure represents one of the largest financial commitments facing utilities over the upcoming decade. The age of the transmission and distribution network combined with continuing electric load growth, and the deployment of renewable generating sources has resulted in heightened concern over the reliability and efficiency of the nation's transmission grid. Capital programs by utilities for necessary upgrades to the grid system are in the early stages of development and are expected to total several billion dollars. |
We have emerged as one of the leading engineering and environmental licensing service providers supporting the extensive upgrade underway to the nation's electric transmission grid. We provide full scope engineering design, material procurement and construction management services. We also provide essential operations and management support to utilities as the trend towards outsourcing engineering functions continues. Our ability to provide integrated energy and environmental services has proven to be a key factor to our success in obtaining these projects.
Environmental
The Environmental operating segment represents our largest operating segment in terms of both profitability and NSR.
The demand for environmental services originally arose in response to the significant environmental legislation in the 1970's. Since that time, regulatory compliance has been a significant market driver, however mergers and acquisitions and the real estate market created economic drivers as well and enabled us to serve those markets on many fronts including support of property owners on a wide range of issues. We provide substantial support to buyers and sellers in the pre-acquisition due diligence and asset valuation process. Our Exit Strategy program grew to national prominence in response to the need for responsible parties, as well as buyers and sellers, to resolve environmental remediation uncertainties.
We are also a national market leader in the areas of air quality modeling, air emissions testing and monitoring, cultural and natural resource management and remediation of contaminated sites.
The markets for our environmental services are dynamic and include:
• | Investigation, remediation, and compliance of contaminated sites. The Environmental Protection Agency estimates over 29,000 contaminated sites of all sizes still need to be evaluated and remediated. This fact combined with the emergence of economically distressed assets into the market provides a strong impetus for assessing and resolving environmental impacts to real estate assets. |
5
• | Natural Gas Related Energy Strategies. Natural gas is a preferred fuel source for domestic energy initiatives. While investment in development of new supplies, transmission pipelines and storage facilities is a function of price and economic conditions, we believe it will become increasingly important in the domestic energy mix. We continue to be an industry leader in serving this market based upon our staff experience which includes Federal Energy Regulatory Commission ("FERC") licensing; federal and state media specific environmental permitting; electrical interconnection engineering; and construction management and oversight. With one of the most experienced national teams of environmental scientists, we have been responsible for the licensing and construction oversight of several of the largest multi-state gas transmission pipeline projects in development. We are currently providing services for the permitting of both land-based and offshore Liquefied Natural Gas ("LNG") terminals in the Gulf and Northwest. |
• | Power and Generation Source Licensing and Permitting. The demand for licensing services and electrical interconnection for new electrical generation sources continues to increase due to several strong market factors. In load congested areas such as the Mid-Atlantic, Northeast, and California, utilities are pursuing development of new sources of electrical supply. Recognizing the importance of fuel diversity, fossil fuel plant development is focusing on both natural gas and coal. Coal plant development projects we are supporting include traditional pulverized coal, waste coal and Integrated Gas Coal Conversion technology. |
With over half of the States implementing renewable portfolio standards, we are providing licensing and engineering support to a number of wind power projects. Reflecting the breadth of our staff capabilities and experience, we are participating in both land-based and offshore wind power developments. Services provided have broadened to include feasibility studies, environmental permitting, site civil engineering, electric transmission interconnect/substation design, construction management and transactional support involving the sale or purchase of existing generation assets. We have provided due diligence and best management practices consulting support with respect to energy assets to a number of leading financial institutions, equity firms and diversified energy companies. This year we have seen a significant increase in the solar development market in particular.
• | Greenhouse gases. There is continuing pressure on the United States to reduce greenhouse gas emissions across all segments of the economy. This will provide us opportunities to support clients in the areas of air emissions consulting, project development, renewable energy permitting, and the development of sustainable business practices. The need to reduce greenhouse gas emissions represents a new starting point for businesses to "green" their processes and make them more efficient and environmentally friendly. |
• | Solid waste management. We offer a full spectrum of solid waste and landfill management services including, siting and permitting, site investigations, planning, alternatives analysis, design, construction, operation, closure and post-closure. The United States generates about 250 million tons of solid waste annually, and all the current facilities have finite capacity. We will be leveraging existing professional expertise with our acquisition of RMT-EBU to expand into this market in fiscal year 2012. |
• | Transaction support. Our ability to evaluate environmental and regulatory risk in real property and business transfers continues to be one of our core strengths. We forecast a steady need for due diligence activities by public and private equity investors, financial institutions, regulatory agencies, and property owners as properties and businesses change ownership. |
• | Environmental compliance and auditing. Industrial and commercial projects must comply with regulations covering, among other things, air quality, water quality, solid and hazardous waste requirements, land use, wildlife, wetlands, cultural resources, and natural resource conservation. Many of these requirements are independent of economic circumstances. In fiscal year 2012 we will be expanding our service line offering in environmental compliance auditing, strategic due diligence services, and environmental health and safety auditing and compliance services. |
• | Infrastructure modernization. Modernizing our national transportation and energy delivery systems continues to be a focus of both the public and the private sectors. Investment in these areas will include the related environmental impacts associated with such modernization. |
• | Sustainability and Climate Change. The market for climate change related services is being driven domestically from many fronts, most of which are not regulatory in nature. We have seen demand for services emerge in the areas of carbon emission assessment and verification, alternate energy development, and public and private sector programs which are designed around energy conservation and other green initiatives. We believe our expertise in air modeling and measurement, renewable energy project licensing, project environmental impact assessment and project engineering, as well as program design and management, provides us an advantage in this emerging |
6
market.
In addition, other market factors are also creating opportunities in the following areas:
• | Mercury monitoring of air emissions as a function of emerging legislation. |
• | Control technology requirements in the Clean Air Act, e.g., the Best Available Retrofit Technology requirements for certain air emission sources. |
• | Continued litigation over a variety of air issues such as facility compliance and operations, historic discharge enforcement and toxic tort claims. |
• | Indoor environmental exposures such as "sick building syndrome" and microbial (mold) issues. |
The primary demand for environmental assessment and remediation services is driven by the regulatory obligations of our clients at existing operating facilities and by the real estate transfer and redevelopment process. We expect our assessment and remediation services market to continue to grow as more of our clients adopt newer, more aggressive environmental management strategies as part of evolving corporate philosophies embracing sustainability and environmental accountability. These strategies require voluntary, accelerated assessment and remediation to lower costs and improve environmental conditions which meet increased societal and shareholder demands for better stewardship. While the market for this type of service has been somewhat reinvigorated due to some positive economic trends, the need for cleanup at affected sites in support of economic redevelopment opportunities continues to lag due to the continued slow conditions in the real estate market. Opportunities to support private sector development-related cleanup projects should expand as economic conditions in real estate and the associated transactional markets improve. We expect our assessment and remediation services market to continue to grow in support of the power generation industry as older facilities are retired or re-powered. Special services we offer are:
• | Exit Strategy®. Our Exit Strategy program is one of the most innovative services we offer our clients. We pioneered this program and created a new national market of environmental risk transfers for contaminated properties. We remain a national market leader with over 100 sites under contract. Traditionally our Exit Strategy offering has been especially attractive to clients in the following situations: |
• | Discontinued Operations. We assume responsibility for the cleanup of contamination at closed or redundant facilities, allowing our clients to focus on their core business operations. |
• | Bankruptcy. Debtors and the creditors are seeking the highest possible value for saleable assets and relief from lingering environmental liabilities. By assuming those liabilities, we can help them achieve a responsible financial solution. |
• | Acquisitions and Divestitures. We assume responsibility for existing environmental cleanup liabilities which neither the buyer wants to assume nor the seller wants to retain. |
• | Multi-Party Superfund Sites. By transferring responsibility for the cleanup of Superfund sites from groups of potentially responsible parties to us, the cleanup schedule can be accelerated and the legal and administrative cost burden substantially reduced. |
• | Brownfield Real Estate Development. By assuming responsibility for site cleanup and defining the related cost with certainty, our Exit Strategy program aids in the settlement of commercial issues among interested parties, such as property owners, lenders, developers, and municipalities, that often stall the redevelopment process. |
• | RE Power®. RE Power is a program where we, in conjunction with a decommissioning and demolition company, provide comprehensive dismantling, cleanup, liability transfer and asset optimization solutions to power and utility companies that elect to decommission and reposition their aging power plant assets. The goal of RE Power is to provide energy companies with a one-stop resource to gain maximum value for power plant assets within any constraints imposed by the power grid and the larger community. This can include safely removing plants from service through demolition and environmental cleanup, and potentially into a redevelopment phase, or preparing the existing power plant for re-powering with more economical fuel sources or more efficient generating equipment. |
Infrastructure
We offer a wide variety of services to our infrastructure clients primarily related to: (1) rehabilitation of overburdened and deteriorating infrastructure systems; (2) design, construction engineering inspection and construction management associated with new infrastructure projects; and (3) management of risks related to security of public and private facilities. We have a
7
strong geographic presence in the Northeast corridor of the United States as well as Texas, Louisiana and California. The following is a listing of the general types of infrastructure services we offer:
• | Construction Management. We provide support to our clients in the areas of program management, project management, construction engineering and inspection, fabrication plant inspections, construction management, estimating and scheduling. |
• | Transportation. We provide planning, design and construction management services in support of work on roads, highways, bridges and aviation facilities. In addition to performing basic design engineering, we also incorporate activities associated with completing environmental studies, marine engineering, seismic analysis, and traffic engineering. |
• | General Civil Engineering Services. We provide civil engineering services associated with development support for commercial and residential real estate development projects by providing master planning, traffic studies, storm water design and management, utility design, and site engineering. We also can provide the basic engineering needs of small municipalities, and our civil engineering expertise is utilized on projects such as the planning, design and construction management of potable water and wastewater treatment systems; master drainage planning; street, roadway and site drainage; dam analysis and design; and master drainage planning. |
• | Geotechnical and Materials Engineering. We provide subsurface exploration, laboratory testing, geotechnical assessments, seismic engineering and quality assurance testing. |
• | Hydraulics and Hydrological Studies. We provide aquifer tests, ground water modeling and yield analysis, scour and erosion studies, design and analysis of storage and distribution systems, Federal Emergency Management Agency studies and watershed modeling. |
• | Security. We provide vulnerability assessments, design engineering and structural improvements for public and private infrastructure facilities, design and implementation of security and surveillance systems, blast resistance design, disaster recovery planning, and force protection analysis. Through the assistance of our national sales program, our market emphasis has shifted from providing these services in commercial buildings to a focus upon public and quasi-public infrastructure and energy-related facilities such as transit systems, utility companies and ports. |
• | Geographic Information Systems & Mapping. We provide, among other services, data modeling, terrain analysis, shoreline management analysis, total station mapping and resource mapping. |
We believe that the long-term market for our infrastructure services will be stable and driven by population growth in certain geographic regions, continued aging and obsolescence of existing infrastructure, capacity shortfalls, and future federal stimulus funding for state and municipal projects. However, spending by both private and government clients has continued to decline in recent years, reflecting economic conditions, and these conditions did not materially improve in the current calendar year. In addition, legislation regarding long term funding for federal transportation projects still remains unresolved at this time. We expect this trend to continue in the near term.
Of note is the continued lack of design-related projects in the "pipeline" for both public and private clients. Given the need to rebuild and modernize our aging national infrastructure, however, we do expect increased spending on public infrastructure programs over the intermediate and long term. The timing and extent of recovery in the private sector is, however, more uncertain in the short and mid-term. The pace of spending on private infrastructure projects has diminished, and, as a result, during the past fiscal year we have experienced client initiated delays and/or cancellation of some assignments. We are focusing our activities where the pace of infrastructure development has remained somewhat robust, and therefore continue to be optimistic regarding the prospects for this market.
In addition, we made the decision to aggressively seek out new markets and service offerings to foster our organic growth plans amidst a challenged economy. Toward that end, we have entered the Steel Fabrication Inspection market. Steel inspection in fabrication shops complements our existing inspection program of pre-cast concrete structures for the same clients. In addition, we have expanded our Construction Management Program in the Northeast to take advantage of local opportunities in our existing market.
8
Clients
No single client accounted for 10% or more of our NSR during fiscal years ended 2011, 2010 and 2009.
Representative clients during the past five years include:
AES Enterprises | Goodyear Tire and Rubber Company | Sempra Energy | ||
AIMCO, Inc. | Hoffman La Roche, Inc. | Spectra Energy | ||
Alcoa | Iberdrola USA | SPX Corporation | ||
Alyeska Pipeline Service Co. | J-Power | Transwestern Pipeline Company, LLC | ||
ASARCO | Kinder Morgan | Waste Management | ||
BNSF | LS Power | State Transportation/Power Authorities: | ||
British Petroleum | Lower Manhattan | • California | ||
Canadian Northern Railway | Development Corporation | • Massachusetts | ||
Central Maine Power Company | Magellan Midstream Partners | • New Hampshire | ||
Competitive Power Ventures | Mirant | • New Jersey | ||
Connecticut Resources Recovery | National Grid | • New York | ||
Authority | New York State Energy Research and | • Pennsylvania | ||
ConocoPhillips | Development Authority | • Texas | ||
Consolidated Edison | Nexterra | • West Virginia | ||
Constellation Energy | Northeast Utilities | • Louisiana | ||
Covanta | NRG | U.S. Government: | ||
Duke Energy | Orange County Transportation Authority | • Environmental Protection Agency | ||
El Paso Energy | PG&E Corporation | • Department of Defense | ||
Entergy | Public Service of New Hampshire | • Federal Aviation Administration | ||
ExxonMobil | PSE&G | • General Services Administration | ||
Competition
The markets for many of our services are highly competitive. There are numerous engineering and consulting firms and other organizations that offer many of the same services offered by us. These firms range in size from small local firms to large national firms that have substantially greater resources than we do. Competitive factors include reputation, performance, price, geographic location and availability of skilled technical personnel. As a mid-size firm, we compete with both the large international firms and the small niche or geographically focused firms.
The majority of our work comes from repeat orders from long-term clients, especially where we are one of the leading service providers in the markets we address. For example, we believe that we are one of the top providers of licensing services for large energy projects. We also believe we are the market leader in the complete outsourcing of site remediation services through our Exit Strategy program. By continuing to stay in front of emerging trends in our markets we believe our competitive position will remain strong.
Backlog
As of June 30, 2011, our contract backlog based on gross revenue was approximately $367 million, compared to approximately $361 million as of June 30, 2010. Our contract backlog based on NSR was approximately $230 million as of June 30, 2011, compared to approximately $222 million as of June 30, 2010. The increase in backlog can be most directly attributed to backlog assumed in the acquisition of RMT-EBU during fiscal year 2011. Approximately 60% of backlog is typically completed in one year. In addition to this contract backlog, we hold open-order contracts from various clients and government agencies. As work under these contracts is authorized and funded, we include this portion in our contract backlog. While most contracts contain cancellation provisions, we are unaware of any material work included in backlog that will be canceled or delayed.
Employees
As of June 30, 2011, we had approximately 2,300 full- and part-time employees. Approximately 90% of these employees are engaged in performing professional services for clients. Many of these employees have advanced degrees. Our professional staff includes program managers, project managers, professional engineers and scientists, construction specialists, computer programmers, systems analysts, attorneys and others with degrees and experience that enable us to provide a diverse range of services. Other employees are engaged in executive, administrative and support activities. We consider the relationships with
9
our employees to be favorable.
Contracts with the United States Government and Agencies of State and Local Governments
We have contracts with agencies of the United States government and various state agencies that are subject to examination and renegotiation. We believe that adjustments resulting from such examination or renegotiation proceedings, if any, will not have a material impact on our operating results, financial position or cash flows.
Regulatory Matters
Our businesses are subject to various rules and regulations at the federal, state and local government levels. We believe that we are in substantial compliance with these rules and regulations. We have the appropriate licenses to bid and perform work in the locations in which we operate. We have not experienced any significant limitations on our business as a result of regulatory requirements. We do not believe any currently proposed changes in law or anticipated changes in regulatory practices would limit bidding on future projects.
Trademarks, Patents and Licenses
We have a number of trademarks, patents, copyrights and licenses. None of these are considered material to our business as a whole.
Environmental and Other Considerations
We do not believe that our own compliance with federal, state and local laws and regulations relating to the protection of the environment will have any material effect on our capital expenditures, earnings or competitive position.
Item 1A. Risk Factors
The risk factors listed below, in addition to those described elsewhere in this report, could materially and adversely affect our business, financial condition, results of operations or cash flows.
Risks Related to Our Company
We incurred significant losses in fiscal years 2011, 2010, and 2009, and may incur such losses in the future. If we continue to incur significant losses or are unable to generate sufficient working capital from our operations or our revolving credit facility, we may have to seek additional external financing.
As reflected in our consolidated financial statements, we incurred net losses applicable to our common shareholders of $16.6 million, $22.9 million and $24.1 million in fiscal years 2011, 2010 and 2009, respectively. Major factors in our losses have been the Arena Towers litigation reserve in fiscal year 2011 and non-cash goodwill and intangible asset impairment charges in fiscal years 2010 and 2009. In addition we recorded significant non-cash preferred stock accretion charges in fiscal years 2011 and 2010. Operating performance has, however, improved and we are continuing to take actions to increase profitability. Nevertheless, if we are unable to maintain operating performance we may incur additional losses. We depend on our core businesses to generate profits and cash flow to fund our working capital growth.
We finance our operations through cash generated by operating activities and borrowings under our revolving credit facility with Wells Fargo Capital Finance. During fiscal year 2010 we completed a preferred stock offering with gross proceeds of $15.5 million. While we have rarely used the credit facility since the preferred stock offering, we are dependent on this facility for any short term liquidity needs when available cash and cash equivalents and cash provided by operations are not adequate to support working capital requirements. The credit facility contains covenants which, among other things, require us to maintain minimum levels of earnings before interest, taxes, depreciation, and amortization as defined in the credit agreement ("EBITDA"), maintain a minimum fixed charge coverage ratio, maintain a minimum level of backlog, and limit capital expenditures.
We believe that existing cash resources, cash forecasted to be generated from operations and availability under our credit facility are adequate to meet our requirements for the foreseeable future. The current uncertain state of the economy and the possibility that economic conditions could continue to be uncertain or deteriorate may affect businesses such as ours in a number of ways. While management cannot directly measure it, variability in the economy and any corollary impact on the availability of credit could affect the ability of our customers and vendors to obtain financing for significant purchases and operations and could result in a decrease in their business with us which could adversely affect our ability to generate profits and cash flows. We are unable to predict the likely duration of the current economic uncertainty and its potential impact on our
10
clients.
If we must write off a significant amount of intangible assets or long-lived assets, our earnings will be negatively impacted.
Goodwill was approximately $20.9 million as of June 30, 2011. We also had other identifiable intangible assets of $4.8 million, net of accumulated amortization, as of June 30, 2011. Goodwill and identifiable intangible assets are assessed for impairment at least annually or whenever events or changes in circumstances indicate that the carrying value of the assets may not be recoverable. We have recorded goodwill and intangible asset impairment charges of $20.2 million and $21.4 million in the fiscal years 2010 and 2009, respectively. A decline in the estimated future cash flows of our reporting units, declines in market multiples of comparable companies and other factors may result in additional impairments of goodwill or other assets which would negatively impact our earnings.
We are and will continue to be involved in litigation. Legal defense and settlement expenses can have a material adverse impact on our operating results.
We have been, and likely will be, named as a defendant in legal actions claiming damages and other relief in connection with engineering and construction projects and other matters. These are typically actions that arise in the normal course of business, including employment-related claims, contractual disputes, professional liability, or claims for personal injury or property damage. We have substantial deductibles on several of our insurance policies, and not all claims are insured. In addition, we have also incurred legal defense and settlement expenses related to prior acquisitions. Accordingly, defense costs, settlements and potential damage awards may have a material adverse effect on our business, operating results, financial position and cash flows in future periods.
A trial was recently held in the The Arena Group v. TRC Environmental Corporation and TRC Companies, Inc. case which resulted in jury verdict being rendered against us and our subsidiary on June 20, 2011. As a result, the accompanying statement of operations for the fiscal year ended June 30, 2011 includes a charge of $17.3 million representing the full value of the verdict as well as pre-judgment interest and certain potential costs associated with appeal.
Subcontractor performance and pricing could expose us to loss of reputation and additional financial or performance obligations that could result in reduced profits or losses.
We often hire subcontractors for our projects. The success of these projects depends, in varying degrees, on the satisfactory performance of our subcontractors and our ability to successfully manage subcontractor costs and pass them through to our customers. If our subcontractors do not meet their obligations or we are unable to manage or pass through costs, we may be unable to profitably perform and deliver our contracted services. Under these circumstances we may be required to make additional investments and expend additional resources to ensure the adequate performance and delivery of the contracted services. These additional obligations have resulted in reduced profits or, in some cases, significant losses for us with respect to certain projects. In addition, the inability of our subcontractors to adequately perform or our inability to manage subcontractor costs on certain projects could hurt our competitive reputation and ability to obtain future projects.
Our operations could require us to utilize large sums of working capital, sometimes on short notice and sometimes without the ability to recover the expenditures.
Circumstances or events which could create large cash outflows include losses resulting from fixed-price contracts, remediation of environmental liabilities, legal expenses and settlements, project completion delays, failure of clients to pay, income tax assessments and professional liability claims, among others. We cannot provide assurance that we will have sufficient liquidity or the credit capacity to meet all of our cash needs if we encounter significant working capital requirements as a result of these or other factors.
Our services expose us to significant risks of liability and it may be difficult or more costly to obtain or maintain adequate insurance coverage.
Our services involve significant risks that may substantially exceed the fees we derive from our services. Our business activities expose us to potential liability for professional negligence, personal injury and property damage among other things. We cannot always predict the magnitude of such potential liabilities. In addition, our ability to perform certain services is dependent on the availability of adequate insurance.
We obtain insurance from insurance companies to cover a portion of our potential risks and liabilities subject to specified policy limits, deductibles or coinsurance. It is possible that we may not be able to obtain adequate insurance to meet our needs, may have to pay an excessive amount for the insurance coverage we want, or may not be able to acquire any insurance for certain types of business risks. As a result of events in the financial markets, we face additional risks due to the continuing uncertainty and disruption in those markets. Much of our commercial insurance is underwritten by the regulated insurance subsidiaries of Chartis (formerly the American International Group). Chartis has also underwritten almost all of the cost cap
11
and related insurance purchased by Exit Strategy clients which share some specific characteristics that present additional risk. The Exit Strategy related policies all tend to be long term; many are ten years or more. Some policies also serve to satisfy state and federal financial assurance requirements for certain projects, and without these policies, alternative financial assurance arrangements for these projects would need to be arranged. Additionally, most of our Exit Strategy projects require us to perform the work in the event insurance limits are exhausted, directly exposing us to financial risks.
We are self-insured or carry deductibles for a significant portion of our claims exposure, which could materially and adversely affect our operating income and profitability.
We are self-insured or carry deductibles for most of our insurance coverages, including certain insurance programs related to discontinued businesses. Because of these deductibles and self-insured retention amounts, we have significant exposure to fluctuations in the number and severity of claims. As a result, our insurance and claims expense could increase in the future. Under certain conditions, we may elect or be required to increase our self-insured or deductible amounts, which would increase our already significant exposure to expense from claims. If any claim exceeds our coverage, we would bear the excess expense, in addition to our other self-insured amounts. If the frequency or severity of claims or our expenses increase, our operating income and profitability could be materially adversely affected.
Our failure to properly manage projects may result in additional costs or claims.
Our engagements involve a variety of projects, some of which are large-scale and complex. Our performance on projects depends in large part upon our ability to manage the relationship with our clients and to effectively manage the project and deploy appropriate resources, including third-party contractors and our own personnel, in a timely manner. If we miscalculate, or fail to properly manage, the resources or time we need to complete a project with capped or fixed fees, or the resources or time we need to meet contractual obligations, our operating results could be adversely affected. Furthermore, any defects, errors or failures to meet our clients' expectations could result in claims against us.
If we miss a required performance standard, fail to timely complete, or otherwise fail to adequately perform on a project, we may incur a loss on that project, which may reduce or eliminate our overall profitability.
We may commit to a client that we will complete a project by a scheduled date. We may also commit that a project, when completed, will achieve specified performance standards. If the project is not completed by the scheduled date or fails to meet required performance standards, we may incur significant additional costs or be held responsible for the costs incurred by the client to rectify damages due to late completion or failure to achieve the required performance standards. The uncertainty of the timing of a project can present difficulties in planning the amount of personnel needed for the project. If the project is delayed or canceled, we may bear the cost of an underutilized workforce that was dedicated to fulfilling the project. In addition, performance of projects can be affected by a number of factors beyond our control, including unavoidable delays from weather conditions, changes in the project scope of services requested by clients or labor or other disruptions. In some cases, should we fail to meet the required schedule or performance standards, we may also be subject to agreed-upon financial damages, which are determined by the contract. To the extent that these events occur, the total costs of the project could exceed our estimates or, in some cases, cause a loss on a project, which may reduce or eliminate our overall profitability.
Our business and operating results could be adversely affected by our inability to accurately estimate the overall risks, revenue or costs on a contract.
We generally enter into three principal types of contracts with our clients: fixed-price, time-and-materials, and cost-plus. Under our fixed-price contracts, we receive a fixed price irrespective of the actual costs we incur and, consequently, we are exposed to a number of risks. These risks include: underestimation of costs, problems with new technologies, unforeseen costs or difficulties, delays, price increases for materials, poor project management or quality problems, and economic and other changes that may occur during the contract period. Under our time-and-materials contracts, we are paid for labor at negotiated hourly billing rates and for other expenses. Profitability on these contracts is driven by billable headcount and cost control. Many of our time-and-materials contracts are subject to maximum contract values, and, accordingly, revenue relating to these contracts is recognized as if these contracts were fixed-price contracts. Under our cost-plus contracts, some of which are subject to contract ceiling amounts, we are reimbursed for allowable costs and fees which may be fixed or performance-based. If our costs exceed the contract ceiling or are not allowable under the provisions of the contract or any applicable regulations, we may not be able to obtain reimbursement for all such costs. Accounting for a fixed-price contract requires judgments relative to assessing the contract's estimated risks, revenue and estimated costs as well as technical issues. The uncertainties inherent in the estimating process make it possible for actual costs to vary from estimates, or estimates to change, resulting in reductions or reversals of previously recorded revenue and profit. Such differences could be material.
Our Exit Strategy projects present risks that could arise from the eventual expiration of the fixed insurance policy term or the potential for the incurred costs to exceed of the financial limits of the insurance policy. Funding for each Exit Strategy project is provided through a notional commutation account held by the insurer and an insurance layer which provides for
12
additional funding of incremental costs incurred above the funds contained in the notional commutation account. If we are unable to complete the work within the financial and term limits of the commutation account and the insurance layer, we may incur costs which are not reimbursable, and we may incur a significant loss on the contract. Exit Strategy projects typically involve complex multi-year environmental remediation measures which must be approved by regulators both as to the remedial approach as well as the achievement of the final result.
Our profitability could suffer if we are not able to maintain adequate utilization of our workforce.
As a service organization, the percentage of our employees' time that is chargeable to clients (utilization) is a key factor. The rate at which we utilize our workforce is affected by a number of factors, including:
• | Our ability to transition employees from completed projects to new assignments and to hire and assimilate new employees; |
• | Our ability to forecast demand for our services and thereby maintain an appropriate headcount in each of our geographies and workforces; |
• | Our ability to manage attrition; |
• | Our need to devote time and resources to training, business development, professional development and other non-chargeable activities; and |
• | Our ability to match the skill sets of our employees to the needs of the marketplace. |
Our backlog is subject to cancellation and unexpected adjustments and is an uncertain indicator of future operating results.
Our contract backlog based on NSR as of June 30, 2011 was approximately $230 million. We cannot guarantee that the NSR projected in our backlog will be realized or, if realized, will result in profits. In addition, project cancellations or scope adjustments may occur from time to time with respect to contracts reflected in our backlog. These types of backlog reductions could adversely affect our revenue and margins. Accordingly, our backlog as of any particular date is an uncertain indicator of our future earnings.
Acquisitions, joint ventures and strategic alliances may have an adverse effect on our business.
We expect to continue making acquisitions or entering into joint ventures and strategic alliances as part of our long-term business strategy. These transactions involve significant challenges and risks including that the transaction does not advance our business strategy, that we don't realize a satisfactory return on our investment, that we experience difficulty integrating new employees, business systems, technology, and cultures or that management's attention is diverted from our other businesses. It may take longer than expected to realize the full benefits of acquisitions, such as increased revenue, enhanced efficiencies, or market share, or those benefits may ultimately be smaller than anticipated, or may not be realized. These events could harm our operating results or financial condition.
If we are not able to successfully manage our growth strategy, our business and results of operations may be adversely affected.
Our expected future growth presents numerous managerial, administrative, operational and other challenges. Our ability to manage the growth of our operations will require us to increase the capacity of our management information systems and maintain strong internal systems and controls. In addition, our growth will increase our need to attract, develop, motivate and retain management and professional employees. The inability of our management to effectively manage our growth or the inability of our employees to achieve anticipated performance could have a material adverse effect on our business.
Our operating results may be adversely impacted by worldwide political and economic uncertainties and specific conditions in the markets we address.
General worldwide economic conditions have experienced a downturn due to the lack of available credit, slower economic activity, concerns about inflation and deflation, increased energy costs, decreased consumer confidence, reduced corporate profits and capital spending, and adverse business conditions. These conditions make it extremely difficult for our clients and our vendors to accurately forecast and plan future business activities and could cause businesses to slow spending on services, and they have also made it difficult for us to predict the short-term and long-term impacts on our business. We cannot predict the timing, strength or duration of any economic slowdown or subsequent economic recovery worldwide or in our industry. If the economy or markets in which we operate deteriorate from the level experienced in fiscal year 2011, our business, financial condition and results of operations may be materially and adversely affected.
13
Our inability to maintain adequate bonding capacity could have a material adverse effect on our future revenue and business prospects.
Certain clients require bid bonds and performance and payment bonds. These bonds indemnify the client should we fail to perform our obligations under a contract. If a bond is required for a particular project and we are unable to obtain an appropriate bond, we cannot pursue that project. We currently have bonding capacity but, as is typically the case, the issuance of bonds under that facility is at the surety's sole discretion. Moreover, due to events that can negatively affect the insurance and bonding markets, bonding may be more difficult to obtain or may only be available at significant additional cost. There can be no assurance that bonds will continue to be available to us on reasonable terms. Our inability to obtain adequate bonding and, as a result, to bid on new work, could have a material adverse effect on our future revenue and business prospects.
Risks Related to Our Industry
Changes in existing environmental laws, regulations and programs or reductions in the level of regulatory enforcement could reduce demand for our environmental services which could cause our revenue to decline.
While we pursue markets for our services that are strongly tied to the overall health of the domestic economy, our business is also materially dependent on the continued enforcement by federal, state and local governments of various environmental regulations. A significant amount of our business is generated either directly or indirectly as a result of existing federal and state laws, regulations and programs related to pollution and environmental protection. Accordingly, a relaxation or repeal of these laws and regulations, or changes in governmental policies regarding the funding, implementation or enforcement of these programs, could result in a decline in demand for environmental services that may have a material adverse effect on our revenue and business prospects.
We operate in highly competitive industries.
The markets for many of our services are highly competitive. There are numerous professional architectural, engineering and consulting firms and other organizations which offer many of the services offered by us. We compete with many companies, some of which have greater resources. Competitive factors include reputation, performance, price, geographic location and availability of technically skilled personnel. In addition, many clients also use in-house staff to perform the same types of services we do.
We are materially dependent on contracts with federal, state and local governments. Our inability to continue to win or renew government contracts could result in material reductions in our revenues and profits.
We have increased our contract activity with the federal, state and local governments in recent years and are materially dependent on such contracts. We estimate that contracts with agencies of the United States government and various state and local governments represented approximately 25% of our NSR in fiscal year 2011. Companies engaged in government contracting are subject to certain unique business risks. Among these risks are dependence on appropriations and administrative allotment of funds as well as changing policies and regulations. These contracts may also be subject to renegotiation of profits or termination at the option of the government. The stability and continuity of that portion of our business depends on the periodic exercise by the government of contract renewal options, our continued ability to negotiate favorable terms and the continued awarding of task orders to us. We cannot control whether those clients will fund or continue funding our outstanding projects.
We are subject to procurement laws and regulations associated with our government contracts. If we do not comply with these laws and regulations, we may be prohibited from completing our existing government contracts or suspended from government contracting and subcontracting for some period of time or debarred.
Our compliance with the laws and regulations relating to the procurement, administration, and performance of our government contracts is dependent upon our ability to ensure that we properly design and execute compliant procedures. Our termination from any of our larger government contracts or suspension from future government contracts for any reason would result in material declines in expected revenue. Because government agencies have the ability to terminate a contract for convenience, the agencies could terminate or decide not to renew our contracts with little or no prior notice.
Our government contracts are subject to audit. These audits may result in the determination that certain costs claimed as reimbursable are not allowable or have not been properly allocated to government contracts according to government regulations. We are subject to audits for several years after payment for services has been received. Based on these audits, government entities may adjust or seek reimbursement for previously paid amounts. None of the audits performed to date on our government contracts have resulted in any significant adjustments to our financial statements. It is possible, however, that an audit in the future could have an adverse effect on our revenue, profits and cash flow.
14
Reductions in state and local government budgets could negatively impact their capital spending and adversely affect our business, financial condition and results of operations.
Several of our state and local government clients are currently facing budget deficits, resulting in smaller budgets and reduced capital spending, which has negatively impacted our revenue and profitability. Our state and local government clients may continue to face budget deficits that prohibit them from funding new or existing projects. In addition, existing and potential clients may either postpone entering into new contracts or request price concessions. If we are not able to reduce our costs quickly enough to respond to the revenue decline from these clients that may occur, our operating results would be adversely affected. Accordingly, these factors affect our ability to accurately forecast our future revenue and earnings from business areas that may be adversely impacted by market conditions.
Other Risks
The value of our equity securities could continue to be volatile.
Our stock is thinly traded and over time has experienced substantial price volatility. In addition, the stock market has experienced price and volume fluctuations that have affected the market price of many companies that have often been unrelated to the operating performance of these companies. The overall market and the price characteristics of our common stock may continue to fluctuate greatly. Additionally, volatility or a lack of positive performance in our stock price may adversely affect our ability to retain or attract key employees. Many of these key employees are granted stock options and restricted stock as an element of compensation, the value of which is dependent on our stock price.
Our actual business and financial results could differ from the estimates and assumptions that we use to prepare our financial statements, which may significantly reduce or eliminate our profits.
To prepare financial statements in conformity with generally accepted accounting principles ("GAAP") in the United States, management is required to make estimates and assumptions as of the date of the financial statements. These estimates and assumptions affect the reported values of assets, liabilities, revenue and expenses, as well as disclosures of contingent assets and liabilities. For example, we recognize revenue over the life of a contract based on the proportion of costs incurred to date compared to the total costs estimated to be incurred for the entire project. Areas requiring significant estimates by our management include:
• | The application of the percentage-of-completion method of accounting and revenue recognition on contracts, change orders and contract claims; |
• | Provisions for uncollectible receivables and client claims and recoveries of costs from subcontractors, vendors and others; |
• | Provisions for income taxes and uncertain tax positions; |
• | Value of goodwill and recoverability of other intangible assets; |
• | Valuations of assets acquired and liabilities assumed in connection with business combinations; |
• | Estimated earn-out payments due in connection with business combinations; |
• | Valuation of self insured reserves; |
• | Valuation of stock-based compensation expense; and |
• | Accruals for estimated liabilities, including litigation and insurance reserves. |
Our actual business and financial results could differ from those estimates, which may significantly reduce or eliminate our profits.
We may experience adverse impacts on our results of operations as a result of adopting new accounting standards or interpretations.
Our adoption of, and compliance with, changes in accounting rules, including new accounting rules and interpretations, could adversely affect our operating results or cause unanticipated fluctuations in our operating results.
We are highly dependent on key personnel.
The success of our business depends on our ability to attract and retain qualified employees. We need talented and experienced personnel in a number of areas to support our core business activities. An inability to attract and retain sufficient qualified personnel could harm our business. Turnover among certain critical staff could have a material adverse effect on our ability to implement our strategies and on our results of operations.
15
Safety related issues could result in significant losses.
Safety is a primary focus of our business. We often work on large-scale and complex projects, sometimes in geographically remote locations which can place our employees and others near large equipment, dangerous processes or highly regulated materials, and in challenging environments. Many of our clients require that we meet certain safety criteria to be eligible to bid on contracts, and some of our contract fees or profits are subject to satisfying safety criteria. Unsafe work conditions also have the potential of increasing employee turnover, increasing project costs and raising our operating costs. We are responsible for the safety of our employees at work, and, on occasion on certain projects, we take on expanded site safety responsibilities. If our employees or others become injured, or if we fail to implement appropriate health and safety procedures, we could be subject to claims and liability. In addition, if our overall safety metrics fall below certain levels we may be foreclosed from bidding on work with certain clients.
We rely on third-party internal and outsourced software to run our critical accounting, project management and financial information systems. As a result, any sudden loss, disruption or unexpected costs to maintain these systems could significantly increase our operational expense and disrupt the management of our business operations.
We rely on third-party software to run our critical accounting, project management and financial information systems. We also depend on our software vendors to provide long-term software maintenance support for our information systems. Software vendors may decide to discontinue further development, integration or long-term software maintenance support for our information systems, in which case we may need to abandon one or more of our current information systems and migrate some or all of our accounting, project management and financial information to other systems, thus increasing our operational expense as well as disrupting the management of our business operations.
If we fail to maintain an effective system of internal controls, we may not be able to accurately report our financial results or prevent fraud. As a result, investors could lose confidence in our financial reporting, which could harm our business and the trading price of our stock.
Effective internal controls are necessary for us to provide reliable financial reports and prevent fraud. If we cannot provide reliable financial reports or prevent fraud, our operating results could be harmed. We devote significant attention to establishing and maintaining effective internal controls. Implementing changes to our internal controls has entailed substantial costs in order to modify our existing accounting systems. Although these measures are designed to do so, we cannot be certain that such measures and future measures will guarantee that we will successfully maintain adequate controls over our financial reporting processes and related reporting requirements. For example, in the past we have had material weaknesses, including a material weakness relating to the policies and procedures relating to the development, documentation and review of contract values and estimates of cost at completion, which we have remediated. Internal controls that are found to not be operating effectively could affect our operating results or cause us to fail to meet our reporting obligations and could result in a breach of a covenant in our revolving credit facility in future periods. Ineffective internal controls could also cause investors to lose confidence in our reported financial information, which could have a negative effect on the market price of our stock.
Extraordinary events, including natural disasters and terrorist actions could negatively impact the economies in which we operate or disrupt our operations, which may affect our financial condition, results of operations or cash flows.
Extraordinary events beyond our control, such as natural and man-made disasters, computer hacking, as well as terrorist actions, could negatively impact us by causing the closure of offices, interrupting projects and forcing the relocation of employees. Further, despite our implementation of network security measures, our computer systems are vulnerable to computer viruses, break-ins and similar disruptions from unauthorized tampering with our computer systems. If we are not able to react quickly to these sort of events, our operations may be affected significantly, which would have a negative impact on our financial condition, results of operations or cash flows.
Item 1B. Unresolved Staff Comments
None.
Item 2. Properties
We provide our services through a network of approximately 100 offices located nationwide. We lease approximately 700,000 square feet of office and commercial space to support these operations. In addition, a subsidiary of ours owns a 26,000 square foot office/warehouse building in Austin, Texas. This property is subject to a deed of trust in favor of the lenders under our principal credit facility. All properties are adequately maintained and are suitable and adequate for the business activities conducted therein. In connection with the performance of certain Exit Strategy or real estate projects, some of our subsidiaries have taken title to sites on which environmental remediation activities are being performed.
16
Item 3. Legal Proceedings
See Note 18—Commitments and Contingencies of the Notes to Financial Statements (Part II, Item 8 of this Form 10-K) for information regarding legal proceedings in which we are involved.
17
Part II
Item 5. Market for Registrant's Common Equity, Related Stockholder Matters and Issuer Purchases of Equity Securities
On June 1, 2009, we sold 7,209.302 shares of a new Series A Convertible Preferred Stock, $0.10 par value, for $2,150 per share pursuant to a stock purchase agreement by and among us and three of our existing shareholders and related entities. The preferred stock offering resulted in proceeds of $15.3 million, net of issuance costs of $0.2 million. On December 1, 2010, the preferred stock converted to 7,209,302 shares of common stock. The preferred stock offering was made pursuant to the exemption from registration provided in Regulation D, Rule 506, under Section 4 (2) of the Securities Act of 1933 as amended (the “Act”). Each of the investors is an “accredited investor” within the meaning of Rule 501 (a) under the Act.
During fiscal year 2011, we issued 79,787 shares of unregistered common stock with a market value of $0.3 million as consideration for the purchase of Alexander Utility Engineering, Inc.
Our common stock is traded on the New York Stock Exchange ("NYSE") under the symbol "TRR." The following table sets forth the high and low per share prices for the common stock for fiscal years 2011 and 2010 as reported on the NYSE:
Fiscal 2011 | Fiscal 2010 | ||||||||||||||
High | Low | High | Low | ||||||||||||
First Quarter | $ | 3.25 | $ | 2.65 | $ | 4.97 | $ | 3.50 | |||||||
Second Quarter | 3.98 | 2.20 | 3.86 | 2.55 | |||||||||||
Third Quarter | 5.14 | 3.45 | 3.11 | 2.57 | |||||||||||
Fourth Quarter | 9.01 | 4.30 | 3.56 | 2.66 | |||||||||||
As of July 13, 2011, there were 259 shareholders of record, and, as of that date, we estimate there were approximately 1,845 beneficial owners holding our common stock in nominee or "street" name.
To date we have not paid any cash dividends on our common stock, and the payment of dividends in the future will be subject to financial condition, capital requirements and earnings. Future earnings are expected to be used for expansion of our operations, and cash dividends are not currently anticipated. The terms of our credit agreement also prohibit the payment of cash dividends.
18
Stock Performance Graph
Comparison of Five-Year Cumulative Total Return Among TRC, S&P 500 Total Return Index and Peer Companies
The annual changes for the five-year period shown in the graph below are based upon the assumption (as required by SEC rules) that $100 had been invested in our Common Stock on June 30, 2006. The figures presented assume that all dividends, if any, paid over the performance periods were reinvested.
Comparison of 5 Year Cumulative Total Return
Assumes Initial Investment of $100
June 2011
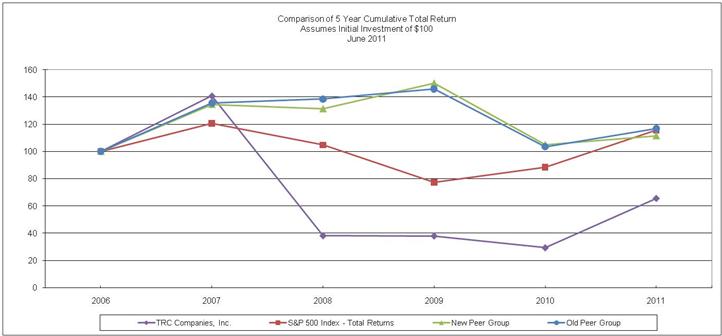
Data and graph provided by Zacks Investment Research, Inc. Copyright© 2011, Standard & Poor's, a division of The McGraw-Hill Companies, Inc. All rights reserved.
Year Ended June 30, | |||||||||||||||||||||||
2006 | 2007 | 2008 | 2009 | 2010 | 2011 | ||||||||||||||||||
TRC | $ | 100 | $ | 141 | $ | 38 | $ | 38 | $ | 29 | $ | 66 | |||||||||||
S&P 500 Index | 100 | 121 | 105 | 77 | 88 | 116 | |||||||||||||||||
New Peer Group | 100 | 134 | 131 | 150 | 105 | 111 | |||||||||||||||||
Old Peer Group | 100 | 136 | 139 | 146 | 104 | 117 | |||||||||||||||||
The companies included in the new peer group are: Ecology & Environment, Inc.; ENGlobal Corp.; Michael Baker Corporation; Tetra Tech, Inc.; and Versar, Inc.
The companies included in the old peer group are: Ecology & Environment, Inc.; ENGlobal Corp.; Tetra Tech, Inc.; Versar, Inc.; and, VSE Corp.
We updated our peer group in fiscal year 2011 to include Michael Baker Corporation and remove VSE Corporation to provide a more representative peer group.
19
Item 6. Selected Financial Data
The following table provides summarized information with respect to our operations and financial position. The data set forth below should be read in conjunction with "Management's Discussion and Analysis of Financial Condition and Results of Operations" and our financial statements and the notes thereto.
Statements of Operations Data, for the fiscal years ended June 30, | 2011 | 2010 | 2009 | 2008 | 2007 | ||||||||||||||
(in thousands, except per share data) | |||||||||||||||||||
Gross revenue | $ | 333,209 | $ | 330,575 | $ | 432,517 | $ | 465,079 | $ | 441,643 | |||||||||
Less subcontractor costs and other direct reimbursable charges | 87,298 | 100,476 | 177,713 | 196,870 | 185,735 | ||||||||||||||
Net service revenue | 245,911 | 230,099 | 254,804 | 268,209 | 255,908 | ||||||||||||||
Interest income from contractual arrangements | 411 | 596 | 1,859 | 3,944 | 4,747 | ||||||||||||||
Insurance recoverables and other income | (1,573 | ) | 8,844 | 19,539 | 6,123 | 4,170 | |||||||||||||
Operating costs and expenses: | |||||||||||||||||||
Cost of services (exclusive of costs shown separately below) (1) | 202,265 | 203,221 | 227,217 | 241,647 | 231,025 | ||||||||||||||
General and administrative expenses (1) | 26,286 | 26,028 | 32,936 | 38,660 | 23,969 | ||||||||||||||
Provision for doubtful accounts | 1,763 | 2,344 | 3,952 | 3,708 | 1,318 | ||||||||||||||
Depreciation and amortization (2) | 4,729 | 8,049 | 7,322 | 8,051 | 8,311 | ||||||||||||||
Goodwill and intangible asset impairments (3) | — | 20,249 | 21,438 | 77,267 | — | ||||||||||||||
Arena Towers litigation reserve (4) | 17,278 | 1,100 | — | 1,417 | — | ||||||||||||||
Total operating costs and expenses | 252,321 | 260,991 | 292,865 | 370,750 | 264,623 | ||||||||||||||
Operating (loss) income | (7,572 | ) | (21,452 | ) | (16,663 | ) | (92,474 | ) | 202 | ||||||||||
Interest expense | (761 | ) | (1,003 | ) | (2,925 | ) | (3,936 | ) | (4,359 | ) | |||||||||
Gain on extinguishment of debt (5) | — | 1,716 | — | — | — | ||||||||||||||
Registration penalties (6) | — | — | — | — | (600 | ) | |||||||||||||
Loss from operations before taxes and equity in earnings (losses) | (8,333 | ) | (20,739 | ) | (19,588 | ) | (96,410 | ) | (4,757 | ) | |||||||||
Federal and state income tax (provision) benefit (7) | (1,127 | ) | 4,210 | (3,871 | ) | (12,296 | ) | 1,337 | |||||||||||
Loss from operations before equity in earnings (losses) | (9,460 | ) | (16,529 | ) | (23,459 | ) | (108,706 | ) | (3,420 | ) | |||||||||
Equity in earnings (losses) from unconsolidated affiliates, net of taxes (8) | 30 | (45 | ) | (449 | ) | (505 | ) | (161 | ) | ||||||||||
Loss from continuing operations | (9,430 | ) | (16,574 | ) | (23,908 | ) | (109,211 | ) | (3,581 | ) | |||||||||
Discontinued operations, net of taxes (9) | — | — | — | — | (77 | ) | |||||||||||||
Net loss | (9,430 | ) | (16,574 | ) | (23,908 | ) | (109,211 | ) | (3,658 | ) | |||||||||
Net loss applicable to noncontrolling interest | 58 | 125 | — | 62 | 24 | ||||||||||||||
Net loss applicable to TRC Companies, Inc. | (9,372 | ) | (16,449 | ) | (23,908 | ) | (109,149 | ) | (3,634 | ) | |||||||||
Dividends and accretion charges on preferred stock (10) | (7,261 | ) | (6,431 | ) | (215 | ) | — | (2,233 | ) | ||||||||||
Net loss applicable to TRC Companies, Inc.'s common shareholders | $ | (16,633 | ) | $ | (22,880 | ) | $ | (24,123 | ) | $ | (109,149 | ) | $ | (5,867 | ) | ||||
Basic and diluted loss per common share | |||||||||||||||||||
Loss from continuing operations | $ | (0.69 | ) | $ | (1.17 | ) | $ | (1.25 | ) | $ | (5.84 | ) | $ | (0.33 | ) | ||||
Discontinued operations, net of taxes | — | — | — | — | — | ||||||||||||||
$ | (0.69 | ) | $ | (1.17 | ) | $ | (1.25 | ) | $ | (5.84 | ) | $ | (0.33 | ) | |||||
Basic and diluted weighted-average common shares outstanding | 24,107 | 19,548 | 19,272 | 18,700 | 17,563 | ||||||||||||||
Cash dividends declared per common share | — | — | — | — | — | ||||||||||||||
Balance Sheet Data at June 30: | |||||||||||||||||||
Total assets | $ | 276,060 | $ | 287,795 | $ | 336,896 | $ | 397,319 | $ | 485,982 | |||||||||
Long-term debt, including current portion | 9,176 | 9,444 | 12,501 | 39,310 | 42,670 | ||||||||||||||
Preferred stock | — | 8,239 | 1,808 | — | — | ||||||||||||||
Shareholders' equity | 29,672 | 27,953 | 48,623 | 57,671 | 161,729 | ||||||||||||||
_________________________________
(1) | Concurrent with the implementation of our new enterprise resource and planning system in fiscal year 2007, our processes and costs relating to financial, information technology and administrative functions were realigned and are now incurred by corporate functions. Beginning in fiscal year 2008, the related costs are classified as general and administrative expenses. Previously, these processes and related expenses were performed by individuals in field locations and were included in cost of services. Management estimates that $5.6 million of expenses were included in general and administrative expenses in fiscal year 2008 that in the previous year were included in costs of services. |
(2) | During fiscal year 2010, we recorded amortization expense of $1.9 million of which $1.6 million was due to the acceleration of amortization expense |
20
relating to certain customer relationship intangible assets.
(3) | During fiscal year 2010, we recorded an impairment charge of $20.2 million related to goodwill. During fiscal year 2009, we recorded impairment charges of $19.3 million related to goodwill and $2.1 million related to certain customer relationships intangible assets. During fiscal year 2008, we recorded impairment charges of $76.7 million related to goodwill and $0.6 million related to certain customer relationships intangible assets. |
(4) | During fiscal year 2011, the jury in the Arena Towers case returned a verdict against us in the amount of $15.4 million. We incurred approximately $17.3 million, $1.1 million and $1.4 million of litigation reserve expenses relating to this case in fiscal years 2011, 2010 and 2008, respectively. No judgment has been entered on the verdict, and we are undertaking post-trial and appellate measures in an effort to reduce or reverse the verdict. |
(5) | During fiscal year 2010, we recorded a $1.7 million gain on extinguishment of debt in connection with the dissolution of Co-Energy LLC, a consolidated entity. |
(6) | During fiscal year 2007, the $0.6 million penalty related to our failure to obtain an effective registration statement related to our fiscal year 2006 private placement. |
(7) | During fiscal year 2010, we recorded a net tax benefit of $4.2 million primarily due to: (i) the Worker, Homeownership, and Business Assistance Act of 2009 which amended I.R.C. §172(b)(1)(H), which allows taxpayers to elect to carry back an applicable net operating loss ("NOL") for a period of 3, 4, or 5 years, to offset taxable income in those preceding years enabling us to carry back our fiscal year 2008 NOL for a tax benefit of $2.8 million, which amount was collected in January 2010, and (ii) the re-assessment of our uncertain tax positions based on communications with the IRS relating to our examination including the impact of the NOL law change. During fiscal year 2008, we determined that it was more likely than not that our deferred tax assets would not be realized as a result of insufficient expected future taxable income or reversals of existing temporary differences and recorded a valuation allowance of $12.1 million to fully reserve for our deferred tax assets as of such date. |
(8) | The fiscal years 2009, 2008 and 2007 equity in losses from unconsolidated affiliates includes impairment charges of $0.4 million, $0.5 million and $0.4 million, respectively. |
(9) | We sold our wholly-owned subsidiaries Omni and Bellatrix in fiscal year 2007. |
(10) | We incurred charges of approximately $7.3 million, $6.4 million and $0.2 million in fiscal years 2011, 2010 and 2009, respectively, related to the accretion of beneficial conversion feature related to the preferred stock issued in June 2009. In December 2006, preferred stock which was issued in fiscal 2001 was exchanged for approximately 1.1 million shares of common stock, resulting in a charge of approximately $2.0 million related to the induced conversion of the preferred stock and $0.2 million in accretion charges. |
Item 7. Management's Discussion and Analysis of Financial Condition and Results of Operations
You should read the following discussion of our results of operations and financial condition in conjunction with our consolidated financial statements and related notes included elsewhere in this Annual Report on Form 10-K. This discussion contains forward-looking statements that are based upon current expectations and assumptions that are subject to risks and uncertainties. Actual results and the timing of certain events may differ materially from those projected in such forward-looking statements due to a number of factors, including those discussed in the section entitled "Forward-Looking Statements" on page 3.
OVERVIEW
We are a firm that provides integrated engineering, consulting, and construction management services. Our project teams assist our commercial and governmental clients implement environmental, energy and infrastructure projects from initial concept to delivery and operation. We provide our services almost entirely in the United States of America
We derive our revenue from fees for professional and technical services. As a service company, we are more labor-intensive than capital-intensive. Our revenue is driven by our ability to attract and retain qualified and productive employees, identify business opportunities, secure new and renew existing client contracts, provide outstanding service to our clients and execute projects successfully. Our income or loss from operations is derived from our ability to generate revenue and collect cash under our contracts in excess of our direct costs, subcontractor costs, other contract costs, and general and administrative (“G&A”) expenses.
In the course of providing our services we routinely subcontract services. Generally these subcontractor costs are passed through to our clients and, in accordance with accounting principles generally accepted in the United States of America (“U.S. GAAP”) and consistent with industry practice, are included in gross revenue. Because subcontractor services can change significantly from project to project, changes in gross revenue may not be indicative of business trends. Accordingly, we also report net service revenue ("NSR"), which is gross revenue less subcontractor costs and other direct reimbursable charges, and our discussion and analysis of financial condition and results of operations uses NSR as a primary point of reference.
21
The following table presents the approximate percentage of NSR by contract type:
Fiscal Year | ||||||||
2011 | 2010 | 2009 | ||||||
Time-and-materials | 60 | % | 58 | % | 54 | % | ||
Fixed-price | 36 | % | 41 | % | 44 | % | ||
Cost-plus | 4 | % | 1 | % | 2 | % | ||
100 | % | 100 | % | 100 | % | |||
Our cost of services (“COS”) includes professional compensation and related benefits together with certain direct and indirect overhead costs such as rents, utilities and travel. Professional compensation represents the majority of these costs. Our G&A expenses are comprised primarily of our corporate headquarters costs related to corporate executive management, finance, accounting, information technology, administration and legal. These costs are generally unrelated to specific client projects and can vary as expenses are incurred to support corporate activities and initiatives.
Our revenue, expenses and operating results may fluctuate significantly from year to year as a result of numerous factors, including:
• | Unanticipated changes in contract performance that may affect profitability, particularly with contracts that are fixed-price or have funding limits; |
• | Seasonality of the spending cycle, notably for state and local government entities, and the spending patterns of our commercial sector clients; |
• | Budget constraints experienced by our federal, state and local government clients; |
• | Divestitures or discontinuance of operating units; |
• | Employee hiring, utilization and turnover rates; |
• | The number and significance of client contracts commenced and completed during the period; |
• | Creditworthiness and solvency of clients; |
• | The ability of our clients to terminate contracts without penalties; |
• | Delays incurred in connection with contracts; |
• | The size, scope and payment terms of contracts; |
• | Contract negotiations on change orders and collection of related accounts receivable; |
• | The timing of expenses incurred for corporate initiatives; |
• | Competition; |
• | Litigation; |
• | Changes in accounting rules; |
• | The credit markets and their effect on our customers; and |
• | General economic or political conditions. |
We experience seasonal trends in our business. Our revenue is typically lower in the second and third fiscal quarters, as our business is, to some extent, dependent on field work and construction scheduling and is also affected by federal holidays. Our revenues are lower during these times of the year because many of our clients' employees, as well as our own employees, do not work during those holidays, resulting in fewer billable hours charged to projects and thus, lower revenues recognized. In addition to holidays, harsher weather conditions that occur in the fall and winter occasionally cause some of our offices to close temporarily and can significantly affect our project field work. Conversely, our business generally benefits from milder weather conditions in our first and fourth fiscal quarters which allow for more productivity from our field services.
Acquisitions and Divestitures
Acquisitions. We continuously evaluate the marketplace for strategic acquisition opportunities. A fundamental
component of our profitable growth strategy is to pursue acquisitions that will expand our platform in key U.S. markets.
In June 2011, we acquired the Environmental Business Unit ("RMT-EBU") of RMT, Inc., a subsidiary of Alliant Energy, headquartered in Madison, Wisconsin. RMT-EBU specializes in consulting, development, engineering and construction through remediation and restoration; environmental, health and safety management; air pollution control; and solid waste management. RMT-EBU consists of approximately 200 consultants and ten primary locations. The RMT-EBU is integrated into our business processes and systems as a part of our Environmental operating segment. The initial purchase price of approximately $13.9 million consisted of cash of $13.3 million paid at closing and $0.6 million for a working capital adjustment payable within several months. Goodwill of $4.2 million and other intangible assets of $3.8 million were recorded as a result of this acquisition. The impact of this acquisition was not material to our consolidated balance sheets and results of operation.
22
In February 2011, we acquired the stock of privately-held Alexander Utility Engineering, Inc. (“AUE”), through a combination of cash, stock and subordinated debt. Headquartered in San Antonio, Texas, AUE is a professional engineering and design firm that specializes in providing a range of services to the electric utility marketplaces. AUE is integrated into our business processes and systems as a part of our Energy operating segment. The initial purchase price of approximately $2.3 million consisted of cash of $0.7 million payable at closing, a $0.9 million subordinated note, 80 shares of our common stock valued at $0.3 million, and future earnout consideration with an estimated fair value of $0.4 million. Goodwill of $1.8 million and other intangible assets of $0.5 million were recorded as a result of this acquisition. The impact of this acquisition was not material to our consolidated balance sheets and results of operation.
During fiscal year 2010, we acquired the assets of Blue Wave Ventures, LLC ("Blue Wave"), a consulting firm headquartered in Boston, Massachusetts. Blue Wave advises brownfield developers and environmental and renewable energy companies in the areas of project management, financing and capital sourcing, regulatory approvals, community and government relations, and business development. This acquisition was made in support of our strategic growth plan to expand our services and capabilities within the Energy and Environmental operating segments. Blue Wave is part of our Environmental operating segment. The initial purchase price of $0.2 million consisted of cash of $0.1 million payable at closing and $0.1 million on the first anniversary thereof, which was recorded net of imputed interest of $9 thousand. There was no goodwill recorded as a result of this acquisition, however other intangible assets of $0.2 million were recorded.
Divestitures. From time to time, we may divest certain non-core businesses and reallocate our resources to businesses that better align with our long-term strategic direction. In June 2010 we sold our 50% ownership position in Environmental Restoration, LLC, an unconsolidated affiliate formed to develop a habitat mitigation bank. We received cash payments of $25 thousand and a $275 thousand five-year promissory note. Profit on the transaction was deferred as the buyer's initial financial commitment was insufficient to provide economic substance to the transaction. As a result, the profit will be recognized under the installment method, which recognizes profit as collections of principal are received.
Operating Segments
During fiscal year 2009 our accounting system was configured to provide revenue and earnings information that allowed us to initiate reporting to our chief operating decision maker ("CODM") under three operating segments. Management established these operating segments based upon the type of project, the client and market to which those projects are delivered, the different marketing strategies associated with the services provided and the specialized needs of the respective clients. Effective in the first quarter of fiscal year 2010, we made certain changes to our operating segments in our continuing efforts to align businesses around markets and customers. Operating segment information for all periods presented has been reclassified to reflect the new operating segment structure. The operating segments are as follows:
Energy: The Energy operating segment provides services to a range of clients including energy companies, utilities, other commercial entities, and state and federal governments. Our services include program management, engineer/procure/construct projects, design, and consulting. Our typical projects involve upgrades and new construction for electrical transmission and distribution systems, energy efficiency program design and management, and alternative energy development. This operating segment also provides services to support energy savings projects for state government entities and end users.
Environmental: The Environmental operating segment provides services to a wide range of clients including industrial, transportation, energy and natural resource companies, as well as federal, state and municipal agencies. The Environmental operating segment is organized to focus on key areas of demand including: environmental management of buildings, air quality measurements and modeling of potential air pollution impacts, assessment and remediation of contaminated sites and buildings, solid waste management, environmental compliance auditing and strategic due diligence, environmental licensing and permitting of a wide variety of projects, and natural and cultural resource assessment and management.
Infrastructure: The Infrastructure operating segment provides services related to the expansion of infrastructure capacity, the rehabilitation of overburdened and deteriorating infrastructure systems, and the management of risks related to security of public and private facilities. Our client base is predominantly state and municipal governments as well as select commercial developers. Primary services include: roadway, bridge and related surface transportation design; structural design of bridges; construction engineering inspection and construction management for roads and bridges; civil engineering for municipalities and public works departments; geotechnical engineering services; and security services including assessments, design and construction management on projects including ports, bridges, airports and correctional facilities. Major markets include the northeast United States, Texas, Louisiana and California.
Our CODM is our Chief Executive Officer (“CEO”). Our CEO manages the business by evaluating the financial results of the three operating segments, focusing primarily on segment revenue and segment profit. We utilize segment revenue and
23
segment profit because we believe they provide useful information for effectively allocating resources among operating segments; evaluating the health of our operating segments based on metrics that management can actively influence; and gauging our investments and our ability to service, incur or pay down debt. Specifically, our CEO evaluates segment revenue and segment profit and assesses the performance of each operating segment based on these measures, as well as, among other things, the prospects of each of the operating segments and how they fit into our overall strategy. Our CEO then decides how resources should be allocated among our operating segments. We do not track our assets by operating segment, and consequently, it is not practical to show assets by operating segment. Segment profit includes all operating expenses except the following: costs associated with providing corporate shared services (including certain depreciation and amortization), goodwill and intangible asset write-offs, stock-based compensation expense and amortization of intangible assets. Depreciation expense is primarily allocated to operating segments based upon their respective use of total operating segment office space. Inter-segment balances and transactions are not material. The accounting policies of the operating segments are the same as those for us as a whole, except as discussed herein.
The following table presents the approximate percentage of our NSR by operating segment:
Fiscal Year | ||||||||
2011 | 2010 | 2009 | ||||||
Energy | 30 | % | 26 | % | 27 | % | ||
Environmental | 53 | % | 53 | % | 52 | % | ||
Infrastructure | 17 | % | 21 | % | 21 | % | ||
100 | % | 100 | % | 100 | % | |||
Business Trend Analysis
Energy: The utilities in the United States are in the midst of a multi-year upgrade of the electric transmission grid to improve capacity, reliability and dispatch of renewable sources of generation. Years of underinvestment coupled with an increasingly favorable regulatory environment have provided a good business opportunity for those serving this market. Electric utilities throughout the United States will be investing over $50 billion in the performance of this work over the next several years. The current downturn within the US economy has slowed the pace of this investment, yet it does not appear to have affected the long term plan of investment. Energy efficiency services continue to benefit from increasing state and federal funds targeted at energy efficiency. The American Recovery and Reinvestment Act of 2009 (“ARRA”), Regional Green House Gas Initiative and system benefit charges at the state or utility level are expanding the marketplace for energy efficiency program management services. Investment within the renewable portfolios also remains strong. We are well established in the Northeast and Mid-Atlantic regions and are focused on growing our presence in the Texas and California markets where demand for services is the highest.
Environmental: Market demand for environmental services has begun to grow again following a stagnation caused by general economic conditions. While the past economic decline had served to temporarily halt the long-term pattern of growth historically enjoyed by this operating segment, the fundamental compliance drivers for environmental services remain in place. Recent indicators suggest that several aspects of the environmental market have begun to recover. A rapidly evolving regulatory site cleanup and compliance arena, the continuing need to support transactions, and the need to enhance our aging transportation and energy infrastructure all remain as critical drivers for environmental services. It now appears that historical long-term growth rates in the environmental market may return over the next several years.
Infrastructure: Demand for infrastructure services is expected to continue to be flat for fiscal year 2012 due to general economic conditions, heavy budget cuts and deficit issues, the lack of a new federal transportation bill, and revenue shortfalls at state and municipal levels. Nevertheless, recent estimates indicate that approximately $2.0 trillion need to be invested over the next five years in national infrastructure alone to restore the system to a state of good repair. In January 2010, the current administration committed $8 billion in federal stimulus to high speed rail, but the program has developed slowly in light of the current political climate. The long-term prospect may also be benefited by pending legislation for a new transportation bill and alternative funding mechanisms (e.g., a proposed National Infrastructure Bank), Public Private Partnerships, potential additional economic stimulus initiatives and the continued need to upgrade, replace or repair aging transportation infrastructure. In addition to our base business, we are focusing on the steel inspection market, expansion of our construction management business and seismic design work in the Northeast, and expanding our geotechnical program for services related to coal and shale gas exploration.
24
Critical Accounting Policies
Our financial statements have been prepared in accordance with U.S. GAAP. These principles require the use of estimates and assumptions that affect amounts reported and disclosed in the financial statements and related notes. Actual results could differ from these estimates and assumptions. We use our best judgment in the assumptions used to compile these estimates, which are based on current facts and circumstances, prior experience and other assumptions that are believed to be reasonable. Our accounting policies are described in Note 2 to the consolidated financial statements contained in Item 8 of this report. We believe the following critical accounting policies reflect the more significant judgments and estimates used in preparation of our consolidated financial statements and are the policies which are most critical in the portrayal of our financial position and results of operations:
Revenue Recognition: We recognize contract revenue in accordance with Accounting Standards Codification ("ASC") Topic 605, Revenue Recognition. Specifically, we follow the guidance in ASC Subtopic 605-35, Revenue Recognition—Construction-Type and Production-Type Contracts.
Fixed-Price Contracts
We recognize revenue on fixed-price contracts using the percentage-of-completion method. Under this method of revenue recognition, we estimate the progress towards completion to determine the amount of revenue and profit to recognize on all significant contracts. We generally utilize an efforts-expended, cost-to-cost approach in applying the percentage-of-completion method under which revenue is earned in proportion to total costs incurred divided by total costs expected to be incurred.
Under the percentage-of-completion method, recognition of profit is dependent upon the accuracy of a variety of estimates including engineering progress, materials quantities, achievement of milestones and other incentives, liquidated-damages provisions, labor productivity and cost estimates. Such estimates are based on various judgments we make with respect to those factors and can be difficult to accurately determine until the project is significantly underway. Due to uncertainties inherent in the estimation process, actual completion costs often vary from estimates. If estimated total costs on any contract indicate a loss, we charge the entire estimated loss to operations in the period the loss first becomes known. If actual costs exceed the original fixed contract price, recognition of any additional revenue will be pursuant to a change order, contract modification, or claim.
We have fixed-price Exit Strategy contracts to remediate environmental conditions at contaminated sites. Under most Exit Strategy contracts, the majority of the contract price is deposited by the client into a restricted account with an insurer. The funds in the restricted account are held by the insurer and used to pay us as work is performed. The arrangement with the insurer provides for the deposited funds to earn interest at the one-year constant maturity United States Treasury Bill rate. The interest is recorded when earned and reported as interest income from contractual arrangements on the consolidated statements of operations.
The Exit Strategy funds held by the insurer, including any interest growth thereon, are recorded as an asset (current and long-term restricted investment) on our consolidated balance sheets, with a corresponding liability (current and long-term deferred revenue) related to the funds. Consistent with our other fixed-price contracts, we recognize revenue on Exit Strategy contracts using the percentage-of-completion method. When determining the extent of progress towards completion on Exit Strategy contracts, prepaid insurance premiums and fees are amortized, on a straight-line basis, to cost incurred over the life of the related insurance policy. Certain Exit Strategy contracts are classified as pertaining to either remediation or operation, maintenance and monitoring. In addition, certain Exit Strategy contracts are segmented such that the remediation and operation portion of the contract is separately accounted for from the maintenance and monitoring portion.
Under most Exit Strategy contracts, additional payments are made by the client to the insurer, typically through an insurance broker, for insurance premiums and fees for a policy to cover potential costs in excess of the original estimates and other factors such as third party liability. For Exit Strategy contracts where we establish that (1) costs exceed the contract value and interest growth thereon and (2) such costs are covered by insurance, we record an estimated insurance recovery up to the amount of insured costs. An insurance gain, that is, an amount to be recovered in excess of our recorded costs, is not recognized until the receipt of insurance proceeds. Insurance recoveries are reported as insurance recoverables and other income on our consolidated statements of operations. If estimated total costs on any contract indicate a loss, we charge the entire estimated loss to operations in the period the loss first becomes known.
Unit price contracts are a subset of fixed-price contracts. Under unit price contracts, our clients pay a set fee for each unit of service or production. We recognize revenue under unit price contracts as we complete the related service transaction for our clients. If our costs per service transaction exceed original estimates, our profit margins will decrease, and we may realize a loss on the project unless we can receive payment for the additional costs.
25
Time-and-Materials Contracts
Under time-and-materials contracts we negotiate hourly billing rates and charge our clients based on the actual time that we expend on a project. In addition, clients reimburse us for actual out-of-pocket costs of materials and other direct reimbursable expenses that we incur in connection with our performance under the contract. Our profit margins on time-and-materials contracts fluctuate based on actual labor and overhead costs that we directly charge or allocate to contracts compared to negotiated billing rates. Revenue on time-and-materials contracts is recognized based on the actual number of hours we spend on the projects plus any actual out-of-pocket costs of materials and other direct reimbursable expenses that we incur on the projects.
Cost-Plus Contracts
Cost-Plus Fixed Fee Contracts. Under our cost-plus fixed fee contracts we charge clients for our costs, including both direct and indirect costs, plus a fixed negotiated fee. In negotiating a cost-plus fixed fee contract we estimate all recoverable direct and indirect costs and then add a fixed profit component. The total estimated cost plus the negotiated fee represents the total contract value. We recognize revenue based on the actual labor and non-labor costs we incur plus the portion of the fixed fee we have earned to date. We invoice for our services as revenue is recognized or in accordance with agreed upon billing schedules.
Cost-Plus Fixed Rate Contracts. Under our cost-plus fixed rate contracts we charge clients for our costs plus negotiated rates based on our indirect costs. In negotiating a cost-plus fixed rate contract we estimate all recoverable direct and indirect costs and then add a profit component, which is a percentage of total recoverable costs, to arrive at a total dollar estimate for the project. We recognize revenue based on the actual total costs we have expended plus the applicable fixed rate. If the actual total costs are lower than the total costs we have estimated, our revenue from that project will be lower than originally estimated.
Change Orders/Claims
Change orders are modifications of an original contract that change the provisions of the contract. Change orders typically result from changes in scope, specifications or design, manner of performance, facilities, equipment, materials, sites, or period of completion of the work. Claims are amounts in excess of the agreed contract price that we seek to collect from our clients or others for client-caused delays, errors in specifications and designs, contract terminations, change orders that are either in dispute or are unapproved as to both scope and price, or other causes.
Costs related to change orders and claims are recognized when they are incurred. Change orders are included in total estimated contract revenue when it is probable that the change order will result in a bona fide addition to contract value and can be reliably estimated. Claims are included in total estimated contract revenues only to the extent that contract costs related to the claims have been incurred and when it is probable that the claim will result in a bona fide addition to contract value which can be reliably estimated. No profit is recognized on claims until final settlement occurs. For the fiscal years ending June 30, 2011, 2010 and 2009, we did not recognize any revenue related to claims.
Other Contract Matters
Federal Acquisition Regulations ("FAR"), which are applicable to our federal government contracts and may be incorporated in many local and state agency contracts, limit the recovery of certain specified indirect costs on contracts. Cost-plus contracts covered by FAR or with certain state and local agencies also require an audit of actual costs and provide for upward or downward adjustments if actual recoverable costs differ from billed recoverable costs. Most of our federal government contracts are subject to termination at the discretion of the client. Contracts typically provide for reimbursement of costs incurred and payment of fees earned through the date of such termination.
Contracts with the federal government are subject to audit, primarily by the Defense Contract Audit Agency ("DCAA"), which reviews our overhead rates, operating systems and cost proposals. During the course of its audits, the DCAA may disallow costs if it determines that we have accounted for such costs in a manner inconsistent with Cost Accounting Standards or FAR. Our last audit was for fiscal 2004 and resulted in a $14 adjustment. Incurred cost proposals have been submitted to DCAA for fiscal 2005 through 2010, and are pending DCAA audit. Historically we have not had any material cost disallowances by the DCAA as a result of audit, however there can be no assurance that DCAA audits will not result in material cost disallowances in the future.
Allowance for Doubtful Accounts—An allowance for doubtful accounts is maintained for estimated losses resulting from the failure of our clients to make required payments. The allowance for doubtful accounts has been determined through reviews of specific amounts deemed to be uncollectible and estimated write-offs as a result of clients who have filed for bankruptcy protection plus an allowance for other amounts for which some loss is determined to be probable based on current
26
circumstances. If the financial condition of clients or our assessment as to collectability were to change, adjustments to the allowances may be required.
Income Taxes—We are required to estimate the provision for income taxes, including the current tax expense together with assessing temporary differences resulting from differing treatments of assets and liabilities for tax and financial accounting purposes. These differences between the financial statement and tax bases of assets and liabilities, together with net operating loss ("NOL") carryforwards and tax credits are recorded as deferred tax assets or liabilities on the consolidated balance sheets. An assessment is required to be made of the likelihood that the deferred tax assets will be recovered from future taxable income. To the extent that we determine that it is more likely than not that the deferred asset will not be utilized, a valuation allowance is established. Taxable income in future periods significantly above or below that projected will cause adjustments to the valuation allowance that could materially decrease or increase future income tax expense.
We recognize the tax benefit from an uncertain tax position only if it is more likely than not that the tax position will be sustained on examination by the taxing authorities, based on the technical merits of the position. The tax benefits recognized in the financial statements from such a position are measured based on the largest benefit that has a greater than 50% likelihood of being realized upon ultimate settlement. Accounting literature also provides guidance on derecognition of income tax assets and liabilities, classification of current and deferred income tax assets and liabilities, accounting for interest and penalties associated with tax positions, and income tax disclosures. Judgment is required in assessing the future tax consequences of events that have been recognized in our financial statements or tax returns. Variations in the actual outcome of these future tax consequences could materially impact our financial statements.
Goodwill and Other Intangible Assets—In accordance with ASC Topic 350, Intangibles—Goodwill and Other, goodwill and intangible assets deemed to have indefinite lives are not amortized but are subject to impairment testing at least annually, or more frequently if events or changes in circumstances indicate that goodwill might be impaired. We perform impairment reviews for our reporting units utilizing valuation methods, including the discounted cash flow method, the guideline company approach, and the guideline transaction approach, as the best evidence of fair value. The valuation methodology used to estimate the fair value of the total Company and our reporting units requires inputs and assumptions (i.e. revenue growth, operating profit margins and discount rates) that reflect current market conditions. The estimated fair value of each reporting unit is compared to the carrying amount of the reporting unit, including goodwill. If the carrying value of the reporting unit exceeds its fair value, the goodwill of the reporting unit is potentially impaired, and we then determine the implied fair value of goodwill, which is compared to the carrying value of goodwill to determine if impairment exists.
Since the adoption of ASC Topic 350, our annual impairment review of goodwill had been completed at the end of the second quarter of each fiscal year. On December 24, 2010 we changed our accounting policy whereby the annual impairment review of goodwill will be performed as of each fiscal April month-end instead of the end of the second quarter of each fiscal year. This date coincides with the interim impairment analysis of goodwill for all reporting units with goodwill that was completed as of April 26, 2010. The change in the annual goodwill impairment testing date coincides with our annual preparation of long range projections (budgets and forecasts), which are a significant component utilized in the goodwill impairment analysis. Accordingly, we believe the change in the annual impairment testing date is preferable in the circumstances. The change in our annual goodwill impairment testing date is not intended to, nor does it delay, accelerate or avoid an impairment charge. As it was impracticable to objectively determine long range projection and valuation estimates as of each fiscal April month-end for fiscal years ending on or prior to June 30, 2009, we have retrospectively applied the change in annual impairment testing date to the start of the fiscal year beginning July 1, 2009.
Other intangible assets are included in other assets and consist primarily of purchased customer relationships and other intangible assets acquired in acquisitions. The costs of intangible assets with determinable useful lives are amortized on a straight-line basis over the estimated periods benefited. We review the economic lives of our intangible assets annually.
Management judgment and assumptions are required in performing the impairment tests for all reporting units with goodwill and in measuring the fair value of goodwill, indefinite-lived intangibles and long-lived assets. While we believe our judgments and assumptions are reasonable, different assumptions could change the estimated fair values or the amount of the recognized impairment losses.
Insurance Matters, Litigation and Contingencies—In the normal course of business, we are subject to certain contractual guarantees and litigation. Generally, such guarantees relate to project schedules and performance. Most of the litigation involves us as a defendant in contractual disputes, professional liability, personal injury and other similar lawsuits. We maintain insurance coverage for various aspects of our business and operations, however, we have elected to retain a portion of losses that may occur through the use of substantial deductibles, limits and retentions under our insurance programs. This practice may subject us to some future liability for which we are only partially insured or are completely uninsured. In accordance with ASC Topic 450, Contingencies, we record in our consolidated balance sheets amounts representing our estimated losses from claims and settlements when such losses are deemed probable and estimable. Otherwise, these losses are expensed as incurred.
27
Costs of defense are generally expensed as incurred. We undertake an overall assessment of risk and if the estimate of a probable loss is a range, and no amount within the range is a more reasonable estimate, we accrue the lower limit of the range. As additional information about current or future litigation or other contingencies becomes available, management will assess whether such information warrants the recording of additional expenses relating to those contingencies. Such additional expenses could potentially have a material impact on our results of operations and financial position.
Results of Operations
We incurred significant losses during fiscal years 2011, 2010, and 2009.
Fiscal Year 2011
The net loss applicable to our common shareholders for fiscal year 2011 of $16.6 million was adversely impacted by the following:
• | a $17.3 million charge incurred relating to the Arena Towers litigation reserve; and |
• | $7.3 million of accretion charges on preferred stock. |
Arena Towers Litigation Reserve: A case titled The Arena Group v. TRC Environmental Corporation and TRC Companies, Inc., was filed in September 2007 and involved a former landlord seeking damages for alleged breach of a lease for certain office space in Houston, Texas that a subsidiary had vacated. The jury in that case returned an adverse verdict against us and our subsidiary TRC Environmental Corporation that was significantly in excess of our previously established litigation reserve. As a result, the accompanying consolidated statement of operations for the fiscal year ended June 30, 2011 includes a charge of $17.3 million which includes the full value of the verdict as well as pre-judgment interest and certain potential costs associated with appeal. No judgment has been rendered on the verdict and post-trial motions are pending. We believe the verdict is incorrect for a number of reasons, and we have filed a post-trial motion to disregard a substantial portion of the verdict, and we will also pursue appellate measures in an effort to reduce or vacate the verdict. We believe there are meritorious bases for such post-trial motion and appeal, however this matter will have a material adverse effect on our cash flows. Any payment of damages will be at the end of the appeals process, which could take up to several years. Once a judgment is entered, interest would accrue on the amount ultimately determined to be payable until paid.
Accretion Charges on Preferred Stock: On June 1, 2009, we sold 7,209 shares of a new Series A Convertible Preferred Stock, $0.10 par value (the "Preferred Stock"), for $2,150 per share (the "2009 Private Placement") pursuant to a stock purchase agreement by and among us and three of our existing shareholders and related entities. The 2009 Private Placement resulted in proceeds of $15.3 million, net of issuance costs of $0.2 million of which $0.1 million were paid as of June 30, 2009. In accordance with ASC Subtopic 470-20, Debt with Conversion and Other Options, and ASC 470-20-55-20, it was determined that the conversion price was at a discount to fair value. The value of this discount (the beneficial conversion feature) was $13.7 million. The beneficial conversion feature, a non-cash item, was deducted from the carrying value of the Preferred Stock and was accreted over 18 months, the period at the end of which the Preferred Stock converted to common stock on December 1, 2010. The accretion was treated as a preferred stock dividend. During fiscal years 2011, 2010, and 2009 we recorded accretion charges on preferred stock of $7.3 million, $6.4 million and $0.2 million, respectively. The preferred stock converted to common stock on December 1, 2010, and, as of that date, no further preferred stock accretion charges will be recorded.
Despite the adverse impact of the Arena Towers litigation, our fiscal year 2011 operating results improved compared to the prior year. In fact, results of our operations for fiscal year 2011 reflect an increase in revenues and a reduction of the net loss applicable to our common shareholders. The 6.9% year-over-year growth in NSR was achieved despite the continued challenging economic and industry trends due to the absence of clear macro growth drivers in the domestic economy. Many clients continue to carefully manage their capital spending below 2007 levels, as they press for certainty with regard to federal energy, infrastructure, and environmental policy. Although the near-term outlook for both the economy and many of our key markets remains uncertain, we are encouraged by the long-term opportunities available to TRC.
Fiscal Year 2010
The net loss applicable to our common shareholders for fiscal year 2010 of $22.9 million included:
• | a $20.2 million impairment charge for goodwill and a $1.6 million charge due to the acceleration of amortization expense relating to certain customer relationship intangible assets; |
• | $6.4 million of accretion charges on preferred stock; |
• | a $4.2 million tax benefit; and |
28
• | a $1.7 million gain on extinguishment of debt. |
Goodwill and Intangible Assets: During fiscal year 2010, we recorded a charge of $20.2 million for the impairment of goodwill related to reporting units within our Environmental and Energy operating segments. The key factor contributing to the goodwill impairment was a decline in actual and forecasted financial performance as a result of weak economic conditions as our clients took a cautious approach to starting large-scale capital improvement projects. During fiscal year 2010, we incurred $1.6 million of accelerated amortization expense relating to certain customer relationship intangible assets.
Accretion Charges on Preferred Stock: On June 1, 2009, we sold 7,209 shares of a new Series A Convertible Preferred Stock, $0.10 par value (the "Preferred Stock"), for $2,150 per share (the "2009 Private Placement") pursuant to a stock purchase agreement by and among us and three of our existing shareholders and related entities. The 2009 Private Placement resulted in proceeds of $15.3 million, net of issuance costs of $0.2 million of which $0.1 million were paid as of June 30, 2009. In accordance with ASC Subtopic 470-20, Debt with Conversion and Other Options, and ASC 470-20-55-20, it was determined that the conversion price was at a discount to fair value. The value of this discount (the beneficial conversion feature) was $13.7 million. The beneficial conversion feature, a non-cash item, was deducted from the carrying value of the Preferred Stock and was accreted over 18 months, the period at the end of which the Preferred Stock converted to common stock. The accretion was treated as a preferred stock dividend. During the fiscal years 2010 and 2009, we recorded accretion charges on preferred stock of $6.4 million and $0.2 million, respectively.
Federal and State Income Tax Benefit: The federal and state income tax benefit was $4.2 million for fiscal year 2010 from a tax provision of $3.9 million for the same period in the prior year primarily related to uncertain tax positions. We recognized a net tax benefit of $4.2 million in fiscal year 2010 primarily due to: (i) the Worker, Homeownership, and Business Assistance Act of 2009 which amended I.R.C. §172(b)(1)(H), allowing taxpayers to elect to carry back an applicable NOL for a period of 3, 4, or 5 years, to offset taxable income in those preceding years and enabling us to carry back our fiscal year 2008 NOL for a tax benefit of $2.8 million, which amount was collected in fiscal year 2010, and (ii) the re-assessment of our uncertain tax positions based on communications with the IRS relating to its examination including the impact of the NOL law change which resulted in an income tax benefit of $1.9 million.
Gain on Extinguishment: In fiscal year 2001 we made an investment in a privately held energy services contracting company ("Co-Energy LLC") that specialized in the installation of ground source heat pump systems. Over its history, Co-Energy LLC incurred significant losses. During December 2009, in connection with the dissolution of Co-Energy LLC, a consolidated entity, we were legally released from an aggregate of $1.7 million of loans extended to Co-Energy LLC by a party unrelated to us. The loans were extinguished because Co-Energy LLC had no assets at the time of dissolution. The lender did not have an equity interest in us and received no claims, rights or enhancement as a result of the extinguishment. Consequently, we recognized a $1.7 million gain on extinguishment of debt during fiscal year 2010.
Fiscal Year 2009
The net loss applicable to our common shareholders of $24.1 million for fiscal year 2009 included:
• | a $21.4 million impairment charge for goodwill and intangible assets; and |
• | a $3.9 million provision for income taxes primarily related to uncertain tax positions. |
Goodwill and Intangible Assets: During fiscal year 2009, we performed a goodwill assessment and concluded that an impairment of goodwill existed and recorded a non-cash goodwill impairment charge of $19.3 million and an intangible asset impairment charge of $2.1 million.
Federal and State Income Tax Provision: During fiscal year 2009, we recorded a provision for income taxes of $3.9 million primarily related to uncertain tax positions. We are currently under an IRS examination for the fiscal years 2003 through 2008. During fiscal year 2009, the IRS formally assessed us certain adjustments related to Exit Strategy projects. We do not agree with these adjustments and protested the assessments. If the IRS prevails in its position, our federal income tax due for the fiscal years 2003 through 2008 would be $9.9 million (including interest). Although the final resolution of the adjustment is uncertain, management increased the gross unrecognized tax benefits under the measurement principles of ASC Topic 740, Income Taxes, during fiscal year 2009.
29
Fiscal Year 2011 Compared to Fiscal Year 2010
Consolidated Results of Operations
The following table presents the dollar and percentage changes in certain items in the consolidated statements of operations for fiscal years 2011 and 2010:
Years Ended June 30, | Change | |||||||||||||
(Dollars in thousands) | 2011 | 2010 | $ | % | ||||||||||
Gross revenue | $ | 333,209 | $ | 330,575 | $ | 2,634 | 0.8 | % | ||||||
Less subcontractor costs and other direct reimbursable charges | 87,298 | 100,476 | (13,178 | ) | (13.1 | ) | ||||||||
Net service revenue | 245,911 | 230,099 | 15,812 | 6.9 | ||||||||||
Interest income from contractual arrangements | 411 | 596 | (185 | ) | (31.0 | ) | ||||||||
Insurance recoverables and other income | (1,573 | ) | 8,844 | (10,417 | ) | (117.8 | ) | |||||||
Cost of services (exclusive of costs shown separately below) | 202,265 | 203,221 | (956 | ) | (0.5 | ) | ||||||||
General and administrative expenses | 26,286 | 26,028 | 258 | 1.0 | ||||||||||
Provision for doubtful accounts | 1,763 | 2,344 | (581 | ) | (24.8 | ) | ||||||||
Depreciation and amortization | 4,729 | 8,049 | (3,320 | ) | (41.2 | ) | ||||||||
Goodwill and intangible asset impairments | — | 20,249 | (20,249 | ) | (100.0 | ) | ||||||||
Arena Towers litigation reserve | 17,278 | 1,100 | 16,178 | NM | ||||||||||
Operating loss | (7,572 | ) | (21,452 | ) | 13,880 | (64.7 | ) | |||||||
Interest expense | (761 | ) | (1,003 | ) | 242 | (24.1 | ) | |||||||
Gain on extinguishment of debt | — | 1,716 | (1,716 | ) | (100.0 | ) | ||||||||
Loss from operations before taxes and equity in earnings (losses) | (8,333 | ) | (20,739 | ) | 12,406 | (59.8 | ) | |||||||
Federal and state income tax (provision) benefit | (1,127 | ) | 4,210 | (5,337 | ) | (126.8 | ) | |||||||
Loss from operations before equity in earnings (losses) | (9,460 | ) | (16,529 | ) | 7,069 | (42.8 | ) | |||||||
Equity in earnings (losses) from unconsolidated affiliates, net of taxes | 30 | (45 | ) | 75 | (166.7 | ) | ||||||||
Net loss | (9,430 | ) | (16,574 | ) | 7,144 | (43.1 | ) | |||||||
Net loss applicable to noncontrolling interest | 58 | 125 | (67 | ) | (53.6 | ) | ||||||||
Net loss applicable to TRC Companies, Inc. | (9,372 | ) | (16,449 | ) | 7,077 | (43.0 | ) | |||||||
Accretion charges on preferred stock | (7,261 | ) | (6,431 | ) | (830 | ) | 12.9 | |||||||
Net loss applicable to TRC Companies, Inc.'s common shareholders | $ | (16,633 | ) | $ | (22,880 | ) | $ | 6,247 | (27.3 | )% | ||||
Gross revenue increased $2.6 million, or 0.8%, to $333.2 million for fiscal year 2011 from $330.6 million for fiscal year 2010. Current year gross revenue in our Energy operating segment increased $10.3 million primarily due to increased activity on electric transmission and distribution projects as a number of our clients have begun to resume investments that were deferred over the past few years. This increase was offset, in large part, by decreased gross revenue in our Environmental and Infrastructure operating segments. The $7.9 million decrease in our Environmental operating segment was primarily due to a decline in work performed by our subcontractors. Throughout fiscal year 2010, our projects experienced higher levels of subcontracting and procurement activity and, therefore, generated higher gross revenues and subcontractor costs and other direct reimbursable charges ("ODCs"). Current year gross revenue in our Infrastructure operating segment decreased $3.4 million primarily due to the wind-down of a large transportation design project, certain actions taken in the prior fiscal year to eliminate lower margin work and lower overall demand primarily due to revenue shortfalls at state and municipal levels.
NSR increased $15.8 million, or 6.9%, to $245.9 million for fiscal year 2011 from $230.1 million for fiscal year 2010. NSR in our Energy operating segment increased $12.1 million for fiscal year 2011 primarily due to the above-mentioned increased activity on electric transmission and distribution projects. Current year NSR in our Environmental operating segment also increased $9.0 million primarily due to improved project performance on certain Exit Strategy contracts and a moderate increase in demand for our environmental services as the market for environmental services has begun to recover following a decline caused by general economic conditions. These increases were offset, in part, by a $4.4 million decrease in our Infrastructure operating segment which was result of the wind-down of a significant transportation design project and lower
30
overall demand from state and municipal clients which have experienced significant revenue shortfalls.
Interest income from contractual arrangements decreased $0.2 million, or 31.0%, to $0.4 million for fiscal year 2011 from $0.6 million for fiscal year 2010 primarily due to lower one year constant maturity T−Bill rates and a lower average balance of restricted investments in fiscal year 2011 compared to fiscal year 2010.
Insurance recoverables and other income decreased $10.4 million, or 117.8%, to $(1.6) million for fiscal year 2011 from $8.8 million for fiscal year 2010. During fiscal year 2010, three Exit Strategy projects had estimated cost increases which were not expected to be funded by the project-specific restricted investments and, therefore, were projected to be funded by the project-specific insurance policies procured at project inception to cover, among other things, costs in excess of the original estimates. Conversely, during fiscal year 2011, we reduced our cost estimate on one project as we currently expect to complete our contractual obligation sooner than previously anticipated, resulting in less projected recoveries from the project-specific insurance policy.
COS decreased $1.0 million, or 0.5%, to $202.3 million for fiscal year 2011 from $203.2 million for fiscal year 2010. The decrease was principally due to a $6.9 million decrease in Exit Strategy contract loss reserves offset by costs as described below. As discussed above, increases to our Exit Strategy cost estimates did not occur at the same level in fiscal year 2011 as in the prior fiscal year. Additionally, we reduced the loss reserve on one Exit Strategy project in fiscal year 2011 as we currently expect to complete our contractual obligation sooner than previously anticipated. The decrease in COS related to decreases to our Exit Strategy loss reserves was offset, in part, by additional costs incurred to support growth in NSR in our Environmental and Energy operating segments. Specifically, labor and bonus costs increased $4.0 million and travel, outside consultants and project chargeable equipment increased $1.5 million. In addition, during the current year we incurred a $0.4 million charge for the early termination of an office lease. As a percentage of NSR, COS was 82.3% and 88.3% for fiscal years 2011 and 2010, respectively.
G&A expenses increased $0.3 million, or 1.0%, to $26.3 million for fiscal year 2011 from $26.0 million for fiscal year 2010. The increase was primarily attributable to increased legal fees related to the Arena Towers case. As a percentage of NSR, G&A expenses were 10.7% and 11.3% for fiscal years 2011 and 2010, respectively.
The provision for doubtful accounts decreased $0.6 million, or 24.8%, to $1.8 million for fiscal year 2011 from $2.3 million for fiscal year 2010. The decrease was primarily due to the collection of certain amounts previously determined to be uncollectible.
Depreciation and amortization decreased $3.3 million, or 41.2%, to $4.7 million for fiscal year 2011 from $8.0 million for fiscal year 2010. The decrease in depreciation expense was principally related to technology equipment becoming fully depreciated since the same period in the prior year. Also, amortization expense decreased during fiscal year 2011 due to accelerated amortization expense on certain intangible assets in the fourth quarter of fiscal year 2010.
We assessed the recoverability of goodwill as of April 29, 2011. The fair value of each of our reporting units with goodwill exceeded its carrying value, and therefore no further analysis was required. We do not believe there were any events or changes in circumstances since its April 2011 annual assessment that would indicate the fair value of goodwill was more likely than not reduced to below its carrying value. We assessed the recoverability of goodwill during the first, second and fourth quarters of fiscal year 2010. In performing the goodwill assessments, we utilized valuation methods, including the discounted cash flow method, the guideline company approach, and the guideline transaction approach as the best evidence of fair value. The aggregate fair value of our reporting units declined from the December 25, 2009 valuation to the April 26, 2010 valuation primarily due to a decline in the estimated future cash flows of the reporting units and declines in market multiples of comparable companies. These declines were primarily driven by the U.S recession and its negative impact on several of our key markets, resulting in delays, curtailments and cancellations of proposed and existing projects, which decreased the overall demand for our services. The fair value of three of our reporting units with goodwill did not exceed its carrying value in the fourth quarter of fiscal year 2010, resulting in a goodwill impairment charge of $20.2 million.
Management judgment and assumptions are required in performing the impairment tests for all reporting units with goodwill and in measuring the fair value of goodwill, indefinite-lived intangibles and long-lived assets. While we believe our judgments and assumptions are reasonable, different assumptions could change the estimated fair values or the amount of the recognized impairment losses.
Arena Towers litigation reserve expenses increased $16.2 million to $17.3 million for fiscal year 2011 from $1.1 million for fiscal year 2010. During fiscal year 2011, the jury in that case returned an adverse verdict against us and our subsidiary TRC Environmental Corporation that was significantly in excess of our litigation reserve. As a result, the accompanying consolidated statement of operations for the fiscal year ended June 30, 2011 includes a charge of $17.3 million which includes the full value of the verdict as well as pre-judgment interest and certain potential costs associated with appeal. No judgment has been rendered on the verdict and post-trial motions are pending. We believe the verdict is incorrect for a number of reasons, and
31
we have filed a post-trial motion to disregard a substantial portion of the verdict, and we will also pursue appellate measures in an effort to reduce or vacate the verdict. We believe there are meritorious bases for such post-trial motion and appeal, however this matter will have a material adverse effect on our cash flows. Any payment of damages will be at the end of the appeals process, which could take up to several years. Once a judgment is entered, interest would accrue on the amount ultimately determined to be payable until paid.
Interest expense decreased $0.2 million, or 24.1%, to $0.8 million for fiscal year 2011 from $1.0 million for fiscal year 2010. The decrease was primarily due to lower interest expense incurred on the CAH loan due to the modification agreement entered into in June 2010 that reduced the interest rate from 10.0% to 6.5% in return for principal payments made on the loan.
The federal and state income tax provision was $1.1 million for fiscal year 2011 compared to a tax benefit of $4.2 million for the same period in the prior fiscal year primarily related to uncertain tax positions. We incurred a tax provision of $1.1 million during fiscal year 2011 due to penalties and interest as well as expense from state income tax liabilities incurred which we were unable to offset with NOL carryforwards. We recognized a net tax benefit of $4.2 million in fiscal year 2010 primarily due to: (i) the Worker, Homeownership, and Business Assistance Act of 2009 which amended I.R.C. §172(b)(1)(H), allowing taxpayers to elect to carry back an applicable NOL for a period of 3, 4, or 5 years to offset taxable income in those preceding years and enabling us to carry back our fiscal year 2008 NOL for a tax benefit of $2.8 million, which amount was collected in fiscal year 2010, and (ii) the re-assessment of our uncertain tax positions based on communications with the IRS relating to its examination including the impact of the NOL law change which resulted in an income tax benefit of $1.9 million.
Operating Segment Results of Operations
Energy Operating Segment Results
Fiscal Year | ||||||||||||||
2011 | 2010 | Change | ||||||||||||
Gross revenue | $ | 87,372 | $ | 77,035 | $ | 10,337 | 13.4 | % | ||||||
Net service revenue | $ | 71,625 | $ | 59,554 | $ | 12,071 | 20.3 | % | ||||||
Segment profit | $ | 15,744 | $ | 8,572 | $ | 7,172 | 83.7 | % | ||||||
Gross revenue increased $10.3 million, or 13.4%, to $87.4 million for fiscal year 2011 from $77.0 million for fiscal year 2010. The increase in gross revenue in fiscal year 2011 was due to the return of some of our clients to more typical electric transmission and distribution spending levels following a period of budgetary constraints.
NSR increased $12.1 million, or 20.3%, to $71.6 million for fiscal year 2011 from $59.6 million for fiscal year 2010. The increase in NSR was primarily due to increased activity on electric transmission and distribution projects as our clients began to resume investments in capital projects that were previously on hold.
The Energy operating segment's profit increased $7.2 million, or 83.7%, to $15.7 million for fiscal year 2011 from $8.6 million for fiscal year 2010. The increase in the Energy operating segment's profit during fiscal year 2011 was primarily related to the increase in NSR. As a percentage of NSR, the Energy operating segment's profit increased to 22.0% in fiscal year 2011 from 14.4% in the prior year.
Environmental Operating Segment Results
Fiscal Year | ||||||||||||||
2011 | 2010 | Change | ||||||||||||
Gross revenue | $ | 187,412 | $ | 195,332 | $ | (7,920 | ) | (4.1 | )% | |||||
Net service revenue | $ | 129,396 | $ | 120,431 | $ | 8,965 | 7.4 | % | ||||||
Segment profit | $ | 24,764 | $ | 25,170 | $ | (406 | ) | (1.6 | )% | |||||
Gross revenue decreased $7.9 million, or 4.1%, to $187.4 million for fiscal year 2011 from $195.3 million for fiscal year 2010. The decline was primarily due to the wind-down of subcontractor activity on two large environmental projects, which resulted in both decreased gross revenue and subcontractor costs. This decrease was offset by increased demand for work
32
performed by our employees.
NSR increased $9.0 million, or 7.4%, to $129.4 million for fiscal year 2011 from $120.4 million for fiscal year 2010. The increase in NSR for fiscal year 2011 was primarily related to increased revenue from Exit Strategy contracts due to improved project performance, and, in particular, a favorable project close-out related to a large commercial development project recorded in fiscal year 2011. In addition, the market for our environmental services has begun to recover following a decline related to general economic conditions.
Insurance recoverables and other income decreased $10.4 million, or 117.8%, to $(1.6) million for fiscal year 2011 from $8.8 million for fiscal year 2010. During fiscal year 2010, three Exit Strategy projects had estimated cost increases which were not expected to be funded by the project-specific restricted investments and, therefore, were projected to be funded by the project-specific insurance policies procured at project inception to cover, among other things, costs in excess of the original estimates. Conversely, during fiscal year 2011, we reduced our cost estimate on one project as we currently expect to complete our contractual obligation sooner than previously anticipated, resulting in less projected recoveries from the project-specific insurance policy.
The Environmental operating segment's profit decreased $0.4 million, or 1.6%, to $24.8 million for fiscal year 2011 from $25.2 million for fiscal year 2010. The decrease in the Environmental operating segment's profit for fiscal year 2011 was related to the above-mentioned decrease in insurance recoverables, offset, by higher NSR. As a percentage of NSR, the Environmental operating segment's profit decreased to 19.1% in fiscal year 2011 from 20.9% in the prior year.
Infrastructure Operating Segment Results
Fiscal Year | ||||||||||||||
2011 | 2010 | Change | ||||||||||||
Gross revenue | $ | 56,050 | $ | 59,446 | $ | (3,396 | ) | (5.7 | )% | |||||
Net service revenue | $ | 42,278 | $ | 46,636 | $ | (4,358 | ) | (9.3 | )% | |||||
Segment profit | $ | 5,823 | $ | 4,565 | $ | 1,258 | 27.6 | % | ||||||
Gross revenue decreased $3.4 million, or 5.7%, to $56.1 million for fiscal year 2011 from $59.4 million for fiscal year 2010. The decrease in gross revenue for our Infrastructure operating segment was primarily due to the wind-down of a large transportation design project and lower overall demand for our services driven by uncertainties in federal policy and funding.
NSR decreased $4.4 million, or 9.3%, to $42.3 million for fiscal year 2011 from $46.6 million for fiscal year 2010. The decrease in NSR for our Infrastructure operating segment was due to the reasons described above in addition to lower overall demand related primarily to revenue shortfalls at state and municipal levels.
The Infrastructure operating segment's profit increased $1.3 million, or 27.6%, to $5.8 million for fiscal year 2011 from $4.6 million for fiscal year 2010. Our Infrastructure operating segment experienced stronger performance for fiscal year 2011, as compared to the same period of the prior year, despite a reduction in the overall volume of business, as we continue to reduce low margin work. As a percentage of NSR, the Infrastructure operating segment's profit increased to 13.8% in fiscal year 2011 from 9.8% in the prior year.
33
Fiscal Year 2010 Compared to Fiscal Year 2009
Consolidated Results of Operations
The following table presents the dollar and percentage changes in certain items in the consolidated statements of operations for fiscal years 2010 and 2009:
Years Ended June 30, | Change | |||||||||||||
(Dollars in thousands) | 2010 | 2009 | $ | % | ||||||||||
Gross revenue | $ | 330,575 | $ | 432,517 | $ | (101,942 | ) | (23.6 | )% | |||||
Less subcontractor costs and other direct reimbursable charges | 100,476 | 177,713 | (77,237 | ) | (43.5 | ) | ||||||||
Net service revenue | 230,099 | 254,804 | (24,705 | ) | (9.7 | ) | ||||||||
Interest income from contractual arrangements | 596 | 1,859 | (1,263 | ) | (67.9 | ) | ||||||||
Insurance recoverables and other income | 8,844 | 19,539 | (10,695 | ) | (54.7 | ) | ||||||||
Cost of services (exclusive of costs shown separately below) | 203,221 | 227,217 | (23,996 | ) | (10.6 | ) | ||||||||
General and administrative expenses | 26,028 | 32,936 | (6,908 | ) | (21.0 | ) | ||||||||
Provision for doubtful accounts | 2,344 | 3,952 | (1,608 | ) | (40.7 | ) | ||||||||
Depreciation and amortization | 8,049 | 7,322 | 727 | 9.9 | ||||||||||
Goodwill and intangible asset impairments | 20,249 | 21,438 | (1,189 | ) | (5.5 | ) | ||||||||
Arena Towers litigation reserve | 1,100 | — | 1,100 | 100.0 | ||||||||||
Operating loss | (21,452 | ) | (16,663 | ) | (4,789 | ) | 28.7 | |||||||
Interest expense | (1,003 | ) | (2,925 | ) | 1,922 | (65.7 | ) | |||||||
Gain on extinguishment of debt | 1,716 | — | 1,716 | 100.0 | ||||||||||
Loss from operations before taxes and equity in losses | (20,739 | ) | (19,588 | ) | (1,151 | ) | 5.9 | |||||||
Federal and state income tax benefit (provision) | 4,210 | (3,871 | ) | 8,081 | (208.8 | ) | ||||||||
Loss from operations before equity in losses | (16,529 | ) | (23,459 | ) | 6,930 | (29.5 | ) | |||||||
Equity in losses from unconsolidated affiliates | (45 | ) | (449 | ) | 404 | (90.0 | ) | |||||||
Net loss | (16,574 | ) | (23,908 | ) | 7,334 | (30.7 | ) | |||||||
Net loss applicable to noncontrolling interest | 125 | — | 125 | (100.0 | ) | |||||||||
Net loss applicable to TRC Companies, Inc. | (16,449 | ) | (23,908 | ) | 7,459 | (31.2 | ) | |||||||
Accretion charges on preferred stock | (6,431 | ) | (215 | ) | (6,216 | ) | 2,891.2 | |||||||
Net loss applicable to TRC Companies, Inc.'s common shareholders | $ | (22,880 | ) | $ | (24,123 | ) | $ | 1,243 | (5.2 | )% | ||||
Gross revenue decreased $101.9 million, or 23.6%, to $330.6 million for fiscal year 2010 from $432.5 million for fiscal year 2009. Overall, requirements for work performed by our subcontractors that generated much of our gross revenue growth in prior fiscal years declined. Specifically, fiscal year 2010 revenue in our Environmental operating segment decreased $47.0 million primarily due to the wind-down of a large commercial development Exit Strategy project and the completion of several large environmental compliance projects. Gross revenue in our Energy operating segment declined by $39.8 million primarily due to reduced activity on electric transmission and distribution projects and, in particular, engineering, procurement and construction ("EPC") contracts which generate significant amounts of gross revenue due to the large amount of equipment and substantial subcontracting requirements. The remainder of the decrease was primarily attributable to the wind-down of a large transportation design project in our Infrastructure operating segment.
NSR decreased $24.7 million, or 9.7%, to $230.1 million for fiscal year 2010 from $254.8 million for fiscal year 2009. The decrease was partially due to a $9.3 million reduction in our Environmental operating segment primarily related to: (1) the completion of several large environmental compliance contracts which reduced NSR by approximately $6.3 million and (2) the wind-down of a large commercial development Exit Strategy project which reduced NSR by approximately $4.0 million. These contracts were not replaced at the same level primarily due to the economic downturn. In addition, NSR in our Energy operating segment declined by $8.4 million as work associated with certain EPC contracts was lower than in fiscal year 2009 by approximately $10.2 million. Also, NSR for our Infrastructure operating segment decreased by $7.4 million primarily due to: (1) personnel departures resulting from certain actions taken to eliminate low margin work and (2) the wind-down of a large transportation design project.
34
Interest income from contractual arrangements decreased $1.3 million, or 67.9%, to $0.6 million for fiscal 2010 from $1.9 million for fiscal year 2009 primarily due to lower one year constant maturity T-Bill rates and a lower average balance of restricted investments in fiscal year 2010 compared to fiscal year 2009.
Insurance recoverables and other income decreased $10.7 million, or 54.7%, to $8.8 million for fiscal year 2010 from $19.5 million for fiscal year 2009. During fiscal year 2009, three Exit Strategy projects had estimated cost increases which were not expected to be funded by the project-specific restricted investments and, therefore, were projected to be funded by the project-specific insurance policies procured at project inception to cover, among other things, costs in excess of the original estimates. In fiscal year 2010, we did not experience similar estimated cost increases.
COS decreased $24.0 million, or 10.6%, to $203.2 million for fiscal year 2010 from $227.2 million for fiscal year 2009. The decrease was related, in part, to a $9.8 million decrease in Exit Strategy contract loss reserves. As discussed above, increases to our Exit Strategy cost estimates did not occur at the same level in the fiscal year 2010 as compared to fiscal year 2009. The remainder of the decrease in COS, to a large extent, corresponded to the reduction in NSR. Specifically, the decrease was related to an $11.7 million decrease in labor and fringe costs and a $3.2 million decrease in bonus expense. As a percentage of NSR, COS was 88.3% and 89.2% for fiscal years 2010 and 2009, respectively.
G&A expenses decreased $6.9 million, or 21.0%, to $26.0 million for fiscal year 2010 from $32.9 million for fiscal year 2009. The decrease was primarily attributable to a $2.5 million decrease in external legal fees and litigation settlement costs and a $1.3 million decrease in accounting fees. In addition, corporate salary expense, bonus expense and fringe benefit costs decreased $1.0 million primarily due to reduced headcount and incentive compensation costs. The remainder of the decrease was primarily attributable to reduced facility costs.
The provision for doubtful accounts decreased $1.6 million, or 40.7%, to $2.3 million for fiscal year 2010 from $3.9 million for fiscal year 2009. The decrease was primarily due to the corresponding decrease in revenues and the collection of a receivable in fiscal year 2010 that was reserved for in a prior year.
Depreciation and amortization increased $0.7 million, or 9.9%, to $8.0 million for fiscal year 2010 from $7.3 million for fiscal year 2009. The increase was primarily related to $1.6 million of accelerated amortization expense relating to certain customer relationship intangible assets which was partially offset by a decrease due to technology equipment becoming fully depreciated in fiscal year 2009.
We assessed the recoverability of goodwill during the first, second and fourth quarters of fiscal year 2010. In performing the goodwill assessments, we utilized valuation methods, including the discounted cash flow method, the guideline company approach, and the guideline transaction approach as the best evidence of fair value. The aggregate fair value of our reporting units declined from the December 25, 2009 valuation to the April 26, 2010 valuation primarily due to a decline in the estimated future cash flows of the reporting units and declines in market multiples of comparable companies. These declines were primarily driven by the U.S recession and its negative impact on several of our key markets, resulting in delays, curtailments and cancellations of proposed and existing projects, which decreased the overall demand for our services. The fair value of three of our reporting units with goodwill did not exceed its carrying value in the fourth quarter of fiscal year 2010, resulting in a goodwill impairment charge of $20.2 million. During fiscal year 2009, an impairment charge of $19.3 million was recorded to write down the carrying value of goodwill, and an impairment charge of $2.1 million was recorded related to certain customer relationships intangible assets.
Management judgment and assumptions are required in performing the impairment tests for all reporting units with goodwill and in measuring the fair value of goodwill, indefinite-lived intangibles and long-lived assets. While we believe our judgments and assumptions are reasonable, different assumptions could change the estimated fair values or the amount of the recognized impairment losses.
Interest expense decreased $1.9 million, or 65.7%, to $1.0 million for fiscal year 2010 from $2.9 million for fiscal year 2009. We received $15.3 million of net proceeds from the preferred stock offering in June 2009 and utilized the proceeds to pay down our revolving credit facility. The average outstanding balance on our credit facility during fiscal year 2010 was zero compared to an average outstanding balance of $18.4 million for fiscal year 2009.
The federal and state income tax benefit was $4.2 million for fiscal year 2010 from a tax provision of $3.9 million for fiscal year 2009 primarily related to uncertain tax positions. We recognized a net tax benefit of $4.2 million in fiscal year 2010 primarily due to: (i) the Worker, Homeownership, and Business Assistance Act of 2009 which amended I.R.C. §172(b)(1)(H), allowing taxpayers to elect to carry back an applicable NOL for a period of 3, 4, or 5 years to offset taxable income in those preceding years and enabling us to carry back our fiscal year 2008 NOL for a tax benefit of $2.8 million, which amount was collected in fiscal year 2010; and (ii) the re-assessment of our uncertain tax positions based on communications with the IRS relating to its examination including the impact of the NOL law change which resulted in an income tax benefit of $1.9 million.
35
Equity in losses from unconsolidated affiliates, net of taxes, decreased $0.4 million, to $0.1 million in fiscal year 2010 from $0.5 million in fiscal year 2009. The fiscal year 2009 results were negatively impacted by a $0.4 million impairment charge on our investment in Environmental Restoration, LLC.
Operating Segment Results of Operations
Energy Operating Segment Results
Fiscal Year | ||||||||||||||
2010 | 2009 | Change | ||||||||||||
Gross revenue | $ | 77,035 | $ | 116,868 | $ | (39,833 | ) | (34.1 | )% | |||||
Net service revenue | $ | 59,554 | $ | 67,964 | $ | (8,410 | ) | (12.4 | )% | |||||
Segment profit | $ | 8,572 | $ | 15,327 | $ | (6,755 | ) | (44.1 | )% | |||||
Gross revenue decreased $39.8 million, or 34.1%, to $77.0 million for fiscal year 2010 from $116.9 million for fiscal year 2009. The Energy operating segment experienced a decline in gross revenue in fiscal year 2010 due to a slowdown in electric transmission and distribution spending and a reduction of large project awards throughout fiscal year 2010. Specifically, gross revenue generated by engineer, procure and construct (“EPC”) contracts for fiscal year 2010 was lower than fiscal year 2009 by approximately $41.1 million. EPC projects were, to some extent, replaced by traditional energy service projects which had lower levels of subcontracting requirements and, therefore, generated less gross revenue.
NSR decreased $8.4 million, or 12.4%, to $59.6 million for fiscal year 2010 from $68.0 million for fiscal year 2009. The Energy operating segment experienced a decline in NSR in fiscal year 2010 due to the aforementioned slowdown in electric transmission and distribution spending. In particular, many of our clients delayed previously scheduled investments in large, multi-year capital projects throughout fiscal year 2010. Consequently, as several of our major EPC contracts wound down, we experienced a decline in NSR. The decrease in NSR related to delayed EPC contract awards was, in part, replaced by an increase in demand for our energy efficiency program management services.
The Energy operating segment's profit decreased $6.7 million, or 44.1%, to $8.6 million for fiscal year 2010 from $15.3 million for fiscal year 2009. The decline in the Energy operating segment's profit for fiscal year 2010 was primarily related to the decline in NSR. As described above, our clients delayed large scale capital investments and, alternatively, were focusing on smaller, competitively bid maintenance projects. Increased competition for these smaller maintenance projects and reduced bookings of new awards resulted in lower segment profit margins. As a percentage of NSR, the Energy operating segment's profit decreased to 14.4% in fiscal year 2010 from 22.6% in the prior year.
Environmental Operating Segment Results
Fiscal Year | ||||||||||||||
2010 | 2009 | Change | ||||||||||||
Gross revenue | $ | 195,332 | $ | 242,301 | $ | (46,969 | ) | (19.4 | )% | |||||
Net service revenue | $ | 120,431 | $ | 129,698 | $ | (9,267 | ) | (7.1 | )% | |||||
Segment profit | $ | 25,170 | $ | 24,532 | $ | 638 | 2.6 | % | ||||||
Gross revenue decreased $47.0 million, or 19.4%, to $195.3 million for fiscal year 2010 from $242.3 million for fiscal year 2009. We experienced lower gross revenue activity in our Environmental operating segment due, in part, to the completion of several major compliance projects which reduced gross revenue by approximately $19.5 million for fiscal year 2010 when compared to fiscal year 2009. In addition, the wind-down of a large commercial development Exit Strategy project reduced gross revenue by approximately $17.8 million for fiscal year 2010 when compared to fiscal year 2009. The remainder of the decrease was primarily attributable to a change in project mix, particularly with remediation projects where we experienced lower subcontracting requirements.
NSR decreased $9.3 million, or 7.1%, to $120.4 million for fiscal 2010 from $129.7 million for fiscal year 2009. The decrease in NSR for fiscal year 2010 was primarily related to (1) adjustments to the estimates at completion on certain Exit Strategy contracts which reduced NSR by approximately $2.8 million and (2) the wind-down of a large commercial
36
development Exit Strategy project which reduced NSR by approximately $4.0 million. The remainder of the decrease was due to lower activity in our Environmental operating segment due to the completion of several major compliance projects These contracts have not been replaced at the same level primarily due to the decrease in capital spending on oil and gas pipelines, energy exploration and distribution projects, and new electrical generation sources.
The Environmental operating segment's profit increased $0.6 million, or 2.6%, to $25.2 million for fiscal year 2010 from $24.5 million for fiscal year 2009. The increase in the Environmental operating segment's profit for fiscal year 2010 was primarily due to improved execution resulting in higher margins as compared to the same period in the prior year as well as the positive impact of cost saving measures implemented during fiscal year 2010. As a percentage of NSR, the Environmental operating segment's profit increased to 20.9% in fiscal year 2010 from 18.9% in the prior year.
Infrastructure Operating Segment Results
Fiscal Year | ||||||||||||||
2010 | 2009 | Change | ||||||||||||
Gross revenue | $ | 59,446 | $ | 70,305 | $ | (10,859 | ) | (15.4 | )% | |||||
Net service revenue | $ | 46,636 | $ | 54,034 | $ | (7,398 | ) | (13.7 | )% | |||||
Segment profit | $ | 4,565 | $ | 5,696 | $ | (1,131 | ) | (19.9 | )% | |||||
Gross revenue decreased $10.9 million, or 15.4%, to $59.4 million for fiscal year 2010 from $70.3 million for fiscal year 2009. The decrease in gross revenue for our Infrastructure operating segment was primarily due to the wind-down of a large transportation design project.
NSR decreased $7.4 million, or 13.7%, to $46.6 million for fiscal year 2010 from $54.0 million for fiscal year 2009. The decrease in NSR for our Infrastructure operating segment was primarily due to the personnel departures resulting from certain actions taken to limit low margin work and the wind-down of a large transportation design project.
The Infrastructure operating segment's profit decreased $1.1 million, or 19.9%, to $4.6 million for fiscal year 2010 from $5.7 million for fiscal year 2009. The Infrastructure operating segment's profit decreased primarily due to the above described decrease in NSR. This decrease was partially mitigated by reductions of costs, principally labor and fringe of $6.3 million. The reduction in costs was due to the implementation of various cost-control measures in response to the current economic downturn. As a percentage of NSR, the Infrastructure operating segment's profit decreased to 9.8% in fiscal year 2010 from 10.5% in the prior year.
37
Costs and Expenses as a Percentage of NSR
The following table presents the percentage relationships of items in the consolidated statements of operations to NSR for fiscal years 2011, 2010 and 2009:
2011 | 2010 | 2009 | ||||||
Net service revenue | 100.0 | % | 100.0 | % | 100.0 | % | ||
Interest income from contractual arrangements | 0.2 | 0.3 | 0.7 | |||||
Insurance recoverables and other income | (0.6 | ) | 3.8 | 7.7 | ||||
Operating costs and expenses: | ||||||||
Cost of services (exclusive of costs shown separately below) | 82.3 | 88.3 | 89.2 | |||||
General and administrative expenses | 10.7 | 11.3 | 12.9 | |||||
Provision for doubtful accounts | 0.7 | 1.0 | 1.6 | |||||
Depreciation and amortization | 1.9 | 3.5 | 2.9 | |||||
Goodwill and intangible asset impairments | — | 8.8 | 8.4 | |||||
Arena Towers litigation reserve | 7.0 | 0.5 | — | |||||
Total operating costs and expenses | 102.6 | 113.4 | 115.0 | |||||
Operating loss | (3.1 | ) | (9.3 | ) | (6.6 | ) | ||
Interest expense | (0.3 | ) | (0.4 | ) | (1.1 | ) | ||
Gain on extinguishment of debt | — | 0.7 | — | |||||
Loss from operations before taxes and equity in earnings (losses) | (3.4 | ) | (9.0 | ) | (7.7 | ) | ||
Federal and state income tax (provision) benefit | (0.5 | ) | 1.8 | (1.5 | ) | |||
Loss from operations before equity in earnings (losses) | (3.8 | ) | (7.2 | ) | (9.2 | ) | ||
Equity in earnings (losses) from unconsolidated affiliates, net of taxes | — | — | (0.2 | ) | ||||
Net loss | (3.8 | ) | (7.2 | ) | (9.4 | ) | ||
Net loss applicable to noncontrolling interest | — | 0.1 | — | |||||
Net loss applicable to TRC Companies, Inc. | (3.8 | ) | (7.1 | ) | (9.4 | ) | ||
Accretion charges on preferred stock | (3.0 | ) | (2.8 | ) | (0.1 | ) | ||
Net loss applicable to TRC Companies, Inc.'s common shareholders | (6.8 | )% | (9.9 | )% | (9.5 | )% | ||
Impact of Inflation
Our operations have not been materially affected by inflation or changing prices because most contracts of a longer term are subject to adjustment or have been priced to cover anticipated increases in labor and other costs, and the remaining contracts are short term in nature.
Liquidity and Capital Resources
We primarily rely on cash from operations and financing activities, including borrowings under our revolving credit facility, to fund our operations. Our liquidity is assessed in terms of our overall ability to generate cash to fund our operating and investing activities and to reduce debt.
Fiscal Year 2011 Compared to Fiscal Year 2010
Cash flows provided by operating activities were $12.5 million for fiscal year 2011, compared to $11.1 million of cash provided for fiscal year 2010. Sources of cash provided by operating assets and liabilities for fiscal year 2011 totaled $31.0 million and primarily consisted of the following: (1) an $8.5 million decrease in restricted investments primarily due to work performed on Exit Strategy projects; (2) a $7.1 million decrease in prepaid insurance attributable to continued amortization of policies on Exit Strategy projects; (3) a $4.9 million increase in accrued compensation and benefits, due primarily to the one additional accrual day at the current year end and increased bonus accruals driven by our operating results net of the Arena Towers litigation reserve; and (4) a $4.5 million decrease in accounts receivable due to timing of collections and a favorable reduction in days sales outstanding as noted below. Sources of cash provided by operating assets and liabilities during fiscal
38
year 2011 were offset by cash used in operating assets and liabilities totaling $35.0 million consisting primarily of the following: (1) an $18.8 million decrease in deferred revenue primarily related to revenue earned on Exit Strategy projects; and (2) an $11.4 million decrease in accounts payable primarily due to the timing of payments to vendors. In addition, non-cash items for fiscal year 2011 resulted in net expenses of $26.0 million consisting primarily of the following: (1) a $17.3 million charge related to the Arena Towers litigation reserve; (2) $4.7 million for depreciation and amortization; (3) $2.5 million for stock-based compensation expense; and (4) $1.8 million for the provision for doubtful accounts.
Accounts receivable include both: (1) billed receivables associated with invoices submitted for work performed and (2) unbilled receivables (work in progress). The unbilled receivables are primarily related to work performed in the last month of the quarter. The efficiency of the billing and collection process is commonly evaluated as days sales outstanding (“DSO”), which we calculate by dividing current receivables by the most recent three-month average of daily gross revenue. DSO, which measures the collections turnover of both billed and unbilled receivables, decreased to 85 days as of June 30, 2011 from 93 days as of June 30, 2010. Our goal is to maintain DSO at less than 90 days.
Under Exit Strategy contracts the majority of the contract price is typically deposited into a restricted account with an insurer. The funds in the restricted account are held by the insurer and used to pay us as work is performed. The arrangement with the insurer provides for deposited funds to earn interest at the one-year constant maturity T-Bill rate. If the actual interest rate earned on the deposited funds is less than the rate anticipated when the contract was executed, over time the balance in the restricted account may be less than originally expected. However, there is typically an insurance policy paid for by the client which provides coverage for cost increases from unknown or changed conditions up to a specified maximum amount which is typically significantly in excess of the estimated cost of remediation.
Cash used in investing activities was approximately $15.1 million during fiscal year 2011, compared to $2.7 million used in fiscal year 2010. Cash used consisted primarily of (1) $14.0 million for the acquisitions of RMT and AUE; and (2) $3.1 million for property and equipment, which amounts were primarily offset by $1.9 million of proceeds from restricted investments.
Cash used in financing activities was approximately $1.3 million during fiscal year 2011, compared to $2.2 million used in fiscal year 2010. Cash used consisted of $3.6 million for payments made on long-term debt and the short-term insurance financing related to fiscal year 2011 insurance premiums which was offset by $2.6 million of short-term financing related to fiscal year 2011 insurance premiums which have been repaid as of June 30, 2011.
Fiscal Year 2010 Compared to Fiscal Year 2009
Cash flows provided by operating activities were $11.1 million for fiscal year 2010, compared to $21.0 million of cash provided for fiscal year 2009. Sources of cash provided by operating assets and liabilities for fiscal year 2010 totaled $37.1 million and primarily consisted of the following: (1) a $19.3 million decrease in restricted investments primarily due to work performed on Exit Strategy projects; (2) a $10.5 million decrease in accounts receivable due to a reduction in gross revenue; and (3) a $3.2 million decrease in long-term prepaid insurance. Sources of cash provided by operating assets and liabilities during fiscal year 2010 were offset by uses of cash from operating assets and liabilities totaling $41.9 million consisting primarily of the following: (1) a $14.8 million decrease in deferred revenue primarily related to revenue earned on Exit Strategy projects; (2) an $8.3 million increase in insurance recoverable due to estimated cost increases on certain Exit Strategy projects that will be funded by project-specific insurance policies; (3) an $8.2 million decrease in accounts payable primarily due to a reduction in the subcontractor costs and other direct reimbursable charges and the timing of payments to vendors; and (4) a $7.5 million decrease in accrued compensation and benefits primarily due to the payment of employee bonuses. In addition, non-cash items during this period resulted in net expenses of $31.3 million. The non-cash expense items of $34.1 million consisted primarily of the following: (1) $20.2 million for a goodwill impairment charge; (2) $8.0 million for depreciation and amortization of which $1.6 million was due to the acceleration of amortization expense relating to certain customer relationship intangible assets; (3) $2.3 million for the provision for doubtful accounts; and (4) $1.9 million for stock-based compensation expense. The non-cash expense items were offset by non-cash income of $1.7 million related to a gain recorded on extinguishment of debt in connection with the dissolution of Co-Energy LLC.
Cash used in investing activities was approximately $2.7 million during fiscal year 2010, compared to $2.2 million used in fiscal year 2009. Cash used consisted primarily of $3.4 million for property and equipment, $0.7 million for earnout payments made on a prior year acquisition, and $0.1 million for the acquisition of a business, which were primarily offset by $1.3 million of proceeds from restricted investments and $0.1 million of proceeds from the sale of fixed assets.
Cash used in financing activities was approximately $2.2 million during fiscal year 2010, compared to $11.6 million used in fiscal year 2009. Cash used consisted of $4.2 million for payments made on long-term debt, $0.3 million for payments made for employee tax withholdings related to the cancellation of shares, and $0.1 million for issuance costs related to convertible preferred stock which was offset by $2.5 million of borrowings in fiscal year 2010 which have been repaid as of June 30, 2010.
39
Long-Term Debt
Long-term debt as of June 30, 2011 and 2010 is comprised of the following (in thousands):
2011 | 2010 | ||||||
Revolving credit facility | $ | — | $ | — | |||
Subordinated debt: | |||||||
Federal Partners note payable | 5,000 | 5,000 | |||||
CAH note payable | 2,450 | 2,700 | |||||
AUE note payable | 900 | — | |||||
Other notes payable | 277 | 1,016 | |||||
Lease financing obligations | 549 | 728 | |||||
9,176 | 9,444 | ||||||
Less current portion | (3,139 | ) | (3,629 | ) | |||
Long-term debt | $ | 6,037 | $ | 5,815 | |||
On July 17, 2006, we and substantially all of our subsidiaries, (the “Borrower”), entered into a secured credit agreement (the “Credit Agreement”) and related security documentation with Wells Fargo Capital Finance (“Wells Fargo”) as the lead lender and administrative agent, with Textron Financial Corporation (“Textron”) subsequently participating as an additional lender. The Credit Agreement, as amended, provided us with a five-year senior revolving credit facility of up to $50.0 million based upon a borrowing base formula on accounts receivable. In connection with the closing of the preferred stock offering and as a result of previously announced plans to exit the asset based lending business, Textron elected to no longer participate in the credit facility. In June 2009, a $15.0 million syndication reserve was established which reduces the maximum revolver amount from $50.0 million to $35.0 million subject to increase upon Wells Fargo completing a syndication to replace Textron as a participant in the facility. Any amounts outstanding under the Credit Agreement bear interest at the greater of 5.75% and the prime rate plus a margin of 2.50% to 3.50%, or the greater of 3.00% and LIBOR plus a margin of 3.50% to 4.50%, based on Trailing Twelve Month Earnings Before Interest, Taxes, Depreciation and Amortization (“EBITDA”), as defined. Our obligations under the Credit Agreement are secured by a pledge of substantially all of our assets and guaranteed by substantially all of our subsidiaries that are not borrowers. The Credit Agreement also contains cross-default provisions which become effective if we default on other indebtedness.
Under the Credit Agreement we must maintain average monthly backlog of $190.0 million and, depending on available borrowing capacity, maintain a minimum fixed charge coverage ratio of 1.00 to 1.00. The Credit Agreement was amended as of January 19, 2010 to extend the expiration date of the facility by two years from July 17, 2011 to July 17, 2013. The amendment also changed the Consolidated Adjusted EBITDA covenant to $6.1 million, $9.2 million, $10.9 million and $12.4 million, for the trailing twelve month periods ending on September 30, 2010, December 31, 2010, March 31, 2011 and June 30, 2011, respectively; and $12.5 million for each 12 month period ending each fiscal quarter thereafter. The definition of Consolidated Adjusted EBITDA also provides an aggregate allowance for cost reduction efforts, defined in the Credit Agreement as restructuring charges, in the amount of $3.0 million in fiscal year 2010 and $1.25 million in fiscal year 2011 at the Permitted Discretion of the lender as defined in the Credit Agreement. Additional changes in the January 2010 amendment included: (i) an increase to the fee for unused borrowing capacity depending on borrowing usage; (ii) a reduction of the maximum annual capital expenditure covenant from $10.6 million to $7.5 million for fiscal year 2010 through fiscal year 2012 and $8.5 million for fiscal year 2013; and (iii) a revision to the fixed charge ratio covenant which now requires the ratio to be computed and the covenant applied only if available borrowing capacity under the facility, measured on a trailing 30 day average basis, is less than $20.0 million.
The Credit Agreement was amended as of February 25, 2011 to allow us to purchase the stock of AUE and incur indebtedness in connection with that acquisition in the form of a subordinated promissory note in a principal amount not to exceed $0.9 million. The Credit Agreement was again amended as of June 6, 2011 to allow us to enter into an asset purchase agreement with RMT, Inc.
The Credit Agreement was amended as of August 15, 2011 to increase the maximum amount of letters of credit usage from $15.0 million to $25.0 million. The amendment also changed the Consolidated Adjusted EBITDA covenant to $3.0 million, $6.0 million, $10.0 million and $12.5 million, for the three months ended September 30, 2011, the six months ended December 31, 2011, the nine months ended March 31, 2012 and the twelve months ended June 30, 2012, respectively; and $12.5 million for each 12 month period ending each fiscal quarter thereafter. The amendment also changed the definition of Consolidated Adjusted EBITDA to include an allowance of $19.5 million relating to legal costs and reserves incurred during
40
fiscal year 2011. The amendment also revised the criteria for determining whether the fixed charge coverage ratio covenant is applicable and requires the ratio to be computed and the covenant applied only if available borrowing capacity under the facility plus qualified cash, measured on a trailing 30 day average basis, is less than $20.0 million or, at any point during the most recent fiscal quarter, is less than $15.0 million.
Management presents Consolidated Adjusted EBITDA, which is a non-GAAP measure, because it is a we believe that it is a useful tool for us, our lenders and our investors to measure our ability to meet debt service, capital expenditure and working capital requirements. Consolidated Adjusted EBITDA, as presented, may not be comparable to similarly titled measures reported by other companies, because not all companies calculate EBITDA in an identical manner. Consolidated Adjusted EBITDA is not intended to represent cash flows for the period or funds available for management's discretionary use, nor is it represented as an alternative to operating income (loss) as an indicator of operating performance and should not be considered in isolation or as a substitute for measures of performance prepared in accordance with generally accepted accounting principles. Our Consolidated Adjusted EBITDA should be evaluated in conjunction with GAAP measures such as operating income (loss), net income (loss), cash flow from operations and other measures of equal importance. Consolidated Adjusted EBITDA is presented below based on both the definition used in our Credit Agreement as well as the typical calculation method. Set forth below is a reconciliation of Consolidated Adjusted EBITDA, as calculated under the Credit Agreement, to EBITDA and operating loss for the trailing twelve month periods ended June 30, 2011, 2010 and 2009 (in thousands):
Trailing Twelve Months | |||||||||||
June 30, 2011 | June 30, 2010 | June 30, 2009 | |||||||||
Operating loss | $ | (7,572 | ) | $ | (21,452 | ) | $ | (16,663 | ) | ||
Depreciation and amortization | 4,729 | 8,049 | 7,322 | ||||||||
EBITDA | (2,843 | ) | (13,403 | ) | (9,341 | ) | |||||
Goodwill and intangible asset impairments | — | 20,249 | 21,438 | ||||||||
Permitted discretionary cost reduction efforts | 836 | 1,722 | 1,500 | ||||||||
Permitted discretionary litigation reserve | 17,278 | — | — | ||||||||
Consolidated Adjusted EBITDA under the Credit Agreement | $ | 15,271 | $ | 8,568 | $ | 13,597 | |||||
The actual covenant results as compared to the covenant requirements under the Credit Agreement as of June 30, 2011 for the measurement periods described below are as follows (in thousands):
Measurement Period | Actual | Required | |||||||||
Minimum Consolidated Adjusted EBITDA | Trailing 12 months | $ | 15,271 | Must Exceed | $ | 12,400 | |||||
Average Monthly Backlog | Trailing 3 months | $ | 372,381 | Must Exceed | $ | 190,000 | |||||
Capital Expenditures | Fiscal year 2011 | $ | 3,058 | Not to Exceed | $ | 7,500 | |||||
Minimum Fixed Charge Coverage Ratio (1) | Trailing 12 months | Not Applicable | Must Exceed | 1.00 to 1.00 | |||||||
_________________________
(1) | As of June 30, 2011, the minimum fixed charge coverage ratio covenant is not applicable as the available borrowing capacity under the facility, measured on a trailing 30 day average basis, was greater than $20.0 million and, at no point during the most recent fiscal quarter was less than $15.0 million. |
As of June 30, 2011 and 2010, we had no borrowings outstanding pursuant to the Credit Agreement. Letters of credit outstanding were $3.8 million and $3.7 million as of June 30, 2011 and 2010, respectively. Based upon the borrowing base formula, the maximum availability under the Credit Agreement was $35.0 million and $30.2 million as of June 30, 2011 and 2010, respectively. Funds available to borrow under the Credit Agreement after consideration of the reserve amount were $31.2 million and $26.5 million as of June 30, 2011 and 2010, respectively.
On July 19, 2006, we and substantially all of our subsidiaries entered into a three-year subordinated loan agreement with Federal Partners, L.P. (“Federal Partners”), a stockholder of ours, pursuant to which we borrowed $5.0 million. The loan bears interest at a fixed rate of 9% per annum. The loan was amended on June 1, 2009 in connection with the preferred stock offering to extend the maturity date from July 19, 2009 to July 19, 2012. Federal Partners was an investor in our preferred stock offering.
In fiscal year 2007, we formed a limited liability company, Center Avenue Holdings, LLC ("CAH"), to purchase and
41
remediate certain property in New Jersey. We maintain a 70% ownership position in CAH. CAH entered into a term loan agreement with a commercial bank in the amount of approximately $3.2 million which bore interest at a fixed rate of 10.0% annually. The loan is secured by the CAH property and is non-recourse to the members of CAH. The proceeds from the loan were used to purchase, and are currently funding the remediation of, the property. In June 2010, we entered into a modification of the credit agreement with the lender that reduced the interest rate from 10.0% to 6.5% in return for a principal payment of $0.5 million made upon consummation of the modification followed by a second principal payment of $0.25 million made on December 1, 2010 and extended the maturity date of the loan from January 31, 2010 until April 1, 2011. In April 2011, we entered into a modification of the credit agreement with the lender that extended the maturity date of the loan from April 1, 2011 until October 1, 2011.
In July 2010, we financed approximately $2.6 million of insurance premiums payable in nine equal monthly installments of approximately $0.3 million each, including a finance charge of 2.89%. As of June 30, 2011, the balance has been repaid.
In February 2011, we entered into a two-year subordinated promissory note with the principal owner of AUE pursuant to which we agreed to pay $0.9 million. The note bears interest at a fixed rate of 3.25% per annum. The principal amount outstanding under this note shall become due and payable in two equal installments of $0.45 million on each of the first and second anniversaries of the note.
Based on our current operating plans, we believe that existing cash resources as well as cash forecasted to be generated from operations and availability under our revolving credit facility are adequate to meet our requirements for the foreseeable future. In addition we expect to remain in full compliance with the covenant requirements under the Credit Agreement over the next twelve months.
Future minimum long-term debt payments as of June 30, 2011 are as follows (in thousands):
Year | Debt | Lease Financing Obligations | Total | ||||||||
2012 | $ | 2,961 | $ | 178 | $ | 3,139 | |||||
2013 | 5,511 | 145 | 5,656 | ||||||||
2014 | 63 | 97 | 160 | ||||||||
2015 | 68 | 97 | 165 | ||||||||
2016 | 24 | 32 | 56 | ||||||||
Thereafter | — | — | — | ||||||||
$ | 8,627 | $ | 549 | $ | 9,176 | ||||||
42
Contractual Obligations
The following table sets forth, as of June 30, 2011, certain information concerning our obligations to make future principal and interest payments (variable interest components used interest rates for estimating future interest payment obligations of between 3.25% to 9.00%) under contracts, such as debt and lease agreements (in thousands).
Payments due by period (1) | |||||||||||||||||||
Contractual Obligations | Total | Year 1 | Years 2 - 3 | Years 4 - 5 | Beyond | ||||||||||||||
Revolving credit facility | $ | — | $ | — | $ | — | $ | — | $ | — | |||||||||
Subordinated debt: | |||||||||||||||||||
Federal Partners note payable | 5,481 | 457 | 5,024 | — | — | ||||||||||||||
CAH note payable | 2,503 | 2,503 | — | — | — | ||||||||||||||
AUE note payable | 944 | 479 | 465 | — | — | ||||||||||||||
Other notes payable | 337 | 85 | 149 | 103 | — | ||||||||||||||
Operating leases | 40,468 | 10,859 | 14,421 | 8,580 | 6,608 | ||||||||||||||
Lease financing obligations | 549 | 178 | 242 | 129 | — | ||||||||||||||
Unrecognized tax benefits (2) | 4,911 | — | — | — | 4,911 | ||||||||||||||
Total contractual obligations | $ | 55,193 | $ | 14,561 | $ | 20,301 | $ | 8,812 | $ | 11,519 | |||||||||
______________________________
(1) | Includes estimated interest. |
(2) | Represents liabilities for unrecognized tax benefits related to uncertain tax positions. We are unable to reasonably predict the timing of tax settlements, as tax audits can involve complex issues and the resolution of those issues may span multiple years, particularly if subject to negotiation or litigation. |
We enter into long-term contracts pursuant to our Exit Strategy program under which we are obligated to complete the remediation of environmental conditions at sites.
On June 1, 2009, we sold 7,209.302 shares of a new Series A Convertible Preferred Stock, $0.10 par value, for $2,150 per share pursuant to a stock purchase agreement by and among us and three of our existing shareholders and related entities. On December 1, 2010, each share of the preferred stock automatically converted into 1,000 shares of common stock, or an aggregate of 7,209,302 shares of common stock.
Off-Balance Sheet Arrangements
As of June 30, 2011, our "Off-Balance Sheet" arrangements, as that term is defined by the Securities and Exchange Commission, included $3.8 million of standby letters of credit issued primarily for outstanding performance or payment bonds. The letters of credit were issued by our bank and renew annually. We also have operating leases for most of our office facilities and certain equipment. Rental expense for operating leases was approximately $10.3 million in fiscal year 2011, $11.4 million in fiscal year 2010, and $11.4 million in fiscal year 2009. Minimum operating lease obligations payable in future years (i.e., primarily base rent) are included above in Contractual Obligations.
Item 7A. Quantitative and Qualitative Disclosures About Market Risk
We currently do not utilize derivative financial instruments. While we currently do not have any borrowings outstanding under our credit agreement, to the extent we have borrowings, we would be exposed to interest rate risk under that agreement. Our credit facility provides for borrowings bearing interest at the greater of 5.75% and the prime rate plus a margin of 2.50% to 3.50%, or the greater of 3.00% and LIBOR plus a margin of 3.50% to 4.50%, based on Trailing Twelve Month EBITDA.
Borrowings at these rates have no designated term and may be repaid without penalty any time prior to the facility's maturity date. Under its term as amended, the facility matures on July 17, 2013, or earlier at our discretion, upon payment in full of loans and other obligations.
43
Item 8. Financial Statements and Supplementary Data
REPORT OF INDEPENDENT REGISTERED PUBLIC ACCOUNTING FIRM
To the Board of Directors and Stockholders of
TRC Companies, Inc.
Windsor, Connecticut
We have audited the accompanying consolidated balance sheets of TRC Companies, Inc. and subsidiaries (the "Company") as of June 30, 2011 and 2010, and the related consolidated statements of operations, changes in equity, and cash flows for each of the three years in the period ended June 30, 2011. These financial statements are the responsibility of the Company's management. Our responsibility is to express an opinion on these financial statements based on our audits.
We conducted our audits in accordance with the standards of the Public Company Accounting Oversight Board (United States). Those standards require that we plan and perform the audit to obtain reasonable assurance about whether the financial statements are free of material misstatement. An audit includes examining, on a test basis, evidence supporting the amounts and disclosures in the financial statements. An audit also includes assessing the accounting principles used and significant estimates made by management, as well as evaluating the overall financial statement presentation. We believe that our audits provide a reasonable basis for our opinion.
In our opinion, such consolidated financial statements present fairly, in all material respects, the financial position of TRC Companies, Inc. and subsidiaries at June 30, 2011 and 2010, and the results of their operations and their cash flows for each of the three years in the period June 30, 2011, in conformity with accounting principles generally accepted in the United States of America.
We have also audited, in accordance with the standards of the Public Company Accounting Oversight Board (United States), the Company's internal control over financial reporting as of June 30, 2011, based on Internal Control-Integrated Framework issued by the Committee of Sponsoring Organizations of the Treadway Commission and our report September 8, 2011 expressed an unqualified opinion on the Company's internal control over financial reporting.
/s/ DELOITTE & TOUCHE LLP
Boston, Massachusetts
September 8, 2011
44
TRC Companies, Inc.
CONSOLIDATED STATEMENTS OF OPERATIONS
In thousands, except per share data
Years ended June 30, | 2011 | 2010 | 2009 | ||||||||
Gross revenue | $ | 333,209 | $ | 330,575 | $ | 432,517 | |||||
Less subcontractor costs and other direct reimbursable charges | 87,298 | 100,476 | 177,713 | ||||||||
Net service revenue | 245,911 | 230,099 | 254,804 | ||||||||
Interest income from contractual arrangements | 411 | 596 | 1,859 | ||||||||
Insurance recoverables and other income | (1,573 | ) | 8,844 | 19,539 | |||||||
Operating costs and expenses: | |||||||||||
Cost of services (exclusive of costs shown separately below) | 202,265 | 203,221 | 227,217 | ||||||||
General and administrative expenses | 26,286 | 26,028 | 32,936 | ||||||||
Provision for doubtful accounts | 1,763 | 2,344 | 3,952 | ||||||||
Depreciation and amortization | 4,729 | 8,049 | 7,322 | ||||||||
Goodwill and intangible asset impairments | — | 20,249 | 21,438 | ||||||||
Arena Towers litigation reserve | 17,278 | 1,100 | — | ||||||||
Total operating costs and expenses | 252,321 | 260,991 | 292,865 | ||||||||
Operating loss | (7,572 | ) | (21,452 | ) | (16,663 | ) | |||||
Interest expense | (761 | ) | (1,003 | ) | (2,925 | ) | |||||
Gain on extinguishment of debt | — | 1,716 | — | ||||||||
Loss from operations before taxes and equity in earnings (losses) | (8,333 | ) | (20,739 | ) | (19,588 | ) | |||||
Federal and state income tax (provision) benefit | (1,127 | ) | 4,210 | (3,871 | ) | ||||||
Loss from operations before equity in earnings (losses) | (9,460 | ) | (16,529 | ) | (23,459 | ) | |||||
Equity in earnings (losses) from unconsolidated affiliates, net of taxes | 30 | (45 | ) | (449 | ) | ||||||
Net loss | (9,430 | ) | (16,574 | ) | (23,908 | ) | |||||
Net loss applicable to noncontrolling interest | 58 | 125 | — | ||||||||
Net loss applicable to TRC Companies, Inc. | (9,372 | ) | (16,449 | ) | (23,908 | ) | |||||
Accretion charges on preferred stock | (7,261 | ) | (6,431 | ) | (215 | ) | |||||
Net loss applicable to TRC Companies, Inc.'s common shareholders | $ | (16,633 | ) | $ | (22,880 | ) | $ | (24,123 | ) | ||
Basic and diluted loss per common share | $ | (0.69 | ) | $ | (1.17 | ) | $ | (1.25 | ) | ||
Basic and diluted weighted-average common shares outstanding | 24,107 | 19,548 | 19,272 | ||||||||
See accompanying notes to consolidated financial statements.
45
TRC Companies, Inc.
CONSOLIDATED BALANCE SHEETS
In thousands, except share data
June 30, 2011 | June 30, 2010 | ||||||
ASSETS | |||||||
Current assets: | |||||||
Cash and cash equivalents | $ | 10,829 | $ | 14,709 | |||
Accounts receivable, less allowance for doubtful accounts | 89,258 | 87,104 | |||||
Insurance recoverable - environmental remediation | 30,827 | 35,664 | |||||
Restricted investments | 12,413 | 14,744 | |||||
Prepaid expenses and other current assets | 9,878 | 9,123 | |||||
Income taxes refundable | 209 | 388 | |||||
Total current assets | 153,414 | 161,732 | |||||
Property and equipment: | |||||||
Land and building | 480 | 480 | |||||
Equipment, furniture and fixtures | 43,093 | 41,946 | |||||
Leasehold improvements | 4,902 | 4,861 | |||||
48,475 | 47,287 | ||||||
Less accumulated depreciation and amortization | (36,825 | ) | (35,535 | ) | |||
Property and equipment, net | 11,650 | 11,752 | |||||
Goodwill | 20,886 | 14,870 | |||||
Investments in and advances to unconsolidated affiliates and construction joint ventures | 111 | 117 | |||||
Long-term restricted investments | 38,753 | 46,426 | |||||
Long-term prepaid insurance | 37,410 | 44,529 | |||||
Other assets | 13,836 | 8,369 | |||||
Total assets | $ | 276,060 | $ | 287,795 | |||
LIABILITIES AND EQUITY | |||||||
Current liabilities: | |||||||
Current portion of long-term debt | $ | 3,139 | $ | 3,629 | |||
Accounts payable | 26,510 | 35,871 | |||||
Accrued compensation and benefits | 28,252 | 22,393 | |||||
Deferred revenue | 22,709 | 26,486 | |||||
Environmental remediation liabilities | 505 | 623 | |||||
Other accrued liabilities | 59,718 | 43,781 | |||||
Total current liabilities | 140,833 | 132,783 | |||||
Non-current liabilities: | |||||||
Long-term debt, net of current portion | 6,037 | 5,815 | |||||
Income taxes payable | 4,912 | 4,149 | |||||
Deferred revenue | 88,865 | 102,452 | |||||
Environmental remediation liabilities | 5,741 | 6,404 | |||||
Total liabilities | 246,388 | 251,603 | |||||
Preferred stock, $.10 par value; 500,000 shares authorized, 7,209 shares issued and outstanding as convertible, liquidation preference value of $22,277 as of June 30, 2010 | — | 8,239 | |||||
Commitments and contingencies | |||||||
Equity: | |||||||
Common stock, $.10 par value; 40,000,000 shares authorized, 27,303,774 and 27,300,292 shares issued and outstanding, respectively, at June 30, 2011, and 19,637,535 and 19,634,053 shares issued and outstanding, respectively, at June 30, 2010 | 2,730 | 1,964 | |||||
Additional paid-in capital | 173,984 | 163,897 | |||||
Accumulated deficit | (147,255 | ) | (137,883 | ) | |||
Accumulated other comprehensive income | 429 | 133 | |||||
Treasury stock, at cost | (33 | ) | (33 | ) | |||
Total shareholders' equity applicable to TRC Companies, Inc. | 29,855 | 28,078 | |||||
Noncontrolling interest | (183 | ) | (125 | ) | |||
Total equity | 29,672 | 27,953 | |||||
Total liabilities and equity | $ | 276,060 | $ | 287,795 | |||
See accompanying notes to consolidated financial statements.
46
TRC Companies, Inc.
CONSOLIDATED STATEMENTS OF CASH FLOWS
In thousands
Years ended June 30, | 2011 | 2010 | 2009 | ||||||||
Cash flows from operating activities: | |||||||||||
Net loss | $ | (9,430 | ) | $ | (16,574 | ) | $ | (23,908 | ) | ||
Adjustments to reconcile net loss to net cash provided by operating activities: | |||||||||||
Non-cash items: | |||||||||||
Depreciation and amortization | 4,729 | 8,049 | 7,322 | ||||||||
Stock-based compensation expense | 2,533 | 1,917 | 2,256 | ||||||||
Provision for doubtful accounts | 1,763 | 2,344 | 3,952 | ||||||||
Arena Towers litigation reserve | 17,278 | 1,100 | — | ||||||||
Equity in losses from unconsolidated affiliates and construction joint ventures | 49 | 50 | 2,000 | ||||||||
Goodwill and intangible asset impairments | — | 20,249 | 21,438 | ||||||||
Gain on extinguishment of debt | — | (1,716 | ) | — | |||||||
Other non-cash items | (333 | ) | 419 | 741 | |||||||
Changes in operating assets and liabilities: | |||||||||||
Accounts receivable | 4,479 | 10,455 | 15,591 | ||||||||
Insurance recoverable - environmental remediation | 4,837 | (8,285 | ) | (18,351 | ) | ||||||
Income taxes | 923 | (2,094 | ) | 5,477 | |||||||
Restricted investments | 8,549 | 19,274 | 24,836 | ||||||||
Prepaid expenses and other current assets | (822 | ) | 1,994 | (1,564 | ) | ||||||
Long-term prepaid insurance | 7,119 | 3,237 | 3,315 | ||||||||
Other assets | 116 | 227 | (70 | ) | |||||||
Accounts payable | (11,449 | ) | (8,243 | ) | (11,417 | ) | |||||
Accrued compensation and benefits | 4,944 | (7,454 | ) | 4,795 | |||||||
Deferred revenue | (18,776 | ) | (14,754 | ) | (24,315 | ) | |||||
Environmental remediation liabilities | (781 | ) | (1,072 | ) | (1,343 | ) | |||||
Other accrued liabilities | (3,191 | ) | 1,954 | 10,199 | |||||||
Net cash provided by operating activities | 12,537 | 11,077 | 20,954 | ||||||||
Cash flows from investing activities: | |||||||||||
Additions to property and equipment | (3,058 | ) | (3,362 | ) | (3,816 | ) | |||||
Restricted investments | 1,867 | 1,334 | 1,627 | ||||||||
Acquisition of businesses | (13,950 | ) | (100 | ) | — | ||||||
Earnout payments on acquisitions | (77 | ) | (656 | ) | (110 | ) | |||||
Proceeds from sale of fixed assets | 117 | 126 | 133 | ||||||||
Investments in and advances to unconsolidated affiliates | (14 | ) | (19 | ) | (41 | ) | |||||
Land improvements | — | — | (6 | ) | |||||||
Purchases of marketable securities | (6,171 | ) | — | — | |||||||
Maturities and sales of marketable securities | 6,171 | — | — | ||||||||
Net cash used in investing activities | (15,115 | ) | (2,677 | ) | (2,213 | ) | |||||
Cash flows from financing activities: | |||||||||||
Net repayments under revolving credit facility | — | — | (26,996 | ) | |||||||
Payments on long-term debt and other | (3,574 | ) | (4,244 | ) | (118 | ) | |||||
Proceeds from long-term debt and other | 2,559 | 2,485 | — | ||||||||
Payments of issuance costs related to convertible preferred stock | — | (134 | ) | (75 | ) | ||||||
Shares repurchased to settle tax withholding obligations | (277 | ) | (267 | ) | — | ||||||
Proceeds from issuance of convertible preferred stock | — | — | 15,500 | ||||||||
Proceeds from exercise of stock option and warrants | (10 | ) | — | 111 | |||||||
Net cash used in financing activities | (1,302 | ) | (2,160 | ) | (11,578 | ) | |||||
Decrease in cash and cash equivalents | (3,880 | ) | 6,240 | 7,163 | |||||||
Cash and cash equivalents, beginning of period | 14,709 | 8,469 | 1,306 | ||||||||
Cash and cash equivalents, end of period | $ | 10,829 | $ | 14,709 | $ | 8,469 | |||||
Supplemental cash flow information: | |||||||||||
Interest paid | $ | 875 | $ | 990 | $ | 2,800 | |||||
Income taxes paid (refunded) | 656 | (2,354 | ) | (747 | ) | ||||||
Capital expenditures included in accounts payable | 446 | 176 | 168 | ||||||||
Issuance of common stock | 331 | 182 | — | ||||||||
Conversion of preferred stock to common stock | 15,500 | — | — | ||||||||
Beneficial conversion feature charge related to convertible preferred stock | — | — | 13,698 | ||||||||
Net settlement of amount due to/from construction joint venture | — | — | 4,756 | ||||||||
See accompanying notes to consolidated financial statements.
47
TRC Companies, Inc.
CONSOLIDATED STATEMENTS OF CHANGES IN EQUITY
In thousands, except share data
Common Stock | Additional Paid-in Capital | Retained Earnings (Accumulated Deficit) | Accumulated Other Comprehensive Income (Loss) | Treasury Stock | Total TRC Shareholders' Equity | Non- Controlling Interest | |||||||||||||||||||||||||||||||
Number of Shares | Amount | Number of Shares | Amount | Total Equity | |||||||||||||||||||||||||||||||||
Balance, June 30, 2008 | 19,093,555 | $ | 1,909 | $ | 153,259 | $ | (97,526 | ) | $ | 62 | 3,482 | $ | (33 | ) | $ | 57,671 | $ | — | $ | 57,671 | |||||||||||||||||
Net loss | — | — | — | (24,123 | ) | — | — | — | (24,123 | ) | — | (24,123 | ) | ||||||||||||||||||||||||
Unrealized losses on available for sale securities | — | — | — | — | (367 | ) | — | — | (367 | ) | — | (367 | ) | ||||||||||||||||||||||||
Total comprehensive loss | (24,490 | ) | — | (24,490 | ) | ||||||||||||||||||||||||||||||||
Exercise of stock options | 40,500 | 4 | 107 | — | — | — | — | 111 | — | 111 | |||||||||||||||||||||||||||
Beneficial conversion feature charge related to convertible preferred stock | — | — | 13,698 | — | — | — | — | 13,698 | — | 13,698 | |||||||||||||||||||||||||||
Accretion charges on preferred stock | — | — | (215 | ) | 215 | — | — | — | — | — | — | ||||||||||||||||||||||||||
Warrants | — | — | (656 | ) | — | — | — | — | (656 | ) | — | (656 | ) | ||||||||||||||||||||||||
Stock-based compensation | 200,868 | 20 | 2,236 | — | — | — | — | 2,256 | — | 2,256 | |||||||||||||||||||||||||||
Shares repurchased to settle tax withholding obligations | (14,804 | ) | (1 | ) | (72 | ) | — | — | — | — | (73 | ) | — | (73 | ) | ||||||||||||||||||||||
Directors' deferred compensation | 37,454 | 4 | 102 | — | — | — | — | 106 | — | 106 | |||||||||||||||||||||||||||
Balance, June 30, 2009 | 19,357,573 | $ | 1,936 | $ | 168,459 | $ | (121,434 | ) | $ | (305 | ) | 3,482 | $ | (33 | ) | $ | 48,623 | $ | — | $ | 48,623 | ||||||||||||||||
Net loss | — | — | — | (16,449 | ) | — | — | — | (16,449 | ) | (125 | ) | (16,574 | ) | |||||||||||||||||||||||
Unrealized gain on available for sale securities | — | — | — | — | 438 | — | — | 438 | — | 438 | |||||||||||||||||||||||||||
Total comprehensive loss | (16,011 | ) | (125 | ) | (16,136 | ) | |||||||||||||||||||||||||||||||
Issuance of common stock | 47,998 | 5 | 177 | — | — | — | — | 182 | — | 182 | |||||||||||||||||||||||||||
Accretion charges on preferred stock | — | — | (6,431 | ) | — | — | — | — | (6,431 | ) | — | (6,431 | ) | ||||||||||||||||||||||||
Stock-based compensation | 283,763 | 28 | 1,889 | — | — | — | — | 1,917 | — | 1,917 | |||||||||||||||||||||||||||
Shares repurchased to settle tax withholding obligations | (71,324 | ) | (7 | ) | (260 | ) | — | — | — | — | (267 | ) | — | (267 | ) | ||||||||||||||||||||||
Directors' deferred compensation | 19,525 | 2 | 63 | — | — | — | — | 65 | — | 65 | |||||||||||||||||||||||||||
Balance, June 30, 2010 | 19,637,535 | $ | 1,964 | $ | 163,897 | $ | (137,883 | ) | $ | 133 | 3,482 | $ | (33 | ) | $ | 28,078 | $ | (125 | ) | $ | 27,953 | ||||||||||||||||
Net income (loss) | — | — | — | (9,372 | ) | — | — | — | (9,372 | ) | (58 | ) | (9,430 | ) | |||||||||||||||||||||||
Unrealized gain on available for sale securities | — | — | — | — | 296 | — | — | 296 | — | 296 | |||||||||||||||||||||||||||
Total comprehensive income (loss) | (9,076 | ) | (58 | ) | (9,134 | ) | |||||||||||||||||||||||||||||||
Issuance of common stock in connection with businesses acquired | 79,787 | 8 | 323 | — | — | — | — | 331 | — | 331 | |||||||||||||||||||||||||||
Accretion charges on preferred stock | — | — | (7,261 | ) | — | — | — | — | (7,261 | ) | — | (7,261 | ) | ||||||||||||||||||||||||
Stock-based compensation | 465,281 | 46 | 2,487 | — | — | — | — | 2,533 | — | 2,533 | |||||||||||||||||||||||||||
Shares repurchased to settle tax withholding obligations | (99,518 | ) | (10 | ) | (267 | ) | — | — | — | — | (277 | ) | — | (277 | ) | ||||||||||||||||||||||
Directors' deferred compensation | 11,387 | 1 | 36 | — | — | — | — | 37 | — | 37 | |||||||||||||||||||||||||||
Preferred stock conversion | 7,209,302 | 721 | 14,779 | — | — | — | — | 15,500 | — | 15,500 | |||||||||||||||||||||||||||
Cash paid related to option exchange | — | — | (10 | ) | — | — | — | — | (10 | ) | — | (10 | ) | ||||||||||||||||||||||||
Balance, June 30, 2011 | 27,303,774 | $ | 2,730 | $ | 173,984 | $ | (147,255 | ) | $ | 429 | 3,482 | $ | (33 | ) | $ | 29,855 | $ | (183 | ) | $ | 29,672 | ||||||||||||||||
See accompanying notes to consolidated financial statements.
48
NOTES TO CONSOLIDATED FINANCIAL STATEMENTS
In thousands, except per share data
Note 1. Company Background and Basis of Presentation
TRC Companies, Inc., through its subsidiaries (collectively, the “Company”), provides integrated engineering, consulting, and construction management services. Its project teams assist its commercial and governmental clients implement environmental, energy and infrastructure projects from initial concept to delivery and operation. The Company provides its services almost entirely in the United States of America
The Company reported net losses applicable to the Company's common shareholders of $16,633, $22,880 and $24,123 for fiscal years 2011, 2010 and 2009, respectively. During fiscal year 2011, the Company incurred a $17,278 charge relating to the Arena Towers litigation reserve and $7,261 of accretion charges related to preferred stock. A significant portion of the net losses in the fiscal years 2010 and 2009 are the result of non-cash charges related to asset impairments and accretion charges on preferred stock. The preferred stock converted to common stock on December 1, 2010, and, as of that date, no further preferred stock accretion charges will be recorded. Although we have incurred net losses in these periods we have generated cash from operations of $12,537, $11,077 and $20,954 in fiscal years 2011, 2010 and 2009, respectively. The Company has a revolving credit facility with a maturity date of July 17, 2013 under which no amounts were outstanding as of June 30, 2011 and $31,232 was available for borrowings. The Company will continue to focus on improving operating profitability and cash flows from operations through reductions in general and administrative expenses and cost of services. The Company believes that existing cash resources, cash forecasted to be generated from operations and availability under its credit facility are adequate to meet its requirements for the duration of the credit facility and the foreseeable future.
The consolidated financial statements include all the accounts of TRC Companies, Inc., its wholly-owned subsidiaries and Center Avenue Holdings, LLC (“CAH”), a variable interest entity (“VIE”) of which the Company is the primary beneficiary (see Note 12). All intercompany balances and transactions have been eliminated in consolidation.
In February and June 2011, the Company completed the acquisitions of Alexander Utility Engineering, Inc. (“AUE”) and the Environmental Business Unit (“RMT-EBU”) of RMT, Inc., a subsidiary of Alliant Energy , respectively. For a complete discussion see Note 9.
Note 2. Summary of Significant Accounting Policies and New Accounting Pronouncements
Revenue Recognition: The Company recognizes contract revenue in accordance with Accounting Standards Codification ("ASC") Topic 605, Revenue Recognition ("ASC Topic 605"). Specifically, the Company follows the guidance in ASC Subtopic 605-35, Revenue Recognition—Construction-Type and Production-Type Contracts.
Fixed-Price Contracts
The Company recognizes revenue on fixed-price contracts using the percentage-of-completion method. Under this method of revenue recognition, the Company estimates the progress towards completion to determine the amount of revenue and profit to recognize on all significant contracts. The Company generally utilizes an efforts-expended, cost-to-cost approach in applying the percentage-of-completion method under which revenue is earned in proportion to total costs incurred divided by total costs expected to be incurred.
Under the percentage-of-completion method, recognition of profit is dependent upon the accuracy of a variety of estimates including engineering progress, materials quantities, achievement of milestones and other incentives, liquidated-damages provisions, labor productivity and cost estimates. Such estimates are based on various judgments the Company makes with respect to those factors and can be difficult to accurately determine until the project is significantly underway. Due to uncertainties inherent in the estimation process, actual completion costs often vary from estimates. If estimated total costs on any contract indicate a loss, the Company charges the entire estimated loss to operations in the period the loss first becomes known. If actual costs exceed the original fixed contract price, recognition of any additional revenue will be pursuant to a change order, contract modification, or claim.
The Company has fixed-price Exit Strategy contracts to remediate environmental conditions at contaminated sites. Under most Exit Strategy contracts, the majority of the contract price is deposited by the client into a restricted account with an insurer. The funds in the restricted account are held by the insurer and used to pay the Company as work is performed. The arrangement with the insurer provides for the deposited funds to earn interest at the one-year constant maturity U.S. Treasury Bill rate. The interest is recorded when earned and reported as interest income from contractual arrangements on the Company's consolidated statements of operations.
49
NOTES TO CONSOLIDATED FINANCIAL STATEMENTS (Continued)
In thousands, except per share data
Note 2. Summary of Significant Accounting Policies and New Accounting Pronouncements (Continued)
The Exit Strategy funds held by the insurer, including any interest growth earned thereon, are recorded as an asset (current and long-term restricted investment) on the Company's consolidated balance sheets, with a corresponding liability (current and long-term deferred revenue) related to the funds. Consistent with the Company's other fixed-price contracts, the Company recognizes revenue on Exit Strategy contracts using the percentage-of-completion method. When determining the extent of progress towards completion on Exit Strategy contracts, prepaid insurance premiums and fees are amortized, on a straight-line basis, to cost incurred over the life of the related insurance policy. Certain Exit Strategy contracts are classified as pertaining to either remediation or operation, maintenance and monitoring. In addition, certain Exit Strategy contracts are segmented such that the remediation and operation portion of the contract is separately accounted for from the maintenance and monitoring portion.
Under most Exit Strategy contracts, additional payments are made by the client to the insurer, typically through an insurance broker, for insurance premiums and fees for a policy to cover potential costs in excess of the original estimates and other factors such as third party liability. For Exit Strategy contracts where the Company establishes that (1) costs exceed the contract value and interest growth thereon and (2) such costs are covered by insurance, the Company will record an estimated insurance recovery up to the amount of insured costs. An insurance gain, that is, an amount to be recovered in excess of the Company's recorded costs, is not recognized until the receipt of insurance proceeds. Insurance recoveries are reported as insurance recoverables and other income on the Company's consolidated statements of operations. If estimated total costs on any contract indicate a loss, the Company charges the entire estimated loss to operations in the period the loss first becomes known.
Unit price contracts are a subset of fixed-price contracts. Under unit price contracts, the Company's clients pay a set fee for each unit of service or production. The Company recognizes revenue under unit price contracts as it completes the related service transaction for its clients. If the Company's costs per service transaction exceed original estimates, its profit margins will decrease, and it may realize a loss on the project unless it can receive payment for the additional costs.
Time-and-Materials Contracts
Under time-and-materials contracts the Company negotiates hourly billing rates and charges its clients based on the actual time that it expends on a project. In addition, clients reimburse the Company for actual out-of-pocket costs of materials and other direct reimbursable expenses that it incurs in connection with its performance under the contract. The Company's profit margins on time-and-materials contracts fluctuate based on actual labor and overhead costs that it directly charges or allocates to contracts compared to negotiated billing rates. Revenue on time-and-materials contracts is recognized based on the actual number of hours the Company spends on the projects plus any actual out-of-pocket costs of materials and other direct reimbursable expenses that it incurs on the projects.
Cost-Plus Contracts
Cost-Plus Fixed Fee Contracts. Under the Company's cost-plus fixed fee contracts it charges clients for its costs, including both direct and indirect costs, plus a fixed negotiated fee. In negotiating a cost-plus fixed fee contract the Company estimates all recoverable direct and indirect costs and then adds a fixed profit component. The total estimated cost plus the negotiated fee represents the total contract value. The Company recognizes revenue based on the actual labor and non-labor costs it incurs plus the portion of the fixed fee it has earned to date. The Company invoices for its services as revenue is recognized or in accordance with agreed upon billing schedules.
Cost-Plus Fixed Rate Contracts. Under the Company's cost-plus fixed rate contracts it charges clients for its costs plus negotiated rates based on its indirect costs. In negotiating a cost-plus fixed rate contract the Company estimates all recoverable direct and indirect costs and then adds a profit component, which is a percentage of total recoverable costs, to arrive at a total dollar estimate for the project. The Company recognizes revenue based on the actual total costs it has expended plus the applicable fixed rate. If the actual total costs are lower than the total costs the Company has estimated, its revenue from that project will be lower than originally estimated.
Change Orders/Claims
Change orders are modifications of an original contract that change the provisions of the contract. Change orders typically result from changes in scope, specifications or design, manner of performance, facilities, equipment, materials, sites, or period of completion of the work. Claims are amounts in excess of the agreed contract price that the Company seeks to collect from its clients or others for client-caused delays, errors in specifications and designs, contract terminations, change orders that are
50
NOTES TO CONSOLIDATED FINANCIAL STATEMENTS (Continued)
In thousands, except per share data
Note 2. Summary of Significant Accounting Policies and New Accounting Pronouncements (Continued)
either in dispute or are unapproved as to both scope and price, or other causes.
Costs related to change orders and claims are recognized when they are incurred. Change orders are included in total estimated contract revenue when it is probable that the change order will result in a bona fide addition to contract value and can be reliably estimated. Claims are included in total estimated contract revenues only to the extent that contract costs related to the claims have been incurred and when it is probable that the claim will result in a bona fide addition to contract value which can be reliably estimated. No profit is recognized on claims until final settlement occurs. For the fiscal years ending June 30, 2011, 2010 and 2009, the Company did not recognize any revenue related to claims.
Other Contract Matters
Federal Acquisition Regulations ("FAR"), which are applicable to the Company's federal government contracts and may be incorporated in many local and state agency contracts, limit the recovery of certain specified indirect costs on contracts. Cost-plus contracts covered by FAR or with certain state and local agencies also require an audit of actual costs and provide for upward or downward adjustments if actual recoverable costs differ from billed recoverable costs. Most of the Company's federal government contracts are subject to termination at the discretion of the client. Contracts typically provide for reimbursement of costs incurred and payment of fees earned through the date of such termination.
Contracts with the federal government are subject to audit, primarily by the Defense Contract Audit Agency ("DCAA"), which reviews the Company's overhead rates, operating systems and cost proposals. During the course of its audits, the DCAA may disallow costs if it determines that the Company has accounted for such costs in a manner inconsistent with Cost Accounting Standards or FAR. The Company's last audit was for fiscal year 2004 and resulted in a $14 adjustment. Incurred cost proposals have been submitted to DCAA for fiscal years 2005 through 2010, and are pending DCAA audit. Historically the Company has not had any material cost disallowances by the DCAA as a result of audit, however there can be no assurance that DCAA audits will not result in material cost disallowances in the future.
Allowance for Doubtful Accounts—An allowance for doubtful accounts is maintained for estimated losses resulting from the failure of the Company's clients to make required payments. The allowance for doubtful accounts has been determined through reviews of specific amounts deemed to be uncollectible and estimated write-offs as a result of clients who have filed for bankruptcy protection plus an allowance for other amounts for which some loss is determined to be probable based on current circumstances. If the financial condition of clients or the Company's assessment as to collectability were to change, adjustments to the allowances may be required.
Stock-Based Compensation—The Company accounts for stock-based awards in accordance with ASC Topic 718, Compensation—Stock Compensation ("ASC Topic 718"), which requires the measurement and recognition of compensation expense for all stock-based awards made to the Company's employees and directors including stock options, restricted stock, and other stock-based awards based on estimated fair values.
The Company measures stock-based compensation cost at the grant date based on the fair value of the award. The value of the portion of the award that is ultimately expected to vest is recognized as expense over the requisite service periods in the Company's consolidated statements of operations. Stock-based compensation expense includes the estimated effects of forfeitures, and estimates of forfeitures will be adjusted over the requisite service period to the extent actual forfeitures differ, or are expected to differ, from such estimates. Changes in estimated forfeitures will be recognized in the period of change and will also impact the amount of expense to be recognized in future periods. Total stock-based compensation expense for fiscal years 2011, 2010 and 2009, was $2,533, $1,917 and $2,256, respectively, which consisted of stock-based compensation expense related to stock option awards, restricted stock awards, restricted stock units and performance stock units. There were no stock options exercised during fiscal years 2011 and 2010. For fiscal year 2009, stock options of 41 shares of the Company's common stock were exercised for proceeds of $111.
The Company uses the Black-Scholes option pricing model for determining the estimated grant date fair value for stock options. The fair value is then amortized on a straight-line basis over the requisite service periods of the awards, which is generally the vesting period. Use of a valuation model requires management to make certain assumptions with respect to selected model inputs. The risk-free interest rate assumption is based upon observed interest rates appropriate for the expected life of the Company's employee stock options. The average expected life is based on the contractual term of the option and expected employee exercise and historical post-vesting employment termination experience. The Company estimates the volatility of its stock using historical volatility in accordance with current accounting guidance. Management determined that historical volatility of TRC Companies, Inc. stock is most reflective of market conditions and the best indicator of expected
51
NOTES TO CONSOLIDATED FINANCIAL STATEMENTS (Continued)
In thousands, except per share data
Note 2. Summary of Significant Accounting Policies and New Accounting Pronouncements (Continued)
volatility. The dividend yield assumption is based on the Company's historical and expected dividend payouts. The assumptions used to value stock options granted for fiscal years 2011, 2010 and 2009 are as follows:
Fiscal Year Ended June 30, | |||||
2011 | 2010 | 2009 | |||
Risk-free interest rate | 1.57% - 1.81% | 1.94% - 2.25% | 1.37% - 2.92% | ||
Expected life | 4.0 years | 4.0 years | 4.0 - 4.1 years | ||
Expected volatility | 76.6% - 77.0% | 72.9% - 75.3% | 50.3% - 72.5% | ||
Expected dividend yield | None | None | None | ||
Weighted-average fair value of options granted | $2.09 | $1.88 | $1.41 | ||
Income Taxes—The Company is required to estimate the provision for income taxes, including the current tax expense together with an assessment of temporary differences resulting from differing treatments of assets and liabilities for tax and financial accounting purposes. These differences between the financial statement and tax bases of assets and liabilities, together with net operating loss ("NOL") carryforwards and tax credits are recorded as deferred tax assets or liabilities on the consolidated balance sheets. An assessment is required to be made of the likelihood that the deferred tax assets will be recovered from future taxable income. To the extent that the Company determines that it is more likely than not that the deferred asset will not be utilized, a valuation allowance is established. Taxable income in future periods significantly above or below that projected will cause adjustments to the valuation allowance that could materially decrease or increase future income tax expense.
The Company recognizes the tax benefit from an uncertain tax position only if it is more likely than not that the tax position will be sustained on examination by the taxing authorities, based on the technical merits of the position. The tax benefits recognized in the financial statements from such a position are measured based on the largest benefit that has a greater than 50% likelihood of being realized upon ultimate settlement. Accounting literature also provides guidance on derecognition of income tax assets and liabilities, classification of current and deferred income tax assets and liabilities, accounting for interest and penalties associated with tax positions, and income tax disclosures. Judgment is required in assessing the future tax consequences of events that have been recognized in the Company's financial statements or tax returns. Variations in the actual outcome of these future tax consequences could materially impact the Company's financial statements.
Goodwill and Other Intangible Assets—In accordance with ASC Topic 350, Intangibles—Goodwill and Other, goodwill and intangible assets deemed to have indefinite lives are not amortized but are subject to impairment testing at least annually, or more frequently if events or changes in circumstances indicate that goodwill might be impaired. The Company performs impairment reviews for its reporting units utilizing valuation methods, including the discounted cash flow method, the guideline company approach, and the guideline transaction approach, as the best evidence of fair value. The valuation methodology used to estimate the fair value of the total Company and its reporting units requires inputs and assumptions (i.e. revenue growth, operating profit margins and discount rates) that reflect current market conditions. The estimated fair value of each reporting unit is compared to the carrying amount of the reporting unit, including goodwill. If the carrying value of the reporting unit exceeds its fair value, the goodwill of the reporting unit is potentially impaired, and the Company then determines the implied fair value of goodwill, which is compared to the carrying value of goodwill to determine if impairment exists.
Since the adoption of ASC Topic 350, the Company's annual impairment review of goodwill had been completed at the end of the second quarter of each fiscal year. On December 24, 2010 the Company changed its accounting policy whereby the annual impairment review of goodwill will be performed as of each fiscal April month-end instead of the end of the second quarter of each fiscal year. This date coincides with the interim impairment analysis of goodwill for all reporting units with goodwill that was completed as of April 26, 2010. The change in the annual goodwill impairment testing date coincides with the Company's annual preparation of long range projections (budgets and forecasts), which are a significant component utilized in the goodwill impairment analysis. Accordingly, the Company believes the change in the annual impairment testing date is preferable in the circumstances. The change in the Company's annual goodwill impairment testing date is not intended to, nor does it delay, accelerate or avoid an impairment charge. As it was impracticable to objectively determine long range projection and valuation estimates as of each fiscal April month-end for fiscal years ending on or prior to June 30, 2009, the Company has retrospectively applied the change in annual impairment testing date to the start of the fiscal year beginning July 1, 2009.
Other intangible assets are included in other assets and consist primarily of purchased customer relationships and other
52
NOTES TO CONSOLIDATED FINANCIAL STATEMENTS (Continued)
In thousands, except per share data
Note 2. Summary of Significant Accounting Policies and New Accounting Pronouncements (Continued)
intangible assets acquired in acquisitions. The costs of intangible assets with determinable useful lives are amortized on a straight-line basis over the estimated periods benefited. The Company reviews the economic lives of its intangible assets annually.
Management judgment and assumptions are required in performing the impairment tests for all reporting units with goodwill and in measuring the fair value of goodwill, indefinite-lived intangibles and long-lived assets. While the Company believes its judgments and assumptions are reasonable, different assumptions could change the estimated fair values or the amount of the recognized impairment losses.
Preferred Stock—The Company applies the guidance in ASC Topic 480, Distinguishing Liabilities from Equity ("ASC Topic 48"), and Accounting Standards Update ("ASU") 2009-04, Accounting for Redeemable Equity Instruments ("ASU 2009-04"),when determining the classification and measurement of preferred stock. Preferred shares subject to mandatory redemption are classified as liability instruments and are measured at fair value in accordance with ASC Topic 480. The Company does not have any preferred shares subject to mandatory redemption. Preferred shares not subject to ASC Topic 480 are subject to the classification and measurement principles of ASU 2009-04. In accordance with ASU 2009-04, the Company classified its convertible preferred stock, which is subject to redemption upon the occurrence of a liquidation or sale, events not solely within the Company's control, as temporary equity. Because a liquidation or sale was not probable as of June 30, 2010, an adjustment from the preferred stock's carrying amount to the redemption amount was not required. The preferred stock converted to common stock on December 1, 2010 and therefore as of June 30, 2011 was not subject to the classification and measurement principles of ASU 2009-04.
At June 30, 2010, the Company evaluated whether or not its convertible preferred stock contained embedded conversion features that meet the definition of derivatives under ASC Topic 815, Derivatives and Hedging, and related interpretations. ASC Subtopic 815-15 states that an embedded derivative instrument shall be separated from the host contract and accounted for as a derivative instrument pursuant to the statement if certain criteria are met. The Company's convertible preferred stock did not contain embedded conversion features requiring bifurcation from the host.
Property and Equipment—Property and equipment are recorded at cost, including costs to bring the equipment into operation. Major improvements to and betterments that extend the useful life of existing equipment are capitalized. Maintenance and repairs are charged to expense as incurred. The Company provides for depreciation of property and equipment using the straight-line method over estimated useful lives of the assets as follows:
Asset Category | Estimated Useful Life | |
Building | 30 years | |
Equipment, furniture and fixtures | 3 - 10 years | |
Leasehold improvements | Shorter of remaining life of lease or 7 years | |
In accordance with ASC Topic 360, Property, Plant and Equipment, the Company periodically evaluates whether events or circumstances have occurred that indicate that long-lived assets may not be recoverable or that the remaining useful life may warrant revision. When such events or circumstances are present, the Company assesses the recoverability of long-lived assets by determining whether the carrying value will be recovered through the expected undiscounted future cash flows resulting from the use of the asset. In the event the sum of the expected undiscounted future cash flows is less than the carrying value of the asset, an impairment loss equal to the excess of the asset's carrying value over its fair value is recorded. The long-term nature of these assets requires the estimation of cash inflows and outflows several years into the future.
Consolidation—The consolidated financial statements include the Company and its wholly-owned subsidiaries after elimination of intercompany accounts and transactions. The Company determines whether it has a controlling financial interest in an entity by first evaluating whether the entity is a voting interest entity or a variable interest entity ("VIE") under generally accepted accounting principles.
Voting Interest Entities. Voting interest entities are entities in which the total equity investment at risk is sufficient to enable each entity to finance itself independently and provides the equity holders with the obligation to absorb losses, the right to receive residual returns and the right or power to make decisions about or direct the entity's activities that most significantly impact the entity's economic performance. Voting interest entities, where the Company has a majority interest, are consolidated in accordance with ASC Topic 810, Consolidations (“ASC Topic 810”). ASC Topic 810 states that the usual condition for a
53
NOTES TO CONSOLIDATED FINANCIAL STATEMENTS (Continued)
In thousands, except per share data
Note 2. Summary of Significant Accounting Policies and New Accounting Pronouncements (Continued)
controlling financial interest in an entity is ownership of a majority voting interest. Accordingly, the Company consolidates voting interest entities in which it has all, or a majority of, the voting interests.
Variable Interest Entities ("VIE's"). VIE's are entities that lack one or more of the characteristics of a voting interest entity. A controlling financial interest in a VIE is present when an enterprise has a variable interest, or a combination of variable interests, that will absorb a majority of the VIE's expected losses, receive a majority of the VIE's expected residual returns, or both. The enterprise with a controlling financial interest, known as the primary beneficiary, consolidates the VIE. In accordance with ASC Topic 810, the Company consolidates all VIEs of which it is the primary beneficiary.
The Company determines whether it is the primary beneficiary of a VIE by performing a qualitative analysis of the VIE that includes, among other factors, a review of its capital structure, contractual terms, which interests create or absorb variability, related party relationships and the design of the VIE.
Equity-Method Investments. When the Company does not have a controlling financial interest in an entity but exerts significant influence over the entity's operating and financial policies (generally defined as owning a voting interest of 20% to 50% for a corporation or 3% to 50% for a partnership or Limited Liability Company) and has an investment in common stock or in-substance common stock, the Company accounts for its investment in accordance with the equity method of accounting prescribed by ASC Topic 323, Investments—Equity Method and Joint Ventures.
Insurance Matters, Litigation and Contingencies—In the normal course of business, the Company is subject to certain contractual guarantees and litigation. Generally, such guarantees relate to project schedules and performance. Most of the litigation involves the Company as a defendant in contractual disputes, professional liability, personal injury and other similar lawsuits. The Company maintains insurance coverage for various aspects of its business and operations, however the Company has elected to retain a portion of losses that may occur through the use of substantial deductibles, limits and retentions under our insurance programs. This practice may subject the Company to some future liability for which it is only partially insured or is completely uninsured. In accordance with ASC Topic 450, Contingencies,("ASC Topic 450") the Company records in its consolidated balance sheets amounts representing its estimated losses from claims and settlements when such losses are deemed probable and estimable. Otherwise, these losses are expensed as incurred. Costs of defense are generally expensed as incurred. The Company undertakes an overall assessment of risk and if the estimate of a probable loss is a range, and no amount within the range is a more reasonable estimate, the Company accrues the lower limit of the range. As additional information about current or future litigation or other contingencies becomes available, management will assess whether such information warrants the recording of additional expenses relating to those contingencies. Such additional expenses could potentially have a material impact on the Company's results of operations and financial position.
Restricted Investments—Current and long-term restricted investments relate primarily to the Company's Exit Strategy contracts. Under the terms of the majority of Exit Strategy contracts, the contract proceeds are paid by the client to an insurer at inception. A portion of these proceeds, generally five to ten percent, are remitted to the Company. The balance of contract proceeds, less any insurance premiums and fees for a policy to cover potential cost overruns and other factors, are deposited into a restricted investment account with the insurer and are used to pay the Company as services are performed. Upon expiration of the related insurance policies, any remaining funds are remitted to the Company as provided in the policy. The deposited funds are recorded as restricted investments with a corresponding amount shown as deferred revenue on the Company's consolidated balance sheets. The current portion of the restricted investments represents the amount the Company estimates it will collect from the insurer over the next year.
As of June 30, 2011 and 2010, $43,585 and $52,564, respectively, of the restricted investments represent deposits which earn interest at the one-year constant maturity U.S. Treasury Bill rate, which rate is reset on the anniversary of each policy. As of June 30, 2011 and 2010 the one-year constant maturity U.S. Treasury Bill rate for such deposits ranged from 0.19% to 0.47% and from 0.32% to 2.12% respectively.
Properties Available for Sale—Included in other assets are certain properties acquired in connection with certain Exit Strategy contracts that are available for sale in the amounts of $6,844 and $6,836 as of June 30, 2011 and 2010, respectively. The properties were recorded at fair value upon acquisition.
In cases where the Company does not expect to recover its carrying costs on properties available for sale, the Company reduces its carrying value to the fair value less costs to sell. During fiscal years 2011, 2010 and 2009, no impairment losses were recognized.
54
NOTES TO CONSOLIDATED FINANCIAL STATEMENTS (Continued)
In thousands, except per share data
Note 2. Summary of Significant Accounting Policies and New Accounting Pronouncements (Continued)
Capitalized Software—Internally used software, whether purchased or developed, is capitalized and amortized using the straight-line group method over its estimated useful life. In accordance with ASC Subtopic 350-40, Internal-Use Software, the Company capitalizes certain costs associated with software such as costs of employees devoting time to the projects and external direct costs for materials and services. Costs associated with internally developed software to be used internally are expensed until the point at which the project has reached the development stage. Subsequent additions, modifications or upgrades to internal-use software are capitalized only to the extent that they allow the software to perform a task it previously did not perform. Software maintenance and training costs are expensed in the period in which they are incurred. The capitalization of software requires judgment in determining when a project has reached the development stage and the period over which the Company expects to benefit from the use of that software. The Company reviews the economic lives of its capitalized software annually. During fiscal years 2011, 2010 and 2009, capitalized software was amortized over three to five years.
Leases and Lease Financing Obligations—The Company accounts for leases in accordance with ASC Topic 840, Leases. For lease agreements that provide for escalating rent payments and rent holidays, the Company recognizes rent expense on a straight-line basis over the non-cancellable lease term and option renewal periods where failure to exercise such options would result in an economic penalty such that renewal appears, at the inception of the lease, to be reasonably assured. The lease term commences when the Company becomes obligated under the terms of the lease agreement.
ASC Subtopic 840-40-55, Sale-Leaseback Transactions ("ASC Subtopic 840-40-55"), is applied if the Company pays or can be required to pay any portion of construction costs generally associated with tenant improvement costs. ASC Subtopic 840-40-55 requires the Company to be considered the owner, for accounting purposes, of the tenant improvements. Accordingly, the Company records a construction-in-process asset for the tenant improvements with an offsetting lease finance obligation which is included in current and long-term debt in the Company's consolidated balance sheets. These leases typically do not qualify for sale-leaseback treatment in accordance with ASC Subtopic 840-40-55 generally due to the Company's continuing involvement with the property. As a result, the tenant improvements and associated lease financing obligations remain on the Company's consolidated balance sheets when construction is completed. The lease financing obligation is amortized over the lease term based on the payments designated in the lease agreement, and the tenant improvement assets are amortized on a straight line basis over the lesser of their useful lives or the lease term.
Self-Insurance Reserves—The Company is self-insured for certain losses related to workers' compensation and employee medical benefits. Costs for self-insurance claims are accrued based on known claims and historical experience. Management believes that it has adequately reserved for its self-insurance liability, which is capped through the use of stop-loss contracts with insurance companies. However, any significant variation of future claims from historical trends could cause actual results to differ from the amount recorded. Once the stop-loss limit is reached for a given loss, the Company records a recoverable based on the terms of the self-insured plans.
Environmental Remediation Liabilities—The Company records environmental remediation liabilities for properties available for sale. The environmental remediation liabilities are initially recorded at fair value. The liability is reduced for actual costs incurred in connection with the clean-up activities for each property. In accordance with ASC Topic 405, Liabilities, upon completion of the capital phase of the clean-up, the environmental remediation liability is adjusted to equal the fair value of the remaining operation, maintenance and monitoring activities to be performed for the properties. The reduction in the liability resulting from the completion of the capital phase is included in insurance recoverables and other income. During fiscal years 2011, 2010 and 2009, no such income was recorded.
If it is determined that the expected costs of the clean-up activities are greater than the remaining environmental remediation liability for a specific property, the environmental remediation liability is adjusted pursuant to ASC Topic 410 Asset Retirement and Environmental Obligations ("ASC Topic 410"). Environmental remediation liabilities recorded pursuant to ASC Topic 410 are discounted when the amount and timing of the clean-up activities can be reliably determined. As of June 30, 2011 and 2010, the environmental liability for one project was discounted as the amount and timing of the remaining monitoring activities could be reliably determined. A discount of $384 and $388 was calculated using a risk-free discount rate of 3.9% and 4.9% as of June 30, 2011 and 2010, respectively. Estimated remediation costs for clean-up activities are based on experience, site conditions and the remedy selected. The liability is regularly adjusted as estimates are revised and as clean-up proceeds. The undiscounted environmental liability as of June 30, 2011 and 2010 was $6,629 and $7,415, respectively.
Employee Benefit Plan—The Company has a 401(k) savings plan covering substantially all employees. The Company's matching formula has two components. The basic match is up to 50% of each Participant's first 4% of contributed
55
NOTES TO CONSOLIDATED FINANCIAL STATEMENTS (Continued)
In thousands, except per share data
Note 2. Summary of Significant Accounting Policies and New Accounting Pronouncements (Continued)
compensation, and the discretionary match of up to another 1% of contributed compensation is based on the Company's performance for the previous fiscal year. In fiscal years 2011, 2010 and 2009, the Company's contributions to the plan were approximately $3,594, $2,834 and $3,210, respectively. The Company does not provide post-employment or other post-retirement benefits.
Comprehensive Loss—The Company reports comprehensive loss in accordance with ASC Topic 220, Comprehensive Income. Comprehensive loss consists of net loss and other gains and losses affecting equity that are not the result of transactions with owners.
Earnings per Share—Upon issuance of the convertible preferred stock in June 2009, accounting guidance defining participating securities and the two class method of calculating EPS became applicable to the Company. The relevant guidance establishes standards regarding the computation of earnings (loss) per share by companies that have securities other than common stock that contractually entitle the holder to participate in dividends and earnings of the Company. The guidance also requires that earnings applicable to common shareholders for the period, after deduction of preferred stock dividends and accretion charges, be allocated between the common and preferred shareholders based on their respective rights to receive dividends. Basic earnings (loss) per share is then calculated by dividing the net income (loss) applicable to the Company's common shareholders by the weighted-average number of common shares outstanding.
Diluted EPS is computed using the treasury stock method for stock options, warrants, non-vested restricted stock awards and units, and non-vested performance stock units. The treasury stock method assumes conversion of all potentially dilutive shares of common stock with the proceeds from assumed exercises used to hypothetically repurchase stock at the average market price for the period. Diluted EPS is computed by dividing net income applicable to the Company by the weighted-average common shares and potentially dilutive common shares that were outstanding during the period.
For fiscal years 2011, 2010 and 2009, the Company reported a net loss applicable to common shareholders; therefore, the potentially dilutive shares are anti-dilutive and are excluded from the calculation of diluted earnings (loss) per share in accordance with ASC Topic 260, Earnings Per Share. The holders of the convertible preferred stock do not have a contractual obligation to share in the net losses of the Company, and, as such, the undistributed net losses for fiscal years 2011, 2010 and 2009 were not allocated to the convertible preferred stock. Because the effects are anti-dilutive, 7 preferred shares were excluded from the calculation of diluted EPS for each of fiscal years 2011, 2010 and 2009 (prior to conversion). The preferred stock converted to common stock on December 1, 2010, resulting in the inclusion of 4,205 shares in the basic weighted-average shares outstanding for the fiscal year ended June 30, 2011. Because the effects are anti-dilutive, 3,004 of the 7,209 common shares from the preferred stock conversion on December 1, 2010 were excluded from the calculation of diluted EPS for the fiscal year ended June 30, 2011. The number of outstanding stock options, warrants and non-vested restricted stock awards excluded from the diluted EPS calculations (as they were anti-dilutive) in fiscal years 2011, 2010 and 2009 were 2,655, 2,810 and 2,959, respectively.
The following table sets forth the computations of basic and diluted EPS for the fiscal years ended June 30:
2011 | 2010 | 2009 | |||||||||
Net loss applicable to TRC Companies, Inc. | $ | (9,372 | ) | $ | (16,449 | ) | $ | (23,908 | ) | ||
Accretion charges on preferred stock | (7,261 | ) | (6,431 | ) | (215 | ) | |||||
Net loss applicable to TRC Companies, Inc.'s common shareholders | $ | (16,633 | ) | $ | (22,880 | ) | $ | (24,123 | ) | ||
Weighted-average common shares outstanding | 24,107 | 19,548 | 19,272 | ||||||||
Net loss per common share | $ | (0.69 | ) | $ | (1.17 | ) | $ | (1.25 | ) | ||
Credit Risks—Financial instruments which subject the Company to credit risk consist primarily of cash, accounts receivable, restricted investments, insurance recoverables, investments in and advances to unconsolidated affiliates and construction joint ventures. The Company performs credit evaluations of its clients as required and maintains an allowance for estimated credit losses.
Fair Value of Financial Instruments—Cash and cash equivalents, accounts receivable, accounts payable, and accrued liabilities as reflected in the consolidated financial statements, approximate their fair values because of the short-term maturity of those instruments. The Company considers all highly liquid investments with original maturities of three months or less to be
56
NOTES TO CONSOLIDATED FINANCIAL STATEMENTS (Continued)
In thousands, except per share data
Note 2. Summary of Significant Accounting Policies and New Accounting Pronouncements (Continued)
cash equivalents. The carrying amounts of the Company's revolving credit facility and subordinated notes payable as of June 30, 2011 and 2010, approximate fair value because the interest rates on the instruments change with market interest rates or because of the short term nature of their maturities. The carrying amount of the Company's remaining notes payable as of June 30, 2011 and 2010 approximate fair value as either the fixed interest rates approximate current rates for these obligations or the remaining term is not significant.
Use of Estimates—The preparation of consolidated financial statements in conformity with generally accepted accounting principles in the United States ("U.S. GAAP") necessarily requires management to make estimates and assumptions that affect the reported amounts of assets and liabilities, disclosure of contingent assets and liabilities at the date of the financial statements, and the reported amounts of revenues and expenses during the reporting periods. Actual results could differ materially from those estimates.
New Accounting Pronouncements—In June 2011, the Financial Accounting Standards Board ("FASB") issued Accounting Standards Update ("ASU") 2011-05, Comprehensive Income (“ASU 2011-05”). ASU 2011-05 requires that all nonowner changes in shareholders' equity be presented either in a single continuous statement of comprehensive income or in two separate but consecutive statements. In the two-statement approach, the first statement should present total net income and its components followed consecutively by a second statement that should present total other comprehensive income, the components of other comprehensive income, and the total of comprehensive income. The adoption of ASU 2011-05 is effective for fiscal years beginning after December 15, 2011 and is therefore effective for the Company in fiscal year 2013 beginning July 1, 2012. The Company is currently evaluating presentation options of ASU 2011-05 on its financial statement presentation of comprehensive income.
In May 2011, the FASB issued guidance to amend the accounting and disclosure requirements on fair value measurements. The new guidance limits the highest-and-best-use measure to nonfinancial assets, permits certain financial assets and liabilities with offsetting positions in market or counterparty credit risks to be measured on a net basis, and provides guidance on the applicability of premiums and discounts. Additionally, the new guidance expands the disclosures on Level 3 inputs by requiring quantitative disclosure of the unobservable inputs and assumptions, as well as description of the valuation processes and the sensitivity of the fair value to changes in unobservable inputs. The new guidance will be effective for the Company beginning January 1, 2012. Other than requiring additional disclosures, the Company does not anticipate material impacts on its consolidated results of operations or financial condition upon adoption.
In December 2010, the FASB issued ASU 2010-28, an accounting pronouncement related to ASC Topic 350, Intangibles - Goodwill and Other (“ASC Topic 350”), which requires a company to consider whether there are any adverse qualitative factors indicating that an impairment may exist in performing step 2 of the impairment test for reporting units with zero or negative carrying amounts. The provisions of this pronouncement are effective for fiscal years, and interim periods within those years, beginning after December 15, 2010, with no early adoption. The Company will adopt this pronouncement for its fiscal year beginning July 1, 2011. The adoption of this pronouncement is not expected to have a material impact on the Company's consolidated results of operations or financial condition.
In December 2010, the FASB issued ASU 2010-29, Disclosure of Supplementary Pro Forma Information for Business Combinations (“ASU 2010-29”), which addresses diversity in practice about the interpretation of the pro forma revenue and earnings disclosure requirements for business combinations. The amendments in ASU 2010-29 specify that if a public entity presents comparative financial statements, the entity should disclose revenue and earnings of the combined entity as though the business combination(s) that occurred during the current year had occurred as of the beginning of the comparable prior annual reporting period only. The amendments in ASU 2010-29 also expand the supplemental pro forma disclosures to include a description of the nature and amount of material, nonrecurring pro forma adjustments directly attributable to the business combination included in the reported pro forma revenue and earnings. The amendments in ASU 2010-29 are effective prospectively for business combinations for which the acquisition date is on or after the beginning of the first annual reporting period beginning on or after December 15, 2010. If applicable, the Company will include the required disclosures for its fiscal year beginning July 1, 2011.
In January 2010, the FASB issued guidance to amend the disclosure requirements related to fair value measurements. The guidance requires the disclosure of roll forward activities on purchases, sales, issuance, and settlements of the assets and liabilities measured using significant unobservable inputs (Level 3 fair value measurements). The guidance will become effective for us with the reporting period beginning July 1, 2011. Other than requiring additional disclosures, the adoption of this new guidance will not have a material impact on the Company's consolidated results of operations or financial condition.
57
NOTES TO CONSOLIDATED FINANCIAL STATEMENTS (Continued)
In thousands, except per share data
Note 3. Fair Value Measurements
The Company's financial assets or liabilities are measured using inputs from the three levels of the fair value hierarchy. A financial asset or liability's classification within the hierarchy is determined based on the lowest level input that is significant to the fair value measurement. The three levels are as follows:
Level 1 Inputs—Unadjusted quoted prices in active markets that are accessible at the measurement date for identical, unrestricted assets or liabilities. Generally this includes debt and equity securities and derivative contracts that are traded on an active exchange market (i.e. New York Stock Exchange) as well as certain U.S. Treasury and U.S. Government and agency mortgage-backed securities that are highly liquid and are actively traded in over-the-counter markets.
Level 2 Inputs—Quoted prices for similar assets or liabilities in active markets; quoted prices for identical or similar assets or liabilities in inactive markets; or valuations based on models where the significant inputs are observable (e.g., interest rates, yield curves, credit risks, etc.) or can be corroborated by observable market data.
Level 3 Inputs—Valuations based on models where significant inputs are not observable. The unobservable inputs reflect the Company's own assumptions about the assumptions that market participants would use.
The following tables present the level within the fair value hierarchy at which the Company's financial assets are measured on a recurring basis as of June 30, 2011 and 2010.
Assets Measured at Fair Value on a Recurring Basis as of June 30, 2011
Level 1 | Level 2 | Level 3 | Total | ||||||||||||
Restricted investments: | |||||||||||||||
Mutual funds | $ | — | $ | 3,940 | $ | — | $ | 3,940 | |||||||
Certificates of deposit | — | 1,507 | — | 1,507 | |||||||||||
Municipal bonds | — | 827 | — | 827 | |||||||||||
Corporate bonds | — | 667 | — | 667 | |||||||||||
Money market accounts | 411 | — | — | 411 | |||||||||||
Total restricted investments | $ | 411 | $ | 6,941 | $ | — | $ | 7,352 | |||||||
Assets and Liabilities Measured at Fair Value on a Recurring Basis as of June 30, 2010
Level 1 | Level 2 | Level 3 | Total | ||||||||||||
Restricted investments: | |||||||||||||||
Mutual funds | $ | — | $ | 3,796 | $ | — | $ | 3,796 | |||||||
Certificates of deposit | — | 1,656 | — | 1,656 | |||||||||||
Corporate bonds | — | 667 | — | 667 | |||||||||||
Money market accounts | 1,927 | — | — | 1,927 | |||||||||||
U.S. government obligations | 110 | — | — | 110 | |||||||||||
Total restricted investments | $ | 2,037 | $ | 6,119 | $ | — | $ | 8,156 | |||||||
As of June 30, 2011, the Company believes that the carrying value of cash and cash equivalents, marketable securities, accounts receivable, and accounts payable approximate fair value due to the short maturity of these financial instruments. The Company's long-term debt is not measured at fair value in the consolidated balance sheets. The fair value of debt is the estimated amount the Company would have to pay to transfer its debt, including any premium or discount attributable to the difference between the stated interest rate and market rate of interest at the balance sheet date. Fair values are based on valuations of similar debt at the balance sheet date and supported by observable market transactions when available. At June 30, 2011 and 2010 the fair value of the Company's debt was not materially different than its carrying value. The Company's restricted investment financial assets as of June 30, 2011 and 2010 are included within current and long-term restricted investments on the consolidated balance sheets. The classification of mutual fund assets held by the Company as of June 30, 2010 was updated to conform to the current year classification.
58
NOTES TO CONSOLIDATED FINANCIAL STATEMENTS (Continued)
In thousands, except per share data
Note 3. Fair Value Measurments (Continued)
As of June 30, 2011 and 2010, $411 and $1,927, respectively, of the restricted investments represented deposits in money market accounts under escrow arrangements. The carrying value of these investments approximated the fair market value as of such dates. Additionally, mutual funds, bonds, certificates of deposit and U.S. Treasury Notes under escrow arrangements with a cost of $6,492 and a fair value of $6,941, respectively, as of June 30, 2011 and a cost of $5,816 and a fair value of $6,229, respectively, as of June 30, 2010 are also included in restricted investments. These investments are recorded at fair value with changes in unrealized appreciation reported as a separate component of equity. During fiscal years 2011, 2010 and 2009, realized gains of $124, $0 and $3 were reported, respectively. If the Company determines that any unrealized losses are other than temporary, they will be charged to earnings. Total losses for securities with net losses in accumulated other comprehensive income were $68, $139 and $418 in fiscal years 2011, 2010 and 2009, respectively. Total gains for securities with net gains in accumulated other comprehensive income were $364, $577 and $51 in fiscal years 2011, 2010 and 2009, respectively.
The restricted investments under escrow arrangements earned dividends and interest of approximately $229, $258 and $145 during fiscal years 2011, 2010 and 2009, respectively, which are recorded as income and reflected as an operating activity in the consolidated statements of cash flows.
Assets Measured at Fair Value on a Non-Recurring Basis as of June 30, 2011
Certain assets were measured at fair value on a non-recurring basis and are not included in the discussion below. These assets include the assessment of the recoverability of goodwill and certain intangible assets as of each fiscal April month-end or more frequently if events or changes in circumstances indicate that goodwill might be impaired. During fiscal year 2011 the Company changed its accounting policy whereby the annual impairment review of goodwill will be performed as of each fiscal April month-end instead of the end of the second quarter of each fiscal year.
In determining the fair value of goodwill, the Company utilized valuation methods, including the discounted cash flow method, the guideline company approach and the guideline transaction approach as the best evidence of fair value. These fair value methods all included level 3 inputs within the the fair value hierarchy for those assets measured at fair value on a non-recurring basis during fiscal year 2011.
Note 4. Restructuring Reserve
The Company recorded favorable adjustments to cost of services and general and administrative expenses for restructuring costs of $67 for fiscal year 2011 primarily due to the amendment of a lease. The Company recorded charges to cost of services and general and administrative expenses for restructuring costs of $143 and $569 for fiscal years 2010 and 2009, respectively. The following table details accrued restructuring obligations and related activities for fiscal years 2011, 2010 and 2009:
Facility Closures | Employee Severance | Total | |||||||||
Liability balance at July 1, 2008 | $ | 2,297 | $ | 330 | $ | 2,627 | |||||
Total charge to operating costs and expenses | 574 | (5 | ) | 569 | |||||||
Payments | (1,461 | ) | (325 | ) | (1,786 | ) | |||||
Liability balance at June 30, 2009 | 1,410 | — | 1,410 | ||||||||
Total charge to operating costs and expenses | 143 | — | 143 | ||||||||
Payments | (665 | ) | — | (665 | ) | ||||||
Liability balance at June 30, 2010 | 888 | — | 888 | ||||||||
Total adjustments of charges to operating costs and expenses | (67 | ) | — | (67 | ) | ||||||
Payments | (488 | ) | — | (488 | ) | ||||||
Liability balance at June 30, 2011 | $ | 333 | $ | — | $ | 333 | |||||
On June 23, 2008, the Board of Directors of the Company authorized management to implement a restructuring plan (the "Plan"). Management committed to the Plan as of June 30, 2008. The Plan was part of the Company's ongoing initiative to reduce operating costs and improve the efficiency of the Company's organization. Under the Plan, the Company reduced its workforce by 71 employees and consolidated or closed 14 office facilities.
In connection with the Plan, the Company recorded asset impairment, facility exit and restructuring costs of $3,161 in fiscal year 2008. This included approximately $2,168 for facility closures, $516 for severance and personnel-related costs and
59
NOTES TO CONSOLIDATED FINANCIAL STATEMENTS (Continued)
In thousands, except per share data
Note 4. Restructuring Reserve (Continued)
$477 for asset write-offs. Total facility closure costs include lease liabilities offset by estimated sublease income, when applicable, and are based on market information. As of June 30, 2011, $333 of facility closure costs remain accrued (net of $291 of actual sublease payments due under non-cancelable subleases) which are expected to be paid over the various remaining lease terms through fiscal year 2013. During fiscal year 2011 the Company entered into amendments to the leases on two of the closed office facilities, resulting in an adjustment of $67.
Note 5. Accounts Receivable
The current portion of accounts receivable as of June 30, 2011 and 2010 were comprised of the following:
2011 | 2010 | ||||||
Billed | $ | 58,740 | $ | 47,040 | |||
Unbilled | 38,832 | 43,736 | |||||
Retainage | 3,245 | 6,241 | |||||
100,817 | 97,017 | ||||||
Less allowance for doubtful accounts | (11,559 | ) | (9,913 | ) | |||
$ | 89,258 | $ | 87,104 | ||||
A substantial portion of unbilled receivables represents billable amounts recognized as revenue in the last month of the fiscal period. Management expects that almost all unbilled amounts will be billed and collected within one year. Retainage represents amounts billed but not paid by the client which, pursuant to contract terms, are due at completion.
Rollforward of allowance for doubtful accounts reserves is as follows:
Additions | |||||||||||||||||||||
Year | Description | Balance at beginning of period | Charged to costs and expenses | Other (1) | Deductions (2) | Balance at end of period | |||||||||||||||
2011 | Allowance for doubtful accounts | $ | (9,913 | ) | $ | (1,763 | ) | $ | (729 | ) | $ | 846 | $ | (11,559 | ) | ||||||
2010 | Allowance for doubtful accounts | $ | (10,015 | ) | $ | (2,344 | ) | $ | — | $ | 2,446 | $ | (9,913 | ) | |||||||
2009 | Allowance for doubtful accounts | $ | (8,184 | ) | $ | (3,952 | ) | $ | — | $ | 2,121 | $ | (10,015 | ) | |||||||
______________________________
(1) | Allowance for acquired and disposed businesses. |
(2) | Uncollectible accounts written off, net of recoveries. |
Note 6. Long-Term Prepaid Insurance
Long-term prepaid insurance relates to insurance premiums and other fees paid by the client to the insurer, typically through an insurance broker, for environmental remediation cost cap and pollution legal liability insurance policies related to the Company's Exit Strategy contracts. The insurance premiums and fees are amortized over the life of the policies which have terms ranging from ten to thirty-two years. The portion of the premiums and fees paid for the insurance policies that will be amortized over the next year are included in prepaid expenses and other current assets in the Company's consolidated balance sheets.
60
NOTES TO CONSOLIDATED FINANCIAL STATEMENTS (Continued)
In thousands, except per share data
Note 7. Other Accrued Liabilities
As of June 30, 2011 and 2010, other accrued liabilities were comprised of the following:
2011 | 2010 | ||||||
Contract costs and loss reserves | $ | 22,450 | $ | 26,845 | |||
Legal costs | 26,050 | 8,821 | |||||
Lease obligations | 2,495 | 2,955 | |||||
Other | 8,723 | 5,160 | |||||
$ | 59,718 | $ | 43,781 | ||||
Note 8. Deferred Revenue
Deferred revenue represents amounts billed or collected in accordance with contractual terms in advance of when the work is performed. These advance payments primarily relate to the Company's Exit Strategy program. The current portion of deferred revenue represents the balance the Company estimates will be earned as revenue during the next fiscal year.
Note 9. Acquisitions
On June 6, 2011, the Company acquired the Environmental Business Unit ("RMT-EBU") of RMT, Inc., a subsidiary of Alliant Energy, headquartered in Madison, Wisconsin. RMT-EBU specializes in consulting, development, engineering and construction through remediation and restoration; environmental, health and safety management; air pollution control; and solid waste management. RMT-EBU consists of approximately 200 consultants and ten primary locations. RMT-EBU was integrated into the Company's business processes and systems as a part of the Company's Environmental operating segment. The purchase price of approximately $13,894 consisted of cash of $13,250 paid at closing and a working capital adjustment of $643, payable within several months. Goodwill of $4,173, all of which is expected to be tax deductible, and other intangible assets of $3,800 were recorded as a result of this acquisition. The goodwill is primarily attributable to the synergies and ancillary growth opportunities expected to arise after the Company’s acquisition of RMT-EBU. RMT-EBU contributed $2,180 of gross revenue, $1,537 of net service revenue and a net loss of $41 to the Company for the period from June 6, 2011 through June 30, 2011. As of June 30, 2011, the purchase price allocation remains preliminary. The final purchase price allocation is pending the receipt of additional information on the assets acquired, and is expected to be completed within a one year time period following the acquisition date. The provisional items pending finalization are primarily the valuation of acquired unbilled receivables, intangible assets, goodwill and income tax related matters. Any adjustments recorded are not expected to be material to the Company's financial position, and will be applied retrospectively if significant.
On February 25, 2011, the Company acquired 100% of the stock of privately-held Alexander Utility Engineering, Inc. (“AUE”), through a combination of cash, stock and subordinated debt. Headquartered in San Antonio, Texas, AUE is a professional engineering and design firm that specializes in providing a range of services to the electric utility marketplaces. AUE is integrated into the Company's business processes and systems as a part of the Company's Energy operating segment. The initial purchase price of approximately $2,293 consisted of cash of $700 payable at closing, a $900 subordinated note, 80 shares of the Company's common stock valued at $331 (based on the closing price of the Company's common stock on the date of the transaction), and future earnout consideration with an estimated fair value of $362. Goodwill of $1,843, none of which is expected to be tax deductible, and other intangible assets of $549 were recorded as a result of this acquisition. The goodwill is primarily attributable to the synergies and ancillary growth opportunities expected to arise after the Company’s acquisition of AUE. The Company recorded the initial fair value of the contingent consideration liabilities which were calculated based on a weighted probability assessment. The liabilities will continue to be measured at fair value at the end of each reporting period. Acquisition related transaction costs were not material and were included in general and administrative expenses. AUE contributed $1,079 of gross revenue, $867 of net service revenue and a net loss of $167 to the Company for the period from February 25, 2011 through June 30, 2011.
The gross amount of trade receivables due under contracts acquired during the fiscal year ended June 30, 2011, is $9,610, of which $729 is expected to be uncollectible. The Company did not acquire any other class of receivable as a result of the acquisition of these businesses.
The unaudited proforma financial information summarized in the following table gives effect to the RMT-EBU and AUE
61
NOTES TO CONSOLIDATED FINANCIAL STATEMENTS (Continued)
In thousands, except per share data
Note 9. Acquisitions (Continued)
acquisitions and assumes they occurred on July 1 of each period presented:
For the year ended June 30, | ||||||||
2011 | 2010 | |||||||
Gross revenue | $ | 372,263 | $ | 384,507 | ||||
Net service revenue | 274,764 | 265,107 | ||||||
Net loss applicable to TRC Companies, Inc.'s common shareholders | (15,044 | ) | (27,189 | ) | ||||
The unaudited proforma financial information does not assume any impacts from revenue, cost or other operating synergies that are expected as a result of the acquisitions. Proforma adjustments have been made to reflect amortization of the identifiable intangible assets for the related periods. Identifiable intangible assets are being amortized on a basis approximating the economic value derived from those assets. The unaudited proforma financial information above does not purport to present what actual results would have been had the acquisitions in fact occurred at the beginning of fiscal 2011 and 2010, nor does the information project results for any future period.
The Company has calculated the fair value of the tangible and intangible assets acquired to allocate the purchase price as of the acquisition date. The excess of the purchase price over the aggregate fair values was recognized as goodwill. A summary of the cumulative consideration paid and the provisional allocation of the purchase price of fiscal year 2011 acquisitions is as follows:
Allocation of purchase price: | Estimated Useful Life (In years) | 2011 | |||||||
Accounts receivable | $ | 8,881 | |||||||
Prepaid and other current assets | 129 | ||||||||
Property and equipment | 465 | ||||||||
Other assets | 117 | ||||||||
Amortizable and unamortizable intangible assets acquired: | |||||||||
Contract backlog | 0.5 - 1 | 258 | |||||||
Customer relationships | 7 - 10 | 4,091 | |||||||
Goodwill | 6,016 | ||||||||
Total assets acquired | $ | 19,957 | |||||||
Accounts payable | $ | 882 | |||||||
Accrued expenses | 953 | ||||||||
Deferred revenue | 1,412 | ||||||||
Other liabilities | 524 | ||||||||
Total liabilities assumed | $ | 3,771 | |||||||
Net assets acquired | $ | 16,186 | |||||||
Consideration: | |||||||||
Cash | $ | 13,950 | |||||||
Working capital adjustment | 643 | ||||||||
Note payable | 900 | ||||||||
Common stock | 331 | ||||||||
Estimated fair value of contingent consideration | 362 | ||||||||
$ | 16,186 | ||||||||
62
NOTES TO CONSOLIDATED FINANCIAL STATEMENTS (Continued)
In thousands, except per share data
Note 9. Acquisitions (Continued)
During fiscal year 2010, the Company acquired the assets of Blue Wave Ventures, LLC ("Blue Wave"), a consulting firm headquartered in Boston, Massachusetts. Blue Wave advises brownfield developers and environmental and renewable energy companies in the areas of project management, financing and capital sourcing, regulatory approvals, community and government relations, and business development. This acquisition was made in support of the Company's strategic growth plan to expand its services and capabilities within the Energy and Environmental operating segments. Blue Wave is part of the Company's Environmental operating segment. The initial purchase price of $200 consisted of cash of $100 payable at closing and $100 on the first anniversary thereof, which was recorded net of imputed interest of $9. There was no goodwill recorded as a result of this acquisition, however other intangible assets of $189 were recorded. Acquisition related transaction costs were not material and were included in general and administrative expenses. The impact of this acquisition was not material to the Company's consolidated balance sheets and results of operations.
During fiscal years 2011, 2010 and 2009, the Company made additional purchase price cash payments of $77, $656 and $110, respectively, related to acquisitions completed in prior years. The additional purchase price payments were earned as a result of the acquired entities achieving certain financial objectives, primarily operating income targets, as well as pursuant to amendments to earnout arrangements.
Note 10. Goodwill and Other Intangible Assets
The Company performed its most recent annual goodwill impairment review as of April 29, 2011, and noted the fair value of each of the Company's reporting units with goodwill substantially exceeded its carrying value, and therefore no further analysis was required. As of June 30, 2011, the Company had $20,886 of goodwill. The Company does not believe there were any events or changes in circumstances since its April 2011 annual assessment that would indicate the fair value of goodwill was more likely than not reduced to below its carrying value. In making this assessment, the Company relied on a number of factors including operating results, business plans, anticipated future cash flows, transactions and market data.
In performing the 2011 goodwill assessment, the Company utilized valuation methods, including the discounted cash flow method, the guideline company approach, and the guideline transaction approach as the best evidence of fair value. The weighting of the valuation methods used by the Company was 50% discounted cash flows, 40% guideline company approach and 10% guideline transaction approach. When compared to the prior year impairment analysis the Company increased the weighting of the guideline company approach by 10% and lowered the weighting of the guideline transaction approach. This adjustment was primarily made due to the limited number of relevant recent transactions with complete data.
The key estimates and factors used in the income approach include, but are not limited to, revenue growth rates and profit margins based on internal forecasts, terminal value and the weighted-average cost of capital used to discount future cash flows. The key uncertainty in the revenue growth assumption used in the estimation of the fair value of the Energy operating segment reporting unit is the level of investment electric utilities will make to upgrade the electric transmission grid over the next several years. The key uncertainty in the revenue growth assumption used in the estimation of the fair value of the Environmental operating segment reporting units is the projected increase in capital spending on oil and gas pipelines, energy exploration and distribution projects, and new electrical generation sources.
Virtually all of the assumptions used in the Company's models are susceptible to change due to national and regional economic conditions as well as competitive factors in the industry in which it operates. The forecasted cash flows the Company uses are derived from the annual long-range planning process that it performs and presents to its Board of Directors. In this process, each reporting unit is required to develop reasonable sales, earnings and cash flow forecasts for the next three to five years based on current and forecasted economic conditions. For purposes of testing for impairment, the cash flow forecasts are adjusted as needed to reflect information that becomes available concerning changes in business levels and general economic trends. The discount rates used for determining discounted future cash flows are generally based on our weighted-average cost of capital and are then adjusted for "plan risk" (the risk that a business will fail to achieve its forecasted results). Finally, a growth factor beyond the three to five-year period for which cash flows are planned is selected based on expectations of future economic conditions. While the Company believes the estimates and assumptions it uses are reasonable, various economic factors could cause the results of its goodwill testing to vary significantly.
During fiscal year 2010, the Company made certain changes to its management reporting structure which resulted in a change in the composition of the Company's operating segments and to the number of reporting units. The Company reallocated goodwill to its newly formed reporting units using the relative fair value allocation approach. As a result, there was a reallocation of goodwill in the amount of $6,383 from the Energy operating segment to the Environmental operating segment.
63
NOTES TO CONSOLIDATED FINANCIAL STATEMENTS (Continued)
In thousands, except per share data
Note 10. Goodwill and Other Intangible Assets (Continued)
The Company had 16 reporting units as of September 25, 2009 compared to three reporting units as of June 30, 2009. This reallocation, in conjunction with the continued downturn in the Company's key markets, resulted in an interim impairment test. Accordingly, the Company assessed the recoverability of goodwill of $35,119 as of September 25, 2009 for the seven reporting units within its Energy and Environmental operating segments which had associated goodwill. The remaining nine reporting units, all in the Infrastructure operating segment, have no goodwill associated with them due to impairment charges recorded in fiscal year 2009. As of September 25, 2009, the fair value of each of the Company's reporting units with goodwill exceeded its carrying value, and therefore no further analysis was required.
The Company also assessed the recoverability of goodwill of $35,119 as of the end of the second quarter of fiscal year 2010, which was its historical annual impairment date. At December 25, 2009, the fair value of each of the Company's reporting units with goodwill exceeded its carrying value, and therefore no further analysis was required.
In April of fiscal year 2010, given the market conditions and lower than expected operating results for its reporting units, the Company again assessed the recoverability of goodwill. The analysis resulted in a non-cash goodwill impairment charge related to the Energy and Environmental operating segments of $14,506 and $5,743, respectively. The goodwill impairment charge was included in the results of the Corporate Shared Services and was not allocated to its operating segments. The fair value of each of the Company's remaining reporting units with goodwill exceeded their carrying value, and therefore no further analysis was required.
The changes in the carrying amount of goodwill for fiscal year 2011 by operating segment are as follows:
Gross | Gross | |||||||||||||||||||||
Balance, | Accumulated | Balance, | Balance, | Accumulated | Balance, | |||||||||||||||||
July 1, | Impairment | July 1, | Additions / | June 30, | Impairment | June 30, | ||||||||||||||||
Operating Segment | 2010 | Losses | 2010 | Adjustments | 2011 | Losses | 2011 | |||||||||||||||
Energy | $ | 20,050 | $ | (14,506 | ) | $ | 5,544 | $ | 1,843 | $ | 21,893 | $ | (14,506 | ) | $ | 7,387 | ||||||
Environmental | 27,191 | (17,865 | ) | 9,326 | 4,173 | 31,364 | (17,865 | ) | 13,499 | |||||||||||||
Infrastructure | 7,224 | (7,224 | ) | — | — | 7,224 | (7,224 | ) | — | |||||||||||||
$ | 54,465 | $ | (39,595 | ) | $ | 14,870 | $ | 6,016 | $ | 60,481 | $ | (39,595 | ) | $ | 20,886 | |||||||
The changes in the carrying amount of goodwill for fiscal year 2010 by operating segment are as follows:
Gross | Gross | |||||||||||||||||||||
Balance, | Accumulated | Balance, | Balance, | Accumulated | Balance, | |||||||||||||||||
July 1, | Impairment | July 1, | Additions / | June 30, | Impairment | June 30, | ||||||||||||||||
Operating Segment | 2009 | Losses | 2009 | Adjustments | 2010 | Losses | 2010 | |||||||||||||||
Energy | $ | 26,433 | $ | — | $ | 26,433 | $ | (20,889 | ) | $ | 20,050 | $ | (14,506 | ) | $ | 5,544 | ||||||
Environmental | 20,808 | (12,122 | ) | 8,686 | 640 | 27,191 | (17,865 | ) | 9,326 | |||||||||||||
Infrastructure | 7,224 | (7,224 | ) | — | — | 7,224 | (7,224 | ) | — | |||||||||||||
$ | 54,465 | $ | (19,346 | ) | $ | 35,119 | $ | (20,249 | ) | $ | 54,465 | $ | (39,595 | ) | $ | 14,870 | ||||||
64
NOTES TO CONSOLIDATED FINANCIAL STATEMENTS (Continued)
In thousands, except per share data
Note 10. Goodwill and Other Intangible Assets (Continued)
Identifiable intangible assets as of June 30, 2011 and 2010 are included in other assets on the consolidated balance sheets and were comprised of:
June 30, 2011 | June 30, 2010 | |||||||||||||||||||||||
Gross | Net | Gross | Net | |||||||||||||||||||||
Carrying | Accumulated | Carrying | Carrying | Accumulated | Carrying | |||||||||||||||||||
Identifiable intangible assets | Amount | Amortization | Amount | Amount | Amortization | Amount | ||||||||||||||||||
With determinable lives: | ||||||||||||||||||||||||
Customer relationships | $ | 4,275 | $ | (125 | ) | $ | 4,150 | $ | 184 | $ | (25 | ) | $ | 159 | ||||||||||
Contract backlog | 258 | (55 | ) | 203 | — | — | — | |||||||||||||||||
4,533 | (180 | ) | 4,353 | 184 | (25 | ) | 159 | |||||||||||||||||
With indefinite lives: | ||||||||||||||||||||||||
Engineering licenses | 426 | — | 426 | 426 | — | 426 | ||||||||||||||||||
$ | 4,959 | $ | (180 | ) | $ | 4,779 | $ | 610 | $ | (25 | ) | $ | 585 | |||||||||||
Identifiable intangible assets with determinable lives are amortized over the weighted-average period of approximately seven years. The weighted-average periods of amortization by intangible asset class is approximately eight years for client relationship assets and six months for contract backlog. The amortization of intangible assets for fiscal years 2011, 2010 and 2009 were $155, $1,928 and $361, respectively. During fiscal year 2010, the Company accelerated the amortization of certain customer relationship assets primarily due to the departure of certain key employees. This resulted in $1,647 of additional amortization during fiscal year 2010, of which $1,629 and $18 related to reporting units within the Environmental and Energy operating segments, respectively. Estimated amortization of intangible assets for future periods is as follows: fiscal year 2012 - $500; fiscal year 2013 - $668; fiscal year 2014 - $926; fiscal year 2015 - $839; fiscal year 2016 $629 and thereafter - $791.
On an annual basis, or more frequently if events or changes in circumstances indicate that the asset might be impaired, the fair value of the indefinite-lived intangible assets is evaluated by the Company to determine if an impairment charge is required. The fair value for intangible assets is based on discounted cash flows. During fiscal year 2009, the Company concluded that intangible assets relating to certain customer relationships within Infrastructure operating segment reporting units were not fully recoverable due to a decline in the estimated future cash flows related to these assets, and an impairment charge of $2,092 was recorded.
Note 11. Long-Term Debt
Long-term debt as of June 30, 2011 and 2010 was comprised of the following:
2011 | 2010 | ||||||
Revolving credit facility | $ | — | $ | — | |||
Subordinated debt: | |||||||
Federal Partners note payable | 5,000 | 5,000 | |||||
CAH note payable | 2,450 | 2,700 | |||||
AUE note payable | 900 | — | |||||
Other notes payable | 277 | 1,016 | |||||
Lease financing obligations | 549 | 728 | |||||
9,176 | 9,444 | ||||||
Less current portion | (3,139 | ) | (3,629 | ) | |||
Long-term debt | $ | 6,037 | $ | 5,815 | |||
On July 17, 2006, the Company and substantially all of its subsidiaries, (the “Borrower”), entered into a secured credit
65
NOTES TO CONSOLIDATED FINANCIAL STATEMENTS (Continued)
In thousands, except per share data
Note 11. Long-Term Debt (Continued)
agreement (the “Credit Agreement”) and related security documentation with Wells Fargo Capital Finance (“Wells Fargo”) as the lead lender and administrative agent, with Textron Financial Corporation (“Textron”) subsequently participating as an additional lender. The Credit Agreement, as amended, provided the Borrower with a five-year senior revolving credit facility of up to $50,000 based upon a borrowing base formula on accounts receivable. In connection with the closing of the preferred stock offering and as a result of previously announced plans to exit the asset-based lending business, Textron elected to no longer participate in the credit facility. In June 2009, a $15,000 syndication reserve was established which reduces the maximum revolver amount from $50,000 to $35,000 subject to increase upon Wells Fargo completing a syndication to replace Textron as a participant in the facility. Any amounts outstanding under the Credit Agreement bear interest at the greater of 5.75% and the prime rate plus a margin of 2.50% to 3.50%, or the greater of 3.00% and LIBOR plus a margin of 3.50% to 4.50%, based on Trailing Twelve Month Earnings Before Interest, Taxes, Depreciation and Amortization (“EBITDA”), as defined. The Company's obligations under the Credit Agreement are secured by a pledge of substantially all of its assets and guaranteed by substantially all of its subsidiaries that are not borrowers. The Credit Agreement also contains cross-default provisions which become effective if the Company defaults on other indebtedness.
Under the Credit Agreement the Company must maintain average monthly backlog of $190,000 and, depending on available borrowing capacity, maintain a minimum fixed charge coverage ratio of 1.00 to 1.00. The Credit Agreement was amended as of January 19, 2010 to extend the expiration date of the facility by two years from July 17, 2011 to July 17, 2013. The amendment also changed the Consolidated Adjusted EBITDA covenant to $6,100, $9,200, $10,900 and $12,400, for the trailing twelve month periods ending on September 30, 2010, December 31, 2010, March 31, 2011 and June 30, 2011, respectively; and $12,500 for each 12 month period ending each fiscal quarter thereafter. The definition of Consolidated Adjusted EBITDA also provides an aggregate allowance for cost reduction efforts, defined in the Credit Agreement as restructuring charges, in the amount of $1,250 in fiscal year 2011 at the Permitted Discretion of the lender as defined in the Credit Agreement. Additional changes in the January 2010 amendment included: (i) an increase to the fee for unused borrowing capacity depending on borrowing usage; (ii) a reduction of the maximum annual capital expenditure covenant from $10,600 to $7,500 for fiscal year 2010 through fiscal year 2012 and $8,500 for fiscal year 2013; and (iii) a revision to the fixed charge ratio covenant which now requires the ratio to be computed and the covenant applied only if available borrowing capacity under the facility, measured on a trailing 30 day average basis, is less than $20,000.
The Credit Agreement was amended as of August 15, 2011 to increase the maximum amount of letters of credit usage from $15,000 to $25,000. The amendment also changed the Consolidated Adjusted EBITDA covenant to $3,000, $6,000, $10,000 and $12,500, for the three months ended September 30, 2011, the six months ended December 31, 2011, the nine months ended March 31, 2012 and the twelve months ended June 30, 2012, respectively; and $12,500 for each 12 month period ending each fiscal quarter thereafter. The amendment also changed the definition of Consolidated Adjusted EBITDA to include an allowance of $19,500 relating to legal costs and reserves incurred during fiscal year 2011. The amendment also revised the criteria for determining whether the fixed charge coverage ratio covenant is applicable and requires the ratio to be computed and the covenant applied only if available borrowing capacity under the facility plus qualified cash, measured on a trailing 30 day average basis, is less than $20,000 or, at any point during the most recent fiscal quarter, is less than $15,000.
The Credit Agreement was amended as of February 25, 2011 to allow the Company to purchase the stock of AUE and incur indebtedness in connection with that acquisition in the form of a subordinated promissory note in a principal amount not to exceed $900. The Credit Agreement was again amended as of June 6, 2011 to allow the Company to enter into an asset purchase agreement with RMT, Inc. (See Note 9).
As of June 30, 2011 and 2010, the Company had no borrowings outstanding pursuant to the Credit Agreement. Letters of credit outstanding were $3,768 and $3,668 as of June 30, 2011 and 2010, respectively. Based upon the borrowing base formula, the maximum availability under the Credit Agreement was $35,000 and $30,195 as of June 30, 2011 and 2010, respectively. Funds available to borrow under the Credit Agreement after consideration of the reserve amount were $31,232 and $26,527 as of June 30, 2011 and 2010, respectively.
On July 19, 2006, the Company and substantially all of its subsidiaries entered into a three-year subordinated loan agreement with Federal Partners, L.P. (“Federal Partners”), a stockholder of the Company, pursuant to which the Company borrowed $5,000. The loan bears interest at a fixed rate of 9% per annum. The loan was amended on June 1, 2009 in connection with the preferred stock offering to extend the maturity date from July 19, 2009 to July 19, 2012.
In fiscal year 2007, the Company formed a limited liability company, Center Avenue Holdings, LLC ("CAH"), to purchase and remediate certain property in New Jersey. The Company maintains a 70% ownership position in CAH. CAH entered into a
66
NOTES TO CONSOLIDATED FINANCIAL STATEMENTS (Continued)
In thousands, except per share data
Note 11. Long-Term Debt (Continued)
term loan agreement with a commercial bank in the amount of approximately $3,200 which bore interest at a fixed rate of 10.0% annually. The loan is secured by the CAH property and is non-recourse to the members of CAH. The proceeds from the loan were used to purchase, and are currently funding the remediation of, the property. In June 2010, the Company entered into a modification of the credit agreement with the lender that reduced the interest rate from 10.0% to 6.5% in return for a principal payment of $500 made upon consummation of the modification followed by a second principal payment of $250 made on December 1, 2010 and extended the maturity date of the loan from January 31, 2010 until April 1, 2011. In April 2011, the Company entered into a modification of the credit agreement with the lender that extended the maturity date of the loan from April 1, 2011 until October 1, 2011 (See Note 12).
In July 2010, the Company financed $2,559 of insurance premiums payable in nine equal monthly installments of approximately $288 each, including a finance charge of 2.89%. As of June 30, 2011, the balance has been repaid.
In February 2011, the Company entered into a two-year subordinated promissory note with the principal owner of AUE pursuant to which the Company agreed to pay $900. The note bears interest at a fixed rate of 3.25% per annum. The principal amount outstanding under this note shall become due and payable in two equal installments of $450 on each of the first and second anniversaries of the note.
Future minimum long-term debt payments as of June 30, 2011 are as follows:
Fiscal Year | Debt | Lease Financing Obligations | Total | ||||||||
2012 | $ | 2,961 | $ | 178 | $ | 3,139 | |||||
2013 | 5,511 | 145 | 5,656 | ||||||||
2014 | 63 | 97 | 160 | ||||||||
2015 | 68 | 97 | 165 | ||||||||
2016 | 24 | 32 | 56 | ||||||||
Thereafter | — | — | — | ||||||||
$ | 8,627 | $ | 549 | $ | 9,176 | ||||||
Note 12. Variable Interest Entity
The Company's consolidated financial statements include the financial results of a variable interest entity in which it is the primary beneficiary. In determining whether the Company is the primary beneficiary of an entity, it considers a number of factors, including its ability to direct the activities that most significantly affect the entity's economic success, the Company's contractual rights and responsibilities under the arrangement and the significance of the arrangement to each party. These considerations impact the way the Company accounts for its existing collaborative and joint venture relationships and determines the consolidation of companies or entities with which the Company has collaborative or other arrangements.
The Company consolidates the operations of CAH, as it retains the contractual power to direct the activities of CAH which most significantly and directly impact its economic performance. The activity of CAH is not significant to the overall performance of the Company. The assets of CAH are restricted, from the standpoint of the Company, in that they are not available for the Company's general business use outside the context of CAH.
67
NOTES TO CONSOLIDATED FINANCIAL STATEMENTS (Continued)
In thousands, except per share data
The following table sets forth the assets and liabilities of CAH included in the consolidated balance sheets of the Company:
June 30, 2011 | June 30, 2010 | ||||||
Current assets: | |||||||
Cash and cash equivalents | $ | 17 | $ | 64 | |||
Restricted investments | 63 | 309 | |||||
Total current assets | 80 | 373 | |||||
Other assets | 4,344 | 4,336 | |||||
Total assets | $ | 4,424 | $ | 4,709 | |||
Current liabilities: | |||||||
Current portion of long-term debt | $ | 2,450 | $ | 2,700 | |||
Environmental remediation liabilities | — | 50 | |||||
Other accrued liabilities | 13 | 693 | |||||
Total current liabilities | 2,463 | 3,443 | |||||
Long-term environmental remediation liabilities | 50 | 108 | |||||
Total liabilities | $ | 2,513 | $ | 3,551 | |||
The Company and the other member of CAH do not generally have an obligation to make additional capital contributions to CAH. However, through the end of fiscal year 2011, the Company has provided approximately $994 of support it was not contractually obligated to provide. The additional support was primarily for debt service payments on the note payable. Ultimately, the Company expects the proceeds from the sale of the property (a component of other assets in the consolidated balance sheets) will be sufficient to repay the debt and any remaining unfunded liabilities, however, to the extent a sale does not occur prior to maturity of the liabilities or the sales proceeds are insufficient to fund any remaining liabilities, the Company intends to fund CAH's obligations as they become due.
Note 13. Gain on Extinguishment of Debt
In fiscal year 2001 the Company made an investment in a privately held energy services contracting company ("Co-Energy LLC") that specialized in the installation of ground source heat pump systems. Over its history, Co-Energy LLC incurred significant losses. During December 2009, in connection with the dissolution of Co-Energy LLC, a consolidated entity, the Company was legally released from an aggregate of $1,716 of loans extended to Co-Energy LLC by a party unrelated to the Company. The loans were extinguished because Co-Energy LLC had no assets at the time of dissolution. The lender did not have an equity interest in the Company and received no claims, rights or enhancement as a result of the extinguishment. Consequently, the Company recognized a $1,716 gain on extinguishment of debt during fiscal year 2010.
68
NOTES TO CONSOLIDATED FINANCIAL STATEMENTS (Continued)
In thousands, except per share data
Note 14. Federal and State Income Taxes
The federal and state income tax (provision) benefit for fiscal years 2011, 2010 and 2009 consists of the following:
2011 | 2010 | 2009 | |||||||||
Current: | |||||||||||
Federal | $ | (644 | ) | $ | 4,283 | $ | (2,866 | ) | |||
State | (634 | ) | (73 | ) | (1,005 | ) | |||||
Foreign | (67 | ) | — | — | |||||||
Total current | (1,345 | ) | 4,210 | (3,871 | ) | ||||||
Deferred: | |||||||||||
Federal | 208 | — | — | ||||||||
State | 10 | — | — | ||||||||
Total deferred | 218 | — | — | ||||||||
Total (provision) benefit | $ | (1,127 | ) | $ | 4,210 | $ | (3,871 | ) | |||
Of the $218 deferred tax benefit realized in fiscal year 2011, $215 was as a result of the reduction in the valuation allowance due to the acquisition of AUE. Pursuant to ASC 805, the impact on the acquiring company's deferred tax assets and liabilities caused by an acquisition is recorded in the acquiring company's financial statements outside of acquisition accounting.
Deferred income taxes represent the tax effect of transactions that are reported in different periods for financial and tax reporting purposes. Temporary differences and carryforwards that give rise to a significant portion of the deferred income tax benefits and liabilities are as follows at June 30:
2011 | 2010 | ||||||
Current deferred income tax assets before valuation allowance: | |||||||
Revenue recognition on long-term contracts | $ | 130 | $ | 240 | |||
Doubtful accounts and other accruals | 4,823 | 4,230 | |||||
Vacation pay accrual | 2,649 | 2,041 | |||||
Bonus accrual | 3,535 | 2,652 | |||||
Other | 2,421 | 3,054 | |||||
13,558 | 12,217 | ||||||
Long-term deferred income tax assets before valuation allowance: | |||||||
Loss carryforwards | 8,986 | 12,926 | |||||
Capital loss carryforwards | 1,189 | 967 | |||||
Revenue recognition on long-term contracts | 510 | 1,247 | |||||
Goodwill and intangible asset amortization | 5,530 | 7,439 | |||||
Legal reserve | 8,377 | 1,653 | |||||
Stock-based compensation expense | 3,304 | 2,368 | |||||
Other | 2,244 | 2,839 | |||||
30,140 | 29,439 | ||||||
Total deferred income tax assets before valuation allowance | 43,698 | 41,656 | |||||
Less valuation allowance | (39,478 | ) | (36,031 | ) | |||
Total deferred income tax assets | 4,220 | 5,625 | |||||
Current deferred income tax liabilities: | |||||||
Unearned revenue | (2,681 | ) | (4,979 | ) | |||
Long-term deferred income tax liabilities: | |||||||
Depreciation | (1,539 | ) | (646 | ) | |||
Total deferred income tax liabilities | (4,220 | ) | (5,625 | ) | |||
Net deferred income tax assets | $ | — | $ | — | |||
69
NOTES TO CONSOLIDATED FINANCIAL STATEMENTS (Continued)
In thousands, except per share data
Note 14. Federal and State Income Taxes (Continued)
During the year ended June 30, 2008, the Company determined that it was more likely than not that its net deferred tax assets would not be realized as a result of insufficient expected future taxable income generated from pretax book income. Accordingly, a valuation allowance of $34,846 was recorded during fiscal year 2008 to fully reserve for all of the Company's net deferred tax assets.
As of June 30, 2011, prior to the consideration of the Company's uncertain tax positions, the Company had approximately $27,611 and $41,197 of federal and state loss carryforwards, respectively, which expire at various dates through fiscal year 2031. As of June 30, 2010, prior to the consideration of the Company's uncertain tax positions, the Company had approximately $37,279 and $51,638 of federal and state loss carryforwards, respectively, which expire at various dates through fiscal year 2030.
The Company has a tax benefit of approximately $1,846 related to the exercise of non-qualified stock options. Pursuant to ASC Topic 718 the benefit will be recognized and recorded as an addition to additional paid-in capital when the benefit is realized through the reduction of taxes payable.
A reconciliation of the U.S. federal statutory income tax rate to the Company's consolidated effective income tax rate for the fiscal years ended June 30 is as follows:
2011 | 2010 | 2009 | ||||||
U.S. federal statutory income tax rate | 35.0 | % | 35.0 | % | 35.0 | % | ||
State income taxes, net of federal benefit | (6.0 | ) | 2.0 | (8.0 | ) | |||
Increase in valuation allowance | (33.3 | ) | (14.8 | ) | (38.9 | ) | ||
Permanent portion of goodwill impairment | — | (22.1 | ) | (16.1 | ) | |||
Interest on potential tax liabilities | (8.7 | ) | 7.3 | (4.9 | ) | |||
Federal income tax refund | 0.9 | 13.5 | 5.1 | |||||
Other, net | (1.6 | ) | (0.5 | ) | 8.5 | |||
Effective income tax rate | (13.7 | )% | 20.4 | % | (19.3 | )% | ||
The following represents a summary of the Company's uncertain tax positions:
2011 | 2010 | 2009 | |||||||||
Unrecognized tax benefits, beginning of year | $ | 13,377 | $ | 17,711 | $ | 2,391 | |||||
Increases for tax positions related to prior years | — | — | 16,200 | ||||||||
Decreases for tax positions related to prior years | — | (2,856 | ) | (743 | ) | ||||||
Decreases for tax positions taken during the year | (2,481 | ) | (1,090 | ) | (137 | ) | |||||
Reductions due to settlement with Revenue Agencies | (74 | ) | (388 | ) | — | ||||||
Unrecognized tax benefits, end of year | $ | 10,822 | $ | 13,377 | $ | 17,711 | |||||
The Company's uncertain tax positions are presented on a gross basis in the table above per ASC 740; as such, the ending balance of the unrecognized tax benefits will not agree to the net liability recorded on the balance sheet.
The Company is currently under an IRS examination for the fiscal years 2003 through 2008. During the second quarter of fiscal year 2010, the IRS formally assessed the Company certain adjustments related to Exit Strategy projects. The Company does not agree with these adjustments and has protested the assessments. If the IRS prevails in its position, the Company's federal income tax due for the fiscal years 2003 through 2008 would result in taxes due of $10,438 (including interest).
The fiscal year 2010 decreases for tax positions related to prior years, relate to changes in measurements under ASC Topic 740, Income Taxes, of the unrecognized tax benefits on Exit Strategy projects currently under IRS examination.
As of June 30, 2011, the total amount of gross unrecognized tax benefits was $10,822, of which $4,580, if recognized, would impact the Company's effective tax rate.
The Company expects that the total amount of unrecognized tax benefits could increase or decrease within the next twelve
70
NOTES TO CONSOLIDATED FINANCIAL STATEMENTS (Continued)
In thousands, except per share data
Note 14. Federal and State Income Taxes (Continued)
months. It is reasonably possible that the unrecognized tax benefits could decrease by approximately $4,200 or increase by approximately $6,000 depending on the timing of the resolution of the IRS examination.
The Company recognized interest and penalties related to unrecognized tax benefits within income tax expense. The total amount of interest and penalties recognized in the consolidated statements of operations was $29 and ($1,187) for fiscal years 2011 and 2010, respectively. As of June 30, 2011 and 2010, the total accrued interest and penalties recognized in the consolidated balance sheets are $332 and $303, respectively.
The Company and its subsidiaries file income tax returns in the U.S. federal jurisdictions, and various state and local jurisdictions. With few exceptions, the Company is no longer subject to state income tax examinations by tax authorities for fiscal years ending before June 30, 2007. The Company is no longer subject to U.S. federal tax examination by the IRS for fiscal years ending before June 30, 2003.
Note 15. Lease Commitments
The Company had commitments as of June 30, 2011 under non-cancelable operating leases for office facilities and equipment. The Company recognizes escalating rental payments on a straight-line basis over the terms of the related leases in order to provide level recognition of rental expense in accordance with ASC Subtopic 840-20, Operating Leases. Such rental expense in excess of the cash paid is recognized as deferred rent as of June 30, 2011. Rental expense, net of sublease income, charged to operations in fiscal years 2011, 2010 and 2009 was approximately $10,293, $11,384 and $11,406, respectively.
Minimum operating lease obligations payable in future fiscal years are as follows:
2012 | $ | 10,859 | |
2013 | 8,300 | ||
2014 | 6,122 | ||
2015 | 5,086 | ||
2016 | 3,493 | ||
2017 and thereafter | 6,608 | ||
$ | 40,468 | ||
Note 16. Equity
(a) Private Placement of Preferred and Common Shares
On June 1, 2009, the Company sold 7 shares of a new Series A Convertible Preferred Stock, $0.10 par value (the "Preferred Stock"), for $2,150 per share (the "2009 Private Placement") pursuant to a stock purchase agreement by and among the Company and three of its existing shareholders and related entities. The 2009 Private Placement resulted in proceeds of $15,291, net of issuance costs of $209. In accordance with ASC Subtopic 470-20, Debt with Conversion and Other Options, and ASC 470-20-55-20, it was determined that the conversion price was at a discount to fair value. The value of this discount (the beneficial conversion feature) was $13,698. The beneficial conversion feature was deducted from the carrying value of the Preferred Stock and was accreted over 18 months, the period at the end of which the Preferred Stock converted to common stock. The accretion was treated as a preferred stock dividend. The 2009 Private Placement was made pursuant to the exemption from registration provided in Regulation D, Rule 506, under Section 4 (2) of the Securities Act of 1933 as amended. Each of the investors was an "accredited investor" within the meaning of Rule 501 (a) under the Act.
On December 1, 2010, each share of the Preferred Stock automatically converted into one thousand shares of common stock, or an aggregate of 7,209 shares of common stock. As of June 30, 2010, the liquidation preference was $22,277.
The Company entered into a registration rights agreement with the investors pursuant to which the common stock issued upon conversion of the Preferred Stock was subject to registration rights at any time following the expiration of the 18 month restricted period that the Company was eligible to register shares on Form S-3 provided that a minimum of $2,500 of shares shall be included in such registration and that the Company shall not be obligated to undertake more than two such registrations in any 12-month period. The holders of Preferred Stock were entitled to appoint one director to the Company's Board of
71
NOTES TO CONSOLIDATED FINANCIAL STATEMENTS (Continued)
In thousands, except per share data
Note 16. Equity (Continued)
Directors.
(b) Stock Options
Stock Option Plans
The Company has two plans under which stock options have been issued: the TRC Companies, Inc. Restated Stock Option Plan (the "Restated Plan"), and the Amended and Restated 2007 Equity Incentive Plan (the "2007 Plan"), collectively, ("the Plans"). The Company issues new shares or utilizes treasury shares, when available, to satisfy awards under the Plans. Options are awarded by the Compensation Committee of the Board of Directors, however, the Compensation Committee has delegated to the Chief Executive Officer ("CEO") the authority to grant awards for up to 10 shares to employees subject to a limitation of 100 shares in any 12 month period.
The Restated Plan: Pursuant to amendments approved by the Company's shareholders on July 20, 2009, shares available or that become available for grant under the Restated Plan are available for grant under the 2007 Plan, and no new grants will be made under the Restated Plan. As such, there were no shares available for grants under the Restated Plan as of June 30, 2011.
The 2007 Plan: The 2007 Plan was originally approved by the Company's shareholders in May 2007 and amended and restated as of July 20, 2009. As of June 30, 2011, the Company had reserved a total of 3,500 shares of common stock for issuance under the 2007 Plan. In addition, any shares subject to outstanding awards that expire unexercised or any unvested shares that are forfeited will be available for reissuance under the 2007 Plan, which amount was 1,830 in total through fiscal year 2011. The Company may generally grant six types of awards under the 2007 Plan: restricted stock awards and restricted stock units, stock options (including both incentive stock options, within the meaning of Section 422 of the Internal Revenue Code and non-qualified options), phantom stock, stock bonus awards, other awards (including stock appreciation rights) and performance based awards. In addition, the Compensation Committee of the Board of Directors may, in its discretion, make other awards. The 2007 Plan provides that the exercise price for each stock option shall not be less than the fair market value (or par value) of the common stock of the Company at the time the stock option is granted. The maximum number of shares of common stock that may be the subject of awards to a participant in any Company tax year is 300. Stock options granted under the 2007 Plan generally vest ratably over four years and expire seven years from the date of grant. As of June 30, 2011, 1,926 shares remained available for grants under the 2007 Plan.
72
NOTES TO CONSOLIDATED FINANCIAL STATEMENTS (Continued)
In thousands, except per share data
Note 16. Equity (Continued)
Stock Options
A summary of stock option activity for fiscal years ended 2011, 2010 and 2009 under the Plans is as follows:
Options | Weighted Average Exercise Price | Weighted Average Remaining Contractual Term (in years) | Aggregate Intrinsic Value (in thousands) | ||||||||||
Outstanding options at June 30, 2008 (1,532 exercisable) | 2,348 | $ | 11.92 | ||||||||||
Options granted | 60 | 2.88 | |||||||||||
Options exercised | (41 | ) | 2.75 | ||||||||||
Options forfeited | (61 | ) | 10.17 | ||||||||||
Options expired | (353 | ) | 12.84 | ||||||||||
Outstanding options at June 30, 2009 (1,493 exercisable) | 1,953 | 11.71 | |||||||||||
Options granted | 16 | 3.34 | |||||||||||
Options forfeited | (30 | ) | 9.19 | ||||||||||
Options expired | (455 | ) | 11.05 | ||||||||||
Outstanding options at June 30, 2010 (1,231 exercisable) | 1,484 | 11.88 | |||||||||||
Options granted | 11 | 3.65 | |||||||||||
Options forfeited | (419 | ) | 13.39 | ||||||||||
Options expired | (153 | ) | 12.80 | ||||||||||
Outstanding options at June 30, 2011 | 923 | $ | 10.94 | 3.4 | $ | 353 | |||||||
Options exercisable at June 30, 2011 | 805 | $ | 11.57 | 3.3 | $ | 178 | |||||||
Options vested and expected to vest at June 30, 2011 | 912 | $ | 11.03 | 3.4 | $ | 325 | |||||||
Options available for future grants | 1,926 | ||||||||||||
The aggregate intrinsic value is measured using the fair market value at the date of exercise (for options exercised) or as of June 30, 2011 (for outstanding options), less the applicable exercise price. The closing price of the Company's common stock on the New York Stock Exchange was $6.25 as of June 30, 2011. There were no options exercised during fiscal years 2011 and 2010. The total intrinsic value of options exercised in fiscal year 2009 was $0. The total cash received from option exercises was $111 in fiscal years 2009 and there was no tax benefit realized by the Company.
As of June 30, 2011, there was $229 of total unrecognized compensation expense related to unvested stock option grants under the Plans, and this expense is expected to be recognized over a weighted-average period of 0.9 years.
In July 2009 the Company's shareholders approved amendments to the 2007 Equity Incentive Plan to permit option repricings, exchanges and similar programs. Directors and Executive Officers do not participate in such programs. On September 23, 2010 the Company commenced an option exchange program under which stock options with exercise prices in excess of $7.25 per share and expiration dates after June 30, 2011 were eligible for exchange into RSU's with a four year vesting schedule based on the Black-Scholes value of the exchanged stock options. Where a participant received less than five hundred RSU's they were entitled to a cash payment equal to the greater of the number of RSU's times $2.82 or one hundred dollars. On November 1, 2010, 415 stock options were forfeited and exchanged for 97 RSU's and an aggregate of $10 in cash.
73
NOTES TO CONSOLIDATED FINANCIAL STATEMENTS (Continued)
In thousands, except per share data
Note 16. Equity (Continued)
The following table summarizes additional information about stock options outstanding as of June 30, 2011:
Options Outstanding | Options Exercisable | Options Vested and Expected to Vest | ||||||||||||||||||||||||||||
Range of Exercise Prices | Shares | Weighted Average Exercise Price | Weighted Average Remaining Contractual Term in Years | Shares | Weighted Average Exercise Price | Weighted Average Remaining Contractual Term in Years | Shares | Weighted Average Exercise Price | Weighted Average Remaining Contractual Term in Years | |||||||||||||||||||||
$ 1.41 - $ 2.63 | 15 | $ | 2.00 | 6.3 | 7 | $ | 1.92 | 6.4 | 14 | $ | 1.99 | 6.3 | ||||||||||||||||||
2.76 - 4.15 | 95 | 3.50 | 4.7 | 45 | 3.53 | 4.2 | 87 | 3.51 | 4.6 | |||||||||||||||||||||
5.09 - 7.90 | 137 | 6.17 | 3.4 | 121 | 6.14 | 3.4 | 136 | 6.17 | 3.4 | |||||||||||||||||||||
9.01 - 13.82 | 536 | 10.80 | 3.7 | 492 | 10.77 | 3.7 | 535 | 10.80 | 3.7 | |||||||||||||||||||||
15.77 - 27.50 | 115 | 19.68 | 1.5 | 115 | 19.68 | 1.5 | 115 | 19.68 | 1.5 | |||||||||||||||||||||
33.33 - 33.33 | 25 | 33.33 | 0.5 | 25 | 33.33 | 0.5 | 25 | 33.33 | 0.5 | |||||||||||||||||||||
$ 1.41 - $33.33 | 923 | $ | 10.94 | 3.4 | 805 | $ | 11.57 | 3.3 | 912 | $ | 11.03 | 3.4 | ||||||||||||||||||
Restricted Stock Awards
Compensation expense for RSA's granted to employees is recognized ratably over the vesting term, which is generally four years. The fair value of the RSA's is determined based on the closing market price of the Company's common stock on the grant date. RSA grants totaled 5, 55 and 789 shares at a weighted average grant date fair value of $3.59, $2.84 and $2.90 during fiscal years 2011, 2010 and 2009, respectively.
A summary of non-vested RSA activity for fiscal years 2011, 2010 and 2009 is as follows:
Restricted Stock Awards | Weighted Average Grant Date Fair Value | |||||
Non-vested awards at June 30, 2008 | 159 | $ | 11.27 | |||
Awards granted | 789 | 2.90 | ||||
Awards vested | (43 | ) | 11.24 | |||
Awards forfeited | (27 | ) | 6.61 | |||
Non-vested awards at June 30, 2009 | 878 | 3.89 | ||||
Awards granted | 55 | 2.84 | ||||
Awards vested | (231 | ) | 4.31 | |||
Awards forfeited | (95 | ) | 3.69 | |||
Non-vested awards at June 30, 2010 | 607 | 3.67 | ||||
Awards granted | 5 | 3.59 | ||||
Awards vested | (212 | ) | 4.00 | |||
Awards forfeited | (1 | ) | 11.47 | |||
Non-vested awards at June 30, 2011 | 399 | $ | 3.47 | |||
As of June 30, 2011, there was $908 of total unrecognized compensation expense related to unvested RSA's under the Plans, and this expense is expected to be recognized over a weighted-average period of 1.1 years.
Restricted Stock Units
Compensation expense for RSU's granted to employees is recognized ratably over the vesting term, which is generally four years. The fair value of RSU's is determined based on the closing market price of the Company's common stock on the grant date. RSU grants totaled 799, 715, and 158 shares at a weighted-average grant date fair value of $2.69, $3.49 and $1.90 per
74
NOTES TO CONSOLIDATED FINANCIAL STATEMENTS (Continued)
In thousands, except per share data
Note 16. Equity (Continued)
share during fiscal years 2011, 2010 and 2009, respectively. During fiscal years 2011 and 2010, 253 and 52 shares vested with a fair value of $824 and $162, respectively. During fiscal year 2009, 158 shares of RSU's were granted to Directors at a weighted-average grant date fair value of $1.90. These RSU's were considered immediately vested due to provisions of the RSU agreements and had a fair value of $300.
A summary of non-vested RSU activity for fiscal years 2011 and 2010 is as follows:
Restricted Stock Units | Weighted Average Grant Date Fair Value | |||||
Non-vested units at June 30, 2008 | — | $ | — | |||
Units granted | 158 | 1.90 | ||||
Units vested | (158 | ) | 1.90 | |||
Non-vested units at June 30, 2009 | — | — | ||||
Units granted | 715 | 3.49 | ||||
Units vested | (52 | ) | 3.08 | |||
Units forfeited | (46 | ) | 3.59 | |||
Non-vested units at June 30, 2010 | 617 | 3.51 | ||||
Units granted | 799 | 2.69 | ||||
Units vested | (253 | ) | 3.29 | |||
Units forfeited | (1 | ) | 1.98 | |||
Non-vested units at June 30, 2011 | 1,162 | $ | 3.00 | |||
As of June 30, 2011, there was $2,922 of total unrecognized compensation expense related to unvested RSU's under the Plans, and this expense is expected to be recognized over a weighted-average period of 2.6 years.
Effective July 1, 2011, the Company entered into a Third Amended and Restated Employment Agreement (the "Employment Agreement") with Christopher P. Vincze, pursuant to which Mr. Vincze will remain in his current position as Chairman of the Board of Directors and Chief Executive Officer of the Company. In connection with the Employment Agreement, 300 RSU's were granted on July 1, 2011 (the "2012 Award") and to the extent he is still employed by the Company at the time 300 will be awarded effective July 1, 2012 (the "2013 Award"). Forty percent of the shares of common stock subject to the RSU's contain time-based vesting restrictions and the remaining sixty percent are subject to performance-based vesting restrictions. The time-based vesting component of the 2012 Award will vest in equal one-fourth increments on July 1 of 2012, 2013, 2014, and 2015; and the time-based vesting component of the 2013 Award, if awarded pursuant to the Employment Agreement, will vest in equal one-third increments on July 1 of 2013, 2014, and 2015. The performance-based vesting components of both RSU's shall vest in their entirety based on earnings per share (“EPS”) for the Company's fiscal year ending June 30, 2014 (or an earlier trailing four-quarter period) (the “FY 2014 Target”). If the FY 2014 Target is not achieved prior to July 1, 2014, the performance-based vesting components will vest in their entirety based on EPS in a trailing four-quarter period ending on or before July 1, 2015. If neither of the EPS targets is met by the indicated dates, the performance-based vesting components of the RSU's will immediately be forfeited.
Performance Stock Units
Compensation expense for PSU's granted to employees is recognized if and when the Company concludes that it is probable that the performance condition will be achieved. The Company reassesses the probability of vesting at each reporting period for awards with performance conditions and adjusts compensation expense based on its probability assessment. The fair value of the PSU's is determined based on the closing market price of the Company's common stock on the grant date. During fiscal year 2011, the Company granted 551 PSU's to employees at a weighted-average grant date fair value of $2.88. The PSU's vest over four years upon meeting certain financial targets for the fiscal year ending June 30, 2011.
As of June 30, 2011, the Compensation Committee of the Company's Board of Directors determined that the performance condition of the PSU's granted during fiscal year 2011 had been achieved, and therefore $296 of compensation expense was recorded during fiscal year 2011.
75
NOTES TO CONSOLIDATED FINANCIAL STATEMENTS (Continued)
In thousands, except per share data
Note 16. Equity (Continued)
As of June 30, 2011, there was $1,291 of total unrecognized compensation expense related to non-vested PSU's under the Plans, and this expense is expected to be recognized over a weighted-average period of 2.0 years.
Warrants
During fiscal year 2010, warrants to purchase 73 shares of the Company's common stock were redeemed for cash of $656. The redemption of the warrants was treated as an investing outflow in the consolidated statement of cash flows for fiscal year 2010 because the warrants related to a prior acquisition.
Stock-Based Compensation
The Company measures stock-based compensation cost at the grant date based on the fair value of the award. The value of the portion of the award that is ultimately expected to vest is recognized as expense over the requisite service periods in the Company's consolidated statements of operations. Stock-based compensation expense includes the estimated effects of forfeitures, and estimates of forfeitures will be adjusted over the requisite service period to the extent actual forfeitures differ, or are expected to differ, from such estimates. Changes in estimated forfeitures will be recognized in the period of change and will also impact the amount of expense to be recognized in future periods. During fiscal years 2011, 2010 and 2009, the Company recognized stock-based compensation expense in cost of services and general and administrative expenses within the consolidated statements of operations as follows:
2011 | 2010 | 2009 | |||||||||
Cost of services | $ | 1,061 | $ | 845 | $ | 837 | |||||
G&A expenses | 1,472 | 1,072 | 1,419 | ||||||||
Total stock-based compensation expense | $ | 2,533 | $ | 1,917 | $ | 2,256 | |||||
Directors' Deferred Compensation
In fiscal year 2011 each non-employee director of the Company received an annual retainer of $35 payable at each director's election in cash or common stock and subject to deferral under the Directors' Deferred Compensation Plan. The Company issued approximately 11, 20 and 37 shares of common stock in fiscal years 2011, 2010 and 2009, respectively, to its non-employee directors under the Directors' Deferred Compensation Plan. The Company recognized approximately $37, $65, and $106 in expense based on the fair value of the shares issued in fiscal years 2011, 2010 and 2009, respectively.
Note 17. Operating Segments
During fiscal year 2009 the Company's accounting system was configured to provide revenue and earnings information that allowed the Company to initiate reporting to its chief operating decision maker ("CODM") under three operating segments. Management established these operating segments based upon the type of project, the client and market to which those projects are delivered, the different marketing strategies associated with the services provided and the specialized needs of the respective clients. Effective in the first quarter of fiscal year 2010, the Company made certain changes to its operating segments in its continuing efforts to align businesses around markets and customers. Operating segment information for all periods presented has been reclassified to reflect the new operating segment structure. The operating segments are as follows:
Energy: The Energy operating segment provides services to a range of clients including energy companies, utilities, other commercial entities, and state and federal governments. The Company's services include program management, engineer/procure/construct projects, design, and consulting. The Company's typical projects involve upgrades and new construction for electrical transmission and distribution systems, energy efficiency program design and management, and alternative energy development. This operating segment also provides services to support energy savings projects for state government entities and end users.
Environmental: The Environmental operating segment provides services to a wide range of clients, including industrial, transportation, energy and natural resource companies, as well as federal, state and municipal agencies. The Environmental operating segment is organized to focus on key areas of demand including: environmental management of buildings, air quality measurements and modeling of potential air pollution impacts, assessment and remediation of contaminated sites and buildings, solid waste management, environmental compliance auditing and strategic due diligence, environmental licensing and permitting of a wide variety of projects, and natural and cultural resource
76
NOTES TO CONSOLIDATED FINANCIAL STATEMENTS (Continued)
In thousands, except per share data
Note 17. Operating Segments (Continued)
assessment and management.
Infrastructure: The Infrastructure operating segment provides services related to the expansion of infrastructure capacity, the rehabilitation of overburdened and deteriorating infrastructure systems, and the management of risks related to security of public and private facilities. The Company's client base is predominantly state and municipal governments as well as selected commercial developers. Primary services include: roadway, bridge and related surface transportation design; structural design of bridges; construction engineering inspection and construction management for roads and bridges; civil engineering for municipalities and public works departments; geotechnical engineering services; and security services including assessments, design and construction management on projects including ports, bridges, airports and correctional facilities. Major markets include the northeast United States, Texas, Louisiana and California.
The Company's CODM is its CEO. The Company's CEO manages the business by evaluating the financial results of the three operating segments focusing primarily on segment revenue and segment profit. The Company utilizes segment revenue and segment profit because it believes they provide useful information for effectively allocating resources among operating segments; evaluating the health of its operating segments based on metrics that management can actively influence; and gauging its investments and its ability to service, incur or pay down debt. Specifically, the Company's CEO evaluates segment revenue and segment profit and assesses the performance of each operating segment based on these measures, as well as, among other things, the prospects of each of the operating segments and how they fit into the Company's overall strategy. The Company's CEO then decides how resources should be allocated among its operating segments. The Company does not track its assets by operating segment, and consequently, it is not practical to show assets by operating segment. Segment profit includes all operating expenses except the following: costs associated with providing corporate shared services (including certain depreciation and amortization), goodwill and intangible asset write-offs, stock-based compensation expense and amortization of intangible assets. Depreciation expense is primarily allocated to operating segments based upon their respective use of total operating segment office space. Assets solely used by Corporate are not allocated to the operating segments. Inter-segment balances and transactions are not material. The accounting policies of the operating segments are the same as those for the Company as a whole, except as discussed herein.
The following tables present summarized financial information for the Company's operating segments (as of and for the periods noted below).
Energy | Environmental | Infrastructure | Total | ||||||||||||
Year ended June 30, 2011: | |||||||||||||||
Gross revenue | $ | 87,372 | $ | 187,412 | $ | 56,050 | $ | 330,834 | |||||||
Net service revenue | 71,625 | 129,396 | 42,278 | 243,299 | |||||||||||
Segment profit | 15,744 | 24,764 | 5,823 | 46,331 | |||||||||||
Depreciation and amortization | 993 | 1,708 | 566 | 3,267 | |||||||||||
Year ended June 30, 2010: | |||||||||||||||
Gross revenue | $ | 77,035 | $ | 195,332 | $ | 59,446 | $ | 331,813 | |||||||
Net service revenue | 59,554 | 120,431 | 46,636 | 226,621 | |||||||||||
Segment profit | 8,572 | 25,170 | 4,565 | 38,307 | |||||||||||
Depreciation and amortization | 961 | 2,467 | 901 | 4,329 | |||||||||||
77
NOTES TO CONSOLIDATED FINANCIAL STATEMENTS (Continued)
In thousands, except per share data
Note 17. Operating Segments (Continued)
Years Ended | |||||||
June 30, 2011 | June 30, 2010 | ||||||
Gross revenue | |||||||
Gross revenue from reportable operating segments | $ | 330,834 | $ | 331,813 | |||
Reconciling items(1) | 2,375 | (1,238 | ) | ||||
Total consolidated gross revenue | $ | 333,209 | $ | 330,575 | |||
Net service revenue | |||||||
Net service revenue from reportable operating segments | $ | 243,299 | $ | 226,621 | |||
Reconciling items(1) | 2,612 | 3,478 | |||||
Total consolidated net service revenue | $ | 245,911 | $ | 230,099 | |||
Loss from operations before taxes and equity in earnings (losses) | |||||||
Segment profit | $ | 46,331 | $ | 38,307 | |||
Corporate shared services(2) | (32,630 | ) | (32,773 | ) | |||
Goodwill and intangible asset impairments | — | (20,249 | ) | ||||
Arena Towers litigation reserve | (17,278 | ) | (1,100 | ) | |||
Stock-based compensation expense | (2,533 | ) | (1,917 | ) | |||
Unallocated depreciation and amortization | (1,462 | ) | (3,720 | ) | |||
Interest expense | (761 | ) | (1,003 | ) | |||
Gain on extinguishment of debt | — | 1,716 | |||||
Total consolidated loss from operations before taxes and equity in earnings (losses) | $ | (8,333 | ) | $ | (20,739 | ) | |
Depreciation and amortization | |||||||
Depreciation and amortization from reportable operating segments | $ | 3,267 | $ | 4,329 | |||
Unallocated depreciation and amortization | 1,462 | 3,720 | |||||
Total consolidated depreciation and amortization | $ | 4,729 | $ | 8,049 | |||
____________________________________
(1) | Amounts represent certain unallocated corporate amounts not considered in the CODM's evaluation of operating segment performance. |
(2) | Corporate shared services consists of centrally managed functions in the following areas: accounting, treasury, information technology, legal, human resources, marketing, internal audit and executive management such as the CEO and various executives. These costs and other items of a general corporate nature are not allocated to the Company's three operating segments. |
Note 18. Commitments and Contingencies
Exit Strategy Contracts
The Company has entered into a number of long-term contracts pursuant to its Exit Strategy program under which the Company is obligated to complete the remediation of environmental conditions at sites. The Company assumes the risk for remediation costs for pre-existing site environmental conditions and believes that through in-depth technical analysis, comprehensive cost estimation and creative remedial approaches it is able to execute pricing strategies which protect the Company's return on these projects. The Company's client pays a fixed price and, as additional protection, for a majority of the contracts the client also pays for a finite risk cost cap insurance policy. The policy, which includes the Company as a named or additional insured party, provides coverage for cost increases from unknown or changed conditions up to a specified maximum amount significantly in excess of the estimated cost of remediation. The Company believes that it is adequately protected from risk on these projects and that it is not likely that it will incur material losses in excess of applicable insurance. However, since
78
NOTES TO CONSOLIDATED FINANCIAL STATEMENTS (Continued)
In thousands, except per share data
Note 18. Commitments and Contingencies (Continued)
we are near the term or financial limits of the insurance on two projects we believe it is reasonably possible that events could occur under certain circumstances on several projects which could be material to the Company's financial statements. The Company would not be able to reasonably estimate potential future costs beyond the limits or term of insurance until such an event occurred and there was additional information as to the exact nature of the event, its impact and duration, among other things, upon which to form the basis for a reasonable estimate.
Certain Exit Strategy contracts entered into by the Company involved the Company entering into consent decrees with government authorities and assuming the obligation for the settling responsible parties' statutory environmental remediation liability at the sites. The Company's expected remediation costs for the aforementioned contracts (included within current and long-term deferred revenue in the consolidated balance sheets) are funded by the contract price and insured by the environmental remediation cost cap policy (current and long-term restricted investments in the consolidated balance sheets). The remediation for one of the projects was completed in fiscal year 2006, and the Company is undertaking long-term maintenance and monitoring at that site.
The Company's indirect cost rates applied to contracts with the U.S. Government and various state agencies are subject to examination and renegotiation. Contracts and other records of the Company with respect to federal contracts have been examined through June 30, 1999. The Company believes that adjustments resulting from such examination or renegotiation proceedings, if any, will not likely have a material impact on the Company's business, operating results, financial position and cash flows.
Legal Matters
The Company and its subsidiaries are subject to claims and lawsuits typical of those filed against engineering and consulting companies. The Company carries liability insurance, including professional liability insurance, against such claims, subject to certain deductibles and policy limits. Except as described herein, management is of the opinion that the resolution of these claims and lawsuits will not likely have a material effect on the Company's operating results, financial position and cash flows.
The Arena Group v. TRC Environmental Corporation and TRC Companies, Inc., District Court Harris County, Texas, 2007. A former landlord of a subsidiary of the Company sued for damages alleging breach of a lease for certain office space in Houston, Texas which the subsidiary vacated. A trial was recently held in this case which resulted in jury verdict being rendered against the Company and its subsidiary on June 20, 2011. As a result, the accompanying consolidated statement of operations for the fiscal year ended June 30, 2011 includes a charge of $17,278 which includes the full value of the verdict as well as pre-judgment interest and certain potential costs associated with appeal. No judgment has been rendered on the verdict and post-trial motions are pending. The Company believes the verdict is incorrect for a number of reasons, and the Company has filed a post-trial motion to disregard a substantial portion of the verdict and will also pursue appellate measures in an effort to reduce or vacate the verdict. The Company believes there are meritorious bases for such post-trial motion and appeal, however this matter will have a material adverse effect on the Company's cash flows. Any payment of damages will be at the end of the appeals process, which could take up to several years. Once a judgment is entered, interest would accrue on the amount ultimately determined to be payable until paid.
In re: World Trade Center Lower Manhattan Disaster Site Litigation, United States District Court for the Southern District of New York, 2006. A subsidiary of the Company has been named as a defendant (along with a number of other defendants) in a number of cases which are pending in the United States District Court for the Southern District of New York and are styled under the caption "In Re World Trade Center Lower Manhattan Disaster Site Litigation." The Complaints allege that the plaintiffs were workers involved in construction, demolition, excavation, debris removal and clean-up in the buildings surrounding the World Trade Center site, allege that plaintiffs were injured and seek unspecified damages for those injuries. The Company believes the subsidiary has meritorious defenses and is adequately insured, however an adverse determination in this matter could have a material effect on the Company's business, operating results, financial position and cash flows.
The Company records actual or potential litigation-related losses in accordance with ASC Topic 450. As of June 30, 2011 and June 30, 2010, the Company had recorded $24,624 and $7,126, respectively, of reserves in the Company's financial statements for probable and estimable liabilities related to the litigation-related losses in which the Company was then involved. The Company also has insurance recovery receivables related to the aforementioned litigation-related reserves of $2,645 and $2,840 as of June 30, 2011 and June 30, 2010, respectively.
The Company periodically adjusts the amount of such reserves when such actual or potential liabilities are paid or
79
NOTES TO CONSOLIDATED FINANCIAL STATEMENTS (Continued)
In thousands, except per share data
Note 18. Commitments and Contingencies (Continued)
otherwise discharged, new claims arise, or additional relevant information about existing or potential claims becomes available. The Company believes that it is reasonably possible that the amount of potential litigation related liabilities could increase by as much as $8,500, of which $3,000 would be covered by insurance.
The Company indemnifies its directors and officers to the maximum extent permitted under the laws of the State of Delaware.
Note 19. Quarterly Financial Information (Unaudited)
Management believes the following unaudited quarterly financial information for fiscal years 2011 and 2010, which is derived from the Company's unaudited interim financial statements, reflects all adjustments necessary for a fair statement of results of operations.
Year Ended June 30, 2011 | First Quarter | Second Quarter | Third Quarter | Fourth Quarter | |||||||||||
Gross revenue | $ | 78,818 | $ | 84,291 | $ | 76,071 | $ | 94,029 | |||||||
Net service revenue | 57,590 | 60,323 | 57,748 | 70,250 | |||||||||||
Operating income (loss) (1) | 3,357 | 2,906 | 1,136 | (14,971 | ) | ||||||||||
Income (loss) from operations before taxes and equity in (losses) earnings | 3,160 | 2,688 | 963 | (15,144 | ) | ||||||||||
Income (loss) from operations before equity in earnings (losses) | 2,696 | 2,466 | 947 | (15,569 | ) | ||||||||||
Net income (loss) | 2,683 | 2,489 | 947 | (15,549 | ) | ||||||||||
Net income (loss) applicable to TRC Companies, Inc. | 2,704 | 2,502 | 952 | (15,530 | ) | ||||||||||
Accretion charges on preferred stock | (3,799 | ) | (3,462 | ) | — | — | |||||||||
Net (loss) income applicable to TRC Companies, Inc.'s common shareholders | (1,095 | ) | (960 | ) | 952 | (15,530 | ) | ||||||||
Basic (loss) earnings per common share | $ | (0.06 | ) | $ | (0.04 | ) | $ | 0.04 | $ | (0.57 | ) | ||||
Diluted (loss) earnings per common share | $ | (0.06 | ) | $ | (0.04 | ) | $ | 0.03 | $ | (0.57 | ) | ||||
_______________________________________
(1) | As previously disclosed, a case titled The Arena Group v. TRC Environmental Corporation and TRC Companies, Inc., was filed in September 2007 and involved a former landlord seeking damages for alleged breach of a lease for certain office space in Houston, Texas that the subsidiary had vacated. The jury in that case returned an adverse verdict against the Company and its subsidiary TRC Environmental Corporation that was significantly in excess of our previously established litigation reserve. Therefore, in the fourth quarter of fiscal year 2011, the Company increased its litigation reserve by $17,278. This adjustment was recorded on the Company's statement of operations under the caption Arena Towers Litigation Reserve (See Note 18). |
80
NOTES TO CONSOLIDATED FINANCIAL STATEMENTS (Continued)
In thousands, except per share data
Note 19. Quarterly Financial Information (Unaudited) (Continued)
Year Ended June 30, 2010 | First Quarter | Second Quarter | Third Quarter | Fourth Quarter | |||||||||||
Gross revenue | $ | 82,357 | $ | 82,264 | $ | 82,101 | $ | 83,853 | |||||||
Net service revenue | 56,960 | 54,240 | 54,577 | 64,322 | |||||||||||
Operating income (loss) (1) | 229 | (1,451 | ) | (397 | ) | (19,833 | ) | ||||||||
(Loss) income from operations before taxes and equity in losses | (35 | ) | 3 | (639 | ) | (20,068 | ) | ||||||||
(Loss) income from operations before equity in losses (2) | (91 | ) | 4,484 | (246 | ) | (20,676 | ) | ||||||||
Net (loss) income | (106 | ) | 4,456 | (269 | ) | (20,655 | ) | ||||||||
Net (loss) income applicable to TRC Companies, Inc. | (79 | ) | 4,493 | (241 | ) | (20,622 | ) | ||||||||
Accretion charges on preferred stock | (834 | ) | (1,218 | ) | (1,779 | ) | (2,600 | ) | |||||||
Net (loss) income applicable to TRC Companies, Inc.'s common shareholders | (913 | ) | 3,275 | (2,020 | ) | (23,222 | ) | ||||||||
Basic (loss) earnings per common share | $ | (0.05 | ) | $ | 0.17 | $ | (0.10 | ) | $ | (1.18 | ) | ||||
Diluted (loss) earnings per common share | $ | (0.05 | ) | $ | 0.16 | $ | (0.10 | ) | $ | (1.18 | ) | ||||
_________________________________
(1) | Fiscal year 2010 fourth quarter results were adversely affected by a $20,249 goodwill impairment charge. |
(2) | Fiscal year 2010 second quarter results were positively affected by a tax benefit of $4,481 related to a carryback claim resulting in a tax refund and changes in the Company's uncertain tax positions. |
Note 20. Subsequent Events
Effective September 3, 2011, the Company acquired The Payne Firm, Inc. (“Payne”), headquartered in Cincinnati, Ohio. Payne provides full life-cycle environmental consulting services to the legal and financial communities and industries ranging from manufacturing and healthcare to higher education. The initial purchase price of approximately $3,800 consisted of cash of $3,500 payable at closing and 61 shares of the Company's common stock valued at $300 (based on the average closing prices of the Company's common stock over the 30 trading-day period preceding the date of the transaction.) In addition, the purchase agreement provides for contingent consideration of up to an additional $1,200 based on performance of the acquired firm over the three fiscal years following closing. Due to the limited time since the closing of the Payne acquisition, the related acquisition accounting is incomplete at this time. As a result, we are unable to provide amounts recognized as of the acquisition date for major classes of assets and liabilities acquired and resulting from the transaction. The impact of this acquisition is not expected to be material to the Company's consolidated balance sheets and results of operations.
81
Item 9. Changes in and Disagreements with Accountants on Accounting and Financial Disclosure
None.
Item 9A. Controls and Procedures
Disclosure Controls and Procedures
The Company maintains disclosure controls and procedures that are designed to provide reasonable assurance that information required to be disclosed in the reports that it files or submits under the Securities Exchange Act of 1934 (the “Exchange Act”) is recorded, processed, summarized and reported within the time periods specified in the SEC's rules and forms. Disclosure controls and procedures include, without limitation, controls and procedures designed to ensure that information required to be disclosed by the Company in the reports that it files or submits under the Exchange Act is accumulated and communicated to management, including the Chief Executive and Chief Financial officer, as appropriate, to allow timely decisions regarding required disclosure.
The Company has evaluated, under the supervision and with the participation of management, including the Chief Executive Officer and Chief Financial Officer, the effectiveness of its disclosure controls and procedures, as defined in Rules 13a-15(e) and 15d-15(e) of the Exchange Act, as of June 30, 2011. Based on that evaluation, the Chief Executive Officer and Chief Financial Officer have concluded that the Company's disclosure controls and procedures were effective as of June 30, 2011.
Management's Annual Report on Internal Control over Financial Reporting
The Company's management is responsible for establishing and maintaining adequate internal control over financial reporting as that term is defined in Exchange Act Rule 13a-15(f). Under the supervision and with the participation of the Company's management, including the Chief Executive Officer and Chief Financial Officer, the Company conducted an evaluation of the effectiveness of its internal control over financial reporting based on the framework in Internal Control - Integrated Framework issued by the Committee of Sponsoring Organizations of the Treadway Commission (“COSO”).
Based on their evaluation, the Company's management concluded that the Company maintained effective internal controls over financial reporting as of June 30, 2011.
Management's evaluation excluded the Environmental Business Unit ("RMT-EBU") of RMT, Inc., a subsidiary of Alliant Energy, from which the Company acquired certain assets on June 6, 2011. At June 30, 2011, RMT-EBU had $14.9 million and $14.0 million of total assets and net assets, respectively. For the year ended June 30, 2011, the Company's consolidated statement of operations included total gross revenue associated with RMT-EBU of $2.2 million. In accordance with guidance issued by the SEC, companies are allowed to exclude acquisitions from their assessment of internal controls over financial reporting during the first year subsequent to the acquisition while integrating the acquired operations.
Deloitte & Touche LLP, the independent registered public accounting firm that audited the Company's consolidated financial statements, has issued an attestation report on the Company's internal control over financial reporting as of June 30, 2011, which is included below in this Item 9A of this Annual Report on Form 10-K.
Changes in Internal Control over Financial Reporting
There has been no change in the Company's internal controls over financial reporting during its most recently completed fiscal quarter that has materially affected, or is reasonably likely to materially affect, the Company's internal controls over financial reporting.
Inherent Limitations on Effectiveness of Controls
The Company's management, including the Chief Executive Officer and Chief Financial Officer, has designed the Company's disclosure controls and procedures and its internal control over financial reporting to provide reasonable assurances that the controls' objectives will be met. However, management does not expect that disclosure controls and procedures or the Company's internal control over financial reporting will prevent or detect all error and all fraud. A control system, no matter how well designed and operated, can provide only reasonable, not absolute, assurance that the control system's objectives will be met. The design of a control system must reflect the fact that there are resource constraints, and the benefits of controls must be considered relative to their costs. Further, because of the inherent limitations in all control systems, no evaluation of controls can provide absolute assurance that misstatements due to error or fraud will not occur or that all control issues and instances of
82
fraud, if any, within the Company have been detected. These inherent limitations include the realities that judgments in decision-making can be faulty and that breakdowns can occur because of a simple error or mistake. Controls can also be circumvented by the individual acts of some persons, by collusion of two or more people, or by management override of the controls. The design of any system of controls is based in part on certain assumptions about the likelihood of future events, and there can be no assurance that any system's design will succeed in achieving its stated goals under all potential future conditions. Projections of any evaluation of a system's control effectiveness into future periods are subject to risks. Over time, controls may become inadequate because of changes in conditions or deterioration in the degree of compliance with policies or procedures.
83
REPORT OF INDEPENDENT REGISTERED PUBLIC ACCOUNTING FIRM
To the Board of Directors and Stockholders of
TRC Companies, Inc.
Windsor, Connecticut
We have audited the internal control over financial reporting of TRC Companies, Inc. (the "Company") as of June 30, 2011, based on criteria established in Internal Control-Integrated Framework issued by the Committee of Sponsoring Organizations of the Treadway Commission. The Company's management is responsible for maintaining effective internal control over financial reporting and for its assessment of the effectiveness of internal control over financial reporting, included in the accompanying Management's Annual Report on Internal Control over Financial Reporting. Our responsibility is to express an opinion on the Company's internal control over financial reporting based on our audit.
We conducted our audit in accordance with the standards of the Public Company Accounting Oversight Board (United States). Those standards require that we plan and perform the audit to obtain reasonable assurance about whether effective internal control over financial reporting was maintained in all material respects. Our audit included obtaining an understanding of internal control over financial reporting, assessing the risk that a material weakness exists, testing and evaluating the design and operating effectiveness of internal control based on that risk, and performing such other procedures as we considered necessary in the circumstances. We believe that our audit provides a reasonable basis for our opinion.
A company's internal control over financial reporting is a process designed by, or under the supervision of, the company's principal executive and principal financial officers, or persons performing similar functions, and effected by the company's board of directors, management, and other personnel to provide reasonable assurance regarding the reliability of financial reporting and the preparation of financial statements for external purposes in accordance with generally accepted accounting principles. A company's internal control over financial reporting includes those policies and procedures that (1) pertain to the maintenance of records that, in reasonable detail, accurately and fairly reflect the transactions and dispositions of the assets of the company; (2) provide reasonable assurance that transactions are recorded as necessary to permit preparation of financial statements in accordance with generally accepted accounting principles, and that receipts and expenditures of the company are being made only in accordance with authorizations of management and directors of the company; and (3) provide reasonable assurance regarding prevention or timely detection of unauthorized acquisition, use, or disposition of the company's assets that could have a material effect on the financial statements.
Because of the inherent limitations of internal control over financial reporting, including the possibility of collusion or improper management override of controls, material misstatements due to error or fraud may not be prevented or detected on a timely basis. Also, projections of any evaluation of the effectiveness of the internal control over financial reporting to future periods are subject to the risk that the controls may become inadequate because of changes in conditions, or that the degree of compliance with the policies or procedures may deteriorate.
In our opinion, the Company maintained, in all material respects, effective internal control over financial reporting as of June 30, 2011, based on the criteria established in Internal Control-Integrated Framework issued by the Committee of Sponsoring Organizations of the Treadway Commission.
We have also audited, in accordance with the standards of the Public Company Accounting Oversight Board (United States), the consolidated financial statements as of and for the year ended June 30, 2011, of the Company and our report dated September 8, 2011 expressed an unqualified opinion on those financial statements.
/s/ Deloitte & Touche
Boston, Massachusetts
September 8, 2011
84
Item 9B. Other Information
None.
Part III
Item 10. Directors, Executive Officers and Corporate Governance
Executive Officers
The following table presents the name and age of each of the Company's executive officers as of June 30, 2011, their present positions with the Company and date of appointment thereto, and other positions held during the past five years, including positions held with other companies and with subsidiaries of the Company:
Name and Age | Present Position and Date of Appointment | Other Positions Held During Last Five Years | ||
Christopher P. Vincze | 49 | Chairman of the Board (November 2006), President and Chief Executive Officer (January 2006) | Senior Vice President and Chief Operating Officer | |
Martin H. Dodd | 58 | Senior Vice President, General Counsel and Secretary (February 1997) | ||
Glenn E. Harkness | 63 | Senior Vice President (September 1997) | ||
Thomas W. Bennet, Jr. | 51 | Senior Vice President and Chief Financial Officer (June 2008) | President, Bennet Consulting Group, LLC, Vice-President and Chief Financial Officer, Connecticut Yankee Atomic Power Company | |
Robert C. Petersen | 68 | Senior Vice President and Chief Operating Officer (August 2010) | Senior Vice President and Environmental and Infrastructure Sector Lead | |
James Mayer | 59 | Senior Vice President and Energy Sector Lead (November 2009) | Senior Vice President Power Delivery | |
David Zarider | 57 | Senior Vice President Business Development (November 2009) | Senior Vice President | |
Board of Directors
Information required by this item is contained under the caption "Election of Directors" in the Company's Proxy Statement for its 2011 Annual Meeting of Shareholders to be held November 17, 2011, and such information is incorporated herein by reference.
Item 11. Executive Compensation
Information required by this item is contained under the caption "Compensation of Executive Officers" in the Company's Proxy Statement for its 2011 Annual Meeting of Shareholders to be held November 17, 2011, and such information is incorporated herein by reference.
Item 12. Security Ownership of Certain Beneficial Owners and Management and Related Stockholder Matters
Information required by this item is contained under the captions "Principal Shareholders" and "Stock Ownership of Directors and Executive Officers" in the Company's Proxy Statement for its 2011 Annual Meeting of Shareholders to be held November 17, 2011, and such information is incorporated herein by reference.
Item 13. Certain Relationships and Related Transactions, and Director Independence
Information required by this item is contained under the caption "Certain Relationships and Related Transactions" in the Company's Proxy Statement for its 2011 Annual Meeting of Shareholders to be held November 17, 2011, and such information is incorporated herein by reference.
85
Item 14. Principal Accounting Fees and Services
Information required by this item is contained under the caption "Appointment of Independent Auditors" in the Company's Proxy Statement for its 2011 Annual Meeting of Shareholders to be held November 17, 2011, and such information is incorporated herein by reference.
PART IV
Item 15. Exhibits and Financial Statement Schedules
(a) (1) Consolidated Financial Statements
The financial statements are set forth under Item 8 of this Form 10-K, as indexed below.
Index to Consolidated Financial Statements | Page |
86
(a) (3) Listing of Exhibits
3.1 | Restated Certificate of Incorporation, dated November 18, 1994, incorporated by reference to the Company's Form 10-K for the fiscal year ended June 30, 1995. | |
3.1.1 | Certificate of Amendment of Restated Certificate of Incorporation, dated July 23 2009, incorporated by reference to the Company's Form 8-K filed on July 23, 2009. | |
3.2 | Bylaws of the Company, as amended, incorporated by reference to the Company's Form S-1 filed on April 16, 1986, Registration No. 33-4896. | |
3.4 | Form of Certificate of Designation of Series A Convertible Preferred Stock, incorporated by reference to the Company's Form 8-K filed on June 1, 2009. | |
*10.1 | Restated Stock Option Plan, dated November 22, 2002, incorporated by reference to the Company's Form 10-K for the fiscal year ended June 30, 2003. | |
10.1.2 | Amended and Restated 2007 Equity Incentive Plan, dated June 20, 2009, incorporated by reference to the Company's Proxy Statement filed on June 22, 2009. | |
*10.1 | Third Amended and Restated Employment Agreement, dated as of June 28, 2011, by and between the Company and Christopher P. Vincze, incorporated by reference to the Company's Form 8-K filed on July 1, 2011. | |
*10.2 | Restricted Stock Unit Award, dated July 1, 2011, by and between the Company and Christopher P. Vincze, incorporated by reference to the Company's Form 8-K filed on July 1, 2011. | |
*10.3 | Form of Restricted Stock Unit Award, dated July 1, 2012, by and between the Company and Christopher P. Vincze, incorporated by reference to the Company's Form 8-K filed on July 1, 2011. | |
10.6.1 | Stock Purchase Agreement, dated March 6, 2006, by and among the Company and purchasers named therein, incorporated by reference to the Company's Form 8-K filed on March 9, 2006. | |
10.6.2 | Registration Rights Agreement, dated March 6, 2006, by and among the Company and the stockholders named therein, incorporated by reference to the Company's Form 8-K filed on March 9, 2006. | |
10.6.3 | Stock Purchase Agreement, dated June 1, 2009, by and among the Company and purchasers named therein, incorporated by reference to the Company's Form 8-K filed on June 1, 2009. | |
10.6.4 | Registration Rights Agreement, dated June 1, 2009, by and among the Company and purchasers named therein, incorporated by reference to the Company's Form 8-K filed on June 1, 2009. | |
10.11 | Credit Agreement, dated July 17, 2006, by and among the Company, certain of its subsidiaries and Wells Fargo Foothill, Inc., incorporated by reference to the Company's Form 8-K filed on July 20, 2006. | |
10.11.13 | Thirteenth Amendment to Credit Agreement, dated August 19, 2008, by and among the Company, certain of its subsidiaries the financial institutions named therein and Wells Fargo Foothill, Inc., incorporated by reference to the Company's Form 8-K filed on August 21, 2008. | |
10.11.14 | Fourteenth Amendment to Credit Agreement, dated June 1, 2009, by and among the Company, certain of its subsidiaries the financial institutions named therein and Wells Fargo Foothill, Inc., incorporated by reference to the Company's Form 8-K filed on June 1, 2009. | |
10.11.15 | Fifteenth Amendment to Credit Agreement, dated January 19, 2010, by and among the Company, certain of its subsidiaries the financial institutions named therein and Wells Fargo Foothill, Inc., incorporated by reference to the Company's Form 8-K filed on January 22, 2010. | |
10.11.19 | Nineteenth Amendment to Credit Agreement, dated August 19, 2011, by and among the Company, certain of its subsidiaries the financial institutions named therein and Wells Fargo Capital Finance, Inc., incorporated by reference to the Company's Form 8-K filed on August 25, 2011. | |
10.12 | Subordinated Loan Agreement, dated July 19, 2006, by and among the Company, certain of its subsidiaries and Federal Partners, L.P., incorporated by reference to the Company's Form 8-K filed on July 20, 2006. | |
21 | Subsidiaries of the Registrant. | |
23.1 | Consent of Independent Registered Public Accounting Firm. | |
31.1 | Certification of Chief Executive Officer Pursuant to Section 302 of the Sarbanes-Oxley Act of 2002. | |
31.2 | Certification of Chief Financial Officer Pursuant to Section 302 of the Sarbanes-Oxley Act of 2002. | |
32.1 | Certification of Chief Executive Officer Pursuant to Section 906 of the Sarbanes-Oxley Act of 2002. | |
32.2 | Certification of Chief Financial Officer Pursuant to Section 906 of the Sarbanes-Oxley Act of 2002. | |
_________________________________
* This exhibit is a management contract or compensatory plan required to be filed as an exhibit to this Form 10-K pursuant to Item 14(c).
87
Signatures
Pursuant to the requirements of Section 13 or 15(d) of the Securities Exchange Act of 1934, the Company has duly caused this report to be signed on its behalf by the undersigned, thereunto duly authorized.
TRC COMPANIES, INC. | ||||
Dated: | September 8, 2011 | By: | /s/ CHRISTOPHER P. VINCZE | |
Christopher P. Vincze Chief Executive Officer and Chairman of the Board | ||||
Pursuant to the requirements of the Securities Exchange Act of 1934, this report has been signed below by the following persons on behalf of the Company and in the capacities and on the dates indicated.
/s/ CHRISTOPHER P. VINCZE | Chief Executive Officer and Chairman of the Board (Principal Executive Officer) | September 8, 2011 | ||
Christopher P. Vincze | ||||
/s/ SHERWOOD L. BOEHLERT | Director | September 8, 2011 | ||
Sherwood L. Boehlert | ||||
/s/ FRIEDRICH K.M. BOHM | Director | September 8, 2011 | ||
Friedrich K.M. Bohm | ||||
/s/ F. THOMAS CASEY | Director | September 8, 2011 | ||
F. Thomas Casey | ||||
/s/ STEPHEN M. DUFF | Director | September 8, 2011 | ||
Stephen M. Duff | ||||
/s/ RICHARD H. GROGAN | Director | September 8, 2011 | ||
Richard H. Grogan | ||||
/s/ ROBERT W. HARVEY | Director | September 8, 2011 | ||
Robert W. Harvey | ||||
/s/ DENNIS E. WELCH | Director | September 8, 2011 | ||
Dennis E. Welch | ||||
/s/ THOMAS W. BENNET, JR. | Senior Vice President and Chief Financial Officer (Principal Financial Officer and Principal Accounting Officer) | September 8, 2011 | ||
Thomas W. Bennet, Jr. | ||||
88
TRC Companies, Inc.
Form 10-K Exhibit Index
Fiscal Year Ended June 30, 2011
Exhibit Number | Description | |
21 | Subsidiaries of the Registrant. | |
23.1 | Consent of Independent Registered Public Accounting Firm. | |
31.1 | Certification of Chief Executive Officer Pursuant to Section 302 of the Sarbanes-Oxley Act of 2002. | |
31.2 | Certification of Chief Financial Officer Pursuant to Section 302 of the Sarbanes-Oxley Act of 2002. | |
32.1 | Certification of Chief Executive Officer Pursuant to Section 906 of the Sarbanes-Oxley Act of 2002. | |
32.2 | Certification of Chief Financial Officer Pursuant to Section 906 of the Sarbanes-Oxley Act of 2002. | |
89