Attached files
| file | filename |
|---|---|
| 8-K - FORM 8-K - SPARTON CORP | d8k.htm |
| EX-99.1 - SCRIPT FOR CONFERENCE CALL - SPARTON CORP | dex991.htm |
 Fiscal 2011 Fourth Quarter
and Full Year Financial
Results Conference Call
September 8, 2011
EXHIBIT 99.2 |
 2
Safe Harbor Statement
Safe Harbor Statement
Certain statements herein constitute forward-looking statements within the meaning of the
Securities Act of 1933, as amended and the Securities Exchange Act of 1934, as amended.
When used herein, words such as “believe,” “expect,” “anticipate,”
“project,” “plan,” “estimate,” “will” or
“intend” and similar words or expressions as they relate to the Company or its
management constitute forward-looking statements. These forward-looking statements reflect
our current views with respect to future events and are based on currently available financial,
economic and competitive data and our current business plans. The Company is under no
obligation to, and expressly disclaims any obligation to, update or alter its forward-looking
statements whether as a result of such changes, new information, subsequent events or
otherwise. Actual results could vary materially depending on risks and uncertainties that may
affect our operations, markets, prices and other factors. Important factors that could cause actual
results to differ materially from those forward-looking statements include those contained
under the heading of risk factors and in the management’s discussion and analysis
contained from time- to-time in the Company’s filings with the Securities and
Exchange Commission.
Adjusted operating income, adjusted net income and adjusted income per share – basic and
diluted are non-GAAP financial measures that exclude or add the effect of certain gains and
charges, including imputing taxes at a 36% effective rate. Sparton believes that the presentation
of non-GAAP financial information provides useful supplemental information to management
and investors regarding financial and business trends relating to the Company’s financial
results. More detailed information, including period over period segment comparisons,
non-GAAP reconciliation tables and the reasons management believes non-GAAP measures
provide useful information to investors, is included in the Fiscal 2011 Fourth Quarter and Full
Year Results press release and 8-K dated September 7, 2011. |
 3
•
Fiscal 2011 Fourth Quarter and Full Year Consolidated Results
•
4
Quarter Segmented Operating Results
•
Liquidity & Capital Resources
•
Medical Financial Results by Location
•
Colorado Financial Comparison
•
Fiscal 2011 Growth Investment Summary
•
Outlook
•
Q & A
Today’s Agenda
Today’s Agenda
th |
 4
Consolidated Financial Results
Consolidated Financial Results
Fiscal 2011 Fourth Quarter
Fiscal 2011 Fourth Quarter
($ in 000’s, except per share)
(adjusted removes certain gains and charges, including imputing taxes at 36%
effective rate) (Adjusted)
2011
2010
2011
2010
Net Sales
$ 60,902
$ 40,013
$ 60,902
$ 40,013
$ 20,889
Gross Profit
10,393
5,507
10,393
5,507
4,886
17.1%
13.8%
17.1%
13.8%
Selling and Administrative Expense
5,176
4,188
5,176
4,188
(988)
8.5%
10.5%
8.5%
10.5%
Internal R&D Expense
546
-
546
-
(546)
Restructuring and Impairment Charges
16,814
n/a
n/a
Gain On Acquisition
-
-
n/a
n/a
Gain On PP&E
-
(3,119)
n/a
n/a
Operating Income (Loss)
(12,343)
2,256
4,471
1,092
3,379
-20.3%
5.6%
7.3%
2.7%
Income (Loss) Before Provision For (Benefit From) Income Tax
(12,346)
2,209
4,468
1,045
3,423
Provision For (Benefit From) Income Taxes
(11,619)
111
1,608
376
(1,232)
Net Income
$ (727)
$ 2,098
$ 2,860
$ 669
$ 2,191
-1.2%
5.2%
4.7%
1.7%
Income per Share, Basic and Diluted
$ (0.07)
$ 0.21
$ 0.28
$ 0.07
$ 0.21
Quarter ended June 30,
Quarter ended June 30,
YoY
Variance
(Reported)
(Adjusted)
1,955 |
 5
Consolidated Financial Results
Consolidated Financial Results
Fiscal 2011 Year End
Fiscal 2011 Year End
(Adjusted)
2011
2010
2011
2010
Net Sales
$ 203,352
$ 173,977
$ 203,352
$ 173,977
$ 29,375
Gross Profit
33,168
26,583
33,168
26,583
6,585
16.3%
15.3%
16.3%
15.3%
Selling and Administrative Expense
20,842
18,205
20,842
18,205
(2,637)
10.2%
10.5%
10.2%
10.5%
Internal R&D Expense
1,110
-
1,110
-
(1,110)
Restructuring and Impairment Charges
16,891
4,076
n/a
n/a
Gain On Acquisition
(2,550)
-
n/a
n/a
Gain On PP&E
(139)
(3,119)
n/a
n/a
Operating Income (Loss)
(3,829)
5,722
10,373
6,679
3,694
-1.9%
3.3%
5.1%
3.8%
Income (Loss) Before Provision For (Benefit From) Income Tax
(3,943)
5,524
10,259
6,280
3,979
Provision For (Benefit From) Income Taxes
(11,404)
(1,916)
3,693
2,261
(1,432)
Net Income
$ 7,461
$ 7,440
$ 6,566
$ 4,019
$ 2,547
3.7%
4.3%
3.2%
2.3%
Income per Share, Basic and Diluted
$ 0.73
$ 0.75
$ 0.64
$ 0.40
$ 0.24
($ in 000’s, except per share)
(adjusted removes certain gains and charges, including imputing taxes at 36%
effective rate) Fiscal
YoY
Variance
Fiscal
(Reported)
(Adjusted) |
 6
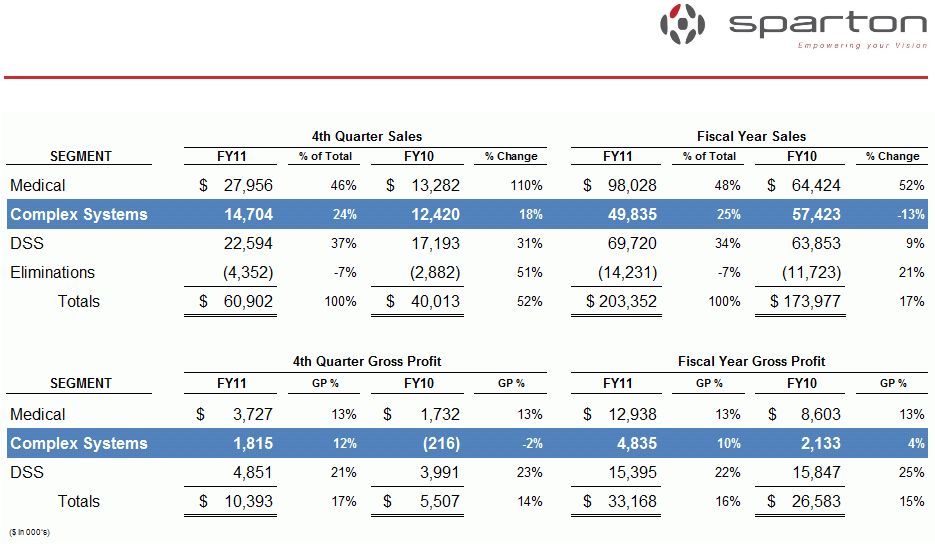
Operating Results
Operating Results
Medical
Medical
SEGMENT
FY11
% of Total
FY10
% Change
FY11
% of Total
FY10
% Change
Medical
$ 27,956
46%
$ 13,282
110%
$ 98,028
48%
$ 64,424
52%
Complex Systems
14,704
24%
12,420
18%
49,835
25%
57,423
-13%
DSS
22,594
37%
17,193
31%
69,720
34%
63,853
9%
Eliminations
(4,352)
-7%
(2,882)
51%
(14,231)
-7%
(11,723)
21%
Totals
$ 60,902
100%
$ 40,013
52%
$ 203,352
100%
$ 173,977
17%
SEGMENT
FY11
GP %
FY10
GP %
FY11
GP %
FY10
GP %
Medical
$ 3,727
13%
$ 1,732
13%
$ 12,938
13%
$ 8,603
13%
Complex Systems
1,815
12%
(216)
-2%
4,835
10%
2,133
4%
DSS
4,851
21%
3,991
23%
15,395
22%
15,847
25%
Totals
$ 10,393
17%
$ 5,507
14%
$ 33,168
16%
$ 26,583
15%
($ in 000’s)
4th Quarter Sales
4th Quarter Gross Profit
Fiscal Year Sales
Fiscal Year Gross Profit |
 7
Operating Results
Operating Results
Complex Systems
Complex Systems |
 8
Operating Results
Operating Results
Defense & Security Systems
Defense & Security Systems
SEGMENT
FY11
% of Total
FY10
% Change
FY11
% of Total
FY10
% Change
Medical
$ 27,956
46%
$ 13,282
110%
$ 98,028
48%
$ 64,424
52%
Complex Systems
14,704
24%
12,420
18%
49,835
25%
57,423
-13%
DSS
22,594
37%
17,193
31%
69,720
34%
63,853
9%
Eliminations
(4,352)
-7%
(2,882)
51%
(14,231)
-7%
(11,723)
21%
Totals
$ 60,902
100%
$ 40,013
52%
$ 203,352
100%
$ 173,977
17%
SEGMENT
FY11
GP %
FY10
GP %
FY11
GP %
FY10
GP %
Medical
$ 3,727
13%
$ 1,732
13%
$ 12,938
13%
$ 8,603
13%
Complex Systems
1,815
12%
(216)
-2%
4,835
10%
2,133
4%
DSS
4,851
21%
3,991
23%
15,395
22%
15,847
25%
Totals
$ 10,393
17%
$ 5,507
14%
$ 33,168
16%
$ 26,583
15%
($ in 000’s)
4th Quarter Sales
4th Quarter Gross Profit
Fiscal Year Sales
Fiscal Year Gross Profit |
 9
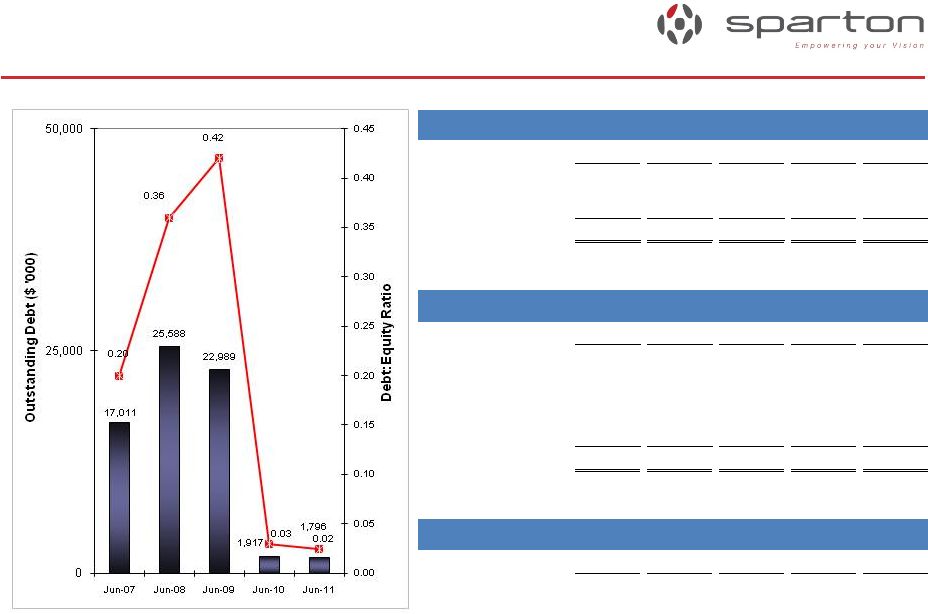
Liquidity & Capital Resources
Liquidity & Capital Resources
($ in '000)
Jun-10
Sep-10
Dec-10
Mar-11
Jun-11
Cash and equivalents
30,589
27,281
29,941
26,119
24,550
LOC Availability
16,897
17,769
17,389
17,497
17,541
Total
47,486
45,050
47,330
43,616
42,091
($ in '000)
Jun-10
Sep-10
Dec-10
Mar-11
Jun-11
Credit Revolver
-
-
-
-
-
Long Bank Term Debt
-
-
-
-
-
Former Astro Owners
-
-
-
-
-
IRB (Ohio)
1,917
1,887
1,856
1,826
1,796
Total
1,917
1,887
1,856
1,826
1,796
($ in '000)
Jun-10
Sep-10
Dec-10
Mar-11
Jun-11
Net Inventory
26,514
36,629
35,076
40,282
38,752
Cash Availability
Debt
Inventory |
 10
Medical
Medical
Financial Results by Location
Financial Results by Location
($ in 000’s)
Total Medical
Colorado
Strongsville
Total Medical
Colorado
Strongsville
Net Sales
$ 27,956
$ 14,229
$ 13,727
$ 98,028
$ 42,320
$ 55,708
Gross Profit
3,727
2,059
1,668
12,938
6,082
6,856
Gross Margin
13.3%
14.5%
12.2%
13.2%
14.4%
12.3%
1,994
1,110
884
6,362
3,235
3,127
Adjusted Operating Margin
7.1%
7.8%
6.4%
6.5%
7.6%
5.6%
*Adjusted for the exclusion of restructuring charges, gain on sale of acquisition
and impairments of goodwill and intangible assets. 3 months ending June 30,
2011 Fiscal 2011
Adjusted Operating Income |
 11
Colorado Financial Comparison
Colorado Financial Comparison
($ in 000’s)
2011
2010
2011
2010
Colorado
Colorado Pro
Forma
Colorado Pro
Forma
Colorado Pro
Forma
Net Sales
$ 14,229
$ 9,360
$ 52,384
$ 39,046
Gross Profit
2,059
510
6,957
1,364
Gross Margin
14.5%
5.4%
13.3%
3.5%
Gain on Acquisition
-
-
2,550
-
Operating Income (Loss)
1,080
(111)
5,490
(1,450)
Operating Margin
7.6%
-1.2%
10.5%
-3.7%
3 months ending June 30,
Fiscal year
Note:
manufacturing businesses of Delphi Medical and Byers Peak as though the acquisitions had occurred as
of July 1, 2009.
The above table summarizes, on a pro forma basis, the results of the operations of the acquired
contract |
 12
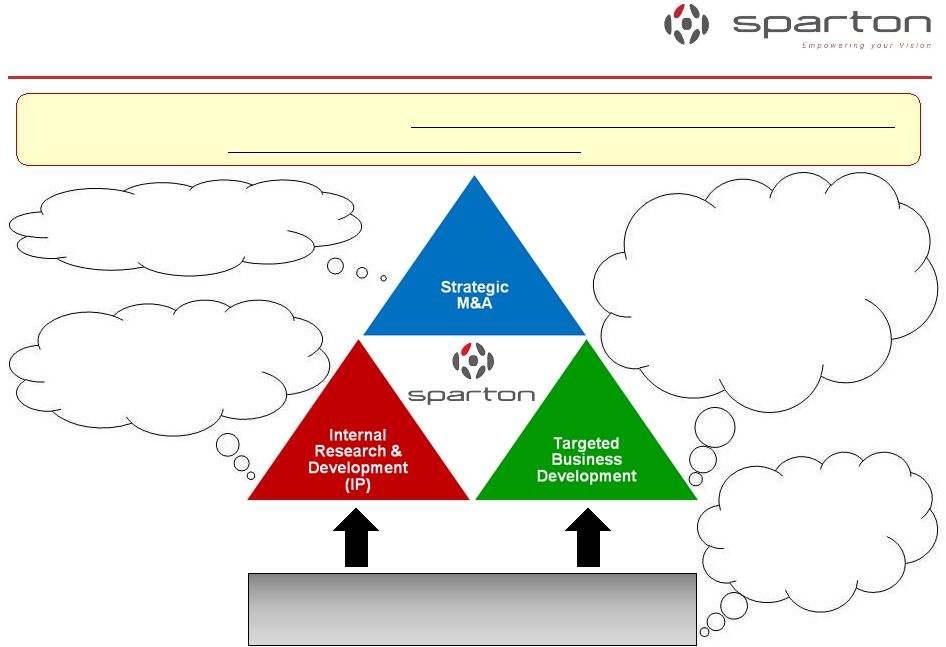
Growth Investments
Growth Investments
Fiscal 2011 Summary
Fiscal 2011 Summary
Focus:
Use
growth
investments
to
achieve
sustainable
year-over-year
revenue
and
profit
increases
and
to
further
place
protective
barriers
around
Sparton.
Supported by market research &
go-to-market programs
•
Delphi Medical Systems on August 6, 2010
•
Byers Peak on March 4, 2011
•
Added 7 business development managers
and ancillary support staff
•
Implemented a new business development
process
•
Won 26 new programs that were
4.5% of FY11 sales (will be 9.1%
of the FY12 sales plan)
•
11 brand new customers
•
Developed the new gyro-enhanced digital
compass (GEDC-6) for a FY12 launch
•
Repackaged the hydrophone as
the PHOD-1 for a FY12 launch
•
New logo, font, and tagline
•
Rebuilt website & micro-sites
•
New marketing collateral
•
New trade show booth |
 13
•
Focus on sustained profitability
–
Continue margin improvements in Complex Systems
•
Targeted gross margin range adjusted up to 7%-10%
–
Backfill Strongsville revenue losses with new business
–
Offset reduced U.S. Navy sonobuoy contracts with foreign sonobuoy sales
–
Continue improvements in operating performance through lean and quality
efforts •
Implementation of the strategic growth plan
–
Continue refining the new business development process to increase the new
business opportunity funnel and win more new business
–
Continue to target the right trade show venues
–
Continue to invest in internal R&D for new product introductions
–
Challenge the technical staff to develop new & innovative ideas
–
Continue to look at complementary and compatible acquisitions
•
Continue
to
attend
Investor
Conferences
and
maintain
an
Investor
Relations
road
show schedule to visit new and existing investors on a regular basis
Fiscal 2012 Outlook
Fiscal 2012 Outlook |
 14
Q & A |