Attached files
| file | filename |
|---|---|
| 8-K - FORM 8-K - PPL Corp | form8k.htm |

1
© PPL Corporation 2011
PPL Corporation
Barclays Capital Conference
September 8, 2011
September 8, 2011
Exhibit 99.1

2
© PPL Corporation 2011
Any statements made in this presentation about future operating
results or other future events are forward-looking statements under
the Safe Harbor Provisions of the Private Securities Litigation Reform
Act of 1995. Actual results may differ materially from such forward-
looking statements. A discussion of factors that could cause actual
results or events to vary is contained in the Appendix to this
presentation and in the Company’s SEC filings.
Cautionary Statements and Factors
That May Affect Future Results
That May Affect Future Results

3
© PPL Corporation 2011
PPL has a highly attractive and differentiated position in the electric industry
Investment Highlights
§ Predominantly rate-regulated business mix with significant growth prospects
§ Operations in constructive jurisdictions
§ Approximately two-thirds of regulated capital expenditures earn real-time or near real-time
returns
returns
§ ~ 9% compound annual growth in rate base from 2011 to 2015
§ Expect 75% of 2013 EBITDA from regulated businesses
§ Highly attractive competitive generation fleet
§ Competitively positioned nuclear, hydro and efficient coal
§ Complemented by flexible dispatch gas fired units
§ No significant exposure to currently proposed environmental regulations
§ Multiple drivers of significant upside
§ Increasing natural gas prices
§ Increasing heat rates
§ Environmental regulation
§ Business Risk Profile rated “Excellent” by S&P
§ Stable ratings outlooks
§ Secure dividend with strong platform for future growth

4
© PPL Corporation 2011
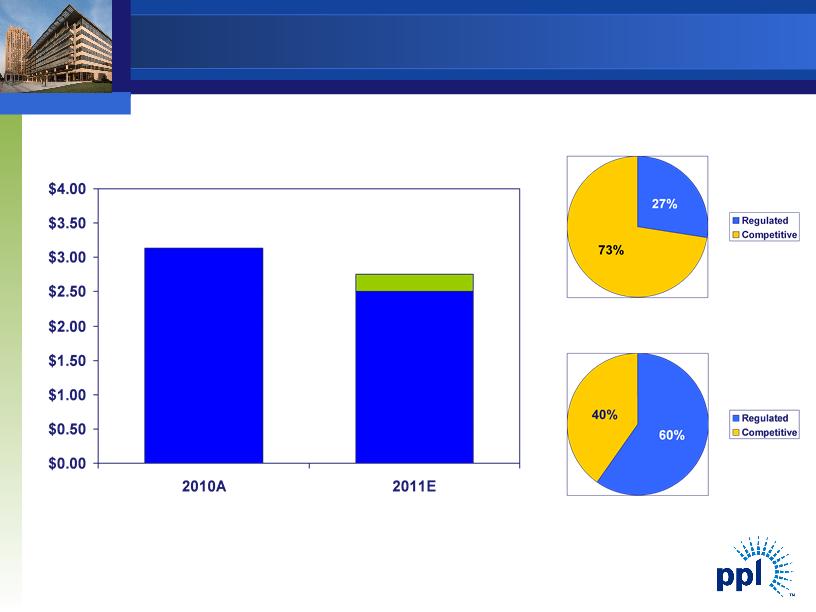
$/Share
Annualized
A significantly more rate-regulated business mix provides strong
support for current dividend and a platform for future growth
(1) Ongoing EPS based on mid-point of forecast. Annualized dividend based on 4th quarter declaration. Actual dividends to
be determined by Board of Directors.
be determined by Board of Directors.
(2) From only regulated segments.
(2)
(1)
Dividend Profile

5
© PPL Corporation 2011
Our Strengths
§ Strong regulatory relationships
§ Best in class reliability, customer service
§ Strong operating performance - regulated and
competitive
competitive
§ Strong environmental position by competitive
generation fleet
generation fleet
§ Excellent cost-management
§ Knowledgeable, dedicated employees

6
© PPL Corporation 2011
International: Midlands Integration Update
§ Synergy plan for Midlands integration on track
§ Road shows completed for 3,900 Midlands staff setting out
WPD background values and approach to integration - 36
presentations over 9 days
WPD background values and approach to integration - 36
presentations over 9 days
§ 85% of union members from the four unions voted to move
to single set of WPD terms and conditions
to single set of WPD terms and conditions
§ Transition from a functional structure to a regional structure
under way and will result in:
under way and will result in:
§ Smaller support structure
§ Elimination of duplicate work
§ Implementation of more efficient procedures
§ All IT, policy and business processes to be changed to WPD
model; December 1st switchover to WPD IT systems
model; December 1st switchover to WPD IT systems

7
© PPL Corporation 2011
§ Total Capital Expenditures - $2,500M
§ LG&E - capital projects totaling $1,392M
§ Mill Creek Air Compliance - $1,268M
§ FGD upgrade/replacement, Baghouse Systems, SCR Turn-downs
§ Trimble County Unit 1 Air Compliance - $124M
§ Baghouse System
§ KU - capital projects totaling $1,114M
§ Ghent Air Compliance - $712M
§ Baghouse Systems, SCR Turn-downs
§ Brown Air Compliance - $344M
§ Baghouse Systems
§ Brown Landfill - $59M
§ Conversion of Main Ash Pond to Landfill
§ Plan also seeks recovery of O&M associated with all projects
§ LG&E O&M expense $55M in 2016
§ KU O&M expense $87M in 2016
Kentucky: 2011 ECR Plan - Summary

8
© PPL Corporation 2011
§ Positive momentum on approval process for
Susquehanna-Roseland line:
Susquehanna-Roseland line:
§ Favorable Commonwealth Court decision in Pennsylvania.
§ Working with National Park Service (NPS) to eliminate any further
delay in Environmental Impact Statement process.
delay in Environmental Impact Statement process.
§ Expecting NPS Record of Decision in October 2012.
§ Continuing other permitting activities to be ready for construction.
§ Optimistic about in-service date in the spring of 2015.
Pennsylvania: Susquehanna-Roseland
Transmission Line
Transmission Line

9
© PPL Corporation 2011
§ HB1294 voted out of Consumer Affairs Committee
§ Expected to be considered by House of
Representatives in fall
Representatives in fall
§ Bill provides for the recovery of a broad range of capital
projects geared toward improving and maintaining
safety and reliability
projects geared toward improving and maintaining
safety and reliability
Pennsylvania: Alternative Rate Making

10
© PPL Corporation 2011
§ Coal Retirements in PJM
§ In light of multiple EPA regulations, 7 - 17 GWs of PJM coal-fired capacity is at-
risk for retirement by 2019.
risk for retirement by 2019.
§ Bulk of the units have an average age over 50 years, are under 500 MWs, and have
capacity factors around 30%.
capacity factors around 30%.
§ Nearly half of the units expected to be retired are located in western PJM.
§ Price Impact
§ Anticipate an increase in PJM West Hub prices
§ Actual increase difficult to predict currently as:
§ The allowance market is not yet functioning, creating uncertainty in allowance prices.
§ Retrofit costs and operational adjustments are not fully incorporated.
§ Heat rates will likely expand as coal-fired generation either retires or backs down.
§ PPL Impact
§ PJM Fleet - Our proactive approach has positioned PPL to capture anticipated
increases in PJM pricing while having minimal impacts on operations.
increases in PJM pricing while having minimal impacts on operations.
Supply: Market Fundamentals

11
© PPL Corporation 2011
Appendix
12
© PPL Corporation 2011
$3.13
$2.75
$/Share
(1) Based on mid-point of forecasted earnings range.
Note: See appendix for reconciliation of earnings from ongoing operations to reported earnings.
(1)
$2.50
2010A
2011E
2011 Earnings from Ongoing Operations Forecast

13
© PPL Corporation 2011
Millions of
Dollars
Dollars
(1) 2010 Free Cash Flow includes two months of the results of the Kentucky Regulated segment.
Note: See Appendix for reconciliation of free cash flow before dividends to cash from operations.
(1)
2011
Forecast
Free Cash Flow before Dividends
14
© PPL Corporation 2011
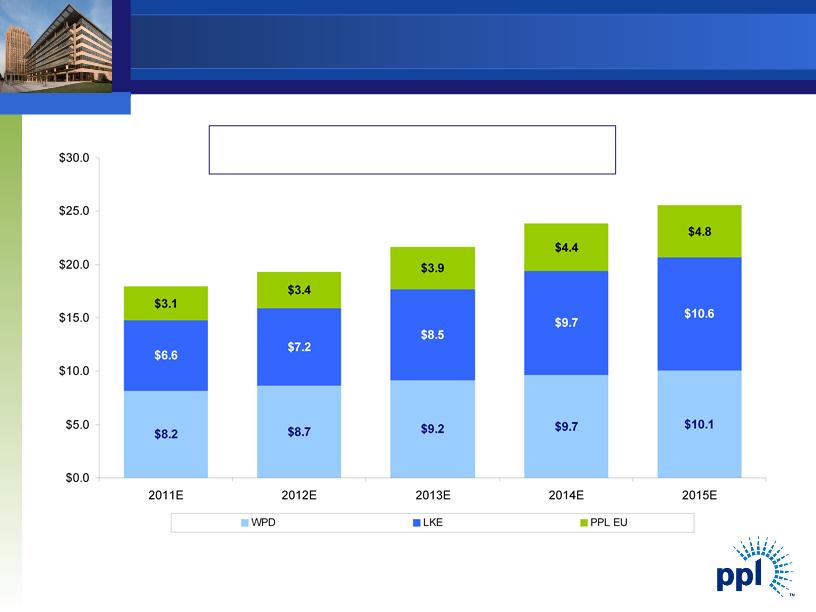
Regulated Rate Base Growth
($ in billions)
(1) Represents capitalization for LKE, as LG&E and KU rate constructs are based on capitalization. Represents Regulatory Asset Value (RAV) for WPD.
(2) Includes RAV for WPD Midlands. Figures based on assumed exchange rate of $1.60 / GBP and are as of year-end December 31.
$17.9
$19.3
$21.6
$23.8
$25.5
2011E - 2015E Regulatory Asset Base(1) CAGR: 9.3%
(2)

15
© PPL Corporation 2011
Capital Expenditures
($ in billions)
(1) Includes capex for WPD Midlands. Figures based on assumed exchange rate of $1.60 / GBP.
(2) Expect approximately 85% to receive timely returns via ECR mechanism based on historical experience.
(1)
(2)
$2.8
$3.7
$4.3
$4.1
$3.7

16
© PPL Corporation 2011
§ July 16 - Filed Application for ECR Plan
§ Discovery began in July; LG&E and KU filed responses to data requests between July 25 and
August 10
August 10
§ Early September
§ Public Meetings to be held in Louisville, Lexington, Henderson and Corbin areas
§ September 1
§ LG&E and KU to file responses to 2nd Round of data requests of PSC Staff and Interveners
§ September 16
§ Intervener testimony to be filed
§ September 30
§ Data requests issued to Interveners
§ October 13
§ Intervener responses to be filed
§ October 24
§ Rebuttal testimony to be filed
§ November 9-10 (tentative)
§ Public Hearing at PSC in Frankfort
§ December 16
§ Statutory deadline to issue final Order
2011 ECR Plan - Procedural Schedule

17
© PPL Corporation 2011
Capacity revenues are expected to be $430 million, $385 million and $590 million for 2011, 2012 and 2013, respectively.
As of June 30, 2011
(1) Represents expected sales based on current business plan assumptions.
(2) The 2011 average hedge energy prices are based on the fixed price swaps as of June 30, 2011; the prior collars have all been converted to fixed swaps.
(3) The 2012 and 2013 ranges of average energy prices for existing hedges were estimated by determining the impact on the existing collars resulting from 2012 and 2013 power prices at the
5th and 95th percentile confidence levels.
5th and 95th percentile confidence levels.
(4) Includes six months of actual results.
(5) Transportation contract in negotiation.
|
|
|
|
2011(4)
|
|
2012
|
|
2013
|
|
Baseload
|
|
|
|
|
|
|
|
|
Expected Generation(1) (Million MWhs)
|
|
|
47.9
|
|
54.7
|
|
54.4
|
|
East
|
|
|
40.1
|
|
46.2
|
|
46.0
|
|
West
|
|
|
7.8
|
|
8.5
|
|
8.4
|
|
|
|
|
|
|
|
|
|
|
Current Hedges (%)
|
|
|
98%
|
|
97%
|
|
69%
|
|
East
|
|
|
99%
|
|
98%
|
|
69%
|
|
West
|
|
|
97%
|
|
95%
|
|
72%
|
|
|
|
|
|
|
|
|
|
|
Average Hedged Price (Energy Only) ($/MWh)(2) (3)
|
|
|
|
|
|
|
|
|
East
|
|
|
$57
|
|
$54-55
|
|
$53-56
|
|
West
|
|
|
$54
|
|
$53-54
|
|
$50-51
|
|
|
|
|
|
|
|
|
|
|
Current Coal Hedges (%)
|
|
|
100%
|
|
96%
|
|
88%
|
|
East
|
|
|
100%
|
|
95%
|
|
91%
|
|
West
|
|
|
100%
|
|
100%
|
|
79%
|
|
|
|
|
|
|
|
|
|
|
Average Hedged Consumed Coal Price (Delivered $/Ton)
|
|
|
|
|
|
|
|
|
East
|
|
|
$73-74
|
|
$76-80
|
|
(5)
|
|
West
|
|
|
$23-27
|
|
$23-29
|
|
$23-30
|
|
|
|
|
|
|
|
|
|
|
Intermediate/Peaking
|
|
|
|
|
|
|
|
|
Expected Generation(1) (Million MWhs)
|
|
|
7.6
|
|
6.2
|
|
6.3
|
|
Current Hedges (%)
|
|
|
87%
|
|
32%
|
|
19%
|
Enhancing Value Through Active Hedging
18
© PPL Corporation 2011
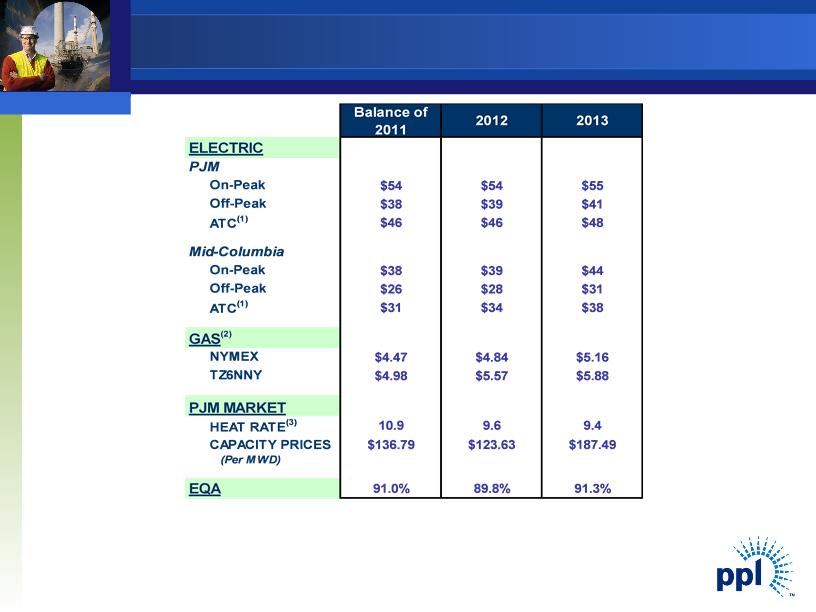
Market Prices
|
(1)
|
24-hour average.
|
|
(2)
|
NYMEX and TZ6NNY forward gas prices on 6/30/2011.
|
|
(3)
|
Market Heat Rate = PJM on-peak power price divided by TZ6NNY gas
price. |
Balance of 2011 2012 2013 ELECTRIC PJM On-Peak $54 $54 $55 Off-Peak
$38 $39 $41 ATC(1) $46 $46 $48 Mid-Columbia On-Peak $38 $39 $44 Off-Peak
$26 $28 $31 ATC(1) $31 $34 $38 GAS(2) NYMEX
$4.47 $4.84 $5.16 TZ6NNY $4.98 $5.57 $5.88 PJM MARKET HEAT RATE(3) 10.9 9.6 9.4 CAPACITY PRICES $136.79 $123.63 $187.49 (Per MWD)
EQA 91.0% 89.8% 91.3%
19
© PPL Corporation 2011
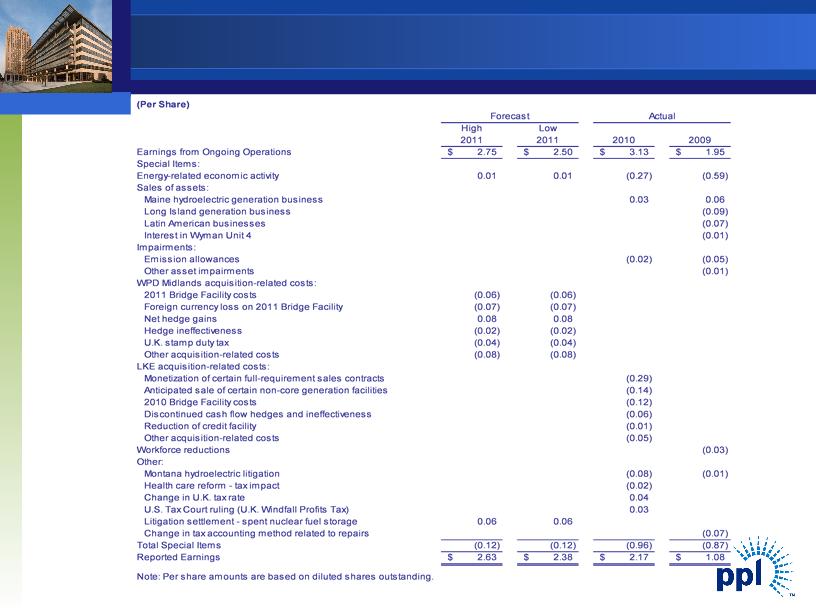
Reconciliation of PPL’s Earnings from Ongoing
Operations to Reported Earnings
Operations to Reported Earnings
(Per Share) Forecast Actual High Low 2011 2011 2010 2009 Earnings from Ongoing
Operations $ 2.75 $ 2.50 $ 3.13 $ 1.95 Special Items: Energy-related economic
activity 0.01 0.01 (0.27) (0.59) Sales of assets: Maine hydroelectric generation business 0.03 0.06 Long Island generation
business (0.09) Latin American businesses (0.07) Interest in Wyman Unit 4 (0.01) Impairments: Emission allowances (0.02) (0.05) Other asset
impairments (0.01) WPD Midlands acquisition-related costs: 2011 Bridge Facility costs (0.06) (0.06) Foreign currency loss on 2011 Bridge Facility (0.07) (0.07) Net hedge
gains 0.08 0.08 Hedge ineffectiveness (0.02) (0.02) U.K. stamp duty tax (0.04) (0.04) Other acquisition-related
costs (0.08) (0.08) LKE acquisition-related costs: Monetization of certain full-requirement sales contracts (0.29) Anticipated sale of certain non-core generation facilities (0.14) 2010 Bridge Facility costs (0.12) Discontinued cash flow hedges and
ineffectiveness (0.06) Reduction of credit facility (0.01) Other acquisition-related costs (0.05) Workforce reductions (0.03) Other: Montana hydroelectric
litigation (0.08) (0.01) Health care reform - tax impact (0.02) Change in U.K. tax rate 0.04 U.S. Tax Court ruling (U.K. Windfall Profits Tax) 0.03 Litigation settlement - spent nuclear fuel
storage 0.06 0.06 Change in tax accounting method related to repairs (0.07) Total Special Items (0.12) (0.12) (0.96) (0.87) Reported
Earnings $ 2.63 $ 2.38 $ 2.17 $ 1.08 Note: Per share amounts are based on diluted shares outstanding.

20
© PPL Corporation 2011
|
|
2009
|
2010
|
2011
|
||
|
Cash from Operations
|
$1,852
|
|
$2,034
|
|
$2,020
|
|
Increase (Decrease) in cash due to:
|
|
|
|
|
|
|
Capital Expenditures
|
(1,265)
|
|
(1,644)
|
|
(2,805)
|
|
Sale of Assets
|
84
|
|
161
|
|
384
|
|
Other Investing Activities - Net
|
(71)
|
|
(20)
|
|
111
|
|
Free Cash Flow before Dividends
|
$ 600
|
|
$ 531
|
|
$ (290)
|
(Millions of Dollars)
PPL Corporation Reconciliation of Cash from
Operations to Free Cash Flow before Dividends
Operations to Free Cash Flow before Dividends

21
© PPL Corporation 2011
Statements contained in this presentation, including statements with respect to future earnings, cash flows, financing, regulation and
corporate strategy are "forward-looking statements" within the meaning of the federal securities laws. Although PPL Corporation
believes that the expectations and assumptions reflected in these forward-looking statements are reasonable, these statements are
subject to a number of risks and uncertainties, and actual results may differ materially from the results discussed in the statements.
The following are among the important factors that could cause actual results to differ materially from the forward-looking statements:
market demand and prices for energy, capacity and fuel; weather conditions affecting customer energy usage and operating costs;
competition in power markets; the effect of any business or industry restructuring; the profitability and liquidity of PPL Corporation and
its subsidiaries; new accounting requirements or new interpretations or applications of existing requirements; operating performance of
plants and other facilities; the length of scheduled and unscheduled outages at our generating plants; environmental conditions and
requirements and the related costs of compliance, including environmental capital expenditures and emission allowance and other
expenses; system conditions and operating costs; development of new projects, markets and technologies; performance of new
ventures; asset or business acquisitions and dispositions, and PPL Corporation’s ability to realize the expected benefits from acquired
businesses, including the 2010 acquisition of Louisville Gas and Electric Company and Kentucky Utilities Company and the 2011
acquisition of the Central Networks electricity distribution businesses in the U.K.; any impact of hurricanes or other severe weather on
our business, including any impact on fuel prices; receipt of necessary government permits, approvals, rate relief and regulatory cost
recovery; capital market conditions and decisions regarding capital structure; the impact of state, federal or foreign investigations
applicable to PPL Corporation and its subsidiaries; the outcome of litigation against PPL Corporation and its subsidiaries; stock price
performance; the market prices of equity securities and the impact on pension income and resultant cash funding requirements for
defined benefit pension plans; the securities and credit ratings of PPL Corporation and its subsidiaries; political, regulatory or
economic conditions in states, regions or countries where PPL Corporation or its subsidiaries conduct business, including any potential
effects of threatened or actual terrorism or war or other hostilities; foreign exchange rates; new state, federal or foreign legislation,
including new tax legislation; and the commitments and liabilities of PPL Corporation and its subsidiaries. Any such forward-looking
statements should be considered in light of such important factors and in conjunction with PPL Corporation's Form 10-K and other
reports on file with the Securities and Exchange Commission.
Forward-Looking Information Statement

22
© PPL Corporation 2011
“Earnings from ongoing operations” should not be considered as an alternative to reported earnings, or net income attributable to PPL, which is an
indicator of operating performance determined in accordance with generally accepted accounting principles (GAAP). PPL believes that “earnings from
ongoing operations,” although a non-GAAP financial measure, is also useful and meaningful to investors because it provides management’s view of
PPL’s fundamental earnings performance as another criterion in making investment decisions. PPL’s management also uses “earnings from ongoing
operations” in measuring certain corporate performance goals. Other companies may use different measures to present financial performance.
“Earnings from ongoing operations” is adjusted for the impact of special items. Special items include:
• Energy-related economic activity (as discussed below).
• Foreign currency-related economic hedges.
• Gains and losses on sales of assets not in the ordinary course of business.
• Impairment charges (including impairments of securities in the company’s nuclear decommissioning trust funds).
• Workforce reduction and other restructuring impacts.
• Acquisition-related costs and charges.
• Other charges or credits that are, in management’s view, not reflective of the company’s ongoing operations.
Energy-related economic activity includes the changes in fair value of positions used economically to hedge a portion of the economic value of PPL’s
generation assets, full-requirement sales contracts and retail activities. This economic value is subject to changes in fair value due to market price
volatility of the input and output commodities (e.g., fuel and power) prior to the delivery period that was hedged. Also included in energy-related
economic activity is the ineffective portion of qualifying cash flow hedges, the monetization of certain full-requirement sales contracts and premium
amortization associated with options. This economic activity is deferred, with the exception of the full-requirement sales contracts that were
monetized, and included in earnings from ongoing operations over the delivery period of the item that was hedged or upon realization. Management
believes that adjusting for such amounts provides a better matching of earnings from ongoing operations to the actual amounts settled for PPL’s
underlying hedged assets. Please refer to the Notes to the Consolidated Financial Statements and MD&A in PPL Corporation’s periodic filings with
the Securities and Exchange Commission for additional information on energy-related economic activity.
“Free cash flow before dividends” is derived by deducting capital expenditures and other investing activities-net, from cash flow from operations. Free
cash flow before dividends should not be considered as an alternative to cash flow from operations, which is determined in accordance with GAAP.
PPL believes that free cash flow before dividends, although a non-GAAP measure, is an important measure to both management and investors, as it
is an indicator of the company’s ability to sustain operations and growth without additional outside financing beyond the requirement to fund maturing
debt obligations. Other companies may calculate free cash flow before dividends in a different manner.
Definitions of Non-GAAP Financial Measures