Attached files
| file | filename |
|---|---|
| 8-K - FORM 8-K - PEABODY ENERGY CORP | btu8k20110907.htm |

Barclays CEO
Energy/Power Conference
Greg Boyce
Chairman and
Chief Executive Officer
September 8, 2011

Statement on
Forward-Looking Information
Some of the following information contains forward-looking statements within the meaning of Section 27A of the Securities Act of 1933 and Section 21E of the Securities Exchange Act of 1934, as amended, and is intended to come within the safe-harbor protection provided by those sections.
Our forward-looking statements are based on numerous assumptions that the company believes are reasonable, but they are open to a wide range of uncertainties and business risks that may cause actual results to differ materially from expectations as of September 1, 2011. These factors are difficult to accurately predict and may be beyond the company’s control. The company does not undertake to update its forward-looking statements. Factors that could affect the company’s results include, but are not limited to: demand for coal in the United States and the seaborne thermal and metallurgical coal markets; price volatility and demand, particularly in higher-margin products and in our trading and brokerage businesses; impact of weather and natural disasters on demand, production and transportation; reductions and/or deferrals of purchases by major customers and ability to renew sales contracts; credit and performance risks associated with customers, suppliers, co-shippers, trading, banks and other financial counterparties; geologic, equipment, permitting and operational risks related to mining; transportation availability, performance and costs; availability, timing of delivery and costs of key supplies, capital equipment or commodities such as diesel fuel, steel, explosives and tires; successful implementation of business strategies, including our Btu Conversion and generation development initiatives; negotiation of labor contracts, employee relations and workforce availability; changes in postretirement benefit and pension obligations and funding requirements; replacement and development of coal reserves; availability, access to and the related cost of capital and financial markets; effects of changes in interest rates and currency exchange rates (primarily the Australian dollar); effects of acquisitions or divestitures; economic strength and political stability of countries in which we have operations or serve customers; legislation, regulations and court decisions or other government actions, including new environmental requirements, changes in income tax regulations or other regulatory taxes; litigation, including claims not yet asserted; and other risks detailed in the company’s reports filed with the Securities and Exchange Commission (SEC). The use of “Peabody,” “the company,” and “our” relate to Peabody, its subsidiaries and majority-owned affiliates.
EBITDA or Adjusted EBITDA is defined as income from continuing operations before deducting net interest expense, income taxes, asset retirement obligation expense, and depreciation, depletion and amortization. EBITDA, which is not calculated identically by all companies, is not a substitute for operating income, net income or cash flow as determined in accordance with United States generally accepted accounting principles. Management uses EBITDA as a key measure of operating performance and also believes it is a useful indicator of the company’s ability to meet debt service and capital expenditure requirements.
Adjusted EPS is defined as diluted earnings per share excluding the impact of the remeasurement of foreign income tax accounts. Management has included this measurement because, in management’s opinion, excluding such impact is a better indicator of the company’s ongoing effective tax rate and diluted earnings per share, and is therefore more useful in comparing the company’s results with prior and future periods.
09/01/11

Peabody Energy: Expanding Global Reach to Serve Coal’s Supercycle
Unmatched international growth pipeline with major Australia and Asia projects
Largest position in fastest growing U.S. regions
Significant upside with earnings growth and
multiple expansion

Global Coal Market
Fundamentals Remain Strong
Major U.S. Summer Inventory Drawdowns
New Air Rules Likely to Lift Value of Ultra-Low Sulfur PRB Coal
Europe Raises Coal Use on Lower Nuclear Burn and High Gas Prices
China July YOY: Coal Generation Up 19%; Steel Production Up 15%; Coal Imports a Record 17 MT
Major Japan Utility Coal Use Up 5% YOY in July
India Thermal Coal Imports Up 43% YTD
Global Steel Production Up 8% YTD
Met Coal Settlements Above Analyst Forecasts
Year-to-date information as of July 2011.
Source: Industry reports and Peabody analysis.

2011: Targeting Peabody’s Best Year
Peabody EBITDA
$ in Millions
2006 910
2007
2008
2009
2010 1,815
2011 Target 2,125-2,325
First half 2011 increases:
Revenues +18%
EBITDA +25%
EPS +47%
2011 Targets:
EBITDA of
$2.125 – $2.325 billion;
EPS of $3.70 to $4.15
EPS is adjusted diluted EPS from continuing operations.
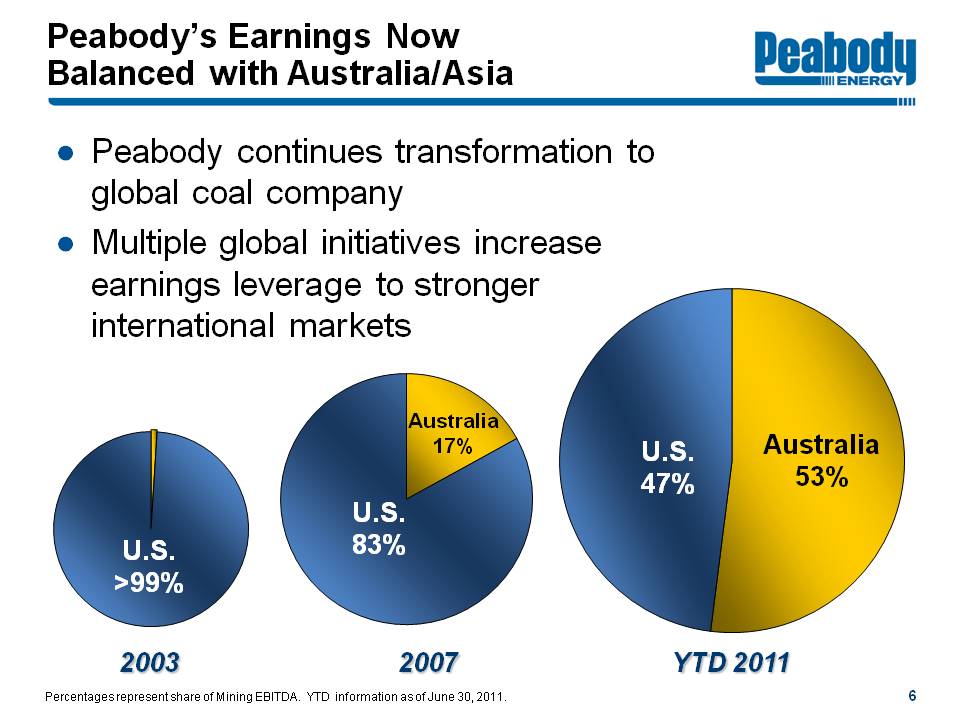
Peabody’s Earnings Now
Balanced with Australia/Asia
Peabody continues transformation to global coal company
Multiple global initiatives increase earnings leverage to stronger international markets
2003 U.S. >99%
2007 U.S. 83% Australia 17%
YTD 2011 U.S. 47% Australia 53%
Percentages represent share of Mining EBITDA. YTD information as of June 30, 2011.
Global Coal Markets
Poised for Long-Term Growth

World in Early Stages of
Supercycle for Coal
Asia Represents 90+% of 4 Billion Tonne Coal Demand Growth
U.S. growth presented in short tons.
Source: World Energy Outlook 2010, International Energy Agency; Annual Energy Outlook 2011 Early Release, Energy Information Administration; Peabody analysis.
+30
+60
+160
+580
+910
+2,320
 India, Brazil and China Upside: ~1.2 Billion Tonnes of Met Coal Growth
Major Increases in Steel Intensity to Reach Maturity
Brazil and India driving demand through increased urbanization and higher steel consumption
Both countries rely on imports for majority of met coal needs
India’s Ministry of Steel forecasts a three-fold increase in steel demand by 2020
Steel Consumption Per Capita
Acceleration Stage
India
(55 kg)
Brazil
(170 kg)
China
(466 kg
Stable Stage
Japan
(807 kg)
Taiwan
(884 kg
Source: Peabody Global Energy Analytics.

Global Metallurgical Coal Use Expected to Rise >500 Million Tonnes by 2020
Approximately 50 Million Tonnes of New Supply Required Each Year
Australia to Supply Majority of Seaborne Metallurgical Coal Growth
Global Met Coal Demand
(Tonnes in Millions)
2010 920
2015 1,185
2020 1,440
2015 Growth~30%; CAGR ~5%
2020 Growth~60%; CAGR ~5%
Source: Peabody Global Energy Analytics.
 Global Coal-Fueled Generation Growing Dramatically
~400 GW of new generation requires ~1.4 billion tonnes of new annual thermal coal supply over the next five years
Nearly 300 million tonnes of new coal demand for generation expected this year alone
Asia represents 90% of expected growth in new coal generation
Australia/Indonesia to Supply Majority of Seaborne Thermal Growth
New Coal-Fueled Generation 2011 – 2015 (GW)
China 250
India 75
Other Asia 27
Europe 16
USA 8
Others 16
Source: Platts Worldwide Power Plant Database and Peabody analysis.
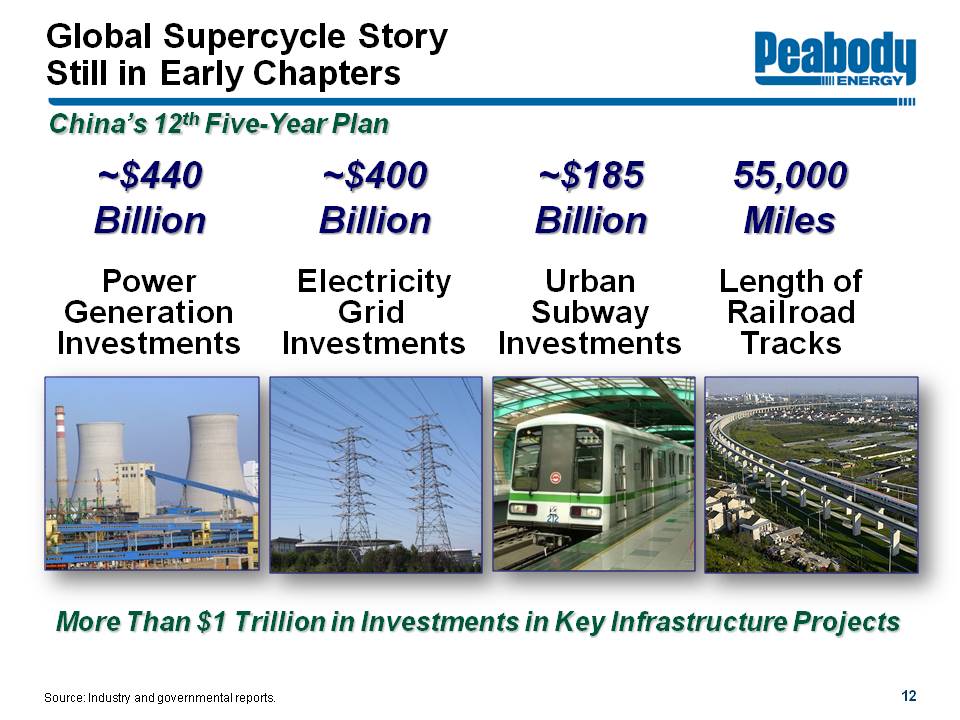 Global Supercycle Story
 Still in Early Chapters
China’s 12th Five-Year Plan
~$440
Billion
Power
Generation Investments
~$400
Billion
Electricity Grid Investments
~$185
Billion
Urban Subway Investments
55,000
Miles
Length of Railroad Tracks
More Than $1 Trillion in Investments in Key Infrastructure Projects
Source: Industry and governmental reports.
 India Likely to be the
 World’s Fastest-Growing Coal Importer
GDP expected to rise from $1.9 trillion to $10 trillion by 2025
Middle class expected to rise 10-fold to 580 million by 2025
India accelerating spending on infrastructure in 12th five-year plan
10% CAGR
> $1 trillion investments;
Double prior plan
Coal imports expected to increase to 200 MTPY over five years
Source: India government reports.
 Seaborne Coal Pricing:
Continued Positive Long-Term Trend
Peabody Levered to Rising Prices Through Australia Platform
Benchmark Met Coal Prices
2002 $48
Q4 2011 $285
Newcastle Thermal Coal
2005 $53
2013 $120 - $130
Unpriced Position
2011: 2 – 3 million tons
2012 and beyond: 100% open
Unpriced Position
2011: 1 – 2 million tons
2012: 75% – 80% open
Source: Third party pricing data as of August 25, 2011. Unpriced positions as of July 19, 2011 earnings release. Pricing shown in dollars per metric ton.

PRB and Illinois Basin Expected to
Grow as Appalachia Declines
CAPP challenged by permitting, geology, safety and significant increases in cost structure
PRB and ILB demand growing from new plants, increasing exports and fuel switching in Eastern markets
Ultra-low sulfur PRB demand to increase from EPA regulations
Expected U.S. Coal Demand Change 2010 – 2015
(Tons in Millions)
CAPP (45-55)
Other (10-15)
NAPP (5) - 5
ILB 45-55
SPRB 60-70
Estimates based on Peabody analysis and industry reports. Includes exports.
 U.S. Coal Demand Boosted by Low Stockpiles, Higher Exports
Muted GDP dampens generation
Summer stockpile draws above average, PRB inventories at targeted levels for first time in several years
Coal exports increase out of East, West and Gulf coasts
Greater recovery seen in 2012 and beyond
Btu’s Unpriced U.S. Volumes
2011: Essentially Sold Out
2012: 20% – 25%
2013: 60% – 70%
Unpriced positions as of July 19, 2011 earnings release.
U.S. Utility Inventory Levels Down ~20% From 2009 Levels
Source: Industry reports and Peabody analysis.

Peabody Targeting
Multiple Growth Projects
 Peabody Progressing Toward “Asia 100” Goal
Australia exports
China JVs
Tavan Tolgoi
Indonesia supplies
PRB to Asia
 Major Organic Growth Projects
Well Under Way in Australia
Expansions are in process at Burton, Wilpinjong, Metropolitan and other operations
Expected Australia Volumes
2010
Domestic Thermal 6
Seaborne Thermal 11
Met 10
Total 27
2011
Domestic Thermal 6.5
Seaborne Thermal 12-13
Met 9-10
Total 28-30
2015
Domestic Thermal ~8
Seaborne Thermal 15-17
Met 12-15
Total 35-40
 Australia Growth Expands Seaborne
 Access to Pacific Markets
Planned Expansions
(Tons in Millions)
Mine
Mine Additional MTPYFirst Coal
Burton1 – 2 HCCLate 2012
N. Goonyella 1 – 2 HQHCC 2014
Millennium 1 – 2 SH/PCI Late 2011
Wilpinjong 2 – 3 T Q4 2011
Wambo ~3 T 2012 - 2013
Metropolitan HCC Late 2013
Additional volumes expected to be offset by some mine depletions.
 Expanding Met Coal Position With Recommended Macarthur Coal Offer
Peabody and ArcelorMittal in
60/40 joint venture to acquire Macarthur Coal
Offering A$16.00
(A$4.8 billion)
World’s largest supplier of seaborne low-vol PCI coal
Adds to development pipeline, reserve base and production capacity
260 million tonnes of reserves and 2.3 billion tonnes of resources (100% project basis)
Macarthur targeting to double production to 9.2 MTPY by 2014
Macarthur data based on public filings. MTPY represents million metric tons per year.
 Pursuing Development of
 One of China’s Largest Mines
Advancing 50 million ton-per-year thermal project in
Xinjiang Province
Xinjiang likely to be
world’s fastest growing
coal region
100 million tonnes of
production in 2010
May reach 1 billion tonnes
per year by ~2025
Government supportive
Committed to
accelerate coal
reserve allocations
China’s coal production base is shifting from older, underground operations in the East to large-scale open-cut operations in the Western provinces. The Xinjiang development would be one of China’s largest mines.
 Advancing Multiple Projects to
 Serve Growing Demand Within China
Yankuang Wucaiwan Mine
Pursuing development of 20 million ton-per-year surface mine in Xinjiang
Would include 2 GW supercritical power plant and SNG facility
Pursuing development of 15 million ton-per-year surface
mine in Xinjiang
Only non-Chinese partner
in 650 MW IGCC plant
First phase starts up this year
CCS for enhanced oil recovery
The GreenGen coal-fueled IGCC plant near Tianjin is due to begin operations later this year
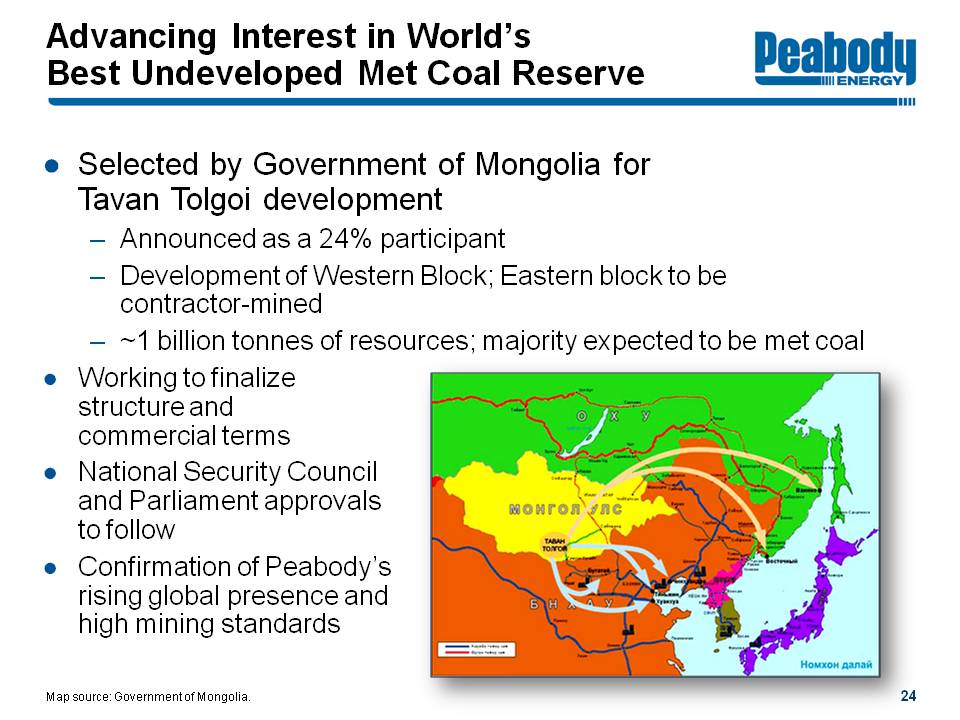 Advancing Interest in World’s
 Best Undeveloped Met Coal Reserve
Selected by Government of Mongolia for
Tavan Tolgoi development
Announced as a 24% participant
Development of Western Block; Eastern block to be
contractor-mined
~1 billion tonnes of resources; majority expected to be met coal
Working to finalize
structure and
commercial terms
National Security Council
and Parliament approvals
to follow
Confirmation of Peabody’s
rising global presence and
high mining standards
Map source: Government of Mongolia.
 Peabody Leveraging Leading
 PRB and Illinois Basin Presence
Peabody’s North
Antelope Rochelle
Mine produces more than
100 million tons per year of
ultra-low sulfur coal with
a sulfur content 40% below
the benchmark PRB product –
a valuable feature in a market
with rising SO2 allowance prices
Illinois Basin to…
New York, South Carolina and Florida
Europe and India through Gulf of Mexico
Powder River Basin to…
Asia via West Coast
Europe through Gulf
Eastern U.S. backfill for CAPP
Texas and other lignite regions to comply with CSAPR regs
 Advancing Multiple Projects in U.S.
Bear Run
Growing to ~8 MT in 2012
Gateway North
Expanding ~40% to 4.5 MT by 2014
Powder River Basin
Adding ultra-class trucks; Modest volume growth in 2011
Accessing NARM North reserves and loadout facilities for blending opportunities, margin enhancements and export supplies
West Coast Exports
Developing plans for PRB exports to Asia at scale
Peabody has a 24 million tonne per year throughput agreement for a deep-draft export facility being permitted in Cherry Point, Wash.
 Peabody’s Unmatched Growth Pipeline
Australia
Millennium
1 – 2 MTPY SHCC/PCI
Burton
1 – 2 MTPY HCC
Wilpinjong
2 – 3 MTPY Thermal
Wambo
~ 3 MTPY Thermal/PCI
Metropolitan
1 MTPY HCC
N. Goonyella LTCC
1 – 2 MTPY HQHCC
Goonyella Lower
3 – 4 MTPY HQHCC
Potential Macarthur Takeover
Macarthur Plans to Increase Production by 5 MTPY by 2014
Asia
Tavan Tolgoi Consortium
15 – 20 MTPY HCC
Xinjiang China MOU
50 MTPY Thermal
Yankuang China MOU
20 MTPY Thermal, 2.0GW Plant
Luan China MOU
15 MTPY Thermal
Indonesian Coal Supply Agreements
~6 MT Thermal Over Next Several Years
U.S
Bear Run Ramp-Up
8 MTPY Thermal
Gateway North
4.5 MTPY Thermal
Gateway Pacific Terminal
24 MTPY Thermal Exports
 Solid Financial Strength
 to Fund Growth Pipeline
Cash
• | $1.2 billion in cash |
• | Strong operating cash flows |
Credit Facility
• | $1.5 billion available under credit facility |
• | BB+/Ba1 credit rating |
Debt/Project Financing
• | Balance sheet under-leveraged |
Equity Markets
• | Access if needed |
Peabody’s
Debt-to-Capital Ratio (%)
2007 52
2008 47
2009 42
2010 37
YTD 2011 32
Target Zone
40 - 60
Cash, liquidity and YTD debt-to-capital ratio as of June 30, 2011.
 Peabody Positioned for Significant Growth and Value Creation
• | Industry Leading Reserves and Production Base |
• | Major Cash Flow Generation and Strong Balance Sheet |
• | Expanding in Fastest Growing Global Markets |
• | Significant Organic Growth Capability in U.S. and Australia |
• | Value-Adding Acquisitions and Joint Ventures |
• | Multiple Expansion to Return to More Traditional Levels |
BTU Drivers To Deliver Premium Valuation
 Barclays CEO
Energy/Power Conference
Greg Boyce
Chairman and
Chief Executive Officer
September 8, 2011