Attached files
| file | filename |
|---|---|
| 8-K - FORM 8-K - METLIFE INC | y92511e8vk.htm |
Exhibit 99.1

| KBW Insurance Conference September 2 0 1 1 Bill Toppeta President, International MetLife, Inc. |
| Safe Harbor These materials may contain or incorporate by reference information that includes or is based upon forward-looking statements within the meaning of the Private Securities Litigation Reform Act of 1995. Forward-looking statements give expectations or forecasts of future events. These statements can be identified by the fact that they do not relate strictly to historical or current facts. They use words such as "anticipate," "estimate," "expect," "project," "intend," "plan," "believe" and other words and terms of similar meaning in connection with a discussion of future operating or financial performance. In particular, these include statements relating to future actions, prospective services or products, future performance or results of current and anticipated services or products, sales efforts, expenses, the outcome of contingencies such as legal proceedings, trends in operations and financial results. Any or all forward-looking statements may turn out to be wrong. They can be affected by inaccurate assumptions or by known or unknown risks and uncertainties. Many such factors will be important in determining the actual future results of MetLife, Inc., its subsidiaries and affiliates. These statements are based on current expectations and the current economic environment. They involve a number of risks and uncertainties that are difficult to predict. These statements are not guarantees of future performance. Actual results could differ materially from those expressed or implied in the forward-looking statements. Risks, uncertainties, and other factors that might cause such differences include the risks, uncertainties and other factors identified in MetLife, Inc.'s filings with the U.S. Securities and Exchange Commission (the "SEC"). These factors include: (1) difficult conditions in the global capital markets; (2) the delay by Congress in raising the statutory debt limit of the U.S., as well as rating agency downgrades of U.S. Treasury securities; (3) increased volatility and disruption of the capital and credit markets, which may affect our ability to seek financing or access our credit facilities; (4) uncertainty about the effectiveness of the U.S. government's programs to stabilize the financial system, the imposition of fees relating thereto, or the promulgation of additional regulations; (5) impact of comprehensive financial services regulation reform on us; (6) exposure to financial and capital market risk; (7) changes in general economic conditions, including the performance of financial markets and interest rates, which may affect our ability to raise capital, generate fee income and market-related revenue and finance statutory reserve requirements and may require us to pledge collateral or make payments related to declines in value of specified assets; (8) potential liquidity and other risks resulting from our participation in a securities lending program and other transactions; (9) investment losses and defaults, and changes to investment valuations; (10) impairments of goodwill and realized losses or market value impairments to illiquid assets; (11) defaults on our mortgage loans; (12) the impairment of other financial institutions that could adversely affect our investments or business; (13) our ability to address unforeseen liabilities, asset impairments, loss of key contractual relationships, or rating actions arising from acquisitions or dispositions, including our acquisition of American Life Insurance Company and Delaware American Life Insurance Company (collectively, "ALICO") and to successfully integrate and manage the growth of acquired businesses with minimal disruption; (14) uncertainty with respect to the outcome of the closing agreement entered into with the United States Internal Revenue Service in connection with the acquisition of ALICO; (15) uncertainty with respect to any incremental tax benefits resulting from the elections made for ALICO and certain of its subsidiaries under Section 338 of the U.S. Internal Revenue Code of 1986, as amended; (16) the dilutive impact on our stockholders resulting from the issuance of equity securities in connection with the acquisition of ALICO or otherwise; (17) economic, political, currency and other risks relating to our international operations, including with respect to fluctuations of exchange rates; (18) our primary reliance, as a holding company, on dividends from our subsidiaries to meet debt payment obligations and the applicable regulatory restrictions on the ability of the subsidiaries to pay such dividends; (19) downgrades in our claims paying ability, financial strength or credit ratings; (20) ineffectiveness of risk management policies and procedures; (21) availability and effectiveness of reinsurance or indemnification arrangements, as well as default or failure of counterparties to perform; (22) discrepancies between actual claims experience and assumptions used in setting prices for our products and establishing the liabilities for our obligations for future policy benefits and claims; (23) catastrophe losses; (24) heightened competition, including with respect to pricing, entry of new competitors, consolidation of distributors, the development of new products by new and existing competitors, distribution of amounts available under U.S. government programs, and for personnel; (25) unanticipated changes in industry trends; (26) changes in accounting standards, practices and/or policies; (27) changes in assumptions related to deferred policy acquisition costs, deferred sales inducements, value of business acquired or goodwill; (28) increased expenses relating to pension and postretirement benefit plans, as well as health care and other employee benefits; (29) exposure to losses related to variable annuity guarantee benefits, including from significant and sustained downturns or extreme volatility in equity markets, reduced interest rates, unanticipated policyholder behavior, mortality or longevity, and the adjustment for nonperformance risk; (30) deterioration in the experience of the "closed block" established in connection with the reorganization of Metropolitan Life Insurance Company; (31) adverse results or other consequences from litigation, arbitration or regulatory investigations; (32) inability to protect our intellectual property rights or claims of infringement of the intellectual property rights of others, (33) discrepancies between actual experience and assumptions used in establishing liabilities related to other contingencies or obligations; (34) regulatory, legislative or tax changes relating to our insurance, banking, international, or other operations that may affect the cost of, or demand for, our products or services, impair our ability to attract and retain talented and experienced management and other employees, or increase the cost or administrative burdens of providing benefits to employees; (35) the effects of business disruption or economic contraction due to terrorism, other hostilities, or natural catastrophes, including any related impact on our disaster recovery systems and management continuity planning which could impair our ability to conduct business effectively; (36) the effectiveness of our programs and practices in avoiding giving our associates incentives to take excessive risks; and (37) other risks and uncertainties described from time to time in MetLife, Inc.'s filings with the SEC. MetLife, Inc. does not undertake any obligation to publicly correct or update any forward-looking statement if MetLife, Inc. later becomes aware that such statement is not likely to be achieved. Please consult any further disclosures MetLife, Inc. makes on related subjects in reports to the SEC. |

| Explanatory Note on Non-GAAP Financial Information All references in this presentation to net income (loss), net income (loss) per share, operating earnings, operating earnings per share and book value per share should be read as net income (loss) available to MetLife, Inc.'s common shareholders, net income (loss) available to MetLife, Inc.'s common shareholders per diluted common share, operating earnings available to common shareholders, operating earnings available to common shareholders per diluted common share and book value per common share, respectively. Operating earnings is the measure of segment profit or loss that MetLife uses to evaluate segment performance and allocate resources and, consistent with accounting principles generally accepted in the United States of America ("GAAP") accounting guidance for segment reporting, is MetLife's measure of segment performance. Operating earnings is also a measure by which MetLife senior management's and many other employees' performance is evaluated for the purposes of determining their compensation under applicable compensation plans. Operating earnings is defined as operating revenues less operating expenses, both net of income tax. Operating earnings available to common shareholders is defined as operating earnings less preferred stock dividends. Operating revenues exclude net investment gains (losses) and net derivative gains (losses). The following additional adjustments are made to GAAP revenues, in the line items indicated, in calculating operating revenues: Universal life and investment-type product policy fees exclude the amortization of unearned revenue related to net investment gains (losses) and net derivative gains (losses) and certain variable annuity guaranteed minimum income benefits ("GMIB") fees ("GMIB Fees"); Net investment income: (i) includes amounts for scheduled periodic settlement payments and amortization of premium on derivatives that are hedges of investments but do not qualify for hedge accounting treatment, (ii) includes income from discontinued real estate operations, (iii) excludes certain amounts related to contractholder-directed unit-linked investments, (iv) excludes post-tax operating earnings adjustments relating to insurance joint ventures accounted for under the equity method, and (v) excludes certain amounts related to securitization entities that are variable interest entities ("VIEs") consolidated under GAAP; and Other revenues are adjusted for settlements of foreign currency earnings hedges. |

| The following adjustments are made to GAAP expenses, in the line items indicated, in calculating operating expenses: Policyholder benefits and claims and policyholder dividends exclude: (i) changes in the policyholder dividend obligation related to net investment gains (losses) and net derivative gains (losses), (ii) inflation-indexed benefit adjustments associated with contracts backed by inflation-indexed investments and amounts associated with periodic crediting rate adjustments based on the total return of a contractually referenced pool of assets, (iii) benefits and hedging costs related to GMIBs ("GMIB Costs"), and (iv) market value adjustments associated with surrenders or terminations of contracts ("Market Value Adjustments"); Interest credited to policyholder account balances includes adjustments for scheduled periodic settlement payments and amortization of premium on derivatives that are hedges of policyholder account balances but do not qualify for hedge accounting treatment and amounts related to net investment income earned on contractholder-directed unit-linked investments; Amortization of DAC and value of business acquired ("VOBA") excludes amounts related to: (i) net investment gains (losses) and net derivative gains (losses), (ii) GMIB Fees and GMIB Costs, and (iii) Market Value Adjustments; Amortization of negative VOBA excludes amounts related to Market Value Adjustments; Interest expense on debt excludes certain amounts related to securitization entities that are VIEs consolidated under GAAP; and Other expenses exclude costs related to: (i) noncontrolling interests, (ii) implementation of new insurance regulatory requirements, and (iii) business combinations. MetLife believes the presentation of operating earnings and operating earnings available to common shareholders as MetLife measures it for management purposes enhances the understanding of the company's performance by highlighting the results from operations and the underlying profitability drivers of the business. Operating revenues, operating expenses, operating earnings, operating earnings available to common shareholders, operating earnings available to common shareholders per diluted common share, book value per common share, excluding accumulated other comprehensive income ("AOCI") and book value per diluted common share, excluding AOCI should not be viewed as substitutes for the following financial measures calculated in accordance with GAAP: GAAP revenues, GAAP expenses, GAAP net income (loss) from continuing operations, net of income tax, GAAP net income (loss) available to MetLife, Inc.'s common shareholders and GAAP net income (loss) available to MetLife, Inc.'s common shareholders per diluted common share, book value per common share and book value per diluted share, respectively. For the historical periods presented, reconciliations of non-GAAP measures used in this presentation to the most directly comparable GAAP measures are included in the Appendix to the presentation materials and are on our Internet website. Additional information about our historical financial results is also available in our Quarterly Financial Supplements for the corresponding periods which may be accessed through our Internet website. The non-GAAP measures used in this presentation should not be viewed as substitutes for the most directly comparable GAAP measures. In this presentation, we sometimes refer to sales activity for various products. These sales statistics do not correspond to revenues under GAAP, but are used as relevant measures of business activity. Explanatory Note on Non-GAAP Financial Information (Continued) |
| Agenda Leading global life insurer Growth engine Unique combination of capabilities Strong footprint combining markets of today and markets of tomorrow Japan - strong growth in a challenging environment Key markets driving growth 5 strategic growth priorities Advantageous combination of businesses to manage risk while growing |

| GWP Life1 $M 84,962 75,663 72,832 67,712 N/A2 41,146 37,954 Market capitalization3 $35.5B $46.9B $37.4B $28.2B $24.3B $15.9B $25.7B # of countries present4 61 70 30 68 37 26 14 # of countries - top 5 share5 23 16 9 7 1 6 6 Total customers (M)4 90 76 40 >70 50 53 25 Assets Total1 $M 730,906 828,235 969,655 559,856 539,854 574,584 403,487 MetLife leads the International Life market by premiums among multinational companies 1 Gross Written Premiums (GWP) and Assets Total as of 2010. GWP corresponds to the amount of premiums written by insurance and reinsurance companies on business incepted in the year with respect to both insurance contracts and investment contracts with discretionary participating features, net of cancellations and gross of reinsurance ceded. Figures in US dollars; GWP converted at 2010 average exchange rates; Assets converted at 2010 year-end exchange rates. Sources: GWP and Assets Total from 2010 USGAAP and statutory annual filings for US companies; from 2010 corporate annual reports for non-US companies. 2 GWP not available as premiums are reported in USGAAP. For comparison, USGAAP Premiums for 2010 were: Prudential (U.S.) $18,260M; MetLife $27,394M. 3 Market capitalization as of Aug 31, 2011. Source: Thomson Financial and Worldscope databases. 4 Presence in countries and total customers data have been obtained from company web sites, 2010 annual reports, group profile information, corporate responsibility reports and consolidated financial release data. Both AXA and Prudential Plc customer and country information represent the life insurance sector; the rest of the peer group data represents combined numbers for both life and non-life businesses. MetLife country presence includes Taiwan where the sale of MetLife Taiwan Insurance Co. Ltd. (MetLife Taiwan) is pending. 5 Market share 2009/2010 based on premium income information derived from AXCO reports available as of August 25, 2011. Avia Prudential Plc Prudential (U.S.) Generali AXA Allianz |
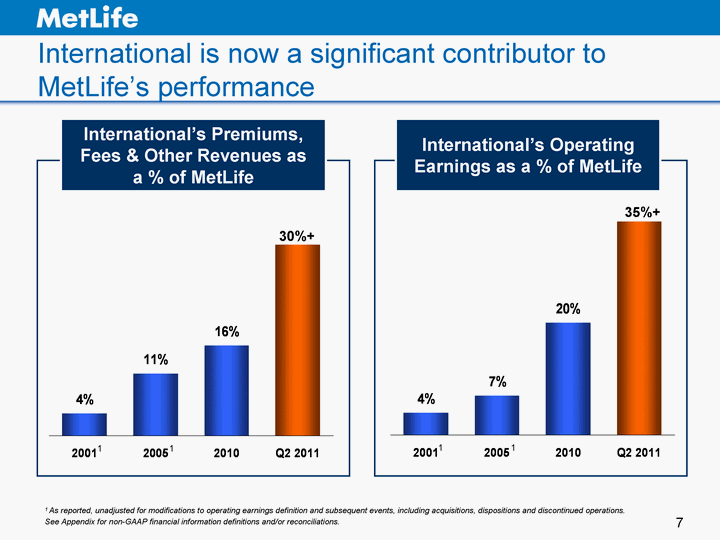
| International is now a significant contributor to MetLife's performance 2001 2005 2010 Q2 2011 0.04 0.11 0.16 0.34 2001 2005 2010 Q2 2011 0.04 0.07 0.2 0.38 35%+ 30%+ International's Operating Earnings as a % of MetLife International's Premiums, Fees & Other Revenues as a % of MetLife 1 As reported, unadjusted for modifications to operating earnings definition and subsequent events, including acquisitions, dispositions and discontinued operations. 1 1 See Appendix for non-GAAP financial information definitions and/or reconciliations. 1 1 |

| Our starting point: a unique position Geographic breadth Presence in all major regions of the world with access to over 90% of the Life insurance market Leadership positions Top 5 position in almost half of the countries in which we compete1 Established core countries, products and channels Four core countries represent more than 80% of earnings2 (Japan, Mexico, South Korea and Poland) Two core product lines represent 70% of earnings2 (Life and Accident & Health) One core channel represents 60% of earnings2 (face-to-face distribution) Strong position in emerging core geographies A group of 19 countries representing more than 15% of our operating earnings2 and providing a platform for medium term growth. Top 5 in 13 out of 191 Rapid growth in BRICs (Brazil, Russia, India, China) Provides opportunity for longer term shareholder value 1 Based on premium income information derived from AXCO reports available as of August 25, 2011. Information available for 15 out of 19 countries. UAE information from local annual reports and newspapers. 2 As of December 31, 2010 (pro forma to reflect the acquisition of American Life Insurance Company and Delaware American Life Insurance Company). |
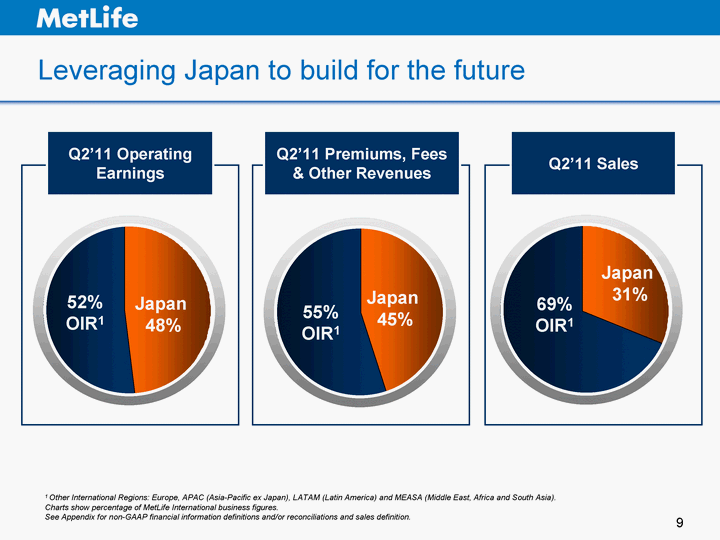
| 1st Qtr 2nd Qtr 3rd Qtr 4th Qtr East 0.31 0.69 90 20.4 West 30.6 38.6 34.6 31.6 North 45.9 46.9 45 43.9 1st Qtr 2nd Qtr 3rd Qtr 4th Qtr East 0.45 0.55 90 20.4 West 30.6 38.6 34.6 31.6 North 45.9 46.9 45 43.9 Japan OIR 3rd Qtr 4th Qtr East 0.48 0.52 90 20.4 West 30.6 38.6 34.6 31.6 North 45.9 46.9 45 43.9 Japan 48% 52% OIR1 Japan 45% 55% OIR1 Japan 31% 69% OIR1 Q2'11 Operating Earnings Q2'11 Premiums, Fees & Other Revenues Q2'11 Sales Leveraging Japan to build for the future 1 Other International Regions: Europe, APAC (Asia-Pacific ex Japan), LATAM (Latin America) and MEASA (Middle East, Africa and South Asia). Charts show percentage of MetLife International business figures. See Appendix for non-GAAP financial information definitions and/or reconciliations and sales definition. |

| Asia Europe Middle East+India+Pakistan+Nepal+Bangladesh LatAm East 0.19 0.32 0.08 0.41 Asia Europe Middle East+India+Pakistan+Nepal+Bangladesh LatAm East 0.16 0.24 0.09 0.51 OIR Q2 2011: Geographic diversification Europe 32% Latin America 41% Middle East 8% Asia 19% Europe 24% Latin America 51% Middle East 9% Asia 16% Premiums, Fees & Other Revenues Operating Earnings Maximizing Growth Opportunities and Minimizing Risk See Appendix for non-GAAP financial information definitions and/or reconciliations. |

| Presence in 8 of the World's Largest Life Insurance Markets Country Life Premiums United States 506 Japan 441 United Kingdom 214 France 192 China 143 Italy 122 Germany 115 South Korea 71 India 68 Taiwan1 64 Source: Swiss Re Sigma. 1 Sale of MetLife Taiwan Insurance Co. Ltd. (MetLife Taiwan) is pending. ($ Billions USD) 2010 |
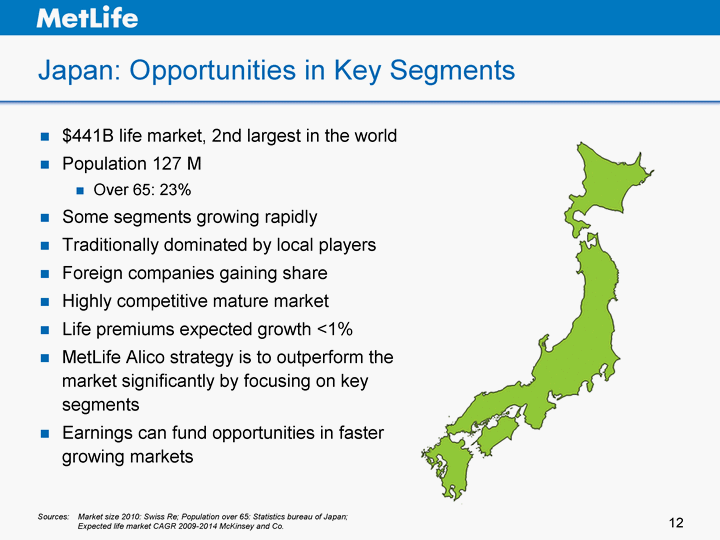
| Japan: Opportunities in Key Segments $441B life market, 2nd largest in the world Population 127 M Over 65: 23% Some segments growing rapidly Traditionally dominated by local players Foreign companies gaining share Highly competitive mature market Life premiums expected growth <1% MetLife Alico strategy is to outperform the market significantly by focusing on key segments Earnings can fund opportunities in faster growing markets Sources: Market size 2010: Swiss Re; Population over 65: Statistics bureau of Japan; Expected life market CAGR 2009-2014 McKinsey and Co. |

| One of the industry leaders in productivity and profitability Metric Career Agency Career Agency Independent Agency Independent Agency Metric 2008 (pre-crisis) 2011 (12 months ended May 2011) 2008 (pre-crisis) 2011 (12 months ended May 2011) # Agents / Agencies1 4,662 4,914 10,141 10,508 Activity Ratio2 88.3% 90.5% 50.9% 58.3% Sales Productivity per Active3 ¥1,007K per month ¥825K per month ¥756K per month ¥740K per month Policy Productivity per Active 5.5 per month 6.4 per month 4.0 per month 5.4 per month A&H Packaging Ratio4 57% 74% 57% 67% Improving Performance Through The Crisis 1 Agent count for the Career Agency channel represents actual individual agents and excludes managers. The count for the Independent Agency channel represents the number of contracted independent agencies (both single agent and multi-agent agencies). 2 Percentage of career agents or independent agents that sell one or more policies in a given month. 3 See Appendix for sales definition. 4 Percentage of new policies (among 6 core whole life products) with Accident & Health riders. |
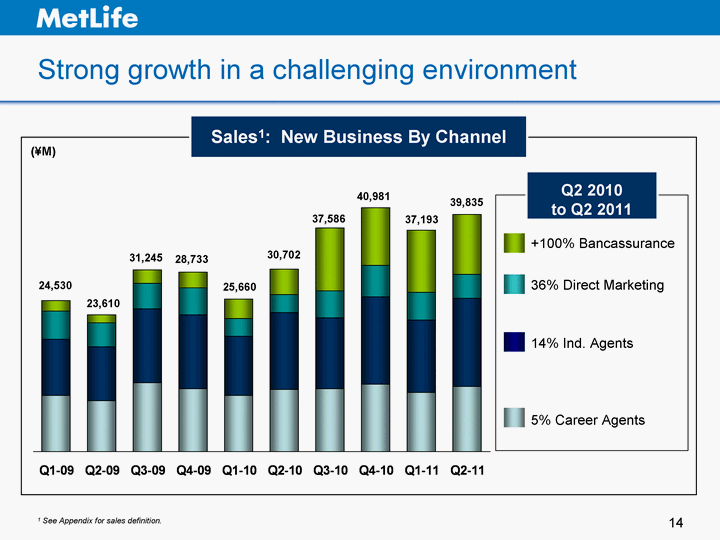
| Strong growth in a challenging environment 5% Career Agents (¥M) 14% Ind. Agents 36% Direct Marketing +100% Bancassurance Sales1: New Business By Channel Q2 2010 to Q2 2011 Q1-09 Q2-09 Q3-09 Q4-09 Q1-10 Q2-10 Q3-10 Q4-10 Q1-11 Q2-11 Career Agency 9380 8606 11547 10606 9445 10446 10512 11319 9899 10930 Independent Agency 9488 8937 12400 12454 9872 12911 11982 14758 12184 14777 Direct Marketing 4701 4114 4309 4483 3034 3033 4523 5164 4701 4115 Bancassurance 1838 1396 2237 2652 3309 4312 10569 9740 10409 10013 Others-ML 0 0 0 0 0 0 0 0 0 0 25,660 30,702 37,586 40,981 37,193 39,835 24,530 23,610 31,245 28,733 1 See Appendix for sales definition. |
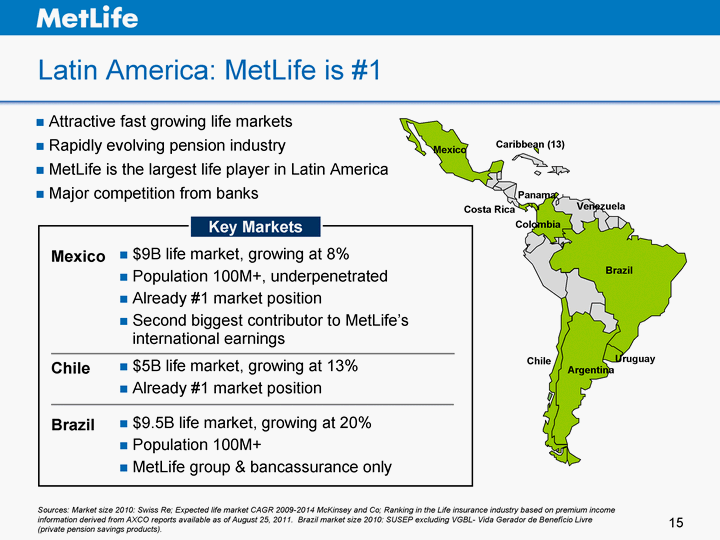
| Latin America: MetLife is #1 $9B life market, growing at 8% Population 100M+, underpenetrated Already #1 market position Second biggest contributor to MetLife's international earnings Mexico $5B life market, growing at 13% Already #1 market position Chile $9.5B life market, growing at 20% Population 100M+ MetLife group & bancassurance only Brazil Attractive fast growing life markets Rapidly evolving pension industry MetLife is the largest life player in Latin America Major competition from banks Mexico Chile Brazil Argentina Colombia Venezuela Panama Caribbean (13) Costa Rica Uruguay Sources: Market size 2010: Swiss Re; Expected life market CAGR 2009-2014 McKinsey and Co; Ranking in the Life insurance industry based on premium income information derived from AXCO reports available as of August 25, 2011. Brazil market size 2010: SUSEP excluding VGBL- Vida Gerador de Beneficio Livre (private pension savings products). Key Markets |

| 16 3 1 Based on premium income information derived from AXCO Global Statistics as of August 25, 2011. Countries included: Argentina, Chile, Colombia, Costa Rica, Mexico, Panama, Trinidad, and Uruguay. Brazil market size 2010: SUSEP excluding VGBL- Vida Gerador de Beneficio Livre (private pension savings products). Premiums presented in US dollars, using average exchange rates for the period (2009 for Trinidad & Tobago and Venezuela; 2010 for all other countries). Banco Santander MAPFRE u u Brazil, Chile, Mexico, Argentina, Uruguay u Brazil, Mexico, Chile, Argentina, Uruguay, Colombia, Costa Rica, Panama, Caribbean u NY Life u Mexico, Argentina BBVA Mexico, Chile, Colombia, Argentina Bradesco u u u Brazil Mexico GNP Itau Brazil, Chile Brazil, Colombia, Mexico, Argentina, Uruguay, Chile AXA Seguros Banco do Brasil u Mexico u Brazil u u MetLife: The Latin America Life Insurer Bank Competes in Top LATAM Players Life GWP ($ million)1 Foreign |

| MetLife Mexico... we stand alone Increasing penetration from 56% to 66-70% Increasing average premiums of current & future policies Opening new payroll deduction slots in additional government agencies Penetrate into "contract employees" segment Expand into pension sales for government employees Goals to Broaden Reach of Worksite Marketing |

| Europe: East & West $9B life market, growing at 11% Professionalizing agency Expanding products and distribution Poland $1B life market, growing at 9% Population 100M+, underpenetrated Already #1 market position Russia Combination of growth niches in mature markets and countries growing at a faster pace, emerging insurance and pension markets CEE - Strongly positioned as first mover, committed to region Western Europe: Growth segments through innovation; employee benefit opportunity Sources: Market size 2010: Swiss Re; Expected life market CAGR 2009-2014 McKinsey and Co; Ranking in the Life insurance industry: Based on premium income information derived from AXCO reports available as of August 25, 2011. Key Markets |

| 3 MetLife is a Top Life Player in Central and Eastern Europe PZU Bank Competes in Top CEE Players Life GWP ($ million)1 u Europa Ceska Pojistovna2 Ethiniki Allianz ING 1 Based on premium income information derived from AXCO Global Statistics available as of Aug 25, 2011. Countries included are Poland, Czech, Hungary, Slovakia, Cyprus, Greece, Russia, Ukraine, Bulgaria, Romania, Serbia, Latvia, Lithuania. 2009 data for Greece, Latvia, Poland, Romania; 2010 data for all other countries. Premiums presented in US dollars, using average exchange rates for the relevant year. 2 Part of JV with Generali. 3PZU information for Ukraine not available for 2010. Poland, Ukraine3, Lithuania Poland, Czech, Hungary, Slovakia, Greece, Romania Poland, Czech, Hungary, Slovakia, Cyprus, Greece, Russia, Ukraine, Bulgaria, Romania, Serbia, Latvia, Lithuania Poland, Czech, Hungary, Slovakia, Cyprus, Greece, Bulgaria, Romania, Russia Poland, Czech, Hungary, Slovakia, Greece, Bulgaria, Romania, Serbia, Ukraine, Russia u u Generali KBC Poland Greece, Cyprus, Romania, Bulgaria Czech Republic VIG Poland, Czech, Hungary, Slovakia, Russia, Ukraine, Bulgaria, Romania, Serbia, Latvia, Lithuania Poland, Czech, Bulgaria, Hungary, Slovakia u u Foreign u u u u u |
| Poland: Significant Contributor to Earnings Recruiting experienced agents and managers supporting the expansion Career agency productivity increase New strategic partnerships with medium sized independent agencies to build exclusive high- performance relationships Up-selling our Critical illness and Medical products Expand Face-to-Face Distribution Platform |
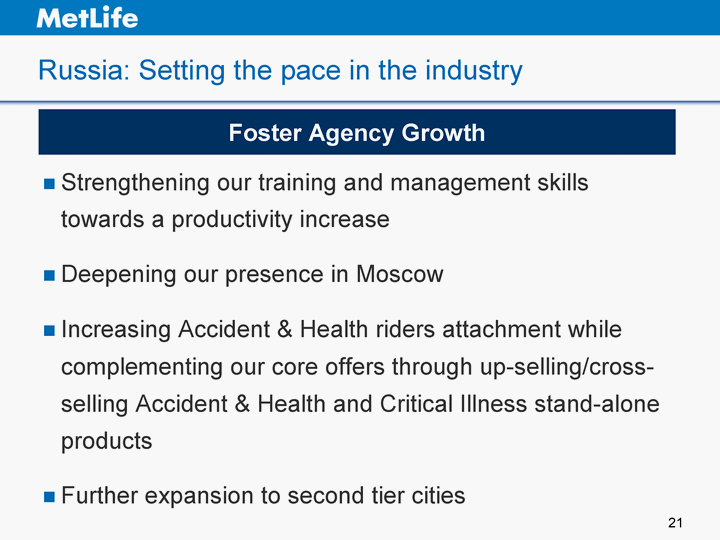
| Russia: Setting the pace in the industry Strengthening our training and management skills towards a productivity increase Deepening our presence in Moscow Increasing Accident & Health riders attachment while complementing our core offers through up-selling/cross- selling Accident & Health and Critical Illness stand-alone products Further expansion to second tier cities Foster Agency Growth |

| MEASA: Attractive Demographics, Strong Growth $1B life market, growing at 6% Population 76M, underpenetrated Strong bancassurance channel Growing pension system Turkey MetLife enjoys a unique position with top 3 rankings in most countries Rapidly growing insurance markets Wealthy markets in some countries/ large growing middle classes with micro-insurance needs in others India Turkey Saudi Arabia Egypt Oman Jordan Lebanon Qatar Kuwait UAE Bahrain India Pakistan Nepal Bangladesh $68B life market, growing at 23% Population 1B+, large underpenetrated segments Rapidly growing middle class Sources: Market size 2010: Swiss Re; Expected life market growth: Expected life market CAGR 2009-2014 McKinsey and Co; Ranking in the Life insurance industry: Based on premium income information derived from AXCO reports available as of August 25, 2011. Turkey shows proforma position: MetLife Alico + DenizEmeklilik. Key Markets |
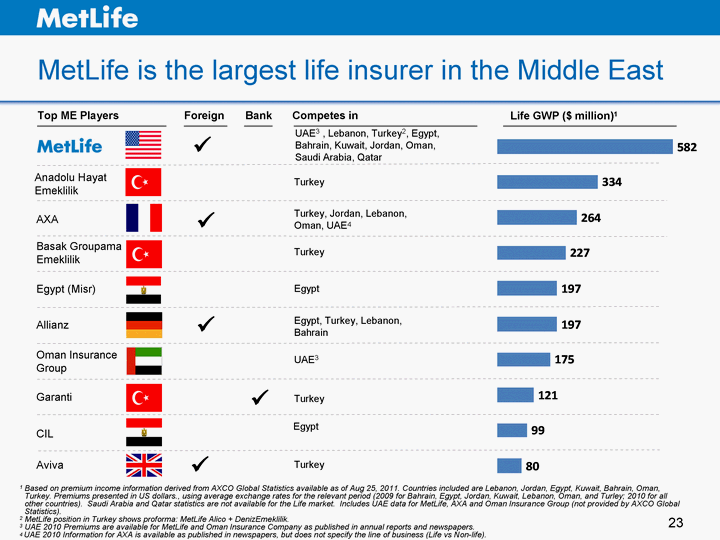
| 3 MetLife is the largest life insurer in the Middle East u u Basak Groupama Emeklilik Anadolu Hayat Emeklilik AXA Aviva UAE3 , Lebanon, Turkey2, Egypt, Bahrain, Kuwait, Jordan, Oman, Saudi Arabia, Qatar Turkey Turkey Turkey Egypt (Misr) Allianz Garanti CIL Oman Insurance Group Egypt, Turkey, Lebanon, Bahrain Egypt UAE3 Turkey Egypt u u u Turkey, Jordan, Lebanon, Oman, UAE4 1 Based on premium income information derived from AXCO Global Statistics available as of Aug 25, 2011. Countries included are Lebanon, Jordan, Egypt, Kuwait, Bahrain, Oman, Turkey. Premiums presented in US dollars., using average exchange rates for the relevant period (2009 for Bahrain, Egypt, Jordan, Kuwait, Lebanon, Oman, and Turley; 2010 for all other countries). Saudi Arabia and Qatar statistics are not available for the Life market. Includes UAE data for MetLife, AXA and Oman Insurance Group (not provided by AXCO Global Statistics). 2 MetLife position in Turkey shows proforma: MetLife Alico + DenizEmeklilik. 3 UAE 2010 Premiums are available for MetLife and Oman Insurance Company as published in annual reports and newspapers. 4 UAE 2010 Information for AXA is available as published in newspapers, but does not specify the line of business (Life vs Non-life). Bank Competes in Top ME Players Life GWP ($ million)1 Foreign |

| Turkey: An expansion story Acquisition of DenizEmeklilik Exclusive 15 yr bancassurance distribution agreement with DenizBank (4 million clients, 500 branches) covering life, pensions and personal accident insurance products and solutions Pension license- current industry: 2.3 million voluntary participants and growing Bancassurance Expansion |

| Asia Pacific: Established in Korea, Growing in China $71B Life market, growing at 8% Aging population opportunity Accident & Health needs South Korea $143B life market, growing at 23% Population 1B+, underpenetrated Access to nearly 40% of Life Insurance market China A mixing of emerging, developing and mature markets Several attractive fast growing insurance markets Dominant local players China Australia South Korea Hong Kong Sources: Market size 2010: Swiss Re; Expected life market CAGR 2009-2014 McKinsey and Co. Key Markets |

| South Korea: Growth through continuous innovation Currently considerable sales volume as riders to life products Significant opportunity to increase A&H sales to savings and annuity customers where A&H is under-penetrated Key initiatives fostering Accident & Health growth: Cross-sell and/or bundle stand-alone A&H alongside savings and annuity product sales Campaigns and incentives driving career agency Accident & Health sales Broader Packaging of Accident and Health Products Through Career Agency Distribution |
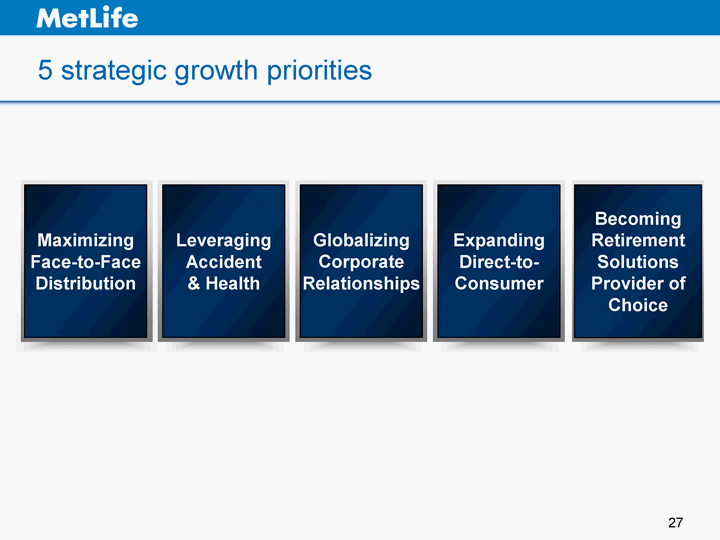
| 5 strategic growth priorities Maximizing Face-to-Face Distribution Leveraging Accident & Health Globalizing Corporate Relationships Expanding Direct-to- Consumer Becoming Retirement Solutions Provider of Choice |
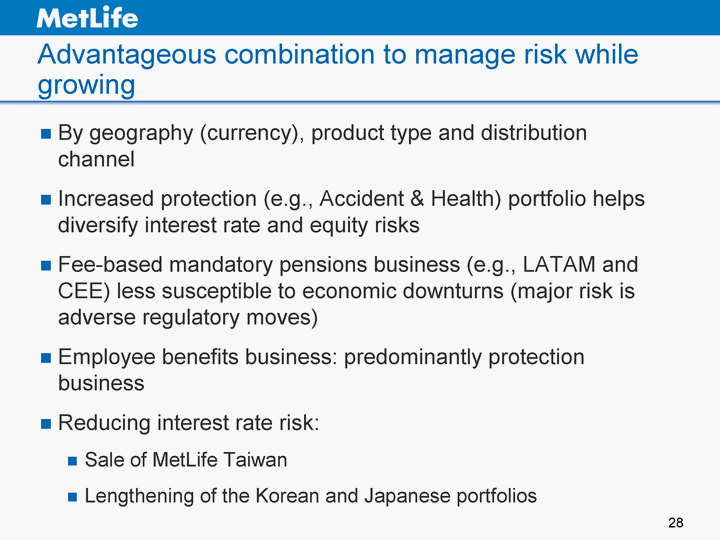
| 33 Advantageous combination to manage risk while growing By geography (currency), product type and distribution channel Increased protection (e.g., Accident & Health) portfolio helps diversify interest rate and equity risks Fee-based mandatory pensions business (e.g., LATAM and CEE) less susceptible to economic downturns (major risk is adverse regulatory moves) Employee benefits business: predominantly protection business Reducing interest rate risk: Sale of MetLife Taiwan Lengthening of the Korean and Japanese portfolios |
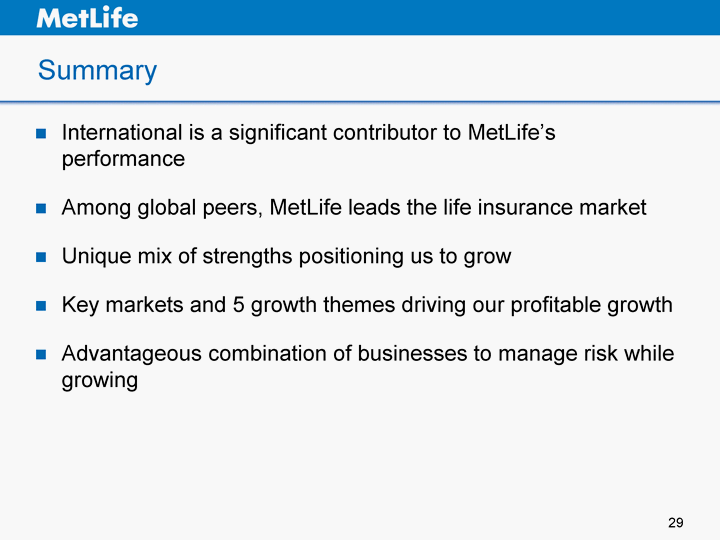
| Summary International is a significant contributor to MetLife's performance Among global peers, MetLife leads the life insurance market Unique mix of strengths positioning us to grow Key markets and 5 growth themes driving our profitable growth Advantageous combination of businesses to manage risk while growing |

| Appendix |

| 32 Explanatory Note on Non-GAAP Financial Information All references in this presentation to net income (loss), net income (loss) per share, operating earnings, operating earnings per share and book value per share should be read as net income (loss) available to MetLife, Inc.'s common shareholders, net income (loss) available to MetLife, Inc.'s common shareholders per diluted common share, operating earnings available to common shareholders, operating earnings available to common shareholders per diluted common share and book value per common share, respectively. Operating earnings is the measure of segment profit or loss that MetLife uses to evaluate segment performance and allocate resources and, consistent with accounting principles generally accepted in the United States of America ("GAAP") accounting guidance for segment reporting, is MetLife's measure of segment performance. Operating earnings is also a measure by which MetLife senior management's and many other employees' performance is evaluated for the purposes of determining their compensation under applicable compensation plans. Operating earnings is defined as operating revenues less operating expenses, both net of income tax. Operating earnings available to common shareholders is defined as operating earnings less preferred stock dividends. Operating revenues exclude net investment gains (losses) and net derivative gains (losses). The following additional adjustments are made to GAAP revenues, in the line items indicated, in calculating operating revenues: Universal life and investment-type product policy fees exclude the amortization of unearned revenue related to net investment gains (losses) and net derivative gains (losses) and certain variable annuity guaranteed minimum income benefits ("GMIB") fees ("GMIB Fees"); Net investment income: (i) includes amounts for scheduled periodic settlement payments and amortization of premium on derivatives that are hedges of investments but do not qualify for hedge accounting treatment, (ii) includes income from discontinued real estate operations, (iii) excludes certain amounts related to contractholder-directed unit-linked investments, (iv) excludes post-tax operating earnings adjustments relating to insurance joint ventures accounted for under the equity method, and (v) excludes certain amounts related to securitization entities that are variable interest entities ("VIEs") consolidated under GAAP; and Other revenues are adjusted for settlements of foreign currency earnings hedges. |
| 33 The following adjustments are made to GAAP expenses, in the line items indicated, in calculating operating expenses: Policyholder benefits and claims and policyholder dividends exclude: (i) changes in the policyholder dividend obligation related to net investment gains (losses) and net derivative gains (losses), (ii) inflation-indexed benefit adjustments associated with contracts backed by inflation-indexed investments and amounts associated with periodic crediting rate adjustments based on the total return of a contractually referenced pool of assets, (iii) benefits and hedging costs related to GMIBs ("GMIB Costs"), and (iv) market value adjustments associated with surrenders or terminations of contracts ("Market Value Adjustments"); Interest credited to policyholder account balances includes adjustments for scheduled periodic settlement payments and amortization of premium on derivatives that are hedges of policyholder account balances but do not qualify for hedge accounting treatment and amounts related to net investment income earned on contractholder-directed unit-linked investments; Amortization of DAC and value of business acquired ("VOBA") excludes amounts related to: (i) net investment gains (losses) and net derivative gains (losses), (ii) GMIB Fees and GMIB Costs, and (iii) Market Value Adjustments; Amortization of negative VOBA excludes amounts related to Market Value Adjustments; Interest expense on debt excludes certain amounts related to securitization entities that are VIEs consolidated under GAAP; and Other expenses exclude costs related to: (i) noncontrolling interests, (ii) implementation of new insurance regulatory requirements, and (iii) business combinations. MetLife believes the presentation of operating earnings and operating earnings available to common shareholders as MetLife measures it for management purposes enhances the understanding of the company's performance by highlighting the results from operations and the underlying profitability drivers of the business. Operating revenues, operating expenses, operating earnings, operating earnings available to common shareholders, operating earnings available to common shareholders per diluted common share, book value per common share, excluding accumulated other comprehensive income ("AOCI") and book value per diluted common share, excluding AOCI should not be viewed as substitutes for the following financial measures calculated in accordance with GAAP: GAAP revenues, GAAP expenses, GAAP net income (loss) from continuing operations, net of income tax, GAAP net income (loss) available to MetLife, Inc.'s common shareholders and GAAP net income (loss) available to MetLife, Inc.'s common shareholders per diluted common share, book value per common share and book value per diluted share, respectively. For the historical periods presented, reconciliations of non-GAAP measures used in this presentation to the most directly comparable GAAP measures are included in the Appendix to the presentation materials and are on our Internet website. Additional information about our historical financial results is also available in our Quarterly Financial Supplements for the corresponding periods which may be accessed through our Internet website. The non-GAAP measures used in this presentation should not be viewed as substitutes for the most directly comparable GAAP measures. Explanatory Note on Non-GAAP Financial Information (Continued) |
| 34 Definitions Sales In this presentation, we sometimes refer to sales activity for various products. These sales statistics do not correspond to revenues under GAAP, but are used as relevant measures of business activity. As used in this presentation sales are calculated as follows: For single premium variable and fixed annuities, pensions and life insurance products, sales are calculated as 10% of the single premium or deposit; and For regular premium annuities, pensions and risk and protection products, such as term, whole life and endowments, or accident & health, sales are calculated as the annualized first year premiums and fees. |
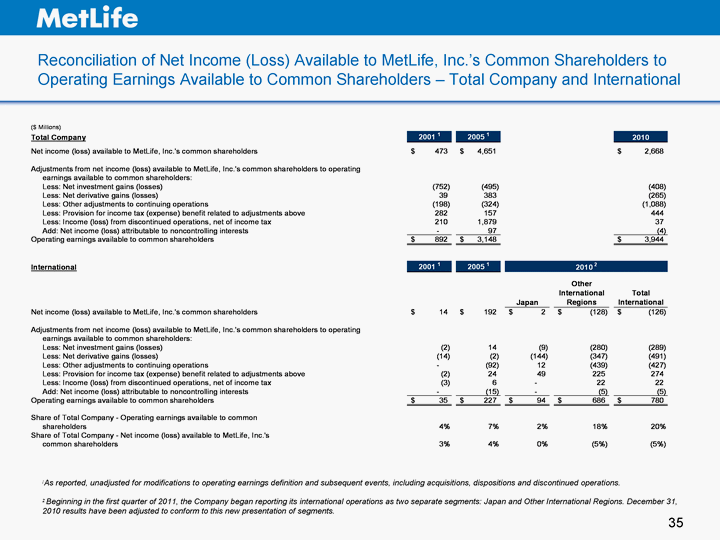
| 35 Reconciliation of Net Income (Loss) Available to MetLife, Inc.'s Common Shareholders to Operating Earnings Available to Common Shareholders - Total Company and International 1As reported, unadjusted for modifications to operating earnings definition and subsequent events, including acquisitions, dispositions and discontinued operations. 2 Beginning in the first quarter of 2011, the Company began reporting its international operations as two separate segments: Japan and Other International Regions. December 31, 2010 results have been adjusted to conform to this new presentation of segments. |

| 36 Reconciliation of Premiums, Fees & Other Revenues - Total Company and International 1As reported, unadjusted for modifications to operating earnings definition and subsequent events, including acquisitions, dispositions and discontinued operations. 2 Beginning in the first quarter of 2011, the Company began reporting its international operations as two separate segments: Japan and Other International Regions. December 31, 2010 results have been adjusted to conform to this new presentation of segments. |
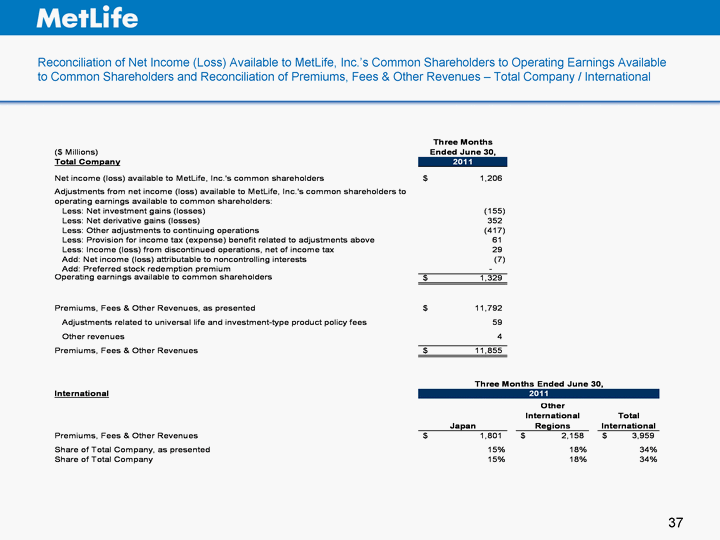
| 37 Reconciliation of Net Income (Loss) Available to MetLife, Inc.'s Common Shareholders to Operating Earnings Available to Common Shareholders and Reconciliation of Premiums, Fees & Other Revenues - Total Company / International |

| 38 Reconciliation of Net Income (Loss) Available to MetLife, Inc.'s Common Shareholders to Operating Earnings Available to Common Shareholders - International and Other International Regions |

