Attached files
| file | filename |
|---|---|
| 8-K - FORM 8-K - PLAINS EXPLORATION & PRODUCTION CO | d8k.htm |
 Barclays
Capital CEO Energy -
Power Conference
September 2011
Exhibit 99.1 |
 2
Corporate Headquarters
Contacts
Plains Exploration & Production Company
700 Milam, Suite 3100
Houston, Texas 77002
Forward-Looking Statements
This presentation is not for reproduction or distribution to others without
PXP’s consent. Corporate Information
James C. Flores –
Chairman, President & CEO
Winston M. Talbert –
Exec. Vice President & CFO
Hance V. Myers, III –
Vice President
Corporate Information Director
Joanna Pankey –
Manager, Shareholder Services
Phone: 713-579-6000
Toll Free: 800-934-6083
Email:
investor@pxp.com
Web Site: www.pxp.com
Except for the historical information contained herein, the matters
discussed
in
this
presentation
are
“forward-looking
statements”
as
defined by the Securities and Exchange Commission. These
statements involve certain assumptions PXP made based on its
experience and perception of historical trends, current conditions,
expected future developments and other factors it believes are
appropriate under the circumstances.
The forward-looking statements are subject to a number of known and
unknown risks, uncertainties and other factors that could cause our
actual results to differ materially. These risks and uncertainties include,
among other things, uncertainties inherent in the exploration for and
development and production of oil and gas and in estimating reserves,
the timing and closing of acquisitions and divestments, unexpected
future capital expenditures, general economic conditions, oil and gas
price volatility, the success of our risk management activities,
competition, regulatory changes and other factors discussed in PXP’s
filings with the SEC.
References to quantities of oil or natural gas may include amounts that
the Company believes will ultimately be produced, but that are not yet
classified as "proved reserves" under SEC definitions.
|
 3
PXP Today
•
$9.0
billion
enterprise
value
(1)
•
416 MMBOE proved reserves YE 2010
•
97.7 MBOE per day production for 2Q 2011
•
+2.2 billion BOE resource potential
•
141.0 million shares outstanding
(2)
(1) Reflects stock price and total debt as of June 30, 2011.
(2) As of June 30, 2011. |
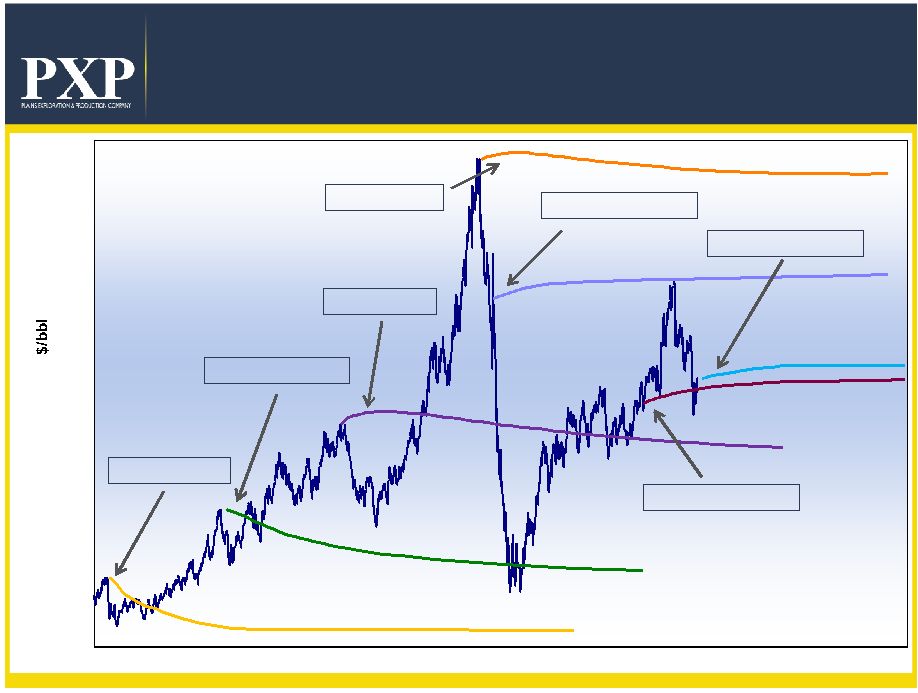 4
WTI NYMEX Historical Prices and
Forward Curves
Source: Goldman Sachs, NYMEX, ICE
July 14, 2006
March 7, 2003
October 26, 2004
July 14, 2008
September 3, 2008
October 25, 2010
September 1, 2011
20
30
40
50
60
70
80
90
100
110
120
130
140
150
2003
2004
2005
2006
2007
2008
2009
2010
2011
2012
2013
2014 |
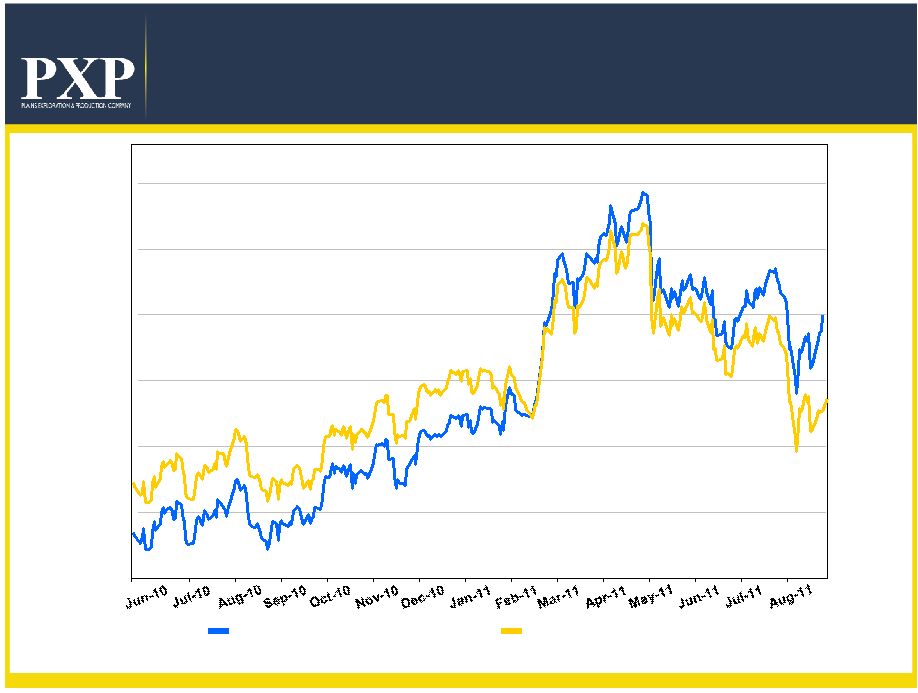 5
PXP California Spot Crude Index
vs. NYMEX WTI
Source: Morgan Stanley Commodities, NYMEX, Platts, Chevron Corp.
PXP California Spot Crude Index is based on the weighting of the
crudes according to expected 2012 production.
60.00
70.00
80.00
90.00
100.00
110.00
120.00
PXP California Spot Crude Index
NYMEX WTI Rolling Front Month
Units: $/bbl |
 6
West Coast Crude Oil Market
Declining Domestic Source Strengthens Local Posted Prices
Declining ANS
Production Midway Sunset % of NYMEX WTI
Source: Barclays Capital and PXP. |
 7
PXP Crude Oil Marketing Strategy
•
Crude oil realization moves from ~92% NYMEX to 101%-103%
of NYMEX, which is 85% of total liquids production
(1)
•
Total liquids realization moves from ~89% NYMEX to 93-95%
NYMEX
(1)
, due to NGL’s and condensate discounts
•
Crude slate beginning 2012 will be:
•
Aligned crude realizations with world prices to increase cash
flow in 2012 by over $150 million
(1)
Estimates based on August 2011 price outlook.
(2)
Using August 31, 2011 WTI NYMEX at $88.81.
Percentage of
NYMEX
(2)
Approx. Quality and
Transportation Discount
Net Price
(2)
74% California Spot
118%
($2.00)/Bbl
$103/Bbl
18% Louisiana Light
Sweet
130%
($8.00)/Bbl
$107/Bbl
8% NYMEX
100%
($1.00)/Bbl
$ 88/Bbl |
 8
Cash Flow Sensitivities
(1)
Excludes impact of derivatives. |
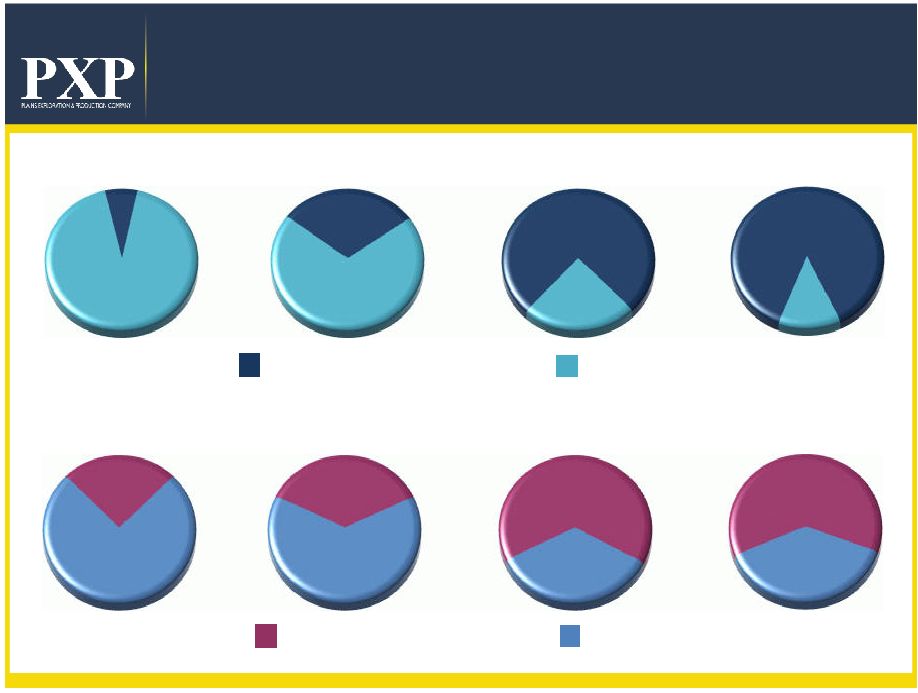 Operated
CapEx Transition Profile
2009
2011E
2010
Oil vs. Gas
Operated vs. Non-Operated
2009
2011E
2010
Includes Eagle Ford acquisition and excludes Gulf of Mexico shallow water assets as of
12/30/2010 . 2012E
2012E
Oil + Liquids
9
7%
93%
30%
70%
76%
24%
87%
13%
25%
75%
36%
64%
65%
35%
62%
38%
Gas + Exploration
Non-operated |
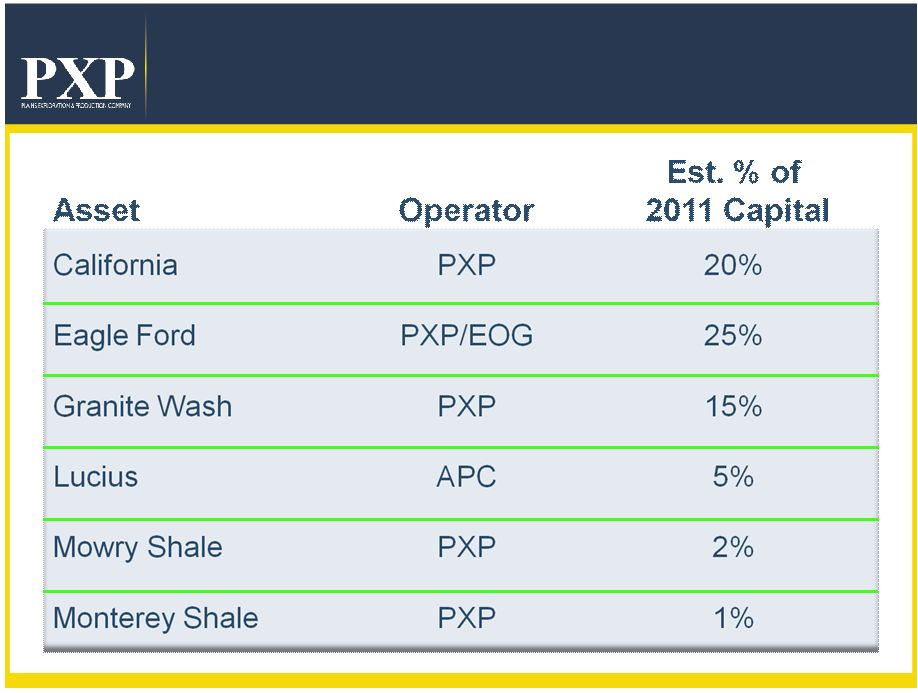
 10
2011 Capital Allocation
Capital Program
(1)
Includes development, exploitation, real estate, capitalized interest and G&A
costs but does not include additional capital for exploratory
successes. Haynesville
California
Cap G&A, Interest
and Other
(1)
Granite Wash
Eagle Ford
2011 Budget
$1.5 Billion
Lucius |
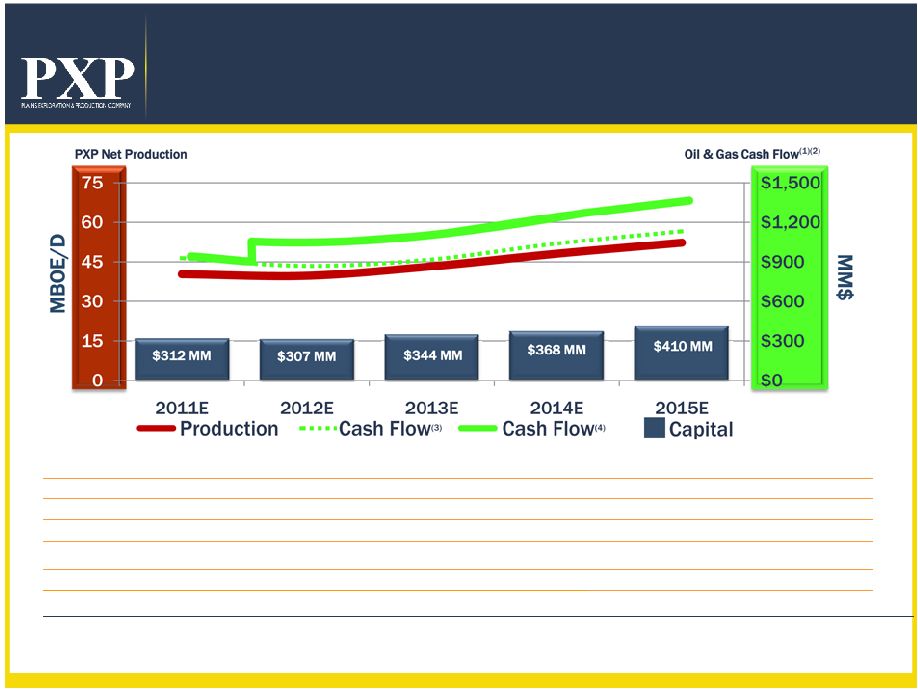
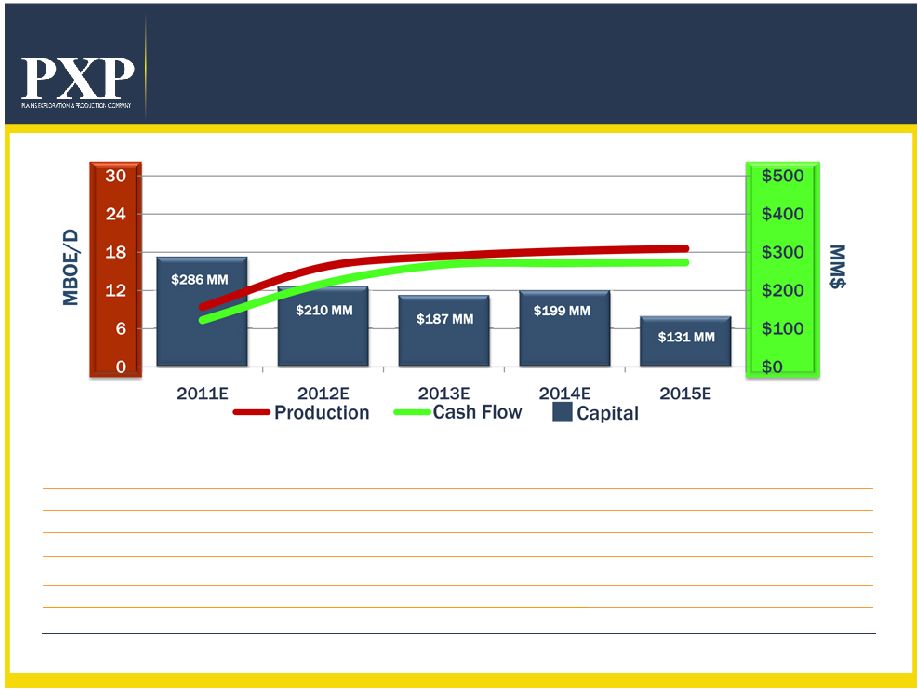
 PXP
Operational Plan at $100 Oil
PXP Net Production
Oil & Gas Cash Flow
(1)(2)
(1) Oil and Gas revenues minus lease expenses.
(2) Assumes $100/Bbl of oil and natural gas pricing of $4.50/MMBtu in 2011, $100/Bbl of
oil and natural gas pricing of $5.00/MMBtu in 2012, and $100/Bbl of oil and
natural gas pricing of $6.00/MMBtu 2013 and beyond. (3) Represents cash flow at
forecasted 2011 differentials. (4) Includes impact of recently announced crude
oil marketing contracts for California and Eagle Ford volumes. Oil & Gas
Capital Cash Flow
(4)
Cash Flow
(3)
Production
GOM Oil Production
Starts 2014
Reduce Haynesville
Spending 2012
11
200
175
150
125
100
75
50
25
0
$1500 MM
$1700 MM
$1700 MM
$1700 MM
$1500 MM
2011E
2012E
2013E
2014E
2015E
$4,000
$3,500
$3,000
$2,500
$2,000
$1,500
$1,000
$500
$0 |
 12
Oil/Liquids Operational Strategy
Focused Oil/Liquids Growth Strategy
•
Increase total company oil/liquids volumes
at a 17% CAGR through 2016 with current
development portfolio
•
Approximately 87% of 2012 CapEx
directed toward oil/liquids assets |
 13
Oil/Liquids Assets |
 14
California Oil
Onshore/Offshore
Los
Angeles
Basin
San Joaquin
Valley
Arroyo
Grande
Pt Pedernales
Pt Arguello
•
211 MMBOE Net Proved Reserves
•
272 MMBOE Net Development
Resource Potential
•
70% Proved Developed
•
14 yr R/P
•
2,000+ future well locations
The shaded areas are for illustrative purposes only and do not reflect actual
leasehold acreage. |
 15
California Oil
Operational Plan
January 1, 2010 Project Cost Forward F&D:
$9.87/BOE
(2)
PXP
Interest:
98% WI / 86%
NRI Potential Net Locations:
2,000+
Proved Net
Reserves:
211 MMBOE
Net Development Resource
Potential:
272 MMBOE
Average Gross Well Cost:
$1.2 MM
Average Gross EUR per Well:
135 MBOE
(1) Oil and Gas revenues minus lease expenses.
(2) Assumes $100/Bbl of oil and natural gas pricing of $4.50/MMBtu in 2011,
$100/Bbl of oil and natural gas pricing of $5.00/MMBtu in 2012, and $100/Bbl of oil
and natural gas pricing of $6.00/MMBtu 2013 and beyond.
(3) Represents cash flow at forecasted 2011 differentials.
(4) Includes impact of recently announced crude oil marketing contracts for
California volumes. |
 16
Eagle Ford Horizontal Oil Play
•
PXP acreage position
~58,700 net acres
•
4 to 6 rigs running in 2011
•
Depth to Eagle Ford Top
~9,500' -
11,500' TVD
TEXAS
Walker
Kimble
Lee
Travis
Milam
Llano
Burnet
Mason
Gillespie
Grimes
Matagorda
Williamson
Fort Bend
Brazos
Waller
Burleson
Webb
Duval
Frio
Kerr
Edwards
Bee
Uvalde
Bexar
Zavala
Medina
Dimmit
La Salle
Real
Maverick
Lavaca
Goliad
Atascosa
Hays
Fayette
Wharton
De Witt
Live Oak
Wilson
Victoria
McMullen
Bastrop
Gonzales
Nueces
Colorado
Karnes
Kleberg
Blanco
Bandera
Austin
Jackson
Refugio
Comal
Jim Wells
Kendall
Guadalupe
Caldwell
San Patricio
Washington
Calhoun
Aransas
Location Map
The shaded area is for illustrative purposes only and does not reflect actual
leasehold acreage. |
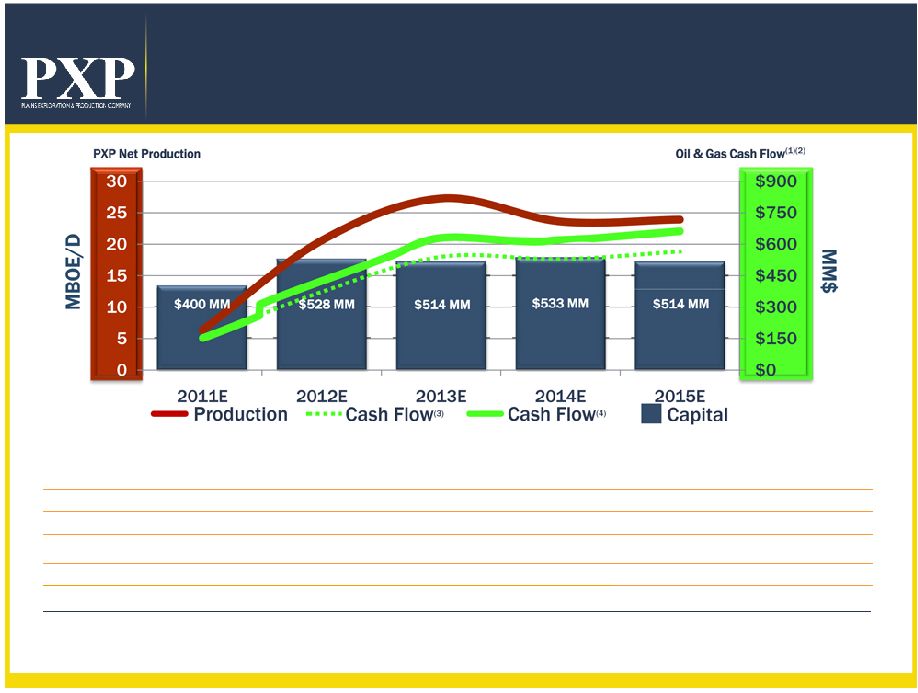 17
Eagle Ford Horizontal Oil Play
Operational Plan
September 1, 2010 Project Cost Forward F&D:
$18.81/BOE
(2)
PXP
Interest:
73% WI/ 56%
NRI Potential Net Locations:
487
Net Development Resource
Potential:
170 MMBOE
Average Gross Well Cost:
$7.0 MM
Average Gross Resource Potential per Well:
483 MBOE
(1) Oil and Gas revenues minus lease expenses.
(2) Assumes $100/Bbl of oil and natural gas pricing of $4.50/MMBtu in 2011,
$100/Bbl of oil and natural gas pricing of $5.00/MMBtu in 2012, and $100/Bbl of oil
and natural gas pricing of $6.00/MMBtu 2013 and beyond.
(3) Represents cash flow at forecasted 2011 differentials.
(4) Includes impact of recently announced crude oil marketing contract for Eagle
Ford volumes. |
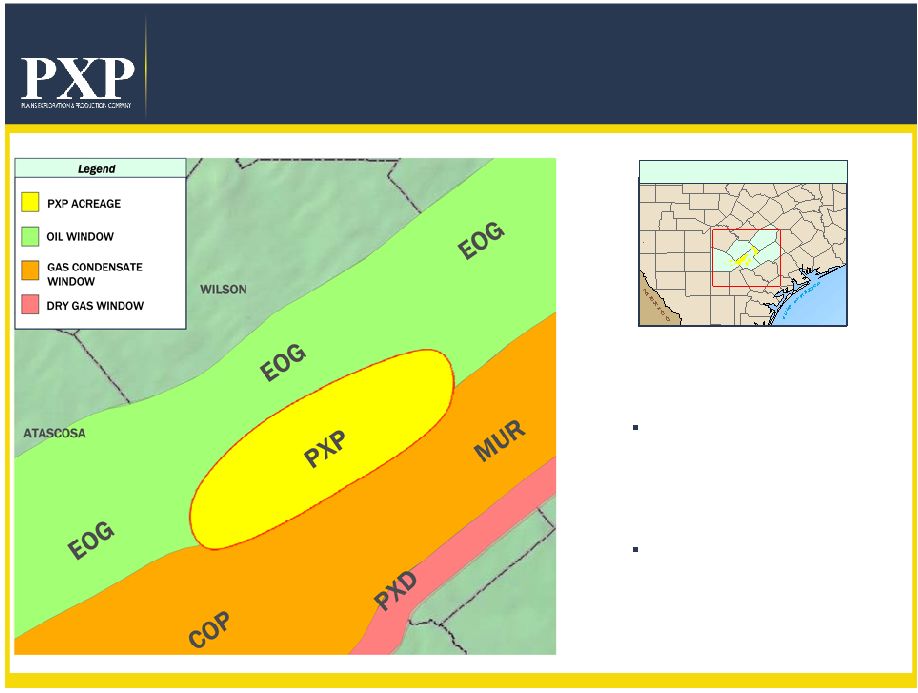
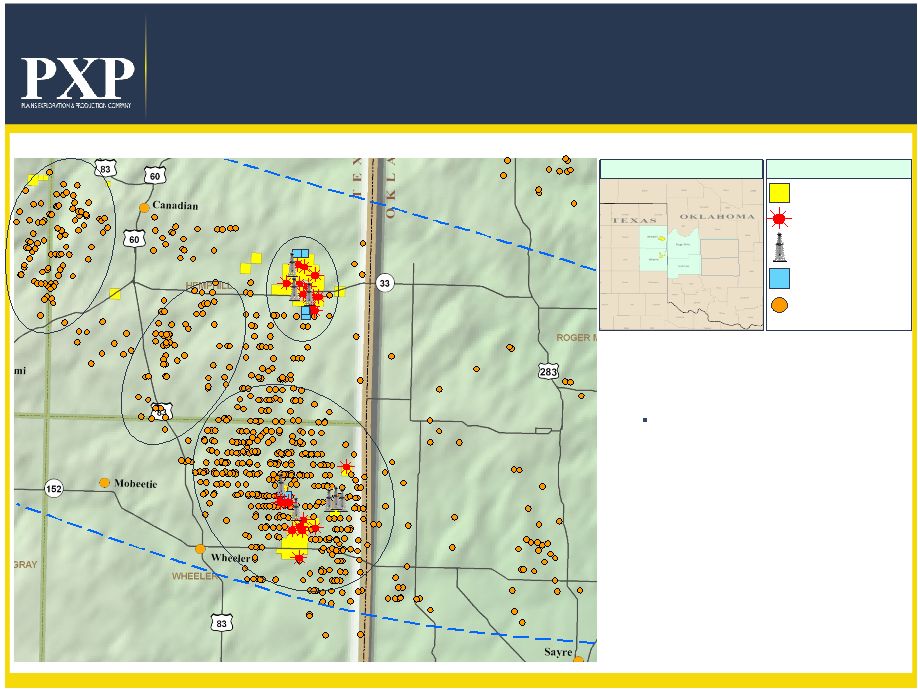 18
Panhandle Horizontal Liquids Play
Activity Map
•
PXP acreage position
21,400 net acres
•
Five rigs currently operating
•
152 Granite Wash Locations
(PXP WI 93%)
PXP Leases
PXP Producing Wells
Active Drilling
Waiting on Completion
Non PXP
Horizontal Wells
Custer
Washita
Legend
Location Map
Buffalo
Wallow Area
Marvin
Lake
Area
Wheeler
Area
NW. Mendota Area |
 19
Oil & Gas Cash Flow
(1)(2)
Panhandle Horizontal Liquids Play
Operational Plan
January 1, 2010 Project Cost Forward F&D:
$9.79/BOE or $1.62/Mcfe
(2)
PXP
Interest:
93% WI / 74%
NRI Net Acreage:
21,400
Potential
Locations:
152
Net Resource
Potential:
119.5 MMBOE
Average Gross Well Cost:
$8.2 MM
Average Gross EUR per Well:
1.1 MMBOE
PXP Net Production
(1) Oil and Gas revenues minus lease expenses.
(2) Assumes $100/Bbl of oil and natural gas pricing of $4.50/MMBtu in 2011,
$100/Bbl of oil and natural gas pricing of $5.00/MMBtu in 2012, and $100/Bbl of oil
and natural gas pricing of $6.00/MMBtu 2013 and beyond.
|
 20
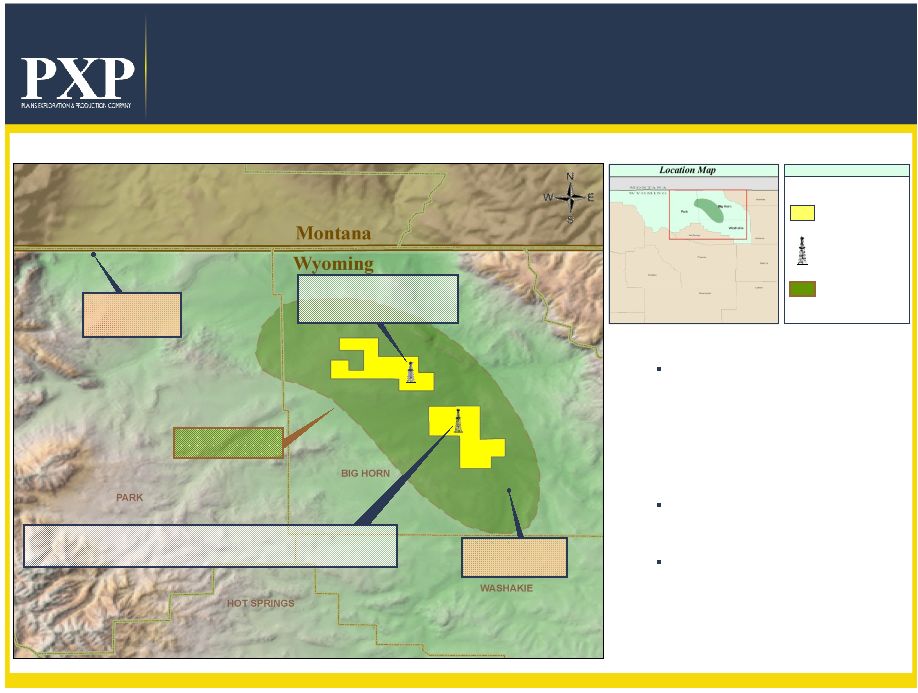
Mowry Shale Horizontal Oil Play
Big Horn Basin, Wyoming
•
PXP acreage position
106,300 net acres
•
Proven source rock
•
Petrophysical characteristics
of successful oil shale plays
•
Depth Range
~6,000' to 10,000'
•
Shale Thickness Range
~250' to 400'
•
Currently completing second
well
•
Two additional wells planned
for 2012
Legend
PXP LEASES
PXP DRILLING
OIL FAIRWAY
Oil Fairway
Mowry Oil
Production
Mowry Gas
Production
Drilled
but not completed
Drilled and completed in June 2011. This test produced
high-quality oil in small quantities. |
 21
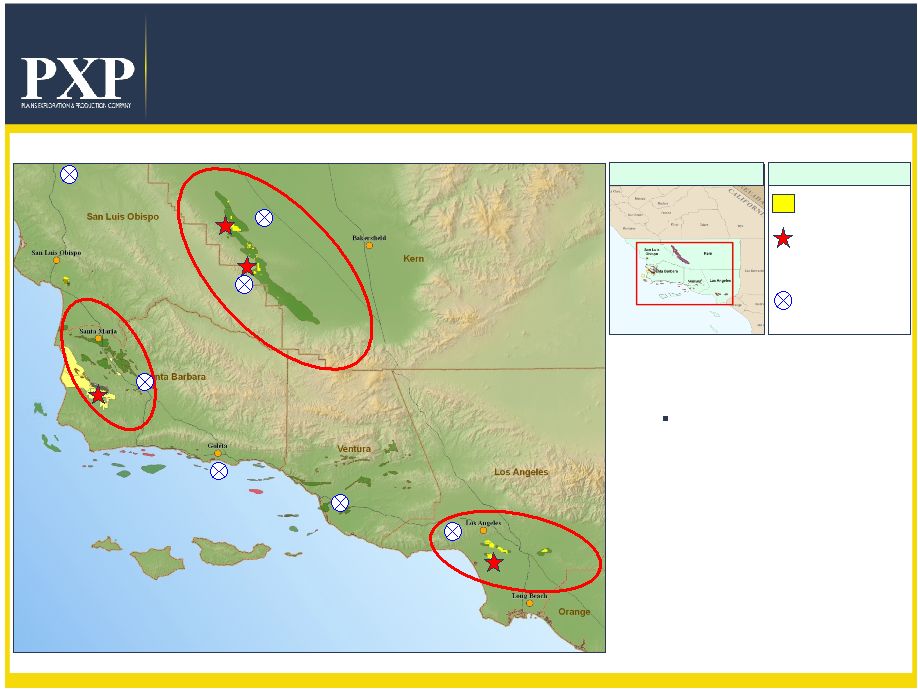
Legend
PXP ACREAGE
PXP
MONTEREY
PRODUCTION
OXY DISCOVERY
VENOCO
ACTIVITY
*
•
PXP acreage position
86,000 net acres
•
Acquiring 3D seismic data
over key assets
•
Potential exploratory wells
planned in 2011
Monterey Shale Oil Play
Location Map
Los Angeles Basin
Los Angeles Basin
Point Pedernales
Point Arguello
Rocky Point
Arroyo Grande
Lompoc
Cymric
Belridge
McKittrick
Midway Sunset
Urban Area
Las Cienegas
Inglewood
Montebello
Pescado
Hondo
San Joaquin Basin
San Joaquin Basin
Santa Maria Basin
Santa Maria Basin
*
Jesus Maria |
 22
Lucius Oil Development
•
Lucius
Oil
Development,
Deepwater
Gulf
of
Mexico
-
project
financing efforts ongoing
•
Coordinating with official Lucius oil project commercial
sanction targeted for year end 2011
•
“Gross resource potential in the Lucius field is approximately
300+ MMBOE”
(1)
•
The Hadrian 5 (KC 919-3) well, that is part of the Lucius
unitization agreement, initially “encountered 475 feet of net oil
pay”
and “drilling ahead to deeper objectives, encountered an
additional 250 feet of net oil pay”
(2)
•
600+ MMBOE net resource potential from Phobos and
additional Pliocene, Miocene and Lower Tertiary prospects
(1)
Source: Anadarko Petroleum Corporation (APC)
(2)
Exxon Mobil Corporation (XOM) Q2 2011 Earnings Call Transcript
|
 23
ExxonMobil / Hadrian 2
KC 964 OCSG-21451 #1
Source: Wood Mackenzie,
Plains Offshore estimates,
ExxonMobil and BOEMRE
ExxonMobil / Hadrian 1
KC 919 OCSG-21447 #1
LUCIUS Discovery
PHOBOS Prospect
Lucius 1
Lucius 1ST
Lucius 2
Hadrian 3
Hadrian 1
Hadrian 2
Hadrian 4
Phobos 1
•Potential 2012 drill
•25,000 acres higher than oil pay at
Hadrian 2
•Pliocene, Miocene and Wilcox potential
•Structure mapped on seismic
Hadrian 2
•Over 1,000 feet of net sand with
over 400 feet of net oil and gas
pay
Hadrian 1
•Over 900 feet of net sand with over
100 feet of net oil and gas pay
•Kicked off additional delineation
drilling in the complex
Lucius 2
•Over 600 feet of net oil pay in three primary
oil pays
•Deeper targets remaining to be drilled
Lucius 1
•Over 600 feet of net high-
quality oil pay with further
gas condensate pay
•Successful flow test
complete
Hadrian 3
•Over 500 feet of net oil pay
Hadrian 5 (KC 919-3)
•Over 700 feet of net oil pay
Hadrian 4
•Discovery
Hadrian 5
HADRIAN Discovery
Lucius / Hadrian / Phobos Oil Complex
500 MMBOE of Discovered Resource;
1+ BBOE Exploration Upside |
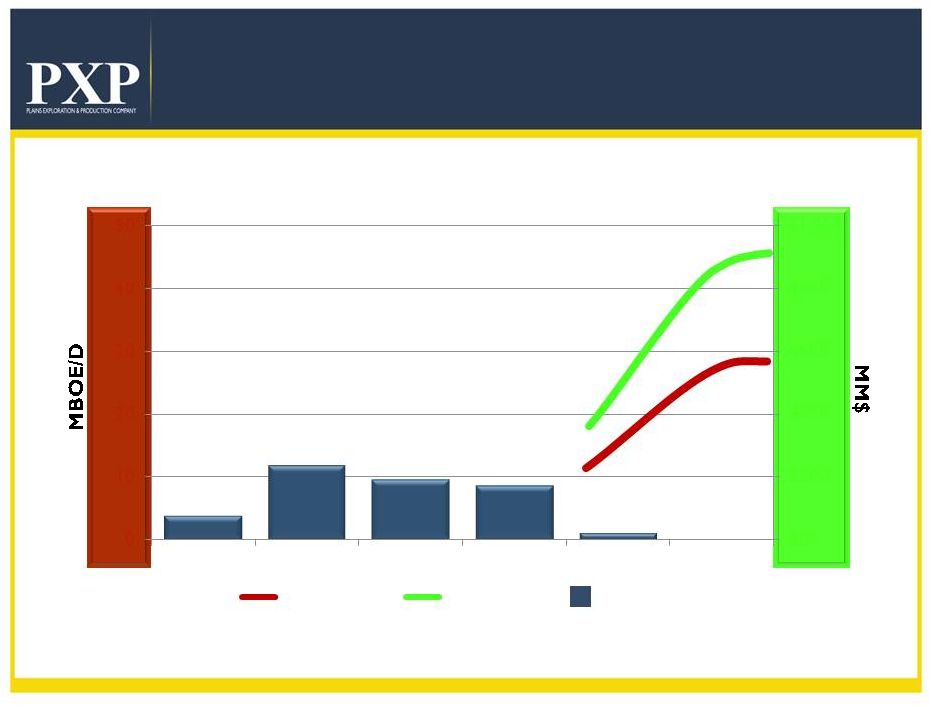 Net
Production Oil & Gas Cash Flow
(1)
Gulf of Mexico Operational Plan
(1) Oil and Gas revenues minus lease expenses.
Capital
Cash Flow
Production
24
50
40
30
20
10
0
$1,000
$800
$600
$400
$200
$0
$75 MM
$235 MM
$190 MM
$170 MM
$10 MM
2011E
2012E
2013E
2014E
2015E |
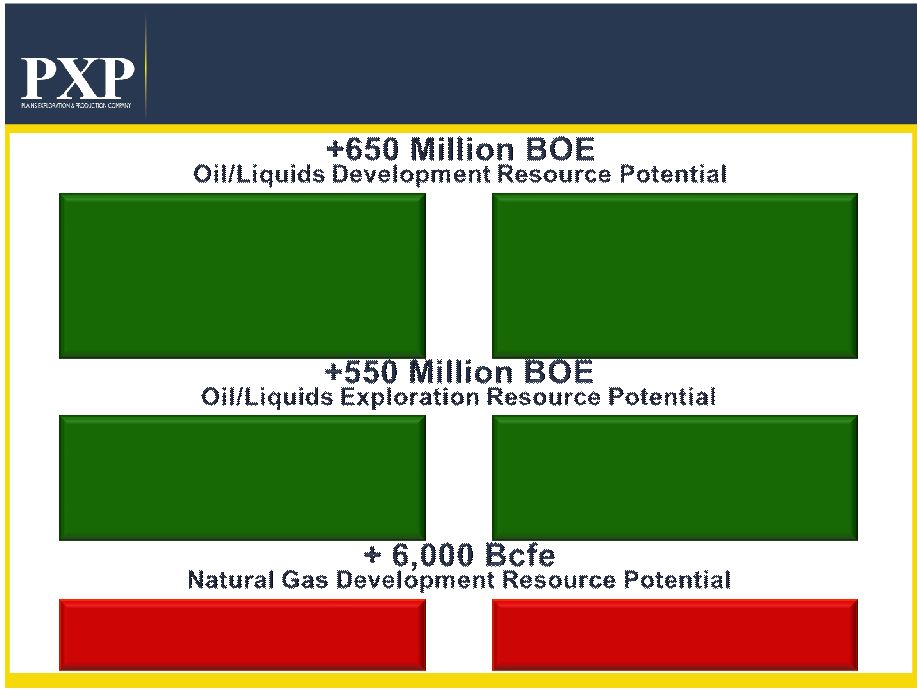 25
+2.2 Billion BOE Resource Potential
Potential Reserves
272 MMBOE
170 MMBOE
120 MMBOE
106 MMBOE
Region
California
Eagle Ford
Granite Wash
Gulf of Mexico
Potential Reserves
156 MMBOE
30 MMBOE
409 MMBOE
Region
Mowry Shale
Monterey Shale
Gulf of Mexico
6,000 Bcfe
60 Bcfe
Haynesville/Bossier
Rockies |
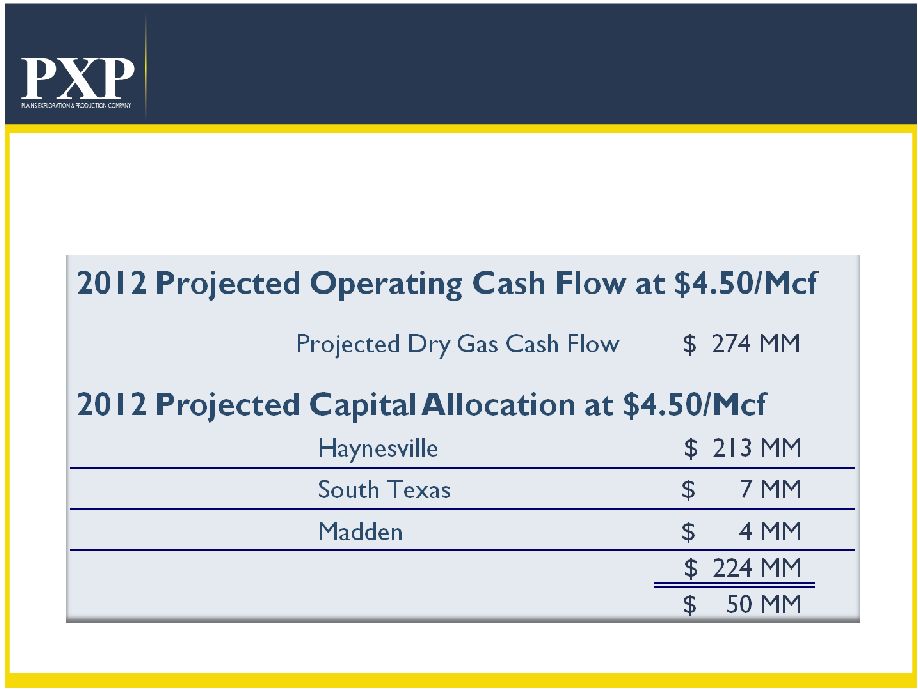 Projected Dry Gas Scenario at $4.50 Mcf
•
Closely align Natural Gas focused CapEx with Natural
Gas generated operating cash flow at $4.50/Mcf
26 |
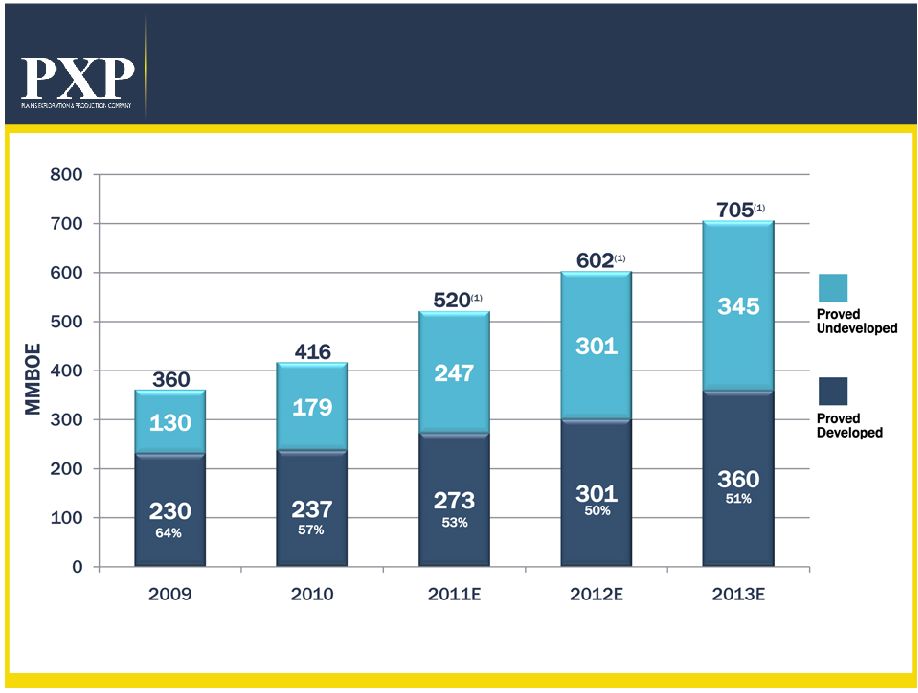 27
Proved Reserves Target Growth
(1)
Illustrates estimated reserves using NYMEX pricing.
Excludes deepwater Gulf of Mexico. |
 28
PXP Targets Over Next 3 Years
•
Grow
reserves
15%
to
20%
per
year
over
the
next 3 years
•
Grow
production
10%
to
15%
per
year
over
the
next 3 years
•
Efficiently
manage
business
focusing
on
cost
reduction
and
profitability
•
Maintain
active
hedging
program
for
secure
cash
flow
•
Focus drilling on high liquid development projects
to increase total percentage of oil production |
 29
Addendum |
 30
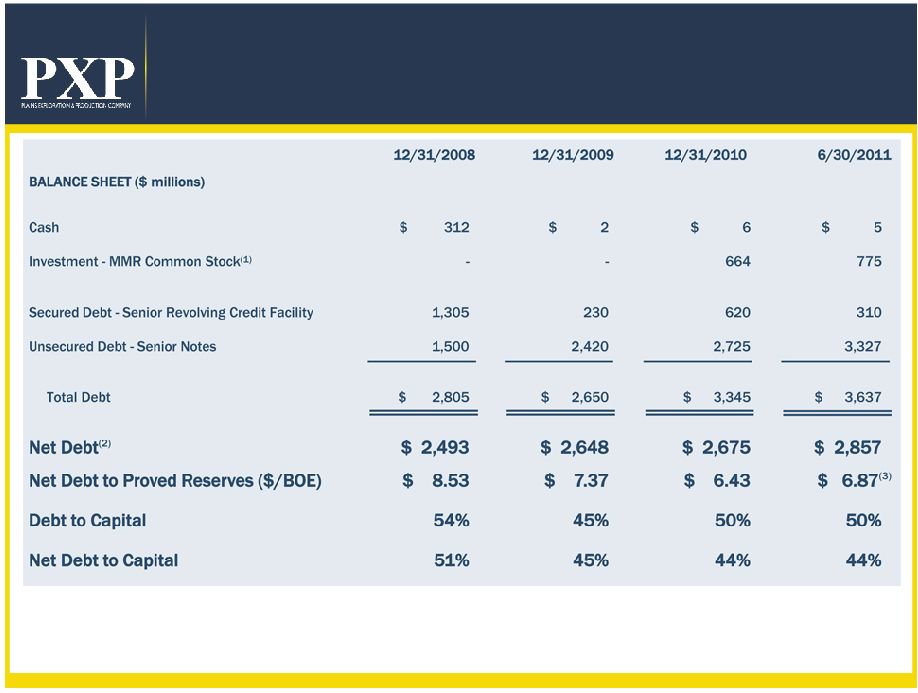
Stronger Financial Position
(1)
At
December
31,
2010
and
June
30,
2011
the
McMoRan
("MMR")
shareswere
valued
at
approximately
$664.3
million,
and
$774.9
million
respectively
based
on
MMR's
closing
stock
price
of
$17.14
on
December
31,
2010
and
$18.48
on
June
30,
2011
discounted
to
reflect
certain
restrictions
on
the
marketability
of
the
MMR
shares.
Under
the
terms
of
the
stockholder
agreement
with
MMR,
we
are
generally
prohibited
from
transferring
any
of
our
shares
of
MMR
until
December
30,
2011.
In
addition,
the
market
price
of
MMR
common
stock
may
decline
substantially
before
we
sell
them.
(2)
Net
of
Cash
and
Investment
in
MMR
common
stock.
(3)
Calculated
utilizing
December
31,
2010
proved
reserves. |
 31
(Millions, except for share data)
Quarter
Ended
6/30/2011
Quarter
Ended
6/30/2010
Revenues
$ 514.8
$ 364.6
Production Costs
(143.1)
(100.7)
General & Administrative
(30.8)
(30.3)
DD&A & Accretion Expense
(155.1)
(128.2)
Impairment of Oil & Gas Properties
-
(59.5)
Other Operating Income
0.3
3.9
Income From Operations
$ 186.1
$ 49.8
Income Before Income Taxes
$ 212.1
$ 91.0
Net Income
$ 124.9
$ 45.4
Earnings Per Share –
Diluted
$ 0.87
$ 0.32
Income Statement Summary |
 “People building value together to find and produce
energy resources safely, reliably and efficiently”
|