Attached files
Table of Contents
UNITED STATES
SECURITIES AND EXCHANGE COMMISSION
Washington, D.C. 20549
FORM 10-K
(Mark One)
| þ | ANNUAL REPORT PURSUANT TO SECTION 13 OR 15(d) OF THE SECURITIES EXCHANGE ACT OF 1934 |
For the Fiscal Year Ended June 30, 2011
OR
| ¨ | TRANSITION REPORT PURSUANT TO SECTION 13 OR 15(d) OF THE SECURITIES EXCHANGE ACT OF 1934 |
For the Transition Period from to .
Commission File Number 1-9728
![]()
EPOCH HOLDING CORPORATION
(Exact Name of Registrant as Specified in Its Charter)
| Delaware | 20-1938886 | |
| (State or Other Jurisdiction of Incorporation or Organization) |
(I.R.S. Employer Identification No.) |
640 Fifth Avenue, New York, NY 10019
(Address of Principal Executive Offices), (Zip Code)
(212) 303-7200
(Registrant’s Telephone Number, Including Area Code)
Securities registered pursuant to Section 12(b) of the Act:
| Title of Each Class |
Name of Each Exchange on Which Registered | |
| Common Stock, $0.01 per share par value | NASDAQ Global Select Market |
Securities registered pursuant to Section 12(g) of the Act: None
Indicate by check mark if the registrant is a well-known seasoned issuer, as defined in Rule 405 of the Securities Act. Yes ¨ No x
Indicate by check mark if the registrant is not required to file reports pursuant to Section 13 or Section 15(d) of the Act. Yes ¨ No x
Table of Contents
Indicate by check mark whether the registrant: (1) has filed all reports required to be filed by Section 13 or 15(d) of the Securities Exchange Act of 1934 during the preceding 12 months (or for such shorter period that the registrant was required to file such reports), and (2) has been subject to such filing requirements for the past 90 days. Yes x No ¨
Indicate by check mark if disclosure of delinquent filers pursuant to Item 405 of Regulation S-K (§229.405 of this chapter) is not contained herein, and will not be contained, to the best of registrant’s knowledge, in definitive proxy or information statements incorporated by reference in Part III of this Form 10-K or any amendment to this Form 10-K. ¨
Indicate by check mark whether the registrant is a large accelerated filer, an accelerated filer, a non-accelerated filer, or a smaller reporting company. See definitions of “large accelerated filer,” “accelerated filer,” and “smaller reporting company” in rule 12b-2 of the Exchange Act. (Check one).
| Large accelerated filer ¨ |
Accelerated filer x | Non-accelerated filer ¨ | Smaller reporting company ¨ | |||
| (Do not Check if a Smaller Reporting Company) |
Indicate by check mark whether the registrant has submitted electronically and posted on its corporate Website, if any, every Interactive Data File required to be submitted and posted pursuant to Rule 405 of Regulation S-T (§232.405 of this chapter) during the preceding 12 months (or for such shorter period that the registrant was required to submit and post such files). Yes ¨ No ¨
Indicate by check mark whether the registrant is a shell company (as defined in Rule 12b-2 of the Exchange Act). Yes ¨ No x
As of December 31, 2010, the last trading day of the registrant’s most recently completed second fiscal quarter, the aggregate market value of common stock held by non-affiliates of the registrant was approximately $233.7 million, computed by reference to the closing price of $15.53 on the NASDAQ Global Select Market on that day. Shares of common stock held by officers, directors and certain holders of more than 1% of the outstanding common stock have been excluded from this calculation because such persons may be deemed to be affiliates.
As of August 31, 2011, there were 23,351,892 shares of the registrant’s common stock, $.01 par value per share, issued and outstanding.
DOCUMENTS INCORPORATED BY REFERENCE
Portions of the following documents are incorporated herein by reference into the Form 10-K as indicated:
| Document |
Part of Form 10-K into Which Incorporated | |
| Epoch Holding Corporation’s Definitive Proxy Statement for the 2011 Annual Meeting of Shareholders to be held on December 1, 2011 | Part III |
Table of Contents
![]()
EPOCH HOLDING CORPORATION AND SUBSIDIARIES
ANNUAL REPORT ON FORM 10-K
FOR THE FISCAL YEAR ENDED JUNE 30, 2011
| Page No. | ||||||
| PART I | ||||||
| Item 1. |
1 | |||||
| Item 1A. |
14 | |||||
| Item 1B. |
22 | |||||
| Item 2. |
23 | |||||
| Item 3. |
23 | |||||
| Item 4. |
23 | |||||
| PART II | ||||||
| Item 5. |
Market for Registrant’s Common Equity, Related Stockholder Matters and Issuer Purchases of Equity Securities | 24 | ||||
| Item 6. |
28 | |||||
| Item 7. |
Management’s Discussion and Analysis of Financial Condition and Results of Operations |
30 | ||||
| Item 7A. |
52 | |||||
| Item 8. |
55 | |||||
| Item 9. |
Changes in and Disagreements with Accountants on Accounting and Financial Disclosure |
84 | ||||
| Item 9A. |
84 | |||||
| Item 9B. |
84 | |||||
| PART III | ||||||
| Item 10. |
85 | |||||
| Item 11. |
85 | |||||
| Item 12. |
Security Ownership of Certain Beneficial Owners and Management and Related Stockholder Matters | 85 | ||||
| Item 13. |
Certain Relationships and Related Transactions and Director Independence |
85 | ||||
| Item 14. |
85 | |||||
| PART IV | ||||||
| Item 15. |
86 | |||||
| 89 | ||||||
i
Table of Contents
PART I
| Item 1. | Business. |
Forward-Looking Statements
Certain information included, or incorporated by reference in this Annual Report on Form 10-K and other materials filed or to be filed by Epoch Holding Corporation (“Epoch” or the “Company”) with the United States Securities and Exchange Commission (the “SEC”) contain statements that may be considered forward-looking within the meaning of the Private Securities Litigation Reform Act of 1995. In some cases, you can identify these statements by forward-looking words such as “may,” “might,” “will,” “should,” “expect,” “plan,” “anticipate,” “believe,” “estimate,” “predict,” “potential” or “continue,” and the negative of these terms and other comparable terminology. These forward-looking statements, which are subject to known and unknown risks, uncertainties and assumptions about the Company, may include projections of the Company’s future financial performance based on the Company’s anticipated growth strategies and trends in the Company’s business. These statements are only predictions based on the Company’s current expectations and projections about future events. There are important factors that could cause the Company’s actual results, level of activity, performance or achievements to differ materially from the results, level of activity, performance or achievements expressed or implied by the forward-looking statements. In particular, you should consider the risks and uncertainties outlined in Item 1A. “Risk Factors.”
These risks and uncertainties are not exhaustive. Other sections of this Annual Report on Form 10-K may include additional factors which could adversely impact the Company’s business and financial performance. Moreover, the Company operates in a very competitive and rapidly changing environment. New risks and uncertainties emerge from time to time, and it is not possible for the Company’s management to predict all risks and uncertainties, nor can the Company assess the impact of all factors on the Company’s business or the extent to which any factor, or combination of factors, may cause actual results to differ materially from those contained in any forward-looking statements.
Although the Company believes the expectations reflected in the forward-looking statements are reasonable, the Company cannot guarantee future results, level of activity, performance or achievements. Moreover, neither the Company nor any other person assumes responsibility for the accuracy or completeness of any of these forward-looking statements. You should not rely upon forward-looking statements as predictions of future events. The Company is under no duty to update any of these forward-looking statements after the date of this Annual Report on Form 10-K, nor to conform the Company’s prior statements to actual results or revised expectations, and the Company does not intend to do so.
Forward-looking statements include, but are not limited to, statements about the Company’s:
| • | business environment, |
| • | expectations with respect to the economy, securities markets, the market for asset management activity and other industry trends, |
| • | competitive position, |
| • | business strategy, |
| • | strategic relationships, |
| • | investment products, |
| • | recruitment and retention of employees, |
| • | possible or assumed future results of operations and operating cash flows, |
| • | potential operating performance, achievements, productivity improvements, technological changes, efficiency and cost reduction efforts, |
| • | expected tax rates, and |
| • | the effect of future legislation and regulation on its business. |
1
Table of Contents
The Company uses a fiscal year, which ends on June 30. References to “FY 2011,” “FY 2010,” and “FY 2009” in this document refer to the fiscal years ended June 30, 2011, June 30, 2010, and June 30, 2009, respectively. This Annual Report on Form 10-K may also include forward-looking statements which refer to fiscal years subsequent to the historical financial positions and results of operations contained herein. References to future fiscal years also apply to the June 30 year-end. When we use the terms the “Company,” “management,” “we,” “us,” and “our,” we mean Epoch Holding Corporation and its consolidated subsidiaries.
Available Information
Reports we file electronically with the SEC via the SEC’s Electronic Data Gathering, Analysis and Retrieval system (“EDGAR”) may be accessed through the internet. The SEC maintains a website that contains reports, proxy and information statements, and other information regarding issuers that file electronically with the SEC, at www.sec.gov. In addition, the public may read and copy any material that we file with the SEC at the SEC’s Public Reference Room at 100F Street, N.E., Washington, D.C., 20549. Information on the operation of the Public Reference Room may be obtained by calling the SEC at 1-800-SEC-0330.
We maintain a website which contains current information on operations and other matters. The website address is www.eipny.com. Through the Investor Relations section of our website, and the “Financial Information” tab therein, we make available, free of charge, our Annual Report on Form 10-K, Quarterly Reports on Form 10-Q, Current Reports on Form 8-K, Proxy Statement, and any amendments to those reports filed or furnished pursuant to Section 13(a) or 15(d) of the Exchange Act as soon as reasonably practicable after we electronically file such material with, or furnish it to, the SEC. Our website also includes information concerning purchases and sales of our equity securities by our executive officers and directors. The information on our website is not, and shall not be deemed to be a part hereof or incorporated into this or any other filings with the SEC.
Also available free of charge on our website within the Investors Relations section, and the “Corporate Governance” tab therein, is our Code of Ethics and Business Conduct, as well as charters for the Audit, Nominating/Corporate Governance, and the Compensation Committees of our Board of Directors.
Overview
Epoch Holding Corporation, incorporated in Delaware in 2004, is a holding company headquartered in New York, NY whose sole line of business is investment advisory and investment management services. The operations of the Company are conducted through its wholly owned subsidiary, Epoch Investment Partners, Inc. (“EIP”). EIP is a registered investment adviser under the Investment Advisers Act of 1940, as amended (the “Investment Advisers Act”).
EIP is an asset management firm with over $17 billion in assets under management (“AUM”) as of June 30, 2011, serving institutional, sub-advisory, and high net worth clients worldwide. For the fiscal year ended June 30, 2011, we generated approximately one-third of our total revenue from clients located outside the U.S.
Our firm’s professional investment staff averages over 20 years of industry experience. Our investment philosophy is focused on achieving superior long-term, risk-adjusted returns by investing in companies that generate free cash flow, appropriately allocate capital to create returns for shareholders, have understandable business models, possess transparent financial statements, and are undervalued relative to our investment team’s value determinations. Security selection and portfolio construction processes are designed to reduce the likelihood of significant capital losses in declining markets while participating in returns from rising markets.
2
Table of Contents
Our operations began in April 2004 with approximately $0.6 billion in AUM and we have grown into a global asset management firm with $17.1 billion in AUM at June 30, 2011. The chart below depicts our annual AUM growth since inception as well as AUM for the last four fiscal quarters:
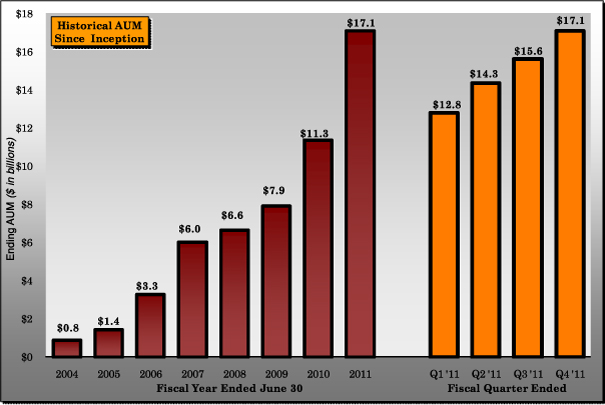
Our AUM growth reflects favorable long-term investment performance and quality client service, administered across a broad array of investment strategies, distribution channels, and market exposures. We believe these attributes will help us continue to expand and grow our business.
3
Table of Contents
Selected financial operating results for the last five years are as follows:
| For the Fiscal Year Ended June 30, | ||||||||||||||||||||
| (Dollar amounts in millions) |
2011 | 2010 | 2009 | 2008 | 2007 | |||||||||||||||
| Operating Revenue |
$ | 70,599 | $ | 53,360 | $ | 31,185 | $ | 33,806 | $ | 23,935 | ||||||||||
| Operating Expense |
$ | 41,842 | $ | 35,204 | $ | 27,737 | $ | 29,952 | $ | 26,452 | ||||||||||
| Operating Income |
$ | 28,757 | $ | 18,156 | $ | 3,448 | $ | 3,854 | $ | (2,517 | ) | |||||||||
| Operating Margin (1) |
41 | % | 34 | % | 11 | % | 11 | % | (11 | %) | ||||||||||
| Cash Flows From Operations |
$ | 18,633 | $ | 14,211 | $ | 855 | $ | 11,349 | $ | 2,389 | ||||||||||
| Working Capital (2) |
$ | 41,613 | $ | 43,697 | $ | 41,897 | $ | 36,792 | $ | 32,685 | ||||||||||
| (1) | Operating margin is computed by dividing operating income/(loss) by total operating revenues. |
| (2) | Working capital is computed by subtracting current liabilities from current assets. |
FY 2011 Significant Developments and Highlights*
The following items are corporate highlights and events which transpired during the year ended June 30, 2011:
| (1) | AUM at June 30, 2011 was $17.1 billion, a 51% increase from a year ago. |
| (2) | Net AUM inflows were $1.8 billion. We continued to develop our distribution channels, including the addition of several significant new institutional and sub-advisory relationships. |
| (3) | As of the fiscal year ended June 30, 2011, all of our investment strategies have outperformed their respective benchmarks for the past five-year period, and nearly all investment strategies have outperformed their respective benchmarks since their inception. |
| (4) | Total operating revenues exceeded $70 million, while our operating margin improved to 41%. |
| (5) | We paid a special cash dividend of $0.75 per share in December 2010, in addition to the regular quarterly dividends. In January 2011, the Board approved an increase in the quarterly dividend rate from $0.05 to $0.06 per share. |
| (6) | We repurchased approximately 98,000 shares during the fiscal year ended June 30, 2011. As of June 30, 2011, we have repurchased a cumulative total of 580,016 shares and have 219,984 shares remaining for repurchase under the existing repurchase plan. |
| (7) | Our balance sheet remains strong. At June 30, 2011, liquid assets comprising of cash, cash equivalents, and accounts receivable were $46.3 million, representing 65% of total assets. We continue to operate debt-free. |
* See Item 7, “Management’s Discussion and Analysis of Financial Condition and Results of Operations,” for further financial highlights.
4
Table of Contents
Our Business
Investment Management Fees
We earn revenues from managing client accounts under investment advisory and sub-advisory agreements. The fees we earn depend on the type of investment strategy we manage, and are typically negotiated after consultation with the client based upon additional factors such as amount of AUM and servicing requirements. Approximately 48% of our fees are based upon daily average AUM, while 52% of our fees are based upon quarter-end AUM balances. We also have certain agreements which allow us to earn performance fees in the event that investment returns meet or exceed targeted amounts during a measurement period.
Clients
Our client base consists of a large number of geographically diverse clients across many industries. We provide investment management services to a broad range of clients including corporations, mutual funds, retirement plans, public pension funds, endowments, foundations, financial institutions and high net worth individuals. We strive to expand our client base by attracting new clients and earn additional business from our existing clients.
Investment Philosophy
Our investment philosophy is focused on achieving superior long-term, risk-adjusted returns by investing in companies that generate free cash flow, appropriately allocate capital to create returns for shareholders, have understandable business models, possess transparent financial statements, and are undervalued relative to our investment team’s value determinations. Security selection and portfolio construction processes are designed to reduce the likelihood of significant capital losses in declining markets while participating in returns from rising markets.
Investment Process
Our investment strategies are managed by a team of portfolio managers supported by fundamental and quantitative research analysts. Our investment process is centered on the integration of several components: fundamental research analysis, quantitative research, disciplined portfolio construction and management, performance attribution and trading.
Our investment process incorporates the following concepts:
| • | Analyze the Business. Determine the sustainability of the business, earnings drivers, barriers to entry, and competitive advantages. |
| • | Understand the Cash Flow Structure. Focus on companies that generate cash earnings and assess the quality and character of those earnings to determine the net cash flow from the business. |
| • | Relate Cash Flow to Enterprise Value. Examine relevant claims against net cash flow and determine the necessity of these claims to maintain and grow the business. Evaluate how management will use free cash flow. Value the cash flow stream and compare it to enterprise value to determine the attractiveness of the investment. |
| • | Evaluate Management Quality. Identify management with an intention and demonstrated ability to create shareholder value. |
| • | Seek Unrecognized Assets. Uncover, where possible, hidden, undervalued or underutilized assets, especially in under-researched small and mid-cap companies. |
While the security selection and research methodology is the same for all of our investment strategies, the portfolio construction process is adaptable to the specific parameters of each client’s individual mandate.
5
Table of Contents
Our research analysts subject the companies they cover to a detailed fundamental analysis. They focus on a company’s management, business plan, financial statements, industry position and corporate governance. We also require our research analysts to spend a significant amount of time interacting with and visiting company management.
Portfolio Risk Management
Risk management is central to the operation of our investment process. We use both quantitative and qualitative analyses to monitor financial and event risk and manage volatility. We place substantial emphasis on portfolio diversification by asset class, industry sector and geography. The active management of positions in our strategies allows for timely reallocation of capital in response to changes in business, market or economic conditions. Additionally, our portfolio managers meet with our analysts regularly to review inherent risks associated with positions in each strategy.
Investment Strategies
As of June 30, 2011, we offered the following investment strategies to our clients:
| (1) | U.S. All Cap Value — Comprised of a broad range of U.S. companies with market capitalizations that resemble stocks in the Russell 3000*, a U.S. Equity index which measures the performance of the 3,000 largest U.S. companies based upon total market capitalization. |
| (2) | U.S. Value — Reflects a selection of equities in U.S. companies with market capitalizations generally considered comparable to the Russell 1000*, a U.S. Equity index which measures the performance of the 1,000 largest companies in the Russell 3000 Index*. |
| (3) | U.S. Smid (small/mid) Cap Value — Comprises U.S. companies with market capitalizations generally considered to be comparable to the Russell 2500*, a U.S. Equity index which measures the performance of the 2,500 smallest companies in the Russell 3000 Index*. |
| (4) | U.S. Small Cap Value — Consists of U.S. companies with market capitalizations generally considered to be comparable to the Russell 2000*, a U.S. Equity index which measures the performance of the 2,000 smallest companies in the Russell 3000 Index*. |
| (5) | U.S. Choice — Uses the same security selection process as our other investment strategies but the holdings are limited to 20 – 30 U.S. equity positions and is fully invested. The benchmark for this investment strategy is the Russell 3000 Index*. |
| (6) | International Small Cap — Draws almost all of its holdings from companies outside the U.S., with “small cap” defined as companies with market capitalization in the bottom 25% of the publicly traded companies in each country where the strategy is applied. MSCI World ex USA Small Cap Index** is the benchmark for this investment strategy. |
| (7) | Global Small Cap — Seeks to capitalize upon the continuing globalization of the world economy by investing in small cap companies in the U.S. and throughout the world. The benchmark for this investment strategy is the MSCI World Small Cap Index**. |
| (8) | Global Choice — Uses the same security selection process as our other investment strategies but the holdings are limited to 20 – 35 global equity positions and are fully invested. The MSCI World Index** is the benchmark for this investment strategy. |
| (9) | Global Absolute Return — While this strategy uses the same security selection process as other investment strategies offered by EIP, its holdings are generally limited to fewer than 30 positions. Individual positions can be as high as 15% and cash is used to control loss exposure. The benchmark for this investment strategy is the MSCI World Index**. |
6
Table of Contents
| (10) | Global Equity Shareholder Yield — Seeks to invest in a diversified portfolio of global equity securities with a history of attractive dividend yields and positive growth in free cash flow. The primary objective of this investment strategy is to seek a high level of income, with capital appreciation as a secondary investment objective. The MSCI World Index** is the benchmark for this investment strategy. |
| (11) | Balanced Portfolios — This investment strategy is available primarily to our high net worth investors. The mix of debt and equity securities is tailored to reflect (i) the client’s tolerance for risk and (ii) the client’s marginal tax rate or other preferences. As a result, the mix can vary among individual clients. The equity components of these portfolios typically reflect our U.S. All Cap equity structure and generally contain 40 – 60 positions, almost all of which are held in our other investment strategies. The debt component of the portfolio is largely comprised of high quality bonds. |
| * | Russell indexes are trademarks of Russell Investments, which is not affiliated with Epoch. |
| ** | MSCI World Indexes are trademarks of MSCI Inc., which is not affiliated with Epoch. |
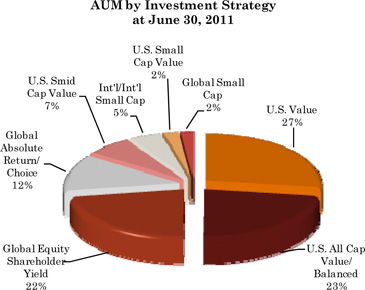
The following chart displays our investment strategies as a percentage of AUM as of June 30, 2011:
The table below depicts our investment strategies’ annual AUM for the past five years, as well as their respective compound annual growth rate for the one, three, and five years ended June 30, 2011 (in millions):
| As of June 30, | Compound Annual Growth Rate | |||||||||||||||||||||||||||||||
| Investment Strategy |
2011 | 2010 | 2009 | 2008 | 2007 | 1 Year | 3 Years | 5 Years | ||||||||||||||||||||||||
| U.S. Value |
$ | 4,661 | $ | 3,403 | $ | 2,340 | $ | 1,499 | $ | 1,155 | 37.0 | % | 46.0 | % | 42.1 | % | ||||||||||||||||
| U.S. All Cap Value/Balanced |
3,900 | 2,646 | 2,016 | 1,601 | 1,395 | 47.4 | % | 34.6 | % | 37.7 | % | |||||||||||||||||||||
| Global Equity Shareholder Yield |
3,811 | 1,959 | 1,515 | 1,538 | 1,323 | 94.5 | % | 35.3 | % | 77.1 | % | |||||||||||||||||||||
| Global Absolute Return/Choice(1) |
2,131 | 1,462 | 375 | 402 | 259 | 45.8 | % | 74.4 | % | 80.6 | % | |||||||||||||||||||||
| U.S. Smid Cap Value |
1,115 | 902 | 749 | 409 | (2) | 13 | 23.6 | % | 39.7 | % | N/A | |||||||||||||||||||||
| International/International Small Cap |
778 | 403 | 396 | 548 | 688 | 93.1 | % | 12.4 | % | 15.8 | % | |||||||||||||||||||||
| U.S. Small Cap Value |
374 | 362 | 325 | 423 | (2) | 995 | 3.3 | % | (4.0 | %) | (10.8 | %) | ||||||||||||||||||||
| Global Small Cap |
316 | 207 | 175 | 214 | 173 | 52.7 | % | 13.9 | % | 1.3 | % | |||||||||||||||||||||
|
|
|
|
|
|
|
|
|
|
|
|
|
|
|
|
|
|||||||||||||||||
| Total AUM |
$ | 17,086 | $ | 11,344 | $ | 7,891 | $ | 6,634 | $ | 6,001 | 50.6 | % | 37.1 | % | 39.3 | % | ||||||||||||||||
|
|
|
|
|
|
|
|
|
|
|
|
|
|
|
|
|
|||||||||||||||||
N/A - not applicable
| (1) | Includes U.S. Choice and Global Choice. |
| (2) | In the year ended June 30, 2008, approximately $360 million of AUM transferred from the U.S. Small Cap Value investment strategy to the U.S. Smid Cap Value investment strategy. |
7
Table of Contents
Investment Strategy Development
We have developed several new investment strategies since our inception. Investment strategy development has stemmed from our investment team’s skill and market knowledge, as well as our responsiveness to client and market demands. We will only launch a new investment strategy if we believe that it can add value to a client’s investment portfolio, or may be attractive to our clients in the future. In certain instances we may incubate an investment strategy using our own capital, in order to test and refine our investment strategy and process before introducing the investment strategy to our clients.
Performance Highlights
We measure relative investment performance by comparing our investment returns to competing investment strategies, industry benchmarks and client investment objectives. As long-term fundamental investors, we believe that our investment strategies yield the most benefits, and are best evaluated, over a long-term time horizon. The following table shows each investment strategy’s composite returns, net of management fees, for the one, three and five year periods ended June 30, 2011 and from the investment strategy’s inception, compared to their applicable benchmarks:
| Inception Date(1) |
Returns* (%)(2) | ||||||||||||
| Strategy |
1 Year |
3 Years |
5 Years |
Since Inception | |||||||||
| U.S. Value |
7/31/01 | 32.7 | 2.9 | 5.6 | 6.0 | ||||||||
| Russell 1000 |
31.9 | 3.7 | 3.3 | 3.4 | |||||||||
| Russell 1000 Value |
28.9 | 2.3 | 1.2 | 4.0 | |||||||||
| U.S. All Cap Value |
7/31/94 | 36.6 | 2.7 | 5.0 | 11.0 | ||||||||
| Russell 3000 |
32.4 | 4.0 | 3.4 | 8.7 | |||||||||
| Russell 3000 Value |
29.1 | 2.7 | 1.2 | 9.1 | |||||||||
| Global Equity Shareholder Yield |
12/31/05 | 32.8 | 5.7 | 6.2 | 6.9 | ||||||||
| MSCI World (Net) |
30.5 | 0.5 | 2.3 | 3.2 | |||||||||
| Global Absolute Return |
12/31/01 | 24.6 | 3.8 | 4.8 | 9.9 | ||||||||
| MSCI World (Net) |
30.5 | 0.5 | 2.3 | 5.0 | |||||||||
| Global Choice |
9/30/05 | 26.4 | 2.1 | 6.4 | 8.2 | ||||||||
| MSCI World (Net) |
30.5 | 0.5 | 2.3 | 3.6 | |||||||||
| U.S. Choice |
4/30/05 | 35.5 | 6.3 | 5.5 | 6.8 | ||||||||
| Russell 3000 |
32.4 | 4.0 | 3.4 | 5.0 | |||||||||
| U.S. Smid Cap Value |
8/31/06 | 37.7 | 6.8 | N/A | 5.6 | ||||||||
| Russell 2500 |
39.3 | 8.2 | N/A | 5.5 | |||||||||
| Russell 2500 Value |
34.5 | 7.9 | N/A | 3.4 | |||||||||
| International Small Cap |
1/31/05 | 40.2 | 3.0 | 6.0 | 10.6 | ||||||||
| MSCI World ex USA Small Cap (Net) |
37.0 | 3.7 | 3.1 | 6.8 | |||||||||
| U.S. Small Cap Value |
12/31/02 | 39.4 | 6.7 | 5.6 | 9.9 | ||||||||
| Russell 2000 |
37.4 | 7.8 | 4.1 | 10.9 | |||||||||
| Russell 2000 Value |
31.4 | 7.1 | 2.2 | 10.3 | |||||||||
| Global Small Cap |
12/31/02 | 40.4 | 6.9 | 7.4 | 13.1 | ||||||||
| MSCI World Small Cap (Net) |
38.4 | 7.0 | 4.4 | 13.8 | |||||||||
* – Index and investment strategy returns assume dividend reinvestment. Investment strategy returns are net of management fees.
8
Table of Contents
N/A – not applicable.
| (1) | Epoch Investment Partners, Inc. became a registered investment adviser under the Investment Advisers Act of 1940 in June 2004. Performance from April 2001 through May 2004 is for our investment team and accounts while at Steinberg Priest Sloane Capital Management, LLC. For the period July 1994 through March 2001, Chief Investment Officer William W. Priest managed the accounts while at Credit Suisse Asset Management, LLC. and was the only individual responsible for selecting the securities to buy and sell. |
| (2) | Past performance is not indicative of future results. |
Distribution Channels
Our AUM is distributed through multiple channels. Our institutional sales efforts include building strong relationships with institutional consultants and also establishing direct relationships with institutional clients.
We manage certain sub-advisory mandates that provide access to market segments that we would not otherwise serve. For example, we currently serve as sub-advisor to mutual funds offered by major financial institutions in retail channels. These mandates are attractive to us because we have chosen not to build the large team of sales professionals typically required to service those channels. We typically approach the servicing of those relationships in a manner similar to our approach with other large institutional account clients.
We service the high net worth channel both directly and through third-party intermediaries, such as wealth advisers who utilize our investment strategies in investment programs they construct for their clients. We maintain a limited direct sales effort in the high net worth channel, and previously raised the minimum account size for this channel.
The following table provides information regarding the composition of our AUM by distribution channel for the past five years, as well as its respective compound annual growth rate for the one, three, and five years ended June 30, 2011 (in millions):
| As of June 30 | Compound Annual Growth Rate | |||||||||||||||||||||||||||||||
| Distribution Channel |
2011 | 2010 | 2009 | 2008 | 2007 | 1 Year | 3 Years | 5 Years | ||||||||||||||||||||||||
| Sub-advisory |
$ | 8,680 | $ | 6,183 | (1) | $ | 4,332 | $ | 3,080 | $ | 2,876 | 40.4 | % | 41.3 | % | 38.3 | % | |||||||||||||||
| Institutional |
8,140 | 4,915 | (1) | 3,309 | 3,263 | (2) | 2,765 | 65.6 | % | 35.6 | % | 45.6 | % | |||||||||||||||||||
| High Net Worth |
266 | 246 | 250 | 291 | (2) | 360 | 8.1 | % | (3.0 | %) | (1.9 | %) | ||||||||||||||||||||
|
|
|
|
|
|
|
|
|
|
|
|
|
|
|
|
|
|||||||||||||||||
| Total AUM |
$ | 17,086 | $ | 11,344 | $ | 7,891 | $ | 6,634 | $ | 6,001 | 50.6 | % | 37.1 | % | 39.3 | % | ||||||||||||||||
|
|
|
|
|
|
|
|
|
|
|
|
|
|
|
|
|
|||||||||||||||||
| (1) | During the three months ended December 31, 2009, approximately $820 million of AUM previously classified as Institutional was reclassified to Sub-advisory in conjunction with the adoption of the Epoch Funds by New York Life Investment Management. |
| (2) | During the fiscal year ended June 30, 2008, approximately $28 million of AUM in separate accounts within the high net worth distribution channel transferred to the Epoch Global Absolute Return Fund, LLC, and approximately $8 million transferred to the Epoch U.S. All Cap Equity Fund, both of which are included within the Institutional distribution channel above. |
Strategic Relationship
In July 2009, we entered into a strategic relationship with New York Life Investments, whereby the MainStay Group of Funds adopted our family of mutual funds (the “Epoch Funds”). The adoption was completed in November 2009. We are responsible for the day-to-day investment management of the funds through a sub-advisory relationship, while MainStay Investments (“MainStay”), the retail distribution arm of New York Life Investments, is responsible for the distribution and administration of the funds. Each former Epoch Fund is now co-branded as a “MainStay Epoch” Fund.
In addition to an existing sub-advisory relationship with New York Life Investments for certain funds, and the adoption of the Epoch Funds indicated above, EIP and New York Life Investments have entered into an arrangement wherein, among other things, EIP and an affiliate of New York Life Investments have established a distribution and administration relationship with respect to certain separately managed account and unified managed account products, and for a period of three years New York Life Investments agrees to pay certain additional base fees and meet minimum distribution targets. For the fiscal year ended June 30, 2011, New York Life Investment Management, through the MainStay Epoch Funds and other funds sub-advised by EIP, accounted for approximately 19% of consolidated operating revenues. Our services and relationship with New York Life Investment Management is considered important to our ongoing growth strategy.
9
Table of Contents
Client Service
Our client service team plays a critical role in maintaining client relations and ensuring quality client service. A dedicated client relationship manager serves as a single point of contact. Some of the key roles and responsibilities of our client service team are as follows:
| • | regular portfolio updates and on-going monitoring of client satisfaction; |
| • | maintaining a comprehensive website including video and whitepaper perspectives on investment issues; and |
| • | hosting quarterly client webcasts with presentations and insights from our senior investment professionals. |
Business Continuity, Technology and Information Security
Business continuity and information security are high priorities for us. Our business continuity plans have been developed to provide reasonable assurance of business continuity in the event of disruptions of our facilities and to comply with regulatory requirements. The key elements of the plans are crisis management and back-up recovery facilities. In the area of information security, we have developed and implemented policies and technology to protect information assets of our firm and our clients.
Our business and operations rely on the secure processing, storage and transmission of confidential and other information. We have made substantial investments in our technology, and are committed to the continued development and use of technology throughout our firm. Our technology initiatives are designed to enhance client service, improve our trading and execution capabilities, support risk management and increase our overall efficiency, productivity and control.
Competition
The investment advisory and investment management industry is highly competitive. There are few barriers to entry for new firms and consolidation within the industry continues to alter the competitive landscape. We continuously encounter competitors in the marketplace who offer similar investment strategies and services. No single or small group of competitors is dominant in the industry. We compete in the U.S. and international markets with a large number of global and U.S. investment advisors, commercial banks, broker/dealers, insurance companies and other financial institutions. According to Pensions & Investments, a publication covering the money management industry, we ranked 228th worldwide out of 711 asset management firms as of December 31, 2010, based on our AUM level of $14.3 billion at that time. When comparing only the equity portion of AUM of all asset management firms, we ranked 134th out of 514 firms who had all or a portion of their AUM invested in equities.
We compete primarily on the basis of investment philosophy, investment performance, range of investment strategies and features, reputation, and quality of client service. We believe that our investment style, investment strategies, and distribution channels enable us to compete effectively in our industry. We also believe that being an independent asset management firm is a competitive advantage, enabling our business model to avoid conflicts that are often inherent within larger institutions that offer a wide range of services. While we believe we will continue to be successful in growing our AUM, it may be necessary to expend additional resources to compete effectively. Our competitive success will depend upon our ability to develop and market investment strategies, adopt or develop new technologies, and continue to expand our relationships with existing clients and attract new ones. Our ability to compete also depends on our ability to attract and retain key employees while managing our compensation and other costs.
10
Table of Contents
Competitive Strengths
We are a global asset management firm with accomplished and experienced professionals that combines in-house research and insight. Our team of senior managers, including our investment professionals, marketing and sales directors, and client service personnel, averages over 20 years of industry experience. We pride ourselves on being able to offer a high level of attention from senior personnel to our clients. We have many highly skilled professionals who have chosen to be part of a smaller firm that has flexibility and preserves an entrepreneurial environment. All of our employees are shareholders. Accordingly our employees’ interests are aligned with those of our clients and shareholders.
Our overall investment philosophy is focused on achieving superior risk-adjusted returns by investing in companies that generate free cash flow and are undervalued relative to our investment team’s value determinations. We have a track record of achieving superior risk-adjusted investment returns over the longer term across our key investment strategies. As of the fiscal year ended June 30, 2011, all of our investment strategies have outperformed their respective benchmarks for the past five-year period, and nearly all investment strategies have outperformed their respective benchmarks since their inception.
We foster an open, collaborative culture that encourages the sharing of ideas and insights. We believe that sharing ideas and analyses across investment teams allows us to leverage our knowledge of markets and industries worldwide. Additionally, this collaboration enables us to readily implement ideas across our range of investment strategies.
We are a global firm in both investment strategy set and in distribution. We offer a set of investment strategies that allows our clients to access investment opportunities worldwide. Our AUM is distributed through multiple channels, including intermediaries such as investment consultants and through sub-advisory relationships. Our distribution model has allowed us to achieve significant leverage from our focused sales force and client service infrastructure.
Our balance sheet is also a source of competitive strength. We maintain liquidity levels sufficient to weather adverse market conditions and to enable us to take advantage of growth opportunities.
Growth Strategy
As we enter our eighth full year of operations, our growth strategy will remain focused on generating superior risk-adjusted investment returns, providing the highest level of client service and continuing to generate operating margins consistent with seasoned, mature firms within our industry. We will also continue to be focused on the development of distribution channels to enable us to offer our various investment strategies to a broad array of clients. These efforts will continue to include developing relationships with investment advisory consultants, initiating managed accounts with third-party institutions, and maintaining strong advisory and sub-advisory relationships. We are also looking to continue to expand internationally through our established distribution partners.
We routinely evaluate our strategic position and maintain a disciplined acquisition and alliance effort that seeks complementary investment strategies or new investment strategies which could benefit clients. While we continue to actively seek such opportunities, we will only act on opportunities that we believe are accretive to our long-term business strategy.
Regulation
Our business is subject to various federal, state and foreign laws and regulations. As a matter of public policy, regulatory bodies are charged with safeguarding the integrity of the securities and other financial markets and with protecting the interests of participants in those markets, including investment advisory clients and shareholders of investment funds. Under these laws and regulations, agencies that regulate investment advisers have broad administrative powers, including the power to limit, restrict or prohibit an investment adviser from carrying on its business in the event the adviser fails to comply with such laws and regulations. Possible sanctions that may be imposed include civil and criminal liability, the suspension of individual employees, limitations on engaging in certain lines of business for specified periods of time, revocation of investment adviser and other registrations, censures and fines.
11
Table of Contents
Epoch Investment Partners, Inc. (“EIP”), our sole operating subsidiary, is registered as an investment adviser with the SEC. As a registered investment adviser, EIP is subject to the requirements of the Investment Advisers Act, the SEC’s regulations thereunder, and examination by the SEC. Requirements relate to, among other things, fiduciary duties to clients, engaging in transactions with clients, disclosure obligations, record keeping and reporting obligations, and general anti-fraud prohibitions. Moreover, in our capacity as a sub-advisor to mutual funds, we are subject to the Investment Company Act of 1940 (the “Investment Company Act”) and its rules and regulations. The Investment Company Act regulates the relationship between a mutual fund and its investment adviser and imposes additional obligations, including detailed operational requirements for both the funds and their advisers. Additionally, an investment adviser’s agreement with a registered fund may be terminated by the fund on not more than 60 days notice, and is subject to renewal by the fund’s board after an initial two-year term. Under the Investment Advisers Act, our investment management agreements may not be assigned without the client’s consent. Under the Investment Company Act, advisory agreements with registered funds, such as the funds we subadvise, terminate automatically upon assignment. The term “assignment” is broadly defined and includes direct assignment as well as assignments that may be deemed to occur, under certain circumstances, upon the transfer, directly or indirectly, of a controlling interest in us. The SEC is authorized to institute proceedings and impose sanctions for violations of the Investment Advisers Act and the Investment Company Act, ranging from fines and censures to termination of an investment adviser’s registration. The failure of EIP, or the registered funds for which EIP serves as sub-advisor, to comply with the requirements of the SEC could have a material adverse effect on us.
To the extent that EIP is a “fiduciary” under the Employment Retirement Act of 1974 (“ERISA”) with respect to benefit plan clients, it is subject to ERISA, and to regulations promulgated thereunder. ERISA and applicable provisions of the Internal Revenue Code impose certain duties on persons who are fiduciaries under ERISA, prohibit certain transactions involving ERISA plan clients, and provide monetary penalties for violations of these prohibitions. Failure to comply with these requirements could have a material adverse effect on our business.
Our trading activities for client accounts are regulated under the Securities Exchange Act of 1934, as amended (“Exchange Act”), as well as the rules of various U.S. and non-U.S. securities exchanges and self-regulatory organizations, including laws governing trading on inside information, market manipulation and a broad number of trading requirements (e.g., volume limitations, reporting obligations) and market regulation policies in the United States and abroad.
We are also subject to investment advisory rules and regulations internationally. EIP is registered with the Ontario Securities Commission and several other provinces in Canada, and also operates in various other foreign jurisdictions without registration in reliance upon applicable exemptions under the laws of those jurisdictions.
The preceding descriptions of the regulatory and statutory provisions applicable to us are not complete and are qualified in their entirety by reference to their respective statutory or regulatory provisions.
Regulatory Reform
On July 21, 2010, the Dodd-Frank Wall Street Reform and Consumer Protection Act (the “DFA”) was signed into law in the United States. The DFA is expansive in scope and requires the adoption of extensive regulations and numerous regulatory decisions in order to be implemented. The ultimate adoption of these regulations and decisions will determine the impact of the DFA on us. It is difficult to predict the ultimate effects that the DFA, or subsequent implementing regulations and decisions, will have upon our business and results of operations. Other jurisdictions outside the United States in which we operate are also in the process of devising or considering more pervasive regulation of many elements of the financial services industry, which could have an impact on us. The DFA and its regulations, other new laws or regulations, changes in rules promulgated by either the SEC or other international, federal and state regulatory authorities or self-regulatory bodies, or changes in the interpretation or enforcement of existing laws and rules could materially and adversely impact the scope or profitability or our business.
Geographic Information
We have clients located worldwide. One of our key priorities is to continue to expand our global distribution network and partnerships. We are building our distribution network through both direct sales to clients and sales through intermediaries, such as investment consultants, private banks, and third party distributors.
12
Table of Contents
For the fiscal years ended June 30, 2011, 2010, and 2009, approximately 32%, 29%, and 22%, respectively, of our total operating revenues were generated from clients domiciled outside the United States. Information relating to revenues by geographic region is contained in Note 19 in the Notes to our Consolidated Financial Statements in Item 8 of Part II of this Form 10-K, which is incorporated herein by reference.
Employees
We believe that a major strength and principal reason for our success is the quality and dedication of our employees and the shared sense of being a part of a team. We strive to maintain a work environment that fosters professionalism, excellence, diversity, cooperation among our employees, and high standards of business ethics.
As of June 30, 2011, we employed 57 full-time employees, including 22 investment management, research and trading professionals, 15 marketing and client service professionals and 20 operations and business management professionals. None of our employees are subject to any collective bargaining agreements. Our portfolio managers and analysts average over 20 years of experience. Since our founding seven years ago, we have had a very low turnover rate among our portfolio managers and analysts. The majority of our portfolio managers have devoted most of their professional careers to the analysis, selection and surveillance of the types of securities held in the funds or accounts they manage.
13
Table of Contents
| Item 1A. | Risk Factors. |
As an investment management firm, risk is an inherent part of our business. Capital markets, by their nature, are prone to uncertainty and expose participants to a variety of risks. While we devote significant resources across all of our operations to identify, measure, monitor, manage and analyze market and operating risk, our business, prospects, financial condition, results of operations, cash flow, or share price could be materially adversely affected by any of the following risks. Additionally, other risks and uncertainties that we do not presently consider to be material or of which we are not presently aware may become important factors that affect us in the future.
Risks Related to Our Business
Difficult market conditions can adversely affect our business in many ways, including reducing the value of our AUM and/or causing clients to withdraw funds, each of which could materially reduce our revenues and adversely affect our results of operations and our financial condition.
We derive all of our revenues from investment management services. The investment management fees paid to us are typically based on the market value of AUM. Accordingly, a general or prolonged decline in securities markets, and equity markets in particular, may cause our revenues and net income to decline due to (i) the value of our AUM decreasing, and/or (ii) clients withdrawing funds in favor of investments they perceive as offering greater opportunity or lower risk. The securities markets have recently been and may continue to be highly volatile and securities prices may decrease for many reasons beyond our control, including a general economic downturn, deterioration in the credit of sovereign nations, political uncertainty or acts of terrorism. In addition, any such decline in the equity markets, failure of these markets to sustain their prior levels of growth, or continued short-term volatility in these markets could result in clients withdrawing funds from our investment strategies in full or in part, or decreased demand for our investment services, which would adversely affect us. Our operating margin may also be adversely affected if we are unable to reduce fixed costs and other expenses within a time frame sufficient to match any decrease in revenue relating to changes in our AUM.
Our investment style in the asset management business may underperform other investment approaches, which may result in significant client or asset departures or a reduction in AUM.
Even when securities prices are rising, performance can be affected by investment style. Many of the equity investment strategies in our asset management business share a common investment orientation towards fundamental security selection. Our overall investment philosophy is focused on achieving a superior risk-adjusted return by investing in companies that generate free cash flow. We believe this style tends to outperform the market in some market environments and underperform it in others. In particular, a prolonged “growth” environment (i.e., a prolonged period whereby growth stocks outperform value stocks) may cause our investment strategy to be out of favor with some clients, consultants or third-party intermediaries.
If our investment strategies perform poorly, our results of operations, financial condition and our prospects for future growth may be materially adversely affected.
The relative performance of our investment strategies is critical in retaining existing clients as well as attracting new clients. If our investment strategies perform poorly, our earnings could be reduced because:
| • | existing clients may withdraw funds from our asset management business in favor of better performing investment strategies, which could cause the revenues that we generate from our investment advisory fees to decline; |
| • | third-party financial intermediaries, advisers or consultants may rate our investment strategies poorly, which may result in client withdrawals and reduced asset flows from these third parties or their clients; |
| • | the investment funds which we sub-advise may decide not to renew or decide to terminate the agreements pursuant to which we sub-advise them and we may not be able to replace these relationships; or |
| • | firms with which we have strategic alliances may terminate such relationships with us, and future strategic alliances may be unavailable. |
14
Table of Contents
Because our clients can remove the assets we manage on short notice, we may experience unexpected declines in revenue and profitability.
Our investment advisory and sub-advisory agreements can generally be terminated upon very short notice. Institutional and individual clients, and firms with which we have strategic alliances, can terminate their relationships with us, reduce the aggregate amount of AUM or shift their funds to other types of accounts with different rate structures for a number of reasons, including investment performance, changes in prevailing interest rates, changes in investment preferences, changes in their management or control, loss of our key investment management or other personnel, and financial market performance. Further, the ability to terminate relationships may allow clients to renegotiate for lower fees paid for asset management services. The decrease in revenues that results from any such significant terminations, withdrawals or reductions in fees could have a material adverse effect on our business.
In addition, in the U.S., as required by the Investment Company Act, each of our investment advisory agreements with the mutual funds we advise or sub-advise automatically terminates upon its “assignment,” or transfer of our responsibility for fund management. Each of our other investment advisory agreements subject to the provisions of the Investment Advisers Act provides that the agreement may not be “assigned” without the consent of the client. A sale of a sufficiently large block of shares of our voting securities or other transactions could be deemed an “assignment” in certain circumstances. An assignment, actual or constructive, will trigger these termination provisions and could adversely affect our ability to continue managing these client accounts. To the extent that a technical “assignment” of investment advisory agreements arises, we will take the necessary steps to provide clients an opportunity to consent to the continuation of their advisory agreements. Such new agreements may need approval by the stockholders of the respective funds. In the event that any of these clients do not consent to a renewal of their agreement, our revenue and profitability may be materially adversely impacted.
Our business and financial condition may be materially adversely impacted by the highly variable nature of our revenues, results of operations and cash flows. Additionally, because of market fluctuations, there may not be a consistent pattern in our financial results from period to period.
Because our revenues are based on the value of our AUM, fluctuations in the equity markets and our AUM affect our revenues. A reduction in the equity markets generally has a negative impact on the level of our AUM and consequently our revenues. Additionally, asset flows, whether inflows or outflows, can be highly variable from month-to-month and quarter-to-quarter. Accordingly, our revenues, results of operations and cash flows are all highly variable. We may also experience fluctuations in our results from quarter to quarter due to a number of other factors, including changes in our operating expenses and unexpected business developments and initiatives. Such variability and unpredictability may lead to volatility or declines in the price of our common stock and cause our results for a particular period not to be indicative of our performance in a future period or particularly meaningful as a basis of comparison against results for a prior period.
Access to clients through intermediaries is important to our asset management business, and reductions in referrals from such intermediaries or poor reviews of our investment strategies or our organization by such intermediaries could materially reduce our revenue and impair our ability to attract new clients.
Our ability to grow our business relies, in large part, on receiving mandates from the client base of investment consultants, insurance companies, defined contribution plan administrators, international and regional securities firms, mutual fund providers, third party distributors and other intermediaries. These intermediaries review and evaluate our investment strategies and our organization. Poor reviews or evaluations of either the particular investment strategies or of our organization may result in client withdrawals or an inability to attract new assets through such intermediaries. The inability to have this access could materially adversely affect our business.
We depend on the continued services of our key personnel, and the loss of key personnel could have a material adverse effect on our business.
We depend upon the skills, expertise and continued contributions of our key personnel and our management team. The loss of any such personnel, without adequate replacement, could have a material adverse effect on our business, results of operations or financial condition. Loss of key personnel may occur due to perceived opportunity for promotion, increased compensation, work environment or other individual reasons, some of which may be beyond our control.
15
Table of Contents
Except for our CEO, there are no employment agreements with any other key employees. The loss of services of one or more key employees, or failure to attract, retain and motivate qualified personnel could limit our ability to successfully execute our business strategy and may prevent us from sustaining the performance of our investment strategies or adversely affect our ability to retain existing clients and attract new clients. We do not carry any “key man” insurance that would provide us with proceeds in the event of the death or disability of any key members of senior management, our investment team, or senior marketing personnel.
The market for experienced asset management professionals is extremely competitive and is increasingly characterized by the movement of employees among different firms. Compensation levels in the investment management industry are highly competitive and can fluctuate significantly from year to year. Due to the competitive market for asset management professionals and the success achieved by some of our key personnel, the costs to retain key personnel are significant and will likely increase over time. We also anticipate that it will be necessary for us to hire additional key personnel as we further develop our business. Consequently, in our efforts to attract and retain highly skilled individuals, our compensation expense could increase at a level that could adversely affect our profitability.
Additionally, we utilize share-based awards as part of our compensation program and as a means for recruiting and retaining highly skilled talent. A decline in our share price could lessen the effectiveness of retaining employees through share-based awards. There can be no assurance that we will continue to successfully attract and retain key personnel.
If our techniques for managing risk are ineffective, we may be exposed to material unanticipated losses.
To manage the significant risks inherent in our business, we must maintain effective policies, procedures and systems that enable us to identify, assess and manage the full spectrum of our risks including market, fiduciary, operational, legal, regulatory and reputational risks. While we believe that our approach to risk management helps us to manage the risks in our business, our risk management methods may prove to be ineffective due to their design or implementation, or as a result of the lack of adequate, accurate or timely information or otherwise. If our risk management efforts are ineffective, we could suffer losses that could have a material adverse effect on our financial condition or results of operations. Additionally, we could be subject to litigation and sanctions or fines from regulators.
Our techniques for managing risks in client portfolios may not fully mitigate the risk exposure in all economic or market environments, or against all types of risk, including risks that we might fail to identify or anticipate. Any failures in our risk management techniques and strategies to accurately quantify such risk exposure could limit our ability to manage risks in those portfolios or to achieve positive, risk-adjusted returns. In addition, any risk management failures could cause portfolio losses to be significantly greater than historical measures predict. If approaches to managing those risks prove insufficient, it may expose us to material unanticipated losses in the value of client portfolios, a reduction in our revenues, and a material adverse impact on our business.
Our reputation is critical to our success.
As a financial services firm, we depend on our reputation of integrity and high-caliber professional services. Any damage to our reputation could impede our ability to attract and retain clients and key personnel, and lead to a reduction in the amount of our AUM.
In recent years, there have been a number of highly publicized cases involving fraud, conflicts of interest or other misconduct by individuals in the financial services industry, and there is the risk that our employees could engage in misconduct that adversely affects our business. For example, if an employee were to engage – or be accused of engaging – in illegal or suspicious activities (such as improper trading, disclosure of confidential information or breach of fiduciary duties), we could be subject to regulatory sanctions and serious reputational or financial harm. We are subject to a number of obligations and standards arising from our business and our authority over the assets we manage as well as our status as a public company listed on the Nasdaq Global Select Market. Accordingly, we have adopted and implemented a code of ethics and other related policies and procedures to address such obligations and standards. However, it is not always possible to deter employee misconduct, and the precautions we take to detect and prevent this activity may not be effective in all cases. Misconduct by our employees, or even unsubstantiated allegations, could result in a material adverse effect on our reputation and our business.
16
Table of Contents
Failure to comply with client requirements and/or guidelines could result in losses, damage awards against us and loss of revenues due to client terminations.
The investment management agreements under which we provide investment advisory services specify certain guidelines or requirements that we are required to observe in the provision of our services. While we maintain various compliance procedures and controls to monitor such guidelines and prevent related errors, a failure to comply with these guidelines or requirements could result in losses to a client or investors in a fund which, depending on the circumstances, could result in our making clients or fund investors whole for such losses. If we believed that the circumstances did not justify a reimbursement, or clients and investors believed the reimbursement offered was insufficient, they could seek to recover damages from us or could withdraw assets from our management or terminate the investment management agreement. Any of these events could harm our reputation and adversely affect our results of operations.
Fluctuations in foreign currency exchange rates could lower our net income or negatively impact the portfolios of our clients and may affect the levels of our AUM.
Certain client portfolios include securities denominated in foreign currencies. Accordingly, foreign currency fluctuations may affect the levels of our AUM. For securities denominated in currencies other than U.S. dollars, an increase in the value of the U.S. dollar relative to those non-U.S. currencies may result in a decrease in the dollar value of our AUM, which, in turn, would result in lower U.S. dollar denominated revenues.
Additionally, a limited portion of our clients are billed for management and performance fees in currencies other than U.S. dollars, and the amounts due to us are subject to foreign currency fluctuation. If the currency in which our fees are paid depreciates against the U.S. dollar, our net income could decline.
While these risks could be limited by foreign currency hedging, some risks cannot be hedged and there is no guarantee that our hedging activity would be successful. Additionally, hedging would result in additional costs to us.
The significant growth we have experienced in recent years may not be indicative of future growth.
Our AUM increased from approximately $7.9 billion at June 30, 2009 to approximately $17.1 billion at June 30, 2011, and it represents a significant rate of growth that may be difficult to sustain. The growth of our business depends on, among other things, our success in producing attractive returns in our investment strategies, our ability to expand our distribution capabilities, the overall performance of the equity markets, and our ability to deal with changing market conditions.
Our continued growth places significant demands on our legal, compliance, accounting, risk management, administrative and operational resources.
Rapid growth in our AUM imposes substantial demands on our legal, compliance, accounting, risk management, administrative and operational infrastructures. We must maintain adequate infrastructure, including technological capacity, backup facilities and sufficient space for expanding staff levels. Furthermore, our future growth will depend on, among other things, our ability to maintain highly reliable operating platforms, management systems and financial reporting and compliance infrastructures that are also sufficiently flexible to promptly and appropriately address our business needs, applicable legal and regulatory requirements and relevant market and operating conditions, all of which change rapidly. Addressing these matters may require us to incur significant additional expenses and to commit additional senior management and operational resources, even during periods when we are experiencing declines in AUM. There can be no assurance that we will be able to manage our operations efficiently without incurring substantial additional expense or that we will be able to effectively grow our business and AUM, and any failure to do so could materially adversely affect our business.
17
Table of Contents
We derive more than 10% of our operating revenue from one client.
Pursuant to a strategic relationship with New York Life Investment Management, EIP is the sub-advisor to several mutual funds within New York Life Investment Management’s MainStay group of funds. As such, New York Life Investment Management accounted for approximately 19% of revenues for FY 2011. There can be no assurance that our relationship with New York Life will remain in place. A loss of this client would significantly impact our operating revenues and net income, and we may not be able to establish relationships with other clients in order to replace the lost revenues and net income.
Changes in fee levels or asset mix could reduce revenues and margins.
Our profit margins and net income are dependent, in significant part, on our ability to maintain current fee levels for the investment strategies that we offer. In recent years, however, in response to market pressures, there has been a trend towards lower fees in the asset management industry and no assurances can be given that we will be able to maintain our current fee structure. Although our investment management fees vary from investment strategy to investment strategy, we compete primarily on the basis of our investment performance and not on the level of our investment management fees relative to those of our competitors. In order to maintain our fee structure in a competitive environment, we must be able to continue to provide clients with investment returns and client service that incentivize our clients to pay our fees. We cannot be assured that we will succeed in providing investment returns and service that will allow us to maintain our current fee structure. Additionally, a shift in the mix in our AUM from higher revenue-generating AUM to lower revenue-generating AUM may result in a decrease in revenues even if our aggregate level of AUM remains unchanged or increases.
Our future results are dependent upon maintaining an appropriate level of expenses, which is subject to fluctuation.
Our expenses are subject to fluctuation and may increase for various reasons, including: variations in compensation due to changes in employee staffing levels, mix, or incentive compensation, expenses incurred to support the distribution of our investment strategies, and changes in expenses and capital costs incurred to maintain and enhance our administrative and operating services infrastructure.
We may not be able to adjust our expenses quickly enough to match a significant deterioration in revenues.
If we are unable to implement appropriate expense reductions in a timely manner in response to declines in our revenues, or if we are otherwise unable to adapt to rapid changes in the global marketplace, our profitability, results of operations and financial condition may be adversely affected.
We may enter into more performance-based fee arrangements with our clients in the future, which could cause greater fluctuations in our revenues.
A small portion of our investment advisory revenues is currently derived from performance fees. We earn performance fees under certain client agreements if the investment performance in the portfolio meets or exceeds a specified benchmark. In these instances, we charge a base advisory fee and are eligible to earn an additional performance-based fee or incentive allocation that is calculated as either a percentage of absolute investment results or a percentage of investment results in excess of a stated benchmark over a specified period of time. In addition, some performance-based fee arrangements include a high-watermark provision, which generally provide that if a client account underperforms relative to its performance target (whether absolute or relative to a specified benchmark), it must gain back such underperformance before we can collect future performance-based fees. Therefore, if we fail to achieve the performance target for a particular period, we will not earn a performance fee for that period and, for accounts with a high-watermark provision, our ability to earn future performance fees may be impaired. We earned $1.8 million, $0.8 million, and $0.6 million in performance fees during fiscal years 2011, 2010, and 2009, respectively. Performance fees may become more common in our industry. An increase in performance fees, or in performance-based fee arrangements with clients, could create greater fluctuations in our revenues.
18
Table of Contents
Expansion into international markets may increase operational, regulatory and other risks.
We offer investment management services in many different regulatory jurisdictions globally and intend to continue to expand our operations. As we increase our international business activities and expand our investment strategy offerings, we will face increased operational, regulatory, compliance, reputational and other risks. Additionally, we will likely incur additional costs and expenses. A failure of our compliance and internal control systems to properly mitigate such risks, or of our operating infrastructure to support such international expansion, could result in a loss of clients or inability to attract new clients, regulatory fines or sanctions, damage to our reputation, or other material adverse impacts on our business.
We are subject to numerous operational risks which may disrupt our business, result in regulatory action against us, or limit our growth.
We face numerous operational risks related to our business on a day-to-day basis. Among other things, we must be able to consistently and reliably obtain securities pricing information, process investment transactions and provide reports and other customer service to our clients. Any failure to keep current and accurate books and records can render us liable to disciplinary action by governmental and self-regulatory authorities, as well as to claims by our clients. If any of our financial, portfolio accounting or other data processing systems, or the systems of third parties on whom we rely for information or communication, do not operate properly or are disabled or if there are other shortcomings or failures in our internal processes, people or systems, or those of third parties on whom we rely, we could suffer a financial loss, a disruption of our businesses, liability to clients, regulatory problems or damage to our reputation. These systems may fail to operate properly or become disabled as a result of events that are wholly or partially beyond our control, including a disruption of electrical or communications services.
Our operations rely on the secure processing, storage and transmission of confidential and other information in our computer systems and networks. Although we take protective measures and endeavors to modify them as circumstances warrant, our computer systems, software and networks may be vulnerable to unauthorized access, computer viruses or other malicious code, and other events that have a security impact. If one or more of such events occur, it potentially could jeopardize our or our clients’ or counterparties’ confidential and other information processed and stored in, and transmitted through, our computer systems and networks, or otherwise cause interruptions or malfunctions in our clients’, our counterparties’ or third parties’ operations. We may be required to spend significant additional resources to modify our protective measures or to investigate and remediate vulnerabilities or other exposures, and we may be subject to litigation and financial losses that are either not insured against fully or not fully covered through any insurance that we maintain.
Lastly, we depend on our headquarters, which is located in New York City, for the continued operation of our business. A disaster or a disruption in the infrastructure that supports our headquarters, or an event disrupting the ability of our employees to perform their job functions there, including terrorist attacks or a disruption involving electrical communications, transportation or other services used by us or third parties with whom we conduct business, directly affecting our headquarters, may have a material adverse impact on our ability to continue to operate our business without interruption. Although we have disaster recovery programs in place, there can be no assurance that these will be sufficient to mitigate the harm that may result from such a disaster or disruption. In addition, insurance and other safeguards might only partially reimburse us for our losses.
Insurance coverage may not protect us from all of the liabilities that could arise from the risks inherent in our business.
We maintain insurance coverage focused on reducing risks related to our operations, in amounts that we consider appropriate. There can be no assurance, however, that a claim or claims will be completely covered by insurance or, if covered, will not exceed the limits of our existing insurance coverage. If a loss occurs that is partially or completely uninsured, we could be exposed to substantial liability.
Insurance costs are impacted by market conditions and may increase significantly over relatively short periods. Renewals of insurance policies may result in additional costs through higher premiums or the assumption of higher deductibles or co-insurance liability.
19
Table of Contents
Various factors may prevent the declaration and payment of cash dividends.
To date, we have paid a quarterly cash dividend each quarter since the quarter ended December 31, 2007 and have paid three special dividends. However, the payment of dividends in the future is subject to the discretion of our Board of Directors, and various events or factors may prevent us from paying dividends. Our Board of Directors will take into account factors such as general economic and business conditions, our financial condition and results of operations, our strategic plans and prospects, working capital requirements and anticipated cash needs, and any legal, contractual or regulatory restrictions.
We may pursue strategic transactions that could create risks, present unforeseen integration obstacles or costs, and could dilute the stock ownership of our stockholders.
As part of our long-term business strategy, we routinely assess our strategic position, and from time to time address potential transactions, including acquisitions, joint ventures or other transactions aimed at expanding the geography and scope of our operations, and further enhancing our competitive position. We expect to explore partnership opportunities that we believe to be accretive.
Any such strategic transactions involve a number of risks and present financial, managerial and operational challenges, including potential disruption of our ongoing business and distraction of management, difficulty with integrating personnel and operating infrastructure, and increasing the scope, geographic diversity and complexity of our operations. Our clients may react unfavorably to any such strategic transaction, we may not realize anticipated benefits, and may be exposed to additional liabilities of any acquired business or joint venture, any of which could materially adversely affect our revenue and results of operations. In addition, strategic transactions may involve the issuance of additional shares of our common stock, which would dilute our existing ownership.
The market price and trading volume of our common stock may be volatile, which could result in rapid and substantial losses for our stockholders.
The market price of our common stock may be highly volatile and could be subject to wide fluctuations. In addition, the trading volume in our common stock may fluctuate and cause significant price variations to occur, which may limit or prevent investors from readily selling their common stock and may otherwise negatively affect the liquidity of our common stock. Some of the factors that could negatively affect the price of our common stock or result in fluctuations in the price or trading volume of our common stock include:
| • | withdrawals by clients of their assets; |
| • | poor investment performance; |
| • | unanticipated variations in our quarterly results of operations; |
| • | a reduction or termination of the regular dividend; |
| • | failure to meet analysts’ earnings estimates; |
| • | publication of negative research or press reports about us, or our investments or the investment management industry; |
| • | departures of key investment or management personnel; |
| • | changes or proposed changes in laws or regulations or differing interpretations thereof affecting our business or enforcement of these laws and regulations, or announcements relating to these matters; |
| • | fluctuations in the performance or share price of other investment management companies; |
| • | adverse publicity about the asset management industry generally or scandals specifically; |
| • | sales of a large number of shares of our common stock or the perception that such sales could occur; and |
| • | difficult global market and economic conditions. |
Our officers and directors own a substantial amount of our common stock and therefore exercise significant control over our corporate governance and affairs.
Our executive officers and directors control approximately 35% of our outstanding common stock (including exercisable stock options held by them). These shareholders, if they act together, may be able to exercise substantial influence over the outcome of corporate actions requiring approval of our shareholders, including the election of directors and approval of significant corporate transactions. This concentration of ownership may also have the effect of delaying or preventing a change in control and might affect the market price of our common stock.
20
Table of Contents
Our ability to issue “blank check” preferred stock without approval by the holders of our common stock could adversely affect the rights of common shareholders and could be used as an anti-takeover device.
Our charter allows our Board of Directors to issue preferred stock and to determine its rights, powers, and preferences without shareholder approval (“blank check preferred stock”). Future preferred stock issued under the Board’s authority could contain preferences over our common stock as to dividends, distributions, and voting power. Holders of preferred stock could, for example, be given the right to separately elect some number of our directors in all or specified events or an independent veto right over certain transactions, and redemption rights and liquidation preferences assigned to preferred shareholders could affect the residual value of common stock. We could also use the preferred stock to deter or delay a change in control that may be opposed by management.
Failure to maintain effective internal control over financial reporting in accordance with Section 404 of the Sarbanes-Oxley Act could have a material adverse effect on our business and the price of our common stock.
Section 404 of the Sarbanes-Oxley Act and the related rules require our management to conduct an annual assessment of the effectiveness of our internal control over financial reporting, and require a report by our independent registered public accounting firm attesting to and reporting on the effectiveness of our internal control over financial reporting, as well as an independent audit of our financial statements.
If we fail for any reason to comply with the requirements of Section 404, our independent registered public accounting firm may not be able to opine on the effectiveness of our internal control over financial reporting. Matters negatively affecting our internal controls may cause us to be unable to report our financial information on a timely basis, or may cause us to restate previously issued financial statements, and thereby subject us to adverse regulatory consequences, including sanctions by the SEC or violations of applicable stock exchange listing rules. There could also be a decline in the price of our common stock due to a loss of investor confidence in us and the reliability of our financial statements.
Certain changes in accounting and/or financial reporting standards issued by the Financial Accounting Standards Board (“FASB”), the SEC or other standard-setting bodies could have a material impact on our financial position or results of operations.
We are subject to the application of accounting principles generally accepted in the United States (“GAAP”), which are periodically revised and/or expanded. As such, we are required to adopt new or revised accounting and/or financial reporting standards issued by recognized accounting standard setters or regulators, such as FASB and the SEC. It is possible that future requirements, including the recently proposed implementation of International Financial Reporting Standards (“IFRS”), could change our current application of GAAP, resulting in a material impact on our financial position or results of operations.
Risks Related to Our Industry
We face strong competition from numerous and sometimes larger companies, many of whom have greater resources and the ability to offer clients a wider range of investment strategies and services than we can offer.
We compete with numerous investment management firms, mutual fund companies, commercial banks, investment banks, hedge funds, insurance companies and other financial institutions. Some of these institutions have greater capital, marketing and other resources, and offer more strategies and services than we do. Our competitors seek to expand their market share in many of the strategies and services we offer. If these competitors are successful, we may lose clients or fail to attract new clients and our revenues and profitability could be adversely affected. In addition, there are relatively few barriers to entry by new investment management firms, and the successful efforts of new entrants into our various distribution channels globally have also resulted in increased competition.
In recent years there have been several instances of industry consolidation, both in the area of distributors and manufacturers of investment strategies. Further consolidation may occur in these areas in the future. The increasing size and market influence of certain competitors may have a negative impact on our prospects for growth and our profit margins in the future.
21
Table of Contents
Extensive regulation of our business limits our activities and results in ongoing exposure to the potential for significant penalties, including fines or limitations on our ability to conduct our business.
The financial services industry is subject to extensive regulation. We are subject to regulation by governmental and self-regulatory organizations in the jurisdictions in which we operate around the world. Many of these regulators, including U.S. and non-U.S. government agencies and self-regulatory organizations, as well as state securities commissions in the U.S., are empowered to conduct administrative proceedings that can result in censure, fine, the issuance of cease-and-desist orders or the suspension or expulsion of an investment adviser. The requirements imposed by our regulators are designed to ensure the integrity of the financial markets and to protect clients and other third parties who deal with us and are not designed to protect our stockholders. Consequently, these regulations often limit our activities.
We face the risk of significant intervention by regulatory authorities, including extended investigation and surveillance activity, adoption of costly or restrictive new regulations and judicial or administrative proceedings that may result in substantial penalties. In addition, the regulatory environment in which we operate is subject to modifications and further regulation. New laws, regulations, or changes in the enforcement of existing laws or regulations applicable to our Company and our clients may also adversely affect our business, and our ability to function in this environment will depend on our ability to constantly monitor and react to these changes. In addition, the regulatory environment in which our clients operate may impact our business. For example, changes in antitrust laws or the enforcement of antitrust laws could affect the level of mergers and acquisitions activity and changes in state laws may limit investment activities of state pension plans.
Instances of criminal activity and fraud by participants in the asset management industry, disclosures of trading and other abuses by participants in the financial services industry, and the recent massive governmental intervention and investment in the financial markets and financial firms have lead the U.S. government and regulators to increase the rules and regulations governing, and oversight of, the U.S. financial system. The cumulative effect of these actions may result in increased expenses, or lower management fees, and therefore, adversely affect the revenues or profitability of our business.
In addition, financial services firms are subject to numerous conflicts of interests or perceived conflicts, and we have adopted various policies, controls and procedures to address or limit actual or perceived conflicts and regularly seek to review and update our policies, controls and procedures. These policies and procedures may result in increased costs, additional operational personnel, and increased regulatory risk. Failure to adhere to our policies and procedures could result in regulatory sanctions or client litigation.
Specific regulatory changes may also have a direct impact on the revenue of our asset management business. In addition to regulatory scrutiny and potential fines and sanctions, regulators continue to examine different aspects of the asset management industry. These regulatory changes and other proposed or potential changes may result in a reduction of revenue or an increase in expenses associated with asset management.
The financial services industry faces substantial litigation risks which could materially adversely affect our business, financial condition or results of operations or cause significant harm to our reputation.
We depend to a large extent on our network of relationships and on our reputation in order to attract and retain clients. If a client is not satisfied with our services, such dissatisfaction may be more damaging in our business than in other types of businesses. In our business, we make investment decisions on behalf of our clients which could result in substantial losses to them. If our clients suffer significant losses, or are otherwise dissatisfied with our services, we could be subject to the risk of legal liabilities or actions alleging negligent misconduct, breach of fiduciary duty or breach of contract. Our agreements typically include broad indemnities from our clients and provisions designed to limit our exposure to legal claims relating to our services, but these provisions may not protect us or may not be adhered to in all cases. Separately, we may also be subject to claims arising from disputes with employees for alleged discrimination or harassment, among other things. The above risks often may be difficult to assess or quantify, and their existence and magnitude often remain unknown for substantial periods of time. As a result, we may incur significant legal expenses in defending against litigation. Substantial legal liability or significant regulatory action against us could materially adversely affect our business, financial condition or results of operations or cause significant reputational harm to us.
| Item 1B. | Unresolved SEC Staff Comments. |
None.
22
Table of Contents
| Item 2. | Properties. |
Our headquarters and operations are located at 640 Fifth Avenue, New York, New York. Business is conducted at a location with approximately 20,000 square feet under long-term leases that expire in September 2015. We believe our present office space is adequate for our existing operating needs. However, we foresee the need for additional office space to support our growth plans. Therefore, we are exploring opportunities for additional office space and we anticipate entering into a contractual obligation within the next twelve months.
For a discussion of occupancy expense, see “Management’s Discussion and Analysis of Financial Condition and Results of Operations” in Item 7. Additional information about our occupancy costs, including commitments under non-cancellable leases, is provided under the caption Lease Commitments in Note 10 to the consolidated financial statements included under Item 8 of Part II of this Form 10-K.
| Item 3. | Legal Proceedings. |
From time to time, we may become parties to claims, legal actions and complaints arising in the ordinary course of business. We are not aware of any claims which would have a material adverse effect on our consolidated financial position, results of operations, or cash flows.
| Item 4. | (Removed and Reserved). |
23
Table of Contents
PART II
| Item 5. | Market for Registrant’s Common Equity, Related Stockholder Matters and Issuer Purchases of Equity Securities. |
Our common stock is listed on the NASDAQ Global Select Market under the ticker symbol “EPHC.”
The following table sets forth for the periods indicated the high, low, and quarter-end closing reported sale prices based on data reported by Bloomberg, as well as dividends declared per share for our Common Stock:
| Common Stock Prices | Dividends Declared | |||||||||||||||||||
| High ($) | Low ($) | Closing Price ($) |
||||||||||||||||||
| Regular($) | Special($) | |||||||||||||||||||
| FY 2011 - Quarter Ended |
||||||||||||||||||||
| June 30 |
$ | 17.85 | $ | 14.71 | $ | 17.85 | $ | 0.06 | ||||||||||||
| March 31 |
16.43 | 14.34 | 15.78 | 0.06 | ||||||||||||||||
| December 31 |
17.85 | 12.51 | 15.53 | 0.05 | $ | 0.75 | ||||||||||||||
| September 30 |
12.88 | 9.43 | 12.88 | 0.05 | ||||||||||||||||
|
|
|
|
|
|
|
|
|
|
|
|||||||||||
| Year ended June 30, 2011 |
$ | 17.85 | $ | 9.43 | $ | 17.85 | $ | 0.22 | $ | 0.75 | ||||||||||
|
|
|
|
|
|
|
|
|
|
|
|||||||||||
| FY 2010 - Quarter Ended |
||||||||||||||||||||
| June 30 |
$ | 13.28 | $ | 10.71 | $ | 12.27 | $ | 0.05 | ||||||||||||
| March 31 |
11.50 | 8.96 | 11.29 | 0.05 | ||||||||||||||||
| December 31 |
10.86 | 8.87 | 10.45 | 0.03 | $ | 0.30 | ||||||||||||||
| September 30 |
9.85 | 7.82 | 8.75 | 0.03 | ||||||||||||||||
|
|
|
|
|
|
|
|
|
|
|
|||||||||||
| Year ended June 30, 2010 |
$ | 13.28 | $ | 7.82 | $ | 12.27 | $ | 0.16 | $ | 0.30 | ||||||||||
|
|
|
|
|
|
|
|
|
|
|
|||||||||||
The closing price for our common stock as reported on the NASDAQ Global Select Market on August 31, 2011 was $14.88.
As of August 31, 2011 there were approximately 1,049 holders of record of our common stock. Since many of the shares are held in street nominee name, we believe the number of beneficial owners of our common stock is substantially higher.
Dividend Policy
Regular Cash Dividends
We have been paying quarterly dividends since November 2007. Quarterly dividends are generally paid in February, May, August and November of each fiscal year. We currently expect to continue paying regular quarterly dividends. However, the actual declaration and payment of any future cash dividends is subject to determination by our Board of Directors each quarter after their review of our financial performance, as well as general business conditions, capital requirements, and any legal or regulatory restrictions. We may change our dividend policy at any time.
Effective with the quarter ended March 31, 2010, we increased the quarterly dividend rate from $0.03 to $0.05 per share. Effective with the quarter ended March 31, 2011, we increased the quarterly dividend rate from $0.05 to $0.06 per share.
Special Cash Dividends
We have paid three special dividends. As with regular dividends, the declaration of special dividends is subject to the determination by our Board of Directors.
24
Table of Contents
Rule 10b5-1 Plans
Our executive officers may purchase or sell shares of our common stock in the open market from time to time. We encourage these officers to make these transactions through plans that comply with Exchange Act Rule 10b5-1(c). We do not receive any proceeds related to these transactions.
Equity Compensation Plan Information
As of June 30, 2011, there were 4,293,585 shares issued under the Company’s Amended and Restated 2004 Omnibus Long-Term Incentive Compensation Plan (the “2004 Plan”). There were 1,206,415 shares available for issuance comprising the following:
| Plan Category |
Number of securities to be issued upon exercise of outstanding options (A) |
Weighted-average exercise price of outstanding options (B) |
Number of securities remaining available for future issuance under equity compensation plan (excluding securities reflected in column (A)) (C) | |||
| Equity compensation plans approved by security holders | 464,023(1) | $6.17 | 742,392(2) |
| (1) | Represents stock options granted in January 2009 under Epoch’s Amended and Restated 2004 Omnibus Long-Term Incentive Compensation Plan. See Note 13 to the consolidated financial statements for further information regarding the plan. |
| (2) | The 742,392 shares may be issued under our Amended and Restated 2004 Omnibus Long-Term Incentive Compensation Plan as options, restricted stock awards or any other form of equity compensation. |
Recent Sales of Unregistered Securities
None.
Issuer Purchases of Equity Securities
Common Stock Repurchase Plan
The following table summarizes on a monthly basis, share repurchases under the Company’s Share Repurchase Plan(1) during the fourth quarter ended June 30, 2011:
| Period |
Total Number of Shares Purchased |
Weighted- Average Price Paid Per Share(3) |
Total Number of Shares Purchased as Part of Publicly Announced Plan |
Maximum Number of Shares that May Yet be Purchased Under the Plan |
||||||||||||
| April 1 - 30 |
- | $ | - | - | 317,599 | |||||||||||
| May 1 - 31 |
97,615 | (2) | 15.45 | 97,615 | 219,984 | |||||||||||
| June 1 - 30 |
- | - | - | 219,984 | ||||||||||||
|
|
|
|
|
|
|
|
|
|||||||||
| Total |
97,615 | $ | 15.45 | 97,615 | 219,984 | |||||||||||
|
|
|
|
|
|
|
|
|
|||||||||
| (1) | The Company’s Share Repurchase Plan was authorized in June 2008 by the Board of Directors and was subsequently amended in March 2009 and December 2009 to increase the number of shares to be repurchased. A total of 800,000 shares were authorized to be repurchased under the Plan. The Share Repurchase Plan is not subject to an expiration date. |
| (2) | Includes 81,815 employee relinquished shares to satisfy statutory employee tax withholding requirements. |
| (3) | The weighted-average price per share is calculated on a trade date basis and includes commissions. |
25
Table of Contents
Employee Tax Withholding
To satisfy statutory employee tax withholding requirements related to the vesting of common shares, employees may elect to have the Company withhold shares and remit the necessary tax withholding on their behalf. We may promptly sell these shares in the open market on behalf of the employee or include them as part of the shares repurchased under the share repurchase plan. Any resulting gain or loss on sale is accounted for as an adjustment to additional paid-in capital. During the quarter ended June 30, 2011, a total of 7,627 employee relinquished shares were sold in the open market, while 81,815 employee relinquished shares were included as part of the shares repurchased under the share repurchase plan.
26
Table of Contents
Stock Performance Graph
The graph and table that follow compare the performance of an investment in our Common Stock from June 30, 2006 through June 30, 2011 with the Russell 2000 Index, the Dow Jones U.S. Asset Managers Total Stock Market Index* (“Dow Jones US Asset Managers TSM”), a composite of publicly traded asset management companies, and an index comprised of public companies with the Standard Industrial Classification (“SIC”) Code 6282, Investment Advice. The graph and table assume a $100 investment in our Common Stock on June 30, 2006, and an equal investment in each of the selected indices, including reinvestment of dividends, if any. The performance shown in the graph and table represents past performance and should not be considered an indication of future performance.
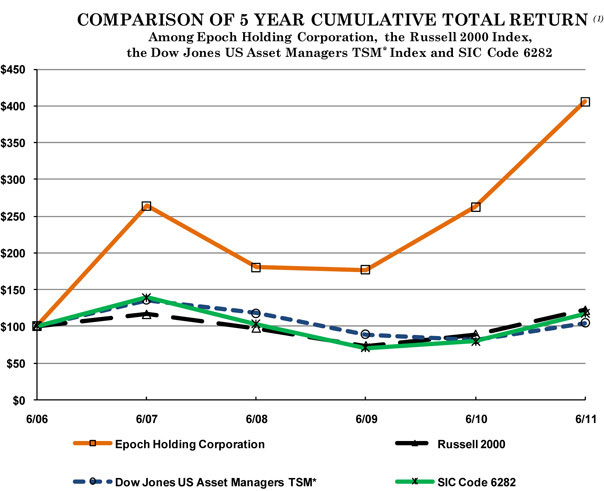
| (1) | $100 invested on June 30, 2006 in stock or index, including reinvestment of dividends. Fiscal year ending June 30. |
| 6/06 | 6/07 | 6/08 | 6/09 | 6/10 | 6/11 | |||||||||||||||||||
| Epoch Holding Corporation |
$ | 100.00 | $ | 263.58 | $ | 180.44 | $ | 176.74 | $ | 262.66 | $ | 406.04 | ||||||||||||
| Russell 2000 |
100.00 | 116.43 | 97.58 | 73.17 | 88.89 | 122.15 | ||||||||||||||||||
| Dow Jones US Asset Managers TSM* |
100.00 | 135.49 | 118.09 | 89.02 | 81.33 | 104.18 | ||||||||||||||||||
| SIC Code 6282 |
100.00 | 139.18 | 103.19 | 70.58 | 79.84 | 116.81 | ||||||||||||||||||
| * | Formerly known as the Dow Jones Asset Manager’s Wilshire Index. |
The foregoing graph and table shall not be deemed to be “soliciting material” or “filed” or incorporated by reference in any previous or future documents filed by the Company with the SEC under the Securities Act or the Exchange Act, except to the extent that the Company specifically incorporates the information by reference in any such document.
27
Table of Contents
| Item 6. | Selected Financial Data. |
The table on the following page presents our selected financial data. This data was derived from our consolidated financial statements and reflects our operations and financial position at the dates and periods indicated.
The following selected historical consolidated financial data should be read in conjunction with Part II, Item 7, “Management’s Discussion and Analysis of Financial Condition and Results of Operations,” and Item 8, “Financial Statements and Supplementary Data,” included in this Annual Report on Form 10-K.
28
Table of Contents
Selected Financial Data
(dollars in thousands, except per share and AUM data)
| For the Year Ended June 30, | ||||||||||||||||||||
| 2011 | 2010 | 2009 | 2008 | 2007 | ||||||||||||||||
| Consolidated Statements of Income Data: |
||||||||||||||||||||
| Operating revenues: |
||||||||||||||||||||
| Investment advisory and management fees |
$ | 68,788 | $ | 52,546 | $ | 30,561 | $ | 33,634 | $ | 22,964 | ||||||||||
| Performance fees |
1,811 | 814 | 624 | 172 | 971 | |||||||||||||||
|
|
|
|
|
|
|
|
|
|
|
|||||||||||
| Total operating revenues |
70,599 | 53,360 | 31,185 | 33,806 | 23,935 | |||||||||||||||
|
|
|
|
|
|
|
|
|
|
|
|||||||||||
| Expenses: |
||||||||||||||||||||
| Employee compensation and benefits(1) |
30,851 | 25,912 | 20,415 | 21,887 | 20,145 | |||||||||||||||
| Occupancy and technology(1) |
4,310 | 4,374 | 3,458 | 3,550 | 2,622 | |||||||||||||||
| Professional fees and services |
3,540 | 2,839 | 2,211 | 2,481 | 2,020 | |||||||||||||||
| General and administrative |
3,141 | 2,079 | 1,653 | 2,034 | 1,665 | |||||||||||||||
|
|
|
|
|
|
|
|
|
|
|
|||||||||||
| Total operating expenses |
41,842 | 35,204 | 27,737 | 29,952 | 26,452 | |||||||||||||||
|
|
|
|
|
|
|
|
|
|
|
|||||||||||
| Operating income/(loss) |
28,757 | 18,156 | 3,448 | 3,854 | (2,517 | ) | ||||||||||||||
| Other income(2) |
695 | 970 | 5,110 | 6,049 | 10,509 | |||||||||||||||
| Provision for income taxes(3) |
7,886 | 7,481 | 2,698 | 867 | 99 | |||||||||||||||
|
|
|
|
|
|
|
|
|
|
|
|||||||||||
| Net income |
21,566 | 11,645 | 5,860 | 9,036 | 7,893 | |||||||||||||||
| Cumulative preferred stock dividends |
- | - | - | 460 | 299 | |||||||||||||||
| Non-cash charge attributable to beneficial conversion feature of preferred stock |
- | - | - | - | 700 | |||||||||||||||
|
|
|
|
|
|
|
|
|
|
|
|||||||||||
| Net income available to common stockholders |
$ | 21,566 | $ | 11,645 | $ | 5,860 | $ | 8,576 | $ | 6,894 | ||||||||||
|
|
|
|
|
|
|
|
|
|
|
|||||||||||
| Consolidated Balance Sheet Data: |
||||||||||||||||||||
| Cash and cash equivalents |
$ | 29,128 | $ | 36,447 | $ | 37,055 | $ | 37,436 | $ | 3,097 | ||||||||||
| Short-term investments |
$ | - | $ | - | $ | - | $ | - | $ | 21,850 | ||||||||||
| Accounts receivable |
$ | 17,183 | $ | 11,156 | $ | 7,523 | $ | 6,391 | $ | 6,293 | ||||||||||
| Total assets |
$ | 70,861 | $ | 62,703 | $ | 55,007 | $ | 54,349 | $ | 39,374 | ||||||||||
| Long-term borrowings |
$ | - | $ | - | $ | - | $ | - | $ | - | ||||||||||
| Total liabilities |
$ | 9,126 | $ | 7,088 | $ | 5,217 | $ | 9,004 | $ | 3,931 | ||||||||||
| Total stockholders’ equity |
$ | 61,735 | $ | 55,615 | $ | 49,790 | $ | 45,345 | $ | 35,443 | ||||||||||
| Common Share Data: |
||||||||||||||||||||
| Earnings per share from continuing operations: |
||||||||||||||||||||
| Basic |
$ | 0.94 | $ | 0.52 | $ | 0.26 | $ | 0.42 | $ | 0.35 | ||||||||||
| Diluted |
$ | 0.93 | $ | 0.52 | $ | 0.26 | $ | 0.41 | $ | 0.35 | ||||||||||
| Cash dividends declared and paid per common share(4) |
$ | 0.97 | $ | 0.46 | $ | 0.24 | $ | 0.075 | $ | - | ||||||||||
| Weighted-average shares outstanding: |
||||||||||||||||||||
| Basic |
23,010 | 22,397 | 22,133 | 20,181 | 19,726 | |||||||||||||||
| Diluted |
23,183 | 22,545 | 22,133 | 21,911 | 20,807 | |||||||||||||||
| Other Financial Data: |
||||||||||||||||||||
| Cash provided by operations |
$ | 18,633 | $ | 14,211 | $ | 855 | $ | 11,349 | $ | 2,389 | ||||||||||
| Working capital(5) |
$ | 41,613 | $ | 43,697 | $ | 41,897 | $ | 36,792 | $ | 32,685 | ||||||||||
| Current ratio(6) |
5.9 | 8.0 | 10.8 | 5.6 | 12.6 | |||||||||||||||
| Operating margin(7) |
41 | % | 34 | % | 11 | % | 11 | % | (11 | %) | ||||||||||
| AUM Data: |
||||||||||||||||||||
| AUM (in millions): |
||||||||||||||||||||
| End of fiscal year |
$ | 17,086 | $ | 11,344 | $ | 7,891 | $ | 6,634 | $ | 6,001 | ||||||||||
| Average |
$ | 14,376 | $ | 10,792 | $ | 5,864 | $ | 6,372 | $ | 4,554 | ||||||||||
| Net AUM flows |
$ | 1,824 | $ | 2,564 | $ | 2,650 | $ | 1,087 | $ | 1,778 | ||||||||||
| (1) | Certain prior year amounts have been reclassified to conform to the 2011 presentation. In particular, employee share-based compensation has been combined with employee compensation and benefits, and depreciation expense has been combined with occupancy and technology expense. |
| (2) | Other income includes both cumulative dividends received and realized gains recognized from disposition of certain of our privately held investments during the fiscal years ended June 30, 2007, 2008, and 2009, respectively. See Note 15 to the consolidated financial statements for the fiscal year ended June 30, 2009 amounts. |
| (3) | Provision for income taxes was reduced in the fiscal year ended June 30, 2011 by the release of a valuation allowance of approximately $5.0 million against certain deferred tax assets. See Note 16 to the consolidated financial statements. |
| (4) | Our Board of Directors began declaring cash dividends in the second quarter of the fiscal year ended June 30, 2008. |
| (5) | Working capital is computed by subtracting current liabilities from current assets. |
| (6) | Current ratio is derived by dividing current assets by current liabilities. |
| (7) | Operating margin is computed by dividing operating income/ (loss) by total operating revenues. |
29
Table of Contents
| Item 7. | Management’s Discussion and Analysis of Financial Condition and Results of Operations. |
You should read the following discussion together with our Consolidated Financial Statements and related notes included in this Annual Report on Form 10-K and the information set forth under Item 6, “Selected Financial Data.” The discussion contains forward-looking statements that involve known and unknown risks and uncertainties. For additional information regarding some of the risks and uncertainties that affect our business and the industry in which we operate, please read “Item 1A. — Risk Factors” included in this Annual Report on Form 10-K. Our actual results may differ materially from those estimated or projected in any of these forward-looking statements.
Overview
We are a global asset management firm with accomplished and experienced professionals. Our professional investment staff averages over 20 years of industry experience. Our Company was formed with the specific goal of responding to paradigm shifts occurring within the sources of global equity investment returns and within the structure of the investment management business as a whole.
Headquartered in New York City, we had approximately $17.1 billion in assets under management (“AUM”) as of June 30, 2011. We remain debt-free and continue to have substantial capital resources available to fund current operations and implement our long-term growth strategy.
Our operating subsidiary, Epoch Investment Partners (“EIP”), is a registered investment adviser under the Investment Advisers Act of 1940, as amended. Our sole line of business is to provide investment advisory and investment management services to our clients which include corporations, mutual funds, retirement plans, public pension funds, endowments, foundations, financial institutions, and high net worth individuals. These services are provided through both separately managed accounts and commingled vehicles, such as private investment funds and mutual funds. Our investment strategies are primarily distributed through three distribution channels. These channels and the relative percentage of managed assets at June 30, 2011 are: sub-advised (51%), institutional (47%), and high net-worth (2%).
Our investment philosophy is focused on achieving superior long-term, risk-adjusted returns by investing in companies that generate free cash flow, appropriately allocate capital to create returns for shareholders, have understandable business models, possess transparent financial statements, and are undervalued relative to our investment team’s value determinations. Security selection and portfolio construction processes are designed to reduce the likelihood of significant capital losses in declining markets while participating in returns from rising markets.
Revenues are generally derived as a percentage of AUM. Therefore, among other factors, revenues are dependent upon:
| • | performance of financial markets, |
| • | performance of our investment strategies, |
| • | our ability to retain existing clients and attract new ones, and |
| • | changes in the composition of AUM. |
Our most significant operating expense is employee compensation and benefits, comprising fixed salaries, variable incentive compensation, share-based compensation, and employee benefits. Variable incentive compensation is primarily based upon management fee revenue, operating income, and investment performance. Our level of compensation reflects our plan to maintain competitive compensation levels to retain key personnel.
Our discussion and analysis of our financial condition and results of operations is based upon our Consolidated Financial Statements, which have been prepared in accordance with generally accepted accounting principles (“GAAP”). The preparation of these financial statements requires us to make estimates and judgments that affect the reported amounts of assets, liabilities, revenue and expenses and related disclosures of contingent assets and liabilities. On an ongoing basis, we evaluate our estimates, including those related to incentive compensation, valuation of deferred tax assets, share-based compensation, and fair value. We base our estimates on historical experience and on various assumptions that we believe to be reasonable under current circumstances, the results of which form the basis for making judgments about the carrying value of assets and liabilities. Actual results may differ from these estimates.
30
Table of Contents
AUM Fair Value Measurement
AUM consists of actively traded securities. The fair value of these securities is determined by an independent pricing service, which uses publicly available, unadjusted quoted market prices for measurement. We substantiate the values obtained with another independent pricing service to confirm all prices are valid. There is no judgment involved in the calculation of AUM in a manner that would directly impact our revenue recognition.
Key Priorities for Driving Growth
We remain committed to the development and growth of our business. Our main objectives are to achieve consistent and superior long-term investment performance for our clients, while further developing our distribution channels, both in the U.S. and abroad. Management has identified the following key priorities for driving growth:
| • | Generate superior risk-adjusted performance. We strive to produce superior risk-adjusted returns by constructing portfolios with risk/reward profiles that do not assume a high degree of capital risk. As of our fiscal year end June 30, 2011, most of our investment strategies have outperformed their respective benchmarks for the past one and five year periods, as well as since their inception. |
| • | Further develop consultant relationships. Consultant relationships serve an important role in helping us to further develop and expand our distribution channels. In the past year we have developed new consultant relationships and have expanded existing ones. |
| • | Continue to expand our global distribution network and partnerships. An important part of our growth the past few years has come from abroad as our investment management reputation continues to gain international recognition. Operating revenues from our international clients increased to approximately 32% for the year ended of June 30, 2011. Additionally, we continue to expand our retail and separately managed account distribution capabilities through our strategic partnership with New York Life Investment Management. |
31
Table of Contents
Key Financial Performance Indicators
We monitor a variety of key financial performance indicators to evaluate our business results. The charts that follow depict our annual growth in certain key financial performance measures over the past five years:
| 1. | Ending AUM |
| 2. | Average AUM |
| 3. | Operating Revenues vs. Operating Expenses |
| 4. | Operating Margin* |
| * | defined as operating income/(loss) divided by operating revenue. |
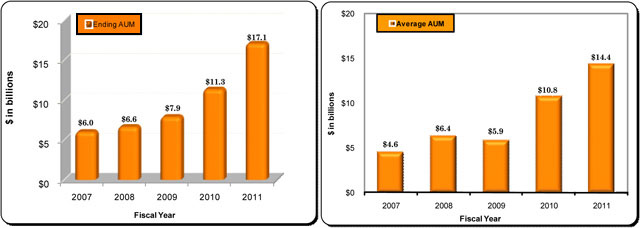
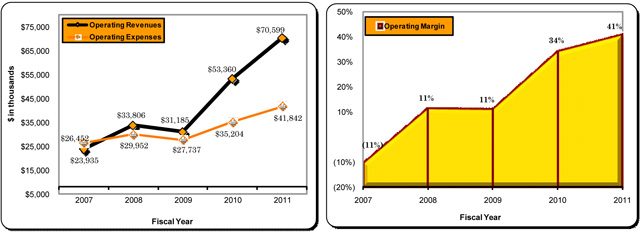
32
Table of Contents
Financial Highlights
For the fiscal year ended June 30, 2011, we reached several operating milestones. AUM exceeded $17 billion, annual operating revenues were in excess of $70 million, and our operating margin continued to grow. Some additional noteworthy accomplishments and items during the past year are as follows:
| • | AUM at June 30, 2011 was $17.1 billion, representing a 51% increase from a year ago. Contributing to the increase was the continued expansion of our institutional and sub-advisory channels, particularly from international clients, coupled with market performance. |
| • | Net AUM inflows were $1.8 billion. We have experienced positive net inflows every year since our inception. |
| • | Nearly all of our investment strategies outperformed their respective benchmarks for the 1-year period ended June 30, 2011. |
| • | Our fiscal year 2011 operating margin was 41% as our operating leverage continued to benefit from AUM and revenue growth, compared with 34% in the previous year. A significant factor in this increase was a 32% year over year increase in operating revenues. |
| • | During the quarter ended December 31, 2010, we released a $5.0 million valuation allowance against certain deferred tax assets relating to acquired net operating losses and alternative minimum tax credits. This resulted in a non-recurring increase in our basic earnings per share of $0.22 and diluted earnings per share of $0.21 for the fiscal year ended June 30, 2011. |
| • | Our Board of Directors declared a special cash dividend in November 2010 of $0.75 per share as a result of our strong cash position, debt-free balance sheet, and confidence in our business. The aggregate dividend payment totaled approximately $17.1 million and was paid in December 2010. |
| • | Our Board of Directors increased our quarterly cash dividend rate from $0.05 per share to $0.06 per share in January 2011. This represents the third dividend rate increase. |
| • | Our balance sheet remains strong. Cash flows from operations were $18.6 million, a 31% increase from the prior year. Working capital continued to be in excess of $40 million for the third consecutive year, while liquid assets, defined as cash, cash equivalents, and accounts receivable, exceeded $46 million at June 30, 2011. We remain debt-free. |
33
Table of Contents
Key Performance Indicators
The table below presents financial results from what we consider to be our key operating and financial drivers for the past three fiscal years ended June 30:
| 2011 | 2010 | 2009 | ’11 vs ’10 Change | ’10 vs ’09 Change | ||||||||||||||||||||||||
| Amt | % | Amt | % | |||||||||||||||||||||||||
| Operating Indicators ($ in millions): |
||||||||||||||||||||||||||||
| AUM at end of fiscal year |
$ | 17,086 | $ | 11,344 | $ | 7,891 | $ | 5,742 | 51 | % | $ | 3,453 | 44 | % | ||||||||||||||
| Average AUM for the fiscal year |
$ | 14,376 | $ | 10,792 | $ | 5,864 | $ | 3,584 | 33 | % | $ | 4,928 | 84 | % | ||||||||||||||
| Net client flows |
$ | 1,824 | $ | 2,564 | $ | 2,650 | $ | (740 | ) | (29 | %) | $ | (86 | ) | (3 | %) | ||||||||||||
| Financial Indicators ($ in thousands): |
||||||||||||||||||||||||||||
| Operating Revenue |
$ | 70,599 | $ | 53,360 | $ | 31,185 | $ | 17,239 | 32 | % | $ | 22,175 | 71 | % | ||||||||||||||
| Operating Income |
$ | 28,757 | $ | 18,156 | $ | 3,448 | $ | 10,601 | 58 | % | $ | 14,708 | 427 | % | ||||||||||||||
| Net Income |
$ | 21,566 | $ | 11,645 | $ | 5,860 | $ | 9,921 | 85 | % | $ | 5,785 | 99 | % | ||||||||||||||
| Earnings Per Share: |
||||||||||||||||||||||||||||
| Basic |
$ | 0.94 | $ | 0.52 | $ | 0.26 | $ | 0.42 | 81 | % | $ | 0.26 | 100 | % | ||||||||||||||
| Diluted |
$ | 0.93 | $ | 0.52 | $ | 0.26 | $ | 0.41 | 79 | % | $ | 0.26 | 100 | % | ||||||||||||||
| Operating Margin(1) |
41 | % | 34 | % | 11 | % | NM | NM | NM | NM | ||||||||||||||||||
| Adjusted Financial Indicators* ($ in thousands): |
||||||||||||||||||||||||||||
| Net Income |
16,602 | 11,110 | 5,458 | $ | 5,492 | 49 | % | $ | 5,652 | 104 | % | |||||||||||||||||
| Earnings Per Share: |
||||||||||||||||||||||||||||
| Basic |
$ | 0.72 | $ | 0.50 | $ | 0.25 | $ | 0.22 | 44 | % | $ | 0.25 | 100 | % | ||||||||||||||
| Diluted |
$ | 0.72 | $ | 0.49 | $ | 0.25 | $ | 0.23 | 47 | % | $ | 0.24 | 96 | % | ||||||||||||||
* The effect of the release of valuation allowances on certain deferred tax assets were removed from these calculations for all years presented.
| (1) | Defined as operating income divided by total operating revenues. |
NM- Not meaningful.
Investment Philosophy
We are global equity investors with a long-term perspective on the drivers of shareholder return. Our investment philosophy is focused on achieving superior long-term, risk-adjusted returns by investing in companies that generate free cash flow, appropriately allocate capital to create returns for shareholders, have understandable business models, possess transparent financial statements, and are undervalued relative to our investment team’s value determinations. Security selection and portfolio construction processes are designed to reduce the likelihood of significant capital losses in declining markets while participating in returns from rising markets.
Business Environment
As an investment management and advisory firm, our results are impacted by the prevailing global economic climate, including such items as corporate profitability, investor confidence, unemployment, and interest rates. These factors can directly affect investor sentiment and global equity markets.
34
Table of Contents
Broad Market Indexes*
| Fiscal Year Ended June 30, | ||||||||||||
| Index |
2011 | 2010 | 2009 | |||||||||
| Dow Jones Industrial Average(1) |
27.0 | % | 18.9 | % | (23.0 | %) | ||||||
| NASDAQ Composite(2) |
31.5 | % | 16.0 | % | (19.2 | %) | ||||||
| S&P 500(3) |
30.7 | % | 14.4 | % | (26.2 | %) | ||||||
| MSCI World (net)(4) |
30.5 | % | 10.2 | % | (29.5 | %) | ||||||
| (1) | Dow Jones Industrial Average is a trademark of Dow Jones & Company, which is not affiliated with Epoch. |
| (2) | NASDAQ is a trademark of the NASDAQ Stock Market, Inc., which is not affiliated with Epoch. |
| (3) | S&P is a trademark of Standard & Poor’s, a division of McGraw-Hill Companies, Inc., which is not affiliated with Epoch. |
| (4) | MSCI World Index is a trademark of MSCI Inc., which is not affiliated with Epoch. |
| * | assumes dividend re-investment. |
Throughout most of our fiscal year ended June 30, 2011, global equity markets continued to recover from their March 2009 lows, driven by continued economic expansion and solid corporate earnings. Global equity markets gained considerable ground during the first half of our fiscal year, before stumbling slightly in late February and early March on concerns about inflation, the strength of the global economic recovery, and high unemployment levels. The March earthquake in Japan and the tsunami that followed, as well as political unrest in North Africa and the Middle East, created new worries. After a quick recovery and uptick in April, stocks slipped again in May and June when fresh worries about the European sovereign debt crisis, weaker economic data, a weakening domestic housing market, and the U.S. political debate over raising the debt ceiling and reducing the budget deficit sent indexes slightly lower.
Market Volatility and Impact on AUM Subsequent to Year End
The business environment we operate in became increasingly challenging following our fiscal year end. From the end of July 2011 through the latter part of August 2011, a downgrade of the U.S. debt rating by Standard & Poor’s, Inc., weak economic data across the globe, the continuing European sovereign debt crisis, ongoing unrest in North Africa and the Middle East, and concerns over potential missteps by the world’s central banks or government policymakers, caused equities to exhibit extreme volatility and endure their largest four week decline in over two years. Overall, for the period June 30, 2011 to August 31, 2011 both the S&P 500 Index and the MSCI World Index tumbled approximately 8%. Our AUM declined by approximately 7% during this same period.
Company Impact and Outlook
While the past fiscal year was a positive one, both in terms of market performance and corporate operating results, recent events subsequent to our fiscal year end demonstrated the fragility of the economy and the volatility of financial markets. Despite the challenging and ever-changing business environment we operate in, we remain cautiously optimistic and continue to believe we are well-positioned for the future.
Although economic uncertainties remain, we believe equities are far more attractive in this business environment than fixed income securities. However, stock selection will be crucial. The key to successful investing will be finding those companies with end-demand for their products, which generate consistent free cash flow, and whose management teams have a history of allocating capital to generate shareholder value. We continue to seek companies that return capital to the business owners through cash dividends, stock buybacks, and debt pay downs, particularly in those instances when internal projects and acquisition opportunities offer returns that are less than a firm’s cost of capital. Alternatively, we also look for those companies that appropriately reinvest their cash flow internally or make acquisitions that are accretive to shareholder value.
We continue to actively monitor global corporate earnings growth, changes in the labor markets, inflation expectations, as well as fiscal and monetary policies. With continued focus on generating superior risk-adjusted returns, providing a high level of client service, and further developing our distribution capabilities, we believe we are well-positioned to achieve our corporate goals.
35
Table of Contents
Assets under Management (“AUM”)
Our AUM has continued to increase, experiencing positive net inflows every year since inception. The graph below depicts the quarterly AUM and revenue growth for the past two fiscal years.
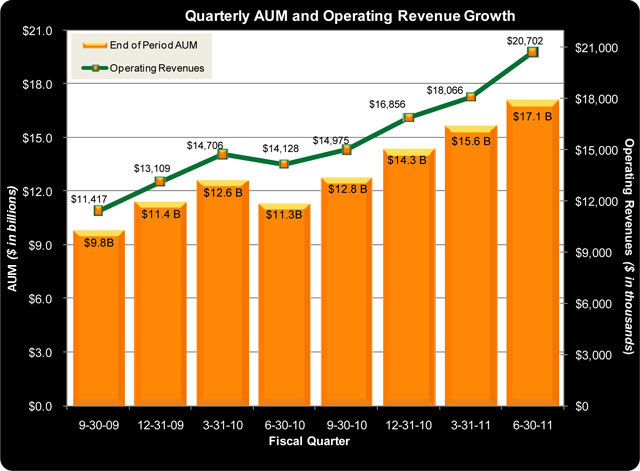
AUM and Flows
AUM increased to $17.1 billion at June 30, 2011 from $11.3 billion at June 30, 2010. This increase was attributable to market performance, coupled with the ongoing expansion of our client base and flows into existing accounts. We continued to expand our institutional and sub-advisory channels. We experienced growth in AUM in all investment strategies, particularly in our Global Equity Shareholder Yield, U.S. Value, and U.S. All Cap investment strategies.
36
Table of Contents
The following table sets forth the changes in our AUM for the past three fiscal years (dollars in millions):
| Twelve Months
Ended June 30, |
||||||||||||
| 2011 | 2010 | 2009 | ||||||||||
| Beginning of period AUM |
$ | 11,344 | $ | 7,891 | $ | 6,634 | ||||||
| Client flows: |
||||||||||||
| Inflows/new accounts |
3,317 | 3,750 | 3,569 | |||||||||
| Outflows/closed accounts |
(1,493 | ) | (1,186 | ) | (919 | ) | ||||||
|
|
|
|
|
|
|
|||||||
| Net inflows |
1,824 | 2,564 | 2,650 | |||||||||
| Market performance |
3,918 | 889 | (1,393 | ) | ||||||||
|
|
|
|
|
|
|
|||||||
| Net change |
5,742 | 3,453 | 1,257 | |||||||||
|
|
|
|
|
|
|
|||||||
| End of period AUM |
$ | 17,086 | $ | 11,344 | $ | 7,891 | ||||||
|
|
|
|
|
|
|
|||||||
| Percent change in total AUM |
50.6 | % | 43.8 | % | 18.9 | % | ||||||
| Net inflows/Beginning of period AUM |
16.1 | % | 32.5 | % | 39.9 | % | ||||||
For the fiscal years ended June 30, 2011, 2010, and 2009, approximately 48%, 46%, and 55%, respectively, of investment advisory and management fees were earned from services to mutual funds under advisory and sub-advisory agreements whose fees are calculated based upon daily net asset values, and approximately 52%, 54%, and 45%, respectively, of fees were earned from services provided for separate accounts whose fees are calculated based upon asset values at the end of the quarter.
Strategic Relationship
In July 2009, we entered into a strategic relationship with New York Life Investments, whereby the MainStay Group of Funds adopted our family of mutual funds (the “Epoch Funds”). The adoption was completed in November 2009. We are responsible for the day-to-day investment management of the funds through a sub-advisory relationship, while MainStay Investments (“MainStay”), the retail distribution arm of New York Life Investments, is responsible for the distribution and administration of the funds. Each former Epoch Fund is now co-branded as a “MainStay Epoch” Fund.
In addition to an existing sub-advisory relationship between EIP and New York Life Investments for certain funds, and the adoption of the Epoch Funds indicated above, EIP and New York Life Investments have entered into an arrangement wherein, among other things, EIP and an affiliate of New York Life Investments have established a distribution and administration relationship with respect to certain separately managed account and unified managed account products, and for a period of three years New York Life Investments agrees to pay certain additional base fees and meet minimum distribution targets. For the fiscal years ended June 30, 2011 and 2010, New York Life Investment Management, through the MainStay Epoch Funds and other funds sub-advised by EIP, accounted for approximately 19% and 16% of consolidated operating revenues, respectively. Our services and relationship with New York Life Investment Management is considered important to our ongoing growth strategy.
37
Table of Contents
Distribution Channels
The following charts show our AUM by distribution channel and annual changes, as well as their percentage of AUM as of the end of the last three fiscal years (dollars in millions):
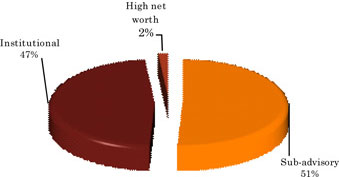
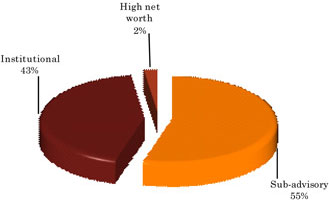
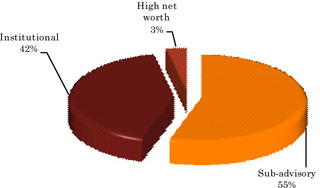
| (1) | During the three months ended December 31, 2009, approximately $820 million of AUM previously classified as Institutional was reclassified to Sub-advisory in conjunction with the adoption of the Epoch Funds by New York Life Investment Management. |
38
Table of Contents
Investment Strategies
The following charts show our AUM by investment strategy and annual changes, as well as their percentage of AUM as of the end of the last three fiscal years (dollars in millions):
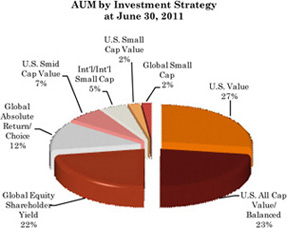
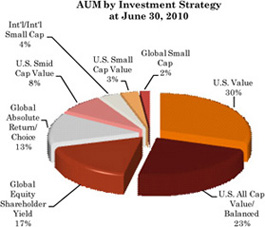
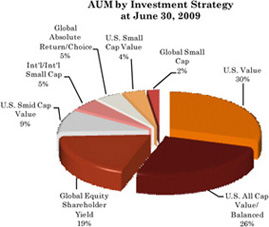
39
Table of Contents
Revenue by Geographic Region
The following charts show our operating revenue by geographic region and annual changes, as well as their percentage of total operating revenues for the last three fiscal years (dollars in thousands):
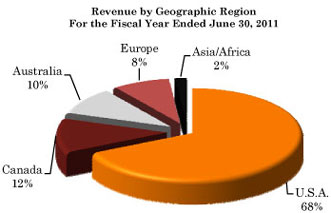
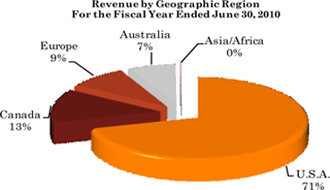
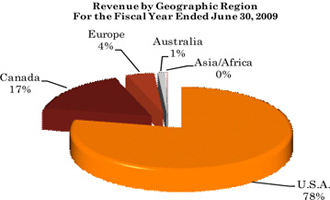
40
Table of Contents
Results of Operations
For the fiscal years ended June 30, 2011, 2010, and 2009
Revenues
| 2011 | 2010 | 2009 | ’11 vs ’10 Change |
’10 vs ’09 Change |
||||||||||||||||||||||||
| (Dollars in thousands) |
$ | % | $ | % | ||||||||||||||||||||||||
| Investment advisory and management fees |
$ | 68,788 | $ | 52,546 | $ | 30,561 | $ | 16,242 | 31 | % | $ | 21,985 | 72 | % | ||||||||||||||
| The increase in investment advisory and management fees for the fiscal year ended June 30, 2011 was attributable to the increase in AUM as a result of market performance as well as net inflows from new and existing clients. Net inflows for the fiscal year were approximately $1.8 billion. Average AUM for the year ended June 30, 2011 was approximately $14.4 billion compared with $10.8 billion for the prior year, an increase of approximately 33%.
The increase for the fiscal year ended June 30, 2010 was attributable to increased levels of AUM when compared with fiscal year ended June 30, 2009. Net inflows for the fiscal year ended June 30, 2010 were approximately $2.6 billion. Average AUM for the year ended June 30, 2010 was approximately $10.8 billion compared with $5.9 billion for the fiscal year ended June 30, 2009, an increase of approximately 84%.
For the fiscal years ended June 30, 2011 and 2010, New York Life Investment Management, through the MainStay Epoch Funds and other funds sub-advised by EIP, accounted for approximately 19% and 16% of consolidated operating revenues, respectively.
|
| |||||||||||||||||||||||||||
| 2011 | 2010 | 2009 | ’11 vs ’10 Change |
’10 vs ’09 Change |
||||||||||||||||||||||||
| (Dollars in thousands) |
$ | % | $ | % | ||||||||||||||||||||||||
| Performance fees |
$ | 1,811 | $ | 814 | $ | 624 | $ | 997 | 122 | % | $ | 190 | 30 | % | ||||||||||||||
We have certain fee agreements that allow us to earn performance fees in the event that investment returns meet or exceed certain pre-established benchmarks specified in the agreements. Revenues for these incentives are recognized only when such performance targets are met or exceeded at the end of the measurement period.
The increase in performance fees during the fiscal year ended June 30, 2011 stemmed from the addition of new accounts with performance fee agreements, coupled with relative performance on both the new and existing performance fee agreements. Increases in the year ended June 30, 2010 over the previous year were also the result of relative performance on new and existing performance fee agreements.
41
Table of Contents
Expenses
We are continuously managing and reviewing our resource allocation. Our largest expense is compensation. Our ability to compete depends, in part, on our ability to attract and retain key employees while managing our compensation and other costs.
| 2011 | 2010 | 2009 | ’11 vs ’10 Change |
’10 vs ’09 Change |
||||||||||||||||||||||||
| (Dollars in thousands) |
$ | % | $ | % | ||||||||||||||||||||||||
| Employee compensation and related benefits |
$ | 30,851 | $ | 25,912 | $ | 20,415 | $ | 4,939 | 19 | % | $ | 5,497 | 27 | % | ||||||||||||||
| As a percent of total revenue |
44 | % | 49 | % | 65 | % | ||||||||||||||||||||||
| Expenses in this category include salaries, share-based compensation, incentive compensation, benefits, signing bonuses, severance, and commissions. Maintaining and recruiting high-caliber, experienced employees are critical to our growth strategy. We place a high emphasis on pay for performance. As such, changes in our Company’s performance as well as changes in the underlying performance of our investment strategies have an impact on compensation and benefits. |
| |||||||||||||||||||||||||||
The increase during the fiscal year ended June 30, 2011 is primarily a result of additions to professional staff. Average headcount increased approximately 12% during the year ended June 30, 2011, when compared with the prior year period. Several additions were made to our investment and client relations teams to support our business expansion. An increase in incentive compensation based on our operating results, including AUM growth, net inflows, investment performance, as well as increased revenue, operating income and margins also contributed to the increase.
These expenses increased in the fiscal year ended June 30, 2010 when compared with the fiscal year ended June 30, 2009 primarily as a result of increased incentive compensation based on our operating results.
We believe that share-based compensation promotes unity in the workplace and a common objective with shareholders. We generally issue share awards to employees shortly following the calendar year.
The Company granted $8.5 million and $6.9 million in restricted stock awards during the fiscal years ended June 30, 2011 and 2010, respectively. During the fiscal year ended June 30, 2009, the Company granted $4.7 million in restricted stock awards. For the fiscal years ended June 30, 2011 and 2010, respectively, a total of 547,050 and 673,484 shares were granted at weighted-average prices of $15.46 and $10.20, respectively. During the fiscal year ended June 30, 2009 a total of 575,066 shares were granted at a weighted-average price of $8.17.
Increased annual employee share awards during both the fiscal years ended June 30, 2011 and 2010 stemmed from higher AUM, revenue and operating income levels.
During the fiscal year ended June 30, 2009, the Company issued options to purchase 630,060 shares of common stock to employees. These stock options vest annually over three years. The related expense is recognized ratably over three years from the grant date and the stock options have a term of seven years. The options have an exercise price of $6.17. However, upon vesting, the options are exercisable only if the volume weighted-average price of the Company’s common stock equals or exceeds $9.25 for a period of at least 20 trading days. Issuance of these awards will result in total stock compensation expense of $1.1 million over the requisite service period. No options were issued during the fiscal years ended June 30, 2010 or June 30, 2011.
The Company granted $0.4 million in restricted stock awards to non-employee directors during each of the fiscal years ended June 30, 2011, 2010 and 2009. For the fiscal years ended June 30, 2011 and 2010 a total of 28,994 shares and 43,459 shares were granted at weighted-average prices of $12.02 and $8.91, respectively. During the fiscal year ended June 30, 2009, non-employee directors were granted 38,620 shares at a weighted-average price of $9.10.
42
Table of Contents
| 2011 | 2010 | 2009 | ’11 vs
’10 Change |
’10 vs
’09 Change |
||||||||||||||||||||||||
| (Dollars in thousands) |
$ | % | $ | % | ||||||||||||||||||||||||
| Occupancy and technology |
$ | 4,310 | $ | 4,374 | $ | 3,458 | $ | (64 | ) | (1 | %) | $ | 916 | 26 | % | |||||||||||||
| As a percent of total revenue |
6 | % | 8 | % | 11 | % | ||||||||||||||||||||||
| Occupancy and technology expenses consist primarily of office space rentals, market data services, depreciation and amortization on equipment and leasehold improvements, and information technology costs.
These expenses were virtually unchanged during the fiscal year ended June 30, 2011 from the previous year. The increase in these expenses for the fiscal year ended June 30, 2010 was the result of an additional 10,000 square feet of office space leased in September 2009, due to business expansion.
As a result of our planned growth we are in the process of exploring opportunities for additional office space to accommodate staffing. As such, we anticipate occupancy and technology costs to increase during the fiscal year ended June 30, 2012.
|
| |||||||||||||||||||||||||||
| 2011 | 2010 | 2009 | ’11 vs
’10 Change |
’10 vs
’09 Change |
||||||||||||||||||||||||
| (Dollars in thousands) |
$ | % | $ | % | ||||||||||||||||||||||||
| Professional fees and services |
$ | 3,540 | $ | 2,839 | $ | 2,211 | $ | 701 | 25 | % | $ | 628 | 28 | % | ||||||||||||||
| As a percent of total revenue |
5 | % | 5 | % | 7 | % | ||||||||||||||||||||||
| Professional fees and services include outside legal fees for general corporate legal matters, independent accountants’ fees, consulting fees, employee placement fees and other professional services.
Increased employee placement fees during the fiscal year ended June 30, 2011 in conjunction with recruitment of professional staff were the primary reason for this increase. Partially offsetting this increase was a decrease in consulting fees, as the prior year period contained consulting fees incurred to enhance our information technology systems.
Increased legal fees in connection with the New York Life/MainStay strategic relationship were a primary reason for the increase during the fiscal year ended June 30, 2010. Consulting fees incurred to enhance existing systems were also a contributing factor for the increase in the fiscal year ended June 30, 2010 when compared with the fiscal year ended June 30, 2009.
|
| |||||||||||||||||||||||||||
| 2011 | 2010 | 2009 | ’11 vs
’10 Change |
’10 vs
’09 Change |
||||||||||||||||||||||||
| (Dollars in thousands) |
$ | % | $ | % | ||||||||||||||||||||||||
| General and administrative |
$ | 3,141 | $ | 2,079 | $ | 1,653 | $ | 1,062 | 51 | % | $ | 426 | 26 | % | ||||||||||||||
| As a percent of total revenue |
4 | % | 4 | % | 5 | % | ||||||||||||||||||||||
| General and administrative expenses consist primarily of expenses for travel and entertainment, advertising, marketing, and other office related expenses.
Increased product distribution costs and travel expenses to support new client mandates and the expansion of our distribution efforts were the primary reasons for the increase in general and administrative expenses for both the fiscal years ended June 30, 2011 and June 30, 2010.
|
| |||||||||||||||||||||||||||
| 2011 | 2010 | 2009 | ’11 vs ’10 Change |
’10 vs ’09 Change |
||||||||||||||||||||||||
| (Dollars in thousands) |
$ | % | $ | % | ||||||||||||||||||||||||
| Other income |
$ | 695 | $ | 970 | $ | 5,110 | $ | (275 | ) | (28 | %) | $ | (4,140 | ) | (81 | %) | ||||||||||||
| As a percent of income before income taxes |
2 | % | 5 | % | 60 | % | ||||||||||||||||||||||
Other income primarily includes realized gains and losses on sales of investments, interest income, and, through August 2010, rental income from subleased office space.
43
Table of Contents
The decline in other income during the fiscal year ended June 30, 2011 reflects a reduction in sublease income from the expiration of a sublease of premises to a third party. Related sublease income declined by approximately $0.4 million. Partially offsetting this decrease were capital gains from other investments of approximately $0.1 million.
The fiscal year ended June 30, 2009 period includes realized gains of $4.7 million from the Strategic Data Corporation transaction (see Note 15 to the Consolidated Financial Statements), losses on investments of $0.6 million, and approximately $0.5 million in interest income. Additionally, lower interest rates during the fiscal year ended June 30, 2010 caused interest income to significantly decline when compared with the fiscal year ended June 30, 2009.
| 2011 | 2010 | 2009 | ’11 vs ’10 Change |
’10 vs ’09 Change |
||||||||||||||||||||||||
| (Dollars in thousands) |
$ | % | $ | % | ||||||||||||||||||||||||
| Provision for income taxes |
$ | 7,886 | $ | 7,481 | $ | 2,698 | $ | 405 | 5 | % | $ | 4,783 | 177 | % | ||||||||||||||
| Effective income tax rate |
27 | % | 39 | % | 32 | % | ||||||||||||||||||||||
| During the quarter ended December 31, 2010, we determined that a valuation allowance against certain deferred tax assets relating to acquired net operating losses and alternative minimum tax credits was no longer appropriate, as it is more likely than not that these deferred tax assets will be realized in future operating periods. Accordingly, we released a valuation allowance of approximately $5.0 million. This determination was made based upon such positive evidence as our recent earnings history, pre-tax income growth rates, and current operating income levels. We expect continued profitability in the future, at a level that will allow us to utilize these deferred tax assets in future periods. |
| |||||||||||||||||||||||||||
The release of the valuation allowance was the primary factor for the decrease in the provision for income taxes and the effective income tax rate for the fiscal year ended June 30, 2011. The effect on our operating performance resulted in a non-recurring increase in our basic earnings per share of $0.22 and diluted earnings per share of $0.21 for the fiscal year ended June 30, 2011. The release also resulted in an increase in deferred tax assets on the Consolidated Balance Sheet, but had no effect on cash flows. Excluding the effect of the valuation allowance release, our effective income tax rate would have been approximately 44% for the fiscal year ended June 30, 2011. The increase in the provision for income taxes as well as the effective income tax rate, excluding the effect of the valuation allowance release, is the result of higher pre-tax income levels when compared with the same period a year ago.
The increase in the provision for income taxes as well as the effective income tax rate for the fiscal year ended June 30, 2010 when compared with the year ended June 30, 2009 was the result of higher pre-tax income.
44
Table of Contents
Liquidity and Capital Resources
Our operating cash flows are primarily influenced by the timing and receipt of investment management fees, and the payment of operating expenses, including cash incentive compensation to our employees. Investment management fees are generally collected within 90 days of quarter end.
Investing cash flows are principally influenced by investments and capital expenditures for property and equipment.
Financing cash flows are predominately influenced by the payment of cash dividends and the repurchase of our common stock. We have been making continuous quarterly dividend payments on our common stock since the quarter ended December 31, 2007 and have paid three special dividends.
We do not have any debt and we do not foresee any reason to incur debt unless a significant business opportunity warrants such action. We routinely evaluate our strategic position and maintain a disciplined acquisition and alliance effort which seeks complementary investment strategies or new investment strategies that would benefit our clients and be accretive to our long-term business strategy. While we plan to actively seek such opportunities, there can be no assurance that any such acquisitions or alliances can be identified or consummated on terms that will be attractive to us.
Sources of Liquidity
Our principal source of liquidity is cash flows from operating activities, particularly investment management fees. Our current financial condition is highly liquid, with a significant amount of our assets comprised of cash and cash equivalents and accounts receivable. While it is currently our intention to hold the held-to-maturity securities until maturity and the other investments long term, we have the ability to convert these items into cash and cash equivalents during any fiscal year. Cash and cash equivalents, accounts receivable, held-to-maturity securities, and other investments accounted for approximately 81% and 85% of total assets as of June 30, 2011 and June 30, 2010, respectively.
The following table summarizes our principal and potential sources of liquidity as of June 30, 2011 and June 30, 2010 (dollars in thousands):
| June 30, 2011 | June 30, 2010 | |||||||
| Consolidated Balance Sheets data: |
||||||||
| Cash and cash equivalents |
$ | 29,128 | $ | 36,447 | ||||
| Accounts receivable |
17,183 | 11,156 | ||||||
| Held-to-maturity securities |
1,960 | 2,001 | ||||||
| Other investments |
8,907 | 3,698 | ||||||
|
|
|
|
|
|||||
| Total |
$ | 57,178 | $ | 53,302 | ||||
|
|
|
|
|
|||||
We believe that the sources of liquidity described above as well as our continuing cash flows from operations will be sufficient to meet our operating needs for the foreseeable future and will enable us to continue implementing our growth strategy. We do not anticipate a need for an external source of liquidity.
Uses of Liquidity
We remain committed to growing our business in this challenging market environment and expect that our main uses of cash will be to pay corporate operating expenses, recruit key personnel, enhance our operating and technology infrastructure, pay quarterly dividends, and reacquire shares of our common stock when appropriate.
Our philosophy regarding the maintenance of a balance sheet with a large component of cash and cash equivalents reflects our views on potential future capital requirements relating to enhancement of our investment capabilities, creation and expansion of distribution channels, potential strategic acquisitions or transactions, and possible challenges to our business. If we believe no such prudent and reasonable opportunity exists, we will consider alternatives to return capital to our shareholders through stock repurchases and dividend payments. We regularly assess our approach in view of our current and potential future needs.
45
Table of Contents
Cash Flow Analysis
A summary of the Statements of Cash Flows for the fiscal years ended June 30 is as follows (dollars in thousands):
| Fiscal Year
Ended June 30, |
||||||||||||
| 2011 | 2010 | 2009 | ||||||||||
| Cash flows provided by/(used in): |
||||||||||||
| Operating activities |
$ | 18,633 | $ | 14,211 | $ | 855 | ||||||
| Investing activities |
(3,792 | ) | (3,778 | ) | 4,596 | |||||||
| Financing activities |
(22,160 | ) | (11,041 | ) | (5,832 | ) | ||||||
|
|
|
|
|
|
|
|||||||
| Net decrease in cash and cash equivalents |
(7,319 | ) | (608 | ) | (381 | ) | ||||||
| Cash and cash equivalents at beginning of period |
36,447 | 37,055 | 37,436 | |||||||||
|
|
|
|
|
|
|
|||||||
| Cash and cash equivalents at end of period |
$ | 29,128 | $ | 36,447 | $ | 37,055 | ||||||
|
|
|
|
|
|
|
|||||||
Cash Flows from Operating Activities
Our cash flows from operating activities are calculated by adjusting net income to reflect other significant sources and uses of cash, certain significant non-cash items such as share-based compensation, and timing differences in the cash settlement of operating assets and liabilities.
For the fiscal year ended June 30, 2011, our net cash provided by operating activities totaled $18.6 million. The increase from the prior fiscal year reflects the increase in revenues and related operating income as well as the timing differences in the cash settlement of assets and liabilities.
Accounts receivable increased by $6.0 million at June 30, 2011 when compared with the prior year and is reflective of higher management fees during the fourth quarter ended June 30, 2011 as a result of the significantly increased level of AUM. Accrued compensation and benefits increased by $1.5 million from the comparable period a year ago, and primarily represents accruals for incentive compensation. This liability is generally paid shortly after the calendar year.
For the fiscal year ended June 30, 2010, net cash provided by operating activities was $14.2 million. The increase from the previous year was the result of increased revenues and related operating income.
Cash Flows from Investing Activities
Our cash flows from investing activities consist primarily of capital expenditures, the purchase and redemption of held-to-maturity securities, as well as investments in Company-sponsored products and other investments.
Cash flows used in investing activities totaled $3.8 million for the fiscal year ended June 30, 2011. Investments of $4.0 million in a non-affiliated investment limited partnership, partially offset by the return of security deposits on leased premises, accounted for most of the cash flows used in investing activities during the fiscal year. The purpose of the investment in the limited partnership is to generate additional returns on our cash balances during the current period of relatively low interest rates.
Cash flows used in investing activities for the fiscal year ended June 30, 2010 totaled $3.8 million. During the year we purchased $2.4 million of high-grade debt securities yielding higher interest rates than money market instruments. These securities are classified as held-to-maturity securities on the Consolidated Balance Sheets as it is our intention to hold these securities until they mature. Capital expenditures of approximately $1.6 million on leasehold improvements and office equipment associated with additional office space leased in September 2009 also contributed to the use of funds.
46
Table of Contents
Cash Flows from Financing Activities
Our cash flows from financing activities primarily reflect the payment of common stock dividends, the repurchase of our common stock, and the recognition of excess tax benefits associated with share-based compensation.
The primary cash flows used in financing activities during the fiscal year ended June 30, 2011 were dividends of $22.2 million, comprising regular dividends of $5.1 million and a special dividend of $17.1 million. During the same period, we also repurchased 97,615 shares of common stock under our authorized repurchase program, for approximately $1.5 million.
The primary cash flows used in financing activities during the fiscal year ended June 30, 2010 were dividends of $10.2 million, comprising regular dividends of $3.5 million and a special dividend of $6.7 million. During the same period, we also repurchased 209,601 shares of common stock under our authorized repurchase program, for approximately $1.9 million.
Working Capital
Our working capital and current ratio for the past two years is set forth in the table below (dollars in thousands):
| June 30, | Change | |||||||||||||||
| 2011 | 2010 | $ | % | |||||||||||||
| Current Assets |
$ | 50,044 | $ | 49,937 | $ | 107 | 0% | |||||||||
| Current Liabilities |
8,431 | 6,240 | 2,191 | 35% | ||||||||||||
|
|
|
|
|
|
|
|||||||||||
| Working Capital |
$ | 41,613 | $ | 43,697 | $ | (2,084) | (5%) | |||||||||
|
|
|
|
|
|
|
|
|
|||||||||
| Current Ratio(1) |
5.9 | 8.0 | (2.1) | (26%) | ||||||||||||
|
|
|
|
|
|
|
|
|
|||||||||
| (1) | Current assets divided by current liabilities |
Capital Expenditures
In September 2009, we entered into a sublease agreement for an additional 10,000 square feet of office space. Leasehold improvements and purchases of additional office equipment resulted in nearly $1.6 million of capital expenditures during the fiscal year ended June 30, 2010.
Regular Cash Dividends
We have been paying regular quarterly dividends since the quarter ended December 31, 2007 and have increased the quarterly dividend rate three times.
Regular quarterly dividends of $0.05 per share were paid in the first and second quarters of fiscal year 2011. Effective with the third quarter of fiscal year 2011, we increased the quarterly dividend rate from $0.05 to $0.06 per share. Approximately $5.1 million of regular dividends were declared and paid during the fiscal year ended June 30, 2011.
Effective during the third quarter of fiscal year 2010, we increased the quarterly dividend rate by from $0.03 to $0.05 per share. A total of $3.5 million of regular dividends were declared and paid during the fiscal year ended June 30, 2010.
47
Table of Contents
We expect regular quarterly cash dividends going forward to be paid in February, May, August and November of each fiscal year. However, the actual declaration of future cash dividends, and the establishment of record and payment dates, is subject to determination by the Board of Directors each quarter after their review of our financial performance, as well as general business conditions, capital requirements, and any legal or regulatory restrictions. We may change our dividend policy at any time.
Special Cash Dividends
The Board of Directors declared a special cash dividend on November 17, 2010 of $0.75 per share. The dividend was paid in December 2010. The aggregate dividend payment totaled approximately $17.1 million.
On November 13, 2009 the Board of Directors declared a special cash dividend of $0.30 per share. The dividend was paid in December 2009. The aggregate dividend payment totaled approximately $6.7 million.
On December 19, 2008 the Board of Directors declared a special cash dividend of $0.12 per share. The dividend was paid in January 2009. The aggregate dividend payment totaled approximately $2.6 million.
As with regular dividends, the declaration of special dividends is subject to the determination by our Board of Directors.
Common Stock Repurchase Plan
We maintain a stock repurchase plan with the objective of maximizing shareholder value. Subject to applicable law, the shares may be purchased from time to time in the open market and/or in privately negotiated transactions. Such purchases will be at times and in amounts as we deem appropriate, based on factors such as prevailing market conditions, legal requirements and other business considerations.
As of June 30, 2011, we have repurchased a cumulative total of 580,016 shares and have 219,984 shares remaining for repurchase under the existing repurchase plan. The table below presents annual shares repurchased and the weighted-average price per share:
| For the Year Ended June 30, | ||||||||||||||||||||||
| 2011 | 2010 | 2009 | ||||||||||||||||||||
| Shares Repurchased |
Weighted- |
Shares |
Weighted- |
Shares |
Weighted- |
|||||||||||||||||
| 97,615 | (1) | $ | 15.45 | 209,601 | $ | 9.21 | 263,900 | $ | 7.36 | |||||||||||||
| (1) | Includes 81,815 employee relinquished shares to satisfy statutory employee tax withholding requirements. |
| (2) | The weighted-average price per share is calculated on a trade date basis and includes commissions. |
For additional information regarding repurchases of our equity securities, see Part II, Item 5, “Market for Registrant’s Common Equity, Related Stockholder Matters and Issuer Purchase of Equity Securities.”
Employee Tax Withholding
To satisfy statutory employee tax withholding requirements related to the vesting of common shares, employees may elect to have our Company withhold shares and remit the necessary tax withholding on their behalf. We may promptly sell these shares in the open market on behalf of the employee or include them as part of the shares repurchased under the share repurchase plan. Any resulting gain or loss on sale is accounted for as an adjustment to additional paid-in capital. During the year ended June 30, 2011, a total of 100,411 employee relinquished shares were sold in the open market, while 81,815 employee relinquished shares were included as part of the shares repurchased under the share repurchase plan. At June 30, 2011, there were no shares so withheld related to employee tax withholdings.
48
Table of Contents
Fair Value Measurements
Our other investments, which include available-for-sale securities, are measured at fair value. Fair values for these investments are determined based upon unadjusted quoted market prices. These investments trade on financial exchanges, with active daily prices.
The gross unrealized losses from available-for-sale securities were primarily caused by overall weakness in the financial markets and world economy. The securities are expected to recover their value over time. We have the intent and ability to hold these investments until such recovery occurs.
We do not hold any derivative instruments or financial liabilities. See Note 7 to the Consolidated Financial Statements for a further discussion on Fair Value Measurements.
Contractual Obligations
Office Space
Our headquarters and operations are located at 640 Fifth Avenue, New York, New York. Business is conducted at a location with approximately 20,000 square feet under long-term leases that expire in September 2015. We believe our present office space is adequate for our existing operating needs. However, we foresee the need for additional office space to support our growth plans. Therefore, we are exploring opportunities for additional office space and we anticipate entering into a contractual obligation within the next twelve months.
Employment Agreement
We renewed our employment agreement with our Chief Executive Officer in December 2010, effective January 1, 2011. The term of the agreement is for two years, with automatic two year renewals thereafter. Both our Company and the Chief Executive Officer have the option not to renew the term of the agreement within forty-five days of the end of the term or renewal term. The agreement calls for a minimum base salary of $375 thousand per annum, and bonus compensation in accordance with our Company’s bonus and incentive compensation plans. The agreement also calls for certain payments in the event of termination. The payments could vary depending on the cause of termination and whether or not our Board of Directors elects to enforce a non-compete agreement. The agreement was reviewed and approved by our Compensation Committee and our Board of Directors.
Summary of Contractual Obligations
The following table summarizes all contractual obligations, including the aforementioned office leases (dollars in thousands):
| Payments Due in Fiscal Years Ended June 30, | ||||||||||||||||||||
| 2012 | 2013- 2014 | 2015- 2016 | 2017 and thereafter |
Total | ||||||||||||||||
| Office space |
$ | 1,427 | $ | 2,854 | $ | 1,784 | $ | - | $ | 6,065 | ||||||||||
| Other operating leases |
37 | 27 | - | - | 64 | |||||||||||||||
|
|
|
|
|
|
|
|
|
|
|
|||||||||||
| Total obligations |
$ | 1,464 | $ | 2,881 | $ | 1,784 | $ | - | $ | 6,129 | ||||||||||
|
|
|
|
|
|
|
|
|
|
|
|||||||||||
Off-Balance Sheet Arrangements
As of June 30, 2011, we had no off-balance sheet arrangements.
49
Table of Contents
Critical Accounting Estimates
Our consolidated financial statements are prepared in accordance with accounting principles generally accepted in the United States (“GAAP”). In connection with the preparation of our financial statements, we are required to make assumptions and estimates about future events, and apply judgments that affect the reported amounts of assets, liabilities, revenue, expenses and disclosure of contingent assets and liabilities. We base our assumptions, estimates and judgments on historical experience, current trends and other factors that we feel to be relevant at the time our consolidated financial statements are prepared. On a regular basis, we review the accounting policies, assumptions, estimates and judgments to ensure that our financial statements are presented fairly and in accordance with GAAP. However, because future events and their effects cannot be determined with certainty, actual results could differ from our assumptions and estimates, and such differences could be material.
Our significant accounting policies and estimates are discussed in Note 2, Summary of Significant Accounting Policies, of the Notes to the Consolidated Financial Statements, included in Item 8, Financial Statements and Supplementary Data of this Annual Report on Form 10-K. We believe that the following accounting estimates are the most subjective, resulting from the need to make estimates about the effect of matters that are inherently uncertain. We have reviewed these critical accounting estimates and related disclosures with the Audit Committee of our Board of Directors.
Provision for Income Taxes
Our judgment is required in developing our provision for income taxes, including the determination of deferred tax assets and liabilities and any valuation allowances that might be required against deferred tax assets. Due to certain tax rules, we have annual limitations on certain acquired net operating losses. As such, their utilization prior to their expiration cannot be reasonably assured.
Incentive Compensation
Based upon Company and individual employee performance, we provide annual incentive-based cash awards to employees, generally following the calendar year. Because Company and individual employee performance is subject to change over the course of the year, estimates may differ from the actual amounts ultimately recognized. With some employees there are written agreements which provide for sales commissions or bonuses, subject to the attainment of certain performance criteria or continuation of employment. In such instances, the estimate of commissions and bonuses is generally governed by the terms of the agreement.
Share-Based Compensation
We issued employee stock options to purchase shares of common stock during the fiscal year ended June 30, 2009. We value stock options based upon the Black-Scholes option-pricing model and recognize this value as an expense over the requisite service period. Implementation of the Black-Scholes option-pricing model requires us to make certain assumptions, including expected volatility, risk-free interest rate, expected dividend yield and expected life of the options. We utilized assumptions that we believed to be most appropriate at the time of the valuation.
Recently Issued Accounting Standards
Presentation of Comprehensive Income
In June 2011, the Financial Accounting Standards Board (“FASB”) issued Accounting Standards Update (“ASU”) No. 2011-05, Presentation of Comprehensive Income. FASB ASU No. 2011-05 amends existing guidance by allowing two options for presenting the components of net income and other comprehensive income: (1) in a single continuous financial statement: a statement of income and other comprehensive income or (2) in two separate but consecutive financial statements, consisting of an income statement followed by a separate statement of other comprehensive income. Also, items that are reclassified from other comprehensive income to net income must be presented on the face of the financial statements. ASU No. 2011-05 requires retrospective application, and it is effective for fiscal years, and interim periods within those years, beginning after December 15, 2011, with early adoption permitted. We early adopted the provisions of ASU 2011-05 during the fourth quarter ended June 30, 2011, choosing to include a separate statement of comprehensive income. The adoption of this standard did not have an impact on our consolidated financial position, results of operations, or cash flows.
50
Table of Contents
Fair Value
In May 2011, FASB issued ASU No. 2011-04, Fair Value Measurement (Topic 820): Amendments to Achieve Common Fair Value Measurement and Disclosure Requirements in U.S. GAAP and IFRS. ASU No. 2011-04 generally provides a uniform framework for fair value measurements and related disclosures between GAAP and International Financial Reporting Standards (“IFRS”). Additional disclosure requirements in the update include, among other things, the disclosure of all transfers between Level 1 and Level 2 of the fair value hierarchy. ASU 2011-04 will be effective for the interim and annual periods beginning on or after December 15, 2011. We do not expect the adoption of this standard to have a material impact on our consolidated financial position, results of operations, or cash flows.
Effects of Inflation
Because our assets are, to a large extent, liquid in nature, they are not significantly affected by inflation. However, the rate of inflation affects such expenses as employee compensation, office space leasing costs and information technology expenses, which may not be readily recoverable in the fees we charge for asset management. Further, to the extent inflation adversely affects the securities markets, it may impact revenues.
51
Table of Contents
| Item 7A. | Quantitative and Qualitative Disclosures About Market Risk. |
In the normal course of business, our results of operations and financial position are subject to different types of risk, including market risk. Market risk is the risk that we will incur losses primarily due to adverse changes in equity prices, interest rates, or currency exchange rates. As an investment manager, we continuously identify, assess, and manage market and other risks. The following information, together with information included in other parts of Item 7, “Management’s Discussion and Analysis of Financial Condition and Results of Operations,” illustrates the significant characteristics of certain items that cause market risk to us.
In evaluating market risk, it is important to note that substantially all of our revenue is based on the market value of AUM. As noted in “Risk Factors” in Item 1A, declines of equity market values negatively impact our revenue and net income.
The management of market risk on behalf of our clients and its impact on fees is a significant focus for us. We use a variety of risk measurement techniques to identify and manage market risk within client portfolios. However, at the corporate level, we have historically not attempted to hedge revenue fluctuations that arise from changes in the fair value of our overall AUM.
Equity Price Risk
Revenues and Net Income
Our predominant exposure to market risk is directly related to our role as an investment adviser to the separate accounts we manage and funds we subadvise. Substantially all of our management fees are based upon the market value of our AUM. Accordingly, our investment management fees will change in proportion to changes in the market price of equity securities underlying our AUM. During the fiscal year ended June 30, 2011, approximately 48% of our management fees were derived from daily net asset values, while the remaining 52% of management fees was derived from market values of AUM at the end of the quarter. Declines in equity security market prices could cause our revenues and net income to decline by causing:
| • | the value of our AUM to decrease, which would result in lower investment management fees; |
| • | the returns realized on our AUM to decrease, impacting performance fees; and |
| • | clients to withdraw funds in favor of investments in markets or investment strategies that they perceive as offering greater opportunity or lower risk, which would also result in lower investment management fees. |
In addition, a decline in the price of securities may present market conditions that could preclude us from increasing AUM and prevent us from realizing higher revenue associated with such growth. Underperformance of client accounts relative to competing investment strategies could exacerbate these factors.
Our AUM was approximately $17.1 billion as of June 30, 2011. At June 30, 2011 we performed a sensitivity analysis to assess the potential loss in the fair value and associated revenue of our market-risk sensitive AUM. Assuming a 10% decrease in the value of AUM solely due to market declines and the change proportionally distributed over all of our investment strategies, the fair value of our AUM would decrease by an estimated $1.4 billion, which would cause an annualized decrease in total investment advisory and management fees of approximately $6.6 million. We do not hedge equity price risk on this exposure.
We earn performance fees on certain client accounts in the event that investment returns meet or exceed targeted amounts specified in the investment management agreements. Our performance fees will be impacted by changes in the market values of those accounts, which in turn are affected by changes in market risk factors. However, several other factors may influence the degree of impact, including: the performance criteria for the respective investment portfolio, the period over which the performance fee applies, and, to the extent applicable, the previous performance of the investment portfolio. As a result, the impact of changes in market risk factors on performance fees may vary widely and is therefore not readily predicted or estimated. Historically, less than 3% of our revenues have been generated from performance fees.
52
Table of Contents
Company Investments
We are exposed to fluctuations in the market security price of the Company’s investments. Company investments primarily consist of investments in Company-sponsored investment vehicles, including mutual funds, an investment strategy separate account, and a limited liability company. Company investments also include an investment in a non-affiliated investment limited partnership. We do not hedge our market security price risk related to these investments and do not intend to do so in the future.
At June 30, 2011 and June 30, 2010, respectively, we performed a sensitivity analysis to assess the potential loss in the fair value of these market-risk sensitive securities. The following table represents the estimated impact on our financial position assuming a hypothetical 10% decline in associated market indices (in thousands):
| Fair Value | Fair Value Assuming 10% Decline(1) |
Decrease in Stockholders’ Equity(2) |
||||||||||
| At June 30, 2011: |
||||||||||||
| Available-for-sale securities: |
||||||||||||
| Investment in limited partnership |
$ | 4,144 | $ | 4,132 | $ | 7 | ||||||
| Epoch Global All Cap separate account |
3,061 | 2,752 | 174 | |||||||||
| Company-sponsored mutual funds |
1,179 | 1,067 | 63 | |||||||||
| Equity method investment: |
||||||||||||
| Epoch Global Absolute Return Fund, LLC |
523 | 477 | 26 | |||||||||
|
|
|
|
|
|
|
|||||||
| Total Other Investments |
$ | 8,907 | $ | 8,428 | $ | 270 | ||||||
|
|
|
|
|
|
|
|||||||
| At June 30, 2010: |
||||||||||||
| Available-for-sale securities: |
||||||||||||
| Epoch Global All Cap separate account |
$ | 2,377 | $ | 2,154 | $ | 128 | ||||||
| Company-sponsored mutual funds |
895 | 810 | 49 | |||||||||
| Equity method investment: |
||||||||||||
| Epoch Global Absolute Return Fund, LLC |
426 | 398 | 16 | |||||||||
|
|
|
|
|
|
|
|||||||
| Total Other Investments |
$ | 3,698 | $ | 3,362 | $ | 193 | ||||||
|
|
|
|
|
|
|
|||||||
| (1) | Based upon the investment’s correlation with its associated market index, a hypothetical 10% decline in the associated market index may result in a change other than 10% in the respective investment. |
| (2) | Investments in the Company-sponsored mutual funds, the Epoch Global All-Cap separate account, and the investment limited partnership are classified as available-for-sale securities. Unrealized gains or losses on available-for-sale securities are excluded from earnings and recorded in accumulated other comprehensive income/loss), net of tax, as a separate component of stockholder’s equity until realized. The investment in the Epoch Global Absolute Return Fund, LLC is accounted for using the equity method, under which our share of net realized and unrealized earnings or losses from the limited liability company is reflected in net income. All amounts shown in this column are net of tax. |
Interest Rate Risk
Revenues and Net Income
Our AUM is also subject to interest rate risk. Changes in both domestic and global interest rates may impact the valuation of equities, and thus our AUM, operating revenues and net income.
Held-to-Maturity Investments
Our investment income is also subject to interest rate risk. Investment income consists primarily of interest income, dividends, and realized gains and losses on our investments. We have invested in and continue to hold high-grade debt securities. Since it is our intent to hold these securities until they mature, we have accounted for them as held-to-maturity securities. We do not hedge our interest rate risk related to these securities and we do not intend to do so in the future. We believe that a hypothetical change in interest rates of 100 basis points would not have a material impact on our consolidated results of operations, financial condition or cash flows.
53
Table of Contents
The table below provides information about our investment securities held-to-maturity, including expected principal flows for the fiscal years June 30, 2012 through June 30, 2017 and thereafter (in thousands):
| Payments Due in Fiscal Years Ended June 30, |
Total Principal Cash Flows |
Fair Market Value at June 30, 2011 |
||||||||||||||||||||||||||||||
| 2012 | 2013 | 2014 | 2015 | 2016 | 2017 and Thereafter |
|||||||||||||||||||||||||||
| Long-term debt securities |
$ | 350 | $ | 1,050 | $ | 500 | $ | - | $ | - | $ | - | $ | 1,900 | $ | 2,008 | ||||||||||||||||
| Weighted-average interest rate |
1.67 | % | 2.14 | % | 2.66 | % | 2.19 | % | ||||||||||||||||||||||||
Cash and Cash Equivalents
Cash consists of amounts held in checking and money market accounts. Cash equivalents include highly liquid investments in money market funds consisting of short-term securities of the U.S. government and its agencies with maturities of three months or less when acquired. Cash and cash equivalents are exposed to market risk due to changes in interest rates, which impacts interest income.
We monitor the quality of the institution where our cash is deposited, the balance of which, at times, may be in excess of the Federal Deposit Insurance Corporation insurance limits. Presently, we neither participate in hedging activities nor have any derivative financial instruments.
While changes in interest rates could decrease our interest income, we do not believe we have a material exposure to changes in interest rates. We do not undertake any specific actions to cover our exposure to interest rate risk and are not a party to any interest rate risk transactions.
Foreign Currency Exchange Risk
Certain client portfolios include securities denominated in foreign currencies. Accordingly, foreign currency fluctuations may affect the levels of our AUM. For securities denominated in currencies other than U.S. dollars, an increase in the value of the U.S. dollar relative to those non-U.S. currencies may result in a decrease in the dollar value of our AUM, which, in turn, would result in lower U.S. dollar denominated revenues. We estimate that, as of June 30, 2011, a 10% weakening or strengthening of the U.S. dollar against all or any combination of currencies to which our portfolios have exposure to exchange rates would not have a material effect on our revenues.
While we operate in the U.S., we have clients in several countries outside the U.S. However, nearly all of our revenue from these clients and the associated expenses are denominated in U.S. dollars. Therefore, only a limited portion of our revenues and expenses are impacted by movements in currency exchange rates. The effect of a 10% change in exchange rates on such revenues and expenses would not have a material effect on our results of operations. We currently do not hedge our currency exposure, and we do not enter into foreign currency transactions for speculative purposes. Our exposure to currency movements may likely increase as our business outside the U.S. grows, and we will continue to monitor our foreign currency exposure accordingly.
54
Table of Contents
| Item 8. | Financial Statements and Supplementary Data. |
The financial statements and supplementary financial information required by this Item are listed in the Index to Financial Statements below:
EPOCH HOLDING CORPORATION AND SUBSIDIARIES
INDEX TO FINANCIAL STATEMENTS, SUPPLEMENTARY DATA
AND FINANCIAL STATEMENT SCHEDULES
(1) Financial Statements:
55
Table of Contents
REPORT OF MANAGEMENT ON INTERNAL CONTROL OVER FINANCIAL REPORTING
Management of Epoch Holding Corporation and Subsidiaries (“the Company”) is responsible for establishing and maintaining adequate internal control over the Company’s financial reporting, as such term is defined in Rules 13a-15(f) and 15d-15(f) of the Securities Exchange Act of 1934, as amended. A company’s internal control over financial reporting is a process designed by, or under the supervision of, the company’s principal executive and principal financial officers, or persons performing similar functions, and effected by the company’s Board of Directors, management and other personnel to provide reasonable assurance regarding the reliability of financial reporting and the preparation of financial statements for external purposes in conformity with accounting principles generally accepted in the United States of America and include those policies and procedures that:
| 1) | pertain to the maintenance of records that in reasonable detail accurately and fairly reflect the transactions and dispositions of the assets of the issuer; |
| 2) | provide reasonable assurance that transactions are recorded as necessary to permit preparation of financial statements in accordance with generally accepted accounting principles and that receipts and expenditures of the issuer are being made only in accordance with authorizations of management and directors of the issuer; and |
| 3) | provide reasonable assurance regarding prevention or timely detection of unauthorized acquisition, use or disposition of the issuer’s assets that could have a material effect on the financial statements. |
There are inherent limitations in the effectiveness of internal control over financial reporting, including the possibility that misstatements may not be prevented or detected. Accordingly, even effective internal controls over financial reporting, no matter how well designed and operated, can provide only reasonable, not absolute, assurance with respect to financial statement preparation. Furthermore, the effectiveness of internal controls can change with circumstances.
Management has assessed the effectiveness of the Company’s internal control over financial reporting as of June 30, 2011 based on the framework set forth by the Committee of Sponsoring Organizations of the Treadway Commission (“COSO”) in Internal Control — Integrated Framework. Based on that assessment, management has concluded that, as of June 30, 2011, the Company’s internal control over financial reporting is effective.
CF & Co., L.L.P., an independent registered public accounting firm, has issued an attestation report on the effective operation of the Company’s internal control over financial reporting as of June 30, 2011. As stated in their report appearing herein, CF & Co., L.L.P. has expressed an unqualified opinion on the effective operation of internal control over financial reporting as of June 30, 2011.
56
Table of Contents

REPORT OF INDEPENDENT REGISTERED PUBLIC ACCOUNTING FIRM
To the Board of Directors and Stockholders of
Epoch Holding Corporation and Subsidiaries:
We have audited the accompanying consolidated balance sheets of Epoch Holding Corporation and Subsidiaries as of June 30, 2011 and 2010, and the related consolidated statements of income, comprehensive income, changes in stockholders’ equity, and cash flows for each of the years in the three-year period ended June 30, 2011. We also have audited Epoch Holding Corporation and Subsidiaries’ internal control over financial reporting as of June 30, 2011, based on criteria established in Internal Control – Integrated Framework issued by the Committee of Sponsoring Organizations of the Treadway Commission (COSO). Epoch Holding Corporation and Subsidiaries’ management is responsible for these financial statements, for maintaining effective internal control over financial reporting, and for its assessment of the effectiveness of internal control over financial reporting, included in the accompanying management report on internal control over financial reporting. Our responsibility is to express an opinion on these financial statements and an opinion on the company’s internal control over financial reporting based on our audits.
We conducted our audits in accordance with the standards of the Public Company Accounting Oversight Board (United States). Those standards require that we plan and perform the audits to obtain reasonable assurance about whether the financial statements are free of material misstatement and whether effective internal control over financial reporting was maintained in all material respects. Our audits of the financial statements included examining, on a test basis, evidence supporting the amounts and disclosures in the financial statements, assessing the accounting principles used and significant estimates made by management, and evaluating the overall financial statement presentation. Our audit of internal control over financial reporting included obtaining an understanding of internal control over financial reporting, assessing the risk that a material weakness exists, and testing and evaluating the design and operating effectiveness of internal control based on the assessed risk. Our audits also included performing such other procedures as we considered necessary in the circumstances. We believe that our audits provide a reasonable basis for our opinions.
A company’s internal control over financial reporting is a process designed to provide reasonable assurance regarding the reliability of financial reporting and the preparation of financial statements for external purposes in accordance with generally accepted accounting principles. A company’s internal control over financial reporting includes those policies and procedures that (1) pertain to the maintenance of records that, in reasonable detail, accurately and fairly reflect the transactions and dispositions of the assets of the company; (2) provide reasonable assurance that transactions are recorded as necessary to permit preparation of financial statements in accordance with generally accepted accounting principles, and that receipts and expenditures of the company are being made only in accordance with authorizations of management and directors of the company; and (3) provide reasonable assurance regarding prevention or timely detection of unauthorized acquisition, use, or disposition of the company’s assets that could have a material effect on the financial statements.
Because of its inherent limitations, internal control over financial reporting may not prevent or detect misstatements. Also, projections of any evaluation of effectiveness to future periods are subject to the risk that controls may become inadequate because of changes in conditions, or that the degree of compliance with the policies or procedures may deteriorate.
In our opinion, the consolidated financial statements referred to above present fairly, in all material respects, the financial position of Epoch Holding Corporation and Subsidiaries as of June 30, 2011 and 2010, and the results of their operations and their cash flows for each of the years in the three-year period ended June 30, 2011, in conformity with accounting principles generally accepted in the United States of America. Also in our opinion, Epoch Holding Corporation and Subsidiaries maintained, in all material respects, effective internal control over financial reporting as of June 30, 2011, based on criteria established in Internal Control – Integrated Framework issued by the Committee of Sponsoring Organizations of the Treadway Commission (COSO).

CF & Co., L.L.P.
Dallas, Texas
September 6, 2011
57
Table of Contents
EPOCH HOLDING CORPORATION AND SUBSIDIARIES
(in thousands, except share data)
| June 30, | ||||||||
| 2011 | 2010 | |||||||
| ASSETS |
||||||||
| Current assets: |
||||||||
| Cash and cash equivalents |
$ | 29,128 | $ | 36,447 | ||||
| Accounts receivable |
17,183 | 11,156 | ||||||
| Deferred income taxes, net - (Note 16) |
2,344 | 861 | ||||||
| Held-to-maturity securities, at amortized cost (fair value of $357) - (Note 5) |
355 | - | ||||||
| Security deposits |
- | 462 | ||||||
| Prepaid and other current assets |
1,034 | 1,011 | ||||||
|
|
|
|
|
|||||
| Total current assets |
50,044 | 49,937 | ||||||
| Held-to-maturity securities, at amortized cost (fair value of $1,651 and $2,046, respectively) - (Note 5) |
1,605 | 2,001 | ||||||
| Other investments, at fair value (cost of $8,360 and $3,856, respectively) - (Note 6) |
8,907 | 3,698 | ||||||
| Deferred income taxes, net - (Note 16) |
8,240 | 4,110 | ||||||
| Property and equipment, net of accumulated depreciation of $3,282 and $2,454, respectively - (Note 8) |
1,580 | 2,187 | ||||||
| Security deposits |
485 | 770 | ||||||
|
|
|
|
|
|||||
| Total assets |
$ | 70,861 | $ | 62,703 | ||||
|
|
|
|
|
|||||
| LIABILITIES AND STOCKHOLDERS’ EQUITY |
||||||||
| Current liabilities: |
||||||||
| Accounts payable and accrued liabilities - (Note 9) |
$ | 1,233 | $ | 929 | ||||
| Accrued compensation and benefits |
6,549 | 5,041 | ||||||
| Subtenant security deposit |
- | 238 | ||||||
| Income taxes payable |
649 | 32 | ||||||
|
|
|
|
|
|||||
| Total current liabilities |
8,431 | 6,240 | ||||||
| Deferred rent |
695 | 848 | ||||||
|
|
|
|
|
|||||
| Total liabilities |
9,126 | 7,088 | ||||||
|
|
|
|
|
|||||
| Commitments and contingencies - (Note 10) |
||||||||
| Stockholders’ equity: |
||||||||
| Common stock, $0.01 par value per share, 60,000,000 shares authorized; 23,944,660 issued and 23,364,644 outstanding at June 30, 2011 and 23,269,262 issued and 22,786,861 outstanding at June 30, 2010, respectively |
239 | 233 | ||||||
| Additional paid-in capital |
64,737 | 56,893 | ||||||
| Retained earnings |
2,041 | 2,668 | ||||||
| Accumulated other comprehensive income/(loss), net of tax |
183 | (223 | ) | |||||
| Less: Treasury stock, at cost, 580,016 and 482,401 shares, respectively - (Note 11) |
(5,465 | ) | (3,956 | ) | ||||
|
|
|
|
|
|||||
| Total stockholders’ equity |
61,735 | 55,615 | ||||||
|
|
|
|
|
|||||
| Total liabilities and stockholders’ equity |
$ | 70,861 | $ | 62,703 | ||||
|
|
|
|
|
|||||
The accompanying notes are an integral part of these consolidated financial statements.
58
Table of Contents
EPOCH HOLDING CORPORATION AND SUBSIDIARIES
CONSOLIDATED STATEMENTS OF INCOME
(in thousands, except per share data)
| For the Year Ended June 30, | ||||||||||||
| 2011 | 2010 | 2009 | ||||||||||
| Operating Revenues: |
||||||||||||
| Investment advisory and management fees |
$ | 68,788 | $ | 52,546 | $ | 30,561 | ||||||
| Performance fees |
1,811 | 814 | 624 | |||||||||
|
|
|
|
|
|
|
|||||||
| Total operating revenues |
70,599 | 53,360 | 31,185 | |||||||||
|
|
|
|
|
|
|
|||||||
| Operating Expenses: |
||||||||||||
| Employee compensation and benefits |
30,851 | 25,912 | 20,415 | |||||||||
| Occupancy and technology |
4,310 | 4,374 | 3,458 | |||||||||
| Professional fees and services |
3,540 | 2,839 | 2,211 | |||||||||
| General and administrative |
3,141 | 2,079 | 1,653 | |||||||||
|
|
|
|
|
|
|
|||||||
| Total operating expenses |
41,842 | 35,204 | 27,737 | |||||||||
|
|
|
|
|
|
|
|||||||
| Operating Income |
28,757 | 18,156 | 3,448 | |||||||||
|
|
|
|
|
|
|
|||||||
| Other Income: |
||||||||||||
| Net realized gains on investments - (Note 15) |
327 | 187 | 4,084 | |||||||||
| Interest and other income |
368 | 783 | 1,026 | |||||||||
|
|
|
|
|
|
|
|||||||
| Total other income |
695 | 970 | 5,110 | |||||||||
|
|
|
|
|
|
|
|||||||
| Income Before Income Taxes |
29,452 | 19,126 | 8,558 | |||||||||
|
|
|
|
|
|
|
|||||||
| Provision for income taxes - (Note 16) |
12,850 | 8,016 | 3,100 | |||||||||
| Income tax benefit from release of valuation allowance - (Note 16) |
(4,964 | ) | (535 | ) | (402 | ) | ||||||
|
|
|
|
|
|
|
|||||||
| Total provision for income taxes |
7,886 | 7,481 | 2,698 | |||||||||
|
|
|
|
|
|
|
|||||||
| Net Income |
$ | 21,566 | $ | 11,645 | $ | 5,860 | ||||||
|
|
|
|
|
|
|
|||||||
| Earnings Per Share: - (Note 17) |
||||||||||||
| Basic |
$ | 0.94 | $ | 0.52 | $ | 0.26 | ||||||
|
|
|
|
|
|
|
|||||||
| Diluted |
$ | 0.93 | $ | 0.52 | $ | 0.26 | ||||||
|
|
|
|
|
|
|
|||||||
| Cash dividends declared and paid per share - (Note 20) |
$ | 0.97 | $ | 0.46 | $ | 0.24 | ||||||
|
|
|
|
|
|
|
|||||||
The accompanying notes are an integral part of these consolidated financial statements.
59
Table of Contents
EPOCH HOLDING CORPORATION AND SUBSIDIARIES
CONSOLIDATED STATEMENTS OF COMPREHENSIVE INCOME
(in thousands)
| For the Year Ended June 30, | ||||||||||||
| 2011 | 2010 | 2009 | ||||||||||
| Net income |
$ | 21,566 | $ | 11,645 | $ | 5,860 | ||||||
|
|
|
|
|
|
|
|||||||
| Other comprehensive income/(loss), net of tax - (Note 18) |
||||||||||||
| Net unrealized gains/(losses) on available-for-sale securities |
591 | 199 | (915 | ) | ||||||||
| Reclassification for net (gains)/losses included in net income |
(185 | ) | (115 | ) | 836 | |||||||
|
|
|
|
|
|
|
|||||||
| Other comprehensive income/(loss), net of tax |
406 | 84 | (79 | ) | ||||||||
|
|
|
|
|
|
|
|||||||
| Comprehensive income |
$ | 21,972 | $ | 11,729 | $ | 5,781 | ||||||
|
|
|
|
|
|
|
|||||||
The accompanying notes are an integral part of these consolidated financial statements.
60
Table of Contents
EPOCH HOLDING CORPORATION AND SUBSIDIARIES
CONSOLIDATED STATEMENTS OF CHANGES IN STOCKHOLDERS’ EQUITY
FOR THE YEARS ENDED JUNE 30, 2011, 2010 AND 2009
(dollars and shares in thousands)
| Preferred Stock Series A Convertible |
Common Stock | Additional Paid-in Capital |
Retained Earnings |
Accumulated Other Comprehensive Income/(Loss) |
Treasury Stock |
Total Stockholders’ Equity |
||||||||||||||||||||||||||||||||||
| Shares | Amount | Shares | Amount | Shares | Amount | |||||||||||||||||||||||||||||||||||
| Balances at June 30, 2008 |
10 | $ | 10 | 20,290 | $ | 203 | $ | 44,745 | $ | 698 | $ | (228 | ) | 9 | $ | (83 | ) | $ | 45,345 | |||||||||||||||||||||
| Net income |
- | - | - | - | - | 5,860 | - | - | - | 5,860 | ||||||||||||||||||||||||||||||
| Other comprehensive loss - (Note 18) |
- | - | - | - | - | - | (79 | ) | - | - | (79 | ) | ||||||||||||||||||||||||||||
| Issuance and forfeitures of restricted share awards |
- | - | 536 | 5 | 295 | - | - | - | - | 300 | ||||||||||||||||||||||||||||||
| Amortization of share-based compensation |
- | - | - | - | 4,196 | - | - | - | - | 4,196 | ||||||||||||||||||||||||||||||
| Conversion of preferred stock - (Note 12) |
(10 | ) | (10 | ) | 1,667 | 17 | (7 | ) | - | - | - | - | - | |||||||||||||||||||||||||||
| Common stock dividends - (Note 20) |
- | - | - | - | - | (5,302 | ) | - | - | - | (5,302 | ) | ||||||||||||||||||||||||||||
| Income tax benefit from dividends paid on unvested shares |
- | - | - | - | 112 | - | - | - | - | 112 | ||||||||||||||||||||||||||||||
| Net sales/purchases of shares for employee withholding |
- | - | (31 | ) | - | (203 | ) | - | - | 31 | (207 | ) | (410 | ) | ||||||||||||||||||||||||||
| Repurchase of common shares |
- | - | (264 | ) | - | - | - | - | 264 | (1,942 | ) | (1,942 | ) | |||||||||||||||||||||||||||
| Excess income tax benefit from share-based compensation |
- | - | - | - | 1,710 | - | - | - | - | 1,710 | ||||||||||||||||||||||||||||||
|
|
|
|
|
|
|
|
|
|
|
|
|
|
|
|
|
|
|
|
|
|||||||||||||||||||||
| Balances at June 30, 2009 |
- | - | 22,198 | 225 | 50,848 | 1,256 | (307 | ) | 304 | (2,232 | ) | 49,790 | ||||||||||||||||||||||||||||
| Net income |
- | - | - | - | - | 11,645 | - | - | - | 11,645 | ||||||||||||||||||||||||||||||
| Other comprehensive income - (Note 18) |
- | - | - | - | - | - | 84 | - | - | 84 | ||||||||||||||||||||||||||||||
| Issuance and forfeitures of restricted share awards |
- | - | 702 | 7 | 821 | - | - | - | - | 828 | ||||||||||||||||||||||||||||||
| Amortization of share-based compensation |
- | - | - | - | 4,309 | - | - | - | - | 4,309 | ||||||||||||||||||||||||||||||
| Common stock dividends - (Note 20) |
- | - | - | - | - | (10,233 | ) | - | - | - | (10,233 | ) | ||||||||||||||||||||||||||||
| Income tax benefit from dividends paid on unvested shares |
- | - | - | - | 174 | - | - | - | - | 174 | ||||||||||||||||||||||||||||||
| Exercise of stock options |
- | - | 65 | 1 | 277 | - | - | - | - | 278 | ||||||||||||||||||||||||||||||
| Net sales/purchases of shares for employee withholding |
- | - | 31 | - | 25 | - | - | (31 | ) | 207 | 232 | |||||||||||||||||||||||||||||
| Repurchase of common shares |
- | - | (209 | ) | - | - | - | - | 209 | (1,931 | ) | (1,931 | ) | |||||||||||||||||||||||||||
| Excess income tax benefit from share-based compensation |
- | - | - | - | 439 | - | - | - | - | 439 | ||||||||||||||||||||||||||||||
|
|
|
|
|
|
|
|
|
|
|
|
|
|
|
|
|
|
|
|
|
|||||||||||||||||||||
| Balances at June 30, 2010 |
- | - | 22,787 | 233 | 56,893 | 2,668 | (223 | ) | 482 | (3,956 | ) | 55,615 | ||||||||||||||||||||||||||||
| Net income |
- | - | - | - | - | 21,566 | - | - | - | 21,566 | ||||||||||||||||||||||||||||||
| Other comprehensive income - (Note 18) |
- | - | - | - | - | - | 406 | - | - | 406 | ||||||||||||||||||||||||||||||
| Issuance and forfeitures of restricted share awards |
- | - | 567 | 5 | 912 | - | - | - | - | 917 | ||||||||||||||||||||||||||||||
| Amortization of share-based compensation |
- | - | - | - | 5,391 | - | - | - | - | 5,391 | ||||||||||||||||||||||||||||||
| Common stock dividends - (Note 20) |
- | - | - | - | - | (22,193 | ) | - | - | - | (22,193 | ) | ||||||||||||||||||||||||||||
| Income tax benefit from dividends paid on unvested shares |
- | - | - | - | 466 | - | - | - | - | 466 | ||||||||||||||||||||||||||||||
| Exercise of stock options |
- | - | 108 | 1 | 668 | - | - | - | - | 669 | ||||||||||||||||||||||||||||||
| Net sales/purchases of shares for employee withholding |
- | - | - | - | 97 | - | - | - | - | 97 | ||||||||||||||||||||||||||||||
| Repurchase of common shares |
- | - | (98 | ) | - | - | - | - | 98 | (1,509 | ) | (1,509 | ) | |||||||||||||||||||||||||||
| Excess income tax benefit from share-based compensation |
- | - | - | - | 310 | - | - | - | - | 310 | ||||||||||||||||||||||||||||||
|
|
|
|
|
|
|
|
|
|
|
|
|
|
|
|
|
|
|
|
|
|||||||||||||||||||||
| Balances at June 30, 2011 |
- | $ | - | 23,364 | $ | 239 | $ | 64,737 | $ | 2,041 | $ | 183 | 580 | $ | (5,465 | ) | $ | 61,735 | ||||||||||||||||||||||
|
|
|
|
|
|
|
|
|
|
|
|
|
|
|
|
|
|
|
|
|
|||||||||||||||||||||
The accompanying notes are an integral part of these consolidated financial statements.
61
Table of Contents
EPOCH HOLDING CORPORATION AND SUBSIDIARIES
CONSOLIDATED STATEMENTS OF CASH FLOWS
(in thousands)
| For the Year Ended June 30, | ||||||||||||
| 2011 | 2010 | 2009 | ||||||||||
| Cash flows from operating activities: |
||||||||||||
| Net income |
$ | 21,566 | $ | 11,645 | $ | 5,860 | ||||||
| Adjustments to reconcile net income to net cash provided by operating activities: |
||||||||||||
| Benefit from deferred income taxes - (Note 16) |
(5,912 | ) | (1,300 | ) | (622 | ) | ||||||
| Share-based compensation |
6,308 | 5,137 | 4,496 | |||||||||
| Depreciation and amortization |
828 | 651 | 434 | |||||||||
| Net realized gains on investments |
(327 | ) | (187 | ) | (3,889 | ) | ||||||
| Equity in net (income)/loss from limited liability company |
(97 | ) | (38 | ) | 90 | |||||||
| Amortization of bond premiums |
41 | 34 | - | |||||||||
| Income tax benefit from dividends paid on unvested shares |
(466 | ) | (174 | ) | (112 | ) | ||||||
| Excess income tax benefit from share-based compensation |
(310 | ) | (439 | ) | (1,710 | ) | ||||||
| (Increase)/decrease in operating assets: |
||||||||||||
| Accounts receivable |
(6,027 | ) | (3,633 | ) | (1,132 | ) | ||||||
| Prepaid and other current assets |
(23 | ) | 35 | (591 | ) | |||||||
| Increase/(decrease) in operating liabilities: |
||||||||||||
| Accounts payable and accrued liabilities |
304 | 293 | (248 | ) | ||||||||
| Accrued compensation and benefits |
1,508 | 1,468 | (2,057 | ) | ||||||||
| Income taxes payable |
1,393 | 599 | 421 | |||||||||
| Deferred rent |
(153 | ) | 120 | (85 | ) | |||||||
|
|
|
|
|
|
|
|||||||
| Net cash provided by operating activities |
18,633 | 14,211 | 855 | |||||||||
|
|
|
|
|
|
|
|||||||
| Cash flows from investing activities: |
||||||||||||
| Investments in Company-sponsored products and other investments, net |
(4,080 | ) | (78 | ) | (311 | ) | ||||||
| Capital expenditures |
(221 | ) | (1,563 | ) | (20 | ) | ||||||
| Security deposits, net |
509 | (109 | ) | (11 | ) | |||||||
| Purchases of held-to-maturity securities |
- | (2,434 | ) | - | ||||||||
| Proceeds from redemption of held-to-maturity securities |
- | 400 | - | |||||||||
| Proceeds from other transactions |
- | 6 | 4,938 | |||||||||
|
|
|
|
|
|
|
|||||||
| Net cash (used in)/provided by investing activities |
(3,792 | ) | (3,778 | ) | 4,596 | |||||||
|
|
|
|
|
|
|
|||||||
| Cash flows from financing activities: |
||||||||||||
| Cash dividends on common stock |
(22,193 | ) | (10,233 | ) | (5,302 | ) | ||||||
| Repurchase of common shares, net |
(1,509 | ) | (1,724 | ) | (2,149 | ) | ||||||
| Income tax benefit from dividends paid on unvested shares |
466 | 174 | 112 | |||||||||
| Excess income tax benefit from share-based compensation |
310 | 439 | 1,710 | |||||||||
| Proceeds from stock option exercises |
669 | 278 | - | |||||||||
| Net gain/(loss) on sale of shares for employee withholding |
97 | 25 | (203 | ) | ||||||||
|
|
|
|
|
|
|
|||||||
| Net cash used in financing activities |
(22,160 | ) | (11,041 | ) | (5,832 | ) | ||||||
|
|
|
|
|
|
|
|||||||
| Net decrease in cash and cash equivalents during year |
(7,319 | ) | (608 | ) | (381 | ) | ||||||
| Cash and cash equivalents at beginning of year |
36,447 | 37,055 | 37,436 | |||||||||
|
|
|
|
|
|
|
|||||||
| Cash and cash equivalents at end of year |
$ | 29,128 | $ | 36,447 | $ | 37,055 | ||||||
|
|
|
|
|
|
|
|||||||
| Supplemental disclosure of cash flow information: |
||||||||||||
| Cash paid for income taxes |
$ | 12,300 | $ | 7,827 | $ | 3,361 | ||||||
|
|
|
|
|
|
|
|||||||
| Supplemental disclosures of non-cash investing activities: |
||||||||||||
| Net change in unrealized gains/(losses) on available-for-sale securities, net of tax |
$ | 406 | $ | 84 | $ | (79 | ) | |||||
|
|
|
|
|
|
|
|||||||
The accompanying notes are an integral part of these consolidated financial statements.
62
Table of Contents
EPOCH HOLDING CORPORATION AND SUBSIDIARIES
NOTES TO CONSOLIDATED FINANCIAL STATEMENTS
Note 1 — Organization and Basis of Presentation
Organization
Epoch Holding Corporation (“Epoch” or the “Company”), a Delaware corporation, is a holding company whose sole line of business is investment advisory and investment management services. The operations of the Company are conducted through its wholly-owned subsidiary, Epoch Investment Partners, Inc. (“EIP”). EIP is a registered investment adviser under the Investment Advisers Act of 1940, as amended. EIP provides investment advisory and investment management services to clients including corporations, mutual funds, retirement plans, public pension funds, endowments, foundations, financial institutions and high net worth individuals. Headquartered in New York City, the Company’s current investment strategies include U.S. Value, U.S. All Cap Value, Global Equity Shareholder Yield, Global Absolute Return, Global Choice, U.S. Choice, U.S. Smid Cap (small/mid) Value, International Small Cap, U.S. Small Cap Value, Global Small Cap, and Balanced.
Basis of Presentation and Principles of Consolidation
The accompanying consolidated financial statements have been prepared in accordance with accounting principles generally accepted in the United States (“GAAP”) and include the accounts of the Company and its subsidiaries. All material intercompany accounts and transactions have been eliminated in consolidation.
Reclassifications
Certain items previously reported have been reclassified to conform to the current year presentation. Specifically, in the Consolidated Statements of Income, prior year amounts related to share-based compensation have been reclassified and combined with employee compensation and benefits, and depreciation expense has been combined and presented as part of occupancy and technology expenses. Additionally, prior year amounts for the income tax benefit from the release of valuation allowances on certain deferred tax assets are now shown as a separate component of the provision for income taxes. Such reclassifications had no impact on net income.
Unless specifically stated otherwise, references to FY 2011, FY 2010 and FY 2009 refer to the fiscal years ended June 30, 2011, June 30, 2010, and June 30, 2009, respectively.
Note 2 — Summary of Significant Accounting Policies
Accounts Receivable
Accounts receivable represent balances arising from investment advisory agreements. The Company’s accounts receivable balances do not include an allowance for doubtful accounts for the periods presented and there have been no bad debt expenses recognized during the fiscal years ended June 30, 2011, 2010 and 2009. Management believes these receivables are fully collectible.
Held-to-Maturity Securities and Other Investments
Held-to-Maturity Securities
The Company holds high-grade debt securities. Since management has the intent and ability to hold these securities until they mature, these investments have been accounted for as held-to-maturity investments. The investments are carried at amortized cost. Premiums and discounts on investments in debt securities are amortized over the contractual lives of these securities. The method of amortization results in a constant effective yield on these securities. Interest on debt securities is recognized in other income in the Consolidated Statements of Income.
63
Table of Contents
EPOCH HOLDING CORPORATION AND SUBSIDIARIES
NOTES TO CONSOLIDATED FINANCIAL STATEMENTS (Continued)
Other Investments
The Company holds investments in four Company co-branded mutual funds – the MainStay Epoch Global Equity Yield Fund (“EPSYX”), the MainStay Epoch Global Choice Fund (“EPACX”), the MainStay Epoch International Small Cap Fund (“EPIEX”), and the MainStay Epoch U.S. Equity Fund (“EPLCX”). The Company also holds investments in the Epoch Global Absolute Return Fund, LLC, in a separate account of Epoch’s Global All Cap strategy as well as an investment in a non-affiliated investment limited partnership. The Company intends to hold these investments for a period in excess of one year.
The investments in the Company’s co-branded mutual funds, the separate account of Epoch’s Global All Cap strategy, and the investment in the non-affiliated investment limited partnership are accounted for as available-for-sale securities. Any resulting change in market value is recorded as unrealized gain or loss, net of tax, in accumulated other comprehensive income/(loss), a separate component of stockholders’ equity. Realized gains and losses from the available-for-sale securities are included in other income in the Consolidated Statements of Income using the specific identification method.
EIP is also the managing member of the Epoch Global Absolute Return Fund, LLC, whose underlying assets consist of marketable securities. The Company’s investment in this entity is accounted for using the equity method, under which EIP’s share of the net earnings or losses from the limited liability company is reported in other income in the Consolidated Statements of Income as earned and any distributions are reflected as reductions from the investment.
Impairments
The Company periodically reviews the carrying value of its investments for impairment by evaluating the nature, duration and extent of any decline in fair value. If the decline in value is determined to be other-than-temporary, the carrying value of the investment is written down to fair value through earnings. No impairment charges have been recognized during the years presented.
Financial Instruments that Approximate Fair Value
Cash and Cash Equivalents
Cash consists of amounts held in checking and money market accounts. Cash equivalents include highly liquid investments in money market funds consisting of short-term securities of the U.S. government and its agencies with maturities of three months or less when acquired. Cash equivalents are stated at cost, which approximates fair value due to their short maturity.
Security Deposits
Security deposits are funds held in certificates of deposit as required by the lessors of the Company’s leased and subleased office premises. These investments mature, and are renewed, in one-year intervals, and accordingly are valued at cost plus accrued interest, which approximates fair value.
Property and Equipment
The costs of leasehold improvements are capitalized and such costs are amortized on a straight-line basis over the shorter of their estimated useful lives or lease terms, excluding option periods if any, as applicable. All other capital assets are recorded at cost and such costs are depreciated on a straight-line basis over their estimated useful lives. Useful lives are periodically evaluated to determine whether events or circumstances have occurred which would indicate the need for revision.
Repairs and maintenance costs are charged to expense as incurred. Upon sale or disposition of property and equipment, the cost and related accumulated depreciation amounts are removed from the accounts and any resulting gain or loss is recognized.
64
Table of Contents
EPOCH HOLDING CORPORATION AND SUBSIDIARIES
NOTES TO CONSOLIDATED FINANCIAL STATEMENTS (Continued)
Depreciable assets are evaluated for impairment when significant events or changes in circumstances indicate the carrying amount may not be recoverable. There have been no impairments of property and equipment for any of the periods presented.
Treasury Stock
The Company may repurchase its common stock from time to time under an established Share Repurchase Program (see Note 11). Treasury stock is accounted for under the cost method and is included as a deduction from equity in the stockholders’ equity section of the Consolidated Balance Sheets. Upon any subsequent resale, the treasury stock account is reduced by the cost of such stock using the specific identification method.
Revenue Recognition
Investment Advisory and Management Fees
Investment advisory and management fees are recognized as services are provided, pursuant to specific terms contained in advisory or sub-advisory agreements between EIP and its clients. Such agreements call for revenue to be determined as a percentage of assets under management (“AUM”). Separate account fees are billed on a quarterly basis, in arrears, generally based on the account’s asset value at the end of the quarter. Fees for services performed for mutual funds under advisory and sub-advisory agreements are calculated based upon the daily net asset values of the respective fund, and are generally received in arrears. Advance payments, if received, are deferred and recognized during the periods for which services are provided.
Performance Fees
The Company also has certain agreements which allow it to earn performance fees in the event that investment returns meet or exceed targeted amounts specified in the agreements. The Company follows the preferred method of accounting identified in the Revenue Recognition Topic of the Financial Accounting Standards Board Accounting Standards Codification (“FASB ASC”). Revenues for these incentives are recognized only when such performance targets are met or exceeded at the end of the measurement period. Due to the inability to forecast financial markets, no revenues are recognized until the measurement period ends, even when investment returns are exceeding the targets within the measurement period.
Share-Based Compensation
The Company has issued restricted stock to both employees and directors of the Company, and issued options to purchase shares of stock to employees of the Company, in accordance with the Amended and Restated 2004 Omnibus Long-Term Incentive Compensation Plan. Share-based compensation costs are charged against income ratably over the requisite service period for the related equity award.
Share-based awards are accounted for using the fair value method. The fair value of the Company’s restricted stock awards is based on the closing price of the Company’s common stock at the grant date. The fair value of stock option awards is based upon the Black-Scholes option-pricing model. Implementation of the Black-Scholes option-pricing model requires the Company to make certain assumptions, including expected volatility, risk-free interest rate, expected dividend yield and expected life of the options. The Company utilizes assumptions that it believes to be most appropriate at the time of the valuation. The Company has historically issued new shares to satisfy the option rights upon exercise.
Leases
Rentals under operating leases, where the lessor retains substantially all the risks and benefits of ownership of the asset, are charged evenly to expense over the respective lease term. Benefits received and receivable, as an incentive to enter into an operating lease, are also spread evenly over the respective lease term.
65
Table of Contents
EPOCH HOLDING CORPORATION AND SUBSIDIARIES
NOTES TO CONSOLIDATED FINANCIAL STATEMENTS (Continued)
Income Taxes
Deferred tax assets and liabilities arising from temporary differences between book and tax basis are recognized using the enacted statutory tax rates and laws that will be in effect when such differences are expected to reverse. Deferred tax assets are recognized for temporary differences that will result in deductible amounts in future years. Deferred tax liabilities are recognized for temporary differences that will result in taxable income in future years.
Deferred tax assets are reduced by a valuation allowance if it is more likely than not that some portion or all of the deferred tax assets will not be realized. The future realization of the Company’s deferred tax assets depends upon the availability of sufficient future taxable income. In making this determination, the Company considers all available positive and negative evidence. The Company considers, among other things, the overall business environment, the Company’s historical earnings and industry outlook.
The Company accounts for any uncertain tax position, should one arise, by reporting a liability for an unrecognized tax benefit resulting from an uncertain tax position taken or expected to be taken in a tax return. Any potential interest and penalty associated with a tax contingency, should one arise, would be included as a component of income tax expense in the period in which the assessment arises. The Company did not have any uncertain tax positions for any of the years presented.
Excess income tax benefits and shortfalls related to share-based compensation are recognized as additional paid-in capital. If the Company does not have additional paid-in capital credits (cumulative tax benefits recorded to additional paid-in capital), the Company will record an expense for any deficit between recorded tax benefits and the tax return benefit. At June 30, 2011, the Company had sufficient excess additional paid-in capital credits to absorb potential deficits between recorded tax benefits and tax return benefits (see Note 16).
Earnings Per Common Share
Basic earnings per share (“EPS”) is calculated by dividing net earnings applicable to common shareholders by the weighted-average number of common shares outstanding during the period. Diluted EPS includes the determinants of basic EPS and, in addition, reflects the dilutive effect, if any, of the common stock deliverable pursuant to stock options.
Accumulated Other Comprehensive Income/(Loss)
The Company’s accumulated other comprehensive income/(loss), net of tax, a separate component of stockholders’ equity, consists of changes in unrealized gains and losses on certain investments classified as available-for-sale and reclassification adjustments for realized gains/losses on those investment securities classified as available-for-sale.
Dividends to Shareholders
Dividends to shareholders are recognized on the declaration date. Dividends are declared and paid on a quarterly basis. The Company has also, from time to time, declared a special dividend during the year. The Company may change its dividend policy at any time.
Business Segments
The Company’s management directs its operations and reviews financial performance as one business, investment management. As such, the Company operates in one business segment as defined in FASB ASC 280-10, Segment Reporting.
66
Table of Contents
EPOCH HOLDING CORPORATION AND SUBSIDIARIES
NOTES TO CONSOLIDATED FINANCIAL STATEMENTS (Continued)
Use of Estimates
The preparation of financial statements in conformity with GAAP requires management to make certain estimates and assumptions. These estimates and assumptions impact the reported amounts of assets and liabilities and disclosures of contingent assets and liabilities as of the dates of these consolidated financial statements and the reported amounts of revenue and expenses during the reporting periods. Actual results could differ from these estimates. The Company’s significant estimates relate to income taxes, incentive compensation and share-based compensation.
Recently Issued Accounting Standards
Presentation of Comprehensive Income
In June 2011, the Financial Accounting Standards Board (“FASB”) issued Accounting Standards Update (“ASU”) No. 2011-05, Presentation of Comprehensive Income. FASB ASU No. 2011-05 amends existing guidance by allowing two options for presenting the components of net income and other comprehensive income: (1) in a single continuous financial statement: a statement of income and other comprehensive income or (2) in two separate but consecutive financial statements, consisting of an income statement followed by a separate statement of other comprehensive income. Also, items that are reclassified from other comprehensive income to net income must be presented on the face of the financial statements. ASU No. 2011-05 requires retrospective application, and it is effective for fiscal years, and interim periods within those years, beginning after December 15, 2011, with early adoption permitted. The Company early adopted the provisions of ASU No. 2011-05 during the quarter ended June 30, 2011, choosing to include a separate statement of comprehensive income. The adoption of this standard did not have an impact on the Company’s consolidated financial position, results of operations, or cash flows.
Fair Value
In May 2011, FASB issued ASU No. 2011-04, Fair Value Measurement (Topic 820): Amendments to Achieve Common Fair Value Measurement and Disclosure Requirements in U.S. GAAP and IFRS. ASU No. 2011-04 generally provides a uniform framework for fair value measurements and related disclosures between U.S. GAAP and International Financial Reporting Standards (“IFRS”). Additional disclosure requirements in the update include, among other things, the disclosure of all transfers between Level 1 and Level 2 of the fair value hierarchy. ASU No. 2011-04 will be effective for the interim and annual periods beginning on or after December 15, 2011. The Company does not expect the adoption of this standard to have a material impact on its consolidated financial position, results of operations, or cash flows.
Note 3 — Financial Instruments with Concentration of Credit Risk
The financial instruments that potentially subject the Company to concentrations of credit risk consist principally of cash, cash equivalents, held-to-maturity investments and other investments. Epoch invests its cash and cash equivalents with high-credit quality financial institutions in amounts, which, at times, may be in excess of the Federal Deposit Insurance Corporation insurance limits. Due to the high quality of the Company’s cash equivalents, held-to-maturity investments and other investments, the Company has not experienced any credit losses related to these to date. The Company has not had any off-balance sheet arrangements for any of the years presented.
Note 4 — Concentration Risks
The Company’s client base consists of a large number of geographically diverse clients across many industries. For the fiscal year ended June 30, 2011, New York Life Investment Management, through the MainStay Epoch Funds and other funds sub-advised by EIP (see Note 10, Strategic Relationship), accounted for approximately 19% of consolidated operating revenues. During the previous year ended June 30, 2010, New York Life Investment Management accounted for approximately 16% of consolidated operating revenues.
67
Table of Contents
EPOCH HOLDING CORPORATION AND SUBSIDIARIES
NOTES TO CONSOLIDATED FINANCIAL STATEMENTS (Continued)
Note 5 — Held-to-Maturity Securities
The Company’s investment securities classified as held-to-maturity consist of high-grade debt securities. These investments are carried at amortized cost. Gross unrealized gains and losses, and fair value of these securities at June 30, 2011 and June 30, 2010 are as follows (in thousands):
| June 30, 2011 | June 30, 2010 | |||||||||||||||||||||||||||||||
| Amortized Cost |
Gross Unrecognized |
Aggregate Fair Value |
Amortized Cost |
Gross Unrecognized |
Aggregate Fair Value |
|||||||||||||||||||||||||||
| Gains | Losses | Gains | Losses | |||||||||||||||||||||||||||||
| Current |
$ | 355 | $ | 2 | $ | - | $ | 357 | $ | - | $ | - | $ | - | $ | - | ||||||||||||||||
| Long-Term |
1,605 | 46 | - | 1,651 | 2,001 | 45 | - | 2,046 | ||||||||||||||||||||||||
|
|
|
|
|
|
|
|
|
|
|
|
|
|
|
|
|
|||||||||||||||||
| $ | 1,960 | $ | 48 | $ | - | $ | 2,008 | $ | 2,001 | $ | 45 | $ | - | $ | 2,046 | |||||||||||||||||
|
|
|
|
|
|
|
|
|
|
|
|
|
|
|
|
|
|||||||||||||||||
The fair value of investments in held-to-maturity securities is valued under the market approach through the use of quoted prices for similar investments in active markets.
During the fiscal year ended June 30, 2010, a $0.4 million security was called by the issuer, at cost. As such, no gain or loss was recognized.
The contractual maturities of the investment securities classified as held-to-maturity at June 30, 2011 are as follows (in thousands):
| Contractual Maturities |
Amortized Cost |
Aggregate Fair Value |
Weighted- Average Interest Rate |
|||||||||
| Less than 1 year |
$ | 355 | $ | 357 | 1.67 | % | ||||||
| Due after 1 year through 3 years |
1,605 | 1,651 | 2.31 | % | ||||||||
|
|
|
|
|
|
|
|||||||
| Total |
$ | 1,960 | $ | 2,008 | 2.19 | % | ||||||
|
|
|
|
|
|
|
|||||||
68
Table of Contents
EPOCH HOLDING CORPORATION AND SUBSIDIARIES
NOTES TO CONSOLIDATED FINANCIAL STATEMENTS (Continued)
Note 6 — Other Investments
The Company’s other investments at June 30, 2011 and 2010 are summarized as follows (in thousands):
| June 30, 2011 | June 30, 2010 | |||||||||||||||||||||||||||||||
| Cost | Gross Unrealized | Fair Value |
Cost | Gross Unrealized | Fair Value |
|||||||||||||||||||||||||||
| Gains | Losses | Gains | Losses | |||||||||||||||||||||||||||||
| Available-for-sale securities: |
||||||||||||||||||||||||||||||||
| Epoch Global All Cap separate account |
$ | 2,652 | $ | 445 | $ | (36 | ) | $ | 3,061 | $ | 2,297 | $ | 185 | $ | (105 | ) | $ | 2,377 | ||||||||||||||
| Investment in limited partnership |
4,000 | 144 | - | 4,144 | - | - | - | - | ||||||||||||||||||||||||
| Company-sponsored mutual funds |
1,185 | 91 | (97 | ) | 1,179 | 1,133 | 34 | (272 | ) | 895 | ||||||||||||||||||||||
|
|
|
|
|
|
|
|
|
|
|
|
|
|
|
|
|
|||||||||||||||||
| Total available-for-sale securities |
7,837 | 680 | (133 | ) | 8,384 | 3,430 | 219 | (377 | ) | 3,272 | ||||||||||||||||||||||
| Equity method investment: |
||||||||||||||||||||||||||||||||
| Epoch Global Absolute Return Fund, LLC |
523 | - | - | 523 | 426 | - | - | 426 | ||||||||||||||||||||||||
|
|
|
|
|
|
|
|
|
|
|
|
|
|
|
|
|
|||||||||||||||||
| Total Other Investments |
$ | 8,360 | $ | 680 | $ | (133 | ) | $ | 8,907 | $ | 3,856 | $ | 219 | $ | (377 | ) | $ | 3,698 | ||||||||||||||
|
|
|
|
|
|
|
|
|
|
|
|
|
|
|
|
|
|||||||||||||||||
The unrealized losses for each fiscal year presented have been unrealized for twelve months or more. Management has reviewed its investment securities for other-than-temporary impairment in accordance with its accounting policy outlined in Note 2. When evaluating whether an unrealized loss on an available-for-sale investment is other-than-temporary, management reviews such factors as extent and duration of the loss, deterioration in the issuer’s credit quality, reduction or cessation of dividend payments, and overall financial strength of the issuer.
Based on management’s assessment, the Company does not believe that the declines are other-than-temporary for all fiscal years presented. The gross unrealized losses from available-for-sale securities were primarily caused by overall weakness in the financial markets and world economy. The securities are expected to recover their value over time and management has the intent and ability to hold these investments until such recovery occurs. Unrealized gains or losses from available-for-sale securities are recorded in accumulated other comprehensive income/(loss), net of tax, as a separate component of stockholders’ equity, until realized.
Proceeds as well as realized gains and losses recognized from investments classified as available-for-sale are as follows (in thousands):
| June 30, 2011 | June 30, 2010 | June 30, 2009 | ||||||||||||||||||||||||||||||||||
| Proceeds | Gross Realized | Proceeds | Gross Realized | Proceeds | Gross Realized | |||||||||||||||||||||||||||||||
| Gains | Losses | Gains | Losses | Gains | Losses | |||||||||||||||||||||||||||||||
| Available-for-sale securities: |
||||||||||||||||||||||||||||||||||||
| Epoch Global All Cap separate account |
$ | 2,782 | $ | 399 | $ | (107 | ) | $ | 3,130 | $ | 357 | $ | (176 | ) | $ | 2,577 | $ | 2 | $ | (850 | ) | |||||||||||||||
| Company-sponsored mutual funds |
36 | 36 | - | 22 | 22 | - | 12 | 12 | - | |||||||||||||||||||||||||||
|
|
|
|
|
|
|
|
|
|
|
|
|
|
|
|
|
|
|
|||||||||||||||||||
| Total available-for-sale securities |
$ | 2,818 | $ | 435 | $ | (107 | ) | $ | 3,152 | $ | 379 | $ | (176 | ) | $ | 2,589 | $ | 14 | $ | (850 | ) | |||||||||||||||
|
|
|
|
|
|
|
|
|
|
|
|
|
|
|
|
|
|
|
|||||||||||||||||||
Realized gains and losses from available-for-sale securities are included in other income in the Consolidated Statements of Income using the specific identification method.
69
Table of Contents
EPOCH HOLDING CORPORATION AND SUBSIDIARIES
NOTES TO CONSOLIDATED FINANCIAL STATEMENTS (Continued)
Note 7 — Fair Value Measurements
Fair value is defined as the price in a transaction to sell an asset or paid to transfer a liability (i.e. the “exit price”) in an orderly transaction between market participants at the measurement date. The Company has established a three-level valuation hierarchy for disclosure of fair value measurements. The valuation hierarchy is based upon the transparency of inputs to the valuation of an asset or liability as of the reported date. The three levels are defined as follows:
| • | Level 1 — unadjusted quoted prices in active markets that are available for identical assets or liabilities as of the reported date. |
| • | Level 2 — quoted prices in markets that are not active or other pricing inputs that are either directly or indirectly observable as of the reported date. |
| • | Level 3 — prices or valuation techniques that are both significant to the fair value measurement and unobservable as of the reported date. These financial instruments do not have active markets and are measured using management’s best estimate of fair value, where the inputs into the determination of fair value require significant management judgment or estimation. |
Assets and liabilities measured and reported at fair value are classified and disclosed in one of the above categories based on the nature of the inputs that are significant to the fair value measurement in its entirety. In certain cases, the inputs used to measure fair value may fall into different levels of the fair value hierarchy. In such cases, an investment’s classification within the fair value hierarchy is based on the lowest level of input that is significant to the fair value measurement.
Other Investments
Other investments consist of investments in Company-sponsored investment vehicles, including mutual funds, an investment strategy separate account, and a limited liability company. Other investments also include an investment in a non-affiliated investment limited partnership.
The investments in the mutual funds and in the separate account are accounted for as available-for-sale investments and valued under the market approach through the use of unadjusted quoted market prices available in an active market and are classified within Level 1 of the valuation hierarchy. The fair market value of these investments at June 30, 2011 was $4.2 million.
During the fiscal year ended June 30, 2011, the Company invested $4.0 million in a non-affiliated investment limited partnership. At June 30, 2011, the Company held less than a 2% ownership interest in this limited partnership. This investment is accounted for as available-for-sale and is valued based upon the Company’s ownership interest in the partnership’s net assets. The value of net assets is based on the underlying assets and liabilities of the partnership, which primarily include exchange-listed common stocks and money market funds. This investment seeks to generate capital appreciation. The Company’s investment may be redeemed as of the end of the partnership’s fiscal year, provided that 30 days prior written notice is given to the general partner. Redemptions may be more frequent at the option of the general partner. There is no lock-up and the Company has no unfunded commitments. The investment limited partnership is classified within Level 2 of the valuation hierarchy. The fair value of this investment at June 30, 2011 was $4.1 million.
70
Table of Contents
EPOCH HOLDING CORPORATION AND SUBSIDIARIES
NOTES TO CONSOLIDATED FINANCIAL STATEMENTS (Continued)
The following table presents, for each of the hierarchy levels previously described, the Company’s assets that are measured at fair value as of June 30, 2011 and 2010, respectively (in thousands):
| June 30, 2011 | June 30, 2010 | |||||||||||||||||||||||||||||||
| Fair Value Measurements |
Level 1 | Level 2 | Level 3 | Fair Value Measurements |
Level 1 | Level 2 | Level 3 | |||||||||||||||||||||||||
| Available-for-sale: |
||||||||||||||||||||||||||||||||
| Epoch Global All Cap separate account |
$ | 3,061 | $ | 3,061 | $ | - | $ | - | $ | 2,377 | $ | 2,377 | $ | - | $ | - | ||||||||||||||||
| Investment in limited partnership |
4,144 | - | 4,144 | - | - | - | - | - | ||||||||||||||||||||||||
| Company-sponsored mutual funds |
1,179 | 1,179 | - | - | 895 | 895 | - | - | ||||||||||||||||||||||||
|
|
|
|
|
|
|
|
|
|
|
|
|
|
|
|
|
|||||||||||||||||
| Total available-for-sale securities |
$ | 8,384 | $ | 4,240 | $ | 4,144 | $ | - | $ | 3,272 | $ | 3,272 | $ | - | $ | - | ||||||||||||||||
|
|
|
|
|
|
|
|
|
|
|
|
|
|
|
|
|
|||||||||||||||||
There were no transfers into or out of the Level 1, 2 and 3 categories in the fair value measurement hierarchy for the fiscal years ended June 30, 2011 and 2010, respectively.
The investment in the limited liability company is accounted for under the equity method, whereby the Company records its percentage share of realized and unrealized earnings or losses in the Consolidated Statement of Income. Consequently, this investment is not recorded at fair value, but approximates fair value. The total carrying value of this investment was $0.5 million at June 30, 2011 and $0.4 million at June 30, 2010.
The Company did not hold any financial liabilities measured at fair value at June 30, 2011 or June 30, 2010.
Note 8 — Property and Equipment
Property and equipment is reported at cost, net of accumulated depreciation and amortization. Depreciation and amortization expense, included in occupancy and technology, totaled $0.8 million, $0.7 million, and $0.4 million for the fiscal years ended June 30, 2011, 2010, and 2009, respectively. The following table reflects the gross and net components of property and equipment as of June 30, 2011 and 2010 (in thousands):
| Estimated
useful lives - in years |
June 30, 2011 | June 30, 2010 | ||||||||||||||||||
| Cost | Net | Cost | Net | |||||||||||||||||
| Leasehold improvements |
3-10 | $ | 3,111 | $ | 1,252 | $ | 3,035 | $ | 1,771 | |||||||||||
| Equipment and office furniture |
3-7 | 1,303 | 261 | 1,169 | 322 | |||||||||||||||
| Purchased software |
1-3 | 448 | 67 | 437 | 94 | |||||||||||||||
|
|
|
|
|
|
|
|
|
|||||||||||||
| Total property and equipment |
$ | 4,862 | $ | 1,580 | $ | 4,641 | $ | 2,187 | ||||||||||||
|
|
|
|
|
|
|
|
|
|||||||||||||
Note 9 — Accounts Payable and Accrued Liabilities
Accounts payable and accrued liabilities consisted of the following (in thousands):
| June 30, | ||||||||
| 2011 | 2010 | |||||||
| Trade accounts payable |
$ | 186 | $ | 215 | ||||
| Accrued professional fees |
177 | 142 | ||||||
| Accrued expenses and other |
870 | 572 | ||||||
|
|
|
|
|
|||||
| Total accounts payable and accrued liabilities |
$ | 1,233 | $ | 929 | ||||
|
|
|
|
|
|||||
71
Table of Contents
EPOCH HOLDING CORPORATION AND SUBSIDIARIES
NOTES TO CONSOLIDATED FINANCIAL STATEMENTS (Continued)
Note 10 — Commitments and Contingencies
Employment Agreements
The Company renewed its employment agreement with its Chief Executive Officer in December 2010, effective January 1, 2011. The term of the agreement is for two years, with automatic two year renewals thereafter. Both the Company and the Chief Executive Officer have the option not to renew the term of the agreement within forty-five days of the end of the term or renewal term. The agreement calls for a minimum base salary of $375 thousand per annum, and bonus compensation in accordance with the Company’s bonus and incentive compensation plans. The agreement also calls for certain payments in the event of termination. The payments could vary depending on the cause of termination and whether or not the Board of Directors elects to enforce a non-compete agreement. The agreement was reviewed and approved by the Company’s Compensation Committee and the Board of Directors.
There are no employment contracts with any other officer or employee of the Company. There are written agreements with certain employees, which provide for sales commissions or bonuses, subject to the attainment of certain performance criteria or continuation of employment. Such commitments under the various agreements total approximately $2.1 million at June 30, 2011. Of this amount, approximately $0.7 million is included in accrued compensation and benefits in the Consolidated Balance Sheet at June 30, 2011. An additional $0.6 million will be accrued during the fiscal year ending June 30, 2012. Approximately $0.8 million represents restricted stock awards to be issued during the fiscal year ending June 30, 2012 and shortly thereafter.
Strategic Relationship
In July 2009, EIP entered into a strategic relationship with New York Life Investments, whereby the MainStay Group of Funds adopted the Company’s family of mutual funds (the “Epoch Funds”). The adoption was completed in November 2009. EIP is responsible for the day-to-day investment management of the funds through a sub-advisory relationship, while MainStay Investments (“MainStay”), the retail distribution arm of New York Life Investments, is responsible for the distribution and administration of the funds. Each former Epoch Fund is now co-branded as a “MainStay Epoch” Fund.
In addition to an existing sub-advisory relationship between EIP and New York Life Investments for certain funds, and the adoption of the Epoch Funds indicated above, EIP and New York Life Investments have entered into an arrangement wherein, among other things, EIP and an affiliate of New York Life Investments have established a distribution and administration relationship with respect to certain separately managed account and unified managed account strategies, and for a period of three years commencing November 2009 New York Life Investments agrees to pay certain additional base fees and meet minimum distribution targets.
Legal Matters
From time to time, the Company or its subsidiaries may become parties to claims, legal actions and complaints arising in the ordinary course of business. Management is not aware of any claims which would have a material effect on its consolidated financial position, results of operations, or cash flows.
Lease Commitments
The Company’s headquarters and operations are located at 640 Fifth Avenue, New York, New York. Business is conducted at a location with approximately 20,000 square feet under long-term leases that expire in September 2015.
The Company was also previously the primary party to another lease in New York City, with approximately 8,500 square feet. A sublease agreement was executed with an unrelated third party for their occupancy of this property. This sublease expired in August 2010. This lease expired in November 2010. The related security deposits were released in fiscal year ended June 30, 2011.
72
Table of Contents
EPOCH HOLDING CORPORATION AND SUBSIDIARIES
NOTES TO CONSOLIDATED FINANCIAL STATEMENTS (Continued)
Rental expenses incurred by the Company were $1.4 million for the fiscal year ended June 30, 2011, while rental expenses for the fiscal years ended June 30, 2010 and 2009 were $1.8 million and $1.4 million, respectively. Rental income under the sublease, net of profit sharing expenses with the primary landlord, was $0.1 million for the fiscal year ended June 30, 2011 and $0.5 million for each of the fiscal years ended June 30, 2010 and 2009.
The following table outlines the minimum annual office lease obligations of the Company (in thousands):
| For the Year Ending June 30, |
Gross | |||
| 2012 |
$ | 1,427 | ||
| 2013 |
1,427 | |||
| 2014 |
1,427 | |||
| 2015 |
1,427 | |||
| 2016 |
357 | |||
| 2017 and thereafter |
- | |||
|
|
|
|||
| Total minimum lease payments |
$ | 6,065 | ||
|
|
|
|||
Note 11 — Treasury Stock
Share Repurchase Plan
As of June 30, 2011, the Company has repurchased a cumulative total of 580,016 shares and has 219,984 shares remaining for repurchase under the existing repurchase plan. The table below presents annual shares repurchased and the weighted-average price per share during the last three fiscal years:
| For the Year Ended June 30, | ||||||||||
| 2011 | 2010 | 2009 | ||||||||
| Shares |
Weighted- |
Shares |
Weighted- |
Shares |
Weighted- | |||||
| 97,615(1) | $15.45 | 209,601 | $9.21 | 263,900 | $7.36 | |||||
| (1) | Includes 81,815 employee relinquished shares to satisfy statutory employee tax withholding requirements. |
| (2) | The weighted-average price per share is calculated on a trade date basis and includes commissions. |
All shares repurchased are shown as treasury stock at cost, in the stockholders’ equity section of the Consolidated Balance Sheets.
Employee Tax Withholding
To satisfy statutory employee tax withholding requirements related to the vesting of common shares, employees may elect to have the Company withhold shares and remit the necessary tax withholding on their behalf. The Company may promptly sell these shares in the open market on behalf of the employee or include them as part of the shares repurchased under the share repurchase plan. Any resulting gain or loss on sale is accounted for as an adjustment to additional paid-in capital. During the year ended June 30, 2011, a total of 100,411 employee relinquished shares were sold in the open market, while 81,815 employee relinquished shares were included as part of the shares repurchased under the share repurchase plan. At June 30, 2011, there were no shares so withheld related to employee tax withholdings.
73
Table of Contents
EPOCH HOLDING CORPORATION AND SUBSIDIARIES
NOTES TO CONSOLIDATED FINANCIAL STATEMENTS (Continued)
Note 12 — Preferred Stock
On November 6, 2006, the Company entered into a Securities Purchase Agreement with General American Investors Company, Inc. (“GAM” or the “Purchaser”), whereby GAM invested $10 million in the Company and the Company issued GAM 10,000 shares of Series A Convertible Preferred Stock (the “Preferred Stock”). These securities were convertible, in whole or in part at any time, into shares of the Company’s common stock at a fixed conversion price of $6.00 per share, or 1,666,667 common shares in total.
On July 1, 2008, GAM converted the Preferred Stock to 1,666,667 shares of Common Stock. Accordingly, the Preferred Stock has been cancelled and the conversion eliminated GAM’s rights to receive semi-annual dividends on the Preferred Stock.
Note 13 — Long-Term Incentive Compensation
The Company has one share-based compensation plan, the Amended and Restated 2004 Omnibus Long-Term Incentive Compensation Plan (the “2004 Plan”), under which awards can be currently issued.
The total compensation cost for share-based payment arrangements was $6.3 million, $5.1 million, and $4.5 million for the fiscal years ended June 30, 2011, 2010, and 2009, respectively. The total income tax benefit from share-based payment arrangements was approximately $2.2 million, $1.8 million, and $1.7 million, for the fiscal years ended June 30, 2011, 2010, and 2009, respectively.
2004 Omnibus Long-Term Incentive Compensation Plan
At the annual meeting of shareholders on November 18, 2004, stockholders approved the 2004 Plan which allowed the Company to issue 3,000,000 shares of common stock subject to stock options, restricted stock awards or other share-based compensation. At the annual meeting of shareholders on December 4, 2008, stockholders approved an amendment to the 2004 Plan to increase the number of shares of common stock available for issuance under the 2004 Plan by 2,500,000 shares. The 2004 Plan terminates at the earliest of (a) the time no shares remain available for issuance under the 2004 Plan, (b) the 2004 Plan is terminated by the Board, or (c) the tenth anniversary of the effective date of the Plan. Awards outstanding upon expiration of the 2004 Plan remain in effect until they have been exercised or terminated, or have expired.
Restricted stock awards issued to employees under the 2004 Plan generally vest at the rate of 12.5% immediately and 12.5%, 25%, and 50% upon the first, second, and third anniversaries, respectively. Restricted stock awards issued to non-employee directors under the 2004 Plan vest fully upon the one year anniversary from the grant date. Stock options issued to employees under the 2004 Plan vest ratably on the first, second, and third anniversaries from the grant date and have a seven year contractual term. Neither employee nor director share awards are subject to performance-based accelerated vesting.
As of June 30, 2011 there were 4,293,585 shares issued under the 2004 Plan. There were 464,023 stock options outstanding and an additional 742,392 shares remain available for issuance under the 2004 Plan.
Restricted Stock Awards
The Company granted 547,050 shares of restricted stock awards to employees during the fiscal year ended June 30, 2011 under the Company’s 2004 Plan at a weighted-average price of $15.46. During the fiscal years ended June 30, 2010 and 2009, a total of 673,484 and 575,066 shares, respectively, were granted at weighted-average prices of $10.20 and $8.17 per share, respectively.
Non-employee directors were awarded $80,000 in total compensation for their services for each of the fiscal years ended June 30, 2011 and 2009, and $60,000 in total compensation for the fiscal year ended June 30, 2010. Such compensation was a minimum of $60,000 in stock for each of the fiscal years ended June 30, 2011 and 2009, and a minimum of $40,000 in stock for the fiscal year ended June 30, 2010, at the election of the director. Total shares granted to non-employee directors for the fiscal year ended June 30, 2011 were 28,994 shares at a weighted-average price of $12.02. Total shares granted to non-employee directors for the fiscal years ended June 30, 2010 and 2009 were 43,459 shares and 38,620 shares, respectively, at weighted-average prices of $8.91 and $9.10, respectively.
74
Table of Contents
EPOCH HOLDING CORPORATION AND SUBSIDIARIES
NOTES TO CONSOLIDATED FINANCIAL STATEMENTS (Continued)
A summary of the Company’s unvested shares under the 2004 Plan as of June 30, 2011, 2010, and 2009, respectively, as well as changes during those years is presented below (shares in thousands):
| For the Year Ended June 30, | ||||||||||||||||||||||||
| 2011 | 2010 | 2009 | ||||||||||||||||||||||
| Shares | Weighted- Average Grant-Date Fair Value |
Shares | Weighted- Average Grant-Date Fair Value |
Shares | Weighted- Average Grant-Date Fair Value |
|||||||||||||||||||
| Unvested at beginning of the year |
1,233 | $ | 9.71 | 1,111 | $ | 8.42 | 1,228 | $ | 7.34 | |||||||||||||||
| Granted under the 2004 Plan |
576 | 15.28 | 717 | 10.13 | 613 | 8.23 | ||||||||||||||||||
| Vested |
(513 | ) | 10.71 | (580 | ) | 7.79 | (653 | ) | 6.13 | |||||||||||||||
| Forfeited |
(9 | ) | 9.68 | (15 | ) | 8.39 | (77 | ) | 9.10 | |||||||||||||||
|
|
|
|
|
|
|
|
|
|
|
|
|
|||||||||||||
| Unvested at end of the year |
1,287 | $ | 11.81 | 1,233 | $ | 9.71 | 1,111 | $ | 8.42 | |||||||||||||||
|
|
|
|
|
|
|
|
|
|
|
|
|
|||||||||||||
As of June 30, 2011, there was $10.4 million of unrecognized compensation costs related to unvested restricted stock awards granted under the 2004 Plan, which is expected to be recognized over a weighted-average period of 2.4 years. The total fair value of restricted stock awards vested during the years ended June 30, 2011, 2010 and 2009 was $7.1 million, $5.3 million and $6.3 million, respectively. The aggregate intrinsic value of unvested shares at June 30, 2011 was $23.0 million. The Company pays dividends on unvested shares.
Stock Option Awards
During the fiscal year ended June 30, 2009, the Company issued nonqualified options to purchase 630,060 shares of common stock to employees of the Company under the 2004 Plan. These stock options vest and are recognized ratably over three years from the grant date and have a term of seven years. The options have an exercise price of $6.17. However, upon vesting, the options are exercisable only if the volume weighted-average price of the Company’s common stock equals or exceeds $9.25 for a period of at least 20 trading days. Issuance of these awards results in total stock compensation expense of approximately $1.1 million over the requisite service period. The weighted-average fair value of stock options granted was $1.82. The fair value of the option grant was estimated on the date of grant using the Black-Scholes option-pricing model using the following assumptions:
| Expected term (years) |
4.0 | |||
| Expected volatility |
50% | |||
| Expected dividend yield |
1.94% | |||
| Risk-free interest rate |
1.59% | |||
| Estimated discount due to restriction on exercise |
15% | |||
| Forfeiture rate |
7.5% |
The expected life and forfeiture rate assumptions were based on the vesting period for each option grant and expected exercise behavior. The assumptions for expected volatility and dividend yield were based on historical experience. Risk-free interest rates were set using grant-date U.S. Treasury yield curves for the same periods as the expected term. No stock options were issued during the fiscal years ended June 30, 2011 and 2010.
Under the 2004 Plan, a total of 108,425 and 44,725 employee stock options were exercised during the fiscal years ended June 30, 2011 and 2010, respectively. The total intrinsic value of options exercised during the years ended June 30, 2011 and 2010 was approximately $1.0 million and $0.4 million, respectively. The income tax benefit for these options was $0.3 million and $0 for the years ended June 30, 2011 and 2010, which differs from the periods exercised due to certain tax deferral rules. No employee stock options were exercised or exercisable during the fiscal year ended June 30, 2009.
75
Table of Contents
EPOCH HOLDING CORPORATION AND SUBSIDIARIES
NOTES TO CONSOLIDATED FINANCIAL STATEMENTS (Continued)
A summary of the Company’s stock options outstanding under the 2004 Plan as of June 30, 2011, 2010 and 2009, respectively, as well as changes during those fiscal years is presented below (options in thousands):
| For the Year Ended June 30, | ||||||||||||||||||||||||
| 2011 | 2010 | 2009 | ||||||||||||||||||||||
| Stock Options |
Weighted- Average Exercise Price |
Stock Options |
Weighted- Average Exercise Price |
Stock Options |
Weighted- Average Exercise Price |
|||||||||||||||||||
| Fixed options: |
||||||||||||||||||||||||
| Outstanding at beginning of period |
572 | $ | 6.17 | 630 | $ | 6.17 | - | $ | - | |||||||||||||||
| Granted |
- | - | - | - | 630 | 6.17 | ||||||||||||||||||
| Exercised |
(108 | ) | 6.17 | (45 | ) | 6.17 | - | - | ||||||||||||||||
| Forfeited |
- | - | (13 | ) | 6.17 | - | - | |||||||||||||||||
|
|
|
|
|
|
|
|
|
|
|
|
|
|||||||||||||
| Outstanding at end of year |
464 | $ | 6.17 | 572 | $ | 6.17 | 630 | $ | 6.17 | |||||||||||||||
|
|
|
|
|
|
|
|
|
|
|
|
|
|||||||||||||
| Options exercisable at end of year |
258 | $ | 6.17 | 152 | $ | 6.17 | - | $ | - | |||||||||||||||
|
|
|
|
|
|
|
|
|
|
|
|
|
|||||||||||||
As of June 30, 2011 there was $0.2 million of unrecognized compensation costs related to the stock options granted under the 2004 Plan, which is expected to be recognized over a weighted-average period of 0.6 years.
The following table summarizes information about the 2004 Plan stock options outstanding and exercisable at June 30, 2011 (options in thousands and intrinsic value in millions):
| Options Outstanding | Options Exercisable | |||||||||||
| Exercise Prices |
Number |
Contractual |
Intrinsic |
Number |
Contractual |
Intrinsic | ||||||
| $6.17 | 464 | 4.59 years | $5.4 | 258 | 4.59 years | $3.0 | ||||||
Total unrecognized compensation costs at June 30, 2011 for awards issued under the 2004 Plan, and weighted-average recognition periods at June 30, 2011 are as follows (dollars in thousands):
| Award |
Unrecognized Compensation Cost |
Weighted- Average Recognition Period |
||||||
| Unvested restricted stock |
$ | 10,408 | 2.4 years | |||||
| Unvested stock options |
209 | 0.6 years | ||||||
|
|
|
|||||||
| Total unrecognized compensation costs |
$ | 10,617 | ||||||
|
|
|
|||||||
Note 14 — Defined Contribution Plan
The Company sponsors a defined contribution plan (the “Plan”) for all of its employees. The Plan qualifies as a deferred salary arrangement under Section 401(k) of the Internal Revenue Code. Under the Plan, participating employees may defer up to 60% of their pre-tax gross wages, subject to annual Internal Revenue Code contribution limits. Employees vest immediately in their contributions. The Plan allows the Company to make discretionary contributions, including profit sharing contributions. The Company made contributions of approximately $0.9 million to the Plan during the fiscal year ended June 30, 2011, which included a profit sharing contribution of $0.7 million. The Company made contributions of $0.1 million in each of the fiscal years ended June 30, 2010 and 2009, respectively. These contributions are included in employee compensation and benefits in the Consolidated Statements of Income. These annual Company contributions vest immediately. The Company intends to contribute to the Plan on an annual basis.
76
Table of Contents
EPOCH HOLDING CORPORATION AND SUBSIDIARIES
NOTES TO CONSOLIDATED FINANCIAL STATEMENTS (Continued)
Note 15 — Other Income
Strategic Data Corporation Transaction
During the fiscal year ended June 30, 2000, J Net Enterprises, Inc. (“JNet”), the predecessor company to Epoch, made an investment in Strategic Data Corp. (“SDC”), a technology-related company that specialized in advertising optimization technology. During the fiscal year ended June 30, 2001, the carrying value of this investment was deemed to be fully impaired by J Net’s management and written down to zero.
In February 2007, SDC’s stockholders approved the acquisition of its stock by Fox Interactive Media, Inc. The SDC merger called for contingent payments, upon the achievement of certain targets and milestones, payable over a period of approximately 3.5 years from the closing date. The merger agreement was subsequently amended during the quarter ended December 31, 2008 to provide for a final settlement of all contingent payments. As such, additional payments totaling $4.7 million were received in December 2008. These payments represented the final contingent payments and are included in net realized gains on investments in the Consolidated Statements of Income for the fiscal year ended June 30, 2009.
Note 16 — Provision for Income Taxes
The components of the provision for income taxes are as follows (in thousands):
| For the Year Ended June 30, | ||||||||||||
| 2011 | 2010 | 2009 | ||||||||||
| Current income tax expense: |
||||||||||||
| Federal |
$ | 9,694 | $ | 6,102 | $ | 2,951 | ||||||
| State and local |
4,104 | 2,679 | 369 | |||||||||
|
|
|
|
|
|
|
|||||||
| Total current income tax expense |
13,798 | 8,781 | 3,320 | |||||||||
|
|
|
|
|
|
|
|||||||
| Deferred income tax benefit: |
||||||||||||
| Federal |
(4,601 | ) | (809 | ) | (504 | ) | ||||||
| State and local |
(1,311 | ) | (491 | ) | (118 | ) | ||||||
|
|
|
|
|
|
|
|||||||
| Total deferred income tax benefit: |
(5,912 | ) | (1,300 | ) | (622 | ) | ||||||
|
|
|
|
|
|
|
|||||||
| Total provision for income taxes |
$ | 7,886 | $ | 7,481 | $ | 2,698 | ||||||
|
|
|
|
|
|
|
|||||||
The Company utilized $0.6 million in net operating loss deductions to reduce current taxable income during each of the fiscal years ended June 30, 2011, 2010 and 2009, respectively, the tax effect of which was $0.3 million each year.
77
Table of Contents
EPOCH HOLDING CORPORATION AND SUBSIDIARIES
NOTES TO CONSOLIDATED FINANCIAL STATEMENTS (Continued)
The Company’s effective income tax rate for the years ended June 30, 2011, 2010 and 2009 differs from the amount computed using income before income taxes and applying the U.S. federal statutory income tax rate to such amounts because of the effect of the following items (dollars in thousands):
| For the Year Ended June 30, | ||||||||||||||||||||||||
| 2011 | 2010 | 2009 | ||||||||||||||||||||||
| $ | % | $ | % | $ | % | |||||||||||||||||||
| U.S. federal statutory income tax expense and rate |
$ | 10,308 | 35.0 | % | $ | 6,694 | 35.0 | % | $ | 2,910 | 34.0 | % | ||||||||||||
| Increase (decrease) in tax resulting from: |
||||||||||||||||||||||||
| State and local taxes, net of federal income tax benefit |
2,499 | 8.5 | 1,434 | 7.5 | 128 | 1.5 | ||||||||||||||||||
| Valuation allowance |
(4,964 | ) | (16.9 | ) | (535 | ) | (2.8 | ) | (402 | ) | (4.7 | ) | ||||||||||||
| Other, net |
43 | 0.2 | (112 | ) | (0.6 | ) | 62 | 0.7 | ||||||||||||||||
|
|
|
|
|
|
|
|
|
|
|
|
|
|||||||||||||
| Effective income tax rate |
$ | 7,886 | 26.8 | % | $ | 7,481 | 39.1 | % | $ | 2,698 | 31.5 | % | ||||||||||||
|
|
|
|
|
|
|
|
|
|
|
|
|
|||||||||||||
Prior to December 31, 2010, the Company maintained a valuation allowance on certain deferred tax assets, relating to acquired net operating losses and alternative minimum tax credits, since the likelihood of the realization of those assets was not “more likely than not”. The Company has continuously evaluated additional facts representing positive and negative evidence in the determination of the realizability of those deferred tax assets. As of December 31, 2010, the Company concluded that sufficient positive evidence existed from recent earnings history, pre-tax income growth rates, current operating income levels, and the outlook for sustained profitability, to conclude that it is more likely than not that these assets will be fully realized in future operating periods. Therefore, the Company released a valuation allowance of approximately $5.0 million as a discrete benefit from income taxes during the quarter ended December 31, 2010. If future operating and business conditions were to differ significantly, the Company would reassess the ability to realize the deferred tax assets. If it is more likely than not that the Company would not be able to realize the deferred tax assets, then all or a portion of the valuation allowance may need to be re-established, which would result in a charge to tax expense.
The release of the above valuation allowance resulted in a non-recurring increase in the Company’s basic earnings per share of $0.22 and diluted earnings per share of $0.21 for the fiscal year ended June 30, 2011. The release also resulted in an increase in deferred tax assets on the Consolidated Balance Sheet, but had no effect on cash flows.
78
Table of Contents
EPOCH HOLDING CORPORATION AND SUBSIDIARIES
NOTES TO CONSOLIDATED FINANCIAL STATEMENTS (Continued)
Significant components of the Company’s deferred income tax assets and liabilities are as follows (in thousands):
| June 30, | ||||||||
| 2011 | 2010 | |||||||
| Deferred tax assets: |
||||||||
| Net operating loss carryforwards - IRC Section 382 |
$ | 3,776 | $ | 4,057 | ||||
| Share-based compensation |
3,436 | 2,680 | ||||||
| Alternative minimum tax credits - IRC Section 383 |
1,171 | 1,171 | ||||||
| Employee compensation |
2,566 | 1,989 | ||||||
| Depreciation and amortization on property and equipment |
97 | 180 | ||||||
| Net unrealized losses on available-for-sale securities |
- | 69 | ||||||
| Leasehold improvement impairments |
- | 30 | ||||||
| Equity method losses and impairments |
- | 82 | ||||||
|
|
|
|
|
|||||
| Net deferred tax assets before valuation allowance |
11,046 | 10,258 | ||||||
| Less: valuation allowance |
- | (5,007 | ) | |||||
|
|
|
|
|
|||||
| Net deferred tax assets, net of valuation allowance |
11,046 | 5,251 | ||||||
|
|
|
|
|
|||||
| Deferred tax liabilities: |
||||||||
| Prepaid expenses |
(221 | ) | (280 | ) | ||||
| Net unrealized gains on available-for-sale securities |
(212 | ) | - | |||||
| Equity method gains |
(29 | ) | - | |||||
|
|
|
|
|
|||||
| Total deferred tax liability |
(462 | ) | (280 | ) | ||||
|
|
|
|
|
|||||
| Total net deferred tax assets |
$ | 10,584 | $ | 4,971 | ||||
|
|
|
|
|
|||||
As of June 30, 2011, the Company has $8.9 million of acquired net operating losses (“NOLs”) remaining, the tax effect of which is $3.8 million, which expire between 2022 and 2026. The Company also has $1.2 million of acquired alternative minimum tax (“AMT”) credits which do not expire. The ability to utilize these NOLs and tax credits are limited for federal, state and local purposes. These limitations are covered by Sections 382 and 383, respectively, of the Internal Revenue Code (“IRC”). The NOLs can be utilized by the Company against taxable income only at a rate of approximately $600 thousand per year due to these limitations. The AMT credits can only be utilized once the NOLs are exhausted.
The Company realized excess income tax benefits of $0.3 million, $0.4 million and $1.7 million during the fiscal years ended June 30, 2011, 2010, and 2009, respectively. Excess income tax benefits reduce the amounts of income taxes to be paid. Excess income tax benefits arise in connection with the Company’s stock compensation. When a restricted stock award vests, the market price on the date the stock vests to the employee may be higher than the original grant-date fair market value of the award. If so, the difference between the cumulative amount that has been recognized through the Consolidated Statements of Income and the vesting amount used for income tax purposes results in an excess income tax benefit. Excess income tax benefits reduce income taxes payable and increase additional paid-in capital in the period they are recognized.
The Company files income tax returns in the U.S. federal jurisdiction and in various state and local jurisdictions. The Company’s federal income tax returns generally remain subject to examination by the Internal Revenue Service for three years from the date of filing. The Company’s state and local income tax returns are subject to examination by the respective state and local authorities over various statutes of limitations, most ranging from three to six years from the date of filing.
79
Table of Contents
EPOCH HOLDING CORPORATION AND SUBSIDIARIES
NOTES TO CONSOLIDATED FINANCIAL STATEMENTS (Continued)
Note 17 — Earnings Per Share
Basic earnings per share (“EPS”) is computed by dividing net income by the weighted-average number of common shares outstanding during the period.
Diluted EPS is computed by dividing net income, adjusted for the effect of dilutive securities, by the weighted-average number of common and common equivalent shares outstanding during the period. The Company uses the treasury stock method to reflect the dilutive effect of outstanding stock options.
The Company had 464,023 issued and outstanding stock options at June 30, 2011. At June 30, 2010 and 2009, the Company had 572,448 and 1,665,060 issued and outstanding stock options, respectively.
The calculation of diluted EPS included all of the outstanding stock options for the fiscal years ended June 30, 2011 and 2010, respectively. The calculation of diluted EPS for the fiscal year ended June 30, 2009 excluded all the issued and outstanding stock options, as the exercise price of the options was higher than the average market price of the common stock for the respective period. The conversion of options whose exercise price is higher than the average market price of the common stock during the respective period would have an anti-dilutive effect.
The table that follows presents the computation of basic and diluted EPS for the years ended June 30, 2011, 2010, and 2009, respectively (in thousands, except per share data):
| For the Year Ended June 30, | ||||||||||||
| 2011 | 2010 | 2009 | ||||||||||
| Numerator: |
||||||||||||
| Net income |
$ | 21,566 | $ | 11,645 | $ | 5,860 | ||||||
|
|
|
|
|
|
|
|||||||
| Denominator: |
||||||||||||
| Weighted-average common shares outstanding |
23,010 | 22,397 | 22,133 | |||||||||
| Net common stock equivalents assuming the exercise of in-the-money stock options |
173 | 148 | - | |||||||||
|
|
|
|
|
|
|
|||||||
| Weighted-average common and common equivalent shares outstanding, assuming dilution |
23,183 | 22,545 | 22,133 | |||||||||
|
|
|
|
|
|
|
|||||||
| Earnings Per Share: |
||||||||||||
| Basic |
$ | 0.94 | $ | 0.52 | $ | 0.26 | ||||||
|
|
|
|
|
|
|
|||||||
| Diluted |
$ | 0.93 | $ | 0.52 | $ | 0.26 | ||||||
|
|
|
|
|
|
|
|||||||
The release of the deferred tax asset valuation allowance discussed in Note 16 resulted in a non-recurring increase in the Company’s basic earnings per share of $0.22 and diluted earnings per share of $0.21 for the fiscal year ended June 30, 2011.
80
Table of Contents
EPOCH HOLDING CORPORATION AND SUBSIDIARIES
NOTES TO CONSOLIDATED FINANCIAL STATEMENTS (Continued)
Note 18 — Other Comprehensive Income/(Loss)
The components of other comprehensive income/(loss) include the changes in fair value of available-for-sale securities and are as follows (in thousands):
| For the Year Ended June 30, | ||||||||||||||||||||||||||||||||||||
| 2011 | 2010 | 2009 | ||||||||||||||||||||||||||||||||||
| Pre-tax Amount |
Tax (Expense)/ Benefit |
Net-of-tax Amount |
Pre-tax Amount |
Tax (Expense)/ Benefit |
Net-of-tax Amount |
Pre-tax Amount |
Tax (Expense)/ Benefit |
Net-of-tax Amount |
||||||||||||||||||||||||||||
| Net unrealized gains/(losses) on available-for-sale securities |
$ | 1,033 | $ | (442 | ) | $ | 591 | $ | 352 | $ | (153 | ) | $ | 199 | $ | (915 | ) | $ | - | $ | (915 | ) | ||||||||||||||
| Reclassifications for net (gains)/ losses included in net income |
(328 | ) | 143 | (185 | ) | (203 | ) | 88 | (115 | ) | 836 | - | 836 | |||||||||||||||||||||||
|
|
|
|
|
|
|
|
|
|
|
|
|
|
|
|
|
|
|
|||||||||||||||||||
| Total |
$ | 705 | $ | (299 | ) | $ | 406 | $ | 149 | $ | (65 | ) | $ | 84 | $ | (79 | ) | $ | - | $ | (79 | ) | ||||||||||||||
|
|
|
|
|
|
|
|
|
|
|
|
|
|
|
|
|
|
|
|||||||||||||||||||
Note 19 — Geographic Information
The Company operates under one business segment, investment management. Geographical information pertaining to the Company’s operating revenues is presented below. The amounts are aggregated by the client’s domicile (in thousands):
| For the Year Ended June 30, | ||||||||||||
| 2011 | 2010 | 2009 | ||||||||||
| United States |
$ | 47,994 | $ | 37,771 | $ | 24,349 | ||||||
| Canada |
8,429 | 7,020 | 5,115 | |||||||||
| Australia |
6,924 | 3,780 | 365 | |||||||||
| Europe |
6,034 | 4,709 | 1,304 | |||||||||
| Asia/Africa |
1,218 | 80 | 52 | |||||||||
|
|
|
|
|
|
|
|||||||
| Total operating revenues |
$ | 70,599 | $ | 53,360 | $ | 31,185 | ||||||
|
|
|
|
|
|
|
|||||||
Note 20 — Cash Dividends
Regular Dividends
During the fiscal years ended June 30, 2011, 2010, and 2009, the Company declared and paid regular quarterly dividends of $5.1 million, $3.5 million, and $2.7 million, respectively, or $0.22, $0.16, and $0.12 per share, respectively.
Special Dividends
During the fiscal years ended June 30, 2011, 2010, and 2009, the Company declared and paid a special dividend of $17.1 million, $6.7 million, and $2.6 million, respectively, or $0.75, $0.30, and $0.12 per share, respectively.
81
Table of Contents
EPOCH HOLDING CORPORATION AND SUBSIDIARIES
NOTES TO CONSOLIDATED FINANCIAL STATEMENTS (Continued)
Note 21 — Subsequent Events
Dividends on Common Stock
On July 8, 2011, the Board of Directors declared a quarterly cash dividend on the Company’s Common Stock of $0.06 per share. The dividend was payable on August 12, 2011 to all shareholders of record at the close of business on July 29, 2011.
Market Volatility and Impact on AUM
From the end of July 2011 through the latter part of August 2011, due to a series of negative macroeconomic and political factors across the world, global equity markets demonstrated extreme volatility and suffered their largest four week decline in over two years. Overall, for the period June 30, 2011 to August 31, 2011 global equity markets tumbled approximately 8%. As a result, the Company’s AUM declined from approximately $17.1 billion as of June 30, 2011 to $15.9 billion as of August 31, 2011.
Note 22 — Quarterly Financial Data (Unaudited)
The tables below present selected quarterly financial data for fiscal years ended June 30, 2011 and 2010, respectively. The data presented should be read in conjunction with the consolidated financial statements and “Management’s Discussion and Analysis of Financial Condition and Results of Operations” included herein (in thousands, except per share and AUM data):
| Fiscal Year 2011 |
Sept. 30 | Dec. 31 | Mar. 31 | Jun. 30 | Total | |||||||||||||||
| Operating revenues |
$ | 14,975 | $ | 16,856 | $ | 18,066 | $ | 20,702 | $ | 70,599 | ||||||||||
| Operating expenses |
$ | 9,175 | $ | 9,819 | $ | 11,343 | $ | 11,505 | $ | 41,842 | ||||||||||
| Operating income |
$ | 5,800 | $ | 7,037 | $ | 6,723 | $ | 9,197 | $ | 28,757 | ||||||||||
| Other income |
$ | 158 | $ | 217 | $ | 142 | $ | 178 | $ | 695 | ||||||||||
| Income before income taxes |
$ | 5,958 | $ | 7,254 | $ | 6,865 | $ | 9,375 | $ | 29,452 | ||||||||||
| Provision for (benefit from) income taxes(1) |
$ | 2,612 | $ | (1,779 | ) | $ | 2,992 | $ | 4,061 | $ | 7,886 | |||||||||
| Net income |
$ | 3,346 | $ | 9,033 | $ | 3,873 | $ | 5,314 | $ | 21,566 | ||||||||||
| Earnings per share(2): |
||||||||||||||||||||
| Basic |
$ | 0.15 | $ | 0.40 | $ | 0.17 | $ | 0.22 | $ | 0.94 | ||||||||||
| Diluted |
$ | 0.15 | $ | 0.39 | $ | 0.17 | $ | 0.22 | $ | 0.93 | ||||||||||
| Weighted-average shares outstanding: |
||||||||||||||||||||
| Basic |
22,786 | 22,827 | 23,073 | 23,359 | 23,010 | |||||||||||||||
| Diluted |
22,959 | 23,028 | 23,262 | 23,547 | 23,183 | |||||||||||||||
| Cash dividends declared and paid per share(3), (4) |
$ | 0.05 | $ | 0.80 | $ | 0.06 | $ | 0.06 | $ | 0.97 | ||||||||||
| Assets under management (in millions): |
||||||||||||||||||||
| End of period |
$ | 12,765 | $ | 14,326 | $ | 15,606 | $ | 17,086 | $ | 17,086 | ||||||||||
| Average |
$ | 12,150 | $ | 13,647 | $ | 15,060 | $ | 16,628 | $ | 14,376 | ||||||||||
| (1) | Includes the release of a valuation allowance against deferred tax assets of approximately $5.0 million during the quarter ended December 31, 2010. |
| (2) | Basic and diluted EPS are computed independently for each of the periods presented. Accordingly, the sum of the quarterly EPS amounts may not agree to the total for the year due to rounding. |
| (3) | Includes a $0.75 per share special dividend declared during the quarter ended December 31, 2010. |
| (4) | On January 7, 2011, the Company’s Board of Directors increased the quarterly dividend rate from $0.05 to $0.06 per share. |
82
Table of Contents
EPOCH HOLDING CORPORATION AND SUBSIDIARIES
NOTES TO CONSOLIDATED FINANCIAL STATEMENTS (Continued)
| Fiscal Year 2010 |
Sept. 30 | Dec. 31 | Mar. 31 | Jun. 30 | Total | |||||||||||||||
| Operating revenues |
$ | 11,417 | $ | 13,109 | $ | 14,706 | $ | 14,128 | $ | 53,360 | ||||||||||
| Operating expenses |
$ | 7,855 | $ | 8,771 | $ | 9,623 | $ | 8,955 | $ | 35,204 | ||||||||||
| Operating income |
$ | 3,562 | $ | 4,338 | $ | 5,083 | $ | 5,173 | $ | 18,156 | ||||||||||
| Other income |
$ | 308 | $ | 329 | $ | 191 | $ | 142 | $ | 970 | ||||||||||
| Income before income taxes |
$ | 3,870 | $ | 4,667 | $ | 5,274 | $ | 5,315 | $ | 19,126 | ||||||||||
| Provision for income taxes |
$ | 1,573 | $ | 1,939 | $ | 1,971 | $ | 1,998 | $ | 7,481 | ||||||||||
| Net income |
$ | 2,297 | $ | 2,728 | $ | 3,303 | $ | 3,317 | $ | 11,645 | ||||||||||
| Earnings per share(2): |
||||||||||||||||||||
| Basic |
$ | 0.10 | $ | 0.12 | $ | 0.15 | $ | 0.15 | $ | 0.52 | ||||||||||
| Diluted |
$ | 0.10 | $ | 0.12 | $ | 0.15 | $ | 0.14 | $ | 0.52 | ||||||||||
| Weighted-average shares outstanding: |
||||||||||||||||||||
| Basic |
22,196 | 22,165 | 22,448 | 22,784 | 22,397 | |||||||||||||||
| Diluted |
22,319 | 22,311 | 22,601 | 22,965 | 22,545 | |||||||||||||||
| Cash dividends declared and paid per share(5), (6) |
$ | 0.03 | $ | 0.33 | $ | 0.05 | $ | 0.05 | $ | 0.46 | ||||||||||
| Assets under management (in millions): |
||||||||||||||||||||
| End of period |
$ | 9,796 | $ | 11,354 | $ | 12,616 | $ | 11,344 | $ | 11,344 | ||||||||||
| Average |
$ | 8,818 | $ | 10,411 | $ | 11,875 | $ | 12,184 | $ | 10,792 | ||||||||||
| (5) | Includes a $0.30 per share special dividend declared during the quarter ended December 31, 2009. |
| (6) | On January 8, 2010, the Company’s Board of Directors increased the quarterly dividend rate from $0.03 to $0.05 per share. |
*******
83
Table of Contents
| Item 9. | Changes in and Disagreements with Accountants on Accounting and Financial Disclosure. |
None.
| Item 9A. | Controls and Procedures. |
Disclosure Controls and Procedures
We have established and maintain disclosure controls and other procedures (as defined in Rule 13a-15(e) and 15d-15(e) under the Securities Exchange Act of 1934, as amended (the “Exchange Act”)), that are designed to provide reasonable assurance that material information relating to our Company and subsidiaries on a consolidated basis required to be disclosed in our reports filed or submitted under the Exchange Act, is recorded, processed, summarized and reported within the time periods specified in the SEC’s rules and forms, and that such information is accumulated and communicated accurately to our management, including our principal executive officer and principal financial and accounting officer, as appropriate, to allow timely decisions regarding required disclosure. There are inherent limitations to the effectiveness of any system of disclosure controls and procedures, including the possibility of human error and the circumvention or overriding of the controls and procedures. In designing and evaluating our disclosure controls and procedures, we recognize that disclosure controls and procedures, no matter how well designed and operated, can only provide reasonable, not absolute, assurance that the objectives of the disclosure controls and procedures are met.
For the fiscal year ended June 30, 2011, management, with the participation of our principal executive officer and principal financial and accounting officer, has evaluated the effectiveness of the design and operation of our disclosure controls and procedures. Based on such evaluation of these disclosure controls and procedures, our principal executive officer and principal financial and accounting officer have concluded that our disclosure controls and procedures were effective during the period covered by this Annual Report on Form 10-K.
We have also established and maintain internal control over financial reporting as a process designed to provide reasonable assurance regarding the reliability of financial reporting and the preparation of consolidated financial statements for external purposes in accordance with accounting principles generally accepted in the United States. In the ordinary course of business, we routinely enhance our internal controls and procedures for financial reporting by either upgrading our current systems or implementing new systems. Changes have been made to our internal controls and procedures for financial reporting as a result of these efforts. During the fiscal quarter ended June 30, 2011, there was no change in our internal control over financial reporting (as defined in Rule 13a-15(f) and 15d-15(f) under the Exchange Act) that has materially affected, or is reasonably likely to materially affect, our internal control over financial reporting.
Management’s Report on Internal Control Over Financial Reporting
The Report of Management on Internal Control over Financial Reporting and the Report of Independent Registered Public Accounting Firm are set forth in the financial statements beginning on page 55 hereof and are incorporated herein by reference.
| Item 9B. | Other Information. |
None.
84
Table of Contents
PART III
| Item 10. | Directors, Executive Officers and Corporate Governance. |
| Item 11. | Executive Compensation. |
| Item 12. | Security Ownership of Certain Beneficial Owners and Management and Related Stockholder Matters. |
| Item 13. | Certain Relationships and Related Transactions, and Director Independence. |
| Item 14. | Principal Accountant Fees and Services. |
The information required by Items 10, 11, 12, 13 and 14 are incorporated by reference from the definitive proxy statement for our 2011 Annual Meeting of Stockholders to be filed with the Securities and Exchange Commission pursuant to Regulation 14A under the Exchange Act.
85
Table of Contents
PART IV
| Item 15. | Exhibits and Financial Statement Schedules. |
(a) (1) and (2) Consolidated Financial Statements and Schedules.
For a list of the consolidated financial statements and consolidated financial statement schedules filed as a part of this Annual Report on Form 10-K, see “Index to Financial Statements, Supplementary Data and Financial Statement Schedules” on page 55.
(a) (3) The exhibits filed and incorporated by reference are listed in the Index of Exhibits required by Item 601 of Regulation S-K at Item b below.
(b) The following is a list of the exhibits filed as part of this Form 10-K. The documents incorporated by reference are located in the SEC’s Public Reference Room in Washington, D.C. in the SEC’s file no. 1-9728.
| Exhibit Number |
Exhibit Description | |
| (2) Plan of Acquisition, Reorganization, Arrangement, Liquidation or Succession | ||
| 2.1 | Agreement of Merger and Plan of Reorganization dated as of June 2, 2004, incorporated by reference to Exhibit 2.1 to the Current Report on Form 8-K , filed with the SEC on June 3, 2004. | |
| (3) Articles of Incorporation and Bylaws | ||
| 3.1 | Certificate of Incorporation of the Registrant, as amended, incorporated by reference to Exhibit 3.1 to the Current Report on Form 8-K, filed with the SEC on December 7, 2004. | |
| 3.2 | Amended and Restated By-Laws of Epoch Holding Corporation (as adopted April 2, 2008), incorporated by reference to Exhibit 3.1 to the Current Report on Form 8-K, filed with the SEC on April 2, 2008. | |
| (4) Instruments Defining the Rights of Security Holders | ||
| 4.1 * | Amended and Restated 2004 Omnibus Long-Term Incentive Compensation Plan, incorporated by reference to Exhibit 4.1 to the Registration Statement on Form S-8, filed with the SEC on December 29, 2008. | |
| 4.2 | Certificate of Designation, Preferences and Rights of Series A Convertible Preferred Stock, incorporated by reference to Exhibit 4.2 to the Current Report on Form 8-K, filed with the SEC on November 9, 2006. | |
| 4.3 | Registration Rights Agreement dated November 7, 2006 by and between Epoch Holding Corporation and between General American Investors Company, Inc, incorporated by reference to Exhibit 4.3 to the Current Report on Form 8-K, filed with the SEC on November 9, 2006. | |
| 4.4 | Stockholders Agreement dated as of June 2, 2004 among J Net Enterprises, Inc. and certain of its stockholders, incorporated by reference to Exhibit 10.1 to the Current Report on Form 8-K, filed with the SEC on June 3, 2004. | |
| 4.5 | Registration Rights Agreement dated as of June 2, 2004 among J Net Enterprises, Inc. and certain of its stockholders, incorporated by reference to Exhibit 10.2 to the Current Report on Form 8-K, filed with the SEC on June 3, 2004. | |
86
Table of Contents
| Exhibit Number |
Exhibit Description | |
| (10) Material Contracts | ||
| 10.1 * | Amended and Restated Employment Agreement by and between Epoch Holding Corporation and William W. Priest, dated as of December 20, 2010 and effective as of January 1, 2011, incorporated by reference to Exhibit 10.1 to the Current Report on Form 8-K, filed with the SEC on December 20, 2010. | |
| 10.40 | Form of Indemnification Agreement between the Registrant and each director and officer of the Registrant, incorporated by reference to Exhibit 10.40 to the Quarterly Report on Form 10-Q for the quarter ended September 30, 2009, filed with the SEC on November 6, 2009. | |
| 10.45 | Office lease between Vornado 640 Fifth Avenue LLC (Landlord) and Epoch Investment Partners, Inc. (Tenant), incorporated by reference to Exhibit 10.45 to the Annual Report on Form 10-K for the fiscal year ended June 30, 2005, filed with the SEC on September 28, 2005. | |
| 10.46 | Form of Restricted Stock Award, incorporated by reference to Exhibit 10.46 to the Annual Report, as amended, on Form 10-K/A for the fiscal year ended June 30, 2006, filed with the SEC on September 26, 2006. | |
| 10.47 | Office lease between 680 Fifth Avenue Associates, L.P. (Landlord) and J Net Enterprises, Inc. (Tenant), incorporated by reference to Exhibit 10.47 to the Annual Report, as amended, on Form 10-K/A for the fiscal year ended June 30, 2006, filed with the SEC on September 26, 2006. | |
| 10.48 | Office sublease between J Net Enterprises, Inc. (Sublandlord) and Game Show Network LLC (Subtenant), incorporated by reference to Exhibit 10.48 to the Annual Report, as amended, on Form 10-K/A for the fiscal year ended June 30, 2006, filed with the SEC on September 26, 2006. | |
| 10.49 | Office sublease between Centerview Partners Holdings LLC (Sublessor) and Epoch Investment Partners, Inc. (Sublessee), incorporated by reference to Exhibit 10.49 to the Quarterly Report on Form 10-Q for the quarter ended September 30, 2009, filed with the SEC on November 6, 2009. | |
| 10.50 | Securities Purchase Agreement dated November 6, 2006 by and between Epoch Holding Corporation and General American Investors Company, Inc, incorporated by reference to Exhibit 10.49 to the Current Report on Form 8-K, filed with the SEC on November 9, 2006. | |
87
Table of Contents
| Exhibit Number |
Exhibit Description | |
| (21) Subsidiaries of the Company | ||
| 21.1 | List of Registrant’s significant subsidiaries, incorporated by reference to Exhibit 21.1 to the Annual Report on Form 10-K for the fiscal year ended June 30, 2005, filed with the SEC on September 28, 2005. | |
| (23) Consents of Experts and Counsel | ||
| 23.1 † | Consent of CF & Co., L.L.P., independent registered public accounting firm. | |
| (31) Rule 13a-14(a)/15d-14(a) Certifications | ||
| 31.1 † | Certification of Chief Executive Officer pursuant to Section 302 of the Sarbanes-Oxley Act of 2002. | |
| 31.2 † | Certification of Principal Financial Officer pursuant to Section 302 of the Sarbanes-Oxley Act of 2002. | |
| (32) Section 1350 Certification | ||
| 32.1 † | Certification of Chief Executive Officer and Chief Financial Officer pursuant to 18 U.S.C. Section 1350, as adopted pursuant to Section 906 of the Sarbanes-Oxley Act of 2002.
† Filed herewith. * Employment contract, compensatory plan or arrangement. | |
88
Table of Contents
Pursuant to the requirements of Section 13 or 15(d) of the Securities Exchange Act of 1934, the Registrant has duly caused this report to be signed on its behalf by the undersigned, thereunto duly authorized.
| EPOCH HOLDING CORPORATION | ||||||
| (Registrant) | ||||||
| Dated: September 6, 2011 | By: | /s/ William W. Priest | ||||
| William W. Priest | ||||||
| Chief Executive Officer | ||||||
Pursuant to the requirements of the Securities and Exchange Act of 1934, this report has been signed below by the following persons on behalf of the Registrant and in the capacities and on the dates indicated.
| Signature |
Title |
Date | ||
| /s/ Allan R. Tessler |
Chairman of the Board | September 6, 2011 | ||
| Allan R. Tessler | ||||
| /s/ William W. Priest |
Chief Executive Officer | September 6, 2011 | ||
| William W. Priest | (Principal Executive Officer ) | |||
| /s/ Adam Borak |
Chief Financial Officer | September 6, 2011 | ||
| Adam Borak | (Principal Financial and | |||
| Accounting Officer ) | ||||
| /s/ Enrique R. Arzac |
Director | September 6, 2011 | ||
| Enrique R. Arzac | ||||
| /s/ Jeffrey L. Berenson |
Director | September 6, 2011 | ||
| Jeffrey L. Berenson | ||||
| /s/ John L. Cecil |
Director | September 6, 2011 | ||
| John L. Cecil | ||||
| /s/ Peter A. Flaherty |
Director | September 6, 2011 | ||
| Peter A. Flaherty | ||||
| /s/ Timothy T. Taussig |
Director | September 6, 2011 | ||
| Timothy T. Taussig | ||||
89