Attached files
Table of Contents
UNITED STATES
SECURITIES AND EXCHANGE COMMISSION
Washington, D.C. 20549
FORM 10-K
(Mark One)
| x | ANNUAL REPORT PURSUANT TO SECTION 13 OR 15(d) OF THE SECURITIES EXCHANGE ACT OF 1934 |
For the fiscal year ended June 30, 2011
OR
| ¨ | TRANSITION REPORT PURSUANT TO SECTION 13 OR 15(d) OF THE SECURITIES EXCHANGE ACT OF 1934 |
For the transition period from to
Commission file number: 001-35188
FUSION-IO, INC.
(Exact name of registrant as specified in its charter)
| Delaware | 20-4232255 | |
| (State or other jurisdiction of incorporation or organization) |
(I.R.S. Employer Identification Number) | |
| 2855 E. Cottonwood Parkway, Suite 100 Salt Lake City, Utah |
84121 | |
| (Address of principal executive offices) | (Zip Code) | |
Registrant’s telephone number, including area code: (801) 424-5500
Securities registered pursuant to Section 12(b) of the Act:
| Title of each class: |
Name of each exchange on which registered: | |
| Common stock, $0.0002 par value | The New York Stock Exchange |
Securities registered pursuant to Section 12(g) of the Act: None
Indicate by check mark if the registrant is a well-known seasoned issuer, as defined in Rule 405 of the Securities Act. Yes ¨ No x
Indicate by check mark if the registrant is not required to file reports pursuant to Section 13 or Section 15(d) of the Act. Yes ¨ No x
Indicate by check mark whether the registrant (1) has filed all reports required to be filed by Section 13 or 15(d) of the Securities Exchange Act of 1934 during the preceding 12 months (or for such shorter period that the registrant was required to file such reports), and (2) has been subject to such filing requirements for the past 90 days. Yes ¨ No x
Indicate by check mark whether the registrant has submitted electronically and posted on its corporate Web site, if any, every Interactive Data File required to be submitted and posted pursuant to Rule 405 of Regulation S-T (§ 232.405 of this chapter) during the preceding 12 months (or for such shorter period that the registrant was required to submit and post such files). Yes ¨ No ¨
Indicate by check mark if disclosure of delinquent filers pursuant to Item 405 of Regulation S-K is not contained herein, and will not be contained, to the best of registrant’s knowledge, in definitive proxy or information statements incorporated by reference in Part III of this Form 10-K or any amendment to this Form 10-K. x
Indicate by check mark whether the registrant is a large accelerated filer, an accelerated filer, a non-accelerated filer, or a smaller reporting company. See the definitions of “large accelerated filer,” “accelerated filer” and “smaller reporting company” in Rule 12b-2 of the Exchange Act. (Check one):
| Large accelerated filer | ¨ | Accelerated filer | ¨ | |||
| Non-accelerated filer | x (Do not check if a smaller reporting company) | Smaller reporting company | ¨ | |||
Indicate by check mark whether the registrant is a shell company (as defined in Rule 12b-2 of the Exchange Act). Yes ¨ No x
As of December 31, 2010, the last business day of the registrant’s most recently completed second fiscal quarter, the registrant’s common stock was not listed on any exchange or over-the-counter market. The registrant’s common stock began trading on the New York Stock Exchange on June 9, 2011. The aggregate market value of voting and non-voting common equity held by non-affiliates of the registrant as of June 14, 2011 was approximately $865.2 million (based on a closing sale price of $23.30 per share as reported for the New York Stock Exchange on June 14, 2011. For the purpose of this calculation, shares of common stock held by the registrant’s current officers and directors and shares of common stock held by persons who hold more than 10% of the outstanding common stock of the registrant have been excluded from this calculation because such persons may be deemed affiliates. This determination of executive officer or affiliate status is not necessarily a conclusive determination for other purposes.
The number of shares of the registrant’s common stock, $0.0002 par value per share, outstanding as of August 30, 2011 was 83,266,842.
DOCUMENTS INCORPORATED BY REFERENCE
Part III of this annual report on Form 10-K incorporates by reference portions of the registrant’s Proxy Statement for its 2011 Annual Meeting of Stockholders to be held on November 18, 2011.
Table of Contents
Fusion-io, Inc.
Form 10-K
For the Fiscal Year Ended June 30, 2011
| Part I |
1 | |||||||
| Item 1. | 1 | |||||||
| Item 1A. | 14 | |||||||
| Item 1B. | 32 | |||||||
| Item 2. | 32 | |||||||
| Item 3. | 32 | |||||||
| Part II |
33 | |||||||
| Item 5. | 33 | |||||||
| Item 6. | 37 | |||||||
| Item 7. | Management’s Discussion and Analysis of Financial Condition and Results of Operations |
38 | ||||||
| Item 7A. | 53 | |||||||
| Item 8. | 54 | |||||||
| Item 9. | Changes in and Disagreements with Accountants on Accounting and Financial Disclosure |
54 | ||||||
| Item 9A. | 54 | |||||||
| Item 9B. | 55 | |||||||
| Part III |
55 | |||||||
| Item 10. | 55 | |||||||
| Item 11. | 55 | |||||||
| Item 12. | Security Ownership of Certain Beneficial Owners and Management and Related Stockholder Matters |
55 | ||||||
| Item 13. | Certain Relationships and Related Transactions, and Director Independence |
55 | ||||||
| Item 14. | 55 | |||||||
| Part IV |
56 | |||||||
| Item 15. | Exhibits, Consolidated Financial Statements and Financial Statement Schedules |
56 | ||||||
| 59 | ||||||||
-i-
Table of Contents
Fusion-io, Inc.
Form 10-K
For the Fiscal Year Ended June 30, 2011
Special Note Regarding Forward-Looking Statements
This Form 10-K contains forward-looking statements that are based on our management’s beliefs and assumptions and on information currently available to our management. The forward-looking statements are contained principally in the sections entitled “Business,” “Risk Factors” and “Management’s Discussion and Analysis of Financial Condition and Results of Operations.” These forward-looking statements include, but are not limited to, statements concerning our possible or assumed future results of operations, business strategies, financing plans, technological leadership, market opportunity, expectations regarding product acceptance, ability to innovate new products and bring them to market in a timely manner, ability to successfully increase sales of our software offerings as part of our overall sales strategy, competitive position and the effects of competition, industry environment, potential growth opportunities, ability to expand internationally, the impact of quarterly fluctuations of revenue and operating results, expectations concerning relationships with third parties, including channel partners, key customers and OEMs, levels of capital expenditures, future capital requirements and availability to fund operations and growth, the adequacy of facilities, impact of our recent acquisition of IO Turbine, Inc., the adequacy of our intellectual property, intellectual property claims, the sufficiency of our issued patents and patent applications to property our intellectual property, the effects of a natural disaster on us or our suppliers, our ability to resell inventory that we cannot use in our products due to obsolescence, our OEM’s continuing to design our products into their products, and the importance of software innovation. Forward-looking statements include statements that are not historical facts and can be identified by terms such as “anticipates,” “believes,” “could,” “seeks,” “estimates,” “expects,” “intends,” “may,” “plans,” “potential,” “predicts, “projects,” “should,” “will,” “would” or similar expressions and the negatives of those terms.
Forward-looking statements involve known and unknown risks, uncertainties and other factors that may cause our actual results, performance or achievements to be materially different from any future results, performance or achievements expressed or implied by the forward-looking statements. We discuss these risks in greater detail in “Risk Factors” and elsewhere in this Form 10-K. Given these uncertainties, you should not place undue reliance on these forward-looking statements. Also, forward-looking statements represent our management’s beliefs and assumptions only as of the date of this Form 10-K.
Except as required by law, we assume no obligation to update these forward-looking statements, or to update the reasons actual results could differ materially from those anticipated in these forward-looking statements, even if new information becomes available in the future. You should read this Form 10-K completely and with the understanding that our actual future results may be materially different from what we expect.
Corporate Information
The Fusion-io, Atomic and IO Turbine design logos and the marks “Fusion-io”, “Accelio”, “directCache”, “ioDirector”, “ioDrive”, “ioDrive Duo”, “ioDrive Octal”, “ioManager”, “ioMemory”, “ioSphere”, “IO Turbine”, “ioCache”, “IOXpress”, “IOPs Dedupe”, “VSL”, “Virtual Storage Layer” and “Powering Innovation” are our trademarks. This annual report on Form 10-K contains additional trade names, trademarks and service marks of other companies. We do not intend our use or display of other companies’ trade names, trademarks or service marks to imply a relationship with, or endorsement or sponsorship of us by these other companies.
Overview
We have pioneered a next generation storage memory platform for data decentralization. Our platform significantly improves the processing capabilities within a datacenter by relocating process-critical, or “active”, data from centralized storage to the server where it is being processed, a methodology we refer to as data
-1-
Table of Contents
decentralization. Our integrated hardware and software solutions leverage non-volatile memory to significantly increase datacenter efficiency and offers enterprise grade performance, reliability, availability and manageability. We sell our solutions through our global direct sales force, original equipment manufacturers, or OEMs, including Dell, HP and IBM, and other channel partners.
Our data decentralization platform can transform legacy architectures into next generation datacenters and allows enterprises to consolidate or significantly reduce complex and expensive high performance storage, high performance networking, and memory-rich servers. Our platform enables enterprises to increase the utilization, performance and efficiency of their datacenter resources and to extract greater value from their information assets. Many users of our platform have reported achieving greater than 10 times the application throughput per server through increased server utilization, resulting in reductions to ongoing facility, energy and cooling expenses.
Our purpose-built storage memory platform integrates our industry standard server-based hardware with our virtualization software, and incorporates our automated data-tiering and platform management software. Our ioMemory hardware uses non-volatile memory to create a high capacity memory tier with fast access rates in a small form factor. Our virtual storage layer, or VSL, software virtualizes the ioMemory hardware and allows the decentralization of active data from centralized storage systems into the server. Our recently released directCache software provides automated data-tiering, which accelerates access to active data from centralized storage. The recent acquisition of IO Turbine, Inc. will enable us to provide virtualization software solutions to accelerate our platform into the virtualized server and desktop markets. Our recently released ioSphere management software centrally configures, monitors and manages all of our distributed ioMemory hardware and software.
We were incorporated in December 2005 as Canvas Technologies, Inc., a Nevada corporation. In June 2006, we changed our name to Fusion Multisystems, Inc. In June 2010, we changed our name to Fusion-io, Inc. and reincorporated as a Delaware corporation. Our principal executive offices are located at 2855 E. Cottonwood Parkway, Suite 100, Salt Lake City, Utah 84121, and our telephone number is 801.424.5500. We also have significant operations in San Jose, California.
As of June 30, 2011, we had 441 employees globally. In fiscal 2011, we had three greater-than 10% customers, including Facebook and Apple, through a reseller, and one of our OEMs, HP. We have experienced substantial growth over the past three years; our revenue was $10.2 million, $36.2 million and $197.2 million in fiscal 2009, 2010 and 2011, respectively.
Our fiscal year end is June 30 and our fiscal quarters end on September 30, December 31, March 31, and June 30. Our fiscal years ended June 30, 2009, 2010 and 2011 are referred to herein as fiscal 2009, 2010 and 2011, respectively.
Recent Developments
On August 11, 2011, we acquired 100% of the stock of IO Turbine, Inc., or IO Turbine, a provider of caching solutions for virtual environments, based in San Jose, California. The acquisition of IO Turbine is a key part of our strategy to enable enterprise customers to increase the utilization, performance and efficiency of their datacenter resources and extract greater value from their information assets.
Industry Background
The profitability and long-term competitiveness of enterprises increasingly depend on their ability to rapidly extract value from their information assets while addressing the following key challenges:
| • | Growth in Quantity of Data — The amount of data that enterprises are processing is growing at an exponential rate. |
| • | Growth in Frequency of Access to Data — The number of people accessing information systems and the frequency of their access are also growing substantially. More devices, applications and services are being used more frequently. |
-2-
Table of Contents
| • | Growing Demand for Faster, More Relevant Responses — Enterprises and consumers expect information systems to be real-time, on-demand, always-on and highly responsive with relevant information. |
These challenges require datacenter infrastructure that can process ever-increasing amounts of data at ever-increasing rates. Since the value an enterprise can extract from its information assets is determined by both the quantity and rate at which data is processed, enterprises must address these challenges. However, they are subject to many constraints, including the following:
| • | Limited Financial Resources — All enterprises must prioritize their finite financial and other resources to invest in their datacenter infrastructure and operations. |
| • | Limited Resources for Datacenters — Datacenters are highly specialized, require substantial energy, cooling and space and require long lead times to build. Therefore, enterprises face a practical limit on their ability to expand existing datacenters or build new ones to meet the rapidly growing demands to process data. |
| • | Pressure to be Energy Efficient — Building new datacenters or expanding the capacity of existing datacenters causes substantial increases in energy consumption. |
To address the increased growth in quantity of data, frequency of data access and performance demands, enterprises are increasingly deploying costly and inefficient datacenter infrastructure.
The Data Supply Problem
The profitability and long-term competitiveness of enterprises increasingly depend on their ability to rapidly extract value from their information assets. Datacenters are being required to process ever-increasing amounts of data at ever-increasing rates. The performance and efficiency of a datacenter is largely determined by the quantity and rate at which data can be supplied from storage to the server for processing. We refer to this flow of data from storage through networking to servers for processing as the data supply chain.
Legacy datacenter architectures using centralized storage cannot effectively supply the increasingly large quantities of process-critical data quickly enough to fully utilize the processing capacity of today’s servers, leading to low levels of server utilization. We refer to this limitation as the data supply problem. As a result of servers waiting idle, processing capabilities are significantly underutilized.
While processing performance has doubled approximately every 18 months, the performance of other elements in the data supply chain has not kept pace. This is especially true for the storage infrastructure, which has been designed primarily to optimize capacity growth, rather than performance growth. This increasing gap between processing and storage performance amplifies the data supply problem.
Traditional Approaches Do Not Efficiently Address the Data Supply Problem
We believe that traditional datacenter architectures cannot adequately address the data supply problem, as they have not scaled with the growth of processing performance. This leads to greater complexity in the datacenter and ever increasing inefficiencies in utilization, cost, physical space and energy consumption.
Traditional approaches used to address the data supply problem include the following:
| • | Deploy More Expensive Storage — To alleviate the restriction that storage places on the data supply chain, enterprises must deploy storage systems with a substantial number of performance optimized hard disk drives in parallel. These performance optimized drives are significantly more expensive than commodity storage. We estimate additional software and services typically bundled with storage systems add $3.96 per gigabyte on average in the storage industry. Based on this estimate, we believe enterprises spend up to 13 times the cost of commodity disk drives to increase the performance of slow disk drives. We believe input / output intensive storage systems provide incremental performance benefits but represent a significant per gigabyte cost premium over performance optimized storage. |
-3-
Table of Contents
| • | Deploy More Expensive Networking — Even after deploying costly high performance storage, enterprises must then deploy high performance networking infrastructure to transport the data between the storage and the server. |
| • | Deploy More Expensive Servers — Even after deploying costly high performance storage and high performance networking, the data cannot be supplied at the necessary rates to avoid server underutilization. To address this bottleneck in the data supply chain, enterprises are deploying more richly configured servers that contain higher amounts of memory to hold more active data within the server to avoid going back and forth to storage through networking as frequently. |
| • | Scale Out Datacenters — Despite the underutilization of physical servers, when deployed in large enough quantities, lower cost, data supply constrained servers can reach acceptable aggregated performance levels. Depending on the degree of underutilization, the initial capital expenditure of this type of server scale-out may be less expensive than deploying a combination of performance-oriented storage and networking and memory-rich servers. However, this approach leads to increased numbers of servers, additional software licenses and related infrastructure within datacenters which we refer to as either datacenter or server sprawl. |
| • | Tune and Redesign Software Applications — Because deploying high performance storage, networking and additional servers does not resolve the data supply problem, enterprises may invest heavily to tune or even redesign their software applications to improve performance in a data supply constrained environment. However, this increases the need for expensive engineering and consulting resources, requires significant investments of time, and can compromise application reliability and time-to-market. |
| • | Utilize Cloud Computing — Because of the cost and complexity of server sprawl caused by datacenter scale-out, many enterprises are transferring the burden of this scale-out to third-party hosted datacenter providers. Although this approach reduces the cost associated with scale-out for a particular enterprise, it fails to address the underlying performance and efficiency limitations of the data supply problem. Rather the data supply problem is transferred to the third-party provider. |
| • | Introduce Server Virtualization — Server virtualization allows multiple server workloads to be consolidated on a single physical server. However, data for each of these workloads must still be supplied to the physical server, compounding the data supply problem. While virtualization brings significant benefits in terms of workload consolidation, its full potential to improve datacenter efficiency remains constrained by the data supply problem. |
In response to the challenges associated with the increased growth in quantities of data, increased frequency of data access and increased performance demands, enterprises continue to deploy more costly infrastructure. As a result, incumbent storage, networking and memory vendors have been reluctant to disrupt traditional approaches and seek more efficient solutions.
Need for a Data Decentralization Solution
A fundamentally new approach is needed to address the data supply problem. We believe that this problem is analogous to the challenges faced in manufacturing, where materials are transported to the factory for assembly. If the manufacturing supply chain is unable to provide a sufficient rate and quantity of materials to meet production capacity, the factory becomes underutilized. The concept of just-in-time manufacturing emerged to address underutilization by introducing an inventory hub near the factory to ensure a steady and uninterrupted flow of materials, optimizing production utilization.
Similarly, in the datacenter, data is retrieved from centralized storage and transported to the server where it is processed. Applying the principle of just-in-time manufacturing to the data supply problem requires relocating process-critical, or “active”, data from centralized storage to the server where it is being processed, a methodology we refer to as data decentralization.
-4-
Table of Contents
We believe that effectively addressing the data supply problem requires a decentralized storage-based solution that includes the following:
| • | hardware with sufficient capacity and rate of access, in a form factor that can be integrated within industry-standard servers; |
| • | software that virtualizes storage resources and governs the flow and management of data between storage and the server; |
| • | software that enables this platform to be utilized within both new and existing datacenter architectures; and |
| • | software that centrally configures, manages and monitors this new distributed infrastructure. |
This platform must also meet enterprise reliability, availability and serviceability requirements.
-5-
Table of Contents
Our Solution
We have pioneered a next generation storage memory platform for data decentralization. Our platform significantly improves the processing capabilities within a datacenter by relocating process-critical, or “active”, data from centralized storage to the server where it is being processed. Our platform enables enterprises to increase the utilization, performance and efficiency of their datacenter resources and to extract greater value from their information assets. Many users of our products have reported achieving greater than 10 times the application throughput per server through increased server utilization, resulting in reductions to ongoing facility, energy and cooling expenses. Our data decentralization platform can transform legacy architectures into next generation datacenters and allows enterprises to consolidate or significantly reduce complex and expensive high performance storage, high performance networking and memory-rich servers.
Our purpose-built storage memory platform for data decentralization addresses the data supply problem while providing enterprise grade performance, reliability, availability and manageability. Our integrated hardware and software solutions operate in industry standard servers, where the data is being processed. Our ioMemory hardware integrates with our VSL virtualization software, and leverages our recently released directCache data-tiering software, the recently acquired ioTurbine virtualization software solutions and ioSphere platform management software. Our ioMemory hardware uses non-volatile memory to create a high capacity memory tier with fast access rates in a small form factor that integrates with an industry-standard server. Our VSL software virtualizes the ioMemory hardware and allows the decentralization of active data from centralized storage systems into the server. Our directCache automated data-tiering software provides automated data-tiering, which accelerates access to active data from centralized storage. Our ioTurbine virtualization software eliminates input / output bottlenecks for virtualized servers connected to traditional backend storage. Our ioSphere platform management software centrally configures, monitors and manages all of our distributed hardware and software. Our products help enterprises transform their datacenters to this next generation architecture in a cost-effective manner.
Our data decentralization platform enables our customers to address the following fundamental industry challenges:
| • | Manage Growth in Quantity of Data — With our ioMemory, a server can currently hold over 10 terabytes of active data. Since our platform utilizes non-volatile memory, we believe our platform will scale capacity and performance in line with processing growth over time. Further, our directCache software is designed to enable enterprises to efficiently manage greater amounts of data by automating the movement of the active data to ioMemory from traditional high capacity, centralized storage. |
| • | Manage Increasing Frequency of Access to Data — Our platform can respond to hundreds of thousands of requests for data per second, a significant improvement compared to traditional approaches. This is possible because our ioMemory connects a large array of non-volatile memory directly to a server’s high-speed system bus allowing data to be accessed with memory-like performance. Further, our VSL software integrates within a server’s operating system and allows multiple processor cores to simultaneously access the active data in our ioMemory. |
| • | Improve Response Times, Relevancy and Value from Data — By decentralizing data within the server, our platform enables applications to rapidly and efficiently access more data, perform deeper analytics on the data, and produce more relevant responses in shorter periods of time. This allows enterprises to extract greater value from their information assets, including systems dedicated to decision support, high performance financial analysis, web search, content delivery and enterprise resource planning. |
Further, our data decentralization platform enables enterprises to transform legacy architectures into next generation datacenters that can:
| • | Reduce Total Cost of Ownership and Environmental Impact — Through the use of our platform, our customers can reduce, simplify and consolidate their purchases of expensive storage, networking and memory-rich server infrastructure and reduce their spending on costly software and services. As a |
-6-
Table of Contents
| result, our platform enables customers to reduce their datacenter infrastructure footprint, administrative expenses and energy consumption related to power and cooling. |
| • | Unlock the Potential of Virtualization — Our platform can significantly increase the processing capabilities of server and desktop virtualization by allowing more active data to quickly reach the numerous virtual servers inside a single physical server. Further, by addressing the data supply problem, our platform also enables data-intensive workloads to be virtualized and enables more virtual servers and desktops to be employed per physical server without experiencing performance issues caused by data supply constraints. |
| • | Support More Cost-Effective Clouds and SaaS — By enabling rapid access to large quantities of data, our platform allows both cloud service providers and software-as-a-service vendors to significantly enhance the performance of the services they offer and improve their underlying cost structures. |
Our Strategy
Our objective is to expand our position as the leading provider of storage memory platforms for data decentralization. The principal elements of our strategy include:
| • | Leverage Our First-to-Market Position in Data Decentralization — As the pioneer in data decentralization, we created an important new market category with our next generation storage memory platform. We believe that early leadership in data decentralization has afforded us a strong leadership position and recognized brand. We intend to extend our position as the leader in data decentralization by focusing on continued development and extension of our technology and brand. |
| • | Continue Our Focus on Platform Solutions — We have designed a comprehensive platform that includes our ioMemory hardware, VSL virtualization software, automated data-tiering software, host-based data-acceleration software for virtualized environments and platform management software into a single solution. This approach allows our platform to be optimized for performance and high reliability and for virtual and non-virtualized environments. It also facilitates our ability to introduce new platform elements over time. Finally, this platform approach enables us to realize the potential of non-volatile memory by leveraging commodity non-volatile memory, such as NAND Flash, to deliver a robust enterprise grade system. We believe this differentiated platform approach will enable us to continue to rapidly innovate and bring new elements of our data decentralization solutions to market. |
| • | Extend Our Platform Differentiation Through Software Innovation — We believe that continued software innovation is critical to addressing the data supply problem. Our extensible architecture allows us to enhance the capabilities of our platform by adding additional software components over time. In this regard, we have recently developed our directCache and ioSphere software and the recently acquired ioTurbine virtualization software for incorporation into our solution and intend to continue to add software functionality either from internal development, business acquisitions, or licensing from third parties to differentiate our products and extend our technology leadership position. |
| • | Develop and Maintain Direct Customer Engagement — Direct engagement with customers enables us to accelerate the adoption of our platform through the direct and OEM-assisted portions of our multi-tier distribution model. We have developed and maintained a specialized global direct sales and sales engineering team. This direct engagement strategy provides us valuable feedback on our products and technology, allowing us to continually enhance and expand our product offerings. |
| • | Leverage and Expand Our Server OEM Relationships — We have established relationships with leading server OEMs, including Dell, HP and IBM. We combine our direct engagement approach with these OEMs’ substantial go-to-market resources to expand our reach and target potential customers. Moreover, these OEMs provide a single point of accountability where needed and supplement our internal customer service and support capabilities. These OEMs also provide important product validation for potential customers through their endorsement of our technology and by integrating our platform into products they offer to end-users. We also believe that our close OEM relationships will |
-7-
Table of Contents
| allow us to collaborate in the development of new applications using our platform. We intend to continue to pursue additional OEM relationships in the future to expand our market reach. |
| • | Pursue International Opportunities — We believe that international markets represent a significant growth opportunity. We are expanding our global presence by growing direct sales teams in international markets, leveraging our established OEM relationships and pursuing additional channel partners in those regions. We intend to focus our near term international efforts in Asia Pacific and Europe. |
Technology
Our next generation storage memory platform for data decentralization integrates a diverse portfolio of enterprise grade technologies. Our sophisticated hardware and software design transforms commodity non-volatile memory into enterprise class storage memory and provides interfaces between storage memory resources and operating systems. In addition, our advanced software capabilities include the development of new and innovative storage applications, as well as platform management software.
ioMemory Hardware and Systems Architecture
Our ioMemory forms the basis of our hardware offering and is designed as a portfolio of upgradeable modules, enabling faster time-to-market and increased extensibility. ioMemory provides a new type of server-based storage memory, integrates our proprietary field programmable data-path controller and connects a large array of non-volatile memory that provides up to 100 times the capacity density of dynamic random access memory, or DRAM. Our ioMemory modules, which currently use NAND Flash memory, can be aggregated to build storage systems of varying capacity, performance and form factors. At the heart of the ioMemory hardware is our proprietary data-path controller. It connects a large array of non-volatile memory chips natively to the server’s PCI-Express peripheral bus, or PCIe, and addresses the reliability issues of non-volatile memory with our Flashback Protection advanced self-healing technology, which is capable of restoring, correcting and resurrecting lost data in the Flash-based storage sub-system. This is accomplished by using an advanced bit error correction, proactive data integrity monitoring of stored data and dedicated memory chips to automate the repair of failed devices in real-time.
The modularity of ioMemory provides both manufacturing flexibility and the ability to design and build new products quickly. Traditional storage approaches use application specific integrated circuits for their embedded controllers that are not fully reprogrammable, creating the need for periodic redesigns, which can be expensive and time consuming. ioMemory uses our proprietary data-path controller that can be reprogrammed and upgraded with new firmware, allowing the features of our products to be expanded, customized, and upgraded by our customers. In addition, by directly attaching to a server’s peripheral bus through the industry-standard PCIe interface, our products can be installed into a server’s PCIe expansion slots, allowing customers to use our products either in new or existing server datacenter equipment. Because our data-path controllers are reprogrammable, our products can incorporate non-volatile memory from a variety of suppliers and are more readily adaptable to changes in non-volatile memory over time. Although we use NAND Flash today, we believe we are unique in our capability to quickly integrate the newest and highest density non-volatile memory technologies as they become available.
Our architecture allows our ioMemory to achieve access rates approximately 1,000 times that of traditional hard disk drives by combining the parallel performance from an array of non-volatile memory devices, while avoiding the bottlenecks of slow storage networks, controllers, buses and protocols. Our approach differs substantially from those approaches used by hybrid disk drive and most solid state drive, or SSD, vendors that are forced to emulate traditional hard disk drives and utilize legacy interfaces and embedded controllers, which constrain the flow of data between device and operating system, resulting in low application performance due to the higher access latency. Our technology manages the non-volatile memory directly from the operating system, eliminating the need for these legacy interfaces and embedded controllers in our solution.
-8-
Table of Contents
Virtual Storage Layer Software
Our VSL virtualization software enables ioMemory to operate as a new data storage memory tier within the enterprise server and with more efficiency and capability than traditional storage devices using embedded controllers. VSL software integrates with the server’s operating system and provides native access to data stored on ioMemory, bypassing legacy storage input / output interfaces. In doing so, VSL software allows servers to achieve significantly increased application performance and data processing with low latency access and high bandwidth throughput from the ioMemory hardware. Non-volatile memory, including NAND Flash memory, is inherently asymmetrical in that read, program and erase times are different, resulting in divergent read and write access times. VSL software allows the non-volatile memory in ioMemory to read and write with nearly equivalent times by means of a log-structured data store that completes data transactions in microseconds as opposed to alternative high performance filing systems that complete data transactions in milliseconds, which implies an approximately 1,000 times improvement in storage performance. Because VSL software is extensible, we are able to add new features such as our recently released directCache data-tiering software and ioSphere management software, as well as our soon to be released data acceleration solutions for virtualized environments, which we recently acquired through the acquisition of IO Turbine. VSL software runs on a variety of operating systems, including Windows, Linux, VMware ESX/ESXi, Solaris and Mac OS X.
Products
Our portfolio of storage memory products incorporates our ioMemory hardware modules and related VSL software into our family of ioDrive and ioCache enterprise grade products. Our ioDrive products work in conjunction with our directCache data-tiering software, ioTurbine virtualization software and ioSphere management system software. ioCache is a new purpose-built ioMemory-based product dedicated to accelerating ioTurbine virtualization software and address low-cost virtualized application workloads. We expect to begin selling the ioCache product in the second quarter of fiscal 2012.
ioDrive and ioCache Products
Our ioDrive and ioCache product families are a line of PCIe standard form-factor storage memory platforms that combine one or more ioMemory modules with our VSL software. We classify our ioDrive and ioCache products based on capacity, latency, bandwidth and input / output operations per second, or IOPS. Our ioDrive and ioCache products offer the following standard specifications:
| Product |
ioMemory Modules |
NAND Type |
VSL Software |
Performance | ||||
| ioDrive |
1 | SLC-160GB SLC-320GB MLC-320GB MLC-640GB |
Yes | 26uS latency, up to 790MB/sec and up to 145,000 IOPS | ||||
| ioCache |
1 | MLC-600GB | Yes | Optimized latency, bandwidth and IOPS for virtualized applications | ||||
| ioDrive Duo |
2 | SLC-320GB SLC-640GB MLC-640GB MLC-1.28TB |
Yes | 26uS latency, up to 1.5GB/sec and up to 285,000 IOPS | ||||
| ioDrive Octal |
8 | MLC-5.12TB | Yes | 30uS latency, up to 6GB/sec and up to 1,190,000 IOPS |
directCache Data-Tiering Software
Our directCache software extends our ioMemory platform and permits interoperability with traditional direct-attached, network-attached, storage area network attached and appliance attached backend storage
-9-
Table of Contents
systems. This software is designed to intelligently identify, copy and cache to ioMemory the most frequently accessed blocks of storage data from very large-scale backend datasets. This active data can then be retrieved significantly faster, allowing the applications accessing the data to achieve performance as if the entire dataset were stored locally on the ioMemory. This capability allows enterprises to realize the benefits of our technology without replacing or modifying their existing datacenter infrastructure. Our directCache software is compatible with all of our ioDrive products.
ioTurbine Virtualization Software
Our recently acquired ioTurbine virtualization software extends our ioMemory platform and permits host-based data acceleration to specifically address the demand for high-density, high-performance server and desktop virtualization. The ioTurbine software takes advantage of flash memory local to the server, dynamically provisions ioMemory capacity and input / output performance across multiple virtual machines, or VMs, and delivers improved performance for virtualized workloads by serving data for each VM context. This approach eliminates otherwise redundant mapping functions, maximizing input / output performance and adding a critical and previously missing piece to virtualized IT environments – an ample supply of scalable, low-latency input / output. ioTurbine virtualization software is compatible with all of our ioDrive and ioCache products. The ioTurbine virtualization software will be released for general availability in the second quarter of fiscal 2012.
ioSphere Platform Management Software
ioSphere is a suite of management software purpose-built for our storage memory infrastructure and designed around our data decentralization platform. ioSphere software is accessible through a graphical user interface that enables datacenter administrators to centrally configure, monitor, manage and tune all distributed ioMemory devices throughout the datacenter. In addition, this software offers real-time, predictive and historical reporting of ioMemory’s performance and wear. ioSphere software also includes our ioManager and ioDirector modules. ioManager is a local device management software module that allows customers to manage one or more ioMemory platforms installed in a single server. ioDirector provides centralized management of ioMemory platforms across multiple servers within a datacenter.
OEM Products
Our OEMs, including Dell, HP and IBM, sell branded storage memory solutions based on our standard products as well as custom form-factor versions to fit specific applications. For example, HP offers a tailored version of our technology in a form-factor specific to its C-class blade servers, which it markets as “HP StorageWorks IO Accelerator”. Similarly, IBM incorporates a tailored version of our ioDrive product into its “InfoSphere Smart Analytics System 5600” and “WebSphere XC10 Middleware” appliances.
Sales and Marketing
We sell our products through our global direct sales force, OEMs and other channel partners.
Our direct sales teams are typically comprised of a combination of a field sales representative, a systems engineer, and an inside sales development representative. Each sales team is responsible for either a geographical territory or has responsibility for a number of named major accounts. The sales cycle from the time of initial prospect qualification to completion of an initial sale may take a few days or several months. After initial deployment, our sales teams focus on ongoing account management and the development of follow-on sales. A majority of the sales opportunities that we generate are directly fulfilled via one of our existing OEM partners.
We also have OEM-focused sales teams. These sales teams are dedicated to working exclusively with each of our OEM partners to maximize the global market penetration of our technology. Current OEMs include Dell, HP, IBM, and others. Our OEMs sell and support our products through their respective sales channels, their direct distribution, their value added resellers and their systems integrators. Our OEMs may integrate our
-10-
Table of Contents
platform into their own proprietary product offerings or sell a customized or branded version of our standard products.
We also work closely with a variety of other OEM and channel partners to promote and sell our products. These companies include appliance builders, systems integrators, and various private label system manufacturers. We offer a technology alliance partnership program to jointly create and develop hardware and software solutions with a number of independent software and appliance vendors. We believe these types of partner efforts will facilitate broader and faster adoption of our products and technology.
We focus our marketing efforts on increasing brand awareness, communicating product advantages and generating qualified leads for our sales force, OEMs and other channel partners. We rely on a variety of marketing vehicles, including trade shows, advertising, public relations, industry research, our website and collaborative relationships with technology vendors.
Customers
Our products are used in a variety of markets such as financial services, Internet, technology, education, retail, manufacturing, energy, life sciences and government.
We generally sell pursuant to individual purchase orders from direct customers and under various master supply or reseller agreements. Our ten largest customers, including the applicable OEM customers, accounted for an aggregate of 47%, 75% and 92% of our revenue in fiscal 2009, 2010 and 2011, respectively. The composition of the group of our largest customers changes from period to period. Our OEM customers IBM and HP, direct customer Facebook and Apple, through a reseller, each accounted for 13%, 10%, 10% and less than 10% of our revenue, respectively, in fiscal 2010, and less than 10%, 14%, 36% and 24% of our revenue, respectively, in fiscal 2011. We expect that sales of our products to a limited number of customers will continue to account for a majority of our revenue in the foreseeable future.
Customer Support
We offer standard warranty service and support with our products, including those sold directly or through resellers. This includes periodic software updates and maintenance releases and patches, if-and-when available, and other product support such as Internet access to technical content and 24-hour telephone and email access to technical support personnel. Our OEMs provide primary product support for our products sold by them. We also sell premium-tiered support pursuant to service contracts. Service contracts typically have a one-year term, though some customers contract for longer terms. Our support personnel are primarily based in San Jose, California and Salt Lake City, Utah. As we expand internationally, we expect to continue to hire additional technical support personnel to service our global customer base.
Research and Development
Our research and development efforts are focused primarily on improving and enhancing our existing products and developing new hardware and software solutions. We believe that software is critical to expanding our leadership in data decentralization. Accordingly, we are devoting the majority of our research and development resources to software development including value added software such as third party infrastructure and applications. We also intend to enhance our ioManager, ioTurbine, ioSphere and directCache software, including adding monitoring service capabilities. We also intend to further enhance our VSL software. Our engineering team has deep operating system expertise, including Linux kernel contributors and developers with expertise in a variety of other operating systems. We work closely with our customers to understand their current and future needs and have designed a product development process that integrates our customers’ feedback.
We believe the timely development of new products is essential to maintaining our competitive position. As of June 30, 2011, we had 152 employees in our research and development organization, substantially all of whom
-11-
Table of Contents
were located at our locations in Salt Lake City, Utah, Boulder, Colorado and San Jose, California. We also supplement our research and development efforts with third-party developers and contractors. We also test our products to certify and ensure interoperability with third-party hardware and software products, including PCIe interoperability and OEM certification. We plan to dedicate significant resources to these continued research and development efforts.
Our research and development expenses were $11.7 million, $16.0 million and $27.2 million in fiscal 2009, 2010 and 2011, respectively.
Manufacturing
We outsource the manufacturing of our hardware products to our contract manufacturers, AlphaEMS Manufacturing Corporation and Jabil Circuit, Inc. We currently procure a majority of the components used in our products directly from third-party vendors and have them delivered to our contract manufacturers. AlphaEMS and Jabil manufacture and assemble our products and deliver them to us for labeling, quality assurance testing, final configuration, including a final firmware installation, and shipment to our customers.
Our manufacturing process is designed to minimize the amount of inventory that we are required to retain to meet customer demand. We place orders with our contract manufacturers on a purchase order basis, and in general, we engage our contract manufacturers to manufacture products to meet our forecasted demand or when our inventories drop below certain levels. Our agreements with our contract manufacturers require us to provide regular forecasts for orders. However, we may cancel or reschedule orders, subject to applicable notice periods and fees, and delivery schedules requested by us in these purchase orders vary based upon our particular needs. Our contract manufacturers work closely with us to ensure design for manufacturability and product quality.
Backlog
We do not believe that our backlog at any particular time is meaningful because it is not necessarily indicative of future revenue. In particular, customers may generally cancel or reschedule orders without penalty, and delivery schedules requested by customers in their purchase orders frequently vary based upon each customer’s particular needs. Additionally, shipments to customers may be delayed due to inventory constraints.
Competition
We believe that the most important competitive factor in our market is to provide a comprehensive platform with the following attributes:
| • | hardware incorporating sufficient capacity and rate of access, in a form factor that can be integrated within industry-standard servers; |
| • | software that virtualizes storage resources and governs the flow and management of data between storage and the server; |
| • | software that enables this platform to be utilized within both new and existing datacenter architectures; and |
| • | software that centrally configures, manages and monitors this new distributed infrastructure. |
Other principal factors affecting our market include:
| • | application performance, including consistent low latency and high bandwidth; |
| • | providing enterprise grade data endurance, reliability, retention and availability not inherent in NAND Flash memory; |
| • | ease of management; |
-12-
Table of Contents
| • | space efficiency; |
| • | energy efficiency; and |
| • | total cost of ownership. |
We believe that we compete favorably with our competitors on the basis of these factors.
Our storage memory platform competes with various traditional datacenter architectures, including high performance server and storage approaches. These may include offerings from traditional data storage providers, including storage array vendors such as EMC Corporation, Hitachi Data Systems and NetApp Inc., who typically sell centralized storage products as well as high-performance storage approaches utilizing solid state disks, as well as vertically integrated appliance vendors such as Oracle. In addition, we may also compete with enterprise solid state disk vendors such as Huawei Technologies, Co., Intel Corp., LSI Corporation, Marvell Semiconductor, Inc., Micron Technology, Inc., OCZ Technology Group, Inc., Samsung Electronics, Inc., SanDisk, Corp., Seagate Technology, STEC, Inc., Toshiba Corp. and Western Digital Corp. Our directCache data-tiering software competes with products of suppliers of software-hardware cache solutions, including LSI Corporation and Adaptec, Inc., as well as several open source software solutions and other software-based hardware cache solutions being developed by privately held companies. Although our ioSphere platform management software is specifically designed to manage solid state storage, it competes with products of developers of general-purpose distributed management and monitoring software solutions, including HP, IBM, CA, Inc. and Nagios Enterprises, LLC. A number of new, privately held companies are currently attempting to enter our market, one or more of which may become significant competitors in the future.
Many of our current competitors have, and some of our potential competitors could have, longer operating histories, greater name recognition, larger customer bases and significantly greater financial, technical, sales, marketing and other resources than we have. Potential customers may prefer to purchase from their existing suppliers rather than a new supplier regardless of product performance or features. Some of our competitors have made acquisitions of businesses that allow them to offer more directly competitive and comprehensive solutions than they had previously offered. In addition, some of our competitors may sell at zero or negative margins to gain business. Our current and potential competitors may also establish cooperative relationships among themselves or with third parties. As a result, we cannot assure that our products will continue to compete favorably, and any failure to do so could seriously harm our business, operating results and financial condition.
Intellectual Property
Our success depends in part upon our ability to protect our core technology and intellectual property. We rely on patents, trademarks, copyrights and trade secret laws, confidentiality procedures, and employee disclosure and invention assignment agreements to protect our intellectual property rights.
We have 7 issued patents and 87 patent applications in the United States and 94 corresponding patent applications in foreign countries, as of September 2, 2011 relating to non-volatile solid state storage, non-volatile solid state memory, software acceleration, and related technologies. We cannot assure you whether any of our patent applications will result in the issuance of a patent or whether the examination process will require us to narrow our claims. Any patents that may issue may be contested, circumvented, found unenforceable or invalidated, and we may not be able to prevent third parties from infringing them.
We generally control access to and use of our proprietary software and other confidential information through the use of internal and external controls, including contractual protections with employees, contractors, customers and partners, and our software is protected by U.S. and international copyright laws. Despite our efforts to protect our trade secrets and proprietary rights through intellectual property rights, licenses and confidentiality agreements, unauthorized parties may still copy or otherwise obtain and use our software and technology. In addition, we intend to expand our international operations, and effective patent, copyright, trademark and trade secret protection may not be available or may be limited in foreign countries.
-13-
Table of Contents
Third parties could claim that our products or technologies infringe their proprietary rights. The data storage industry is characterized by the existence of a large number of patents, trademarks and copyrights and by frequent litigation based on allegations of infringement or other violations of intellectual property rights. We expect that infringement claims may further increase as the number of products and competitors in our market increase. In addition, to the extent that we gain greater visibility and market exposure as a public company, we face a higher risk of being the subject of intellectual property infringement claims from third parties. We cannot assure you that we do not currently infringe, or that we will not in the future infringe, upon any third-party patents or other proprietary rights. See “Risk Factors” for additional information.
Employees
We believe the expertise of our people and our technology focused culture is a key enabler of our technology leadership. Our team has a broad range of expertise across operating systems, datacenter software, systems, storage, networking and servers. As of June 30, 2011, we had 441 employees, including 232 in sales and marketing, 152 in research and development and 57 in general and administrative activities. None of our employees is represented by a labor organization or is a party to any collective bargaining arrangement, we have never had a work stoppage and we consider our relationship with our employees to be good.
Financial Information about Segments and Geographic Areas
We operate our business in one segment. The segment and geographic information required herein is contained in Note 1 — Segment and Geographic Information, in the notes to our consolidated financial statements.
Additional Information
Company Website and Public Filings. We maintain a corporate website at www.fusionio.com. Except as explicitly noted, the information on our website is not incorporated by reference in this annual report on Form 10-K, or in any other filings with, or in any information furnished or submitted to, the Securities and Exchange Commission or the SEC.
We make available, free of charge through our website, our annual reports on Form 10-K, quarterly reports on Form 10-Q and current reports on Form 8-K, and amendments to those reports, filed or furnished pursuant to Sections 13(a) or Section 15(d) of the Securities Exchange Act of 1934, as amended, as soon as reasonably practicable after they have been electronically filed with, or furnished to, the SEC.
The public may read and copy any materials we file with the SEC at the SEC’s Public Reference Room at 100 F. Street, NE, Washington, DC 20549. The public may obtain information on the operation of the Public Reference Room by calling the SEC at 1-800-SEC-0330. The SEC maintains an internet site (http://www.sec.gov) that contains reports, proxy and information statements, and other information regarding issuers that file electronically with the SEC.
Set forth below and elsewhere in this annual report on Form 10-K, and in other documents we file with the SEC, are descriptions of risks and uncertainties that could cause actual results to differ materially from the results contemplated by the forward-looking statements contained in this report. Because of the following factors, as well as other variables affecting our operating results, past financial performance should not be considered a reliable indicator of future performance and investors should not use historical trends to anticipate results or trends in future periods. The risks and uncertainties described below are not the only ones we face. Other events that we do not currently anticipate or that we currently deem immaterial also may affect our results of operations and financial condition.
-14-
Table of Contents
Risks Related to Our Business and Industry
Our limited operating history makes it difficult to evaluate our current business and future prospects, and may increase the risk of your investment.
We were founded in December 2005 and sold our first products in April 2007. The majority of our revenue growth has occurred since the quarter ended December 31, 2009. We are still in the process of introducing central components of our software offerings, have only recently released for general availability our ioSphere and directCache software and have not yet released our recently acquired ioTurbine virtualization software. In addition, our current management team has only been working together for a short period of time. Our limited operating history makes it difficult to evaluate our current business and our future prospects, including our ability to plan for and model future growth. We have encountered and will continue to encounter risks and difficulties frequently experienced by growing companies in rapidly changing industries, such as the risks described herein. If we do not address these risks successfully, our business and operating results would be adversely affected, and our stock price could decline.
Our revenue growth rate in recent periods is not expected to recur in the near term and may not be indicative of our future performance.
You should not consider our revenue growth in recent periods as indicative of our future performance. In fact, in future periods, our revenue could decline. We do not expect to achieve similar percentage revenue growth rates in future periods. We have experienced in the past, and continue to expect to experience, substantial concentrated purchases by customers to complete or upgrade large-scale datacenter deployments. Our revenue in any particular quarterly period could be disproportionately affected if this trend continues. You should not rely on our revenue for any prior quarterly or annual periods as an indication of our future revenue growth. If we are unable to maintain consistent revenue growth, our stock price could be volatile, and it may be difficult to achieve and maintain profitability.
We have experienced rapid growth in recent periods and we may not be able to sustain or manage any future growth effectively.
We have significantly expanded our overall business, customer base, headcount and operations since June 2010, and we anticipate that we will continue to grow our business. For example, from June 30, 2010 to June 30, 2011, our headcount increased from 262 to 441 employees. Our future operating results depend to a large extent on our ability to successfully manage our anticipated expansion and growth.
To manage our growth successfully, we believe we must effectively, among other things:
| • | maintain and extend our leadership in data decentralization; |
| • | maintain and expand our existing original equipment manufacturer, or OEM, and channel partner relationships and develop new OEM and channel partner relationships; |
| • | forecast and control expenses; |
| • | recruit, hire, train and manage additional research and development and sales personnel; |
| • | expand our support capabilities; |
| • | enhance and expand our distribution and supply chain infrastructure; |
| • | manage inventory levels; |
| • | enhance and expand our international operations; and |
| • | implement and improve our administrative, financial and operational systems, procedures and controls. |
-15-
Table of Contents
We expect that our future growth will continue to place a significant strain on our managerial, administrative, operational, financial and other resources. We are likely to incur costs associated with our future growth earlier than we realize some of the anticipated benefits, and the return on these investments may be lower, or may develop more slowly, than we expect or may be nonexistent. If we are unable to manage our growth effectively, we may not be able to take advantage of market opportunities or develop new products or enhancements to existing products and we may fail to satisfy end-users’ requirements, maintain product quality, execute on our business plan or respond to competitive pressures, each of which could adversely affect our business and operating results.
We have incurred significant net losses during our limited operating history and may not consistently achieve or maintain profitability.
Prior to the quarter ended March 31, 2011, we had incurred net losses in each quarter since our inception. We incurred a net loss of $32.5 million in fiscal 2010, and, as of June 30, 2011, we had an accumulated deficit of approximately $65.0 million. We may continue to incur losses in future periods as we increase our expenses in all areas of our operations. If our revenue does not increase to offset these expected increases in operating expenses, we will not be profitable. Accordingly, we cannot assure you that we will be able to consistently achieve or maintain profitability in the future.
We expect large and concentrated purchases by a limited number of customers to continue to represent a substantial majority of our revenue, and any loss or delay of expected purchases could adversely affect our operating results.
Historically, large purchases by a relatively limited number of customers have accounted for a substantial majority of our revenue, and the composition of the group of our largest customers changes from period to period. Some of our customers make concentrated purchases to complete or upgrade specific large-scale data storage installations. These concentrated purchases are short-term in nature and are typically made on a purchase order basis rather than pursuant to long-term contracts. During fiscal 2010 and 2011, sales to the 10 largest customers in each period, including the applicable OEMs, accounted for approximately 75% and 92% of revenue, respectively. Facebook, Inc. is currently our largest customer and accounted for 36% of revenue during fiscal 2011.
As a consequence of our limited number of customers and the concentrated nature of their purchases, our quarterly revenue and operating results may fluctuate from quarter to quarter and are difficult to estimate. For example, any acceleration or delay in anticipated product purchases or the acceptance of shipped products by our larger customers could materially impact our revenue and operating results in any quarterly period. We cannot provide any assurance that we will be able to sustain or increase our revenue from our large customers or that we will be able to offset the discontinuation of concentrated purchases by our larger customers with purchases by new or existing customers. We expect that sales of our products to a limited number of customers will continue to contribute materially to our revenue for the foreseeable future. The loss of, or a significant delay or reduction in purchases by, a small number of customers could materially harm our business and operating results.
Some of our large customers require more favorable terms and conditions from their vendors and may request price concessions. As we seek to sell more products to these customers, we may be required to agree to terms and conditions that may have an adverse effect on our business or ability to recognize revenue.
Some of our large customers have significant purchasing power and, accordingly, have requested and received more favorable terms and conditions, including lower prices, than we typically provide. As we seek to sell more products to this class of customer, we may be required to agree to these terms and conditions, which may include terms that affect the timing of our revenue recognition or may reduce our gross margins and have an adverse effect on our business and operating results.
-16-
Table of Contents
The future growth of our sales to OEMs is dependent on OEM customers incorporating our products into their server and data storage systems and the OEM’s sales efforts. Any failure to grow our OEM sales and maintain relationships with OEMs could adversely affect our business, operating results and financial condition.
Sales of our products to OEMs represent a significant portion of our revenue and we anticipate that our OEM sales will constitute a substantial portion of our future sales. In some cases, our products must be designed into the OEM’s products. If that fails to occur for a given product line of an OEM, we would likely be unable to sell our products to that OEM for such product line during the life cycle of that product. Even if an OEM integrates one or more of our products into its server, data storage systems or appliance solutions, we cannot be assured that its product will be commercially successful, and as a result, our sales volumes may be less than anticipated. Our OEM customers are typically not obligated to purchase our products and can choose at any time to stop using our products, if their own systems are not commercially successful or if they decide to pursue other strategies or for any other reason, including the incorporation or development of competing products by these OEMs. Moreover, our OEM customers may not devote sufficient attention and resources to selling our products. We may not be able to develop or maintain relationships with OEMs for a number of reasons, including because of the OEM’s relationships with our competitors or prospective competitors or other incentives that may not motivate their internal sales forces to promote our products. Even if we are successful in selling through OEMs, we expect that sales through OEMs will be a lower gross margin business than our direct sales business. If we are unable to grow our OEM sales, if our OEM customers’ systems incorporating our products are not commercially successful, if our products are not designed into a given OEM product cycle or if our OEM customers significantly reduce, cancel or delay their orders with us, our revenue would suffer and our business, operating results and financial condition could be materially adversely affected.
Ineffective management of our inventory levels could adversely affect our operating results.
If we are unable to properly forecast, monitor, control and manage our inventory and maintain appropriate inventory levels and mix of products to support our customers’ needs, we may incur increased and unexpected costs associated with our inventory. Sales of our products are generally made through individual purchase orders and some of our customers place large orders with short lead times, which makes it difficult to predict demand for our products and the level of inventory that we need to maintain to satisfy customer demand. If we build our inventory in anticipation of future demand that does not materialize, or if a customer cancels or postpones outstanding orders, we could experience an unanticipated increase in levels of our finished products. For some customers, even if we are not contractually obligated to accept returned products, we may determine that it is in our best interest to accept returns in order to maintain good relationships with those customers. Product returns would increase our inventory and reduce our revenue. If we are unable to sell our inventory in a timely manner, we could incur additional carrying costs, reduced inventory turns and potential write-downs due to obsolescence.
Alternatively, we could carry insufficient inventory, and we may not be able to satisfy demand, which could have a material adverse effect on our customer relationships or cause us to lose potential sales.
We have recently experienced order changes including delivery delays and fluctuations in order levels from period-to-period, and we expect to continue to experience similar delays and fluctuations in the future, which could result in fluctuations in inventory levels, cash balances and revenue.
The occurrence of any of these risks could adversely affect our business, operating results and financial condition.
Our operating results may fluctuate significantly, which could make our future results difficult to predict and could cause our operating results to fall below expectations.
Our operating results may fluctuate due to a variety of factors, many of which are outside of our control. As a result, comparing our operating results on a period-to-period basis may not be meaningful. You should not rely
-17-
Table of Contents
on our past results as an indication of our future performance. If our revenue or operating results fall below the expectations of investors or any securities analysts that follow our company, the price of our common stock would likely decline.
Factors that are difficult to predict and that could cause our operating results to fluctuate include:
| • | the timing and magnitude of orders, shipments and acceptance of our products in any quarter; |
| • | our ability to control the costs of the components we use in our hardware products; |
| • | reductions in customers’ budgets for information technology purchases; |
| • | delays in customers’ purchasing cycles or deferments of customers’ product purchases in anticipation of new products or updates from us or our competitors; |
| • | fluctuations in demand and prices for our products; |
| • | changes in industry standards in the data storage industry; |
| • | our ability to develop, introduce and ship in a timely manner new products and product enhancements that meet customer requirements; |
| • | the timing of product releases or upgrades or announcements by us or our competitors; |
| • | any change in the competitive dynamics of our markets, including new entrants or discounting of product prices; |
| • | our ability to control costs, including our operating expenses; and |
| • | future accounting pronouncements and changes in accounting policies. |
The occurrence of any one of these risks could negatively affect our operating results in any particular quarter and which could cause the price of our common stock to decline.
Our sales cycles can be long and unpredictable, particularly with respect to large orders and OEM relationships, and our sales efforts require considerable time and expense. As a result, it can be difficult for us to predict when, if ever, a particular customer will choose to purchase our products, which may cause our operating results to fluctuate significantly.
Our sales efforts involve educating our customers about the use and benefits of our products, including their technical capabilities and cost saving potential. Customers often undertake an evaluation and testing process that can result in a lengthy sales cycle. We spend substantial time and resources on our sales efforts without any assurance that our efforts will produce any sales. In addition, product purchases are frequently subject to budget constraints, multiple approvals and unplanned administrative, processing and other delays. Additionally, a significant portion of our sales personnel have been with us for less than a year, and we continue to increase our number of sales personnel, which could further extend the sales cycle as these new personnel are typically not immediately productive. These factors, among others, could result in long and unpredictable sales cycles, particularly with respect to large orders.
We also sell to OEMs that incorporate our solutions into their products, which can require an extended evaluation and testing process before our product is approved for inclusion in one of their product lines. We also may be required to customize our product to interoperate with an OEM’s product, which could further lengthen the sales cycle for OEM customers. The length of our sales cycle for an OEM makes us susceptible to the risk of delays or termination of orders if end-users decide to delay or withdraw funding for datacenter projects, which could occur for various reasons, including global economic cycles and capital market fluctuations.
As a result of these lengthy and uncertain sales cycles of our products, it is difficult for us to predict when customers may purchase and accept products from us and as a result, our operating results may vary significantly and may be adversely affected.
-18-
Table of Contents
We compete with large storage and software providers and expect competition to intensify in the future from established competitors and new market entrants.
The market for data storage products is highly competitive, and we expect competition to intensify in the future. Our products compete with various traditional datacenter architectures, including high performance server and storage approaches. These may include the traditional data storage providers, including storage array vendors such as EMC Corporation, Hitachi Data Systems and NetApp, Inc., which typically sell centralized storage products as well as high performance storage approaches utilizing solid state drives, or SSDs, as well as vertically integrated appliance vendors such as Oracle. In addition, we may also compete with enterprise solid state disk vendors such as Huawei Technologies, Co., Intel Corp., LSI Corporation, Marvell Semiconductor, Inc., Micron Technology, Inc., Samsung Electronics, Inc., SanDisk Corp., OCZ Technology Group, Inc., Seagate Technology, STEC, Inc., Toshiba Corp. and Western Digital Corp. Our directCache data-tiering software competes with products from suppliers of software-hardware cache solutions, including LSI Corporation and Adaptec, Inc., as well as several open source software solutions and other software-based hardware cache solutions being developed by privately held companies. Although our ioSphere platform management software is specifically designed to manage solid state storage, it competes with products of developers of general-purpose distributed management and monitoring software solutions, including HP, IBM, CA, Inc. and Nagios Enterprises, LLC. A number of new, privately held companies are currently attempting to enter our market, some of which may become significant competitors in the future.
Many of our current competitors have, and some of our potential competitors could have, longer operating histories, greater name recognition, larger customer bases and significantly greater financial, technical, sales, marketing and other resources than we have. Potential customers may prefer to purchase from their existing suppliers rather than a new supplier regardless of product performance or features. New start-up companies continue to innovate and may invent similar or superior products and technologies that may compete with our products and technology. Some of our competitors have made acquisitions of businesses that may allow them to offer more directly competitive and comprehensive solutions than they had previously offered. In addition, some of our competitors, including our OEM customers, may develop competing technologies and sell at zero or negative margins, through product bundling, closed technology platforms or otherwise, to gain business. Our current and potential competitors may also establish cooperative relationships among themselves or with third parties. As a result, we cannot assure you that our products will continue to compete favorably, and any failure to do so could seriously harm our business, operating results and financial condition.
Competitive factors could make it more difficult for us to sell our products, resulting in increased pricing pressure, reduced gross margins, increased sales and marketing expenses, longer customer sales cycles and failure to increase, or the loss of, market share, any of which could seriously harm our business, operating results and financial condition. Any failure to meet and address these competitive challenges could seriously harm our business and operating results.
The market for non-volatile storage memory products is relatively undeveloped and rapidly evolving, which makes it difficult to forecast end-user adoption rates and demand for our products.
The market for non-volatile storage memory products is relatively undeveloped and rapidly evolving. Accordingly, our future financial performance will depend in large part on growth in this market and on our ability to adapt to emerging demands in this market. Sales of our products currently are dependent in large part upon demand in markets that require high performance data storage solutions such as computing, Internet and financial services. It is difficult to predict with any precision end-user adoption rates, end-user demand for our products or the future growth rate and size of our market. The rapidly evolving nature of the technology in the data storage products market, as well as other factors that are beyond our control, reduce our ability to accurately evaluate our future outlook and forecast quarterly or annual performance. Our products may never reach mass adoption, and changes or advances in technologies could adversely affect the demand for our products. Further, although Flash-based data storage products have a number of advantages compared to other data storage alternatives, Flash-based storage devices have certain disadvantages as well, including a higher price per gigabyte of storage, potentially shortened
-19-
Table of Contents
product lifespan, more limited methods for data recovery and lower performance for certain uses, including sequential input / output transactions and increased utilization of host system resources than traditional storage, and may require end-users to modify or replace network systems originally made for traditional storage media. A reduction in demand for Flash-based data storage caused by lack of end-user acceptance, technological challenges, competing technologies and products or otherwise would result in a lower revenue growth rate or decreased revenue, either of which could negatively impact our business and operating results.
If our industry experiences declines in average sales prices, it may result in declines in our revenue and gross profit.
The data storage products industry is highly competitive and has historically been characterized by declines in average sales prices. It is possible that the market for decentralized storage solutions could experience similar trends. Our average sales prices could decline due to pricing pressure caused by several factors, including competition, the introduction of competing technologies, overcapacity in the worldwide supply of Flash-based or similar memory components, increased manufacturing efficiencies, implementation of new manufacturing processes and expansion of manufacturing capacity by component suppliers. If we are required to decrease our prices to be competitive and are not able to offset this decrease by increases in volume of sales or the sales of new products with higher margins, our gross margins and operating results would likely be adversely affected.
Developments or improvements in storage system technologies may materially adversely affect the demand for our products.
Significant developments in data storage systems, such as advances in solid state storage drives or improvements in non-volatile memory, may materially and adversely affect our business and prospects in ways we do not currently anticipate. For example, improvements in existing data storage technologies, such as a significant increase in the speed of traditional interfaces for transferring data between storage and a server or the speed of traditional embedded controllers, could emerge as preferred alternative to our products especially if they are sold at lower prices. This could be the case even if such advances do not deliver all of the benefits of our products. Any failure by us to develop new or enhanced technologies or processes, or to react to changes or advances in existing technologies, could materially delay our development and introduction of new products, which could result in the loss of competitiveness of our products, decreased revenue and a loss of market share to competitors.
We derive substantially all of our revenue from a single line of products, and a decline in demand for these products would cause our revenue to grow more slowly or to decline.
Our storage memory product line accounts for substantially all of our revenue and will continue to comprise a significant portion of our revenue for the foreseeable future. As a result, our revenue could be reduced by:
| • | the failure of our storage memory products to achieve broad market acceptance; |
| • | any decline or fluctuation in demand for our storage memory products, whether as a result of product obsolescence, technological change, customer budgetary constraints or other factors; |
| • | the introduction of products and technologies that serve as a replacement or substitute for, or represent an improvement over, these products; and |
| • | our inability to release enhanced versions of our products, including any related software, on a timely basis. |
If the storage markets grow more slowly than anticipated or if demand for our products declines, we may not be able to increase our revenue sufficiently to achieve and maintain profitability and our stock price would decline.
-20-
Table of Contents
If we fail to develop and introduce new or enhanced products on a timely basis, including innovations in our software offerings, our ability to attract and retain customers could be impaired and our competitive position could be harmed.
We operate in a dynamic environment characterized by rapidly changing technologies and industry standards and technological obsolescence. To compete successfully, we must design, develop, market and sell new or enhanced products that provide increasingly higher levels of performance, capacity and reliability and meet the cost expectations of our customers. The introduction of new products by our competitors, the market acceptance of products based on new or alternative technologies, or the emergence of new industry standards could render our existing or future products obsolete. Our failure to anticipate or timely develop new or enhanced products or technologies in response to technological shifts could result in decreased revenue and harm our business. If we fail to introduce new or enhanced products that meet the needs of our customers or penetrate new markets in a timely fashion, we will lose market share and our operating results will be adversely affected.
In order to maintain or increase our gross margins, we will need to continue to create valuable software solutions to be integrated with our storage memory products. Any new feature or application that we develop or acquire may not be introduced in a timely or cost-effective manner and may not achieve the broad market acceptance necessary to help increase our overall gross margins. If we are unable to successfully develop or acquire, and then market and sell our next generation products, our ability to increase our revenue and gross margin will be adversely affected.
Our products are highly technical and may contain undetected defects, which could cause data unavailability, loss or corruption that might, in turn, result in liability to our customers and harm to our reputation and business.
Our storage memory products and related software are highly technical and complex and are often used to store information critical to our customers’ business operations. Our products may contain undetected errors, defects or security vulnerabilities that could result in data unavailability, loss or corruption or other harm to our customers. Some errors in our products may only be discovered after they have been installed and used by customers. Any errors, defects or security vulnerabilities discovered in our products after commercial release could result in a loss of revenue or delay in revenue recognition, injury to our reputation, a loss of customers or increased service and warranty costs, any of which could adversely affect our business. In addition, we could face claims for product liability, tort or breach of warranty. Many of our contracts with customers contain provisions relating to warranty disclaimers and liability limitations, which may be difficult to enforce. Defending a lawsuit, regardless of its merit, would be costly and might divert management’s attention and adversely affect the market’s perception of us and our products. In addition, our business liability insurance coverage could prove inadequate with respect to a claim and future coverage may be unavailable on acceptable terms or at all. These product-related issues could result in claims against us and our business could be adversely impacted.
Our products must interoperate with operating systems, software applications and hardware that is developed by others and if we are unable to devote the necessary resources to ensure that our products interoperate with such software and hardware, we may fail to increase, or we may lose, market share and we may experience a weakening demand for our products.
Our products must interoperate with our customers’ existing infrastructure, specifically their networks, servers, software and operating systems, which may be manufactured by a wide variety of vendors and OEMs. When new or updated versions of these software operating systems or applications are introduced, we must sometimes develop updated versions of our software so that our products will interoperate properly. We may not accomplish these development efforts quickly, cost-effectively or at all. These development efforts require capital investment and the devotion of engineering resources. If we fail to maintain compatibility with these applications, our customers may not be able to adequately utilize the data stored on our products, and we may, among other consequences, fail to increase, or we may lose, market share and experience a weakening in demand for our products, which would adversely affect our business, operating results and financial condition.
-21-
Table of Contents
Our products must conform to industry standards in order to be accepted by customers in our markets.
Generally, our products comprise only a part of a datacenter. The servers, network, software and other components and systems of a datacenter must comply with established industry standards in order to interoperate and function efficiently together. We depend on companies that provide other components of the servers and systems in a datacenter to support prevailing industry standards. Often, these companies are significantly larger and more influential in driving industry standards than we are. Some industry standards may not be widely adopted or implemented uniformly, and competing standards may emerge that may be preferred by our customers. If larger companies do not support the same industry standards that we do, or if competing standards emerge, market acceptance of our products could be adversely affected, which would harm our business, operating results and financial condition.
We rely on our key technical, sales and management personnel to grow our business, and the loss of one or more key employees or the inability to attract and retain qualified personnel could harm our business.
Our success and future growth depends to a significant degree on the skills and continued services of our key technical, sales and management personnel. In particular, we are highly dependent on the services of our Chief Executive Officer, David Flynn. All of our employees work for us on an at-will basis, and we could experience difficulty in retaining members of our senior management team. We do not have “key person” life insurance policies that cover any of our officers or other key employees, other than our Chief Executive Officer. The loss of the services of any of our key employees could disrupt our operations, delay the development and introduction of our products, and negatively impact our business, prospects and operating results.
We plan to hire additional personnel in all areas of our business, particularly for sales and research and development. Competition for these types of personnel is intense. We cannot assure you that we will be able to successfully attract or retain qualified personnel. Our inability to retain and attract the necessary personnel could adversely affect our business, operating results and financial condition.
Our current research and development efforts may not produce successful products that result in significant revenue in the near future, if at all.
Developing our products and related enhancements is expensive. Our investments in research and development may not result in marketable products or may result in products that are more expensive than anticipated, take longer to generate revenue or generate less revenue, than we anticipate. Our future plans include significant investments in research and development and related product opportunities. We believe that we must continue to dedicate a significant amount of resources to our research and development efforts to maintain our competitive position. However, we may not receive significant revenue from these investments in the near future, if at all, which could adversely affect our business and operating results.
Our ability to sell our products is dependent in part on ease of use and the quality of our support offerings, and any failure to offer high-quality technical support would harm our business, operating results and financial condition.
Although our products are designed to be interoperable with existing servers and systems, we may need to provide customized installation and configuration support to our customers before our products become fully operational in their environments. Once our products are deployed within our customers’ datacenters, they depend on our support organization to resolve any technical issues relating to our products. Our ability to provide effective support is largely dependent on our ability to attract, train and retain qualified personnel. In addition, our sales process is highly dependent on our product and business reputation and on strong recommendations from our existing customers. Any failure to maintain high-quality installation and technical support, or a market perception that we do not maintain high-quality support, could harm our reputation, adversely affect our ability to sell our products to existing and prospective customers, and could harm our business, operating results and financial condition.
-22-
Table of Contents
If we fail to successfully maintain or grow our reseller and other channel partner relationships, our business and operating results could be adversely affected.
Our ability to maintain or grow our revenue will depend, in part, on our ability to maintain our arrangements with our existing channel partners and to establish and expand arrangements with new channel partners. Our channel partners may choose to discontinue offering our products or may not devote sufficient attention and resources toward selling our products. For example, our competitors may provide incentives to our existing and potential channel partners to use or purchase their products and services or to prevent or reduce sales of our products. The occurrence of any of these events could adversely affect our business and operating results.
We are exposed to the credit risk of some of our customers and to credit exposure in weakened markets, which could result in material losses.
Most of our sales are on an open credit basis. As a general matter, we monitor individual customer payment capability in granting open credit arrangements and may limit these open credit arrangements based on creditworthiness. We also maintain reserves we believe are adequate to cover exposure for doubtful accounts. Although we have programs in place that are designed to monitor and mitigate these risks, we cannot assure you these programs will be effective in reducing our credit risks, especially as we expand our business internationally. If we are unable to adequately control these risks, our business, operating results and financial condition could be harmed.
We currently rely on contract manufacturers to manufacture our products, and our failure to manage our relationship with our contract manufacturers successfully could negatively impact our business.
We rely on contract manufacturers, AlphaEMS Manufacturing Corporation and Jabil Circuit, Inc., to manufacture our products. We currently do not have any long-term manufacturing contracts with these contract manufacturers. Our reliance on these contract manufacturers reduces our control over the assembly process, exposing us to risks, including reduced control over quality assurance, production costs and product supply. If we fail to manage our relationship with these contract manufacturers effectively, or if these contract manufacturers experience delays, disruptions, capacity constraints or quality control problems in their operations, our ability to ship products to our customers could be impaired and our competitive position and reputation could be harmed. If we are required to change contract manufacturers or assume internal manufacturing operations, we may lose revenue, incur increased costs and damage our customer relationships. Qualifying a new contract manufacturer and commencing production is expensive and time-consuming. We may need to increase our component purchases, contract manufacturing capacity, and internal test and quality functions if we experience increased demand. The inability of these contract manufacturers to provide us with adequate supplies of high-quality products, could cause a delay in our order fulfillment, and our business, operating results and financial condition would be adversely affected.
We rely on a limited number of suppliers, and in some cases single-source suppliers, and any disruption or termination of these supply arrangements could delay shipments of our products and could materially and adversely affect our relationships with current and prospective customers.
We rely on a limited number of suppliers, and in some cases single-source suppliers, for several key components of our products, and we have not entered into agreements for the long-term purchase of these components. This reliance on a limited number of suppliers and the lack of any guaranteed sources of supply exposes us to several risks, including:
| • | the inability to obtain an adequate supply of key components, including non-volatile memory and reprogrammable controllers; |
| • | price volatility for the components of our products; |
| • | failure of a supplier to meet our quality, yield or production requirements; |
-23-
Table of Contents
| • | failure of a key supplier to remain in business or adjust to market conditions; and |
| • | consolidation among suppliers, resulting in some suppliers exiting the industry or discontinuing the manufacture of components. |
As a result of these risks, we cannot assure you that we will be able to obtain enough of these key components in the future or that the cost of these components will not increase. If our supply of certain components is disrupted, our lead times are extended or the cost of our components increases our business, operating results and financial condition could be materially adversely affected. If we are successful in growing our business, we may not be able to continue to procure components at current prices, which would require us to enter into longer term contracts with component suppliers to obtain these components at competitive prices. This could increase our costs and decrease our gross margins, harming our operating results.
Our results of operations could be affected by natural events in locations in which our customers or suppliers operate.
Several of our customers and suppliers have operations in locations that are subject to natural disasters, such as severe weather and geological events, which could disrupt the operations of those customers and suppliers. For example, in March 2011, the northern region of Japan experienced a severe earthquake followed by a tsunami. These geological events caused significant damage in that region and have adversely affected Japan’s infrastructure and economy. Some of our customers and suppliers are located in Japan and they have experienced, and may experience in the future, shutdowns as a result of these events, and their operations may be negatively impacted by these events. Our customers affected by this or a future natural disaster could postpone or cancel orders of our products, which could negatively impact our business. Moreover, should any of our key suppliers fail to deliver components to us as a result of this or a future natural disaster, we may be unable to purchase these components in necessary quantities or may be forced to purchase components in the open market at significantly higher costs. We may also be forced to purchase components in advance of our normal supply chain demand to avoid potential market shortages. In addition, if we are required to obtain one or more new suppliers for components or use alternative components in our solutions, we may need to conduct additional testing of our solutions to ensure those components meet our quality and performance standards, all of which could delay shipments to our customers and adversely affect our financial condition and results of operations.
To the extent we purchase excess or insufficient component inventory in connection with discontinuations by our vendors of components used in our products, our business or operating results may be adversely affected.
It is common in the storage and networking industries for component vendors to discontinue the manufacture of certain types of components from time to time due to evolving technologies and changes in the market. A supplier’s discontinuation of a particular type of component, such as a specific size of NAND Flash memory, may require us to make significant “last time” purchases of component inventory that is being discontinued by the vendor to ensure supply continuity until the transition to products based on next generation components or until we are able to secure an alternative supply. To the extent we purchase insufficient component inventory in connection with these discontinuations, we may experience delayed shipments, order cancellations or otherwise purchase more expensive components to meet customer demand, which could result in reduced gross margins. Alternatively, to the extent we purchase excess component inventory that we cannot use in our products due to obsolescence, we could be required to reduce the carrying value of inventory or be required to sell the components at or below our carrying value, which could reduce our gross margins. For example, in the quarter ended March 31, 2011, we sold excess raw materials related to end-of life products at their carrying value of approximately $4.0 million, which resulted in a decrease to our gross margins for that period.
-24-
Table of Contents
If we fail to remediate deficiencies in our control environment or are unable to implement and maintain effective internal control over financial reporting in the future, the accuracy and timeliness of our financial reporting may be adversely affected.
For fiscal 2009 and 2010, our independent registered public accounting firm noted material weaknesses related to our financial statement close process that resulted in audit adjustments. The material weaknesses were a result of the lack of a sufficient number of accounting personnel and a lack of formal accounting policies and procedures related to identification of unique contract terms that affected revenue recognition, proper identification and accounting for inventory in transit and evaluation units and the recording of certain expenses in the proper period. We also restated our consolidated financial statements for fiscal 2010 to reflect a deemed dividend associated with a repurchase of a portion of our convertible preferred stock.
Since July 1, 2010, we have taken and continue to take additional steps to upgrade our finance and accounting function, including the hiring of additional finance and accounting personnel, currently with aggregate related annualized salary expense of approximately $1.0 million, and implemented additional policies and procedures associated with the financial statement close process. Based upon these efforts, the material weaknesses were remediated by June 30, 2011.
We cannot assure you that these or other similar issues will not arise in future periods.
We will need to achieve and maintain effective internal control over financial reporting in accordance with Section 404 of the Sarbanes-Oxley Act and the failure to do so could have a material adverse effect on our business and stock price.
The Sarbanes-Oxley Act requires, among other things, that we maintain effective internal control over financial reporting and disclosure controls and procedures. In particular, commencing in fiscal 2012, we must perform system and process evaluation and testing of our internal control over financial reporting to allow management and our independent registered public accounting firm to report on the effectiveness of our internal control over financial reporting, as required by Section 404 of the Sarbanes-Oxley Act, or Section 404. Our compliance with Section 404 will require that we incur substantial expense and expend significant management efforts. If we are unable to comply with the requirements of Section 404 in a timely manner, or if we or our independent registered public accounting firm note or identify deficiencies in our internal control over financial reporting that are deemed to be material weaknesses, the market price of our stock could decline and we could be subject to sanctions or investigations by the New York Stock Exchange, the SEC, or other regulatory authorities, which would require additional financial and management resources.
If a third party asserts that we are infringing its intellectual property, whether successful or not, it could subject us to costly and time-consuming litigation or expensive licenses, and our business could be harmed.
The storage and networking industries are characterized by the existence of a large number of patents, copyrights, trademarks and trade secrets and by frequent litigation based on allegations of infringement or other violations of intellectual property rights. We have in the past received and may in the future receive inquiries from other intellectual property holders and may become subject to claims that we infringe their intellectual property rights, particularly as we expand our presence in the market and face increasing competition. For example, on April 22, 2011, we received a letter from Entorian Technologies, Inc. that alleged that memory stacks included in our products infringe one or more claims of one or two of Entorian’s patents. Based upon our preliminary investigation of the Entorian patents, we believe that our products do not infringe the claims of the two Entorian patents. If Entorian were to choose to pursue litigation, however, the costs associated with any resulting litigation could negatively impact our operating results regardless of the outcome of the litigation. In addition, on May 17, 2011, Internet Machines LLC filed a lawsuit in U.S. District Court for the Eastern District of Texas against us and 20 other companies. The complaint alleges that our products infringe U.S. Patent Nos. 7,454,552; 7,421,532; 7,814,259; and 7,945,722. The complaint seeks both damages and a permanent injunction against us. We have limited information about the specific infringement allegations, but they appear to focus on a
-25-
Table of Contents
PCI switch component that, while used in some of our products, is manufactured by a third-party supplier. We have requested this third-party supplier to indemnify and defend us with respect to this lawsuit. Based upon our preliminary investigation of the patents identified in the complaint, we do not believe that our products infringe any valid or enforceable claim of these patents. Nevertheless, the costs associated with any actual, pending or threatened litigation could negatively impact our operating results regardless of the actual outcome.
We currently have a number of agreements in effect pursuant to which we have agreed to defend, indemnify and hold harmless our customers, suppliers and channel partners from damages and costs which may arise from the infringement by our products of third-party patents, trademarks or other proprietary rights. The scope of these indemnity obligations varies, but may, in some instances, include indemnification for damages and expenses, including attorneys’ fees. Our insurance may not cover intellectual property infringement claims. A claim that our products infringe a third party’s intellectual property rights, if any, could harm our relationships with our customers, may deter future customers from purchasing our products and could expose us to costly litigation and settlement expenses. Even if we are not a party to any litigation between a customer and a third party relating to infringement by our products, an adverse outcome in any such litigation could make it more difficult for us to defend our products against intellectual property infringement claims in any subsequent litigation in which we are a named party. Any of these results could harm our brand and operating results.
Any intellectual property rights claim against us or our customers, suppliers and channel partners, with or without merit, could be time-consuming, expensive to litigate or settle, could divert management resources and attention and could force us to acquire intellectual property rights and licenses, which may involve substantial royalty payments. Further, a party making such a claim, if successful, could secure a judgment that requires us to pay substantial damages. An adverse determination also could invalidate our intellectual property rights and prevent us from offering our products to our customers and may require that we procure or develop substitute products that do not infringe, which could require significant effort and expense. We may have to seek a license for the technology, which may not be available on reasonable terms or at all, may significantly increase our operating expenses or require us to restrict our business activities in one or more respects. Any of these events could seriously harm our business, operating results and financial condition.
The success of our business depends in part on our ability to protect and enforce our intellectual property rights.
We rely on a combination of patent, copyright, service mark, trademark, and trade secret laws, as well as confidentiality procedures and contractual restrictions, to establish and protect our proprietary rights, all of which provide only limited protection. As of September 2, 2011, we had 7 issued patents and 87 patent applications in the United States and 94 corresponding patent applications in foreign countries. We cannot assure you that any patents will issue with respect to our currently pending patent applications in a manner that gives us the protection that we seek, if at all, or that any patents issued to us will not be challenged, invalidated or circumvented. Our currently issued patents and any patents that may issue in the future with respect to pending or future patent applications may not provide sufficiently broad protection or they may not prove to be enforceable in actions against alleged infringers. We cannot be certain that the steps we have taken will prevent unauthorized use of our technology or the reverse engineering of our technology. Moreover, others may independently develop technologies that are competitive to ours or infringe our intellectual property.
Protecting against the unauthorized use of our intellectual property, products and other proprietary rights is expensive and difficult. Litigation may be necessary in the future to enforce or defend our intellectual property rights or to determine the validity and scope of the proprietary rights of others. Any such litigation could result in substantial costs and diversion of management resources, either of which could harm our business, operating results and financial condition. Further, many of our current and potential competitors have the ability to dedicate substantially greater resources to defending intellectual property infringement claims and to enforcing their intellectual property rights than we have. Accordingly, we may not be able to prevent third parties from infringing upon or misappropriating our intellectual property. Effective patent, trademark, service mark,
-26-
Table of Contents
copyright and trade secret protection may not be available in every country in which our products are available. An inability to adequately protect and enforce our intellectual property and other proprietary rights could seriously harm our business, operating results and financial condition.
Our use of open source and third-party technology could impose limitations on our ability to commercialize our software.
We use open source software in our products. Although we monitor our use of open source software closely, the terms of many open source licenses have not been interpreted by U.S. courts, and there is a risk that such licenses could be construed in a manner that imposes unanticipated conditions or restrictions on our ability to market our products. In such event, we could be required to seek licenses from third parties in order to continue offering our products for certain uses, to license portions of our source code at no charge, to re-engineer our technology or to discontinue offering some of our software in the event re-engineering cannot be accomplished on a timely basis, any of which could adversely affect our business, operating results and financial condition.
We might require additional capital to support business growth, and this capital might not be available on acceptable terms, or at all.
We intend to continue to make investments to support our business growth and may require additional funds to respond to business challenges, including the need to develop new products or enhance our existing products, enhance our operating infrastructure and acquire complementary businesses and technologies. Accordingly, we may need to engage in equity or debt financings to secure additional funds. If we raise additional funds through further issuances of equity or convertible debt securities, our stockholders could suffer significant dilution, and any new equity securities we issue could have rights, preferences and privileges superior to those of holders of our common stock. Any debt financing in the future could involve additional restrictive covenants relating to our capital raising activities and other financial and operational matters, which may make it more difficult for us to obtain additional capital and to pursue business opportunities, including potential acquisitions. We may not be able to obtain additional financing on terms favorable to us, if at all. If we are unable to obtain adequate financing or financing on terms satisfactory to us, when we require it, our ability to continue to support our business growth and to respond to business challenges could be significantly limited, and our business, operating results, financial condition and prospects could be adversely affected.
We may further expand through acquisitions of, or investments in, other companies, each of which may divert our management’s attention, resulting in additional dilution to our stockholders and consumption of resources that are necessary to sustain and grow our business.
Our business strategy may, from time to time, include acquiring complementary products, technologies or businesses. We also may enter into relationships with other businesses in order to expand our product offerings, which could involve preferred or exclusive licenses, additional channels of distribution or discount pricing or investments in other companies. Negotiating these transactions can be time-consuming, difficult and expensive, and our ability to close these transactions may be subject to third-party approvals, such as government regulation, which are beyond our control. Consequently, we can make no assurance that these transactions, once undertaken and announced, will close.
For example, in August 2011, we acquired IO Turbine, a provider of caching solutions for virtual environments, based in San Jose, California. These kinds of acquisitions or investments may result in unforeseen operating difficulties and expenditures. In particular, we may encounter difficulties assimilating or integrating the businesses, technologies, products, personnel or operations of the acquired companies, particularly if the key personnel of the acquired business choose not to work for us, and we may have difficulty retaining the customers of any acquired business. Acquisitions may also disrupt our ongoing business, divert our resources and require significant management attention that would otherwise be available for development of our business. Any acquisition or investment could expose us to unknown liabilities. Moreover, we cannot assure you that the
-27-
Table of Contents
anticipated benefits of any acquisition or investment would be realized or that we would not be exposed to unknown liabilities. In connection with these types of transactions, we may issue additional equity securities that would dilute our stockholders, use cash that we may need in the future to operate our business, incur debt on terms unfavorable to us or that we are unable to repay, incur large charges or substantial liabilities, encounter difficulties integrating diverse business cultures, and become subject to adverse tax consequences, substantial depreciation or deferred compensation charges. These challenges related to acquisitions or investments could adversely affect our business, operating results and financial condition.
Because our long-term success depends, in part, on our ability to expand the sales of our products to customers located outside of the United States, our business is susceptible to risks associated with international operations.
While we currently maintain limited operations outside of the United States, we have been expanding and intend to continue to expand these operations in the future. We have limited experience operating in foreign jurisdictions. Our inexperience in operating our business outside of the United States increases the risk that our international expansion efforts may not be successful. In addition, conducting and expanding international operations subjects us to new risks that we have not generally faced in the United States. These include: exposure to foreign currency exchange rate risk; difficulties in managing and staffing international operations; the increased travel, infrastructure and legal compliance costs associated with multiple international locations; potentially adverse tax consequences; the burdens of complying with a wide variety of foreign laws, including trade barriers, and different legal standards; increased financial accounting and reporting burdens and complexities; political, social and economic instability abroad, terrorist attacks and security concerns in general; and reduced or varied protection for intellectual property rights in some countries. The occurrence of any one of these risks could negatively affect our international business and, consequently, our business, operating results and financial condition generally.
Adverse economic conditions or reduced datacenter spending may adversely impact our revenues and profitability.
Our operations and performance depend in part on worldwide economic conditions and the impact these conditions have on levels of spending on datacenter technology. Our business depends on the overall demand for datacenter infrastructure and on the economic health of our current and prospective customers. Weak economic conditions, or a reduction in datacenter spending, would likely adversely impact our business, operating results and financial condition in a number of ways, including by reducing sales, lengthening sales cycles and lowering prices for our products and services.
Governmental regulations affecting the import or export of products could negatively affect our revenue.
The U.S. and various foreign governments have imposed controls, export license requirements, and restrictions on the import or export of some technologies, especially encryption technology. In addition, from time to time, governmental agencies have proposed additional regulation of encryption technology, such as requiring the escrow and governmental recovery of private encryption keys. Governmental regulation of encryption technology and regulation of imports or exports, or our failure to obtain required import or export approval for our products, could harm our international and domestic sales and adversely affect our revenue. In addition, failure to comply with such regulations could result in penalties, costs, and restrictions on export privileges, which would harm our operating results.
The terms of our loan and security agreement with a financial institution may restrict our ability to engage in certain transactions.
Pursuant to the current terms of our loan and security agreement with a financial institution, we are subject to financial covenants and cannot engage in certain transactions, including disposing of certain assets, incurring
-28-
Table of Contents
additional indebtedness, declaring dividends, acquiring or merging with another entity or leasing additional real property unless certain conditions are met or unless we receive prior approval from the financial institution. Our obligations under the loan and security agreement are secured by substantially all of our assets. The loan and security agreement further limits our ability to make material changes to our management team or enter into transactions with affiliates. If the financial institution does not consent to any of these actions or if we are unable to comply with these covenants, we could be prohibited from engaging in transactions which could be beneficial to our business and our stockholders.
Our business is subject to the risks of earthquakes and other natural catastrophic events, and to interruption by man-made problems such as computer viruses or terrorism.
Our sales headquarters and our current contract manufacturers are located in the San Francisco Bay and Salt Lake City areas, which have heightened risks of earthquakes. We may not have adequate business interruption insurance to compensate us for losses that may occur from a significant natural disaster, such as an earthquake, which could have a material adverse impact on our business, operating results and financial condition. In addition, acts of terrorism or malicious computer viruses could cause disruptions in our or our customers’ businesses or the economy as a whole. To the extent that these disruptions result in delays or cancellations of customer orders or the deployment of our products, our business, operating results and financial condition would be adversely affected.
Failure to comply with governmental laws and regulations could harm our business.
Our business is subject to regulation by various federal, state, local and foreign governmental agencies, including agencies responsible for monitoring and enforcing employment and labor laws, workplace safety, product safety, environmental laws, consumer protection laws, anti-bribery laws, import/export controls, federal securities laws and tax laws and regulations. In certain jurisdictions, these regulatory requirements may be more stringent than in the United States. Noncompliance with applicable regulations or requirements could subject us to investigations, sanctions, mandatory product recalls, enforcement actions, disgorgement of profits, fines, damages, civil and criminal penalties or injunctions. If any governmental sanctions are imposed, or if we do not prevail in any possible civil or criminal litigation, our business, operating results and financial condition could be materially adversely affected. In addition, responding to any action will likely result in a significant diversion of management’s attention and resources and an increase in professional fees. Enforcement actions and sanctions could harm our business, operating results and financial condition.
Risks Related to Our Common Stock
The trading price of our common stock is likely to be volatile, and an active, liquid and orderly market for our common stock may not be sustained.
Our common stock is currently traded on the New York Stock Exchange, but we can provide no assurance that there will be active trading on that market or any other market in the future. If there is not an active trading market or if the volume of trading is limited, the price of our common stock could decline and holders of our common stock may have difficulty selling their shares. In addition, the trading price of our common stock may be highly volatile and could be subject to wide fluctuations in response to various factors, some of which are beyond our control. These factors include:
| • | price and volume fluctuations in the overall stock market from time to time; |
| • | significant volatility in the market price and trading volume of technology companies in general, and of companies in our industry; |
| • | actual or anticipated changes in our results of operations or fluctuations in our operating results; |
| • | whether our operating results meet the expectations of securities analysts or investors; |
-29-
Table of Contents
| • | actual or anticipated changes in the expectations of investors or securities analysts; |
| • | actual or anticipated developments in our competitors’ businesses or the competitive landscape generally; |
| • | litigation involving us, our industry or both; |
| • | regulatory developments in the United States, foreign countries or both; |
| • | general economic conditions and trends; |
| • | major catastrophic events; |
| • | sales of large blocks of our stock; or |
| • | departures of key personnel. |
The stock markets in general, and market prices for the securities of technology-based companies like ours in particular, have from time to time experienced volatility that often has been unrelated to the operating performance of the underlying companies. A certain degree of stock price volatility can be attributed to being a newly public company. These broad market and industry fluctuations may adversely affect the market price of our common stock, regardless of our operating performance. In several recent situations where the market price of a stock has been volatile, holders of that stock have instituted securities class action litigation against the company that issued the stock. If any of our stockholders were to bring a lawsuit against us, the defense and disposition of the lawsuit could be costly and divert the time and attention of our management and harm our operating results.
Sales of outstanding shares of our common stock into the market in the future could cause the market price of our common stock to drop significantly, even if our business is doing well.
If stockholders holding shares of our common stock purchased prior to our initial public offering sell, or indicate an intent to sell, substantial amounts of our common stock in the public market after the contractual lock-up and other legal restrictions on resale lapse, the trading price of our common stock could decline. As of June 30, 2011, we had 81,149,569 shares of common stock outstanding, of which the 12,300,000 shares of our common stock sold in our initial public offering are freely tradable, without restriction, in the public market, unless such shares are held by “affiliates”, as that term is defined in Rule 144 of the Securities Act.
Our directors, officers, employees and stockholders holding shares prior to our initial public offering are subject to a contractual lock-up that prevents them from selling their shares prior to the expiration of this lock-up period. The lock-up, which is set to expire on December 5, 2011, is subject to extension under certain circumstances. Our underwriters may, in their sole discretion, permit shares subject to this lock-up to be sold prior to its expiration.
At various times after the lock-up agreements pertaining to our initial public offering expire, up to an additional 68,192,736 shares of our common stock will be eligible for sale in the public market (of which, 2,047,003 shares were issued in connection with our acquisition of IO Turbine and will become sellable after February 11, 2012, subject to certain escrow provisions), 43,937,289 of which are held by directors, executive officers and other affiliates and will be subject to volume limitations under Rule 144 under the Securities Act of 1933, as amended, and various vesting agreements. In addition, 10,123,007 shares of common stock that are issuable upon exercise of outstanding options as of August 30, 2011 will become eligible for sale in the public market to the extent permitted by the provisions of various vesting agreements, the lock-up agreements and Rules 144 and 701 of the Securities Act. If these additional shares are sold, or if it is perceived that they will be sold, in the public market, the trading price of our common stock could decline.
-30-
Table of Contents
Insiders will continue to have substantial control over us, which could limit your ability to influence the outcome of key transactions, including a change of control.
As of August 30, 2011, our directors, executive officers and each of our stockholders who own greater than 5% of our outstanding common stock and their affiliates, in the aggregate, own approximately 53.4% of the outstanding shares of our common stock. As a result, these stockholders, if acting together, are able to influence or control matters requiring approval by our stockholders, including the election of directors and the approval of mergers, acquisitions or other extraordinary transactions. They may also have interests that differ from yours and may vote in a way with which you disagree and which may be adverse to your interests. This concentration of ownership may have the effect of delaying, preventing or deterring a change of control of our company, could deprive our stockholders of an opportunity to receive a premium for their common stock as part of a sale of our company and might ultimately affect the market price of our common stock. In addition, the significant concentration of stock ownership may adversely affect the trading price of our common stock due to investors’ perception that conflicts of interest may exist or arise.
We have broad discretion in the use of the net proceeds that we received in our initial public offering and may not use them effectively.
We have broad discretion in the application of the net proceeds from our initial public offering and could spend the proceeds in ways that do not improve our results of operations or enhance the value of our common stock. In August 2011, we used approximately $26.6 million of the net proceeds received in our initial public offering to acquire IO Turbine and we intend to use the remaining net proceeds from our initial public offering for working capital and general corporate purposes, including expansion of our sales organization, further development and expansion of our product offerings and possible acquisitions of, or investments in, businesses, technologies or other assets. We have not allocated these net proceeds for any specific purposes. We might not be able to yield a significant return, if any, on any investment of these net proceeds. Stockholders will not have the opportunity to influence our management’s decisions on how to use the net proceeds, and our failure to apply the funds effectively could have a material adverse effect on our business, and could cause the price of our common stock to decline.
We have never paid dividends on our common stock and we do not anticipate paying any cash dividends in the foreseeable future.
We have never declared or paid any dividends on our common stock. In addition, our credit facility with a financial institution restricts our ability to pay dividends. We intend to retain any earnings to finance the operation and expansion of our business, and we do not anticipate paying any cash dividends in the future. As a result, you may only receive a return on your investment in our common stock if the market price of our common stock increases.
We will incur increased costs as a result of being a public company.
As a public company, we will incur significant legal, accounting and other expenses that we did not incur as a private company. In addition, new rules implemented by the SEC and the New York Stock Exchange, require changes in corporate governance practices of public companies. We expect these rules and regulations to increase our legal and financial compliance costs and to make some activities more time-consuming and costly. We will also incur additional costs associated with our public company reporting requirements. We expect these rules and regulations to make it more difficult and more expensive for us to obtain director and officer liability insurance, and we may be required to accept reduced policy limits and coverage or incur substantially higher costs to obtain the same or similar coverage. As a result, it may be more difficult for us to attract and retain qualified people to serve on our board of directors or as executive officers.
-31-
Table of Contents
Provisions in our certificate of incorporation and bylaws and under Delaware law might discourage, delay or prevent a change of control of our company or changes in our management and, therefore, depress the trading price of our common stock.
Our certificate of incorporation and bylaws contain provisions that could depress the trading price of our common stock by acting to discourage, delay or prevent a change of control of our company or changes in our management that the stockholders of our company may deem advantageous. These provisions:
| • | establish a classified board of directors so that not all members of our board of directors are elected at one time; |
| • | authorize the issuance of “blank check” preferred stock that our board of directors could issue to increase the number of outstanding shares to discourage a takeover attempt; |
| • | prohibit stockholder action by written consent, which requires all stockholder actions to be taken at a meeting of our stockholders; |
| • | prohibit stockholders from calling a special meeting of our stockholders; |
| • | provide that the board of directors is expressly authorized to make, alter or repeal our bylaws; and |
| • | establish advance notice requirements for nominations for elections to our board of directors or for proposing matters that can be acted upon by stockholders at stockholder meetings. |
Additionally, we are subject to Section 203 of the Delaware General Corporation Law, which generally prohibits a Delaware corporation from engaging in any of a broad range of business combinations with any “interested” stockholder for a period of three years following the date on which the stockholder became an “interested” stockholder and which may discourage, delay or prevent a change of control of our company.
Any provision of our certificate of incorporation or bylaws or Delaware law that has the effect of delaying or deterring a change in control could limit the opportunity for our stockholders to receive a premium for their shares of our common stock, and could also affect the price that some investors are willing to pay for our common stock.
Part I. Item 1B. Unresolved Staff Comments
None.
Our headquarters occupy approximately 118,000 square feet in Salt Lake City, Utah under leases that expire in September 2021. We have an option to extend these leases to September 2026. Our principal office for sales and marketing occupies approximately 14,000 square feet in San Jose, California, under a lease that expires in May 2013. We have an additional research and development office in Boulder, Colorado. We lease space in locations throughout the United States and various international locations for operations and sales personnel. We believe that our current facilities are adequate to meet our ongoing needs and that, if we require additional space, we will be able to obtain additional facilities on commercially reasonable terms.
Part I. Item 3. Legal Proceedings
On May 17, 2011, Internet Machines LLC filed a lawsuit in U.S. District Court for the Eastern District of Texas against us and 20 other companies. The complaint alleges that our products infringe U.S. Patent Nos. 7,454,552; 7,421,532; 7,814,259; and 7,945,722. The complaint seeks both damages and a permanent injunction against us. We have limited information about the specific infringement allegations, but they appear to focus on a PCI switch component that, while used in some of our products, is manufactured by a third-party supplier. We have requested this third-party supplier to indemnify and defend us with respect to this lawsuit. Based upon our
-32-
Table of Contents
preliminary investigation of the patents identified in the complaint, we do not believe that our products infringe any valid or enforceable claim of these patents. Nevertheless, the costs associated with any actual, pending or threatened litigation could negatively impact our operating results regardless of the actual outcome.
We may, from time to time, be involved in various legal proceedings arising from the normal course of business activities, and an unfavorable resolution of any of these matters could materially affect our future results of operations, cash flows or financial position.
Part II. Item 5. Market for Registrant’s Common Equity, Related Stockholder Matters and Issuer Purchases of Equity Securities
Market for Our Common Stock
Our common stock began trading publicly on the New York Stock Exchange under the ticker symbol “FIO” on June 9, 2011. Prior to that time, there was no public market for our common stock. The following table sets forth, for the period indicated, the high and low sale prices of our common stock as reported by the New York Stock Exchange since our initial public offering.
| Fiscal 2011 |
High | Low | ||||||
| Fourth Quarter (beginning June 9, 2011 through June 30, 2011) |
$ | 36.98 | $ | 19.28 | ||||
On August 30, 2011, the closing stock price of our common stock was $25.35.
Holders of Record
As of August 30, 2011, there were approximately 152 holders of record of our common stock. This figure does not include a substantially greater number of “street name” holders or beneficial holders of our common stock whose shares are held of record by banks, brokers and other financial institutions.
-33-
Table of Contents
Stock Performance Graph and Cumulative Total Return
Notwithstanding any statement to the contrary in any of our previous or future filings with the SEC, the following information relating to the price performance of our common stock shall not be deemed to be “filed” with the SEC or to be “soliciting material” under the Securities Exchange Act of 1934, as amended, or the Exchange Act, and it shall not be deemed to be incorporated by reference into any of our filings under the Securities Act or the Exchange Act, except to the extent we specifically incorporate it by reference into such filing.
The following graph shows a comparison from June 9, 2011 (the date our common stock commenced trading on the New York Stock Exchange) through June 30, 2011 of the cumulative total return assuming a $100 investment in our common stock, the S&P 500 Index and the S&P 500 Information Technology Sector Index. Data for the S&P 500 Index and the S&P 500 Information Technology Sector Index assume reinvestment of dividends. The comparisons in this graph below are based on historical data and are not intended to forecast or be indicative of future performance of our common stock.
Comparison of Cumulative Total Return Among Fusion-io, Inc., The S&P 500
and The S&P 500 Information Technology Sector Index
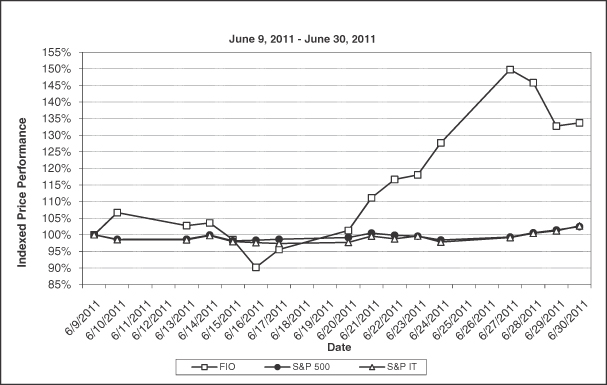
Dividend Policy
We have never declared or paid any cash dividend on our capital stock. We currently intend to retain any future earnings and do not expect to pay any dividends in the foreseeable future. In addition, the terms of our loan and security agreement with a financial institution currently prohibits us from paying cash dividends on our common stock. Any future determination to declare cash dividends will be made at the discretion of our board of directors, subject to applicable laws and compliance with certain covenants under our loan and security agreement with the financial institution, and will depend on our financial condition, results of operations, capital requirements, general business conditions and other factors that our board of directors may deem relevant.
-34-
Table of Contents
Equity Plan Information
Our equity plan information required by this item is incorporated by reference to the information in Part III, Item 12 of this annual report on Form 10-K.
Sales of Unregistered Securities
During fiscal 2011, prior to the effectiveness of our Registration Statement on Form S-8, filed with the SEC on June 9, 2011, we granted options to purchase an aggregate of 9,974,325 shares of common stock at a weighted average exercise price of $4.18 per share, and we issued and sold an aggregate of 1,391,868 shares of our common stock at a weighted average exercise price of $0.60 per share for an aggregate of $839,676 pursuant to exercises of options granted. In addition, during fiscal 2011, we sold an aggregate of 60,000 shares of common stock to two members of our board of directors for a per share purchase price of $5.12 for an aggregate purchase price of $307,200 and issued 12,500 shares of common stock in connection with the exercise of an outstanding common stock warrant at a per share exercise price of $1.96, for an aggregate purchase price of $24,500.
No underwriters were involved in the foregoing sales of securities. These issuances were undertaken in reliance upon the exemption from registration requirements of Rule 701 and Section 4(2) of the Securities Act of 1933, as amended. The recipients of these shares of common stock represented their intentions to acquire the shares for investment only and not with a view to or for sale in connection with any distribution, and appropriate restrictions were set out in the award agreements issued in these transactions. All recipients had adequate access, through their relationships with us, to information about us.
Use of Proceeds from Registered Securities
Our initial public offering of common stock, or IPO, was made pursuant to a registration statement on Form S-1 (File No. 333-172683), which the SEC declared effective on June 8, 2011. In the offering, we sold and issued 12,600,607 shares, including 1,845,000 shares sold pursuant to the full exercise by the underwriters of their over-allotment option, at an issuance price of $19.00 per share, less underwriting discounts and commissions. The offering did not terminate until after the sale of all of the securities registered by the registration statement. Goldman, Sachs & Co. and Morgan Stanley & Co. LLC acted as lead joint book-runners for the offering, and J.P. Morgan Securities LLC and Credit Suisse Securities (USA) LLC acted as passive joint book-runners. As a result of the offering, we received proceeds of approximately $218.9 million, net of approximately $3.8 million in offering costs.
In August 2011, we used approximately $26.6 million of the net offering proceeds to acquire IO Turbine. We anticipate that we will use the remaining net proceeds from our initial public offering for working capital and general corporate purposes, including expansion of our sales organization, further development and expansion of our product offerings and possible acquisitions of, or investments in, businesses, technologies or other assets. We have broad discretion in the way we use the net proceeds. Pending use of the net proceeds as described above, we intend to invest the net proceeds in U.S. government securities and short-term corporate securities such as money market funds. There has been no material change in the planned use of proceeds from our initial public offering from that described in the final prospectus filed with the SEC pursuant to Rule 424(b) on June 9, 2011.
-35-
Table of Contents
Purchases of Equity Securities by the Issuer
| Period |
Total Number of Shares Purchased |
Average Price Paid per Share |
Total Number of Shares Purchased as Part of Publicly Announced Plans or Programs |
Maximum Number (or Approximate Dollar Value) of Shares that May Yet Be Purchased Under the Plans or Programs |
||||||||||||
| April 1 – 30, 2011 |
— | — | — | — | ||||||||||||
| May 1 – 31, 2011 |
165,000 | $ | 7.41 | (1) | — | — | ||||||||||
| June 1 – 30, 2011 |
— | — | — | — | ||||||||||||
| Total |
165,000 | $ | 7.41 | (1) | — | — | ||||||||||
| (1) | In May 2011, we repurchased a total of 165,000 shares of our common stock from two of our stockholders, in separate transactions, for a total purchase price of approximately $1.2 million, pursuant to the exercise of our right of first refusal to which the shares were subject. The terms of the repurchase transaction for 150,000 of such shares require us to pay additional consideration to one of the stockholders equal to half the difference between the applicable liquidity event price per share and $15.00. The liquidity event price per share is the closing per share sale price as of the first trading day following the December 5, 2011 expiration date of the lock-up period applicable to our stockholders in connection with our initial public offering effective June 8, 2011. |
Trading Plans
Our Insider Trading Policy permits directors, officers and other employees covered under the policy to establish, subject to certain conditions and limitations set forth in the policy, written trading plans which are intended to comply with Rule 10b5-1 under the Securities Exchange Act, which permit automatic trading of common stock of Fusion-io, Inc. or trading of common stock by an independent person (such as a stockbroker) who is not aware of material, nonpublic information at the time of the trade. We are aware that certain of our directors and officers have entered into written trading plans, and we believe our directors and officers may establish such programs in the future.
-36-
Table of Contents
Part II. Item 6. Selected Financial Data
The following selected financial data should be read in conjunction with the consolidated financial statements and related notes thereto appearing elsewhere in this annual report on Form 10-K. We have derived the consolidated statement of operations data for fiscal 2009, 2010 and 2011 and consolidated balance sheet data as of June 30, 2010 and 2011 from audited consolidated financial statements included elsewhere in this report. The consolidated statement of operations data for fiscal year ended June 30, 2008 and consolidated balance sheet data as of June 30, 2009 and 2008 were derived from audited consolidated financial statements that are not included in this annual report on Form 10-K. The consolidated statement of operations data for the fiscal year ended June 30, 2007 and the consolidated balance sheet data as of June 30, 2007 were derived from unaudited consolidated financial statements that are not included in this annual report on Form 10-K. The unaudited consolidated financial statements were prepared on a basis consistent with our audited financial statements and include all adjustments, consisting of normal and recurring adjustments that we consider necessary for a fair presentation of the financial position and results of operations as of and for such periods. You should read the following selected consolidated financial data with “Management’s Discussion and Analysis of Financial Condition and Results of Operations”, our consolidated financial statements and the notes to consolidated financial statements, which are included in this annual report on Form 10-K.
SELECTED CONSOLIDATED FINANCIAL DATA
| Year Ended June 30, | ||||||||||||||||||||
| 2007 | 2008 | 2009 | 2010 | 2011 | ||||||||||||||||
| (In thousands, except for per share data) | ||||||||||||||||||||
| Consolidated Statements of Operations Data: |
||||||||||||||||||||
| Revenue |
$ | 4 | $ | 648 | $ | 10,150 | $ | 36,216 | $ | 197,204 | ||||||||||
| Gross profit |
2 | 271 | 5,150 | 20,198 | 113,161 | |||||||||||||||
| Total operating expenses |
1,433 | 10,171 | 30,032 | 51,746 | 103,492 | |||||||||||||||
| (Loss) income from operations |
(1,431 | ) | (9,900 | ) | (24,882 | ) | (31,548 | ) | 9,669 | |||||||||||
| Net (loss) income |
$ | (1,451 | ) | $ | (9,975 | ) | $ | (25,573 | ) | $ | (31,716 | ) | $ | 4,555 | ||||||
| Net (loss) income attributable to common stockholders |
$ | (1,451 | ) | $ | (9,975 | ) | $ | (25,573 | ) | $ | (32,464 | ) | $ | 4,555 | ||||||
| Net (loss) income per common share, basic |
$ | (0.14 | ) | $ | (1.73 | ) | $ | (3.27 | ) | $ | (2.95 | ) | $ | 0.27 | ||||||
| Net (loss) income per common share, diluted |
$ | (0.14 | ) | $ | (1.73 | ) | $ | (3.27 | ) | $ | (2.95 | ) | $ | 0.06 | ||||||
| As of June 30, | ||||||||||||||||||||
| 2007 | 2008 | 2009 | 2010 | 2011 | ||||||||||||||||
| (In thousands) | ||||||||||||||||||||
| Consolidated Balance Sheet Data: |
||||||||||||||||||||
| Cash, cash equivalents and short-term investments(1) |
$ | 3 | $ | 2,097 | $ | 17,533 | $ | 21,193 | $ | 219,604 | ||||||||||
| Inventories |
— | 707 | 3,993 | 25,148 | 35,622 | |||||||||||||||
| Working (deficiency) capital(1) |
(510 | ) | 766 | 17,485 | 32,157 | 270,079 | ||||||||||||||
| Total assets(1) |
33 | 4,566 | 28,216 | 59,452 | 317,286 | |||||||||||||||
| Current and long-term deferred revenue |
— | — | 838 | 839 | 12,017 | |||||||||||||||
| Current and long-term notes payable and capital lease obligations |
266 | — | 279 | 444 | 108 | |||||||||||||||
| Total liabilities |
787 | 2,590 | 7,067 | 21,048 | 42,842 | |||||||||||||||
| Total stockholders’ (deficit) equity(1) |
(1,580 | ) | (11,214 | ) | (35,647 | ) | (66,109 | ) | 274,444 | |||||||||||
| (1) | The significant increases in this item from fiscal 2010 to 2011 was primarily due to our initial public offering, which was effective June 8, 2011, and the receipt of proceeds of $218.9 million, net of issuance costs of $3.8 million. |
-37-
Table of Contents
Part II. Item 7. Management’s Discussion and Analysis of Financial Condition and Results of Operations
The following discussion and analysis should be read together with our consolidated financial statements and the notes to those statements included elsewhere in this annual report on Form 10-K. This discussion contains forward-looking statements based on our current expectations, assumptions, estimates and projections about Fusion-io and our industry. These forward-looking statements involve risks and uncertainties. Our actual results could differ materially from those indicated in these forward-looking statements as a result of certain factors, as more fully described in “Risk Factors” in Item 1A of this Form 10-K, in this Item 7, and elsewhere in this Form 10-K. We undertake no obligation to update publicly any forward-looking statements for any reason, even if new information becomes available or other events occur in the future.
Overview
We have pioneered a next generation storage memory platform for data decentralization. Our data decentralization platform includes our ioMemory hardware, VSL virtualization software, and leverages our recently released directCache automated data-tiering software and ioSphere platform management software.
We were incorporated in December 2005, and we initially focused on the engineering and development of our platform. We have experienced significant growth with revenue of $10.2 million, $36.2 million and $197.2 million in fiscal years 2009, 2010 and 2011, respectively. Our headcount increased from 172 employees as of June 30, 2009, to 262 employees as of June 30, 2010 and to 441 employees as of June 30, 2011.
We sell our products through our global direct sales force, OEMs, including Dell, HP and IBM, and other channel partners. Some of our OEMs and channel partners integrate our platform into their own proprietary product offerings. Our primary sales office is located in San Jose, California, and we also have a sales presence in the United Kingdom, Germany, Japan, Hong Kong, Singapore, Korea, Australia, Canada, France, China, Italy, Denmark and the Netherlands.
Large purchases by a limited number of customers have accounted for a substantial majority of our revenue, and the composition of the group of our largest customers changes from period to period. Some of our customers make concentrated purchases to complete or upgrade specific large-scale data storage installations. These concentrated purchases are short-term in nature and are typically made on a purchase order basis rather than pursuant to long-term contracts. During fiscal 2009, 2010 and 2011, sales to the 10 largest customers in each period, including the applicable OEMs, accounted for approximately 47%, 75% and 92% of revenue, respectively. Our OEM customers IBM and HP, direct customer Facebook and Apple, through a reseller, each accounted for 13%, 10%, 10% and less than 10% of our revenue, respectively, in fiscal 2010, and less than 10%, 14%, 36% and 24% of our revenue, respectively, in fiscal 2011. We expect that sales to a limited number of customers will continue to contribute materially to our revenue for the foreseeable future.
We anticipate that sales through OEMs will continue to constitute a substantial portion of our future revenue. In some cases, our products must be designed into the OEM’s products. If that fails to occur for a given product line of an OEM, we would likely be unable to sell our products to that OEM during the life cycle of that product, which would adversely affect our revenue. We expect that as we expand our global presence and business overseas that we will increasingly depend on our OEM relationships in such markets.
We believe that extending our platform differentiation through software innovation will be critical to achieving broader market acceptance and maintaining or increasing our gross margins. In this regard, we have recently developed our directCache data-tiering software and ioSphere platform management software for incorporation into our solutions and intend to continue to add software functionality to differentiate our products. We also recently acquired IO Turbine, Inc., which provides us virtualization software solutions that will enable us to accelerate our platform into the virtualized server and desktop markets. Our directCache software and ioSphere software were recently released for general availability. We are devoting the majority of our research and development resources to software development, and if we are unable to successfully develop or acquire, and then market and sell additional software functionality, our ability to increase our revenue and gross margins will be adversely affected.
-38-
Table of Contents
We outsource the manufacturing of our hardware products to our two primary contract manufacturers. We procure a majority of the components used in our products directly from third-party vendors and have them delivered to our contract manufacturers for manufacturing and assembly. Once our products are assembled, we perform quality assurance testing, labeling, final configuration, including a final firmware installation, and shipment to our customers.
As a consequence of the rapidly evolving nature of our business and our limited operating history, we believe that period-to-period comparisons of revenue and other operating results, including gross margin and operating expenses as a percentage of our revenue, are not necessarily meaningful and should not be relied upon as indications of future performance. Although we have experienced significant percentage growth in our revenue, we do not believe that our historical growth rates are likely to be sustainable or indicative of future growth.
Recent Developments
In June 2011, we completed an initial public offering, or IPO, of our common stock, in which we sold and issued 12,600,607 shares, including 1,845,000 shares sold pursuant to the full exercise by the underwriters of their over-allotment option, at an issuance price of $19.00 per share, less underwriting discounts and commissions. As a result of the offering, we received proceeds of approximately $218.9 million, net of approximately $3.8 million in offering costs.
On August 11, 2011, we acquired 100% of the stock of IO Turbine, Inc., or IO Turbine, a provider of caching solutions for virtual environments, based in San Jose, California. The acquisition of IO Turbine is a key part of our strategy to enable enterprise customers to increase the utilization, performance and efficiency of their datacenter resources and extract greater value from their information assets. The preliminary fair value of the aggregate purchase price was approximately $65.6 million, which consisted of (1) cash, (2) shares of our common stock valued at $28.40 per share, the closing sale price of our common stock on the closing date of the acquisition, and (3) the fair value of assumed stock options and restricted stock awards attributable to pre-acquisition service. In addition, subsequent to the acquisition we will recognize up to approximately $26.4 million of stock-based compensation expense related to the fair value of assumed restricted stock awards and stock options, of which approximately $3.8 million will be expensed immediately in connection with the acceleration of vesting of certain restricted stock awards and the remainder recognized over the underlying future service period of the assumed stock awards and stock options. Approximately $3.6 million of cash and 278,974 shares were deposited in escrow and held as partial security for indemnification obligations of the IO Turbine stockholders pursuant to the merger agreement.
Components of Consolidated Statements of Operations
Revenue
We derive revenue primarily from the sale of our storage memory products and support services. We sell our storage memory platform through our global direct sales force, OEMs and other channel partners. We provide our support services pursuant to support contracts, which involve hardware support, software support and software upgrades on a when-and-if available basis, and typically have a one-year term. Revenue from support services represented less than $1.0 million for fiscal 2009 and 2010 and approximately $4.5 million for fiscal 2011. In fiscal 2011, our software revenue was not significant to our consolidated statement of operations.
Cost of Revenue
Cost of revenue consists primarily of material costs including amounts paid to our suppliers and contract manufacturers for hardware components and assembly of those components into our products. The largest portion of our cost of revenue consists of the cost of non-volatile memory components. Given the commodity nature of memory components, neither we nor our contract manufacturers enter into long-term supply contracts
-39-
Table of Contents
for our product components, which can cause our cost of revenue to fluctuate. Cost of revenue is recorded when the related product revenue is recognized. Cost of revenue also includes personnel expenses related to customer support, warranty costs, costs of shipping, and carrying value adjustments recorded for excess and obsolete inventory.
Operating Expenses
The largest component of our operating expenses is personnel costs, consisting of salaries, benefits and incentive compensation for our employees, which includes stock-based compensation. Our headcount increased from 172 employees as of June 30, 2009, to 262 employees as of June 30, 2010 and to 441 employees as of June 30, 2011. As a result, operating expenses have increased significantly over these periods.
Sales and Marketing
Sales and marketing expenses consist primarily of personnel costs, incentive compensation, marketing programs, travel-related costs, consulting expenses associated with sales and marketing activities, and facilities-related costs. We plan to continue to invest heavily in sales by increasing our sales headcount. Our sales personnel are typically not immediately productive and therefore the increase in sales and marketing expense we incur when we add new sales representatives is not immediately offset by increased revenue and may not result in increased revenue over the long-term. The timing of our hiring of new sales personnel and the rate at which they generate incremental revenue could therefore affect our future period-to-period financial performance. We expect that sales and marketing expenses will continue to increase in absolute dollars as we expect to continue hiring.
Research and Development
Research and development expenses consist primarily of personnel costs, prototype expenses, consulting services and depreciation associated with research and development equipment. We expense research and development costs as incurred. We expect to continue to devote substantial resources to the development of our products including the development of new software products. We believe that these investments are necessary to maintain and improve our competitive position. We expect that our research and development expenses will continue to increase in absolute dollars as we continue to invest in additional engineering personnel and infrastructure required to support the development of new products and to enhance existing products.
General and Administrative
General and administrative expenses consist primarily of personnel costs, legal expenses, consulting and professional services, audit costs, and facility-related expenses for our executive, finance, human resources, information technology and legal organizations. While we expect personnel costs to be the primary component of general and administrative expenses, we also expect to incur significant additional legal and accounting costs related to compliance with rules and regulations implemented by the SEC, as well as additional insurance, investor relations and other costs associated with being a public company.
Other income (expense), net
Other income (expense), net consists of changes in the fair value of a preferred stock warrant, changes in the fair value of a derivative related to a repurchase of our common stock, interest expense, interest income, realized gains and losses from investments and foreign currency gains and losses.
-40-
Table of Contents
Results of Operations for the Fiscal Years Ended June 30, 2009, 2010 and 2011
Revenue
The following table presents our revenue for the periods indicated and related changes as compared to the prior periods (dollars in thousands):
| Year Ended June 30, |
Change in | Year Ended June 30, |
Change in | |||||||||||||||||||||||||||||||
| 2009 | 2010 | $ | % | 2010 | 2011 | $ | % | |||||||||||||||||||||||||||
| Revenue |
$ | 10,150 | $ | 36,216 | $ | 26,066 | 257 | % | $ | 36,216 | $ | 197,204 | $ | 160,988 | 445 | % | ||||||||||||||||||
2010 Compared to 2011. Revenue increased $161.0 million from fiscal 2010 to fiscal 2011, primarily due to the increase in the overall volume of our products shipped.
2009 Compared to 2010. Revenue increased $26.1 million from fiscal 2009 to fiscal 2010, primarily due to the increase in the overall volume of our products shipped.
Revenue from the 10 largest customers, including the applicable OEMs, for each fiscal year was 47%, 75% and 92% of revenue for fiscal 2009, 2010 and 2011, respectively. Three customers accounted for 13%, 10% and 10% of our revenue in fiscal 2010 and three customers accounted for 36%, 24%, and 14% of our revenue in fiscal 2011. No other customer accounted for greater than 10% of revenue in fiscal 2010 and 2011, and no customer accounted for greater than 10% of revenue in fiscal 2009. Revenue from customers with a ship-to location in the United States accounted for 86%, 76% and 82% of revenue for fiscal 2009, 2010 and 2011, respectively.
Cost of Revenue and Gross Margin
The following table presents our cost of revenue and gross margin for the periods indicated and related changes as compared to the prior periods (dollars in thousands):
| Year Ended June 30, |
Change in | Year Ended June 30, |
Change in | |||||||||||||||||||||||||||||
| 2009 | 2010 | $ | % | 2010 | 2011 | $ | % | |||||||||||||||||||||||||
| Cost of revenue |
$ | 5,000 | $ | 16,018 | $ | 11,018 | 220 | % | $ | 16,018 | $ | 84,043 | $ | 68,025 | 425 | % | ||||||||||||||||
| Gross profit |
5,150 | 20,198 | 15,048 | 292 | 20,198 | 113,161 | 92,963 | 460 | ||||||||||||||||||||||||
| Gross margin |
51 | % | 56 | % | 56 | % | 57 | % | ||||||||||||||||||||||||
2010 Compared to 2011. Cost of revenue increased $68.0 million and gross profit increased $93.0 million from fiscal 2010 to fiscal 2011, primarily due to the increase in volume of product shipped. Gross margin increased due to efficiencies resulting from economies of scale as our revenue has increased. The increase was partially offset by sales of excess raw materials of approximately $4.0 million related to end-of-life products in fiscal 2011, which were sold at their approximate carrying value.
2009 Compared to 2010. Cost of revenue increased $11.0 million and gross profit increased $15.0 million from fiscal 2009 to fiscal 2010, primarily due to the increase in the volume of our products shipped. Our gross margin increased from fiscal 2009 to fiscal 2010 due to favorable pricing of NAND Flash raw materials and efficiencies resulting from economies of scale as our revenue has increased. The increase in gross margin in fiscal 2010 was offset by a $0.6 million inventory carrying value adjustment that we recorded for obsolete inventory.
-41-
Table of Contents
Operating Expenses
Sales and Marketing
The following table presents our sales and marketing expenses for the periods indicated and related changes as compared to the prior periods (dollars in thousands):
| Year Ended June 30, |
Change in |
Year Ended June 30, |
Change in |
|||||||||||||||||||||||||||||
| 2009 | 2010 | $ | % | 2010 | 2011 | $ | % | |||||||||||||||||||||||||
| Sales and marketing |
$ | 13,476 | $ | 23,386 | $ | 9,910 | 74 | % | $ | 23,386 | $ | 55,698 | $ | 32,312 | 138 | % | ||||||||||||||||
2010 Compared to 2011. Sales and marketing expenses increased $32.3 million from fiscal 2010 to fiscal 2011, primarily due to an increase in the number of sales and marketing employees, from 123 as of June 30, 2010 to 232 as of June 30, 2011. This resulted in a $25.4 million increase in personnel-related costs, including a $9.6 million increase in commission expense. The increase was also due to a $2.4 million increase in marketing program costs, a $2.2 million increase in travel-related costs and a $0.8 million increase in allocated rent and facilities expenses.
2009 Compared to 2010. Sales and marketing expenses increased $9.9 million from fiscal 2009 to fiscal 2010, primarily due to an increase in sales and marketing personnel from 76 employees at the end of fiscal 2009 to 123 at the end of fiscal 2010, as we hired additional employees to focus on acquiring new customers and expanding our business into new geographic regions. This increase in headcount resulted in an $8.1 million increase in personnel-related costs, including a $2.6 million increase in sales commissions. The majority of the remaining increase in sales and marketing expenses from fiscal 2009 to fiscal 2010 was due to a $0.8 million increase in travel-related costs, a $0.5 million increase in product demonstration expenses, a $0.4 million increase in consulting services, and a $0.2 million increase in allocated rent and facilities expenses. These increases were offset by a $0.3 million decrease in marketing program costs, primarily related to tradeshows.
Research and Development
The following table presents our research and development expenses for the periods indicated and related changes as compared to the prior periods (dollars in thousands):
| Year Ended June 30, |
Change in |
Year Ended June 30, |
Change in |
|||||||||||||||||||||||||||||
| 2009 | 2010 | $ | % | 2010 | 2011 | $ | % | |||||||||||||||||||||||||
| Research and development |
$ | 11,707 | $ | 15,977 | $ | 4,270 | 36 | % | $ | 15,977 | $ | 27,238 | $ | 11,261 | 70 | % | ||||||||||||||||
2010 Compared to 2011. Research and development expenses increased $11.3 million from fiscal 2010 to fiscal 2011, primarily due to an increase in the number of research and development employees, from 97 as of June 30, 2010 to 152 as of June 30, 2011. This resulted in a $7.3 million increase in personnel-related costs. The increase was also due to a $1.7 million increase in manufacturing costs for new product prototypes, a $1.2 million increase in allocated rent and facilities expenses and a $0.3 million increase in depreciation expense.
2009 Compared to 2010. Research and development expenses increased $4.3 million from fiscal 2009 to fiscal 2010, primarily due to an increase in research and development personnel from 74 employees at the end of fiscal 2009 to 97 at the end of fiscal 2010, resulting in a $3.4 million increase in personnel-related costs. The increase was also due to a $0.4 million increase in manufacturing costs for new product prototypes, a $0.3 million increase in engineering consulting services and a $0.2 million increase in depreciation expense.
General and Administrative
The following table presents our general and administrative expenses for the periods indicated and related changes as compared to the prior periods (dollars in thousands):
| Year Ended June 30, |
Change in |
Year Ended June 30, |
Change in |
|||||||||||||||||||||||||||||
| 2009 | 2010 | $ | % | 2010 | 2011 | $ | % | |||||||||||||||||||||||||
| General and administrative |
$ | 4,849 | $ | 12,383 | $ | 7,534 | 155 | % | $ | 12,383 | $ | 20,556 | $ | 8,173 | 66 | % | ||||||||||||||||
-42-
Table of Contents
2010 Compared to 2011. General and administrative expenses increased $8.2 million from fiscal 2010 to fiscal 2011, primarily due to an increase in stock-based compensation of $4.6 million, of which $3.2 million specifically related to non-employee stock option awards and the significant increase in the fair value of these awards from period to period. In addition, the increase is due to the number of general and administrative employees, from 42 as of June 30, 2010 to 57 as of June 30, 2011. These increases contributed to a $7.9 million increase in personnel-related costs. The increase was offset by a $3.1 million decrease in legal costs, including a $1.0 million insurance claim reimbursement related to the resolution of litigation that was ongoing in fiscal 2010. The majority of the remaining increase was due to a $2.4 million increase in depreciation expense, a $0.5 million increase in professional accounting services, and a $0.3 million increase in allocated rent and facilities expenses.
2009 Compared to 2010. General and administrative expenses increased $7.5 million from fiscal 2009 to fiscal 2010, in part due to an increase in general and administrative personnel from 22 employees at the end of fiscal 2009 to 42 employees at the end of fiscal 2010, resulting in a $2.6 million increase in personnel-related costs. In addition, there was a $2.7 million increase in legal costs related to the resolution of legal proceedings. The majority of the remaining increase from fiscal 2009 to fiscal 2010 consisted of a $0.6 million increase in depreciation expense, primarily related to computer equipment and leasehold improvements, a $0.4 million increase in software support and expensed equipment, a $0.3 million increase in professional accounting fees, a $0.3 million increase in allocated rent and facilities expenses and a $0.2 million increase in travel-related expenses.
Other Income (Expense), net
The following table presents our other income (expense), net for the periods indicated and related changes as compared to the prior periods (dollars in thousands):
| Year Ended June 30, |
Change in |
Year Ended June 30, |
Change in |
|||||||||||||||||||||||||||||
| 2009 | 2010 | $ | % | 2010 | 2011 | $ | % | |||||||||||||||||||||||||
| Other income (expense), net |
$ | (690 | ) | $ | (156 | ) | $ | 534 | 77 | % | $ | (156 | ) | $ | (3,420 | ) | $ | (3,264 | ) | (2,092 | )% | |||||||||||
2010 Compared to 2011. Other income (expense), net increased $3.3 million from fiscal 2010 to fiscal 2011, primarily due to $2.1 million increased expense attributable to the revaluation of a warrant to purchase shares of convertible preferred stock and a $1.0 million increase due to a change in the fair value of a common stock repurchase derivative liability.
2009 Compared to 2010. Other income (expense), net decreased by $0.5 million from fiscal 2009 to fiscal 2010, primarily due to a $0.5 million decrease in interest expense related to the conversion or repayment of $15.4 million of outstanding convertible notes.
Income Tax Expense
The following table presents our income tax expense for the periods indicated and related changes as compared to the prior periods (dollars in thousands):
| Year Ended June 30, |
Change in |
Year Ended June 30, |
Change in |
|||||||||||||||||||||||||||||
| 2009 | 2010 | $ | % | 2010 | 2011 | $ | % | |||||||||||||||||||||||||
| Income tax expense |
$ | 1 | $ | 12 | $ | 11 | 1,100 | % | $ | 12 | $ | 1,694 | $ | 1,682 | 14,017 | % | ||||||||||||||||
2010 Compared to 2011. Income tax expense increased by $1.7 million due to income tax expense related to certain state jurisdictions for which taxable income exists and for which net operating loss carryforwards are not available, federal alternative minimum taxes, and foreign income taxes.
-43-
Table of Contents
Selected Quarterly Results of Operations
The following table presents, unaudited selected quarterly consolidated results of operations data for each of the quarters presented. The unaudited consolidated financial statements for each of these quarters were prepared on a basis consistent with our audited consolidated financial statements and include all adjustments, consisting of normal and recurring adjustments, that we consider necessary for a fair presentation of the financial position and results of operations as of and for such periods. You should read this table in conjunction with our consolidated financial statements and the related notes located elsewhere in this filing. The results of operations for any quarter are not necessarily indicative of the results of operations for any future periods.
| Quarter Ended | ||||||||||||||||||||||||||||||||
| Sept. 30, 2009 |
Dec. 31, 2009 |
Mar. 31, 2010 |
June 30, 2010 |
Sept. 30, 2010 |
Dec. 31, 2010 |
Mar. 31, 2011 |
June 30, 2011 |
|||||||||||||||||||||||||
| (In thousands, expect for gross margin and per share data) | ||||||||||||||||||||||||||||||||
| Revenue |
$ | 4,790 | $ | 7,137 | $ | 13,363 | $ | 10,926 | $ | 27,046 | $ | 31,218 | $ | 67,251 | $ | 71,689 | ||||||||||||||||
| Gross profit |
2,725 | 4,420 | 7,937 | 5,116 | 11,634 | 18,340 | 35,753 | 47,434 | ||||||||||||||||||||||||
| Gross margin |
56.9 | % | 61.9 | % | 59.4 | % | 46.8 | % | 43.0 | % | 58.7 | % | 53.2 | % | 66.2 | % | ||||||||||||||||
| Total operating expenses |
9,531 | 10,737 | 14,626 | 16,852 | 17,379 | 20,289 | 28,024 | 37,800 | ||||||||||||||||||||||||
| (Loss) income from operations |
(6,806 | ) | (6,317 | ) | (6,689 | ) | (11,736 | ) | (5,745 | ) | (1,949 | ) | 7,729 | 9,634 | ||||||||||||||||||
| Net (loss) income |
$ | (6,808 | ) | $ | (6,331 | ) | $ | (6,705 | ) | $ | (11,872 | ) | $ | (5,771 | ) | $ | (2,473 | ) | $ | 7,035 | $ | 5,764 | ||||||||||
| Net (loss) income attributable to common stockholders |
$ | (6,808 | ) | $ | (7,079 | ) | $ | (6,705 | ) | $ | (11,872 | ) | $ | (5,771 | ) | $ | (2,473 | ) | $ | 7,035 | $ | 5,764 | ||||||||||
| Net (loss) income per common share, basic |
$ | (0.66 | ) | $ | (0.66 | ) | $ | (0.60 | ) | $ | (1.00 | ) | $ | (0.46 | ) | $ | (0.19 | ) | $ | 0.50 | $ | 0.21 | ||||||||||
| Net (loss) income per common share, diluted |
$ | (0.66 | ) | $ | (0.66 | ) | $ | (0.60 | ) | $ | (1.00 | ) | $ | (0.46 | ) | $ | (0.19 | ) | $ | 0.09 | $ | 0.06 | ||||||||||
Revenue has increased sequentially in most of the quarters presented due to increases in the volume of products sold. Revenue increased $6.2 million from the three months ended December 31, 2009 to the three months ended March 31, 2010 primarily due to sales to three customers. Revenue increased $16.1 million from the three months ended June 30, 2010 to the three months ended September 30, 2010 primarily due to sales to one customer. Revenue increased $36.0 million from the three months ended December 31, 2010 to the three months ended March 31, 2011 primarily due to sales to two customers. Revenue increased $4.4 million from the three months ended March 31, 2011 to the three months ended June 30, 2011 primarily due to sales to one customer.
Gross margin for the three months ended June 30, 2010 was lower due to a $0.6 million inventory carrying value adjustment that we recorded for obsolete inventory. Gross margin for the three months ended September 30, 2010 decreased sequentially, primarily due to lower gross margins on high volume sales to one significant customer. The gross margin for the three months ended December 31, 2010 increased sequentially due to a significantly lower volume of sales to the same significant customer. Gross margin for the three months ended March 31, 2011 decreased sequentially primarily due to sales of excess raw materials of approximately $4.0 million related to end-of-life products, which were sold at their approximate carrying values and to a higher concentration of lower gross margin sales to this same significant customer. Gross margin for the three months ended June 30, 2011 increased due to the higher gross margin mix of products sold.
Operating expenses in all quarters increased sequentially as we continued to add headcount and incurred related costs to accommodate our growth.
-44-
Table of Contents
Liquidity and Capital Resources
Primary sources of liquidity
As of June 30, 2011, our principal sources of liquidity consisted of cash and cash equivalents of $219.6 million, accounts receivable of $44.4 million and amounts available under our revolving line of credit of approximately $21.7 million. In June 2011, we completed an initial public offering of our common stock, in which we sold and issued 12,600,607 shares and received proceeds of approximately $218.9 million, net of approximately $3.8 million in offering costs. We had working capital of $270.1 million as of June 30, 2011.
In August 2011, we used approximately $26.6 million of the net IPO proceeds to purchase IO Turbine. We anticipate using the remaining net proceeds from the IPO for working capital and general corporate purposes, including expansion of our sales organization, further development and expansion of our product offerings and possible acquisitions of, or investments in, businesses, technologies or other assets. We have no present understandings, commitments or agreements to enter into any acquisitions or investments. Our excess cash is primarily invested in money market funds.
Historically, our primary sources of liquidity have been from the issuance of common and convertible preferred stock, customer payments for our products and services, convertible notes and proceeds from our revolving line of credit.
Cash Flow Analysis
| Year Ended June 30, | ||||||||||||
| 2009 | 2010 | 2011 | ||||||||||
| (In thousands) | ||||||||||||
| Net cash provided by (used in): |
||||||||||||
| Operating activities |
$ | (24,816 | ) | $ | (39,553 | ) | $ | (9,857 | ) | |||
| Investing activities |
(3,577 | ) | (14,298 | ) | (916 | ) | ||||||
| Financing activities |
42,648 | 46,719 | 221,113 | |||||||||
Operating Activities
Our operating cash flow primarily depends on the timing and amount of cash receipts from our customers, inventory purchases and payments for operating expenses.
Our net cash used in operating activities for fiscal 2011 was $9.9 million. During this period our operating cash outflows, which consisted primarily of purchases of inventory and investments made to hire additional headcount to support our current and anticipated growth, were partially offset by cash collections from our customers. Our net income for 2011 was $4.6 million. Significant non-cash expenses included in net income were stock-based compensation of $8.6 million, depreciation and amortization expense of $4.5 million and the non-cash expense recorded related to the convertible preferred stock warrant and the common stock repurchase derivative liability.
Our net cash used in operating activities for fiscal 2010 was $39.6 million and was primarily due to an increase in our inventory balance of $21.2 million as a result of the increasing demand for our products. We also had headcount increases in all areas of our business from 172 employees as of June 30, 2009 to 262 employees as of June 30, 2010. Our net loss for 2010 was $31.7 million. Significant non-cash expenses included in net loss were stock-based compensation of $1.9 million and depreciation and amortization expense of $1.5 million.
Our net cash used in operating activities for fiscal 2009 was $24.8 million and was primarily due to the investments we made to grow the operating infrastructure necessary to support the growth in our business. From June 30, 2008 to June 30, 2009, we increased the total number of employees in our company from 86 to 172. Our
-45-
Table of Contents
inventory balances also increased from $0.7 million as of June 30, 2008 to $4.0 million as of June 30, 2009 due to increased demand for our products. Our net loss for fiscal 2009 was $25.6 million. Our fiscal 2009 net loss included non-cash stock-based compensation expense of $1.0 million and depreciation and amortization of $0.7 million.
Investing Activities
Cash flows from investing activities primarily relate to purchases of computer equipment, leasehold improvements and machinery and equipment to support our growth. Investing activities also includes purchases, sales and maturities of our short-term investments in available-for-sale securities.
In fiscal year 2011, our net cash used in investing activities was $0.9 million and was primarily due to the cash used for the purchase of property and equipment of $13.0 million offset by net proceeds from the sale of short-term investments of $12.0 million and $0.1 million from the sale of property and equipment.
For fiscal 2010, our net cash used in investing activities was $14.3 million, including $13.9 million for purchases of short-term investments and $3.4 million for purchases of property and equipment.
For fiscal 2009, our net cash used in investing activities was $3.6 million, including $2.4 million from purchases of property and equipment and $1.2 million from purchases of short-term investments.
Financing Activities
Cash flows from financing activities primarily include net proceeds from issuances of common and convertible preferred stock and proceeds and payments related to issuances of convertible notes and loans from a financial institution.
We generated $221.1 million of net cash from financing activities in fiscal 2011, primarily due to $219.2 million in net proceeds from the issuance of common stock, $11.0 million that we borrowed from a financial institution, $1.5 million in proceeds from the exercise of stock options and a $1.2 million tax benefit from the exercise of stock options and $0.7 million related to a change in restricted cash. These increases were offset by the repayment of $11.3 million of notes payable and capital lease obligations and $1.2 million in repurchases of common stock.
We generated $46.7 million in net cash from financing activities in fiscal 2010, including $43.8 million of net proceeds from the issuance of our Series C convertible preferred stock, $5.0 million from the issuance of convertible notes and $4.0 million from a loan with a financial institution. We repaid the $4.0 million loan prior to the end of fiscal 2010.
We generated $42.6 million in cash from financing activities in fiscal 2009, primarily due to the $28.1 million received from the issuance of our Series B convertible preferred stock, the $15.4 million from the issuance of convertible notes and the $6.0 million from a loan with a financial institution. We repaid the $6.0 million loan prior to the end of fiscal 2009.
Revolving Line of Credit
In September 2010, we amended and restated our loan and security agreement, or the revolving line of credit, with a financial institution. In August 2011, we entered into an amendment to this loan and security agreement to provide for the consent of the financial institution to the acquisition of IO Turbine and to provide us with further flexibility to consummate mergers and acquisitions in the future. The revolving line of credit allows us to borrow up to a limit of $25.0 million, with a sublimit of $6.0 million for letters of credit, certain cash management services and foreign exchange forward contracts. The borrowing limit can fluctuate due to a
-46-
Table of Contents
borrowing base consisting of our combined accounts receivable and inventory balances. Borrowings under the revolving line of credit accrue interest at a floating per annum rate equal to one-half of one percentage point (0.50%) above the prime rate as published in the Wall Street Journal. An unused commitment fee equal to 0.375% of the difference between the $25.0 million limit and the average daily balance of borrowings outstanding each quarter is due on the last day of such quarter. The revolving line of credit includes a prepayment penalty of approximately $0.3 million if outstanding advances are prepaid and the line is cancelled prior to September 2011. The revolving line of credit is secured by substantially all our assets.
During fiscal 2011, we borrowed and repaid a total of $11.0 million. As of June 30, 2011 no borrowings were outstanding under this agreement and we had obtained letters of credit totaling approximately $3.3 million.
We can borrow against the revolving line of credit until its maturity date in September 2012, at which time all unpaid principal and interest shall be due and payable. Under the terms of the revolving line of credit, we are required to maintain the following minimum financial covenants on a consolidated basis:
| • | A ratio of current assets to current liabilities plus, without duplication, any of our obligations to the financial institution, of at least 1.25 to 1.00 measured on a quarterly basis. |
| • | A tangible net worth of at least $25.0 million, plus 25% of the net proceeds received by us from the sale or issuance of our equity or subordinated debt, such increase, which is measured on a quarterly basis. |
As of June 30, 2011, we were in compliance with these covenants.
Future Capital Requirements
Our future capital requirements will depend on many factors, including our rate of revenue growth, possible acquisitions of, or investments in, businesses, technologies or other assets, the expansion of our sales and marketing activities, the timing and extent of spending to support product development efforts and the expansion into new territories, the timing of new product introductions, the building of infrastructure to support our growth, the continued market acceptance of our products, and strategic investments in businesses.
We believe that our cash and cash equivalents and available amounts under the revolving line of credit, will be sufficient to meet our working capital and capital expenditure requirements for at least the next 12 months. Although we are not currently a party to any agreement or letter of intent regarding potential investments in, or acquisitions of, complementary businesses, applications or technologies, we may enter into these types of arrangements, which could require us to seek additional equity or debt financing. If required, additional financing may not be available on terms that are favorable to us, if at all. If we raise additional funds through the issuance of equity or convertible debt securities, the percentage ownership of our stockholders will be reduced and these securities might have rights, preferences and privileges senior to those of our current stockholders. We cannot assure you that additional financing will be available or that, if available, such financing can be obtained on terms favorable to our stockholders and us.
Off Balance Sheet Arrangements
During the periods presented, we did not have any relationships with unconsolidated entities or financial partnerships, such as entities often referred to as structured finance or special purpose entities, which would have been established for the purpose of facilitating off-balance sheet arrangements or other contractually narrow or limited purpose.
-47-
Table of Contents
Contractual Obligations and Material Commitments
The following is a summary of our contractual obligations as of June 30, 2011 (in thousands):
| Payments Due by Period | ||||||||||||||||||||
| Total | Less Than 1 Year |
1 to 3 Years |
3 to 5 Years |
After 5 Years |
||||||||||||||||
| Operating lease obligations |
$ | 36,941 | $ | 3,783 | $ | 6,327 | $ | 7,014 | $ | 19,817 | ||||||||||
| Capital lease obligations |
113 | 107 | 6 | — | — | |||||||||||||||
| Purchase obligations(1) |
1,495 | 1,495 | — | — | — | |||||||||||||||
| Other obligations(2) |
1,137 | 1,137 | — | — | — | |||||||||||||||
|
|
|
|
|
|
|
|
|
|
|
|||||||||||
| Total |
$ | 39,686 | $ | 6,522 | $ | 6,333 | $ | 7,014 | $ | 19,817 | ||||||||||
|
|
|
|
|
|
|
|
|
|
|
|||||||||||
| (1) | Purchase obligations include non-cancelable purchase orders for raw materials inventory. Purchase obligations under purchase orders or contracts that we can cancel without a significant penalty, such as routine purchases for operating expenses, are not included in the above table. |
| (2) | In May 2011, we repurchased a total of 165,000 shares of our common stock from two of our stockholders, in separate transactions, for a total purchase price of approximately $1.2 million, pursuant to the exercise of our right of first refusal to which the shares were subject. The terms of the repurchase transaction for 150,000 of such shares require us to pay additional consideration to one of the stockholders equal to half the difference between the applicable liquidity event price per share and $15.00. The liquidity event price per share is the closing per share sale price as of the first trading day following the December 5, 2011 expiration date of the lock-up period applicable to our stockholders in connection with our initial public offering effective June 8, 2011. |
Operating lease payments primarily relate to our leases of office space with various expiration dates through 2021. The terms of these leases often include periods of free rent, or rent holidays, and increasing rental rates over time. In May 2010, we entered into new leases to expand our primary office facilities in Salt Lake City, Utah. The term of these leases include an initial lease term that ends in September 2021, plus the option for us to extend the lease for an additional five years. These leases include rent holidays during the first year beginning with the lease effective date and also require us to provide the lessor letters of credit in aggregate amount of $3.0 million.
Indemnification
We agreed to indemnify our officers and directors for certain events or occurrences, while the officer or director is or was serving at our request in such capacity. The maximum amount of potential future indemnification is unlimited; however, we have a director and officer insurance policy that limits our exposure and could enable us to recover a portion of any future amounts paid. We are unable to reasonably estimate the maximum amount that could be payable under these arrangements since these obligations are not capped but are conditional to the unique facts and circumstances involved. Accordingly, we have no liabilities recorded for these agreements as of June 30, 2011.
Many of our agreements with channel partners and customers generally include certain provisions for indemnifying the channel partners and customers against liabilities if our products infringe a third party’s intellectual property rights. To date, we have not incurred any material costs as a result of such indemnification provisions and have not accrued any liabilities related to such obligations in our consolidated financial statements.
Critical Accounting Policies and Estimates
Our consolidated financial statements are prepared in accordance with U.S. generally accepted accounting principles, or GAAP. The preparation of these consolidated financial statements requires us to make estimates
-48-
Table of Contents
and assumptions that affect the reported amounts of assets, liabilities, revenue, expenses and related disclosures. These estimates and assumptions are often based on judgments that we believe to be reasonable under the circumstances at the time made, but all such estimates and assumptions are inherently uncertain and unpredictable. Actual results may differ from those estimates and assumptions, and it is possible that other professionals, applying their own judgment to the same facts and circumstances, could develop and support alternative estimates and assumptions that would result in material changes to our operating results and financial condition. We evaluate our estimates and assumptions on an ongoing basis. Our estimates are based on historical experience and various other assumptions that we believe to be reasonable under the circumstances. Our actual results could differ from these estimates.
We believe that the assumptions and estimates associated with revenue recognition, stock-based compensation, inventory valuation, warranty liability and income taxes have the greatest potential impact on our consolidated financial statements. Therefore, we consider these to be our critical accounting policies and estimates. For further information on all of our significant accounting policies, see note 1 of the accompanying notes to our consolidated financial statements.
Revenue Recognition
We derive our revenue from sales of products and support services and enter into multiple-element arrangements in the normal course of business with our customers and channel partners. In all of our arrangements, we do not recognize revenue until we can determine that persuasive evidence of an arrangement exists, delivery has occurred, the fee is fixed or determinable, and we deem collection to be reasonably assured. In making these judgments, we evaluate these criteria as follows:
| • | Evidence of an Arrangement — We consider a non-cancelable agreement signed by a customer or channel partner or purchase order generated by a customer or channel partner to be persuasive evidence of an arrangement. |
| • | Delivery has Occurred — We consider delivery to have occurred when product has been delivered to the customer and no post-delivery obligations exist other than ongoing support obligations under sold support services. In instances where customer acceptance is required, delivery is deemed to have occurred when customer acceptance has been achieved. |
| • | Fees are Fixed or Determinable — We consider the fee to be fixed or determinable unless the fee is subject to refund or adjustment or is not payable within normal payment terms. If the fee is subject to refund or adjustment, we recognize revenue net of estimated returns or if a reasonable estimate cannot be made, when the right to a refund or adjustment lapses. |
| • | Collection is Reasonably Assured — We conduct a credit worthiness assessment on all our customers, OEMs and channel partners. Generally we do not require collateral. We continue to evaluate collectability by reviewing our customers’ and channel partners’ credit worthiness including a review of past transaction history. Our payment terms are typically net-30 days with terms up to net-60 days for certain customers and channel partners. Collection is reasonably assured if, based upon our evaluation, we expect that the customer will be able to pay amounts under the arrangement as payments become due. If we determine that collection is not reasonably assured, revenue is deferred and recognized upon the receipt of cash. |
For multiple-element arrangements originating on or prior to June 30, 2009, the total consideration in these arrangements was not allocated between product and support services revenue because we did not have objective and reliable evidence of fair value of the support services. Accordingly, the total consideration in such arrangements was deferred and is being recognized ratably over the support service period ranging from one to three years.
In October 2009, the Financial Accounting Standards Board (“FASB”) amended the accounting standards for multiple-element revenue arrangements. One of the new standards amends previously issued guidance to
-49-
Table of Contents
exclude tangible products containing software components and non-software components that function together to deliver the tangible product’s essential functionality from the scope of the software revenue recognition rules. The other new standard related to multiple-element arrangements changed the requirements for establishing separate units of accounting in a multiple-element arrangement and requires the allocation of arrangement consideration to each deliverable using the relative selling price of each element. We early adopted these accounting standards effective as of the beginning of fiscal year 2010.
For multiple-element arrangements originating or materially modified on or after July 1, 2009, we evaluated whether each deliverable could be accounted for as separate units of accounting. A deliverable constitutes a separate unit of accounting when it has stand-alone value and for an arrangement where a general right of return exists relative to a delivered item, delivery or performance of the undelivered item must be considered probable and substantially in our control. Stand-alone value exists if the product or service is sold separately.
Our multiple-element arrangements typically include two elements: ioDrive hardware, which includes embedded VSL virtualization software, and support services. We have determined that our ioDrive hardware and the embedded VSL virtualization software are considered a single unit of accounting because the hardware and software individually do not have standalone value and are never sold separately. Support services are considered a separate unit of accounting as they are sold separately and have standalone value.
We allocate arrangement consideration at the inception of an arrangement to all deliverables based on the relative selling price method in accordance with the selling price hierarchy, which includes: (1) vendor-specific objective evidence, or VSOE, if available; (2) third-party evidence, or TPE, if vendor-specific objective evidence is not available; and (3) best estimate of selling price, or BESP, if neither VSOE nor TPE is available.
| • | VSOE — We determine VSOE based on our historical pricing and discounting practices for the specific product or support service when sold separately. In determining VSOE, we require that a substantial majority of the selling prices for products or support services fall within a reasonably narrow pricing range. We have historically priced our products within a narrow range and have used VSOE to allocate the selling price of deliverables for product sales. |
| • | TPE — When VSOE cannot be established for deliverables in multiple element arrangements, we apply judgment with respect to whether we can establish selling price based on TPE. TPE is determined based on competitor prices for similar deliverables when sold separately. Generally, our products differ from those of our peers such that the comparable pricing of support services with similar functionality cannot be obtained. Furthermore, we are unable to reliably determine what similar competitor services’ selling prices are on a stand-alone basis. As a result, we have not been able to establish selling price based on TPE. |
| • | BESP — When we are unable to establish selling price using VSOE or TPE, we use BESP in our allocation of arrangement consideration. The objective of BESP is to determine the price at which we would transact a sale if the product or support service was sold on a stand-alone basis. We determine BESP for deliverables by considering multiple factors including, but not limited to, prices we charge for similar offerings, sales volume, geographies, market conditions, competitive landscape and pricing practices. |
Our agreements with certain customers, including certain OEMs and other channel partners, contain provisions for sales returns in limited circumstances, price protection and rebates. In limited circumstances and on an infrequent basis, even if we are not obligated to accept returned products, we may determine it is in our best interest to accept returns in order to maintain good relationships with our customers. We recognize revenue net of the effects of these estimated obligations at the time revenue is recorded.
We estimate product returns based upon our periodic analysis of historical returns as a percentage of revenue as well as known future returns. We periodically assess the accuracy of our historical estimates and to date the actual results have been reasonably consistent with our estimates. While we believe we have sufficient
-50-
Table of Contents
experience and knowledge of the market and customer buying patterns to reasonably estimate such returns, actual market conditions or customer behavior could differ from our expectations and as a result, our actual results could change materially.
Our price protection obligations with certain OEMs and other channel partners require us to notify them of any decreases in pricing and to provide them with a refund or credit for any units of our product that they have on hand as of the date of the pricing change. Historically, most of our sales to our OEMs and other channel partners have an identified end-user at the time we ship our products and thus the amount of inventory carried by our OEMs and other channel partners at any given time is limited. To date, we have not issued refunds or credits to our OEMs and other channel partners for price protection.
Certain of our contracts allow for rebates that are based on a fixed percentage of our sales to the customer or sales to the end-user or a fixed dollar amount per unit.
Deferred revenue primarily represents customer billings in excess of revenue recognized, primarily for support services. Support services are typically billed in advance on an annual basis or at the inception of a multiple year support contract and revenue is recognized ratably over the support period of one to three years.
Stock-Based Compensation
Under ASC 718, stock-based compensation cost for each award is estimated at the grant date based on the award’s fair value as calculated by an option-pricing model and is recognized as expense over the requisite service period. We use the Black-Scholes-Merton option-pricing model which requires various highly judgmental assumptions including the estimated fair value of our common stock, volatility over the expected life of the option, stock option exercise and cancellation behaviors, risk-free interest rate and expected dividends. We estimated the fair value of each employee option granted using the following assumptions for the periods presented in the table below.
| Year Ended June 30, | ||||||||||||
| 2009 | 2010 | 2011 | ||||||||||
| (unaudited) | ||||||||||||
| Expected stock price volatility |
49 | % | 49 | % | 48-60 | % | ||||||
| Expected life of options |
6.1 years | 6.1 years | 3.2-7.0 years | |||||||||
| Expected dividend yield |
— | — | — | |||||||||
| Risk-free interest rate |
2.8-3.4 | % | 2.4-2.9 | % | 0.6-2.7 | % | ||||||
| • | Volatility — As we do not have a trading history for our common stock, the expected stock price volatility for our common stock was estimated by taking the average historic price volatility for a group of companies we consider our peers based on a number of factors including, but not limited to, similarity to us with respect to industry, business model, stage of growth, financial risk or other factors, along with considering the future plans of our company to determine the appropriate volatility over the expected life of the option. We used the daily price of these peers over a period equivalent to the expected term of the stock option grants. We did not rely on implied volatilities of traded options in our peers’ common stock because the volume of activity was relatively low. We intend to continue to consistently apply this process using the same or similar public companies until a sufficient amount of historical information regarding the volatility of our own common stock share price becomes available, or unless circumstances change such that the identified companies are no longer similar to us, in which case, more suitable companies whose share prices are publicly available would be utilized in the calculation. |
| • | Expected Life — The expected life was based on the simplified method allowed under SEC guidance, which is calculated as the average of the option’s contractual term and weighted-average vesting period. We use this method as we have limited historical stock option data that is sufficient to derive a reasonable estimate of the expected life of an option. |
-51-
Table of Contents
| • | Dividend Yield — We have never declared or paid any cash dividends and do not presently plan to pay cash dividends in the foreseeable future. Consequently, we used an expected dividend yield of zero. |
| • | Risk-free Interest Rate — The risk-free interest rate was determined by reference to the U.S. Treasury rates with the remaining term approximating the expected option life assumed at the date of grant. |
In addition, we are required to estimate the expected forfeiture rate and only recognize expense for those options expected to vest. We estimate the forfeiture rate based on our historical experience. Further, to the extent our actual forfeiture rate is different from our estimate, stock-based compensation expense is adjusted accordingly. If any of the assumptions used in the Black-Scholes-Merton stock-option model change significantly, the fair value and stock-based compensation expense on future grants is impacted accordingly and stock-based compensation expense may differ materially in the future from that recorded in the current period.
Prior to June 9, 2011, the date our common stock began trading on the New York Stock Exchange, the fair value of common stock had been determined by the board of directors at each grant date based on a variety of factors, including periodic valuations of our common stock, our financial position, historical financial performance, projected financial performance, valuations of publicly traded peer companies arm’s-length sales of our common stock, and the illiquid nature of common stock. Since our initial public offering, we determine the fair value of our common stock based on the closing price as quoted on the New York Stock Exchange, of our common stock on the stock option grant date.
Inventory Valuation
Inventories consist of raw materials, work in progress, and finished goods and are stated at the lower of cost, on the average cost method, or market value. Our finished goods consist of manufactured finished goods.
We assess the valuation of all inventories, including raw materials, work in progress and finished goods, on a periodic basis. Inventory carrying value adjustments are established to reduce the carrying amounts of our inventories to their net estimated realizable values. Carrying value adjustments are based on historical usage, expected demand and evaluation unit conversion rate. Inherent in our estimates of market value in determining inventory valuation are estimates related to economic trends, future demand for our products and technological obsolescence of our products. For example, because our revenue often is comprised of large, concentrated sales to a limited number of customers, we may carry high levels of inventory prior to shipment. In addition, in circumstances where a supplier discontinues the production of a key raw material component, such as a specific type of NAND Flash memory, we may be required to make significant “last-time” purchases in order to ensure supply continuity until the transition is made to products based on next generation components. If a significant order were cancelled after we had purchased the related inventory, or if estimates of “last-time” purchases exceed actual demand, we may be required to record additional inventory carrying value adjustments.
Warranty Liability
We provide our customers a limited product warranty of three years for products shipped prior to January 1, 2010 and five years for products shipped on or after January 1, 2010. Our standard warranties require us to repair or replace defective products during such warranty period at no cost to the customer. We estimate the costs that may be incurred under our basic limited warranty and record a liability in the amount of such costs at the time product sales are recognized. Factors that affect our warranty liability include the number of installed units, historical experience and management’s judgment regarding anticipated rates of warranty claims and cost per claim. We assess the adequacy of our recorded warranty liability each period and make adjustments to the liability as necessary.
Income Taxes
Significant judgment is required in determining our provision for income taxes and evaluating our uncertain tax positions. We record income taxes using the asset and liability method, which requires the recognition of
-52-
Table of Contents
deferred tax assets and liabilities for the expected future tax consequences of events that have been recognized in our financial statements or tax returns. In estimating future tax consequences, generally all expected future events other than enactments or changes in the tax law or rates are considered. Valuation allowances are provided when necessary to reduce deferred tax assets to the amount expected to be realized.
We provide reserves as necessary for uncertain tax positions taken on our tax filings. First, we determine if the weight of available evidence indicates that a tax position is more likely than not to be sustained upon audit, including resolution of related appeals or litigation processes, if any. Second, based on the largest amount of benefit, which is more likely than not to be realized on ultimate settlement we recognize any such differences as a liability. Because of our full valuation allowance against the net deferred tax assets, any change in our uncertain tax positions would generally not impact our effective tax rate.
In evaluating our ability to recover our deferred tax assets, in full or in part, we consider all available positive and negative evidence, including our past operating results, our forecast of future market growth, forecasted earnings, future taxable income and prudent and feasible tax planning strategies. The assumptions utilized in determining future taxable income require significant judgment and are consistent with the plans and estimates we are using to manage the underlying businesses. Due to the net losses incurred and the uncertainty of realizing the deferred tax assets, for all the periods presented, we have a full valuation allowance against our deferred tax assets.
As of June 30, 2011, we had federal and state net operating loss carryforwards of $37.4 million and $42.3 million, respectively, and federal and state research and development tax credit carryforwards in the amount of $1.7 million and $0.7 million, respectively. In the future, we intend to utilize any carryforwards available to us to reduce our tax payments. A limited amount of these carryforwards will be subject to annual limitations that may result in their expiration before some portion of them has been fully utilized.
Recently Issued and Adopted Accounting Pronouncements
For information with respect to recent accounting pronouncements and the impact of these pronouncements on our consolidated financial statements, see Note 1 – Description of Business and Summary of Significant Accounting Policies in the notes to consolidated financial statements.
Segments
Operating segments are defined in accounting standards as components of an enterprise about which separate financial information is available and is regularly evaluated by management, namely the chief operating decision maker of an organization, in order to make operating and resource allocation decisions. We have concluded that we operate in one business segment, which is the development, marketing and sale of storage memory platforms. All of our revenue for all periods presented in the accompanying consolidated statements of operations has been from sales of the ioDrive product line and related customer support services.
Certain Relationships and Related Party Transactions
For a discussion of certain relationships and related party transactions, see Note 10 — Related Party Transactions in the notes to consolidated financial statements.
Part II. Item 7A. Quantitative and Qualitative Disclosures About Market Risk
Foreign Currency Risk
Our international sales and marketing operations incur expenses that are denominated in foreign currencies. Although our international operations are currently immaterial compared to our operations in the United States, we expect to continue to expand our international operations which will increase our potential exposure to
-53-
Table of Contents
fluctuations in foreign currencies. Our exposures are to fluctuations in exchange rates primarily for the U.S. dollar versus the euro and the British pound. Changes in currency exchange rates could adversely affect our consolidated results of operations or financial position. Additionally, our international sales and marketing operations maintain cash balances denominated in foreign currencies. In order to decrease the inherent risk associated with translation of foreign cash balances into our reporting currency, we have not maintained excess cash balances in foreign currencies. As of June 30, 2011, we had approximately $0.5 million of cash in foreign accounts. To date, we have not hedged our exposure to changes in foreign currency exchange rates and, as a result, could incur unanticipated translation gains and losses. Through June 30, 2011, all of our sales were billed in U.S. dollars and therefore not subject to direct foreign currency risk.
Part II. Item 8. Consolidated Financial Statements and Supplementary Data
The Consolidated Financial Statements and Schedule listed in the Index to Financial Statements, Schedules and Exhibits on page F-1 are filed as part of this report.
Part II. Item 9. Changes in and Disagreements with Accountants on Accounting and Financial Disclosure
None.
Part II. Item 9A. Controls and Procedures
Evaluation of Disclosure Controls and Procedures
As required by Rule 13a-15(b) under the Securities Exchange Act of 1934, as amended (the “Exchange Act”), our management, including our Chief Executive Officer and Chief Financial Officer, evaluated the effectiveness of the design and operation of our disclosure controls and procedures (as defined in Rule 13a-15(e) under the Exchange Act). Based upon that evaluation, our Chief Executive Officer and Chief Financial Officer concluded that, as of the end of the period covered by this report, our disclosure controls and procedures were effective.
Management’s Report on Internal Control over Financial Reporting
The SEC, as required by Section 404 of the Sarbanes-Oxley Act, adopted rules requiring every company that files reports with the SEC to include a management report on such company’s internal control over financial reporting in its annual report. In addition, our independent registered public accounting firm must attest to our internal control over financial reporting. This report on Form 10-K does not include a report of management’s assessment regarding internal control over financial reporting or an attestation report of our independent registered public accounting firm due to a transition period established by SEC rules applicable to newly public companies. Management will be required to provide an assessment of the effectiveness of our internal control over financial reporting as of June 30, 2012, and we expect that our independent registered public accounting firm will be required to attest that our internal control over financial reporting is effective as of June 30, 2012.
We believe we will have adequate resources and expertise, both internal and external, in place to meet these requirements. However, there is no guarantee that our efforts will result in management’s ability to conclude, or our independent registered public accounting firm to attest, that our internal control over financial reporting is effective as of the applicable dates.
Changes in Internal Control over Financial Reporting
Internal controls over financial reporting were modified during fiscal 2011 to remediate material weaknesses identified during fiscal 2009 and 2010 audits related to our financial statement close process and specifically the lack of a sufficient number of accounting personnel and a lack of formal accounting policies and procedures related to the identification of unique contract terms that affected revenue recognition, proper
-54-
Table of Contents
identification and accounting for inventory in transit and evaluation units and the recording of certain expenses in the proper period. Management believes it remediated the material weaknesses by hiring additional finance and accounting personnel and implementing additional policies and procedures associated with the financial statement close process.
Limitations on Controls
Management does not expect that our disclosure controls and procedures or our internal control over financial reporting will prevent or detect all error and fraud. Any control system, no matter how well designed and operated, is based upon certain assumptions and can provide only reasonable, not absolute, assurance that its objectives will be met. Further, no evaluation of controls can provide absolute assurance that misstatements due to error or fraud will not occur or that all control issues and instances of fraud, if any, within the Company have been detected.
Part II. Item 9B. Other Information
None.
Part III.
We are incorporating by reference the information required by Part III of this report on Form 10-K from our proxy statement relating to our 2011 annual meeting of stockholders (the “2011 Proxy Statement”), which will be filed with the SEC within 120 days after the end of fiscal 2011.
Part III. Item 10. Directors, Executive Officers and Corporate Governance
The information required by this item is included under the captions “Election of Directors — Nominees,” “Election of Directors — Board Meetings and Committees,” “Information Concerning Executive Officers” and “Section 16(a) Beneficial Ownership Reporting Compliance” in the 2011 Proxy Statement and incorporated herein by reference.
Part III. Item 11. Executive Compensation
The information required by this item is included under the captions “Election of Directors — Compensation of Non-Employee Directors,” “Election of Directors — Compensation Committee Interlocks and Insider Participation,” “Compensation Discussion and Analysis,” “Compensation Committee Report” and “Executive Compensation” in the 2011 Proxy Statement and incorporated herein by reference.
Part III. Item 12. Security Ownership of Certain Beneficial Owners and Management and Related Stockholder Matters
The information required by this item is included under the captions “Security Ownership of Certain Beneficial Owners and Management” and “Equity Compensation Plan Information” in the 2011 Proxy Statement and incorporated herein by reference.
Part III. Item 13. Certain Relationships and Related Transactions, and Director Independence
The information required by this item is included under the captions “Certain Relationships and Related Person Transactions” and “Election of Directors — Board Meetings and Committees” in the 2011 Proxy Statement and incorporated herein by reference.
Part III. Item 14. Principal Accounting Fees and Services
The information required by this item is included under the caption “Ratification of Appointment of the Independent Registered Public Accounting Firm” under the subheading of “Fees Paid to Ernst & Young, LLP” in the 2011 Proxy Statement and incorporated herein by reference.
-55-
Table of Contents
Part IV. Item 15. Exhibits, Consolidated Financial Statements and Financial Statement Schedules
(a)(1) Consolidated Financial Statements
We have filed the consolidated financial statements listed in the Index to Consolidated Financial Statements, Schedules and Exhibits on page F-1 as a part of this annual report on Form 10-K.
(a)(2) Financial Statement Schedules
All financial statement schedules have been omitted because they are not applicable, not material or the required information is shown in the consolidated financial statements or the notes thereto.
(a)(3) Exhibits
The exhibits listed below are filed as part of this annual report on Form 10-K.
| Incorporated by Reference | ||||||||||||||||
| Exhibit |
Exhibit Description |
Filed Herewith |
Form | Exhibit | Filing Date | |||||||||||
| 2.1 | Agreement and Plan of Reorganization, dated as of August 4, 2011¸ by and between the Registrant, IO Turbine, Inc. and certain other parties named therein | 8-K | 2.1 | 08/05/11 | ||||||||||||
| 3.1 | Amended and Restated Certificate of Incorporation of the Registrant | X | ||||||||||||||
| 3.2 | Amended and Restated Bylaws of the Registrant | X | ||||||||||||||
| 4.1 | Specimen common stock certificate of the Registrant | S-1/A | 4.1 | 05/23/2011 | ||||||||||||
| 4.2 | Second Amended and Restated Investors’ Rights Agreement, dated as of April 7, 2010 between the Registrant. and certain holders of the Registrant’s capital stock named therein | S-1 | 4.2 | 03/09/2011 | ||||||||||||
| 4.3 | Warrant to Purchase Stock issued by the Registrant to Silicon Valley Bank, dated September 10, 2008 | S-1 | 4.3 | 03/09/2011 | ||||||||||||
| 10.1A* | Form of Indemnification Agreement by and between the Registrant and certain of its directors and officers | S-1/A | 10.1A | 05/23/2011 | ||||||||||||
| 10.1B* | Form of Indemnification Agreement by and between the Registrant and certain of its directors affiliated with investment funds and such investment funds | S-1/A | 10.1B | 05/23/2011 | ||||||||||||
| 10.2* | 2006 Stock Option Plan and Form of Stock Option Agreement under 2006 Stock Option Plan | S-1 | 10.2 | 03/09/2011 | ||||||||||||
| 10.3* | 2008 Stock Incentive Plan and Form of Stock Option Agreement under 2008 Stock Incentive Plan | S-1 | 10.3 | 03/09/2011 | ||||||||||||
| 10.4* | 2010 Executive Stock Incentive Plan and Related Forms | S-1 | 10.4 | 03/09/2011 | ||||||||||||
| 10.5* | 2011 Equity Incentive Plan and Related Forms | S-1/A | 10.5 | 05/23/2011 | ||||||||||||
| 10.6* | 2011 Employee Stock Purchase Plan and Form of Purchase Agreement under 2011 Employee Stock Purchase Plan | S-1/A | 10.6 | 05/23/2011 | ||||||||||||
-56-
Table of Contents
| Incorporated by Reference | ||||||||||||||||
| Exhibit |
Exhibit Description |
Filed Herewith |
Form | Exhibit | Filing Date | |||||||||||
| 10.7* | Form of Non-Plan Stock Option Agreement between the Registrant and certain of its officers | S-1 | 10.7 | 03/09/2011 | ||||||||||||
| 10.8* | Second Amended and Restated Employment Agreement between the Registrant, David Flynn and Sandusky Investments, Ltd., dated as of April 7, 2010 | S-1 | 10.8 | 03/09/2011 | ||||||||||||
| 10.9* | Amended and Restated Employment Agreement between the Registrant, Rick White and West Coast VC, LLC, dated as of December 31, 2008 | S-1 | 10.9 | 03/09/2011 | ||||||||||||
| 10.9A* | Amendment Number One to Amended and Restated Employment Agreement between the Registrant, Rick White and West Coast VC, LLC, dated as of March 7, 2011 | S-1 | 10.9A | 03/09/2011 | ||||||||||||
| 10.10* | Form of Involuntary Termination Severance Agreement between the Registrant and certain of its officers | S-1 | 10.10 | 03/09/2011 | ||||||||||||
| 10.10A* | Involuntary Termination Severance Agreement between the Registrant and Dennis P. Wolf, dated as of August 11, 2010 | S-1/A | 10.10A | 04/18/2011 | ||||||||||||
| 10.11* | Transition Agreement and Release between the Registrant and David R. Bradford, dated as of September 21, 2010 | S-1 | 10.11 | 03/09/2011 | ||||||||||||
| 10.12 | Lease Agreement between the Registrant and NOP Cottonwood 2825, LLC, dated May 28, 2010 (Building 10) | S-1 | 10.12 | 03/09/2011 | ||||||||||||
| 10.13 | Lease Agreement between the Registrant and NOP Cottonwood 2855, LLC, dated May 28, 2010 (Building 11) | S-1 | 10.13 | 03/09/2011 | ||||||||||||
| 10.14 | Office Lease Agreement between the Registrant and Bixby Technology Center, LLC, dated May 29, 2009 | S-1 | 10.14 | 03/09/2011 | ||||||||||||
| 10.15A | Amended and Restated Loan and Security Agreement between the Registrant and Silicon Valley Bank, dated September 13, 2010 |
|
S-1 |
|
10.15 | 03/09/2011 | ||||||||||
| 10.15B | First Amendment to Amended and Restated Loan and Security Agreement between the Registrant and Silicon Valley Bank, dated as of August 4, 2011 | 8-K | 10.1 | 08/05/2011 | ||||||||||||
| 10.16* | Offer Letter between the Registrant and Dennis Wolf, dated November 4, 2009 | S-1/A | 10.16 | 05/06/2011 | ||||||||||||
| 10.17* | Offer Letter between the Registrant and Jim Dawson, dated April 1, 2008 | S-1/A | 10.17 | 05/06/2011 | ||||||||||||
| 10.18* | Offer Letter between the Registrant and Lance Smith, dated April 29, 2008 as supplemented by an Offer Letter dated December 26, 2008 | S-1/A | 10.18 | 05/06/2011 | ||||||||||||
| 10.19* | Executive Incentive Compensation Plan, adopted by the Registrant on May 16, 2011 | S-1/A | 10.19 | 05/23/2011 | ||||||||||||
-57-
Table of Contents
| Incorporated by Reference | ||||||||||
| Exhibit |
Exhibit Description |
Filed Herewith |
Form | Exhibit | Filing Date | |||||
| 10.20* | IO Turbine, Inc. 2009 Equity Incentive Plan | X | ||||||||
| 21.1 | Subsidiaries of the Registrant | X | ||||||||
| 23.1 | Consent of Independent Registered Public Accounting Firm | X | ||||||||
| 31.1 | Certification of the Chief Executive Officer pursuant to Section 302 of the Sarbanes-Oxley Act of 2002 | X | ||||||||
| 31.2 | Certification of the Chief Financial Officer pursuant to Section 302 of the Sarbanes-Oxley Act of 2002 | X | ||||||||
| 32.1 | Certification of the Chief Executive Officer pursuant to Section 906 of the Sarbanes-Oxley Act of 2002 | X | ||||||||
| 32.2 | Certification of the Chief Financial Officer pursuant to Section 906 of the Sarbanes-Oxley Act of 2002 | X | ||||||||
| * | Indicates a management contract or compensatory plan or arrangement. |
-58-
Table of Contents
Pursuant to the requirements of the Section 13 or 15(d) Securities Exchange Act of 1934, the Registrant has duly caused this report to be signed on its behalf by the undersigned hereunto duly authorized.
| Fusion-io, Inc. | ||
| By: | /s/ DAVID A. FLYNN | |
| David A. Flynn | ||
| Chief Executive Officer and President | ||
September 2, 2011
Pursuant to the requirements of the Securities Exchange Act of 1934, this report has been signed below by the following persons on behalf of the Registrant and in the capacities indicated on September 2, 2011.
| Signature |
Title | |
| /s/ DAVID A. FLYNN |
Chief Executive Officer, President and Director | |
| David A. Flynn | (Principal Executive Officer) | |
| /s/ DENNIS P. WOLF |
Chief Financial Officer and Executive Vice President | |
| Dennis P. Wolf | (Principal Financial and Accounting Officer) | |
| /s/ FOREST BASKETT, Ph.D. |
Director | |
| Forest Baskett, Ph.D. | ||
| /s/ H. RAYMOND BINGHAM |
Director | |
| H. Raymond Bingham | ||
| /s/ DANA L. EVAN |
Director | |
| Dana L. Evan | ||
| /s/ SCOTT D. SANDELL |
Director | |
| Scott D. Sandell | ||
| /s/ CHRISTOPHER J. SCHAEPE |
Director | |
| Christopher J. Schaepe | ||
| /s/ RICK C. WHITE |
Director | |
| Rick C. White | ||
-59-
Table of Contents
INDEX TO CONSOLIDATED FINANCIAL STATEMENTS
| Page | ||||
| F-2 | ||||
| F-3 | ||||
| F-4 | ||||
| F-5 | ||||
| F-6 | ||||
| F-7 | ||||
F-1
Table of Contents
REPORT OF INDEPENDENT REGISTERED PUBLIC ACCOUNTING FIRM
The Board of Directors and Stockholders of
Fusion-io, Inc.
We have audited the accompanying consolidated balance sheets of Fusion-io, Inc. (the Company) as of June 30, 2010 and 2011, and the related consolidated statements of operations, convertible preferred stock, stockholders’ (deficit) equity and comprehensive (loss) income, and cash flows for each of the three years in the period ended June 30, 2011. These financial statements are the responsibility of the Company’s management. Our responsibility is to express an opinion on these financial statements based on our audits.
We conducted our audits in accordance with the standards of the Public Company Accounting Oversight Board (United States). Those standards require that we plan and perform the audit to obtain reasonable assurance about whether the financial statements are free of material misstatement. We were not engaged to perform an audit of the Company's internal control over financial reporting. Our audits included consideration of internal control over financial reporting as a basis for designing audit procedures that are appropriate in the circumstances, but not for the purpose of expressing an opinion on the effectiveness of the Company's internal control over financial reporting. Accordingly, we express no such opinion. An audit also includes examining, on a test basis, evidence supporting the amounts and disclosures in the financial statements, assessing the accounting principles used and significant estimates made by management, as well as evaluating the overall financial statement presentation. We believe that our audits provide a reasonable basis for our opinion.
In our opinion, the financial statements referred to above present fairly, in all material respects, the consolidated financial position of Fusion-io, Inc. at June 30, 2010 and 2011, and the consolidated results of its operations and its cash flows for each of the three years in the period ended June 30, 2011, in conformity with U.S. generally accepted accounting principles.
As discussed in Note 1 to the consolidated financial statements, the Company changed its method of accounting for revenue recognition effective July 1, 2009 as a result of new revenue recognition guidance related to multiple-element arrangements.
/s/ Ernst & Young LLP
Salt Lake City, Utah
September 2, 2011
F-2
Table of Contents
CONSOLIDATED BALANCE SHEETS
(In thousands, except share and per share data)
| June 30, | ||||||||
| 2010 | 2011 | |||||||
| Assets |
||||||||
| Current assets: |
||||||||
| Cash and cash equivalents |
$ | 9,219 | $ | 219,604 | ||||
| Short-term investments |
11,974 | — | ||||||
| Accounts receivable, net of allowances of $912 and $2,064 as of June 30, 2010 and 2011, respectively |
5,581 | 44,374 | ||||||
| Inventories |
25,148 | 35,622 | ||||||
| Prepaid expenses and other current assets |
1,020 | 3,866 | ||||||
|
|
|
|
|
|||||
| Total current assets |
52,942 | 303,466 | ||||||
| Property and equipment, net |
5,468 | 13,743 | ||||||
| Restricted cash |
695 | — | ||||||
| Other assets |
347 | 77 | ||||||
|
|
|
|
|
|||||
| Total assets |
$ | 59,452 | $ | 317,286 | ||||
|
|
|
|
|
|||||
| Liabilities, Convertible Preferred Stock and Stockholders’ (Deficit) Equity |
||||||||
| Current liabilities: |
||||||||
| Accounts payable |
$ | 11,050 | $ | 9,314 | ||||
| Accrued and other current liabilities |
8,896 | 15,043 | ||||||
| Deferred revenue |
839 | 9,030 | ||||||
|
|
|
|
|
|||||
| Total current liabilities |
20,785 | 33,387 | ||||||
| Deferred revenue, less current portion |
— | 2,987 | ||||||
| Other liabilities |
263 | 6,468 | ||||||
| Commitments and contingencies |
||||||||
| Convertible preferred stock, $0.0002 par value; 53,069,497 and no shares authorized as of June 30, 2010 and 2011, respectively; 52,489,072 and no shares issued and outstanding as of June 30, 2010 and 2011, respectively (aggregate liquidation preference of $110,792 and $0 as of June 30, 2010 and 2011, respectively) |
104,513 | — | ||||||
| Stockholders’ (deficit) equity: |
||||||||
| Preferred stock, $0.0002 par value; no and 10,000,000 shares authorized as of June 30, 2010 and 2011, respectively; no shares issued and outstanding as of June 30, 2010 and 2011 |
— | — | ||||||
| Common stock, $0.0002 par value; 95,000,000 and 500,000,000 shares authorized as of June 30, 2010 and 2011, respectively; 13,610,481 and 81,149,569 shares issued and outstanding as of June 30, 2010 and 2011, respectively |
3 | 16 | ||||||
| Additional paid-in capital |
2,738 | 339,389 | ||||||
| Accumulated other comprehensive income |
2 | 15 | ||||||
| Accumulated deficit |
(68,852 | ) | (64,976 | ) | ||||
|
|
|
|
|
|||||
| Total stockholders’ (deficit) equity |
(66,109 | ) | 274,444 | |||||
|
|
|
|
|
|||||
| Total liabilities, convertible preferred stock and stockholders’ (deficit) equity |
$ | 59,452 | $ | 317,286 | ||||
|
|
|
|
|
|||||
See accompanying notes to consolidated financial statements
F-3
Table of Contents
CONSOLIDATED STATEMENTS OF OPERATIONS
(In thousands, except per share data)
| Year Ended June 30, | ||||||||||||
| 2009 | 2010 | 2011 | ||||||||||
| Revenue |
$ | 10,150 | $ | 36,216 | $ | 197,204 | ||||||
| Cost of revenue |
5,000 | 16,018 | 84,043 | |||||||||
|
|
|
|
|
|
|
|||||||
| Gross profit |
5,150 | 20,198 | 113,161 | |||||||||
| Operating expenses: |
||||||||||||
| Sales and marketing |
13,476 | 23,386 | 55,698 | |||||||||
| Research and development |
11,707 | 15,977 | 27,238 | |||||||||
| General and administrative |
4,849 | 12,383 | 20,556 | |||||||||
|
|
|
|
|
|
|
|||||||
| Total operating expenses |
30,032 | 51,746 | 103,492 | |||||||||
|
|
|
|
|
|
|
|||||||
| (Loss) income from operations |
(24,882 | ) | (31,548 | ) | 9,669 | |||||||
| Other income (expense): |
||||||||||||
| Interest income |
43 | 90 | 35 | |||||||||
| Interest expense |
(733 | ) | (246 | ) | (2,455 | ) | ||||||
| Other expense |
— | — | (1,000 | ) | ||||||||
|
|
|
|
|
|
|
|||||||
| (Loss) income before income taxes |
(25,572 | ) | (31,704 | ) | 6,249 | |||||||
| Income tax expense |
(1 | ) | (12 | ) | (1,694 | ) | ||||||
|
|
|
|
|
|
|
|||||||
| Net (loss) income |
(25,573 | ) | (31,716 | ) | 4,555 | |||||||
| Deemed dividend on repurchase of Series B convertible preferred stock |
— | (748 | ) | — | ||||||||
|
|
|
|
|
|
|
|||||||
| Net (loss) income attributable to common stockholders |
$ | (25,573 | ) | $ | (32,464 | ) | $ | 4,555 | ||||
|
|
|
|
|
|
|
|||||||
| Net (loss) income per common share: |
||||||||||||
| Basic |
$ | (3.27 | ) | $ | (2.95 | ) | $ | 0.27 | ||||
| Diluted |
$ | (3.27 | ) | $ | (2.95 | ) | $ | 0.06 | ||||
| Weighted average number of shares: |
||||||||||||
| Basic |
7,829 | 11,012 | 16,762 | |||||||||
| Diluted |
7,829 | 11,012 | 81,654 | |||||||||
See accompanying notes to consolidated financial statements
F-4
Table of Contents
CONSOLIDATED STATEMENTS OF CONVERTIBLE PREFERRED STOCK,
STOCKHOLDERS’ (DEFICIT) EQUITY AND COMPREHENSIVE (LOSS) INCOME
(In thousands, except share data)
| Convertible Preferred Stock |
Stockholders’ (Deficit) Equity | Comprehensive (Loss) Income |
||||||||||||||||||||||||||||||||||
| Common Stock | Additional Paid-in Capital |
Accumulated Other Comprehensive Income |
Accumulated Deficit |
Total Stockholders’ (Deficit) Equity |
||||||||||||||||||||||||||||||||
| Shares | Amount | Shares | Amount | |||||||||||||||||||||||||||||||||
| Balance as of June 30, 2008 |
17,445,450 | $ | 13,190 | 10,852,000 | $ | 2 | $ | 347 | $ | — | $ | (11,563 | ) | $ | (11,214 | ) | ||||||||||||||||||||
| Exercise of stock options |
— | — | 2,138,019 | 1 | 140 | — | — | 141 | ||||||||||||||||||||||||||||
| Conversion of convertible notes into Series B convertible preferred stock |
7,763,669 | 15,528 | — | — | — | — | — | — | ||||||||||||||||||||||||||||
| Issuance of Series B convertible preferred stock for cash, net of issuance costs of $264 |
14,171,233 | 28,078 | — | — | — | — | — | — | ||||||||||||||||||||||||||||
| Stock-based compensation |
— | — | — | — | 999 | — | — | 999 | ||||||||||||||||||||||||||||
| Net loss |
— | — | — | — | — | — | (25,573 | ) | (25,573 | ) | $ | (25,573 | ) | |||||||||||||||||||||||
|
|
|
|
|
|
|
|
|
|
|
|
|
|
|
|
|
|
|
|||||||||||||||||||
| Balance as of June 30, 2009 |
39,380,352 | $ | 56,796 | 12,990,019 | $ | 3 | $ | 1,486 | $ | — | $ | (37,136 | ) | $ | (35,647 | ) | $ | (25,573 | ) | |||||||||||||||||
|
|
|
|||||||||||||||||||||||||||||||||||
| Exercise of stock options |
— | — | 620,462 | — | 133 | — | 133 | |||||||||||||||||||||||||||||
| Issuance of Series B convertible preferred stock, net of issuance costs of $43 |
2,075,000 | 4,107 | — | — | — | — | — | — | ||||||||||||||||||||||||||||
| Repurchases of Series B convertible preferred stock (as restated) |
(542,961 | ) | (1,086 | ) | — | — | (748 | ) | — | — | (748 | ) | ||||||||||||||||||||||||
| Conversion of convertible notes into Series C convertible preferred stock |
1,302,237 | 5,038 | — | — | — | — | — | — | ||||||||||||||||||||||||||||
| Issuance of Series C convertible preferred stock, net of issuance costs of $94 |
10,274,444 | 39,658 | — | — | — | — | — | — | ||||||||||||||||||||||||||||
| Issuance of warrant to purchase common stock for services provided |
— | — | — | — | 11 | — | — | 11 | ||||||||||||||||||||||||||||
| Stock-based compensation |
— | — | — | — | 1,856 | — | — | 1,856 | ||||||||||||||||||||||||||||
| Foreign currency translation adjustment |
— | — | — | — | — | (2 | ) | — | (2 | ) | $ | (2 | ) | |||||||||||||||||||||||
| Unrealized gain on available for sale securities |
— | — | — | — | — | 4 | — | 4 | 4 | |||||||||||||||||||||||||||
| Net loss |
— | — | — | — | — | (31,716 | ) | (31,716 | ) | (31,716 | ) | |||||||||||||||||||||||||
|
|
|
|
|
|
|
|
|
|
|
|
|
|
|
|
|
|
|
|||||||||||||||||||
| Balance as of June 30, 2010 |
52,489,072 | $ | 104,513 | 13,610,481 | $ | 3 | $ | 2,738 | $ | 2 | $ | (68,852 | ) | $ | (66,109 | ) | $ | (31,714 | ) | |||||||||||||||||
|
|
|
|||||||||||||||||||||||||||||||||||
| Issuance of common stock, net of issuance costs of $3,789 |
— | — | 12,660,607 | 2 | 219,168 | — | — | 219,170 | ||||||||||||||||||||||||||||
| Exercise of stock options |
— | — | 2,541,909 | 1 | 1,545 | — | — | 1,546 | ||||||||||||||||||||||||||||
| Exercise of common stock warrant |
— | — | 12,500 | — | 25 | — | — | 25 | ||||||||||||||||||||||||||||
| Conversion of convertible preferred stock into common stock |
(52,489,072 | ) | (104,513 | ) | 52,489,072 | 10 | 104,503 | — | — | 104,513 | ||||||||||||||||||||||||||
| Reclassification of convertible preferred stock warrant liability upon conversion to common stock warrant |
— | — | — | — | 2,280 | — | — | 2,280 | ||||||||||||||||||||||||||||
| Repurchase of common stock |
— | — | (165,000 | ) | — | (661 | ) | — | (679 | ) | (1,340 | ) | ||||||||||||||||||||||||
| Stock-based compensation |
— | — | — | — | 8,637 | — | — | 8,637 | ||||||||||||||||||||||||||||
| Income tax benefit from stock option exercises |
— | — | — | — | 1,154 | — | — | 1,154 | ||||||||||||||||||||||||||||
| Foreign currency translation adjustment |
— | — | — | — | — | 17 | — | 17 | $ | 17 | ||||||||||||||||||||||||||
| Reclassification of unrealized gain into net income on available for sale securities |
— | — | — | — | — | (4 | ) | — | (4 | ) | (4 | ) | ||||||||||||||||||||||||
| Net income |
— | — | — | — | — | — | 4,555 | 4,555 | 4,555 | |||||||||||||||||||||||||||
|
|
|
|
|
|
|
|
|
|
|
|
|
|
|
|
|
|
|
|||||||||||||||||||
| Balance as of June 30, 2011 |
— | $ | — | 81,149,569 | $ | 16 | $ | 339,389 | $ | 15 | $ | (64,976 | ) | $ | 274,444 | $ | 4,568 | |||||||||||||||||||
|
|
|
|
|
|
|
|
|
|
|
|
|
|
|
|
|
|
|
|||||||||||||||||||
See accompanying notes to consolidated financial statements
F-5
Table of Contents
CONSOLIDATED STATEMENTS OF CASH FLOWS
(In thousands)
| Year Ended June 30, | ||||||||||||
| 2009 | 2010 | 2011 | ||||||||||
| Operating activities: |
||||||||||||
| Net (loss) income |
$ | (25,573 | ) | $ | (31,716 | ) | $ | 4,555 | ||||
| Adjustments to reconcile net (loss) income to net cash used in operating activities: |
||||||||||||
| Depreciation and amortization |
671 | 1,498 | 4,547 | |||||||||
| Stock-based compensation |
999 | 1,867 | 8,637 | |||||||||
| Interest on convertible notes |
538 | 38 | — | |||||||||
| Income tax benefit from stock option exercises |
— | — | (1,154 | ) | ||||||||
| Other non-cash items |
94 | 193 | 3,185 | |||||||||
| Changes in operating assets and liabilities: |
||||||||||||
| Accounts receivable, net |
(1,912 | ) | (3,420 | ) | (38,793 | ) | ||||||
| Inventories |
(3,286 | ) | (21,155 | ) | (10,474 | ) | ||||||
| Prepaid expenses and other assets |
(424 | ) | (607 | ) | (2,549 | ) | ||||||
| Accounts payable |
1,497 | 8,222 | (593 | ) | ||||||||
| Accrued and other liabilities |
1,742 | 5,526 | 11,604 | |||||||||
| Deferred revenues |
838 | 1 | 11,178 | |||||||||
|
|
|
|
|
|
|
|||||||
| Net cash used in operating activities |
(24,816 | ) | (39,553 | ) | (9,857 | ) | ||||||
| Investing activities: |
||||||||||||
| Purchases of short-term investments |
(1,181 | ) | (13,910 | ) | — | |||||||
| Proceeds from the sale of short-term investments |
— | 2,293 | 11,964 | |||||||||
| Proceeds from maturities of short-term investments |
— | 761 | — | |||||||||
| Proceeds from the sale of property and equipment |
— | — | 152 | |||||||||
| Purchases of property and equipment |
(2,396 | ) | (3,442 | ) | (13,032 | ) | ||||||
|
|
|
|
|
|
|
|||||||
| Net cash used in investing activities |
(3,577 | ) | (14,298 | ) | (916 | ) | ||||||
| Financing activities: |
||||||||||||
| Proceeds from issuance of convertible preferred stock |
28,078 | 43,765 | — | |||||||||
| Repurchases of convertible preferred stock |
— | (1,834 | ) | — | ||||||||
| Repurchases of common stock |
— | — | (1,223 | ) | ||||||||
| Proceeds from a loan from a financial institution |
5,989 | 4,000 | 11,000 | |||||||||
| Repayment of notes payable and capital lease obligations |
(6,021 | ) | (4,179 | ) | (11,254 | ) | ||||||
| Proceeds from exercises of stock options |
141 | 133 | 1,546 | |||||||||
| Proceeds from issuance of common stock, net of issuance costs |
— | — | 219,170 | |||||||||
| Proceeds from exercise of common stock warrant |
— | — | 25 | |||||||||
| Income tax benefit from stock option exercises |
— | — | 1,154 | |||||||||
| Change in restricted cash |
(529 | ) | (166 | ) | 695 | |||||||
| Proceeds from issuance of convertible notes |
15,390 | 5,000 | — | |||||||||
| Repayment of convertible notes |
(400 | ) | — | — | ||||||||
|
|
|
|
|
|
|
|||||||
| Net cash provided by financing activities |
42,648 | 46,719 | 221,113 | |||||||||
|
|
|
|
|
|
|
|||||||
| Effect of exchange rate changes on cash and cash equivalents |
— | (1 | ) | 45 | ||||||||
| Net increase (decrease) in cash and cash equivalents |
14,255 | (7,133 | ) | 210,385 | ||||||||
| Cash and cash equivalents at the beginning of period |
2,097 | 16,352 | 9,219 | |||||||||
|
|
|
|
|
|
|
|||||||
| Cash and cash equivalents at the end of period |
$ | 16,352 | $ | 9,219 | $ | 219,604 | ||||||
|
|
|
|
|
|
|
|||||||
| Supplemental disclosure of cash flow information: |
||||||||||||
| Cash paid for interest |
$ | 107 | $ | 122 | $ | 427 | ||||||
| Supplemental disclosure of noncash investing and financing activities: |
||||||||||||
| Conversion of convertible notes and interest into convertible preferred stock |
$ | 15,528 | $ | 5,038 | $ | — | ||||||
| Assets acquired under capital leases |
327 | 334 | — | |||||||||
| Conversion of convertible preferred stock to common stock |
— | — | 104,513 | |||||||||
| Reclassification of convertible preferred stock warrant liability upon conversion to common stock warrant |
— | — | 2,280 | |||||||||
See accompanying notes to consolidated financial statements
F-6
Table of Contents
NOTES TO CONSOLIDATED FINANCIAL STATEMENTS
1. Description of Business and Summary of Significant Accounting Policies
Fusion-io, Inc. (the “Company”) provides a next generation storage memory platform, which includes the Company’s ioMemory hardware, VSL virtualization software, directCache automated data-tiering software and ioSphere platform management software. The Company was originally incorporated in the state of Nevada in December 2005 and in June 2010 was reincorporated in the state of Delaware as Fusion-io, Inc. The Company sells its products through its global direct sales force, original equipment manufacturers (“OEMs”) and other channel partners.
Basis of Presentation
The consolidated financial statements include the accounts of the Company and its wholly owned subsidiaries. All intercompany balances and transactions have been eliminated in the consolidated financial statements.
Segment and Geographic Information
Operating segments are defined in accounting standards as components of an enterprise about which separate financial information is available and is regularly evaluated by management, namely the chief operating decision maker of an organization, in order to make operating and resource allocation decisions. The Company has concluded it operates in one business segment, which is the development, marketing and sale of storage memory platforms. Substantially all of the Company’s revenue for all periods presented in the accompanying consolidated statements of operations has been from sales of the ioDrive product line and related customer support services. The Company’s headquarters and most of its operations are located in the United States; however, it conducts limited sales activities through sales offices in Europe and Asia. Revenue recognized from sales with a ship-to location outside of the United States was 14%, 24%, and 18% for the fiscal years ended June 30, 2009, 2010 and 2011, respectively. No country outside of the United States accounted for greater than 10% of revenue for all periods presented. Long-lived assets located outside of the United States were not material for all periods for which a consolidated balance sheet is presented.
Use of Estimates
The preparation of financial statements in conformity with U.S. generally accepted accounting principles (“U.S. GAAP”) requires management to make estimates and assumptions that affect the reported amounts of assets and liabilities and disclosure of contingent assets and liabilities at the date of the financial statements and the reported amounts of revenue and expenses during the reporting period. On an on-going basis, the Company evaluates its estimates, including those related to revenue recognition, sales returns, determination of fair value of stock options, valuation of inventory, product warranty, income taxes, useful lives of property and equipment and provisions for doubtful accounts. Actual results could differ from those estimates.
Initial Public Offering
In June 2011, the Company completed an initial public offering, (“IPO”), of its common stock, in which the Company sold and issued 12,600,607 shares, including 1,845,000 shares sold pursuant to the full exercise by the underwriters of their over-allotment option, at an issuance price of $19.00 per share, less underwriting discounts and commissions. As a result of the offering, the Company received proceeds of approximately $218,864,000, net of approximately $3,789,000 in offering costs.
F-7
Table of Contents
FUSION-IO, INC.
NOTES TO CONSOLIDATED FINANCIAL STATEMENTS – (Continued)
Revenue Recognition
The Company derives its revenue from sales of storage memory products (“products”) and related support services. The Company recognizes revenue when persuasive evidence of an arrangement with a customer exists (such as a purchase order or a signed agreement), the product or service has been delivered, the fee earned by the Company is fixed or determinable and collection of the resulting receivable is reasonably assured. In making these judgments, the Company evaluates compliance with these criteria as follows:
| • | Evidence of an arrangement — A non-cancelable agreement signed by a customer or channel partner or purchase order generated by a customer or channel partner is considered persuasive evidence of an arrangement. |
| • | Delivery has occurred — Delivery has occurred when product has been delivered to the customer and no post-delivery obligations exist other than ongoing support obligations under sold support services. In instances where customer acceptance is required, delivery has occurred when customer acceptance has been achieved. |
| • | Fees are fixed or determinable — The Company considers the fee to be fixed or determinable unless the fee is subject to refund or adjustment or is not payable within normal payment terms. If the fee is subject to a refund or adjustment, the Company recognizes revenue net of estimated returns or, if a reasonable estimate cannot be made, when the right to a refund or adjustment lapses. |
| • | Collection is reasonably assured — The Company conducts a credit worthiness assessment on its customers, OEMs and channel partners. Generally collateral is not required. The Company also continues to evaluate collectability by reviewing customer and channel partner credit worthiness including a review of past transaction history. Payment terms are typically net-30 days with terms up to net-60 days for certain customers and channel partners. Collection is deemed reasonably assured if, based upon the credit worthiness evaluation, the Company expects that the customer will be able to pay amounts under the arrangement as payments become due. If the Company determines that collection is not reasonably assured, revenue is deferred and recognized upon the receipt of cash. |
The Company sells its products and support services directly to customers, OEMs and resellers. The Company’s agreements with certain customers, including certain OEMs and resellers, allow for product returns and price adjustments. In the period revenue is recognized, allowances are provided for estimated future product returns based on historical product return rates. If reliable estimates of future returns cannot be made, revenue is not recognized until the rights of return expire. From inception through June 30, 2011, the Company has not had any claims from its resellers for price adjustments. The Company also provides allowances for rebates and discounts based on programs in existence at the time revenue is recognized.
Revenue from stand-alone storage product sales is recognized either upon shipment from the Company’s shipping location or upon receipt of the product at the customer’s location based upon applicable terms. Revenue from sales of stand-alone support services is recognized ratably over the support service period.
Some of the Company’s revenue arrangements are multiple-element arrangements because they are comprised of sales of both storage products and support services. The Company’s storage products also contain the embedded VSL virtualization software. For multiple-element arrangements originating on or prior to June 30, 2009, the Company applied the scope exception included in Accounting Standards Codification (“ASC”) 985-605, Software Revenue Recognition because the Company determined that the software embedded in its storage products was incidental to its products as a whole. As a result of this scope exception, the Company followed the accounting guidance in ASC 605-25, Revenue Recognition-Multiple Element Arrangements. The total consideration in these arrangements was not allocated between product and services revenue, because the Company did not have objective and reliable evidence of fair value of the support services. Accordingly, the total
F-8
Table of Contents
FUSION-IO, INC.
NOTES TO CONSOLIDATED FINANCIAL STATEMENTS – (Continued)
consideration in such arrangements is deferred and recognized ratably over the support service period ranging from one to three years. In these multiple-element arrangements, the Company also defers the related inventory costs for the delivered items and subsequently expenses these costs to cost of revenue over the same period as the related support services. As of June 30, 2010 and 2011, these deferred costs were $20,000 and $7,000, respectively, and are included in prepaid expenses and other current assets in the accompanying balance sheets.
In October 2009, the Financial Accounting Standards Board (“FASB”) amended the accounting standards for multiple-element revenue arrangements. One of the new standards amends previously issued guidance to exclude tangible products containing software components and non-software components that function together to deliver the tangible product’s essential functionality from the scope of the software revenue recognition rules. The other new standard related to multiple element arrangements changed the requirements for establishing separate units of accounting in a multiple-element arrangement and requires the allocation of arrangement consideration to each deliverable using the relative selling price of each element. The Company early adopted these accounting standards effective as of the beginning of fiscal year 2010.
For multiple element arrangements originating or materially modified on or after July 1, 2009, the Company evaluates whether each deliverable can be accounted for as separate units of accounting. A deliverable constitutes a separate unit of accounting when it has stand-alone value and for an arrangement where a general right of return exists relative to a delivered item, delivery or performance of the undelivered item is considered probable and substantially in control of the Company. Stand-alone value exists if the product or service is sold separately by the Company or another vendor or could be resold by the customer. Where the aforementioned criteria for a separate unit of accounting are not met, the deliverable is combined with the undelivered element(s) and treated as a single unit of accounting for the purposes of allocation of the arrangement consideration and revenue recognition. The Company allocates the total arrangement consideration to each separable element of an arrangement based upon the relative selling price of each element.
The Company’s multiple element arrangements typically include two elements: ioDrive hardware, which includes embedded VSL virtualization software, and support services. The Company has determined that its ioDrive hardware and the embedded VSL virtualization software are considered a single unit of accounting because the hardware and software individually do not have standalone value and are never sold separately. Support services are considered a separate unit of accounting as they are sold separately and have standalone value.
The selling price for a deliverable is based on its vendor-specific objective evidence (“VSOE”) of the selling price if available, third party evidence (“TPE”) of the selling price if VSOE is not available, or best estimated selling price (“BESP”) if neither VSOE nor TPE is available. The Company then recognizes revenue on each deliverable in accordance with its policies for product and service revenue recognition.
VSOE is defined as the price charged when the same or similar product is sold separately or, if applicable, the stated substantive renewal rate in the agreement. If a product or service is seldom sold separately, it is unlikely that the Company can determine VSOE for the product or service. In determining VSOE, the Company requires that a substantial majority of the selling prices for a product or service fall within a reasonably narrow pricing range.
TPE would consist of competitor prices for similar deliverables when sold separately. The Company’s products contain significant differentiation such that the comparable pricing of products with similar functionality cannot be obtained. Furthermore, the Company is unable to reliably determine the stand-alone selling prices for similar products of its competitors. Therefore, the Company is typically not able to obtain TPE of selling price.
F-9
Table of Contents
FUSION-IO, INC.
NOTES TO CONSOLIDATED FINANCIAL STATEMENTS – (Continued)
The Company establishes BESP considering multiple factors including, but not limited to, cost and margin objectives, competitive pricing strategies, historical prices of products sold on a stand-alone basis, and general market conditions.
Shipping and handling costs are included in cost of sales.
Cash and Cash Equivalents and Short-term Investments
Cash consists of deposits with financial institutions. Cash equivalents include primarily money market funds and highly liquid debt securities with an original maturity of 90 days or less. Short-term investments include debt securities with an original maturity greater than 90 days. The Company classifies its investments in debt securities as available-for-sale and realized gains and losses are included in income based on the specific identification method. Unrealized gains and losses on available-for-sale securities are recorded to other comprehensive (loss) income, a component of stockholders’ (deficit) equity. Interest on securities classified as available-for-sale is included as a component of interest income. The Company may at times hold securities with stated maturities greater than one year until maturity. The Company considers these investments to be liquid resources available for current operations when and if needed and therefore would classify them as current assets unless specifically identified as an investment to be held to maturity.
Restricted Cash
Restricted cash at June 30, 2010 related to deposits held as cash collateral for letters of credit with a financial institution.
Concentrations of Credit Risk and Significant Customers and Suppliers
Financial instruments that potentially subject the Company to a concentration of credit risk consist principally of cash, cash equivalents, short-term investments and accounts receivable. The Company deposits cash with a high-credit-quality financial institution, which at times may exceed federally insured amounts. The Company has policies that limit its investments as to types of investments, maturity, liquidity, credit quality, concentration and diversification of issuers. The Company performs initial and ongoing credit evaluations of its customers’ financial condition and will limit the amount of credit as deemed necessary, but currently does not require collateral.
The customers accounting for greater than 10% of revenue were as follows:
| Year Ended June 30, | ||||||||||||
| 2009 | 2010 | 2011 | ||||||||||
| Customer A |
* | 10 | % | 36 | % | |||||||
| Customer B |
* | 10 | % | 14 | % | |||||||
| Customer C |
* | 13 | % | * | ||||||||
| Customer G |
* | * | 24 | % | ||||||||
| * | Indicates less than 10% of revenue for the period. |
F-10
Table of Contents
FUSION-IO, INC.
NOTES TO CONSOLIDATED FINANCIAL STATEMENTS – (Continued)
The customers accounting for greater than 10% of accounts receivable, net were as follows:
| Year Ended June 30, | ||||||||
| 2010 | 2011 | |||||||
| Customer A |
* | 11 | % | |||||
| Customer C |
19 | % | * | |||||
| Customer D |
20 | % | * | |||||
| Customer E |
12 | % | * | |||||
| Customer F |
18 | % | * | |||||
| Customer G |
* | 66 | % | |||||
| * | Indicates less than 10% of total accounts receivable, net. |
As a consequence of the concentration of the Company’s customers and typically, a small number of large purchases by these customers, revenue and operating results may fluctuate significantly from period to period.
The Company relies on a limited number of suppliers for its contract manufacturing and certain raw material components. The Company believes that other vendors would be able to provide similar products and services; however, the qualification of such vendors may require substantial start-up time. In order to mitigate any adverse impacts from a disruption of supply, the Company attempts to maintain an adequate supply of critical single-sourced raw materials.
Accounts Receivable
Accounts receivable balances are recorded at the invoiced amount and are non-interest-bearing. The Company maintains an allowance for doubtful accounts to reserve for potential uncollectible receivables. Allowances are made based upon a specific review of all significant outstanding invoices. For those invoices not specifically reserved, allowances are provided based upon a percentage of aged outstanding invoices. In determining these percentages, the Company analyzes its historical collection experience and current economic trends. Provisions are recorded in general and administrative expenses. The Company writes off accounts receivable balances to the allowance for doubtful accounts when it becomes likely that they will not be collected. Accounts receivable balances are considered past due when not paid in accordance with the contractual terms of the related arrangement. As of June 30, 2010 and 2011, the Company’s allowance for doubtful accounts was not considered significant.
The Company records a sales allowance to provide for estimated future product returns and price adjustments. In the period revenue is recognized, allowances are provided for estimated future product returns based on historical product return rates. If reliable estimates of future returns cannot be made, revenue is not recognized until the rights of return expire. The Company also provides allowances for rebates and discounts based on programs in existence at the time revenue is recognized. The Company evaluates the estimate of sales allowances on a regular basis and adjusts the amount reserved accordingly.
The changes in the Company’s sales allowance is as follows (in thousands):
| Year Ended June 30, | ||||||||||||
| 2009 | 2010 | 2011 | ||||||||||
| Balance at beginning of period |
$ | 7 | $ | 433 | $ | 912 | ||||||
| Additions |
946 | 3,908 | 7,942 | |||||||||
| Returns |
(520 | ) | (3,429 | ) | (6,790 | ) | ||||||
|
|
|
|
|
|
|
|||||||
| Balance at end of period |
$ | 433 | $ | 912 | $ | 2,064 | ||||||
|
|
|
|
|
|
|
|||||||
F-11
Table of Contents
FUSION-IO, INC.
NOTES TO CONSOLIDATED FINANCIAL STATEMENTS – (Continued)
Inventories
Inventories are stated at the lower of cost or market. Cost is computed using the average cost method, which approximates actual cost, on a first-in, first-out basis. The Company periodically assesses the recoverability of all inventories, including raw materials, work-in-process and finished goods to determine whether adjustments are required to record inventory at the lower of cost or market. Inventory that the Company determines to be obsolete or in excess of forecasted usage is reduced to its estimated realizable value based on assumptions about future demand and market conditions. If actual demand is lower than the forecasted demand, additional inventory write-downs may be required.
Property and Equipment
Property and equipment are stated at historical cost less accumulated depreciation. Repairs and maintenance costs are expensed as incurred as repairs and maintenance do not extend the useful life or improve the related assets. Depreciation and amortization, including amortization of leasehold improvements and assets under capital leases, is computed using the straight-line method over the estimated useful lives of the assets. The estimated useful life of each asset category is as follows:
| Computer equipment |
3 years | |
| Software |
3 years | |
| Machinery and equipment |
3 years | |
| Furniture and fixtures |
5 years | |
| Leasehold improvements |
Shorter of useful life or remaining lease term |
Impairment of Long-Lived Assets
The Company reviews its property and equipment for impairment whenever events or changes in circumstances indicate that the carrying value may not be recoverable. When there are indicators of potential impairment, the Company evaluates recoverability of the asset carrying values by comparing the carrying amount of an asset to the estimated undiscounted future cash flows expected to be generated by the asset. If the carrying amount of the asset exceeds its estimated undiscounted future net cash flows, an impairment charge is recognized based on the amount by which the carrying value of the asset exceeds the fair value of the asset. The Company recorded an impairment charge of $46,000 for the year ended June 30, 2011 for certain furniture and fixtures that were sold to a third party in connection with the termination of a facility lease.
Product Warranty
The Company provides its customers a limited product warranty of three years for products shipped prior to January 1, 2010 and five years for products shipped on or after January 1, 2010. The Company’s standard warranty requires the Company to repair or replace defective products at no cost to the customer during such warranty period. The Company estimates the costs that may be incurred under its basic limited warranty and records a liability in the amount of such costs at the time product sales are recognized. Factors that affect the Company’s warranty liability include the number of installed units, historical experience and management’s judgment regarding anticipated rates of warranty claims and cost per claim. The Company assesses the adequacy of its recorded warranty liability each period and makes adjustments to the liability as necessary.
F-12
Table of Contents
FUSION-IO, INC.
NOTES TO CONSOLIDATED FINANCIAL STATEMENTS – (Continued)
The following table presents the changes in the product warranty liability (in thousands):
| Year Ended June 30, | ||||||||||||
| 2009 | 2010 | 2011 | ||||||||||
| Balance at beginning of period |
$ | — | $ | 24 | $ | 153 | ||||||
| Additions |
24 | 225 | 1,280 | |||||||||
| Settlements |
— | (96 | ) | (767 | ) | |||||||
|
|
|
|
|
|
|
|||||||
| Balance at end of period |
$ | 24 | $ | 153 | $ | 666 | ||||||
|
|
|
|
|
|
|
|||||||
Foreign Currency
The functional currency of the Company’s international subsidiaries is the local currency. For those subsidiaries, expenses denominated in the functional currency are translated into U.S. dollars using average exchange rates in effect during the period and assets and liabilities are translated using period-end exchange rates. The foreign currency translation adjustments are included in accumulated other comprehensive income (loss) as a separate component of stockholders’ (deficit) equity. Foreign currency transaction gains or losses are recorded in other income (expense), net. Foreign currency transaction gains and losses for all periods presented were not material.
Stock-based Compensation
The Company records stock-based compensation expense related to employee stock-based awards based on the estimated fair value of the awards as determined on the date of grant. The Company utilizes the Black-Scholes-Merton option pricing model to estimate the fair value of employee stock options. The Black-Scholes-Merton model requires the input of highly subjective and complex assumptions, including the estimated fair value of the Company’s common stock on the date of grant, the expected term of the stock option and the expected volatility of the Company’s common stock over the period equal to the expected term of the grant. The Company estimates forfeitures at the date of grant and revises the estimates, if necessary, in subsequent periods if actual forfeitures differ from those estimates.
The Company accounts for stock options and warrants to purchase shares of stock that are issued to nonemployees based on the estimated fair value of such instruments using the Black-Scholes-Merton option pricing model. The measurement of stock-based compensation expense for these instruments is variable and subject to periodic adjustments to the estimated fair value until the awards vest or, in the case of the convertible preferred stock warrant, each reporting period until the warrant is exercised or converted to a warrant to purchase shares of common stock. Any resulting change in the estimated fair value is recognized in the Company’s consolidated statements of operations during the period in which the related services are rendered.
Income Taxes
Deferred tax assets and liabilities are accounted for using the liability method and represent the future tax consequences attributable to differences between financial statement carrying amounts of existing assets and liabilities and their respective tax bases. Deferred tax assets and liabilities are measured using enacted tax rates that are expected to be in effect when these temporary differences are expected to reverse. A valuation allowance is provided when it is more likely than not that some portion of the deferred tax assets will not be realized.
Advertising
The Company expenses advertising costs as incurred. Advertising expense was $148,000, $170,000 and $12,000 for the fiscal years ended June 30, 2009, 2010 and 2011, respectively.
F-13
Table of Contents
FUSION-IO, INC.
NOTES TO CONSOLIDATED FINANCIAL STATEMENTS – (Continued)
Research and Development
Research and development costs are expensed as incurred. Research and development expenses consist primarily of personnel costs, prototype expenses, consulting services and depreciation associated with research and development equipment.
Software Development Costs
The Company expenses software development costs as incurred until technological feasibility is attained, including research and development costs associated with stand-alone software products and software embedded in hardware products. Technological feasibility is attained when the Company has completed the planning, design and testing phase of development of its software and the software has been determined viable for its intended use, which typically occurs when beta testing commences. The period of time between when beta testing commences and when the software is available for general release to customers has historically been short with immaterial amounts of software development costs incurred during this period. Accordingly, the Company has not capitalized any software development costs to date.
Presentation of Certain Taxes
The Company collects various taxes from customers and remits these amounts to the applicable taxing authorities. The Company’s accounting policy is to exclude these taxes from revenue and cost of revenue.
Net (Loss) Income Per Share
Basic net (loss) income per share is computed using the weighted-average number of common shares outstanding during the period, less weighted-average common shares subject to repurchase. Diluted net income per share is computed using the weighted-average number of common shares outstanding and potentially dilutive common shares outstanding during the period that have a dilutive effect on earnings per share. Potentially dilutive common shares result from the assumed exercise of outstanding stock options, assumed vesting of outstanding restricted stock subject to vesting provisions and the assumed conversion of outstanding convertible preferred stock using the if-converted method. In a net loss position, diluted net loss per share is computed using only the weighted-average number of common shares outstanding during the period, less weighted-average common shares subject to repurchase, as any additional common shares would be anti-dilutive.
The following table presents the reconciliation of the numerator and denominator used in the calculation of basic and diluted net loss (income) per share (in thousands):
| Year Ended June 30, | ||||||||||||
| 2009 | 2010 | 2011 | ||||||||||
| Numerator: |
||||||||||||
| Net (loss) income attributable to common stockholders |
$ | (25,573 | ) | $ | (32,464 | ) | $ | 4,555 | ||||
|
|
|
|
|
|
|
|||||||
| Denominator: |
||||||||||||
| Weighted-average common shares outstanding |
11,604 | 13,120 | 17,247 | |||||||||
| Less weighted-average common shares outstanding subject to repurchase |
(3,775 | ) | (2,108 | ) | (485 | ) | ||||||
|
|
|
|
|
|
|
|||||||
| Weighted-average shares, basic |
7,829 | 11,012 | 16,762 | |||||||||
|
|
|
|
|
|
|
|||||||
| Dilution due to stock options and common stock warrant |
— | — | 64,892 | |||||||||
|
|
|
|
|
|
|
|||||||
| Weighted-average shares, diluted |
7,829 | 11,012 | 81,654 | |||||||||
|
|
|
|
|
|
|
|||||||
F-14
Table of Contents
FUSION-IO, INC.
NOTES TO CONSOLIDATED FINANCIAL STATEMENTS – (Continued)
The following weighted-average common stock equivalents were anti-dilutive and therefore were excluded from the calculation of diluted net (loss) income per share (in thousands):
| Year Ended June 30, | ||||||||||||
| 2009 | 2010 | 2011 | ||||||||||
| Convertible preferred stock |
22,417 | 43,261 | — | |||||||||
| Stock options |
1,938 | 1,782 | 8,846 | |||||||||
| Common stock subject to repurchase |
761 | 1,214 | — | |||||||||
|
|
|
|
|
|
|
|||||||
| Total |
25,116 | 46,257 | 8,846 | |||||||||
|
|
|
|
|
|
|
|||||||
Recently Issued and Adopted Accounting Pronouncements
In January 2010, the FASB issued new accounting guidance expanding disclosures regarding fair value measurements by adding disclosures about the different classes of assets and liabilities measured at fair value, the valuation techniques and inputs used, the activity in Level 3 fair value measurements and the transfers between Levels 1, 2 and 3. The new disclosures and clarifications of existing disclosures were effective for interim and annual reporting periods beginning after December 15, 2009, except for the disclosure requirements related to the activity in Level 3 fair value measurements. Those disclosure requirements are effective for fiscal years beginning after December 15, 2010 and for interim periods within those fiscal years. The Company adopted the new disclosures for fiscal 2011. Since the adoption of the new standards only required additional disclosure, the adoption did not have an impact on the Company’s consolidated financial position, results of operations or cash flows.
In December 2010, the FASB issued Accounting Standards Update No. 2010-29, Disclosure of Supplementary Pro Forma Information for Business Combinations (Topic 805) — Business Combinations (ASU 2010-29), to improve consistency in how the pro forma disclosures are calculated. Additionally, ASU 2010-29 enhances the disclosure requirements and requires description of the nature and amount of any material, nonrecurring pro forma adjustments directly attributable to a business combination. ASU 2010-29 is effective for the Company in fiscal 2012 and should be applied prospectively to business combinations for which the acquisition date is after the effective date. Early adoption is permitted. The Company will adopt ASU 2010-29 in fiscal 2012 and does not believe it will have a material impact on the Company’s consolidated financial statements.
In May 2011, the FASB issued Accounting Standards Update No. 2011-04, Amendments to Achieve Common Fair Value Measurement and Disclosure Requirements in U.S. GAAP and International Financial Reporting Standards (Topic 820) — Fair Value Measurement (ASU 2011-04), to provide a consistent definition of fair value and ensure that the fair value measurement and disclosure requirements are similar between U.S. GAAP and International Financial Reporting Standards. ASU 2011-04 changes certain fair value measurement principles and enhances the disclosure requirements particularly for Level 3 fair value measurements (as defined in Note 4 below). ASU 2011-04 is effective for the Company in its fourth quarter of fiscal 2012 and should be applied prospectively. The Company is currently evaluating the impact of the pending adoption of ASU 2011-04 on the Company’s consolidated financial statements.
In June 2011, the FASB issued Accounting Standards Update No. 2011-05, Comprehensive Income (Topic 220) — Presentation of Comprehensive Income (ASU 2011-05), to require an entity to present the total of comprehensive income, the components of net income, and the components of other comprehensive income either in a single continuous statement of comprehensive income or in two separate but consecutive statements.
F-15
Table of Contents
FUSION-IO, INC.
NOTES TO CONSOLIDATED FINANCIAL STATEMENTS – (Continued)
ASU 2011-05 eliminates the option to present the components of other comprehensive income as part of the statement of equity. ASU 2011-05 is effective for the Company in its first quarter of fiscal 2013 and should be applied retrospectively. The Company is currently evaluating the impact of the pending adoption of ASU 2011-05 on the Company’s consolidated financial statements.
2. Balance Sheet Components
Cash and Cash Equivalents and Short-term Investments
Cash, cash equivalents and short-term investments were as follows (in thousands):
| June 30, 2010 | ||||||||||||||||
| Amortized Cost |
Unrealized Gains |
Unrealized Losses |
Estimated Fair Value |
|||||||||||||
| Cash and cash equivalents: |
||||||||||||||||
| Cash |
$ | 675 | $ | — | $ | — | $ | 675 | ||||||||
| Money market funds |
6,045 | — | — | 6,045 | ||||||||||||
| U.S. government agency securities |
2,499 | — | — | 2,499 | ||||||||||||
|
|
|
|
|
|
|
|
|
|||||||||
| Total cash and cash equivalents |
$ | 9,219 | $ | — | $ | — | $ | 9,219 | ||||||||
|
|
|
|
|
|
|
|
|
|||||||||
| Short-term investments: |
||||||||||||||||
| U.S. government agency securities |
$ | 11,970 | $ | 4 | $ | — | $ | 11,974 | ||||||||
|
|
|
|
|
|
|
|
|
|||||||||
| Total short-term investments |
$ | 11,970 | $ | 4 | $ | — | $ | 11,974 | ||||||||
|
|
|
|
|
|
|
|
|
|||||||||
| June 30, 2011 | ||||||||||||||||
| Amortized Cost |
Unrealized Gains |
Unrealized Losses |
Estimated Fair Value |
|||||||||||||
| Cash and cash equivalents: |
||||||||||||||||
| Cash |
$ | 3,795 | $ | — | $ | — | $ | 3,795 | ||||||||
| Money market funds |
215,809 | — | — | 215,809 | ||||||||||||
|
|
|
|
|
|
|
|
|
|||||||||
| Total cash and cash equivalents |
$ | 219,604 | $ | — | $ | — | $ | 219,604 | ||||||||
|
|
|
|
|
|
|
|
|
|||||||||
Gross realized gains and gross realized losses resulting from the sale of available-for-sale securities were not material for all periods presented in the consolidated statement of operations.
Inventories
Inventories consisted of the following (in thousands):
| June 30, | ||||||||
| 2010 | 2011 | |||||||
| Raw materials |
$ | 7,836 | $ | 16,108 | ||||
| Work in progress |
7,191 | 2,346 | ||||||
| Finished goods |
10,121 | 17,168 | ||||||
|
|
|
|
|
|||||
| $ | 25,148 | $ | 35,622 | |||||
|
|
|
|
|
|||||
F-16
Table of Contents
FUSION-IO, INC.
NOTES TO CONSOLIDATED FINANCIAL STATEMENTS – (Continued)
Property and Equipment
Property and equipment consisted of the following (in thousands):
| June 30, | ||||||||
| 2010 | 2011 | |||||||
| Computer equipment |
$ | 3,813 | $ | 8,136 | ||||
| Software |
608 | 1,046 | ||||||
| Machinery and equipment |
896 | 1,991 | ||||||
| Furniture and fixtures |
468 | 2,092 | ||||||
| Leasehold improvements |
1,910 | 5,268 | ||||||
|
|
|
|
|
|||||
| 7,695 | 18,533 | |||||||
| Less accumulated depreciation and amortization |
(2,227 | ) | (4,790 | ) | ||||
|
|
|
|
|
|||||
| $ | 5,468 | $ | 13,743 | |||||
|
|
|
|
|
|||||
During the fiscal year ended June 2010, the Company capitalized leasehold improvements primarily related to its corporate offices of $1,047,000. The leasehold improvements were originally amortized over the remaining period of the related facility lease that was to end in July 2015. In December 2010, the Company entered into a termination agreement related to this lease resulting in the lease terminating on April 30, 2011. The net book value of the related leasehold improvements of $1,335,000 as of December 31, 2010 was amortized on a straight-line basis over the remaining lease term ending April 30, 2011. During the fiscal year ended June 30, 2011, the Company capitalized leasehold improvements of $5,230,000 primarily related to its corporate offices which are being amortized over the related lease term that ends in September 2021.
Accrued and Other Current Liabilities
Accrued and other current liabilities consisted of the following (in thousands):
| June 30, | ||||||||
| 2010 | 2011 | |||||||
| Accrued compensation |
$ | 7,303 | $ | 10,118 | ||||
| Convertible preferred stock warrant liability |
174 | — | ||||||
| Common stock repurchase derivative liability |
— | 1,137 | ||||||
| Accrued professional costs |
156 | 548 | ||||||
| Accrued other liabilities |
1,263 | 3,240 | ||||||
|
|
|
|
|
|||||
| $ | 8,896 | $ | 15,043 | |||||
|
|
|
|
|
|||||
Long-term Other Liabilities
Long-term other liabilities consisted of the following (in thousands):
| June 30, | ||||||||
| 2010 | 2011 | |||||||
| Long-term deferred tax liability |
$ | — | $ | 615 | ||||
| Long-term deferred rent |
92 | 5,847 | ||||||
| Long-term other liabilities |
171 | 6 | ||||||
|
|
|
|
|
|||||
| $ | 263 | $ | 6,468 | |||||
|
|
|
|
|
|||||
F-17
Table of Contents
FUSION-IO, INC.
NOTES TO CONSOLIDATED FINANCIAL STATEMENTS – (Continued)
3. Fair Value Measurements
Assets, Convertible Preferred Stock Warrant and Common Stock Repurchase Derivative Liability Measured and Recorded at Fair Value on a Recurring Basis
The Company measures and records certain financial assets and liabilities at fair value on a recurring basis. Fair value is based on the price that would be received from selling an asset or paid to transfer a liability in an orderly transaction between market participants at the measurement date.
The Company’s financial instruments that are measured at fair value on a recurring basis consist of money market funds, U.S. government agency securities, a convertible preferred stock warrant and a common stock repurchase derivative liability. The following three levels of inputs are used to measure the fair value of financial instruments:
| Level 1: | Quoted prices in active markets for identical assets or liabilities. The Company classifies its money market funds as Level 1 instruments as they are traded in active markets with sufficient volume and frequency of transactions. | |
| Level 2: | Observable prices that are based on inputs not quoted on active markets, but corroborated by market data. The Company classifies its U.S. government agency securities as Level 2 instruments due to the use of readily available market prices or alternative pricing sources utilizing market observable inputs. | |
| Level 3: | Unobservable inputs are used when little or no market data is available. The Company utilized a Black-Scholes-Merton option pricing model in order to determine the fair value of the convertible preferred stock warrant and a Monte Carlo model to determine the fair value of the common stock repurchase derivative liability. Certain inputs used in the models are unobservable. The fair values could change significantly based on future market conditions. | |
The fair value of these financial assets, the convertible preferred stock warrant and the common stock repurchase derivative liability was determined using the following inputs (in thousands):
| Fair Value Measurements at June 30, 2010 Using | ||||||||||||||||
| Description |
Level 1 | Level 2 | Level 3 | Total | ||||||||||||
| Cash equivalents: |
||||||||||||||||
| Money market funds |
$ | 6,045 | $ | — | $ | — | $ | 6,045 | ||||||||
| U.S. government agency securities |
— | 2,499 | — | 2,499 | ||||||||||||
| Short-term investments: |
||||||||||||||||
| U.S. government agency securities |
— | 11,974 | — | 11,974 | ||||||||||||
| Accrued and other liabilities: |
||||||||||||||||
| Convertible preferred stock warrant |
— | — | 174 | 174 | ||||||||||||
| Fair Value Measurements at June 30, 2011 Using | ||||||||||||||||
| Description |
Level 1 | Level 2 | Level 3 | Total | ||||||||||||
| Cash equivalents: |
||||||||||||||||
| Money market funds |
$ | 215,809 | $ | — | $ | — | $ | 215,809 | ||||||||
| Accrued and other liabilities: |
||||||||||||||||
| Common stock repurchase derivative liability |
$ | — | $ | — | $ | 1,137 | $ | 1,137 | ||||||||
F-18
Table of Contents
FUSION-IO, INC.
NOTES TO CONSOLIDATED FINANCIAL STATEMENTS – (Continued)
The following table summarizes the change in value of the convertible preferred stock warrant (in thousands):
| Year Ended June 30, | ||||||||
| 2010 | 2011 | |||||||
| Balance at beginning of period |
$ | 88 | $ | 174 | ||||
| Change in fair value included in interest expense |
86 | 2,106 | ||||||
| Reclassification of convertible preferred stock warrant liability due to conversion |
— | (2,280 | ) | |||||
|
|
|
|
|
|||||
| Balance at end of period |
$ | 174 | $ | — | ||||
|
|
|
|
|
|||||
The following table summarizes the change in the value of the common stock repurchase derivative liability (in thousands):
| Year Ended June 30, | ||||||||
| 2010 | 2011 | |||||||
| Balance at beginning of period |
$ | — | $ | — | ||||
| Fair value at transaction date |
— | 118 | ||||||
| Change in fair value included in other expense |
— | 1,019 | ||||||
|
|
|
|
|
|||||
| Balance at end of period |
$ | — | $ | 1,137 | ||||
|
|
|
|
|
|||||
Assets Measured and Recorded at Fair Value on a Non-recurring Basis
Non-financial long-lived assets such as property and equipment are recorded at their historical cost; however, if there is an impairment, the assets are measured and recorded at fair value. Certain furniture and fixtures were measured at fair value during the year ended June 30, 2011 due to circumstances that indicated that the carrying value of these assets was not recoverable, resulting in an impairment charge of $46,000. This impairment charge is included in operating expenses in the consolidated statements of operations. The fair value of the furniture and fixtures on the measurement date was $170,000 and was measured using level 2 inputs. The fair value was based on a quoted price in a market that is not active.
Fair Value of Other Financial Instruments
The carrying amounts of the Company’s accounts receivable, accounts payable, accrued liabilities, notes payable and other liabilities approximate their fair values due to their short maturities.
4. Long-term Obligations
Loan and Security Agreement
In September 2008, the Company entered into a loan and security agreement with a financial institution. Initially, the agreement provided for borrowings of up to $7,000,000 under a revolving line of credit, and up to an additional $3,000,000 under a bridge loan facility. In January 2009, the Company and the financial institution modified the loan and security agreement to allow financing of up to 80% of certain outstanding receivables, not to exceed $6,250,000. The borrowings carried interest at a rate ranging from prime to prime plus 2.0%. During the year ended June 30, 2009, the Company borrowed, and later repaid, an aggregate of $5,989,000 under these credit facilities. In January 2010, the Company amended the terms of the loan and security agreement primarily to increase the facility amount, modify certain financial covenants and extend the maturity date. The revised
F-19
Table of Contents
FUSION-IO, INC.
NOTES TO CONSOLIDATED FINANCIAL STATEMENTS – (Continued)
agreement allowed financing of up to 80% of certain outstanding receivables, not to exceed $7,500,000. Borrowings were available through April 2010 and any borrowings were due no later than April 2010. During the year ended June 30, 2010, the Company borrowed and repaid a total of $4,000,000. As of June 30, 2010 no borrowings were outstanding under this loan and security agreement.
In September 2010, the Company amended and restated its loan and security agreement (the “Revolving Line of Credit”) with a financial institution. The Revolving Line of Credit allows the Company to borrow up to a limit of $25,000,000 with a sublimit of $6,000,000 for letters of credit, certain cash management services and foreign exchange forward contracts. The total balance of letters of credit outstanding at June 30, 2011 was $3,349,000. Borrowings under the Revolving Line of Credit accrue interest at a floating per annum rate equal to one-half of one percentage point (0.50%) above the prime rate as published in the Wall Street Journal. An unused commitment fee equal to 0.375% of the difference between the $25,000,000 limit and the average daily balance of borrowings outstanding each quarter is due on the last day of such quarter. The Revolving Line of Credit includes a prepayment penalty of $250,000 if outstanding advances are prepaid and the line is cancelled prior to September 2011. The Revolving Line of Credit is secured by substantially all assets of the Company. The Company can make advances against the Revolving Line of Credit until its maturity date in September 2012, at which time all unpaid principal and interest shall be due and payable. During the year ended June 30, 2011, the Company borrowed and repaid a total of $11,000,000. As of June 30, 2011, no borrowings were outstanding under this loan and security agreement.
Under the terms of the Revolving Line of Credit, the Company is required to maintain the following minimum financial covenants on a consolidated basis:
| • | A ratio of current assets to current liabilities plus, without duplication, any obligations of the Company to the financial institution, of at least 1.25 to 1.00. |
| • | A tangible net worth of at least $25,000,000, plus 25% of the net proceeds received by the Company from the sale or issuance of the Company’s equity or subordinated debt, such increase to be measured as of the last day of the quarter in which the Company received such proceeds. |
As of June 30, 2011, the Company was in compliance with these covenants.
5. Income Taxes
The domestic and foreign components of (loss) income before income taxes were as follows (in thousands):
| Year Ended June 30, | ||||||||||||
| 2009 | 2010 | 2011 | ||||||||||
| Domestic |
$ | (25,572 | ) | $ | (31,742 | ) | $ | 5,802 | ||||
| Foreign |
— | 38 | 447 | |||||||||
|
|
|
|
|
|
|
|||||||
| (Loss) income before income taxes |
$ | (25,572 | ) | $ | (31,704 | ) | $ | 6,249 | ||||
|
|
|
|
|
|
|
|||||||
F-20
Table of Contents
FUSION-IO, INC.
NOTES TO CONSOLIDATED FINANCIAL STATEMENTS – (Continued)
Income tax expense consisted of the following components (in thousands):
| Year Ended June 30, | ||||||||||||
| 2009 | 2010 | 2011 | ||||||||||
| Current: |
||||||||||||
| Federal |
$ | — | $ | — | $ | — | ||||||
| State |
1 | 3 | 428 | |||||||||
| Foreign |
— | 9 | 112 | |||||||||
|
|
|
|
|
|
|
|||||||
| Total current tax expense |
1 | 12 | 540 | |||||||||
| Deferred: |
||||||||||||
| Federal |
— | — | — | |||||||||
| State |
— | — | — | |||||||||
| Foreign |
— | — | — | |||||||||
|
|
|
|
|
|
|
|||||||
| Total deferred tax expense |
— | — | — | |||||||||
|
|
|
|
|
|
|
|||||||
| Tax expense attributable to employee stock plans |
— | — | 1,154 | |||||||||
|
|
|
|
|
|
|
|||||||
| Total income tax expense |
$ | 1 | $ | 12 | $ | 1,694 | ||||||
|
|
|
|
|
|
|
|||||||
Income tax expense differed from the amounts computed by applying the statutory federal income tax rate of 34% to (loss) income before income taxes as a result of the following (in thousands):
| Year Ended June 30, | ||||||||||||
| 2009 | 2010 | 2011 | ||||||||||
| Federal tax benefit at statutory rate |
$ | (8,694 | ) | $ | (10,779 | ) | $ | 2,125 | ||||
| State tax (benefit) expense, net of federal tax effect |
(1,518 | ) | (646 | ) | 700 | |||||||
| Rate differential on foreign income taxes |
— | — | (40 | ) | ||||||||
| Current year research tax credits |
(272 | ) | (50 | ) | (618 | ) | ||||||
| Stock-based compensation |
— | — | 1,970 | |||||||||
| Change in valuation allowance |
10,158 | 10,922 | (3,306 | ) | ||||||||
| Other, net |
327 | 565 | 863 | |||||||||
|
|
|
|
|
|
|
|||||||
| Income tax expense |
$ | 1 | $ | 12 | $ | 1,694 | ||||||
|
|
|
|
|
|
|
|||||||
Significant components of the Company’s deferred income tax assets and liabilities were as follows (in thousands):
| June 30, | ||||||||
| 2010 | 2011 | |||||||
| Deferred tax assets: |
||||||||
| Net operating loss carryforwards |
$ | 21,903 | $ | 14,415 | ||||
| Tax credit carryforwards |
592 | 1,743 | ||||||
| Accruals and allowances |
2,818 | 6,474 | ||||||
| Stock-based compensation |
235 | 2,222 | ||||||
|
|
|
|
|
|||||
| Total deferred tax assets |
25,548 | 24,854 | ||||||
| Valuation allowance |
(25,518 | ) | (22,212 | ) | ||||
|
|
|
|
|
|||||
| 30 | 2,642 | |||||||
| Deferred tax liabilities: |
||||||||
| Depreciation |
(30 | ) | (2,642 | ) | ||||
|
|
|
|
|
|||||
| Deferred tax assets, net |
$ | — | $ | — | ||||
|
|
|
|
|
|||||
F-21
Table of Contents
FUSION-IO, INC.
NOTES TO CONSOLIDATED FINANCIAL STATEMENTS – (Continued)
As of June 30, 2011, the Company had federal and state net operating loss carryforwards (“NOLs”) of $37,351,000 and $42,252,000, respectively. The federal and state NOLs begin to expire in 2027 and 2014, respectively, if not utilized. The Company also had federal and state research and development tax credit carryforwards of $1,693,000 and $693,000, respectively, which begin to expire in 2027 and 2020, respectively, if not utilized.
The Company maintained a full valuation allowance at June 30, 2009, 2010 and 2011 due to the uncertainty of realizing future tax benefits from its net operating loss carryforwards and other deferred tax assets due to historical losses. The valuation allowance increased by $10,158,000 and $10,922,000 during the fiscal years ended June 30, 2009 and 2010 respectively and decreased by $3,306,000 during fiscal year ended June 30, 2011.
Utilization of the net operating loss carryforwards and credits may be subject to a substantial annual limitation due to the ownership change limitations provided by the Internal Revenue Code of 1986, as amended, and similar state provisions. The annual limitation may result in the expiration of net operating losses and credits before utilization. If an ownership change has occurred in the past or occurs in the future, the utilization of net operation loss and credit carryforwards could be significantly reduced. A study was performed to determine if any ownership changes as defined by the Internal Revenue Code of 1986 have occurred since the Company’s inception. The study calculated the amount of annual limitation related to such ownership changes and projected the expected usage of both net operating loss and credit carryforwards, by year. Based on the results of this study, the Company expects to utilize the full net operating loss carryforward before expiration. Approximately $111,000 of federal R&D credits are expected to expire unused.
Effective July 1, 2009, the Company adopted the provisions of FASB ASC 740-10, Accounting for Uncertainty in Income Taxes, which provides a financial statement recognition threshold and measurement attribute for a tax position taken or expected to be taken in a tax return. Under FASB ASC 740-10, the Company may recognize the tax benefit from an uncertain tax position only if it is more likely than not that the tax position will be sustained on examination by taxing authorities, based solely on the technical merits of the position. The tax benefits recognized in the financial statements from such a position should be measured based on the largest benefit that has greater than 50% likelihood to be sustained upon ultimate settlement. As a result of the implementation of ASC 740-10, the Company reclassified $184,000 of its tax reserves to ASC 740-10 reserves. Since the Company has a full valuation allowance against its deferred tax assets, the adoption of ASC 740-10 did not result in a change to the financial statements. As of June 30, 2011, the Company’s unrecognized tax benefits were $835,000.
The Company recognizes accrued interest and penalties related to uncertain tax positions as part of income tax expense. As of June 30, 2010 and June 30, 2011, the Company had no accrued interest and penalties.
During the fiscal year ended June 30, 2011, the aggregate changes in the total gross amount of unrecognized tax benefits were as follows (in thousands):
| Balance as of June 30, 2010 |
$ | 349 | ||
| Decrease of unrecognized tax benefits taken in prior years |
— | |||
| Increase in unrecognized tax benefits related to current year |
486 | |||
|
|
|
|||
| Balance at June 30, 2011 |
$ | 835 | ||
|
|
|
The total amount of unrecognized tax benefits that, if recognized, would affect the effective tax rate is zero due to the Company’s full valuation allowance against net deferred tax assets.
F-22
Table of Contents
FUSION-IO, INC.
NOTES TO CONSOLIDATED FINANCIAL STATEMENTS – (Continued)
The Company does not anticipate any significant change within fiscal 2012 of its uncertain tax positions, and the Company does not anticipate any events which could cause a change to these uncertainties. The Company files tax returns in the U.S. on a Federal basis and in many U.S. state and foreign jurisdictions. The Company is open for examinations in its major tax jurisdictions for the 2007 and forward tax years. There are no ongoing examinations by taxing authorities at this time.
In addition to the net operating loss carryforwards in the table above, as of June 30, 2011, the Company has approximately $18,857,000 of net operating loss carryforwards associated with stock option tax deductions greater than deductions claimed for book purposes. These benefits will be recorded directly to equity in the period they reduce current taxes payable.
The Company paid income taxes for state and foreign income taxes of $1,000, $12,000, and $540,000 during the fiscal years ended June 30, 2009, 2010 and 2011, respectively. For fiscal year ended June 30, 2011, income tax expense related to certain state and foreign jurisdictions for which taxable income exists and for which net operating loss carry forwards are not available to be utilized.
6. Convertible Notes
During the fiscal years ended June 30, 2009 and 2010, the Company issued unsecured convertible notes to investors for cash. In the fiscal year ended 2011, the Company did not issue any unsecured convertible notes. The notes accrued interest at 10% per annum and were automatically convertible into preferred stock in a qualifying financing at a conversion price equal to the price per share paid by the investors in such financing.
The following table presents the activity related to convertible notes (in thousands):
| Balance at July 1, 2008 |
$ | — | ||
| Issuance of notes |
15,390 | |||
| Interest accrued |
555 | |||
| Principal paid |
(17 | ) | ||
| Principal repaid |
(400 | ) | ||
| Conversion to Series B convertible preferred stock |
(15,528 | ) | ||
|
|
|
|||
| Balance at June 30, 2009 |
— | |||
| Issuance of notes |
5,000 | |||
| Interest accrued |
38 | |||
| Conversion to Series C convertible preferred stock |
(5,038 | ) | ||
|
|
|
|||
| Balance at June 30, 2010 |
$ | — | ||
|
|
|
F-23
Table of Contents
FUSION-IO, INC.
NOTES TO CONSOLIDATED FINANCIAL STATEMENTS – (Continued)
7. Convertible Preferred Stock and Stockholders’ (Deficit) Equity
Convertible Preferred Stock
Convertible preferred stock consisted of the following (in thousands, except share data):
| June 30, 2010 | June 30, 2011 | |||||||||||||||||||||||
| Shares Authorized |
Shares Issued and Outstanding |
Aggregate Liquidation Preference |
Shares Authorized |
Shares Issued and Outstanding |
Aggregate Liquidation Preference |
|||||||||||||||||||
| Series A |
17,571,250 | 17,445,450 | $ | 19,068 | $ | — | $ | — | $ | — | ||||||||||||||
| Series B |
23,867,334 | 23,466,941 | 46,934 | — | — | — | ||||||||||||||||||
| Series C |
11,630,913 | 11,576,681 | 44,790 | — | — | — | ||||||||||||||||||
|
|
|
|
|
|
|
|
|
|
|
|
|
|||||||||||||
| 53,069,497 | 52,489,072 | $ | 110,792 | $ | — | $ | — | $ | — | |||||||||||||||
|
|
|
|
|
|
|
|
|
|
|
|
|
|||||||||||||
During the fiscal year ended June 30, 2009, the Company designated 23,750,000 shares of its convertible preferred stock as Series B and the Company issued a total of 21,934,902 shares of Series B convertible preferred stock, including 7,763,669 shares issued upon conversion of convertible notes and 14,171,233 shares issued for $2.00 per share resulting in net cash proceeds of $28,078,000. During the fiscal year ended June 30, 2010, an additional 2,075,000 shares of Series B convertible preferred stock were issued for $2.00 per share resulting in net cash proceeds of $4,107,000.
During the fiscal year ended June 30, 2010, the Company designated 11,630,913 shares of its convertible preferred stock as Series C, repurchased 542,961 shares of Series B convertible preferred stock for $1,834,000 and issued a total of 11,576,681 shares of Series C convertible preferred stock, including 1,302,237 shares issued upon conversion of convertible notes and 10,274,444 shares issued for $3.869 per share resulting in net cash proceeds of $39,658,000.
Amounts paid in excess of the carrying amount related to the repurchase of the Series B convertible preferred stock are reflected as a deemed dividend in computing net loss attributable to common stockholders for the fiscal year ended June 30, 2010.
In conjunction with the Company’s initial public offering which closed on June 14, 2011, all shares of convertible preferred stock outstanding automatically converted into 52,489,072 shares of common stock.
Equity Incentive Plans
The Company adopted the 2006 Stock Option Plan (the “2006 Plan”) in July 2006 and subsequently granted a total of 3,028,135 options to purchase common stock under the 2006 Plan. Stock options granted under the 2006 Plan generally vest over a period of 30 months and have a contractual life of 10 years from the date of grant. In March 2008, the Company’s board of directors amended the terms of the 2006 Plan and terminated the ability to grant additional awards under this plan; however, the 2006 Plan will continue to govern the terms and conditions of the awards previously granted.
In March 2008, the Company adopted the 2008 Equity Incentive Plan (the “2008 Plan”) and in July 2010 the Company adopted the 2010 Executive Stock Incentive Plan (the “2010 Plan”). In January 2011, the Company’s board of directors and stockholders authorized an additional 3,000,000 shares of common stock for future issuance under the 2008 Plan and 2010 Plan. In June 2011, the Company’s board of directors determined that no future awards would be issued under the 2008 and 2010 Plans; however, the respective Plan will continue to govern the terms and conditions of the awards previously granted.
F-24
Table of Contents
FUSION-IO, INC.
NOTES TO CONSOLIDATED FINANCIAL STATEMENTS – (Continued)
In June 2011, the Company adopted the 2011 Equity Incentive Plan (the “2011 Plan”) and reserved a total of 12,132,430 shares of common stock for issuance under the 2011 Plan. The shares reserved for issuance under the 2011 Plan include shares returned as the result of expiration or termination of options from the previous Plans and other non-plan awards made prior to the Company’s initial public offering (which may not exceed 25,867,172 shares). As of June 30, 2011, 192,250 awards were issued and outstanding from the 2011 Plan. After giving additive effect of shares returned under the prior plans equal to 27,084, the number of shares available for issuance under the 2011 Plan as of June 30, 2011 was 11,967,264. In addition, the 2011 Plan provides for annual increases in the number of shares available for issuance on the first day of each fiscal year beginning July 1, 2012 equal to the lesser of:
| • | 5% of the outstanding shares of the Company’s common stock on the first day of the fiscal year; |
| • | 10,000,000 shares; and |
| • | such other amount as may be determined by the Company’s Board of Directors or a committee thereof |
The Stock Plans provide for the grant of incentive stock options to employees and for the grant of nonstatutory stock options and awards of restricted or unrestricted shares of common stock to employees, consultants, and advisors. Generally stock options granted under the Stock Plans vest over a period of 48 months and have a contractual life of 10 years from the date of grant. Grants of incentive stock options generally must be at an exercise price not less than the fair value of the underlying common stock on the date of grant.
Stock option activity for all the Stock Plans for the fiscal years ended June 30, 2009, 2010 and 2011 was as follows:
| Number of Shares Subject to Outstanding Options |
Weighted- Average Exercise Price Per Share |
Weighted- Average Contractual Term (in Years) |
Aggregate Intrinsic Value(1) |
|||||||||||||
| (in thousands) | ||||||||||||||||
| Outstanding as of June 30, 2008 |
8,015,385 | $ | 0.24 | |||||||||||||
| Granted |
10,392,157 | 0.63 | ||||||||||||||
| Exercised |
(2,138,019 | ) | 0.07 | |||||||||||||
| Canceled |
(3,091,856 | ) | 0.36 | |||||||||||||
|
|
|
|||||||||||||||
| Outstanding as of June 30, 2009 |
13,177,667 | 0.55 | ||||||||||||||
| Granted |
7,171,034 | 1.10 | ||||||||||||||
| Exercised |
(620,462 | ) | 0.21 | |||||||||||||
| Canceled |
(1,315,399 | ) | 0.60 | |||||||||||||
|
|
|
|||||||||||||||
| Outstanding as of June 30, 2010 |
18,412,840 | 0.77 | ||||||||||||||
| Granted |
10,166,575 | 4.67 | ||||||||||||||
| Exercised |
(2,541,909 | ) | 0.61 | |||||||||||||
| Canceled |
(1,309,575 | ) | 2.30 | |||||||||||||
|
|
|
|||||||||||||||
| Outstanding as of June 30, 2011 |
24,727,931 | $ | 2.31 | 8.6 | $ | 686,967 | ||||||||||
|
|
|
|||||||||||||||
| Vested and expected to vest as of June 30, 2011 |
20,367,655 | $ | 2.04 | 8.5 | $ | 571,408 | ||||||||||
|
|
|
|||||||||||||||
| Vested and exercisable as of June 30, 2011 |
7,524,484 | $ | 0.84 | 7.9 | $ | 220,102 | ||||||||||
|
|
|
|||||||||||||||
| (1) | The aggregate intrinsic value is equal to the difference between the exercise price of the underlying stock option awards and the estimated fair value of the Company’s common stock as of June 30, 2011. |
F-25
Table of Contents
FUSION-IO, INC.
NOTES TO CONSOLIDATED FINANCIAL STATEMENTS – (Continued)
Additional per share information related to stock options granted to employees was as follows:
| Year Ended June 30, | ||||||||||||
| 2009 | 2010 | 2011 | ||||||||||
| Weighted-average grant date fair value — granted |
$ | 0.32 | $ | 0.55 | $ | 3.22 | ||||||
| Weighted-average grant date fair value — forfeited |
0.22 | 0.30 | 2.33 | |||||||||
The aggregate intrinsic value of stock options exercised during the year ended June 30, 2011 was approximately $33,570,000, which was the difference between the exercise price of the underlying stock option awards and the estimated fair value of the Company’s common stock on the date of exercise.
Valuation Assumptions
The Company estimates the fair value of stock options granted to employees using the Black-Scholes-Merton pricing model and a single option award approach, which requires the input of several highly subjective and complex assumptions. The risk-free interest rate for the expected term of the option is based on the yield available on United States Treasury Zero Coupon issues with an equivalent expected term. The expected option term used in the Black-Scholes-Merton pricing model is calculated using the simplified method. The simplified method defines the expected term as the average of the option’s contractual term and the option’s weighted-average vesting period. The Company utilizes this method as it has limited historical stock option data that is sufficient to derive a reasonable estimate of the expected stock option term. The computation of estimated expected volatility is based on the volatility of comparable companies from a representative peer group selected based on industry data.
The following table presents the assumptions used in the Black-Scholes-Merton pricing model related to employee stock options:
| Year Ended June 30, | ||||||
| 2009 | 2010 | 2011 | ||||
| Expected volatility |
49% | 49% | 48-60% | |||
| Expected term (in years) |
6.1 | 6.1 | 3.2-7.0 | |||
| Risk-free interest rate |
2.8-3.4% | 2.4-2.9% | 0.6-2.7% | |||
| Expected dividends |
— | — | — | |||
Total stock-based compensation expense was classified as follows in the accompanying consolidated statement of operations (in thousands):
| Year Ended June 30, | ||||||||||||
| 2009 | 2010 | 2011 | ||||||||||
| Cost of revenue |
$ | 1 | $ | 9 | $ | 31 | ||||||
| Sales and marketing |
461 | 738 | 1,803 | |||||||||
| Research and development |
382 | 492 | 1,545 | |||||||||
| General and administrative |
155 | 628 | 5,258 | |||||||||
|
|
|
|
|
|
|
|||||||
| Total stock-based compensation |
$ | 999 | $ | 1,867 | $ | 8,637 | ||||||
|
|
|
|
|
|
|
|||||||
As of June 30, 2011, there was approximately $43,596,000 of total unrecognized compensation expense related to unvested stock options, which is expected to be recognized over a weighted-average service period of 2.8 years.
F-26
Table of Contents
FUSION-IO, INC.
NOTES TO CONSOLIDATED FINANCIAL STATEMENTS – (Continued)
Shares of Common Stock Subject to Repurchase
In March 2008, the Company agreed with two of its executives to add vesting provisions to an aggregate of 5,000,000 shares of common stock controlled by these executives. The Company had the right to repurchase any unvested shares at a price of $1.09 per share in the event the executive was to no longer provide services to the Company. The repurchase right expired ratably as the shares vested monthly over a 36-month period. The total fair value of the 5,000,000 shares of $1,790,000 was recognized as stock-based compensation expense on a straight-line basis over the vesting period.
The following table summarizes the activity related to these shares subject to repurchase:
| Number of Shares |
Weighted-Average Fair Value |
|||||||
| Unvested shares of common stock at July 1, 2008 |
4,583,333 | $ | 0.36 | |||||
| Common shares subject to vesting provisions |
4,583,333 | 0.36 | ||||||
| Vested |
(1,666,666 | ) | 0.36 | |||||
|
|
|
|||||||
| Unvested as of June 30, 2009 |
2,916,667 | 0.36 | ||||||
| Vested |
(1,666,667 | ) | 0.36 | |||||
|
|
|
|||||||
| Unvested as of June 30, 2010 |
1,250,000 | 0.36 | ||||||
| Vested |
(1,250,000 | ) | 0.36 | |||||
|
|
|
|||||||
| Unvested as of June 30, 2011 |
— | |||||||
|
|
|
|||||||
Non-employee Stock Options
The Company from time to time grants options to purchase common stock to non-employees for advisory and consulting services. The Company estimates the fair value of these stock options using the Black-Scholes-Merton option pricing formula at each balance sheet date and records expense ratably over the vesting period of each stock option award. The Company recorded stock-based compensation expense related to these non-employee stock options of $18,000, $54,000, and $3,235,000 for the fiscal years ended June 30, 2009, 2010 and 2011, respectively.
The following table presents the assumptions used in the Black-Scholes-Merton pricing model related to non-employee stock options:
| Year Ended June 30, | ||||||
| 2009 | 2010 | 2011 | ||||
| Expected volatility |
49-50% | 49% | 48-63% | |||
| Expected term (in years) |
8.8-9.9 | 7.8-10.0 | 7.1-10.0 | |||
| Risk-free interest rate |
2.7-3.8% | 2.9-3.6% | 2.1-3.4% | |||
| Expected dividends |
— | — | — | |||
Employee Stock Purchase Plan
Concurrent with the effectiveness of the Company’s registration statement on Form S-1 on June 8, 2011, the Company’s 2011 Employee Stock Purchase Plan (the “ESPP”) became effective. The ESPP allows eligible employees to purchase shares of the Company’s common stock at a discount through payroll deductions of up to 15% of their eligible compensation, subject to plan limitations. A participant may purchase a maximum of 1,500 shares during the offering period. Generally, the ESPP provides for six-month offering periods, and at the end of
F-27
Table of Contents
FUSION-IO, INC.
NOTES TO CONSOLIDATED FINANCIAL STATEMENTS – (Continued)
each offering period, employees are able to purchase shares at 85% of the lower of the fair market value of the Company’s common stock on the first trading day of the offering period or on the last day of the offering period.
At June 30, 2011, a total of 500,000 shares of common stock were reserved for future issuance under this plan. In addition, the ESPP provides for annual increases in the number of shares available for issuance on the first day of each fiscal year beginning July 1, 2012 equal to the lesser of:
| • | 1% of the outstanding shares of the Company’s common stock on the first day of the year; |
| • | 2,000,000 shares; and |
| • | such other amount as may be determined by the Company’s Board of Directors or a committee thereof |
The Company recorded stock-based compensation expense related to the ESPP of $79,000 for the fiscal year ended June 30, 2011. The following table presents the assumptions used in the Black-Scholes-Merton pricing model related to the ESPP:
| Expected volatility |
47 | % | ||
| Expected life (in years, equal to the contractual term) |
0.69 | |||
| Risk-free interest rate |
0.17 | % | ||
| Dividend yield |
— |
Warrants
During the year ended June 30, 2010, the Company granted to a business a fully vested warrant to purchase 12,500 shares of common stock for $1.96 per share in exchange for services rendered. The estimated fair value of the warrant of $11,000 was expensed in the year ended June 30, 2010 and was measured at the issuance date using the Black-Scholes-Merton option-pricing model with the following assumptions:
| Expected volatility |
49 | % | ||
| Expected life (in years, equal to the contractual term) |
5.0 | |||
| Risk-free interest rate |
2.4 | % | ||
| Dividend yield |
— |
In March 2011, the Company issued 12,500 shares of common stock pursuant to the exercise of this warrant.
In connection with the execution of the September 2008 loan and security agreement, the Company issued the financial institution a fully vested warrant to purchase 125,800 shares of Series A convertible preferred stock at $1.093 per share. The warrant may be exercised for cash or net settled at any time through September 2018. The number of shares to be issued upon settlement of the warrant is 125,800. In conjunction with the initial public offering of the Company’s common stock in June 2011, the warrant converted to a warrant to purchase 125,800 shares of common stock at $1.093 per share.
The FASB has issued accounting guidance on the classification of freestanding warrants and other similar instruments on shares that are redeemable (either puttable or mandatorily redeemable). The guidance requires liability classification for certain warrants issued that are exercisable into convertible preferred stock. Liability classification requires the warrants to be remeasured to their fair value at each reporting period. As of June 30, 2010 and 2011, the fair value of the warrant was $174,000 and $0, respectively, and was recorded in accrued and other liabilities in the accompanying balance sheet. During the fiscal year, any changes in the fair value of the warrant liability are recorded in interest expense prior to converting to a warrant to purchase common stock.
F-28
Table of Contents
FUSION-IO, INC.
NOTES TO CONSOLIDATED FINANCIAL STATEMENTS – (Continued)
Upon conversion, the liability was written-off of additional-paid in capital. The Company utilized a Black-Scholes-Merton option pricing model in order to determine the fair value of the preferred stock warrant, including the consideration of a risk-free interest rate, expected term and expected volatility. Due to the initial public offering of the Company’s common stock and the conversion of all shares of preferred stock to shares of common stock, the Company no longer remeasures the warrant to fair value.
The following table presents the assumptions used in the Black-Scholes-Merton pricing model as of each date the warrant was revalued:
| June 30, 2010 |
June 30, 2011 |
|||||||
| Expected volatility |
49 | % | 59 | % | ||||
| Expected term (in years) |
8.3 | 7.26 | ||||||
| Risk-free interest rate |
2.9 | % | 2.24 | % | ||||
| Expected dividends |
— | — | ||||||
The Company has reserved the following shares of common and convertible preferred stock for issuance upon the exercise of warrants that were outstanding:
| Number of Shares Subject to Warrants |
Shares Subject to Warrants |
Exercise Price |
Date First Exercisable | |||||||||||
| June 30, 2010 |
June 30, 2011 | |||||||||||||
| 12,500 | — | Common Stock | $ | 1.960 | May 28, 2010 | |||||||||
| 125,800 | — | Series A Convertible Preferred Stock | 1.093 | September 10, 2008 | ||||||||||
| — | 125,800 | Common Stock | 1.093 | September 10, 2008 | ||||||||||
|
|
|
|
|
|||||||||||
| 138,300 | 125,800 | |||||||||||||
|
|
|
|
|
|||||||||||
Common Stock and Shares of Common Stock Reserved for Future Issuance
Shares of common stock reserved for future issuance were as follows (in thousands):
| June 30, 2010 |
June 30, 2011 |
|||||||
| Stock options outstanding |
18,412,840 | 24,727,931 | ||||||
| ESPP |
— | 500,000 | ||||||
| Shares available for future grants |
7,073,491 | 11,967,264 | ||||||
| Warrant to purchase common stock |
12,500 | 125,800 | ||||||
| Warrant to purchase convertible preferred stock |
125,800 | — | ||||||
| Convertible preferred stock |
52,489,072 | — | ||||||
|
|
|
|
|
|||||
| 78,113,703 | 37,320,995 | |||||||
|
|
|
|
|
|||||
In February 2011, the Company issued an aggregate of 60,000 shares of common stock for cash to two members of its board of directors. The purchase price of these shares was $5.12 per share.
F-29
Table of Contents
FUSION-IO, INC.
NOTES TO CONSOLIDATED FINANCIAL STATEMENTS – (Continued)
Repurchase of Common Stock
In May 2011, the Company repurchased a total 165,000 shares of common stock from two of its stockholders, in separate transactions, for a total purchase price of $1,222,500. The terms and conditions of the individual stock repurchases, including the purchase price, were established independently between the two stockholders and a third party buyer unaffiliated with the Company. The Company exercised its pre-existing right of first refusal to which the shares were subject and repurchased the shares on the same terms and conditions to which the stockholders and third party buyer had agreed.
The terms of the repurchase transaction for 150,000 of such shares requires the Company to pay additional consideration to one of the stockholders if a liquidity event occurs at any time prior to May 2, 2012 in which the price per share of the Company’s common stock is greater than $15.00. For this purpose, a liquidity event is defined as either a change of control or sale of substantially all of the assets of the Company or the initial public offering of common stock of the Company, or IPO. The amount of the additional per share consideration payable would be equal to half the difference between the applicable liquidity event price per share and $15.00. The liquidity event price per share is the closing per share sale price as of the first trading day following the December 5, 2011 expiration date of the lock-up period described in the underwriting section of the Company’s Form S-1 registration statement. Such consideration shall be payable three business days following the final determination of the amount of such payment. As this transaction will be settled with a cash payment and the amount of settlement is indexed to the Company’s common stock price per share, this transaction was accounted for as a derivative instrument in accordance with ASC 815, Accounting for Derivative Instruments and Hedging Activities, and was recorded at fair value ($118,000 on the date of the transaction and $1,137,000 as of June 30, 2011) on the consolidated balance sheets in accrued and other liabilities. The derivative agreement does not meet the hedge criteria and the Company recorded the change in fair value of the derivative of $1,019,000 as other expense in the consolidated statement of operations in fiscal 2011.
8. Commitments and Contingencies
Letters of Credit
As of June 30, 2010 and 2011, the Company had a total of $645,000 and $3,349,000, respectively, in letters of credit outstanding with a financial institution. These outstanding letters of credit have been issued for purposes of securing the Company’s obligations under equipment and facility leases.
Leases
The Company leases certain assets under capital leases with initial lease terms of 36 months, imputed interest rates between 7.8% and 9.4% and maturities at various dates through fiscal year 2013. These leases are recorded as capital leases due to each lease containing a bargain purchase option. Obligations under capital leases are included in accrued and other current liabilities and other liabilities in the accompanying consolidated balance sheets. Property and equipment capitalized under capital lease obligations were as follows (in thousands):
| June 30, | ||||||||
| 2010 | 2011 | |||||||
| Computer equipment |
$ | 177 | $ | 177 | ||||
| Machinery and equipment |
301 | 301 | ||||||
| Furniture and fixtures |
183 | — | ||||||
|
|
|
|
|
|||||
| 661 | 478 | |||||||
| Less accumulated depreciation and amortization |
(201 | ) | (275 | ) | ||||
|
|
|
|
|
|||||
| $ | 460 | $ | 203 | |||||
|
|
|
|
|
|||||
F-30
Table of Contents
FUSION-IO, INC.
NOTES TO CONSOLIDATED FINANCIAL STATEMENTS – (Continued)
Future minimum lease payments under non-cancelable operating leases and payments under capital leases were as follows (in thousands):
| June 30, 2011 | ||||||||
| Capital Leases |
Operating Leases |
|||||||
| 2012 |
$ | 107 | $ | 3,783 | ||||
| 2013 |
6 | 3,593 | ||||||
| 2014 |
— | 2,734 | ||||||
| 2015 |
— | 3,476 | ||||||
| 2016 |
— | 3,538 | ||||||
| Thereafter |
— | 19,817 | ||||||
|
|
|
|
|
|||||
| Total |
113 | $ | 36,941 | |||||
|
|
|
|||||||
| Less: imputed interest |
(5 | ) | ||||||
|
|
|
|||||||
| Capital lease obligations |
108 | |||||||
| Less: current portion |
(102 | ) | ||||||
|
|
|
|||||||
| Capital lease obligations — noncurrent |
$ | 6 | ||||||
|
|
|
|||||||
Operating lease payments primarily relate to the Company’s leases of office space with various expiration dates through 2021. The terms of these leases often include periods of free rent, or rent holidays, and increasing rental rates over time. The Company recognizes rent expense on a straight-line basis over the lease period and has accrued for rent expense recorded but not paid. In May 2010, the Company entered into new leases to expand its primary office facilities in Salt Lake City, Utah. The term of these leases include an initial lease term that ends in September 2021, plus the option for the Company to extend the lease for an additional five years. These leases include rent holidays during the first year beginning with the lease effective date and also require the Company to provide the lessor letters of credit in aggregate of $3,000,000. These letters of credit were required upon signing the lease but as of June 30, 2010, the Company did not have the letters of credit in place. The letters of credit were secured in October 2010. This delay did not constitute an event of default under the lease agreements.
The Company also leases certain equipment under operating leases that expire at various dates through 2016. These equipment leases typically include provisions that allow the Company at the end of the initial lease term to renew the lease, purchase the underlying equipment at the then fair market value or return the equipment to the lessor.
Rent expense was $1,306,000, $1,614,000, and $4,034,000 for the fiscal years ended June 30, 2009, 2010 and 2011, respectively.
Purchase Commitments
The Company had non-cancelable purchase orders for raw materials inventory of approximately $8,737,000 and $1,495,000 as of June 30, 2010 and 2011, respectively.
Indemnification
The Company has agreed to indemnify its officers and directors for certain events or occurrences, while the officer or director is or was serving at the Company’s request in such capacity. The maximum amount of potential future indemnification is unlimited; however, the Company has a director and officer insurance policy that provides
F-31
Table of Contents
FUSION-IO, INC.
NOTES TO CONSOLIDATED FINANCIAL STATEMENTS – (Continued)
corporate reimbursement coverage that limits its exposure and enables it to recover a portion of any future amounts paid. The Company is unable to reasonably estimate the maximum amount that could be payable under these arrangements since these obligations are not capped but are conditional to the unique facts and circumstances involved. Accordingly, the Company has no liabilities recorded for these agreements as of June 30, 2010 and 2011.
Many of the Company’s agreements with channel partners and customers generally include certain provisions for indemnifying the channel partners and customers against liabilities if the Company’s products infringe a third party’s intellectual property rights. To date, the Company has not incurred any material costs as a result of such indemnification provisions and has not accrued any liabilities related to such obligations in the consolidated financial statements.
Employee Agreements
The Company has signed various employment agreements with key executives pursuant to which if their employment is terminated by the Company without cause or by the employees for good reason, or following a change of control of the Company, the employees are entitled to receive certain benefits, including severance payments, accelerated vesting of stock and stock options, and certain insurance benefits.
Legal Matters
The Company is not currently a party to any material litigation or other material legal proceedings. The Company may, from time to time, be involved in various legal proceedings arising from the normal course of business activities, and an unfavorable resolution of any of these matters could materially affect the Company’s future results of operations, cash flows or financial position.
9. Employee Benefit Plans
The Company sponsors a 401(k) defined contribution plan covering all employees. Matching contributions and profit sharing contributions to the plan are at the discretion of the Company. The Company paid matching contributions of $29,000 in the year ended June 30, 2009 and did not pay any matching contributions in any other periods presented in the accompanying consolidated statements of operations.
10. Related Party Transactions
The Company issued and sold an aggregate of 52,489,072 shares of Series A, B, and C convertible preferred stock for aggregate consideration of $103,765,000, net of issuance costs. Purchasers of the Company’s Series A, B and C convertible preferred stock include New Enterprise Associates 12, Limited Partnership (“NEA 12”) and Lightspeed Venture Partners VIII, L.P. (“Lightspeed VIII”). Both of these investors own more than 5% of the Company’s outstanding capital stock as of June 30, 2010 and 2011. Forest Baskett and Scott Sandell, both of whom are members of the Company’s board of directors, are general partners of NEA 12. Christopher J. Schaepe is a member of the Company’s board of directors and is a representative of Lightspeed VIII.
F-32
Table of Contents
FUSION-IO, INC.
NOTES TO CONSOLIDATED FINANCIAL STATEMENTS – (Continued)
The following table summarizes the purchases of the Company’s convertible preferred stock by NEA 12 and Lightspeed VIII:
| Name of Stockholder |
Class of Convertible Preferred Stock |
Shares of Series A Convertible Preferred Stock |
Price Per Share |
Total Purchase Price |
||||||||||||
| NEA 12 |
Series A | 8,647,755 | $ | 1.093 | $ | 9,451,996 | ||||||||||
| NEA 12 |
Series B | 9,127,294 | * | 18,292,776 | ||||||||||||
| Lightspeed VIII |
Series B | 7,500,000 | 2.000 | 15,000,000 | ||||||||||||
| NEA 12 |
Series C | 2,843,112 | 3.869 | 11,000,000 | ||||||||||||
| Lightspeed VIII |
Series C | 1,292,324 | 3.869 | 5,000,002 | ||||||||||||
| * | NEA 12 purchased 9,000,000 shares of Series A convertible preferred stock directly from the Company at a price per share of $2.00 and a purchase price of $18,000,000. |
In November 2007, the Company received proceeds of $400,000 from an investor, in exchange for a convertible note payable. In March of 2008, the note was converted into 378,500 shares of Series A convertible preferred stock. In July 2008, this investor purchased an additional 450,000 shares of the Company’s Series A convertible preferred stock from another stockholder. In September 2008, the Company received proceeds of $2,000,000 from this investor for a convertible note payable and in April 2009, the note was converted into 1,055,616 shares of Series B convertible preferred stock. In April 2010, an affiliate of this investor purchased 258,465 shares of the Company’s Series C convertible preferred stock. An affiliate of these investors is a customer of the Company. The Company recognized revenue from this affiliate of $181,000, $3,421,000, and $275,000 for the fiscal years ended June 30, 2009, 2010 and 2011, respectively. The accounts receivable balance from this affiliate was $100,000 and $0 as of June 30, 2010 and 2011, respectively.
In May 2008, the Company issued 1,829,825 shares of Series A convertible preferred stock to an investor for a total purchase price of $2,000,000. The parent company of this investor is a customer of the Company. The Company recognized revenue from this customer of $22,000, $191,000, and $5,657,000 for the fiscal years ended June 30, 2009, 2010 and 2011, respectively. The accounts receivable balance from this customer was $0 and $2,189,000 as of June 30, 2010 and 2011, respectively.
In October 2009, the Company issued 2,000,000 shares of Series B convertible preferred stock to an investor for a total purchase price of $4,000,000. One of the Company’s vendors of NAND flash, is an affiliate of this investor. The Company had total purchases from this vendor of $1,477,000, $4,938,000, and $3,212,000 for the fiscal years ended June 30, 2009, 2010 and 2011, respectively. The accounts payable balance with this vendor was $483,000 and $0 as of June 30, 2010 and 2011, respectively.
F-33
Table of Contents
FUSION-IO, INC.
NOTES TO CONSOLIDATED FINANCIAL STATEMENTS – (Continued)
11. Subsequent Events
On August 11, 2011, the Company acquired 100% of the stock of IO Turbine, Inc., or IO Turbine, a provider of caching solutions for virtual environments, based in San Jose, California. The acquisition of IO Turbine is a key part of the Company’s strategy to enable enterprise customers to increase the utilization, performance and efficiency of their datacenter resources and extract greater value from their information assets. The preliminary fair value of the aggregate purchase price was approximately $65,600,000, which consisted of (1) cash, (2) shares of the Company’s common stock valued at $28.40 per share, the closing sale price of the Company’s common stock on the closing date of the acquisition, and (3) the fair value of assumed stock options and restricted stock awards attributable to pre-acquisition service. In addition, subsequent to the acquisition the Company will recognize up to approximately $26,400,000 of stock-based compensation expense related to the fair value of assumed restricted stock awards and stock options, of which approximately $3,800,000 will be expensed immediately in connection with the acceleration of vesting of certain restricted stock awards and the remainder recognized over the underlying future service period of the assumed stock awards and stock options. Approximately $3,600,000 of cash and 278,974 shares were deposited in escrow and held as partial security for indemnification obligations of the IO Turbine stockholders pursuant to the merger agreement.
The Company is still in the process of completing its purchase price allocation associated with the acquisition, but expects that a substantial portion of the purchase price will be allocated to goodwill. Management currently does not expect this goodwill to be tax deductible. Due to the recent acquisition consummation date, the Company has determined that it is not practicable to present summarized pro forma information for fiscal 2010 and 2011. Based upon the Company’s analysis to date, the Company expects that the acquisition would have been dilutive to the Company had it occurred as of the beginning of each of the fiscal years presented.
Immediately prior to the Company’s acquisition of IO Turbine, Lightspeed Venture Partners (or “Lightspeed”), a venture capital firm, through certain of its related funds (including Lightspeed Venture Partners VIII L.P. and Lightspeed Venture Partners VII, L.P.) owned over 10% of the Company’s outstanding capital stock and over 25% of IO Turbine’s capital stock and received 744,866 shares of the Company’s common stock (prior to adjusting for escrowed shares) as a result of the acquisition.
In August 2011, the Company entered into an amendment to the loan and security agreement with a financial institution which provides for the consent of the financial institution with respect to the acquisition described above and certain amendments to provide the Company with further flexibility to consummate mergers and acquisitions permitted under the agreement.
F-34
Table of Contents
Fusion-io, Inc.
Index to Exhibits
| Incorporated by Reference | ||||||||||||||||
| Exhibit |
Exhibit Description |
Filed Herewith |
Form |
Exhibit |
Filing Date |
|||||||||||
| 2.1 | Agreement and Plan of Reorganization, dated as of August 4, 2011¸ by and between the Registrant, IO Turbine, Inc. and certain other parties named therein | 8-K | 2.1 | 08/05/11 | ||||||||||||
| 3.1 | Amended and Restated Certificate of Incorporation of the Registrant | X | ||||||||||||||
| 3.2 | Amended and Restated Bylaws of the Registrant | X | ||||||||||||||
| 4.1 | Specimen common stock certificate of the Registrant | S-1/A | 4.1 | 05/23/2011 | ||||||||||||
| 4.2 | Second Amended and Restated Investors’ Rights Agreement, dated as of April 7, 2010 between the Registrant. and certain holders of the Registrant’s capital stock named therein | S-1 | 4.2 | 03/09/2011 | ||||||||||||
| 4.3 | Warrant to Purchase Stock issued by the Registrant to Silicon Valley Bank, dated September 10, 2008 | S-1 | 4.3 | 03/09/2011 | ||||||||||||
| 10.1A* | Form of Indemnification Agreement by and between the Registrant and certain of its directors and officers | S-1/A | 10.1A | 05/23/2011 | ||||||||||||
| 10.1B* | Form of Indemnification Agreement by and between the Registrant and certain of its directors affiliated with investment funds and such investment funds | S-1/A | 10.1B | 05/23/2011 | ||||||||||||
| 10.2* | 2006 Stock Option Plan and Form of Stock Option Agreement under 2006 Stock Option Plan | S-1 | 10.2 | 03/09/2011 | ||||||||||||
| 10.3* | 2008 Stock Incentive Plan and Form of Stock Option Agreement under 2008 Stock Incentive Plan | S-1 | 10.3 | 03/09/2011 | ||||||||||||
| 10.4* | 2010 Executive Stock Incentive Plan and Related Forms | S-1 | 10.4 | 03/09/2011 | ||||||||||||
| 10.5* | 2011 Equity Incentive Plan and Related Forms | S-1/A | 10.5 | 05/23/2011 | ||||||||||||
| 10.6* | 2011 Employee Stock Purchase Plan and Form of Purchase Agreement under 2011 Employee Stock Purchase Plan | S-1/A | 10.6 | 05/23/2011 | ||||||||||||
| 10.7* | Form of Non-Plan Stock Option Agreement between the Registrant and certain of its officers | S-1 | 10.7 | 03/09/2011 | ||||||||||||
| 10.8* | Second Amended and Restated Employment Agreement between the Registrant, David Flynn and Sandusky Investments, Ltd., dated as of April 7, 2010 | S-1 | 10.8 | 03/09/2011 | ||||||||||||
| 10.9* | Amended and Restated Employment Agreement between the Registrant, Rick White and West Coast VC, LLC, dated as of December 31, 2008 | S-1 | 10.9 | 03/09/2011 | ||||||||||||
| 10.9A* | Amendment Number One to Amended and Restated Employment Agreement between the Registrant, Rick White and West Coast VC, LLC, dated as of March 7, 2011 | S-1 | 10.9A | 03/09/2011 | ||||||||||||
Table of Contents
| Incorporated by Reference | ||||||||||||||||
| Exhibit |
Exhibit Description |
Filed Herewith |
Form |
Exhibit |
Filing Date |
|||||||||||
| 10.10* | Form of Involuntary Termination Severance Agreement between the Registrant and certain of its officers | S-1 | 10.10 | 03/09/2011 | ||||||||||||
| 10.10A* | Involuntary Termination Severance Agreement between the Registrant and Dennis P. Wolf, dated as of August 11, 2010 | S-1/A | 10.10A | 04/18/2011 | ||||||||||||
| 10.11* | Transition Agreement and Release between the Registrant and David R. Bradford, dated as of September 21, 2010 | S-1 | 10.11 | 03/09/2011 | ||||||||||||
| 10.12 | Lease Agreement between the Registrant and NOP Cottonwood 2825, LLC, dated May 28, 2010 (Building 10) | S-1 | 10.12 | 03/09/2011 | ||||||||||||
| 10.13 | Lease Agreement between the Registrant and NOP Cottonwood 2855, LLC, dated May 28, 2010 (Building 11) | S-1 | 10.13 | 03/09/2011 | ||||||||||||
| 10.14 | Office Lease Agreement between the Registrant and Bixby Technology Center, LLC, dated May 29, 2009 | S-1 | 10.14 | 03/09/2011 | ||||||||||||
| 10.15A | Amended and Restated Loan and Security Agreement between the Registrant and Silicon Valley Bank, dated September 13, 2010 | S-1 | 10.15 | 03/09/2011 | ||||||||||||
| 10.15B | First Amendment to Amended and Restated Loan and Security Agreement between the Registrant and Silicon Valley Bank, dated as of August 4, 2011 | 8-K | 10.1 | 08/05/2011 | ||||||||||||
| 10.16* | Offer Letter between the Registrant and Dennis Wolf, dated November 4, 2009 | S-1/A | 10.16 | 05/06/2011 | ||||||||||||
| 10.17* | Offer Letter between the Registrant and Jim Dawson, dated April 1, 2008 | S-1/A | 10.17 | 05/06/2011 | ||||||||||||
| 10.18* | Offer Letter between the Registrant and Lance Smith, dated April 29, 2008 as supplemented by an Offer Letter dated December 26, 2008 | S-1/A | 10.18 | 05/06/2011 | ||||||||||||
| 10.19* | Executive Incentive Compensation Plan, adopted by the Registrant on May 16, 2011 | S-1/A | 10.19 | 05/23/2011 | ||||||||||||
| 10.20* | IO Turbine, Inc. 2009 Equity Incentive Plan | X | ||||||||||||||
| 21.1 | Subsidiaries of the Registrant | X | ||||||||||||||
| 23.1 | Consent of Independent Registered Public Accounting Firm | X | ||||||||||||||
| 31.1 | Certification of the Chief Executive Officer pursuant to Section 302 of the Sarbanes-Oxley Act of 2002 | X | ||||||||||||||
| 31.2 | Certification of the Chief Financial Officer pursuant to Section 302 of the Sarbanes-Oxley Act of 2002 | X | ||||||||||||||
| 32.1 | Certification of the Chief Executive Officer pursuant to Section 906 of the Sarbanes-Oxley Act of 2002 | X | ||||||||||||||
| 32.2 | Certification of the Chief Financial Officer pursuant to Section 906 of the Sarbanes-Oxley Act of 2002 | X | ||||||||||||||
| * | Indicates a management contract or compensatory plan or arrangement. |
-2-