Attached files
| file | filename |
|---|---|
| 8-K - CURRENT REPORT - FAUQUIER BANKSHARES, INC. | form8k09022011.htm |

Deeply rooted in our community.
August 2011
NASDAQ: FBSS

Safe Harbor Statement
In addition to the historical information contained herein, this report contains forward-looking statements.
Forward-looking statements are based on certain assumptions and describe future plans, strategies,
and expectations of the Company, and are generally identifiable by use of the words “believe,” “expect,”
“intend,” “anticipate,” “estimate,” “project,” “may,” “will,” or similar expressions. Although we believe our
plans, intentions, and expectations reflected in these forward-looking statements are reasonable, we
can give no assurance that these plans, intentions, or expectations will be achieved. Our ability to
predict results or the actual effect of future plans or strategies is inherently uncertain, and actual results
could differ materially from those contemplated. Factors that could have a material adverse effect on our
operations and future prospects include, but are not limited to, changes in: interest rates, general
economic conditions, the legislative/regulatory climate, monetary and fiscal policies of the U.S.
Government, including policies of the U.S. Treasury and the Board of Governors of the Federal Reserve
System, the quality or composition of the Bank’s loan or investment portfolios, demand for loan
products, deposit flows, competition, demand for financial services in our market area, and accounting
principles, policies, and guidelines. These risks and uncertainties should be considered in evaluating
forward-looking statements in this report, and you should not place undue reliance on such statements,
which reflect our position as of the date of this report. For additional discussion of risk factors that may
cause our actual future results to differ materially from the results indicated within forward-looking
statements, please refer to "Risk Factors" in Item 1A of our Annual Report on Form 10-K for the year
ended December 31, 2010.
2
FAUQUIER BANKSHARES, INC.

Table of Contents
Ø Who We Are
Ø Market Area
Ø Financial Condition
Ø Financial Performance and Goals
Ø Building Shareholder Value
3
FAUQUIER BANKSHARES, INC.

Who We Are
4
FAUQUIER BANKSHARES, INC.

Purpose
Vision
Core
Values
Making your financial life easier.
Fauquier Bankshares, Inc. is an independent, customer focused,
community resource led by a high performance team. We provide an
above-market return for our shareholders balancing profitability and
prudent growth. Our performance is driven by professional financial
advisors delivering customized investment, credit, fiduciary, insurance,
and banking services in Fauquier County, western Prince William
County, and neighboring markets.
Integrity - we do what we say in a respectful and honest manner.
Transparency - we communicate openly and authentically.
Accountability - we own our actions and take responsibility of our results.
Excellence - we continually strive to exceed expectations.
TFB’s Guiding Principles
FAUQUIER BANKSHARES, INC.
5

Summary Statistics
Founded 1902
Headquarters Warrenton, Virginia (50 miles west of Washington, D.C.)
(10 branch locations)
(10 branch locations)
Total Assets $599.2 million
Total Loans, net $447.8 million
Shares Outstanding 3,669,758
Insider Ownership 6.03%
Institutional Ownership 14.09% 1 (8.3% held by Royce & Associates, LLC2)
Shareholders Approx. 400 + “street” (Over 80% in VA)
All data provided as of June 30, 2011, unless otherwise noted.
(1) Source: NASDAQ as of August 8, 2011
(2) A subsidiary of Legg Mason
6
FAUQUIER BANKSHARES, INC.

Industry Recognition
Ø Named #151 of “Top 200 Publicly Traded Community Banks & Thrifts”
in the June 2011 issue of U.S. Banker magazine, based on previous 3
-year average ROE of 1,035 public institutions, placing Fauquier in the
top 15 percent evaluated. This marks the fifth consecutive year that
FBSS was on the “Top 200” listing.
in the June 2011 issue of U.S. Banker magazine, based on previous 3
-year average ROE of 1,035 public institutions, placing Fauquier in the
top 15 percent evaluated. This marks the fifth consecutive year that
FBSS was on the “Top 200” listing.
Ø In November 2010, The Fauquier Bank was named the 2010 Large
Business of the Year by the Fauquier County Chamber of Commerce.
Business of the Year by the Fauquier County Chamber of Commerce.
Ø Ranked #2 in 2009 for Top Community Bank IT projects by Bank
Technology News in their March 2010 issue. In the summer of 2009,
the Bank negotiated and successfully implemented a core conversion
with Fiserv improving efficiency and decreasing expenses.
Technology News in their March 2010 issue. In the summer of 2009,
the Bank negotiated and successfully implemented a core conversion
with Fiserv improving efficiency and decreasing expenses.
7
FAUQUIER BANKSHARES, INC.

Our Success Is a Result of Our Culture
8
Ø Strategic Planning
Ø Teamwork
Ø Disciplined Execution (aka “Blocking and Tackling”)
Ø Consistently Strong Credit Culture
Ø Disciplined Loan and Deposit Pricing Strategy
FAUQUIER BANKSHARES, INC.

Management Focus On Growth
9
FAUQUIER BANKSHARES, INC.
Ø Quality Growth
Ø Loan Portfolio
Ø Core Transaction Deposits
Ø Non-Interest Fee Income
Ø Wealth Management and Financial Planning

Our Customer Focus
10
To deliver a superior experience for our retail and
commercial customers by enabling them to make the
right choices when selecting financial products and
services that best fit their needs and lifestyles,
thereby empowering our customers to achieve their
financial goals.
commercial customers by enabling them to make the
right choices when selecting financial products and
services that best fit their needs and lifestyles,
thereby empowering our customers to achieve their
financial goals.
FAUQUIER BANKSHARES, INC.

Market Area
11
FAUQUIER BANKSHARES, INC.

Northern Virginia Marketplace
* Includes City of Manassas data
** Includes Fairfax City data
Source: US Census Bureau/CTPP
12
FAUQUIER BANKSHARES, INC.
Fauquier County
16,290
48.02%
Fairfax County**
5,905
18.62%
Prince William County*
6,315
17.41%
Loudoun County
1,805
5.32%
District of Columbia
930
2.74%
Other Places of Work
2,675
7.89%
Total Out-Commuters
17,630
51.98%
Total County Workforce
33,920
100.00%
Places to Which Fauquier County
Residents Commute (2006 - 2008)

Primary Market Area
13
FAUQUIER BANKSHARES, INC.

Northern Virginia Marketplace
Ø Stronger population, economic and employment growth
Ø Stable federal government presence
Ø Exceptional higher education
Ø Diverse industry employment, mostly “clean” industries
Ø High household income
Ø Virginia - “Best State for Business” Forbes (2006 - 2009)
14
FAUQUIER BANKSHARES, INC.
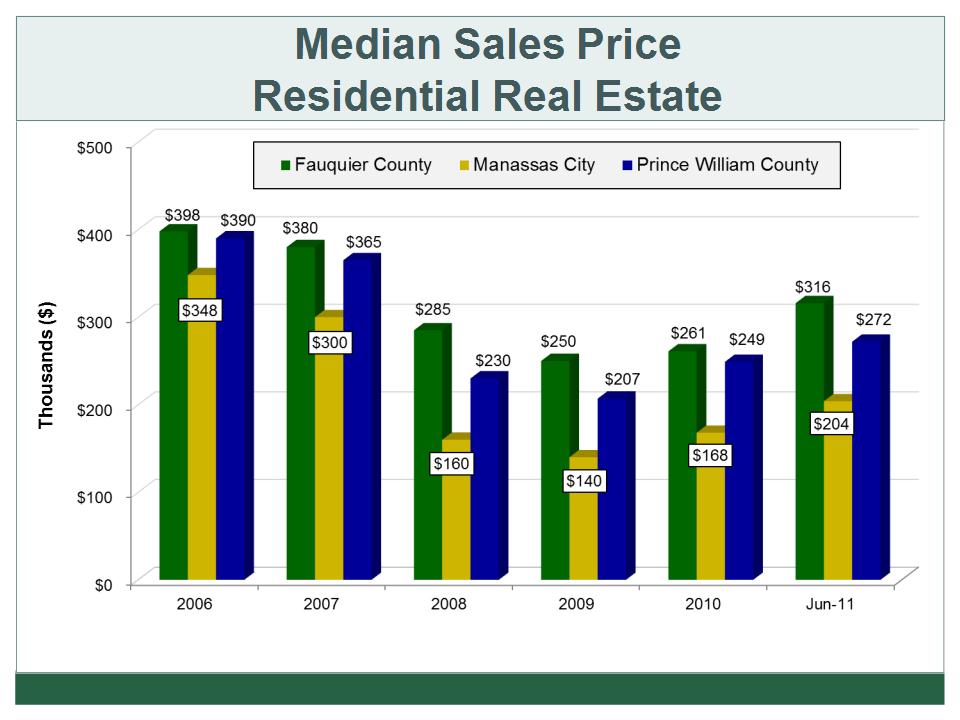
15
Source: MRIS
FAUQUIER BANKSHARES, INC.

Unemployment Rates
16
FAUQUIER BANKSHARES, INC.

Current Market with Sustainable Growth
17
FAUQUIER BANKSHARES, INC.
|
Market
|
Total
Population 2010 (actual) |
Population
Change 2000 - 2010 (%) |
Projected
Change 2010 - 2015 (%) |
Total
Households 2010 (actual) |
Median
HH Income 2010 ($) |
HH Income
Change 2000 - 2010 (%) |
Projected
HH Income Change 2010 - 2015 (%) |
|
Fauquier, VA
|
68,698
|
24.59
|
5.40
|
24,708
|
81,769
|
31.29
|
14.36
|
|
Manassas, VA
(City) |
36,476
|
3.82
|
(0.77)
|
12,114
|
79,048
|
31.00
|
16.51
|
|
Manassas Park,
VA (City) |
13,364
|
29.87
|
1.26
|
4,217
|
80,759
|
32.65
|
14.56
|
|
Prince William, VA
|
387,988
|
38.17
|
7.32
|
132,702
|
86,208
|
31.59
|
16.48
|
Source: SNL Financial

Financial Condition
FAUQUIER BANKSHARES, INC.
18
18
19
FAUQUIER BANKSHARES, INC.

20
Loans, Net
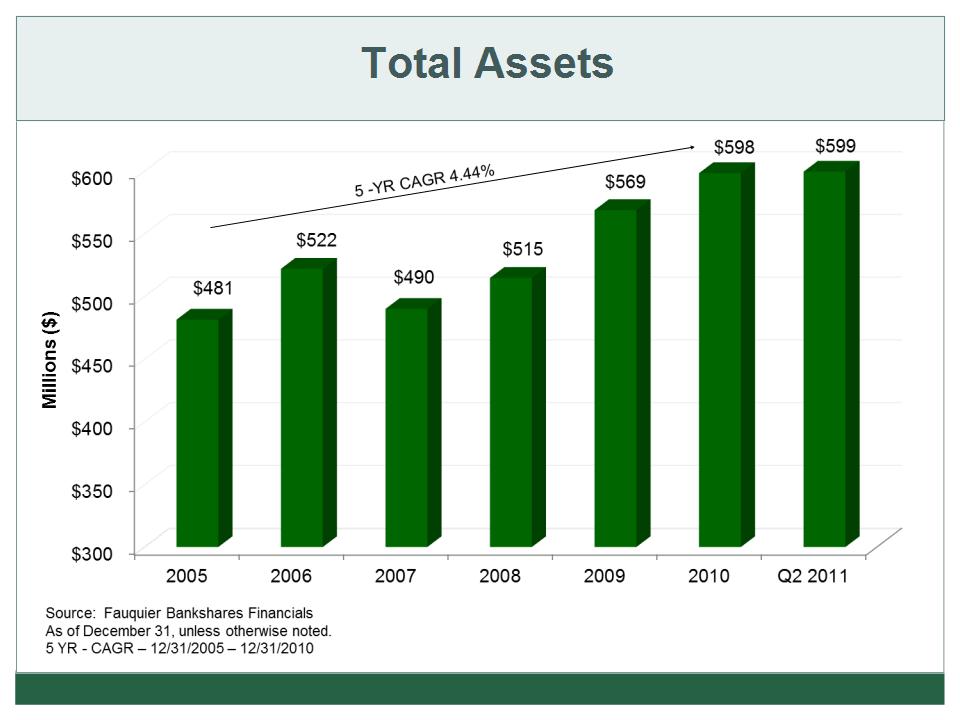
FAUQUIER BANKSHARES, INC.
Source: Fauquier Bankshares Financials
As of December 31, unless otherwise noted.
5 YR - CAGR - 12/31/2005 - 12/31/2010
21
At June 30, 2011
FAUQUIER BANKSHARES, INC.
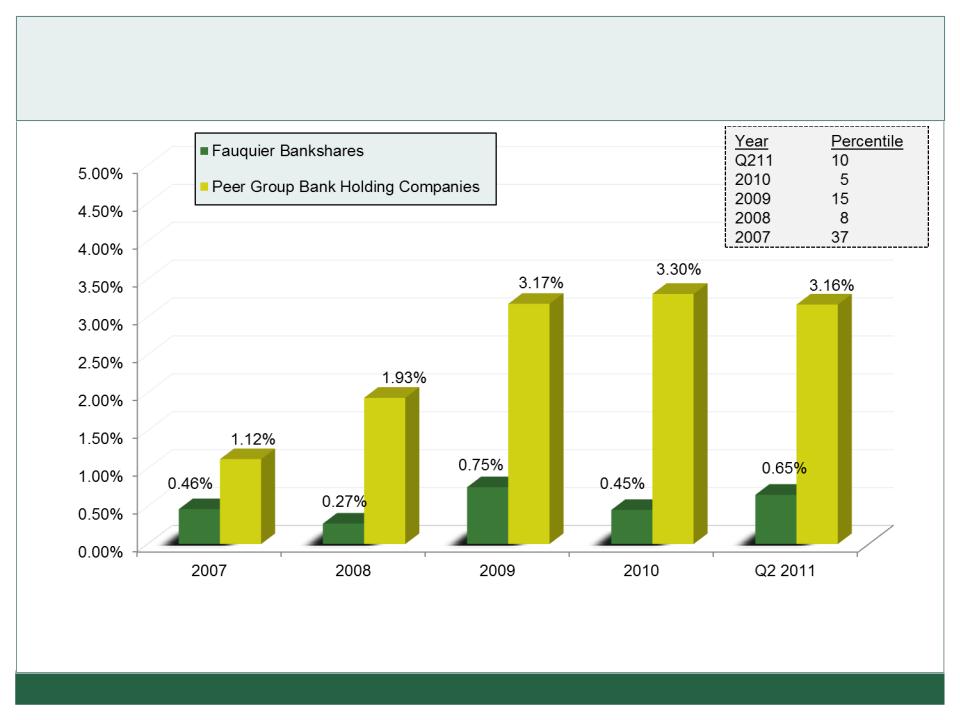
22
Nonperforming Loans to Period End Loans
Peer Group - Bank Holding Companies with Consolidated Assets of $500MM - $1B (2011/2010/2009/2008)
Peer Group - Bank Holding Companies with Consolidated Assets less than $500MM (2007)
Sources: BHC Performance Report and Fauquier Bankshares Financials as of December 31, unless noted otherwise.
FAUQUIER BANKSHARES, INC.

23
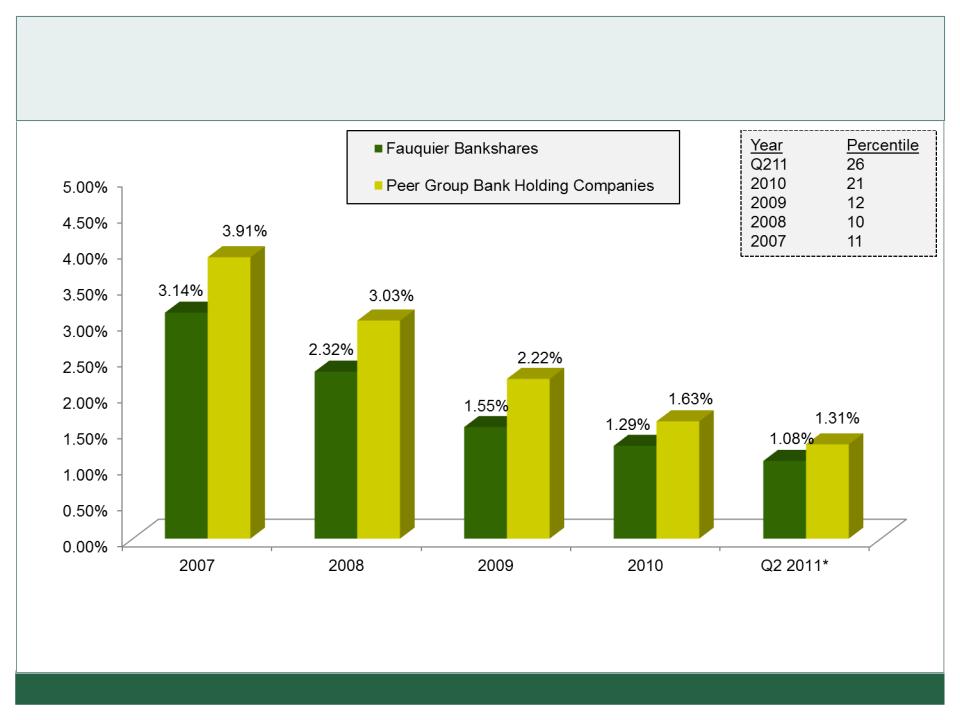
Loan Losses (Net of Recoveries)
As a Percentage of Average Total Loans
FAUQUIER BANKSHARES, INC.
Peer Group - Bank Holding Companies with Consolidated Assets of $500MM - $1B (2011/2010/2009/2008)
Peer Group - Bank Holding Companies with Consolidated Assets less than $500MM (2007)
Sources: BHC Performance Report and Fauquier Bankshares Financials as of December 31, unless noted otherwise. Q2 data is annualized.

24
FAUQUIER BANKSHARES, INC.
Allowance for Loan Loss
As a Percentage of Total Loans
Year Percentile
Q211 31
2010 23
2009 16
2008 28
2007 27
Peer Group - Bank Holding Companies with Consolidated Assets of $500MM - $1B (2011/2010/2009/2008)
Peer Group - Bank Holding Companies with Consolidated Assets less than $500MM (2007)
Sources: BHC Performance Report and Fauquier Bankshares Financials as of December 31, unless noted otherwise.

25
FAUQUIER BANKSHARES, INC.
Allowance for Loan Loss
As a Percentage of 90 Days Past Due & Nonaccrual Loans
Peer Group - Bank Holding Companies with Consolidated Assets of $500MM - $1B (2011/2010/2009/2008)
Peer Group - Bank Holding Companies with Consolidated Assets less than $500MM (2007)
Sources: BHC Performance Report and Fauquier Bankshares Financials as of December 31, unless noted otherwise.
26
FAUQUIER BANKSHARES, INC.
Source: Fauquier Bankshares Financials as of December 31, unless otherwise noted.

27
Total Deposits
FAUQUIER BANKSHARES, INC.
Source: Fauquier Bankshares Financials - as of December 31, unless otherwise noted.

28
Pooled Trust Preferred Securities
FAUQUIER BANKSHARES, INC.
|
Issue
|
X
|
XI
|
XIV
|
XV
|
Total
|
|
Date of purchase
|
6/26/2003
|
9/17/2003
|
6/17/2004
|
9/20/2004
|
|
|
Issue size ($M)
|
$ 581
|
$ 670
|
$ 504
|
$ 625
|
$ 2,380
|
|
Financial institutions (No.)
|
61
|
69
|
65
|
60
|
228*
|
|
States (No.)
|
29
|
28
|
34
|
30
|
30**
|
|
TFB's share of the pool
|
0.17%
|
0.30%
|
0.40%
|
0.16%
|
.029%***
|
|
|
|
|
|
|
|
|
|
|
|
|
|
|
|
TFB’s Investment
|
$ 1,000,000
|
$ 2,000,000
|
$ 2,000,000
|
$ 1,000,000
|
$ 6,000,000
|
|
As of June 30, 2011
Cumulative amount of OTTI loss
|
640,706 |
385,564 |
749,336 |
466,388
|
2,241,994
|
|
Cost, net of OTTI loss
|
$ 359,294
|
$ 1,614,436
|
$ 1,250,664
|
$ 533,612
|
$ 3,758,006
|
|
Cumlative other comprehensive
loss, net of tax benefit |
$ 230,632
|
$ 899,884
|
$ 793,692
|
$ 342,510
|
$ 2,266,718
|
|
Fair Value
|
$ 9,852
|
$ 250,975
|
$ 48,100
|
$ 14,658
|
$ 323,585
|
*Unique institutions in each pool.
**Average
***Weighted average

29
Pooled Trust Preferred Securities
Depository Institutions Financials
(Average and Median Totals)
Depository Institutions Financials
(Average and Median Totals)
FAUQUIER BANKSHARES, INC.
Issue X
Issue XI
06/30/11
2003Q2
06/30/11
2003Q3
Avg
Mdn
Avg
Mdn
NPLs to total loans
4.39%
3.08%
4.46%
3.71%
Loan loss reserves to loans
2.27%
1.94%
1.25%
1.21%
2.53%
2.12%
1.31%
1.27%
Tier 1 risk based ratio
13.07%
12.81%
11.48%
10.72%
13.53%
13.23%
12.18%
11.26%
Return on average assets
0.48%
0.64%
1.09%
1.01%
0.29%
0.69%
1.19%
1.14%
Net interest margin
3.98%
3.78%
4.12%
4.01%
3.73%
3.71%
4.10%
4.13%
Texas Ratio*
39.71
26.26
38.96
36.03
No. of banks with Texas Ratio above 100
3
0
4
0
Issue XIV
Issue XV
06/30/11
2004Q2
06/30/11
2004Q3
Avg
Mdn
Avg
Mdn
Avg
Mdn
Avg
Mdn
NPLs to total loans
5.35%
5.08%
0.57%
0.39%
3.99%
2.95%
0.50%
0.32%
Loan loss reserves to loans
2.47%
2.20%
1.96%
1.76%
Tier 1 risk based ratio
12.53%
12.44%
12.16%
11.46%
12.76%
12.43%
12.79%
11.94%
Return on average assets
0.08%
0.65%
0.50%
0.58%
Net interest margin
3.84%
3.81%
4.11%
3.86%
3.85%
3.85%
4.08%
3.92%
Texas Ratio*
56.65
48.28
7.53
5.72
51.17
30.26
6.28
4.95
No. of banks with Texas Ratio above 100
8
0
7
0
|
* Texas Ratio - Nonperforming assets plus 90 day past due loans divided by tangible equity plus loan loss reserve.
|

30
FAUQUIER BANKSHARES, INC.
Tangible Equity to Assets Ratio
Source: Fauquier Bankshares Financials
As of December 31, unless otherwise noted.

31
FAUQUIER BANKSHARES, INC.
Year Percentile
Q211 38
2010 33
2009 53
2008 67
2007 49
Peer Group - Bank Holding Companies with Consolidated Assets of $500MM - $1B (2011/2010/2009/2008)
Peer Group - Bank Holding Companies with Consolidated Assets less than $500MM (2007)
Source: BHC Performance Report & Fauquier Bankshares Financials - as of December 31
32
FAUQUIER BANKSHARES, INC.
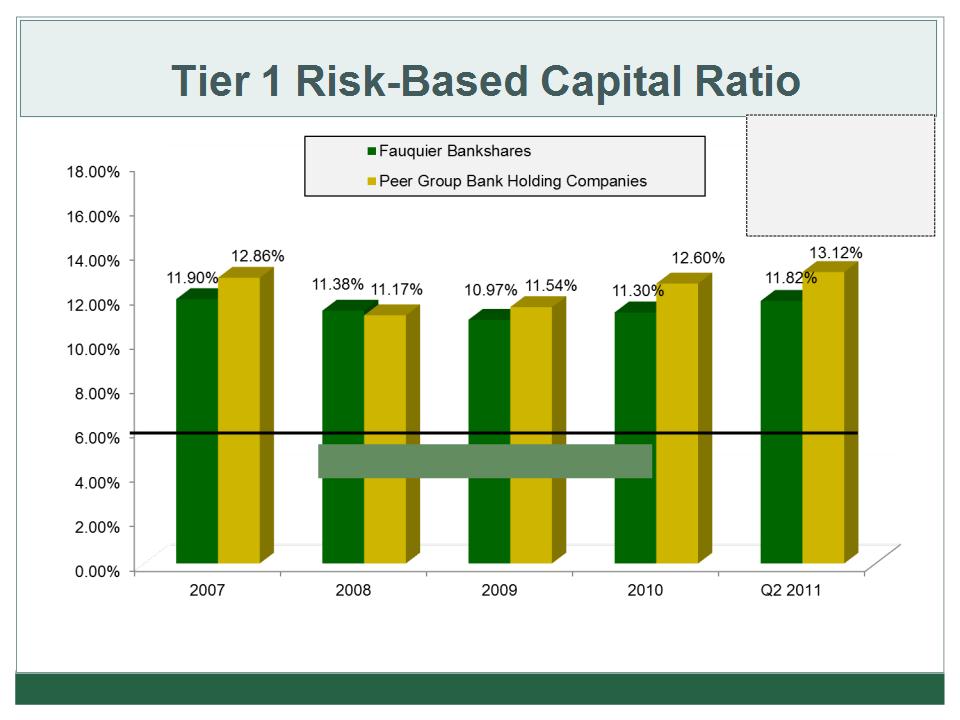
“Well Capitalized” Threshold 6%
Year Percentile
Q211 37
2010 34
2009 43
2008 57
2007 46
Peer Group - Bank Holding Companies with Consolidated Assets of $500MM - $1B (2011/2010/2009/2008)
Peer Group - Bank Holding Companies with Consolidated Assets less than $500MM (2007)
Source: BHC Performance Report & Fauquier Bankshares Financials - as of December 31
33
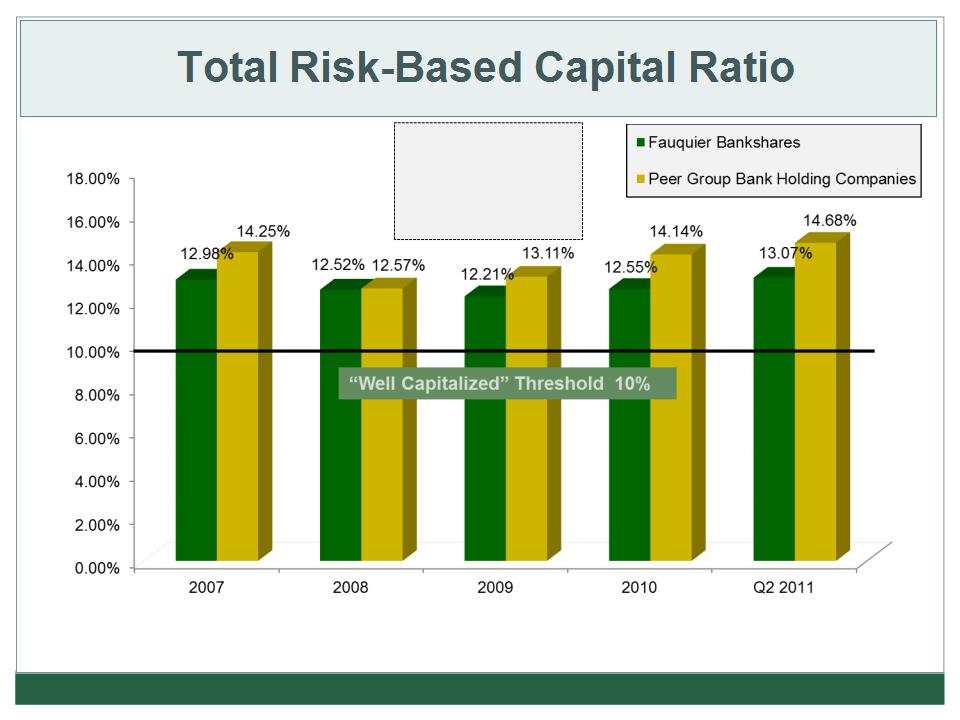
FAUQUIER BANKSHARES, INC.
Peer Group - Bank Holding Companies with Consolidated Assets of $500MM - $1B (2011/2010/2009/2008)
Peer Group - Bank Holding Companies with Consolidated Assets less than $500MM (2007)
Source: BHC Performance Report & Fauquier Bankshares Financials - as of December 31
Year Percentile
Q211 32
2010 29
2009 38
2008 56
2007 42

FAUQUIER BANKSHARES, INC.
Average Daily Balances for Six Months Ended June 30, 2011
|
Transaction Account Growth
Average Daily Balances for Six Months Ended June 30
|
|||
|
2011
|
2010
|
% Change
|
|
|
DDA
|
$73,807 |
$66,077 |
11.70%
|
|
NOW
|
$140,087 |
$98,932 |
41.60%
|
|
Totals
|
$213,894 |
$165,009 |
29.63%
|
Source: Fauquier Bankshares Financials
ØCDARS are large-dollar investments of local depositors
in FDIC insured CDs.
in FDIC insured CDs.
ØBrokered CDs are used to offset interest rate risk.
34
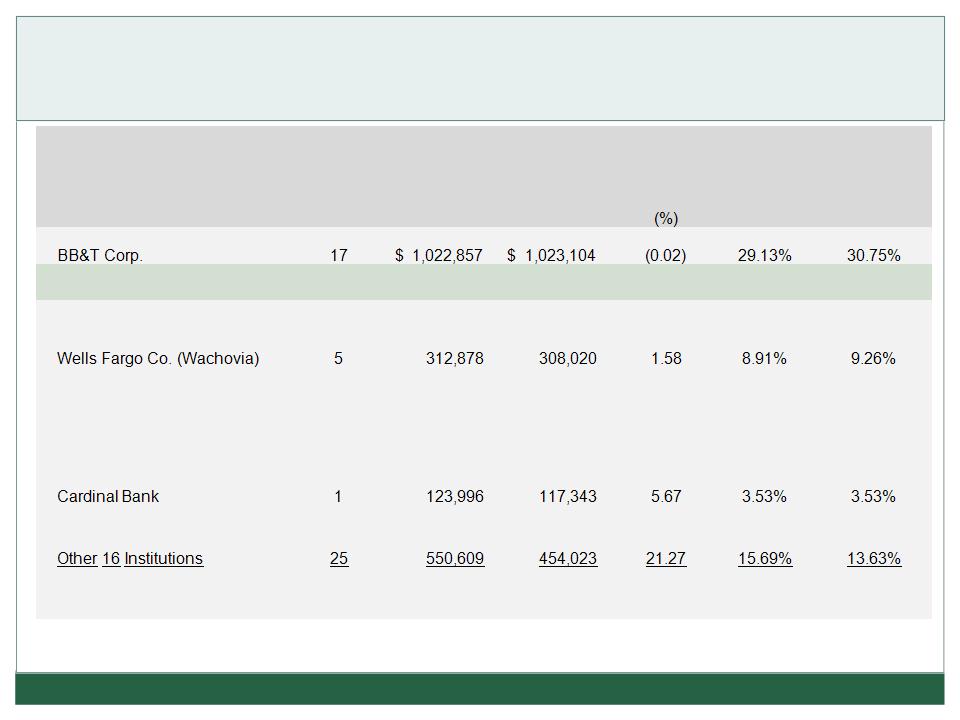
Fauquier County, Western Prince William County and
Manassas City Deposit Market Share
Manassas City Deposit Market Share
35
|
|
Financial Institution
|
Current
Number of Branches |
Total Deposits
2010 ($000) |
Total Deposits
2009 ($000)
|
Year to Year
Deposit Change 2010
|
Market
Share 2010
|
Market
Share 2009
|
|
|
|||||||
|
|
Fauquier Bankshares
|
10
|
493,053
|
412,892
|
19.41
|
14.04%
|
12.41%
|
|
|
Suntrust Bank
|
7
|
428,557
|
417,666
|
2.61
|
12.20%
|
12.55%
|
|
|
|||||||
|
|
Bank of America Corp.
|
4
|
192,607
|
184,549
|
4.37
|
5.48%
|
5.55%
|
|
|
Capital One Financial Corp
|
8
|
139,108
|
154,882
|
(10.18)
|
3.96%
|
4.66%
|
|
|
PNC Financial Services Group
|
7
|
129,330
|
151,671
|
(14.73)
|
3.68%
|
4.56%
|
|
|
|||||||
|
|
Virginia Commerce Bank
|
2
|
118,727
|
102,985
|
15.29
|
3.38%
|
3.10%
|
|
|
|||||||
|
|
|||||||
|
|
Total
|
86
|
$3,511,722
|
$3,327,135
|
5.55%
|
100%
|
100%
|
|
|
Source: FDIC - Deposit Market Share Report
Data as of June 30, 2010 |
|
|||||
FAUQUIER BANKSHARES, INC.

Financial Performance
and Goals
and Goals
FAUQUIER BANKSHARES, INC.
36

Return on Average Equity (ROAE)
FAUQUIER BANKSHARES, INC.
Peer Group - Bank Holding Companies with Consolidated Assets of $500MM - $1B (2011/2010/2009/2008)
Peer Group - Bank Holding Companies with Consolidated Assets less than $500MM (2007)
Sources: BHC Performance Report and Fauquier Bankshares Financials as of December 31, unless noted otherwise. - Q211 annualized

Earnings Per Share, Diluted
FAUQUIER BANKSHARES, INC.
38
Net Income
$3.4MM
Net Income
$3.7MM
Net Income
$3.7MM
Source: Fauquier Bankshares Financials
As of December 31, unless otherwise noted.
2Q 2011 data is annualized based on $.56 per share and net income of $2.1 million as of June 30, 2011.

39
Net Income (ROAA)
(As a Percent of Average Assets)
(As a Percent of Average Assets)
FAUQUIER BANKSHARES, INC.
Year Percentile
Q211 58
2010 60
2009 69
2008 65
2007 59
Peer Group - Bank Holding Companies with Consolidated Assets of $500MM - $1B (2010/2009/2008)
Peer Group - Bank Holding Companies with Consolidated Assets less than $500MM (2007)
Sources: BHC Performance Report and Fauquier Bankshares Financials as of December 31, unless noted otherwise - Q211 annualized

Net Interest Margin*
40
FAUQUIER BANKSHARES, INC.
Peer Group - Bank Holding Companies with Consolidated Assets of $500MM - $1B (2011/2010/2009/2008)
Peer Group - Bank Holding Companies with Consolidated Assets less than $500MM (2007)
Source: BHC Performance Report and Fauquier Bankshares Financials - as of December 31 - Q211 - YTD
Cost of Funds
41
FAUQUIER BANKSHARES, INC.
Peer Group - Bank Holding Companies with Consolidated Assets of $500MM - $1B (2011/2010/2009/2008)
Peer Group - Bank Holding Companies with Consolidated Assets less than $500MM (2007)
Sources: BHC Performance Report and Fauquier Bankshares Financials as of December 31, unless noted otherwise. Q211 - YTD

Total Non-Interest Income
As a Percent of Adjusted Operating Income (TE)
As a Percent of Adjusted Operating Income (TE)
FAUQUIER BANKSHARES, INC.
42
Peer Group - Bank Holding Companies with Consolidated Assets of $500MM - $1B (2011/2010/2009/2008)
Peer Group - Bank Holding Companies with Consolidated Assets less than $500MM (2007)
Sources: BHC Performance Report and Fauquier Bankshares Financials as of December 31, unless noted otherwise.

43
Assets Under Management
(At Market Value)
(At Market Value)
FAUQUIER BANKSHARES, INC.
Q2 2011 as of June 30, 2011
S&P 500 Index

Keys to Building Shareholder Value
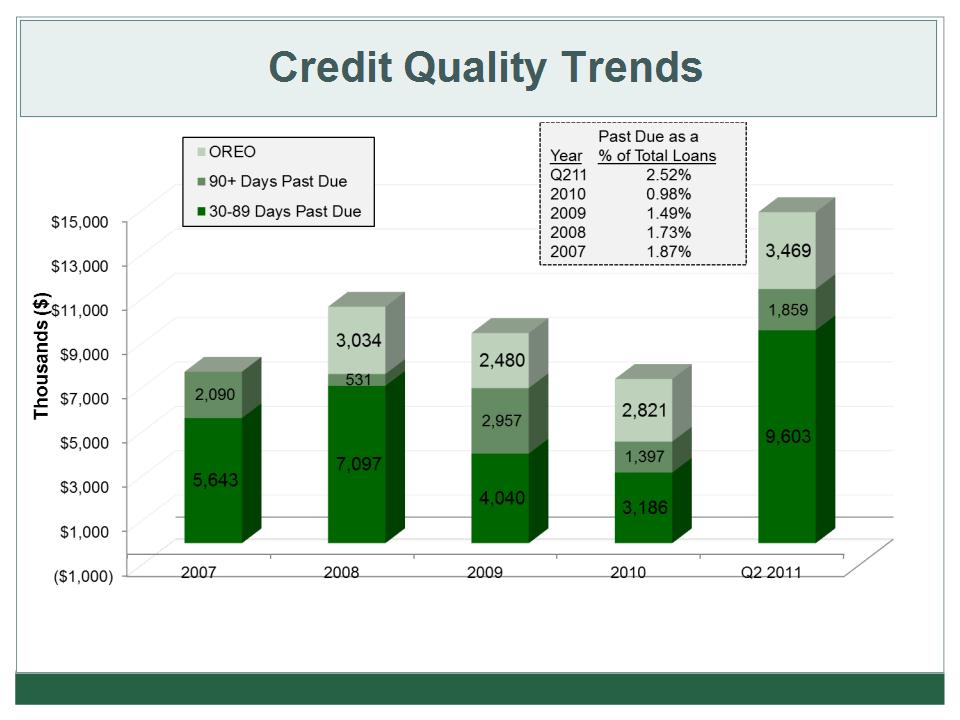
Ø Maintain strong credit quality
- Past due loans as a percent of total loans consistently under 2.6%
- Past due loans as a percent of total loans consistently under 2.6%
Ø Build transaction account deposit base
Ø Disciplined loan and deposit pricing
Ø Continue to improve and implement technology
FAUQUIER BANKSHARES, INC.
44

Stock Total Return Performance
Source: SNL Financial as of 8/03/2011 - SNL indices are weighted by the market capitalization of the company.
FAUQUIER BANKSHARES, INC.
45
|
Index
|
Over Last
Year |
Over Last Two
Years |
Over Last
Three Years |
Since Going
Public (1997) |
|
FBSS
|
(18.83%)
|
(1.80%)
|
(12.55%)
|
189.18%
|
|
SNL Banks
$500M - $1B
|
3.65%
|
(6.96%)
|
(22.05%)
|
64.63%
|
|
SNL Banks
$250M - $500M
|
(2.05%)
|
2.79%
|
(28.26%)
|
49.60%
|
|
SNL Banks
|
(9.61%)
|
2.08%
|
(33.35%)
|
(4.60%)
|

46
Stock Total Return Performance
(September 1, 1997 - August 5, 2011)
(September 1, 1997 - August 5, 2011)
FAUQUIER BANKSHARES, INC.
Source: SNL Financial - August 8, 2011
(4.39)

FAUQUIER BANKSHARES, INC.
Source: SNL Financial - As of August 5, 2011
Stock Chart - Price/Tangible Book
(September 1, 1997- August 5, 2011)
(September 1, 1997- August 5, 2011)
47
FBSS 97.6
SNL 97.5
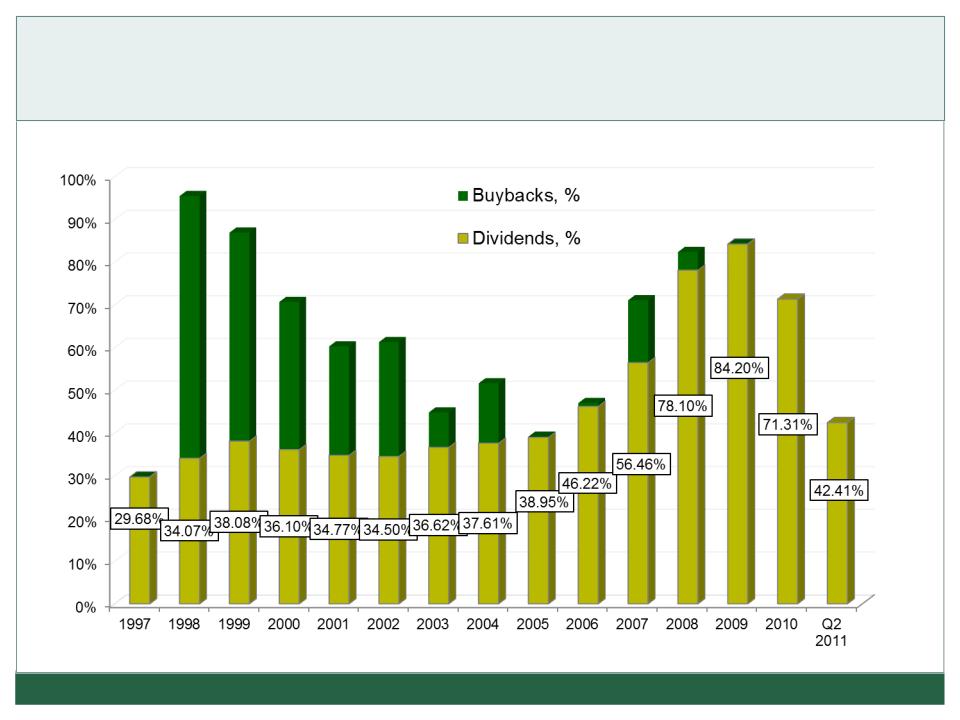
Buybacks and Dividends
as a Percentage of Net Income
as a Percentage of Net Income
48
FAUQUIER BANKSHARES, INC.

Contact Information
Investor Relations Contacts
Randy K. Ferrell
President & Chief Executive Officer
randy.ferrell@fauquierbank.com
randy.ferrell@fauquierbank.com
Eric P. Graap
Executive Vice President
& Chief Financial Officer
eric.graap@fauquierbank.com
Valerie Barlowe
Investor Relations Coordinator
valerie.barlowe@fauquierbank.com
www.fauquierbank.com
MAIN OFFICE
THE PLAINS
VIEW TREE
BEALETON
OLD TOWN MANASSAS
SUDLEY ROAD
NEW BALTIMORE
CATLETT
FAUQUIER BANKSHARES, INC.
BRISTOW
49
HAYMARKET