Attached files
| file | filename |
|---|---|
| 8-K - FORM 8-K - CNB FINANCIAL CORP/PA | d8k.htm |
 Financial Highlights
As of and for the six months ended
June 30, 2011
NASDAQ: CCNE
August 30, 2011
Exhibit 99.1 |
 Forward-Looking Statements
This
presentation
includes
forward-looking
statements
within
the
meaning
of
Section
27A
of
the
Securities
Act
of
1933,
as
amended,
and
Section
21E
of
the
Securities
Exchange
Act
of
1934,
as
amended,
with
respect
to
the
financial
condition,
liquidity,
results
of
operations,
future
performance
and
business
of
CNB
Financial
Corporation.
These
forward-looking
statements
are
intended
to
be
covered
by
the
safe
harbor
for
“forward-looking
statements”
provided
by
the
Private
Securities
Litigation
Reform
Act
of
1995.
Forward-
looking
statements
are
those
that
are
not
historical
facts.
Forward-looking
statements
include
statements
with
respect
to
beliefs,
plans,
objectives,
goals,
expectations,
anticipations,
estimates
and
intentions
that
are
subject
to
significant
risks
and
uncertainties
and
are
subject
to
change
based
on
various
factors
(some
of
which
are
beyond
our
control).
Forward-looking
statements
often
include
the
words
“believes,”
“expects,”
“anticipates,”
“estimates,”
“forecasts,”
“intends,”
“plans,”
“targets,”
“potentially,”
“probably,”
“projects,”
“outlook”
or
similar
expressions
or
future
conditional
verbs
such
as
“may,”
“will,”
“should,”
“would”
and
“could.”
Such
known
and
unknown
risks,
uncertainties
and
other
factors
that
could
cause
the
actual
results
to
differ
materially
from
the
statements,
include,
but
are
not
limited
to:
(i)
changes
in
general
business,
industry
or
economic
conditions
or
competition;
(ii)
changes
in
any
applicable
law,
rule,
regulation,
policy,
guideline
or
practice
governing
or
affecting
financial
holding
companies
and
their
subsidiaries
or
with
respect
to
tax
or
accounting
principles
or
otherwise;
(iii)
adverse
changes
or
conditions
in
capital
and
financial
markets;
(iv)
changes
in
interest
rates;
(v)
changes
in
the
quality
or
composition
of
our
loan
and
investment
portfolios;
(vi)
adequacy
of
loan
loss
reserves;
(vii)
increased
competition;
(viii)
loss
of
certain
key
officers;
(ix)
continued
relationships
with
major
customers;
(x)
deposit
attrition;
(xi)
rapidly
changing
technology;
(xii)
unanticipated
regulatory
or
judicial
proceedings
and
liabilities
and
other
costs;
(xiii)
changes
in
the
cost
of
funds,
demand
for
loan
products
or
demand
for
financial
services;
and
(xiv)
other
economic,
competitive,
governmental
or
technological
factors
affecting
our
operations,
markets,
products,
services
and
prices.
Such
developments
could
have
an
adverse
impact
on
our
financial
position
and our results of operations.
The forward-looking statements are based upon management’s beliefs and
assumptions. Any forward- looking
statement
made
herein
speaks
only
as
of
the
date
of
this
presentation.
Factors
or
events
that
could
cause the our actual results to differ may emerge from time to time, and it is not
possible for us to predict all of them. We undertake no obligation to
publicly update any forward-looking statement, whether as a result of
new information, future developments or otherwise, except as may be required by law.
2 |
 History of CNB Financial
3
1865
1934
1984
…
2005
2006
2008
2009 2010
1865:
County
National Bank
of Clearfield
established
1934:
Reorganizes
through a stock
offering to existing
depositors
1984:
Forms
CNB
Financial Corporation
holding company
2005:
ERIEBANK is
formed
2005:
Purchases
assets
of Holiday Consumer
Discount Company and
forms Holiday Financial
Services Corporation
2006:
Conversion
to a state banking
charter
2010:
Joseph
Bower
becomes CEO after
retirement of William
Falger
2008-2009:
Receives
approval to raise $21
million via TARP;
CNB chooses not to
participate
2010:
Capital
raise of $34.5
million |
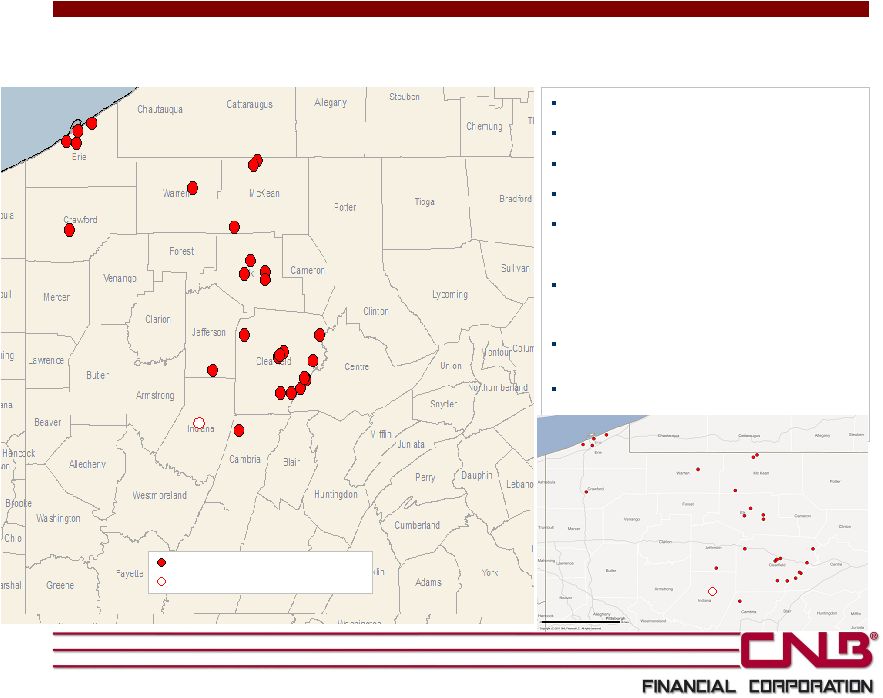 CNB
Financial Overview Headquarters: Clearfield, PA
Branches: 27
Assets: $1.5 billion
Loans: $822 million
Deposits: $1.25 billion
Primary Subsidiaries
CNB
Bank:
22
full-service
branches,
1
loan
production office, telephone & internet banking,
centralized customer service center
ERIEBANK:
Division
of
CNB
Bank
with
five
full-
service branches, headquartered in Erie, PA
Holiday
Financial
Services:
Consumer
loan
company with eight offices
4
Full-service branch
Loan production office
Note: Information and data as of June 30, 2011.
|
 Balance Sheet
•
Deposits of $1.25 billion, growth of 7% over December 31, 2010
–
Transaction, money market and savings deposits equal 75% of total
•
Loans of $822 million, growth of 3% over December 31, 2010
Profitability
•
Net income of $7.2 million, or $0.58 per share
•
Return on assets of 0.98% and return on equity of 12.4%
•
Net interest margin of 3.55%
Asset Quality
•
Nonperforming assets to total assets of 1.23%
•
Net charge-offs to average loans of 0.22%
•
Allowance for loan losses to loans of 1.43%
Capital
•
Tangible common equity to tangible assets of 7.5%*
•
Leverage ratio of 8.5%
•
Tier 1 Risk Based Ratio of 14.0%
•
Total Risk Based Capital Ratio of 15.3%
2011 Highlights
5
Note: Financial data as of or for the six months ended June 30, 2011.
* Please see the Appendix for a reconciliation of non-GAAP financial
information. |
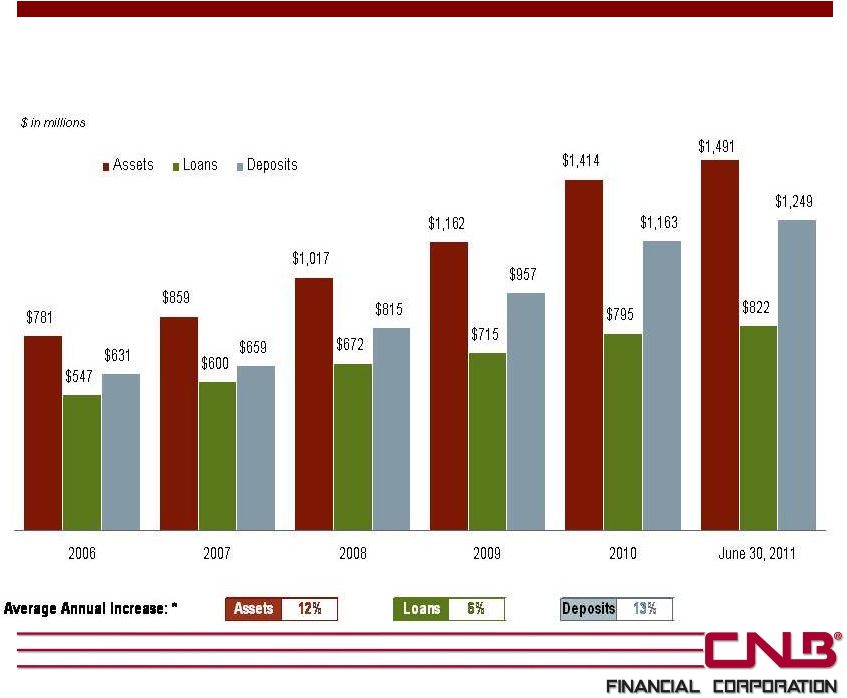 Balance Sheet Growth
* Compound annual growth rate from 2006 –
June 30, 2011.
6 |
 Earnings Per Share & Dividends
* Compound annual growth rate from 2001-2010.
7
Average Annual Increase: *
EPS
4.1%
Div.
6.0%
$0.71
$0.95
$0.99
$0.86
$1.01
$1.08
$1.05
$0.61
$0.98
$1.06
$0.27
$0.32
$0.37
$0.47
$0.47
$0.52
$0.55
$0.57
$0.62
$0.65
$0.66
$0.66
$0.165
$0.165
2001
2002
2003
2004
2005
2006
2007
2008
2009
2010
Q1 2011
Q2 2011
EPS
Dividends |
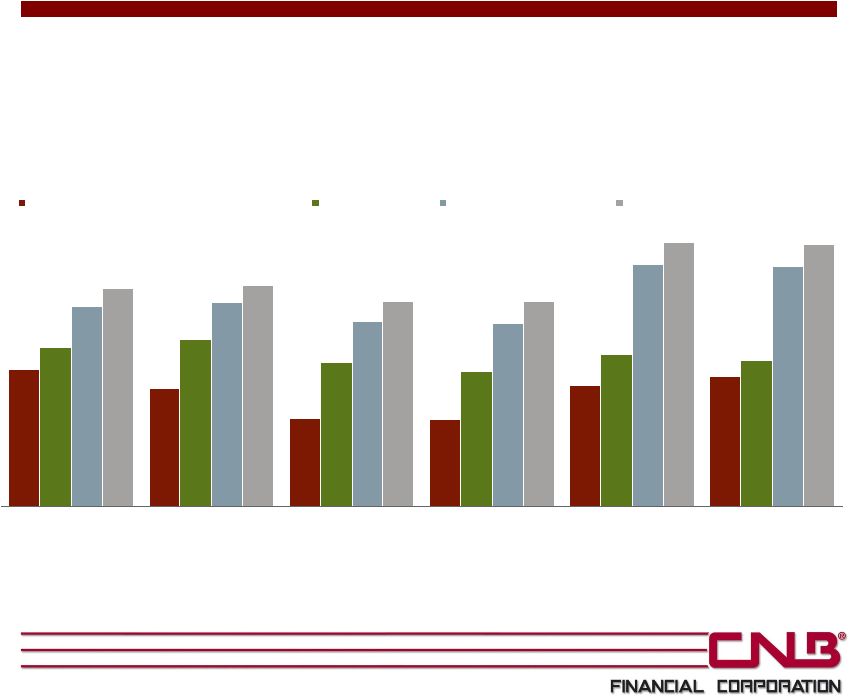 7.9%
6.9%
5.1%
5.1%
7.1%
7.5%
9.2%
9.7%
8.4%
7.9%
8.8%
8.5%
11.7%
11.9%
10.8%
10.7%
14.1%
14.0%
12.8%
12.9%
12.0%
12.0%
15.4%
15.3%
2006
2007
2008
2009
2010
June 30, 2011
Tangible Common Equity to Tangible Assets
Leverage Ratio
Tier 1 Risk Based Ratio
Total Risk Based Capital Ratio
Capital Ratios
8
*
* Please see the Appendix for a reconciliation of non-GAAP financial
information. |
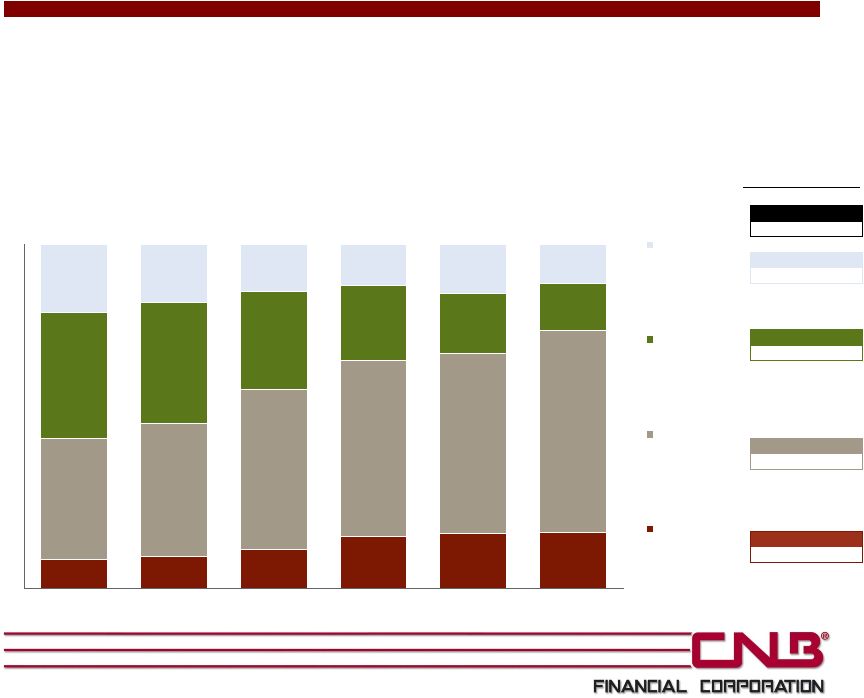 Deposit Composition
9
•
25% annual compound growth from 2006 to June 30, 2011 in transaction, money market
and savings accounts •
Interest-bearing deposit cost of 1.29% (or total deposit cost of 1.11%) for the
six months ended June 30, 2011 * Compound annual growth rate from 2006
– June 30, 2011.
Avg Annual Increase*
Total Deposits
13%
Jumbo CDs
2%
Retail CDs
-5%
MMDA & Savings
24%
Trans Accts
27%
9%
9%
11%
15%
16%
16%
35%
39%
47%
51%
52%
59%
37%
35%
29%
22%
18%
14%
20%
17%
14%
12%
14%
11%
0%
20%
40%
60%
80%
100%
2006
2007
2008
2009
2010
June 30, 2011
Jumbo CDs
Retail CDs
MMDA &
Savings
Trans Accts
$631
$659
$815
$957
$1,163
$1,249
$ in millions |
 Deposit Demographics
Source: SNL Financial 6/30/10
County
CNB Market
Rank
Number
of
Branches
CNB
Deposits
in Market
($000)
CNB
Market
Share
(%)
Total
Deposits
in Market
($000)
Total
Population
2010
(Actual)
Clearfield
1
11
405,489
29.65
1,367,426
83,248
Erie
6
4
271,572
7.25
3,745,173
279,906
Elk
4
4
105,820
16.16
654,902
32,583
McKean
3
3
87,717
11.77
745,411
43,660
Centre
10
1
65,370
2.93
2,333,913
146,264
Warren
4
1
43,613
4.72
923,841
40,631
Cambria
11
1
42,380
1.59
2,673,207
145,348
Crawford
8
1
41,277
3.68
1,120,484
89,185
Jefferson
6
1
35,155
3.96
888,499
45,343
Total
27
1,098,393
14,452,856
906,168
10 |
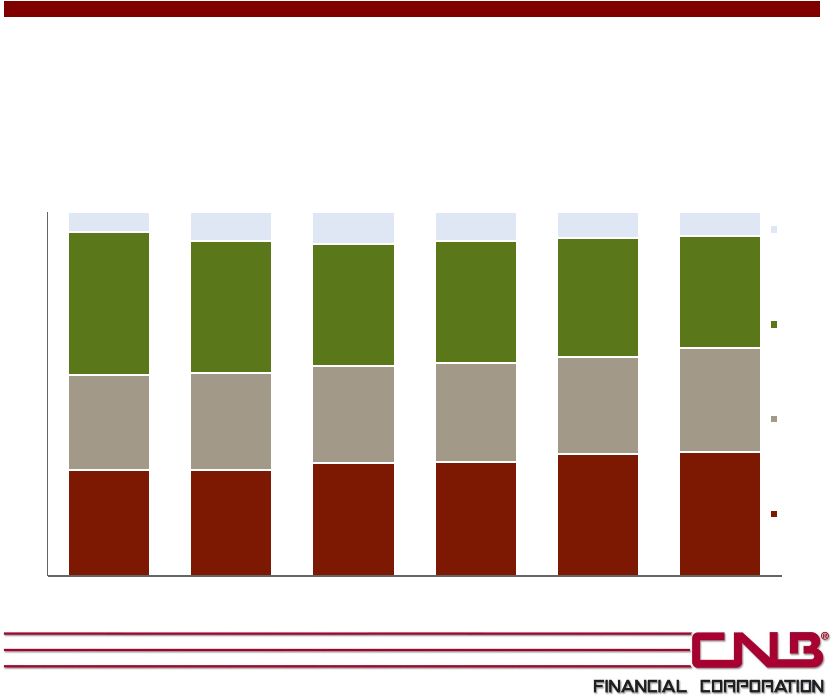 Loan Portfolio Overview
11
$ in millions
29%
29%
31%
31%
34%
34%
26%
27%
27%
27%
27%
29%
39%
36%
34%
33%
33%
31%
5%
8%
9%
8%
7%
7%
0%
20%
40%
60%
80%
100%
2006
2007
2008
2009
2010
June 30, 2011
Consumer and
other
Commercial,
industrial, and
agricultural
Commercial
mortgage
Residential
mortgage
$547
$600
$672
$715
$795
$822 |
 Yield on earning assets, cost of funds and
net interest margin
6.72%
7.11%
5.23%
5.89%
4.86%
2.64%
3.51%
1.78%
2.07%
1.50%
4.27%
4.33%
4.00%
3.71%
3.55%
0%
2%
4%
6%
8%
2007
2008
2009
2010
June 30, 2011
Yield on earning assets
Cost of funds
Net interest margin (tax equivalent)
12 |
 Asset Quality Summary
13 |
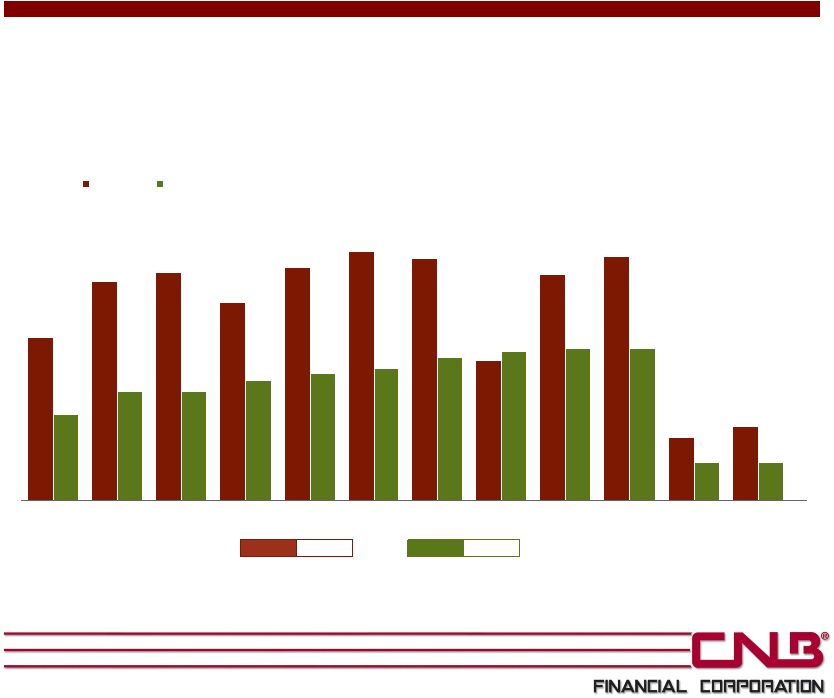
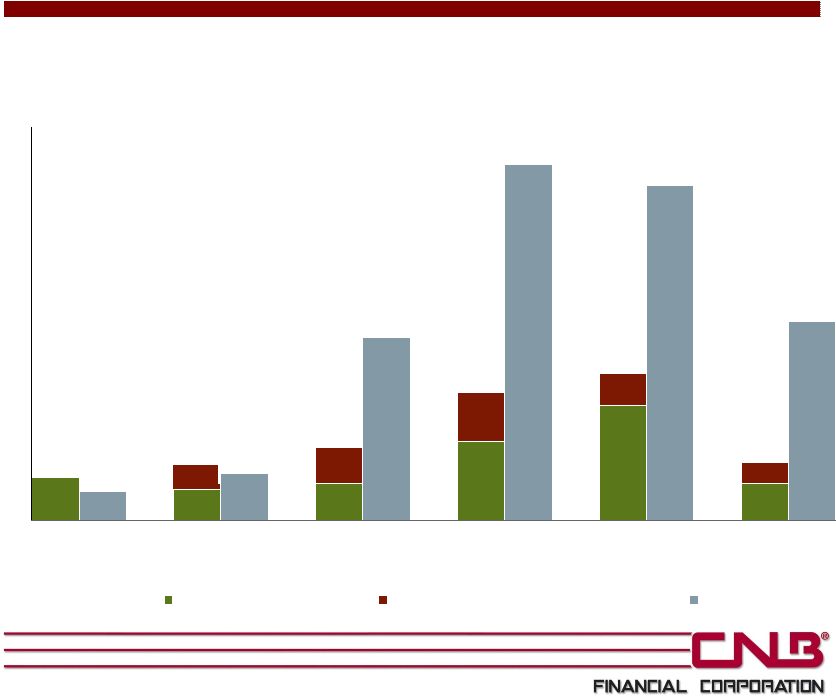 NCOs / Average Loans
Peers include U.S. bank holding companies with assets between $1 and $3 billion for
2011, 2010, 2009, and 2008, and U.S. bank holding companies with assets
between $500 million and $1 billion for 2007 and 2006. (Source: Bank Holding
Company Performance Report – www.ffiec.gov)
14
0.16%
0.12%
0.14%
0.30%
0.44%
0.14%
0.19%
0.12%
0.08%
0.11%
0.18%
0.70%
1.36%
1.28%
0.76%
0.02%
0.14%
0.00%
0.20%
0.40%
0.60%
0.80%
1.00%
1.20%
1.40%
2006
2007
2008
2009
2010
June
30,
2011
CCNE - CNB Bank
CCNE - Holiday Financial Services
Peers |
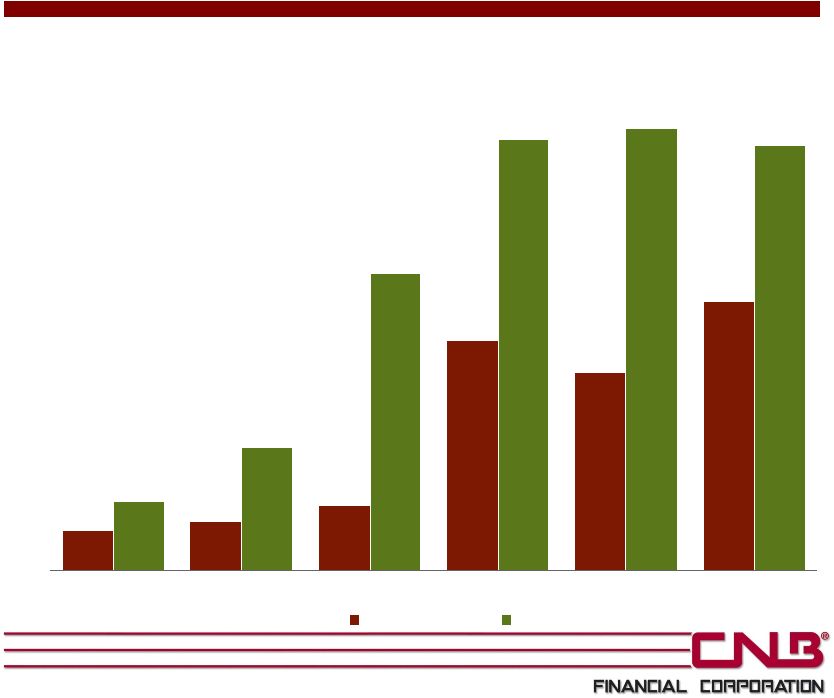 Nonperforming Loans / Loans
15
Peers include U.S. bank holding companies with assets between $1 and $3 billion for
2011, 2010, 2009 and 2008, and U.S. bank holding companies with assets
between $500 million and $1 billion for 2007 and 2006. (Source: Bank Holding
Company Performance Report – www.ffiec.gov)
0.32%
0.40%
0.53%
1.87%
1.61%
2.19%
0.56%
1.00%
2.41%
3.50%
3.59%
3.45%
2006
2007
2008
2009
2010
June 30, 2011
CCNE
Peers |
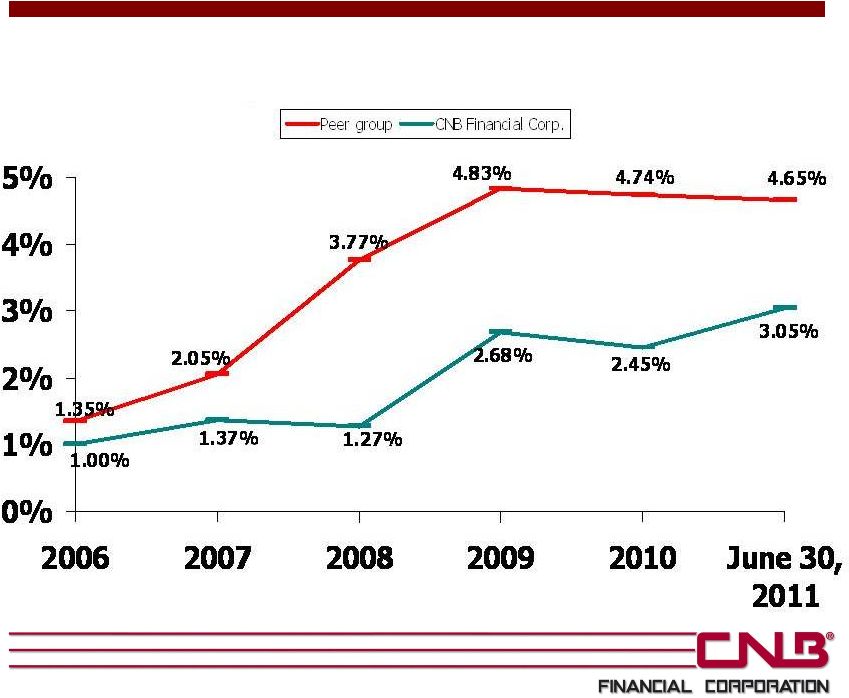 Delinquent Loans/Total Loans
Peers include U.S. bank holding companies with assets between $1 and $3 billion for
2011, 2010, 2009, and 2008, and U.S. bank holding companies with assets
between $500 million and $1 billion for 2007 and 2006. (Source: Bank Holding
Company Performance Report – www.ffiec.gov)
16 |
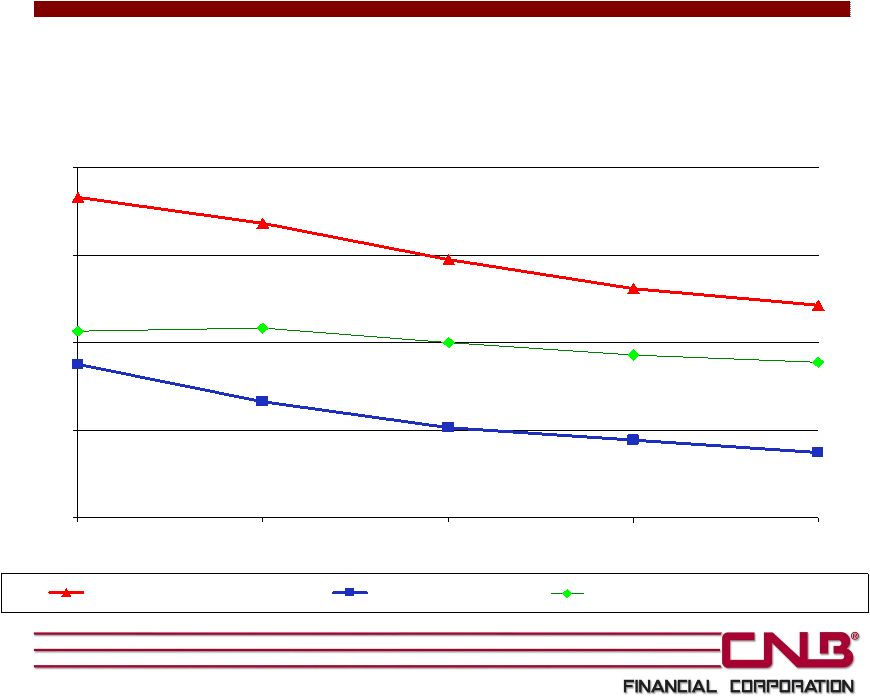
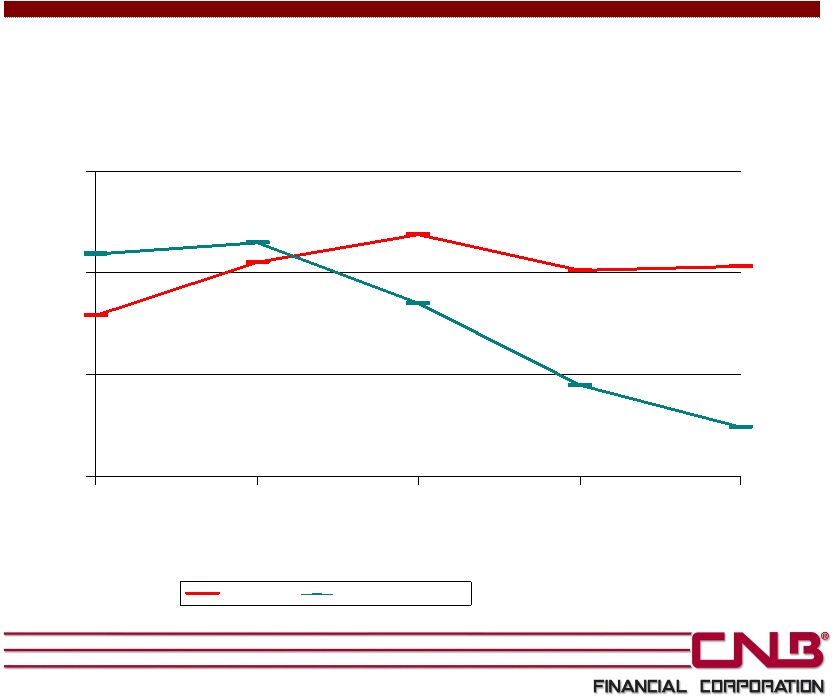 Non-interest expense ratio
{Non-interest expenses divided by average assets}
Peers include U.S. bank holding companies with assets between $1 and $3 billion for
2011, 2010, 2009, and 2008, and U.S. bank holding companies with assets
between $500 million and $1 billion for 2007. (Source: Bank Holding Company
Performance Report – www.ffiec.gov)
3.03%
3.19%
3.01%
2.79%
3.05%
2.24%
2.45%
2.85%
3.15%
3.09%
2.0%
2.5%
3.0%
3.5%
2007
2008
2009
2010
June 30,
2011
Peer group
CNB Financial Corp.
17 |
 Holiday Financial Services Corporation
18
Six months ended
2009
2010
June 30, 2011
Net income
$225
$576
$402
Net chargeoffs
$1,332
$889
$338
Year ended December 31,
(in thousands)
(in thousands) |
 Summary Financial Highlights
19
* Please see the Appendix for a reconciliation of non-GAAP financial
information. ($ in millions, except per share data)
Quarter Ended
2006
2007
2008
2009
2010
3/31/2011
6/30/2011
BALANCE SHEET
Assets
$781
$859
$1,017
$1,162
$1,414
$1,484
$1,491
Loans
$547
$600
$672
$715
$795
$793
$822
Deposits
$631
$659
$815
$957
$1,163
$1,226
$1,249
Shareholders' Equity
$72
$69
$62
$69
$110
$113
$122
PROFITABILITY
Net Income
$9.6
$9.1
$5.2
$8.5
$11.3
$3.3
$3.9
EPS
$1.08
$1.05
$0.61
$0.98
$1.06
$0.27
$0.32
Return on Average Assets
1.26%
1.12%
0.55%
0.79%
0.87%
0.91%
1.04%
Return on Average Equity
13.5%
12.8%
7.9%
12.9%
11.6%
11.8%
13.0%
Net Interest Margin
4.17%
4.27%
4.33%
4.00%
3.71%
3.53%
3.56%
Efficiency Ratio
57.7%
61.8%
65.1%
59.9%
57.9%
57.7%
55.6%
Noninterest Expense/ Avg Assets
2.87%
3.09%
3.03%
2.73%
2.43%
2.30%
2.19%
CAPITAL
Tang. Common Equity / Tang. Assets *
7.9%
6.9%
5.1%
5.1%
7.1%
6.9%
7.5%
Leverage Ratio
9.2%
9.7%
8.4%
7.9%
8.8%
8.6%
8.5%
Tier 1 Risk Based Ratio
11.7%
11.9%
10.8%
10.7%
14.1%
14.1%
14.0%
Total Risk Based Capital Ratio
12.8%
12.9%
12.0%
12.0%
15.4%
15.3%
15.3%
ASSET QUALITY
NPAs/ Assets
0.25%
0.34%
0.42%
1.17%
0.93%
1.09%
1.23%
NPAs/ Loans+OREO
0.35%
0.48%
0.63%
1.90%
1.66%
2.03%
2.23%
NCOs / Average Loans
0.17%
0.14%
0.28%
0.49%
0.56%
0.19%
0.24%
Reserves/ Loans
1.11%
1.13%
1.30%
1.37%
1.36%
1.42%
1.43% |
 Appendix
Non-GAAP Financial Reconciliation
Tangible
common
equity
to
tangible
assets
is
a
non-GAAP
financial
measure
calculated
using
GAAP
amounts.
Tangible
common
equity
is
calculated
by
excluding
the
balance
of
goodwill
and
other
intangible
assets
from
the
calculation
of
shareholders’
equity.
Tangible
assets
is
calculated
by
excluding
the
balance
of
goodwill
and
other
intangible
assets
from
the
calculation
of
total
assets.
CNB
believes
that
this
non-GAAP
financial
measure
provides
information
to
investors
that
is
useful
in
understanding
our
financial
condition.
Because
not
all
companies
use
the
same
calculations
of
tangible
common
equity
and
tangible
assets,
this
presentation
may
not
be
comparable
to
other
similarly
titled
measures
calculated
by
other
companies.
A
reconciliation
of
this
non-GAAP
financial
measure
is
provided
below.
20
Quarter Ended
($ in thousands)
2006
2007
2008
2009
2010
3/31/2011
6/30/2011
Total Shareholders' Equity
$72,279
$69,283
$62,467
$69,409
$109,645
$112,870
$122,230
Less Goodwill
10,821
10,821
10,821
10,821
10,821
10,821
10,821
Less Other Intangible Assets
385
285
185
85
-
-
-
Tangible Common Equity
$61,073
$58,177
$51,461
$58,503
$98,824
$102,049
$111,409
Total Assets
$780,850
$858,700
$1,016,518
$1,161,591
$1,413,511
$1,484,135
$1,491,194
Less Goodwill
10,821
10,821
10,821
10,821
10,821
10,821
10,821
Less Other Intangible Assets
385
285
185
85
-
-
-
Tangible Assets
$769,644
$847,594
$1,005,512
$1,150,685
$1,402,690
$1,473,314
$1,480,373
Total Shareholders' Equity / Total Assets
9.26%
8.07%
6.15%
5.98%
7.76%
7.61%
8.20%
Tangible Common Equity / Tangible Assets
7.94%
6.86%
5.12%
5.08%
7.05%
6.93%
7.53% |
 Financial Highlights
As of and for the six months ended
June 30, 2011
NASDAQ: CCNE
August 30, 2011 |