Attached files
Exhibit 99.2

HORIZON LINES HRZ LISTED NYSE FINANCIAL INFORMATION AUGUST 17, 2011
Forward-Looking Statements & Use of Non-GAAP Measures Risks, Uncertainties, Other Factors with Respect to “Forward-Looking Statements” The information contained in this presentation should be read in conjunction with our filings made with the Securities and Exchange Commission. This presentation contains “forward-looking statements” within the meaning of the federal securities laws. These forward-looking statements are intended to qualify for the safe harbor from liability established by the Private Securities Litigation Reform Act of 1995. Forward-looking statements are those that do not relate solely to historical fact. They include, but are not limited to, any statement that may predict, forecast, indicate or imply future results, performance, achievements or events. Words such as, but not limited to, “believe,” “expect,” “anticipate,” “estimate,” “intend,” “plan,” “target,” “projects,” “likely,” “will,” “would,” “could,” and similar expressions or phrases identify forward-looking statements. All forward-looking statements involve risk and uncertainties. In light of these risks and uncertainties, expected results or other anticipated events or circumstances discussed in this presentation might not occur. We undertake no obligation, and specifically decline any obligation, to publicly update or revise any forward-looking statement, whether as a result of new information, future events or otherwise. See the section entitled “Risk Factors” and other disclosures in our Annual Report Form 10-K (our “10-K”) filed with the SEC on March 28, 2011, and in our Quarterly Reports Form 10-Q filed on April 29, 2011 and July 29, 2011 (our “2Q 10-Q”), in each case filed with the Securities Exchange Commission, for a more complete discussion of these risks and uncertainties and for other risks and uncertainties. Those factors and the other risk factors described therein are not necessarily all of the important factors that could cause actual results or developments to differ materially from those expressed in any of our forward-looking statements. Other unknown or unpredictable factors also could harm our results. Consequently, there can be no assurance that actual results or developments anticipated by us will be realized or, even if substantially realized, that they will have the expected consequences. In particular, this presentation includes projections which are dependent on numerous factors mentioned above. Financial projections are necessarily speculative in nature and one or more of the assumptions and estimates underlying these projections may prove not to be valid. We believe the assumptions and estimates underlying these projections to be reasonable, but they are by their very nature inherently uncertain and subject to significant business, economic and competitive risks and uncertainties, many of which are beyond our control to predict or mitigate. We have had to revise our projections downward in the past. Use of Non-GAAP Measures Horizon Lines reports its financial results in accordance with U.S. generally accepted accounting principles (GAAP). The Company also believes that the presentation of certain non-GAAP measures, provides useful information for the understanding of its ongoing operations and enables investors to focus on period-over-period operating performance without the impact of significant special items, and thereby enhances the user’s overall understanding of the Company’s current financial performance relative to past performance and provides a better baseline for modeling future earnings expectations. The Company cautions that non-GAAP measures should be considered in addition to, but not as a substitute for, the Company’s reported GAAP results. References to “FSX” are to our trans-Pacific liner service between Asia and the U.S. west coast. Adjusted EBITDA is defined as net income (loss) plus net interest expense, income taxes, depreciation and amortization, legal settlements and contingencies, Department of Justice antitrust investigation costs and related legal expenses, impairment of assets, restructuring costs, union and other severance charges, refinancing costs, and loss on modification/extinguishment of debt. We have provided historical and projected adjusted EBITDA. For historical total consolidated adjusted EBITDA we have provided a reconciliation from net income (loss). We are unable to provide separate reconciliations to domestic and other adjusted EBITDA as some of the items added back to get to adjusted EBITDA are attributable to both domestic and other. We are unable to provide reconciliations for projected adjusted EBITDA as we are unable to project all items that would be included in future net income (loss). This presentation should be read together with our SEC filings, including our 10-K, as amended, and our 2Q 10-Q. HORIZON LINES HRZ LISTED NYSE ALWAYS THERE. ALWAYS DELIVERING
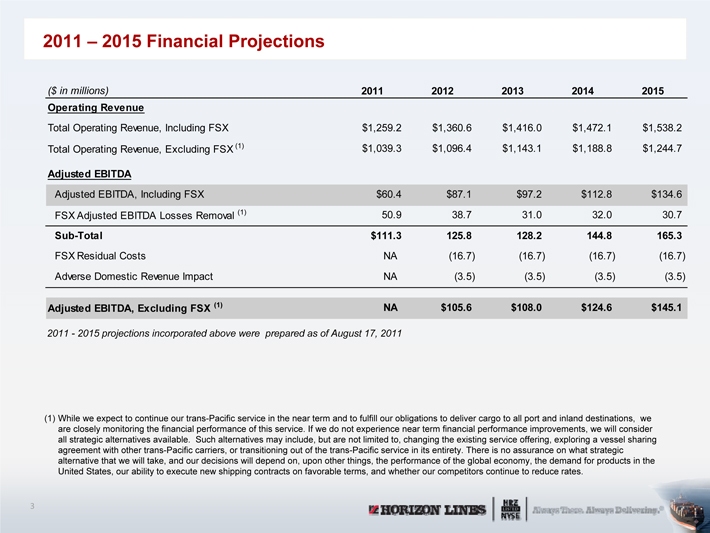
2011 –2015 Financial Projections $ in millions) 20112012201320142015 Operating Revenue Total Operating Revenue, Including FSX $1,259.2 $1,360.6 $1,416.0 $1,472.1 $1,538.2 Total Operating Revenue, Excluding FSX (1) $1,039.3 $1,096.4 $1,143.1 $1,188.8 $1,244.7 Adjusted EBITDA Adjusted EBITDA, Including FSX $60.4 $87.1 $97.2 $112.8 $134.6 FSX Adjusted EBITDA Losses Removal (1) .938.731.032.030.7 Sub-Total $111.3125.8128.2144.8165.3 FSX Residual CostsNA (16.7)(16.7)(16.7)(16.7) Adverse Domestic Revenue ImpactNA (3.5)(3.5)(3.5)(3.5) Adjusted EBITDA, Excluding FSX (1) NA $105.6 $108.0 $124.6 $145.1 2011 -2015 projections incorporated above were prepared as of August 17, 2011 (1) While we expect to continue our trans-Pacific service in the near term and to fulfill our obligations to deliver cargo to all port and inland destinations, we are closely monitoring the financial performance of this service. If we do not experience near term financial performance improvements, we will consider all strategic alternatives available. Such alternatives may include, but are not limited to, changing the existing service offering, exploring a vessel sharing agreement with other trans-Pacific carriers, or transitioning out of the trans-Pacific service in its entirety. There is no assurance on what strategic alternative that we will take, and our decisions will depend on, upon other things, the performance of the global economy, the demand for products in the United States, our ability to execute new shipping contracts on favorable terms, and whether our competitors continue to reduce rates. HORIZON LINES HRZ LISTED NYSE ALWAYS THERE. ALWAYS DELIVERING
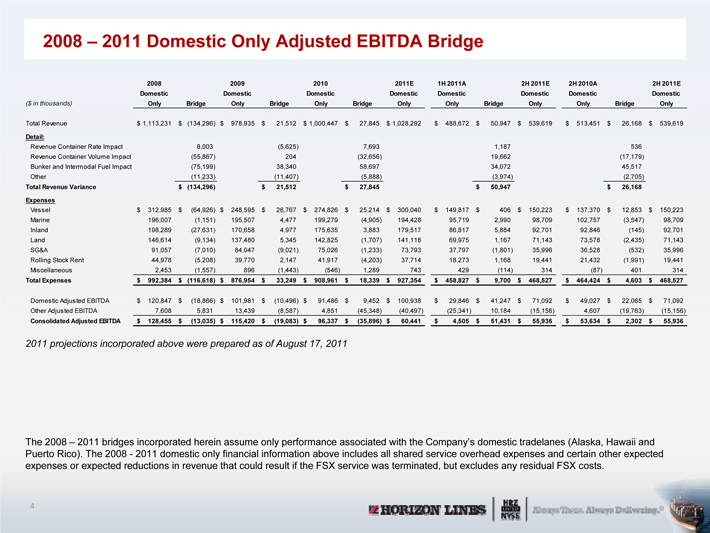
2008 –2011 Domestic Only Adjusted EBITDA Bridge 2008 2009 2010 2011 E1H 2011 A2H 2011 E2H 2010 A2H 2011 EDomestic Domestic Domestic Domestic Domestic Domestic Domestic Domestic ($ in thousands) Only Bridge Only Bridge Only Bridge Only Only Bridge Only Only Bridge Only Total Revenue 1,113,231 $ (134,296) $ 978,935$ 21,512$ 1,000,447$ 27,845$ 1,028,292$ 488,672$ 50,947$ 539,619$ 513,451$ 26,168$ 539,619$ Detail: Revenue Container Rate Impact 8,003 (5,625) 7,693 1,187 536 Revenue Container Volume Impact (55,867) 204 (32,656) 19,662 (17,179) Bunker and Intermodal Fuel Impact (75,199) 38,340 58,697 34,072 45,517 Other (11,233) (11,407) (5,888) (3,974) (2,705) Total Revenue Variance (134,296)$ 21,512$ 27,845$ 50,947$ 26,168$ Expenses Vessel 312,985$ (64,926)$ 248,595$ 26,767$ 274,826$ 25,214$ 300,040$ 149,817$ 406$ 150,223$ 137,370$ 12,853$ 150,223$ Marine 196,007 (1,151) 195,507 4,477 199,279 (4,905) 194,428 95,719 2,990 98,709 102,757 (3,547) 98,709 Inland 198,289 (27,631) 170,658 4,977 175,635 3,883 179,517 86,817 5,884 92,701 92,846 (145) 92,701 Land 146,614 (9,134) 137,480 5,345 142,825 (1,707) 141,118 69,975 1,167 71,143 73,578 (2,435) 71,143 SG&A9 1,057 (7,010) 84,047 (9,021) 75,026 (1,233) 73,793 37,797 (1,801) 35,996 36,528 (532) 35,996 Rolling Stock Rent 44,978 (5,208) 39,770 2,147 41,917 (4,203) 37,714 18,273 1,168 19,441 21,432 (1,991) 19,441 Miscellaneous 2,453 (1,557) 896 (1,443) (546) 1,289 743 429 (114) 314 (87) 401 314 Total Expenses 992,384$ (116,618)$ 876,954$ 33,249$ 908,961$ 18,339$ 927,354$ 458,827$ 9,700$ 468,527$ 464,424$ 4,603$ 468,527$ Domestic Adjusted EBITDA 120,847$ (18,866)$ 101,981$ (10,496)$ 91,486$ 9,452$ 100,938$ 29,846$ 41,247$ 71,092$ 49,027$ 22,065$ 71,092$ Other Adjusted EBITDA 7,608 5,831 13,439 (8,587) 4,851 (45,348) (40,497) (25,341) 10,184 (15,156) 4,607 (19,763) (15,156) Consolidated Adjusted EBITDA 128,455$ (13,035)$ 115,420$ (19,083)$ 96,337$ (35,896)$ 60,441$ 4,505$ 51,431$ 55,936$ 53,634$ 2,302$ 55,936 2011 projections incorporated above were prepared as of August 17, 2011 The 2008 –2011 bridges incorporated herein assume only performance associated with the Company’s domestic tradelanes (Alaska, Hawaii and Puerto Rico). The 2008 -2011 domestic only financial information above includes all shared service overhead expenses and certain other expected expenses or expected reductions in revenue that could result if the FSX service was terminated, but excludes any residual FSX costs. HORIZON LINES HRZ LISTED NYSE ALWAYS THERE. ALWAYS DELIVERING
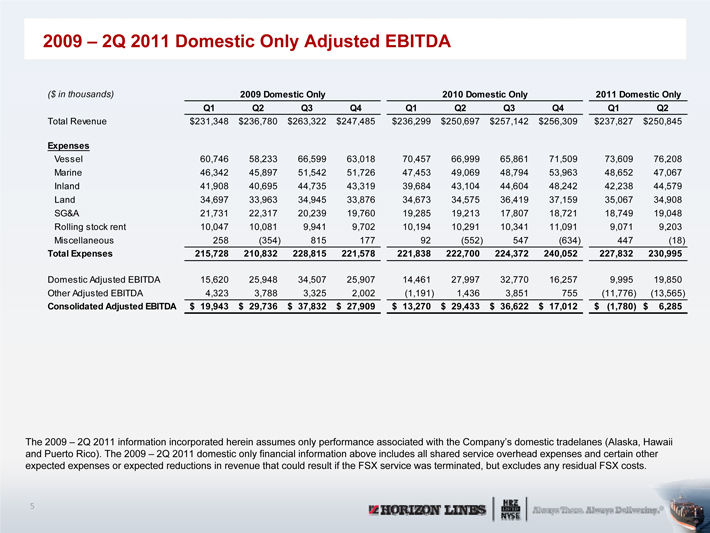
2009 –2Q 2011 Domestic Only Adjusted EBITDA ($ in thousands) 2011 Domestic Only Q1 Q2 \ Q4 Q1 Q2 Q3 Q4 Q1 Q2 Total 2009 Domestic Only 2010 Domestic $ 263,322$ 247,485$ 236,299$ 250,697 31,348 Only Revenue 231,348$ 236,780$ 263,322$ 247,485$ 236,299$ 250,697$ 257,142$ 256,309$ 237,827$ 250,845$ Expenses Vesse l60,746 58,233 66,599 63,018 70,457 66,999 65,861 71,509 73,609 76,208 Marine 46,342 45,897 51,542 51,726 47,453 49,069 48,794 53,963 48,652 47,067 Inland 41,908 40,695 44,735 43,319 39,684 43,104 44,604 48,242 42,238 44,579 Land 34,697 33,963 34,945 33,876 34,673 34,575 36,419 37,159 35,067 34,908 SG&A 21,731 22,317 20,239 19,760 19,285 19,213 17,807 18,721 18,749 19,048 Rolling stock rent 10,047 10,081 9,941 9,702 10,194 10,291 10,341 11,091 9,071 9,203 Miscellaneous 258 (354) 815 177 92 (552) 547 (634) 447 (18) Total Expenses 215,728 210,832 228,815 221,578 221,838 222,700 224,372 240,052 227,832 230,995 Domestic Adjusted EBITDA 15,620 25,948 34,507 25,907 14,461 27,997 32,770 16,257 9,995 19,850 Other Adjusted EBITDA 4,323 3,788 3,325 2,002 (1,191) 1,436 3,851 755 (11,776) (13,565) Consolidated Adjusted EBITDA 19,943$ 29,736$ 37,832$ 27,909$ 13,270$ 29,433$ 36,622$ 17,012$ (1,780)$ 6,285 The 2009 –2Q 2011 information incorporated herein assumes only performance associated with the Company’s domestic tradelanes (Alaska, Hawaii and Puerto Rico). The 2009 –2Q 2011 domestic only financial information above includes all shared service overhead expenses and certain other expected expenses or expected reductions in revenue that could result if the FSX service was terminated, but excludes any residual FSX costs. HORIZON LINES HRZ LISTED NYSE ALWAYS THERE. ALWAYS DELIVERING
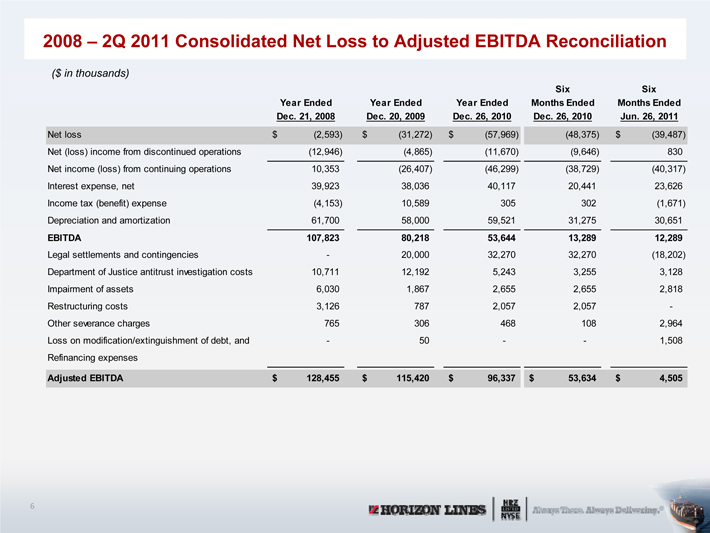
2008 –2Q 2011 Consolidated Net Loss to Adjusted EBITDA Reconciliation ($ in thousands) Six Six Year Ended Year Ended Year Ended Months Ended Months Ended Dec. 21, 2008 Dec. 20, 2009 Dec. 26, 2010 Dec. 26, 2010 Jun. 26, 2011 Net loss(2,593)$ (31,272)$ (57,969)$ (48,375) (39,487)$ Net (loss) income from discontinued operations(12,946) (4,865) (11,670) (9,646) 830 Net income (loss) from continuing operations 10,353 (26,407) (46,299) (38,729) (40,317) Interest expense, net39,923 38,036 40,117 20,441 23,626 Income tax (benefit) expense (4,153) 10,589 305 302 (1,671) Depreciation and amortization 61,700 58,000 59,521 31,275 30,651 EBITDA 107,823 80,218 53,644 13,289 12,289 Legal settlements and contingencies- 20,000 32,270 32,270 (18,202) Department of Justice antitrust investigation costs 10,711 12,192 5,243 3,255 3,128 Impairment of assets 6,030 1,867 2,655 2,655 2,818 Restructuring costs 3,126 787 2,057 2,057 — Other severance charges 765 306 468 108 2,964 Loss on modification/extinguishment of debt, and- 50 — — 1,508 Refinancing expenses Adjusted EBITDA 128,455$ 115,420$ 96,337$ 53,634$ 4,505 HORIZON LINES HRZ LISTED NYSE ALWAYS THERE. ALWAYS DELIVERING
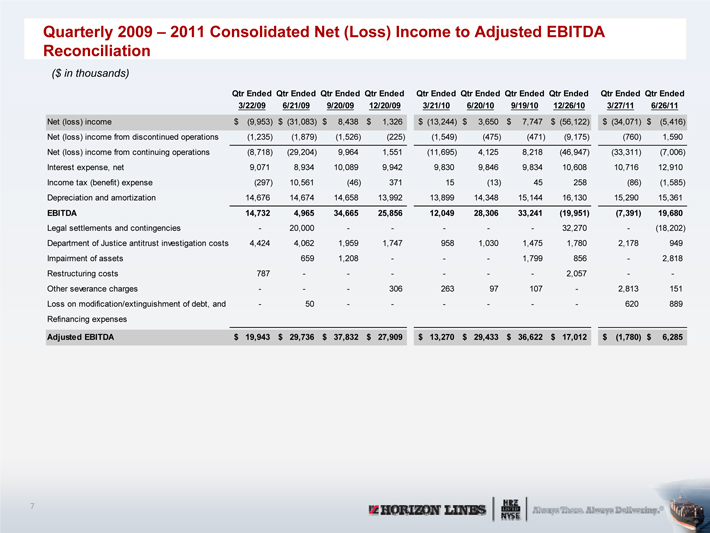
Quarterly 2009 –2011 Consolidated Net (Loss) Income to Adjusted EBITDA Reconciliation ($ in thousands) Qtr Ended Qtr Ended Qtr Ended Qtr Ended Qtr Ended Qtr Ended Qtr Ended Qtr Ended Qtr Ended Qtr Ended 3/22/096/21/099/20/0912/20/093/21/106/20/109/19/1012/26/103/27/116/26/11Net (loss) income(9,953)$ (31,083)$ 8,438$ 1,326$ (13,244)$ 3,650$ 7,747$ (56,122)$ (34,071)$ (5,416)$ Net (loss) income from discontinued operations( 1, 235) (1,879) (1,526) (225) (1,549) (475) (471) (9,175) (760) 1,590 Net (loss) income from continuing operations( 8, 718) (29,204) 9,964 1,551 (11,695) 4,125 8,218 (46,947) (33,311) (7,006) Interest expense, net9,071 8,934 10,089 9,942 9,830 9,846 9,834 10,608 10,716 12,910 Income tax (benefit) expense (297) 10,561 (46) 371 15 (13) 45 258 (86) (1,585) Depreciation and amortization 14,676 14,674 14,658 13,992 13,899 14,348 15,144 16,130 15,290 15,361 EBITDA 14,732 4,965 34,665 25,856 12,049 28,306 33,241 (19,951) (7,391) 19,680 Legal settlements and contingencies- 20,000 — — — — — 32,270 — (18,202) Department of Justice antitrust investigation costs 4,424 4,062 1,959 1,747 958 1,030 1,475 1,780 2,178 949 Impairment of assets 659 1,208 — — — 1,799 856 — 2,818 Restructuring costs 787 — — — — — — 2,057 — — Other severance charges- — — 306 263 97 107 — 2,813 151 Loss on modification/extinguishment of debt, and- 50 — — — — — — 620 889 Refinancing expenses Adjusted EBITDA 19,943$ 29,736$ 37,832$ 27,909$ 13,270$ 29,433$ 36,622$ 17,012$ (1,780)$ 6,285 HORIZON LINES HRZ LISTED NYSE ALWAYS THERE. ALWAYS DELIVERING