UNITED STATES SECURITIES AND
EXCHANGE COMMISSION
Washington, D.C.
20549
Form 10-K
| |
|
|
|
(Mark One)
|
|
|
|
|
|
þ
|
|
ANNUAL REPORT PURSUANT TO SECTION 13 OR 15(d)
OF THE SECURITIES EXCHANGE ACT OF 1934
|
|
|
|
For the fiscal year ended June
30,
2011
|
|
OR
|
|
o
|
|
TRANSITION REPORT PURSUANT TO SECTION 13 OR 15(d)
OF THE SECURITIES EXCHANGE ACT OF 1934
|
|
|
|
For the transition period
from to
|
Commission File Number
000-50866
DFC GLOBAL CORP.
(Exact Name of Registrant as
Specified in Its Charter)
| |
|
|
|
Delaware
|
|
23-2636866
|
(State or Other Jurisdiction
of
Incorporation or Organization)
|
|
(I.R.S. Employer
Identification No.)
|
|
|
|
|
|
|
|
|
|
1436 Lancaster Avenue
|
|
19312-1288
|
|
Berwyn, Pennsylvania
|
|
(Zip Code)
|
|
(Address of Principal Executive
Offices)
|
|
|
Registrant’s telephone number, including area code
(610) 296-3400
Securities registered pursuant to Section 12(b) of the
Exchange Act:
| |
|
|
|
Title of each class
|
|
Name of each exchange on which
registered
|
|
|
|
|
|
Common Stock, $0.001 par value per share
|
|
The NASDAQ Stock Market LLC
|
Securities registered pursuant to Section 12(g) of the
Exchange Act:
| |
|
|
|
Title of each class
|
|
Name of each exchange on which
registered
|
|
|
|
|
|
Not applicable
|
|
Not applicable
|
Indicate by check mark if the registrant is a well-known
seasoned issuer, as defined in Rule 405 of the Securities
Act. Yes o No þ
Indicate by check mark if the registrant is not required to file
reports pursuant to Section 13 or Section 15(d) of the
Act Yes o No þ
Indicate by check mark whether the registrant: (1) has
filed all reports required to be filed by Section 13 or
15(d) of the Securities Exchange Act of 1934 during the
preceding 12 months (or for such shorter period that the
registrant was required to file such reports), and (2) has
been subject to such filing requirements for the past
90 days. Yes þ No o
Indicate by check mark whether the registrant has submitted
electronically and posted on its corporate website, if any,
every Interactive Data File required to be submitted and posted
pursuant to Rule 405 of
Regulation S-T
during the preceding 12 months (or for such shorter period
that the registrant was required to submit and post such
files) Yes o No o
Indicate by check mark if disclosure of delinquent filers
pursuant to Item 405 of
Regulation S-K
is not contained herein, and will not be contained, to the best
of registrant’s knowledge, in definitive proxy or
information statements incorporated by reference in
Part III of this
Form 10-K
or any amendment to this
Form 10-K: o
Indicate by check mark whether the registrant is a large
accelerated filer, an accelerated filer, a non-accelerated filer
or a smaller reporting company. See the definitions of
“large accelerated filer,” “accelerated
filer,” and “smaller reporting company” in
Rule 12b-2
of the Exchange Act. (check one):
|
|
|
|
| Large
accelerated
filer o
|
Accelerated
filer þ
|
Non-accelerated
filer o
|
Smaller
reporting
company o
|
Indicate by check mark whether the registrant is a shell company
(as defined in
Rule 12b-2
of the Exchange
Act). Yes o No þ
As of December 31, 2010, 24,461,639 shares of the
registrant’s common stock, par value $0.001 per share, were
outstanding (without giving effect to the
three-for-two
stock split effected as a stock dividend to all stockholders of
record on January 20, 2011). As of such date the aggregate
market value of voting stock (based upon the last reported sales
price in The Nasdaq Global Select Market) held by non-affiliates
of the registrant was approximately $687,254,467. As of
July 31, 2011, 43,772,801 shares of the
registrant’s voting stock was outstanding.
DOCUMENTS
INCORPORATED BY REFERENCE
| |
|
|
|
Document
|
|
Form 10-K Reference
|
|
|
|
Portions of Proxy Statement for 2011 Annual Meeting of
Shareholders
|
|
Part III
|
DFC
GLOBAL CORP.
Table of
Contents
Report on
Form 10-K
for the Year Ended June 30, 2011
This Annual Report on
Form 10-K
and the documents incorporated herein contain
“forward-looking statements” within the meaning of
Section 27A of the Securities Act of 1933, as amended, and
Section 21E of the Securities Exchange Act of 1934, as
amended. Those statements are therefore entitled to the
protection of the safe harbor provisions of these laws. These
forward-looking statements, which are usually accompanied by
words such as “may,” “might,”
“will,” “should,” “could,”
“intends,” “estimates,”
“predicts,” “potential,”
“continue,” “believes,”
“anticipates,” “plans,” “expects”
and similar expressions, involve risks and uncertainties, and
relate to, without limitation, statements about our market
opportunities, anticipated improvements in operations, our
plans, earnings, cash flow and expense estimates, strategies and
prospects, both business and financial. There are important
factors that could cause our actual results, level of activity,
performance or achievements to differ materially from those
expressed or forecasted in, or implied by, such forward-looking
statements, particularly those factors discussed in
“Item 1A — Risk Factors” of this Annual
Report on
Form 10-K.
Although we believe that the expectations reflected in these
forward-looking statements are based upon reasonable
assumptions, no assurance can be given that such expectations
will be attained or that any deviations will not be material. In
light of these risks, uncertainties and assumptions, the
forward-looking events and circumstances discussed in this
Annual Report on Form
10-K may not
occur and our actual results could differ materially and
adversely from those anticipated or implied in the
forward-looking statements. These forward-looking statements
speak only as of the date on which they are made, and, except as
otherwise required by law, we disclaim any obligation or
undertaking to disseminate any update or revision to any
forward-looking statement contained herein to reflect any change
in our expectations with regard thereto or any change in events,
conditions or circumstances on which any such statement is
based. If we do update or modify one or more forward-looking
statements, you should not conclude that we will make additional
updates or modifications with respect thereto or with respect to
other forward-looking statements, except as required by law.
Unless the context otherwise requires, as used in this Annual
Report on
Form 10-K,
(i) the terms “fiscal year” and
“fiscal” refer to the twelve-month period ended on
June 30 of the specified year, (ii) references to
“$,” “dollars,” “United States
dollars” or “U.S. dollars” refer to the
lawful currency of the United States of America,
(iii) references to “CAD” refer to the Canadian
dollar, the lawful currency of Canada, (iv) references to
“GBP” refer to the British Pound Sterling, the lawful
currency of the United Kingdom of Great Britain and Northern
Ireland, (v) references to “SEK” refer to the
Swedish Krona, the lawful currency of Sweden, and
(vi) references to “EUR” refer to the Euro, the
lawful currency of the European Union.
1
General
We are a leading international diversified financial services
company serving primarily unbanked and under-banked consumers
who, for reasons of convenience and accessibility, purchase some
or all of their financial services from us rather than from
banks and other financial institutions. Through our nearly 1,300
retail storefront locations, multiple Internet websites and our
mobile phone and other remote platforms, we provide a variety of
consumer financial products and services in seven countries
across North America and Europe — Canada, the United
Kingdom, the United States, Sweden, Finland, Poland and the
Republic of Ireland. We believe that our customers, many of whom
receive income on an irregular basis or from multiple employers,
are drawn to the range of financial services that we offer, the
convenience of our products, the multiple ways in which they may
conduct business with us and our high-quality customer service.
Our products and services, principally our short-term
single-payment consumer loans, secured pawn loans, check cashing
services and gold buying services, provide customers with
immediate access to cash for living expenses or other needs. We
strive to offer our customers additional high-value ancillary
services, including Western
Union®
money order and money transfer products, foreign currency
exchange, reloadable
VISA®
and
MasterCard®
prepaid debit cards and electronic tax filing. In addition to
our core retail products, we also provide fee-based services in
the United States to enlisted military personnel applying for
loans to purchase new and used vehicles that are funded and
serviced under an agreement with a major third-party national
bank through our branded Military Installment Loan and Education
Services, or
MILES®,
program.
We continue to seek opportunities to expand upon and diversify
from our core retail financial services businesses in Canada,
the United Kingdom and the United States. In furtherance of that
strategy, we completed several significant acquisitions in
fiscal 2011. On December 31, 2010, we acquired Sefina
Finance AB, which we believe is the largest pawn lender in each
of Sweden and Finland. As a result of our April 2011 acquisition
of Purpose U.K. Holdings Limited, the largest Internet provider
of short-term consumer loans in the United Kingdom, which is
commonly referred to as “Month End Money” or
“MEM” and operates primarily under the brand name
“Payday UK”, we both expanded on our existing online
presence in the U.K. market and obtained a proven technological
platform that we believe we can successfully deploy in other
markets. Shortly after the end of fiscal 2011, we continued to
execute on our strategy though our acquisition of Risicum Oyj,
which offers short-term consumer loans through the Internet and
mobile phone technologies in Finland and Sweden. During fiscal
2011, nearly 50% of our total consolidated revenue was comprised
of products and services which generally carry little or no
credit risk, such as secured pawn lending, check cashing, money
transfers, gold purchasing and fee-based income generated from
our MILES program.
Our networks of retail locations in Canada and the United
Kingdom are the largest of their kind by revenue in each of
those countries. We believe that we are also the largest pawn
lender in Europe by revenue. At June 30, 2011, our global
retail operations consisted of 1,269 retail storefront
locations, of which 1,198 are company-owned financial services
stores, conducting business primarily under the names Money
Mart®,
The Money
Shop®,
Insta-Cheques®,
mce®,
Suttons and
Robertsons®,
The Check Cashing
Store®,
Sefina®,
Helsingin
Panttism,
Optima®
and
MoneyNow!®.
In addition to our retail stores, we also offer Internet-based
short-term consumer loans in the United Kingdom primarily under
the brand names Payday
Express®
and
PaydayUK®,
in Canada under the Money Mart name, and Finland and Sweden
primarily under the
Risicum®
and OK
Money®
brand names.
We report financial results for our business as three reportable
segments — our financial services offerings in each of
Canada, Europe and the United States. Information regarding
total assets, operating results and other financial information
regarding each of our reporting segments for each of the fiscal
years ended June 30, 2009, 2010 and 2011 is set forth in
“Item 8. — Financial Statements and
Supplementary Data — Note 19” in this
Annual Report on
Form 10-K.
2
Our
Industry
We operate in a sector of the financial services industry that
serves the basic needs of individuals and small businesses
needing quick and convenient access to cash and other financial
services. These needs are primarily evidenced by consumer demand
for short-term consumer and small business loans, secured pawn
lending, check cashing, gold buying, money transfers, prepaid
debit cards, foreign currency exchange and other services.
Consumers who use these services are often underserved by banks
and other financial institutions.
Service sector and self-employed individuals represent the
largest portion of the population in each of the countries in
which we operate. Many of these individuals periodically require
short-term loans to provide cash necessary for living and other
episodic expenses. They may not be able, or even desire, to
obtain loans from banks as a result of their immediate need for
cash, the irregular receipt of payments from their employers, or
the unavailability of bank loans in small denominations for
short time periods. For those who maintain banking
relationships, short-term loan products can provide an
alternative to the generally high cost of overdraft fees charged
by their banks for overdrawn accounts. Individuals who do not
maintain regular banking relationships use services provided by
our industry for a variety of reasons, including that they lack
sufficient assets to maintain minimum balance requirements or to
achieve the benefits of savings with banks, do not write enough
checks to make a bank account beneficial, have a dislike or
distrust of banks, or do not have a neighborhood bank in close
proximity to them.
Despite the inherent demand for basic financial services, access
to banks has become increasingly difficult for a significant
segment of consumers, especially in United States, Canada and
Europe. Many banks have chosen to close their less profitable or
lower-traffic locations and to otherwise reduce the hours during
which they operate at such locations. Typically, these closings
have occurred in neighborhoods where the branches have failed to
attract a sufficient base of customer deposits. This trend has
resulted in fewer convenient alternatives for basic financial
services in many neighborhoods. Furthermore, traditional banks
have tended in recent years to eliminate, or have made it
difficult or relatively expensive to obtain, many of the
services that under-banked consumers’ desire.
As a result of these developments, a significant number of
businesses offer financial services to service-sector and
self-employed individuals. The providers of these services are
generally fragmented, and range from specialty finance offices
to retail stores in other industries that offer ancillary
financial services.
Secured pawn lending offers customers a flexible short-term loan
secured primarily on gold-based items, such as jewelry, with the
exception of our Suttons & Robertson’s business
in London which accepts pledges on a broad range of high value
items of up to GBP 1.0 million.
While the mix of products offered may vary, we believe that the
under-banked consumer markets in each of the countries in which
we operate will continue to grow as a result of a diminishing
supply of competing banking services as well as underlying
demographic trends. These demographic trends include an overall
increase in the population in each of our markets and an
increase in the number of self-employed, small business and
service sector jobs as a percentage of the total workforce.
The demographics of the typical customers for non-banking
financial services vary somewhat in each of the markets in which
we operate. The type of store and services that appeal to
customers in each market differs based on cultural, social,
geographic, economic and other factors. The composition of
providers of these services in each market results, in part,
from the historical development and regulatory environment in
that market.
3
Our
Markets
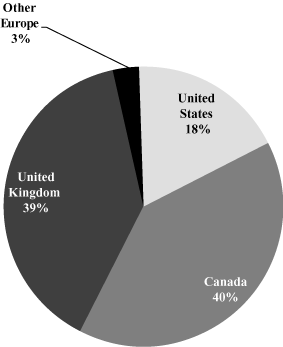
We operate primarily in three geographical markets, Canada,
Europe (the United Kingdom, Sweden, Finland, Poland and the
Republic of Ireland) and the United States. The following chart
illustrates our consolidated revenue by geography for fiscal
2011:
For more information regarding our consolidated revenue by
geography, please see “Item 8. Financial Statements
and Supplementary Data — Note 19” in
this Annual Report on
Form 10-K.
Canada
We believe that we are the leading financial services company in
Canada serving unbanked and under-banked consumers. We estimate
that, across Canada, there are approximately 1,500 individual
outlets offering short-term single-payment consumer loans
and/or check
cashing, including only two other networks of stores exceeding
100 locations in Canada. We believe we operate the largest store
network in Canada based upon revenues and profitability, and
therefore we believe that we have the largest market share in
Canada in our sector.
As of June 30, 2011, our Canadian network consisted of 477
retail financial services stores, of which 455 are company-owned
and 22 are operated by franchisees. During fiscal 2011, we
opened 16 new retail stores in Canada, and reacquired 40
existing franchised Canadian stores. We anticipate opening
approximately 20 to 25 new retail financial services stores in
Canada during fiscal 2012, and purchasing additional franchised
stores as appropriate opportunities arise. We are located in 12
of the 13 Canadian provinces and territories, with 240 locations
in Ontario, 82 locations in British Columbia, 75 locations in
Alberta, 20 locations in Manitoba and 60 locations in the other
Canadian provinces and territories. We have at least one store
in nearly every Canadian city with a population exceeding 50,000.
Our Canadian stores typically offer short-term single-payment
consumer loans, check cashing, Western Union money transfer
products, foreign currency exchange, prepaid debit cards, gold
buying and other ancillary products and services. During fiscal
2011, we began offering pre-paid cellular telephones and related
service plans and accessories in certain of our stores in
Alberta, British Columbia, Ontario and Quebec in partnership
with two Canadian cellular telephone providers. All of our
stores in Canada operate under the name “Money Mart”,
except our locations in Québec, which operate under the
name “Instant Cheques” and do not offer short-term
single-payment consumer loans. We also offer our short-term
single-payment loan products over the Internet to residents of
Alberta and Ontario, primarily through our website located at
www.moneymart.ca, and are testing pawn lending in Toronto.
4
Europe
United
Kingdom and the Republic of Ireland
Based on information from the British Cheque Cashers
Association, we believe that our U.K. stores represent
approximately 30% of all stores in the United Kingdom operating
in our sector. We believe we operate the largest store network
based upon revenues and profitability, and therefore we believe
we have the largest market share in our sector, in the United
Kingdom. In addition, as a result of our April 1, 2011
acquisition of MEM, and our Express Finance business that we
purchased in fiscal 2009, we operate the largest online
single-payment short-term lending business in the United Kingdom.
As of June 30, 2011, our U.K. network consisted of 449
retail financial services stores, of which 400 are operated by
us and 49 are operated by franchisees or agents. Our stores are
located in each of the constituent countries of the United
Kingdom, with 368 locations in England, 38 locations in
Scotland, 25 locations in Northern Ireland and 17 locations in
Wales. We also currently have one store in the Republic of
Ireland which we manage along with our U.K. retail stores.
During fiscal 2011, we opened 69 new retail stores in the United
Kingdom. We anticipate opening approximately 75 to 100 new
retail stores in the United Kingdom during fiscal 2012.
Our financial services stores in the United Kingdom typically
offer short-term single-payment consumer loans, secured pawn
lending, gold buying, check cashing, Western Union money
transfer products, foreign currency exchange and other ancillary
products and services. Most of our stores in the United Kingdom
operate under the name The Money Shop, with the exception of
certain franchises operating under the name Cash A
Chequesm.
We also offer our short-term single-payment loan products via
the Internet through our Express Finance and recently acquired
MEM businesses operating primarily through the web addresses
www.paydayexpress.co.uk and www.paydayuk.com,
respectively.
In addition to our traditional financial services stores and
Internet operations in the United Kingdom, our retail financial
services store network includes two traditional pawn shops
located in Edinburgh and Glasgow, Scotland under the name
“Robert Biggar Ltd.”, and four high-end pawn shops in
London, England doing business since 1770 under the names
Suttons & Robertsons, T.M.
Suttonssm
and
Robertsonssm.
We also provide merchant cash advances which are repaid by
future credit card receipts under the trade name Business Cash
Advancesm.
Sweden
and Finland
On December 31, 2010, we acquired Sefina Finance AB, the
leading pawn lending business in Scandinavia. Sefina, which has
a more than 125 year operating history, provides pawn loans
primarily secured by high value gold jewelry, diamonds and
watches. As of June 30, 2011, our Scandinavian retail
operations consisted of 16 retail pawnbroking locations in
Sweden conducting business under the name “Sefina” and
12 retail store locations in Finland operating under the name
Helsingin Pantti
SM. We
anticipate opening approximately 8 additional pawn lending
stores in Sweden and Finland during fiscal 2012.
On July 6, 2011, we acquired Risicum Oyj (Risicum), the
leading provider of short-term Internet loans in Finland.
Risicum provides loans predominantly in Finland through both
Internet and mobile phone technology, utilizing multiple brands
to target specific customer demographics. Risicum also provides
Internet and telephony-based loans in Sweden.
Poland
Through our 76% controlling interest in Optima, S.A. (Optima),
we offer relatively longer-term consumer installment loans in
Poland with terms of approximately
40-50 weeks
in duration with an average loan amount of $250 to $500. These
loans include an in-home servicing feature. Customer sales and
service activities are managed through an extensive network of
local commission based representatives across seven provinces in
Poland.
5
Additionally, during fiscal 2011, we opened three retail
financial services stores in Poland operating under the name
“Money Now!”. Our Polish retail stores currently offer
gold buying, secured pawn lending, Western Union money transfer
products and other financial services.
United
States
As of June 30, 2011, we operated a total of 312 retail
financial services stores in 15 states, including 102
stores in Florida, 99 stores in California, 16 stores in
Louisiana, 15 stores in Arizona, and 80 stores across 11 other
states. Depending on location, our financial services store
locations in the United States offer some or all of a range of
financial products and services, including short-term
single-payment consumer loans, check cashing, Western Union
money transfer products, prepaid debit cards, gold buying and
other ancillary services. We operate our stores in the United
States primarily under the trade names “Money Mart”
and, in Florida, “The Check Cashing Store”.
In addition to our network of storefront retail financial
services stores in the United States, we also offer our branded
Military Installment Loan and Education Services, or MILES,
program. Through the MILES program, we provide fee-based
services primarily to junior enlisted military personnel seeking
to purchase new and used vehicles, including access to loans
through an agreement with a major third-party national bank and
other ancillary products and services including service
contracts and guaranteed asset protection (GAP) insurance. The
MILES program operates through an established network with
approximately 690 franchised and independent new and used car
dealerships, in 25 states, that are in close proximity to
significant military installations in the United States.
Notwithstanding this extensive presence, we believe that there
are opportunities to expand the MILES program geographically, to
increase its penetration in certain markets, to expand its
product offerings and to increase its penetration with more
tenured enlisted military personnel with higher pay grade levels.
Our
Strategy
Our business strategy is designed to capitalize on our
competitive strengths and enhance our leading position in each
of the markets in which we operate, to enter new markets and to
strengthen our overall business. Key elements of our strategy
include:
Growth through Disciplined Expansion and
Acquisition Since 1990, we have completed
more than 100 acquisitions worldwide that have added over
800 company-owned financial services stores to our network,
as well as new products, lending and other services platforms
and expansion into additional countries, generally with a
continuing focus on serving the service sector workforce, small
businesses and under-banked consumers generally. We intend to
continue to grow our network through the addition of new stores
and acquisitions and expansion of our financial services
platforms, including fee based processing and origination
services, while adhering to a disciplined selection process. We
seek to carefully assess potential markets by analyzing
demographic, competitive and regulatory factors, site selection
and availability and growth potential. With respect to our core
financial services businesses in Canada and the United Kingdom
in particular, we intend to continue to add new storefront
locations during fiscal 2012 and beyond that offer consumer
lending, secured pawn lending, check cashing, debit cards,
foreign currency, Western Union money transfer and money order
products, gold buying and other services, or a combination of
any of these products and services.
In addition to expanding our existing networks of financial
services stores in Canada and Europe, we also intend to continue
our efforts both to expand our business geographically as well
as to diversify into new business lines and financial platform
delivery methods that complement our existing businesses, or
that otherwise present an opportunity to leverage our knowledge
of our core customer segments. With our fiscal 2009 acquisition
of a U.K.-based online consumer lending platform and our
acquisitions of MEM in April 2011 and Risicum in July 2011, we
leveraged our credit analytics knowledge and technology
capabilities and increased our expertise within the Internet
lending arena, which expertise we believe can be leveraged and
exported to other European countries as well as to Canada. As a
result of these
6
acquisitions, we are now the leading provider of short-term
single-payment consumer loans via the Internet, mobile phone and
other remote platforms in the United Kingdom and Finland.
We also continue to explore, and when appropriate, enter, new
markets. By acquiring Sefina, we believe that we will be able to
apply our collective knowledge from our secured pawn lending
activities in the United Kingdom to Scandinavia, where Sefina is
already the largest pawn lender in the market, to continue to
increase Sefina’s business both within its existing markets
as well as to other markets in Europe. In fiscal 2009, we
entered the Eastern European market with our acquisition of a
controlling interest in Poland-based Optima, which specializes
in consumer installment loans, and have since opened three
retail financial services stores in Poland. Poland has a
population of nearly 40 million people, with a significant
percentage of the population currently underserved by the
traditional banking industry. The demographics of neighboring
Eastern European countries are similar to that of Poland, with
the entire population of Eastern Europe approaching
200 million people across several countries, a significant
percentage of which resides in urban-industrial areas. We
believe that our initial investments and experience in Poland
will provide a platform for further expansion throughout Poland
and other Eastern European countries.
With our acquisition of Dealers’ Financial Services, LLC
and its MILES program in December 2009, we diversified into a
fee-based business that operates in a different market than our
core retail financial services stores, yet adheres to our core
focus of serving credit-challenged individuals. Revenue from the
MILES program comes both from fees which are paid by a major
third-party national bank and fees from auto dealers as well as
from fees generated by the sale of ancillary products such as
warranty service contracts and GAP insurance coverage. At
present, the MILES program is solely focused on providing
services to U.S. enlisted military personnel applying for
auto loans to purchase new and late model used vehicles. We
believe we can leverage MILES existing dealership network and
lending platform to other similar customer segments through
several planned proprietary strategic growth initiatives.
Introduction of Related Products and
Services We offer a wide range of consumer
financial products and services, and employ different channels
to provide those products and services, designed to meet the
demands of our customers in each of the markets in which we do
business, including short-term single-payment consumer loans,
secured pawn lending, check cashing, gold buying and Western
Union money transfer services. To supplement these core
products, we seek to provide high-value ancillary products and
services, including foreign currency exchange, reloadable VISA
and MasterCard brand prepaid debit cards, electronic tax filing
and bill payment. These products and services enable our
customers to manage their personal finances more effectively,
and we continue to expand our service offerings to our
customers. For example, during fiscal 2009, we began providing
gold buying services in the United Kingdom, and expanded these
services to Canada and the United States in fiscal 2010. In
fiscal 2011, we entered into partnerships with two cell phone
providers for sales of pre-paid cellular phones in our retail
stores in Canada. Our broad product and geographic mix provides
a diverse stream of revenue growth opportunities that we believe
distinguishes us from others in our industry.
Capitalizing on our Enhanced Network and System
Capabilities With our networks of stores
across Canada, the United Kingdom, the Republic of Ireland, the
United States, Sweden, Finland and Poland, we believe that we
are well-positioned to capitalize on economies of scale. Our
centralized core support functions, including credit analytics,
collections, call centers, field operations and service, loan
processing and tax filing, enable us to generate efficiencies by
improving collections and leveraging purchasing power with our
vendors. We use our proprietary systems to support our customer
relations, consumer lending and loan servicing activities, as
well as to provide an efficient means to manage our internal
reporting requirements and regulatory compliance activities. We
plan to continue to take advantage of these efficiencies to
further enhance our network and store-level profitability.
Furthermore, we intend to leverage these capabilities and
efficiencies into online, telephony, and other delivery
platforms for our products.
7
Maintaining our Customer-Driven Retail
Philosophy We strive to maintain our
customer-service-oriented approach and to meet the basic and
diversified financial service needs of our customers. We believe
our approach differentiates us from many of our competitors and
is a key tenet of our employee training programs. We offer
extended operating hours in clean, attractive and secure store
locations to enhance appeal and stimulate store traffic. In
certain locations, we operate stores that are open 24 hours
a day. Our online operations offer customers additional access
to our short-term single-payment loan products. To ensure
customer satisfaction, we periodically send anonymous market
researchers posing as shoppers to our stores to measure customer
service performance. We intend to continue to develop ways to
improve our performance, including incentive programs that
reward employees for exceptional customer service.
Community Involvement, Ethics and Customer
Education We believe that we strengthen our
relationships with our business partners through ethical
behavior and with our customers through community involvement.
We encourage the management of each of our retail stores and
business units to involve themselves with their respective local
communities. During fiscal 2011, our global business units
contributed approximately $1.0 million in charitable
contributions, including over $0.3 million to the Japan
tsunami relief effort and over $0.5 million to various
children’s health and welfare organizations.
We believe that it is our responsibility, and in the best
interests of our company and our customers, to provide our
customers guidance on financial matters and education about our
products and services. As a part of our commitment to the
long-term financial health of our customers, we encourage our
customers to contact our consumer education department for
guidance or to report any concerns related to our company loan
and other products. We have undertaken consumer education
initiatives to advance and support financial education and
literacy programs in the communities that we serve, as well as
to promote responsible use of our products. Core components of
the program include consumer brochures, social media posts,
non-profit and charitable grant offerings to support financial
education programs, free on-line financial literacy training,
and the creation of a consumer education section on our websites.
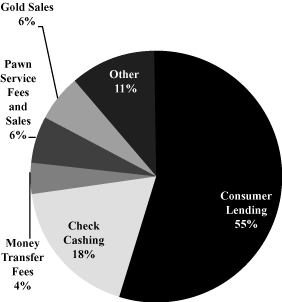
Our
Products and Services
The following chart illustrates our consolidated revenue from
each of our products and services, as a percentage of total
consolidated revenue, for fiscal 2011:
For more information regarding our revenue by product, please
see “Item 7. Management’s Discussion and
Analysis of Financial Condition and Results of
Operation” and “Item 8. Financial
Statements and Supplementary Data” in this Annual
Report on
Form 10-K.
8
Short-Term
Single Payment Loans
We originate unsecured, single-payment short-term consumer loans
at most of our retail financial service locations in Canada, the
United Kingdom and the United States. We bear the entire risk of
loss related to these loans. We originated approximately
$1.8 billion of short-term single-payment consumer loans
during fiscal 2010 and approximately $2.2 billion during
fiscal 2011.
Our single-payment short-term consumer loan products provide
customers with cash in exchange for a promissory note or other
repayment agreement supported, in most cases, by the
customer’s personal check or an authorization to debit the
customer’s bank account via an Automated Clearing House
(ACH) or similar transaction for the amount due. The customer
may repay the loan in cash or by allowing the check to be
presented for collection by manual deposit or an electronic
debit to the customer’s bank account for the amount due. In
Canada, single-payment short-term consumer loans are issued to
qualified borrowers based on a percentage of the borrowers’
income in amounts up to CAD 1,500, with typical repayment terms
of 1 to 35 days. We issue single payment short-term
consumer loans in the United Kingdom for up to GBP 750, with a
maximum term of 30 days. In the United States, these loans
are made for amounts up to $1,000, with terms of 7 to
45 days.
We also offer short-term single-payment consumer loans via the
Internet in the United Kingdom, in the provinces of Ontario and
Alberta, Canada, and, as a result of our recent acquisition of
Risicum Oyj, in Finland and Sweden. Internet-originated loans
are predominantly made by directing the customer to one of our
websites, generally through direct online marketing. Once at the
website, the customer completes an online application for a loan
by providing his or her name, address, employment information,
desired loan amount and bank account information. The
information is automatically screened for fraud and other
indicators and, based on this information, an application is
approved or declined. In some cases, additional information may
be required from the applicant prior to making a loan decision.
Once a loan is approved, the customer agrees to the terms of the
loan and the amount borrowed is directly deposited into the
customer’s bank account.
In addition to our lending activities in Canada, the United
Kingdom and the United States, we offer unsecured loans in
Poland of generally 40 to 50 week durations with average
loan amounts of $250 to $500. The loan transaction includes a
convenient in-home servicing feature, whereby loan disbursement
and collection activities take place in the customer’s home
according to a mutually agreed upon and pre-arranged schedule.
The in-home loan servicing concept is well-established and
accepted within Poland and Eastern Europe, and was initially
established in Britain nearly a century ago. Customer sales and
service activities are managed through an extensive network of
local commission based representatives and market managers
across ten provinces in western Poland.
Because our revenue from our global consumer lending activities
is generated through a high volume of small-dollar financial
transactions, our exposure to loss from a single customer
transaction is minimal. Collection activities are, however, an
important aspect of our global operations, particularly with
respect to our unsecured short-term single-payment consumer loan
products due to the number of unpaid balances beyond stated
terms. We have instituted control mechanisms and a credit
analytics function that have been very effective in managing
risk in our unsecured consumer lending activities. We operate
centralized collection centers to coordinate a consistent
approach to customer service and collections in each of our
markets. Our risk control mechanisms include, among others, the
daily monitoring of initial return rates with respect to
payments made on our unsecured short-term consumer loan
portfolio. We have also implemented proprietary predictive
scoring models that are designed to limit the amount of
unsecured short-term loans we offer to customers who
statistically would likely be unable to repay their loan. As a
result, we believe that we are less likely to sustain a
significant credit loss from a series of transactions or launch
of a new product.
We had approximately $100.9 million and $161.9 million
of net unsecured consumer loans outstanding as of June 30,
2010 and 2011, respectively. These amounts are reflected on our
audited balance sheets included elsewhere in this Annual Report
on
Form 10-K
as consumer loans, net. Consumer loans, net at June 30,
2010 and 2011 are reported net of a reserve of
$10.4 million and $14.9 million, respectively, related
to consumer lending. Loans in default as of June 30, 2010
was $9.3 million, net of a $21.8 million allowance,
and was $13.8 million, net of a $37.7 million
allowance at June 30, 2011. See “Management’s
Discussion and Analysis
9
of Financial Conditions and Results of Operations”
and “Item 8. Financial Statements and Supplementary
Data — Note 2” in this Annual Report on
Form 10-K
for more information regarding our consumer loan loss reserve
policy.
Secured
Pawn Lending
We offer secured pawn loans through our retail stores in Sweden
and Finland and at most of our retail financial services
locations in the United Kingdom. We also operate two traditional
pawn shops in Edinburgh and Glasgow, Scotland, and three
high-end pawn shops in London, England specializing in high
value gold jewelry, watches and diamonds. For fiscal 2010 and
fiscal 2011, we generated total revenues from secured pawn
lending of $19.9 million and $48.0 million,
respectively.
When receiving a pawn loan, a customer pledges personal property
to us as security for the loan. We deliver a pawn transaction
agreement to the customer, along with the proceeds of the loan.
The customer agrees to pay a finance and service charge to
compensate us for the use of the funds loaned and to cover
direct operating expenses related to the pawn transaction. The
finance and service charge is typically calculated as a
percentage of the pawn loan amount based on the size and
duration of the transaction, as permitted by applicable law. If
the customer does not repay the loan and redeem the property,
the customer forfeits the property to us, and we dispose of the
property. We do not have recourse against the customer for the
pawn loan. We rely on the disposition of the pawned property to
recover the principal amount of an unpaid loan, plus a yield on
the investment. As a result, the customer’s
creditworthiness is not a significant factor in the loan
decision, and a decision not to redeem pawned property does not
affect the customer’s personal credit status.
Depending on location, we estimate that 80% to 100% of the items
pawned to us are gold-based items, such as jewelry, and have a
per item fair value of approximately $600-$1,000, with the
exception of our Suttons and Robertson’s business in
London, which accepts pledges that are significantly in excess
of that amount, with fair values of up to GBP 1.0 million.
We have in-store testing equipment to evaluate the purity and
weight of the gold items presented for pawn which we believe
allows us to obtain a higher level of certainty regarding the
pledged item’s fair value. The amount actually loaned in a
pawn lending transaction is based on the fair value of the
pledged item, and is generally 50% to 80% of the appraised fair
value of the pledged item. This variability is due to a variety
of factors, including the potential for decreases in the
appraised value and individual market conditions. The average
term of a pawn loan is six months or less.
Our historical redemption rate on pawn loans is in excess of
85%, which means that for more than 85% of our pawn loans, the
customer pays back the amount borrowed, plus interest and fees,
and we return the pledged item to the customer. In the instance
where the customer fails to reclaim his or her property by
repaying the loan, the pledged item is, within several weeks of
the customer’s default, sold at auction or to a smelter, or
offered for sale in our retail stores or through wholesalers. To
the extent that the amount received upon such sale is in excess
of the original loan principal plus accrued interest and fees,
we return that excess amount received over and above our
recorded asset to the customer in accordance with applicable law.
Check
Cashing
Customers may cash all types of checks at our check cashing
locations, including payroll checks, insurance proceeds checks,
government checks and personal checks. In exchange for a
verified check, customers receive cash immediately and do not
have to wait several days for the check to clear a bank. Before
we distribute cash, we verify both the customer’s
identification and the validity of the check, occasionally using
multiple sources, as required by our standard verification
procedures. Customers are charged a fee for this service, which
is typically calculated as a percentage of the face value of the
check. The fee varies depending on the size and type of check
cashed as well as the customer’s check cashing history at
our stores.
In recent years, the number and aggregate face value of checks
that we have cashed at our stores has declined in all of our
geographical core markets. Studies by the Federal Reserve Board
and others suggest that payments made by electronic means may be
displacing a portion of the paper checks traditionally cashed by
our customers. Moreover, we believe that the recent global
economic downturn, which has affected all of the
10
countries in which we operate, and continuing high unemployment
rates, have significantly contributed to the decline in our
check cashing business. In response to these developments, we
have increasingly focused on cashing payroll and commercial
checks, which tend to have higher face values and therefore
result in higher check cashing fees than government checks.
Other
Retail Services and Products
In addition to short-term consumer loans, secured pawn lending
and check cashing services, we offer our customers a variety of
financial and other products and services at our retail
financial services locations. These services, which vary from
store to store, include Western Union money order and money
transfer products, gold buying, foreign currency exchange, VISA
and MasterCard branded reloadable debit cards, electronic tax
filing, bill payment and prepaid local and long-distance phone
services. Among our most significant other financial services
products and services are:
Money Transfers. Through a strategic alliance
with Western Union in Canada, the United Kingdom, the United
States and Poland, our customers can transfer funds to any
location in the world providing Western Union money transfer
services. Western Union currently has approximately 430,000
agents in more than 200 countries throughout the world. We
receive a percentage of the commission charged by Western Union
for each money transfer transaction. For fiscal 2010 and fiscal
2011, we generated revenue from money transfers of
$27.5 million and $32.1 million, respectively,
primarily at our financial services stores in Canada, the United
Kingdom and the United States.
Gold Purchasing. In a majority of our retail
financial services stores, we purchase gold and other precious
metals from customers, typically in the form of jewelry, and
sell these items to smelters or other third parties or, in the
case of jewelry and other marketable items, offer them for
retail sale in certain of our stores. For fiscal 2010 and fiscal
2011, we generated revenue from gold and other metals purchases
of $43.0 million and $46.5 million, respectively.
Foreign Currency Exchange. We offer customers
foreign exchange services in many of our retail financial
services stores. We derive foreign currency exchange revenues
through the charging of a transaction fee, as well as from the
margin earned from purchasing foreign currency at wholesale
exchange rates and selling foreign currency to customers at
retail exchange rates. For fiscal 2010 and fiscal 2011, we
generated revenue from foreign currency exchange of
$14.4 million and $17.5 million, respectively.
Prepaid Debit Cards. We offer prepaid Visa and
MasterCard branded debit cards in Canada, the United Kingdom and
the United States as an agent for third party issuing banks. For
fiscal 2010 and fiscal 2011, we generated revenue from prepaid
debit card sales of $13.2 million and $17.1 million,
respectively.
MILES
Program
Through our MILES program, we provide fee based services to
enlisted U.S. military personnel applying for auto loans to
purchase new and late-model,
low-mileage
used vehicles that are funded and serviced under an exclusive
agreement with a major third-party national bank. Our partner
third-party national bank approves the loans, funds and
maintains the loan portfolio on its balance sheet, and bears any
risk of repayment default. We derive revenue from the fees
related to the loan application, an interest rate spread between
the rate that the third-party lender receives and the rate that
the borrower pays and fees from the auto dealers, as well as
commission fees from the sale of warranty service contracts and
GAP insurance coverage.
The MILES program operates through an established network of
approximately 690 franchised and independent new and used car
dealerships according to underwriting protocols specified by the
major third-party bank lender and servicer. We maintain
relationships with this network of car dealerships through an
experienced group of local sales representatives. To be part of
the MILES network, dealerships must first be certified by us and
agree to comply with a number of vehicle quality and sale
stipulations. In particular, the
11
vehicle being financed by the bank lender through the MILES
program must be less than five years old, have fewer than
75,000 miles on the odometer and pass a comprehensive
quality inspection.
The bank lender’s unique underwriting standards and the
ability to purchase service contracts and GAP insurance policies
at a discount are designed to help insulate the borrower from
events that typically lead to a loan default. GAP insurance
covers the difference between the outstanding loan amount and
the retail value of the automobile, in the event the vehicle is
classified as a “total loss” due to unforeseen events
such as a collision, mechanical failure or theft. As part of the
MILES program, the borrower is also required to complete, at no
charge, an educational course administered by us covering such
topics as credit counseling, personal budgeting, and vehicle
purchase and maintenance training.
Operations
Facilities
and Hours of Operation
As part of our retail and customer-driven strategy, we seek to
present a clean, attractive and secure environment, and an
appealing format for our retail financial services stores. We
follow a set of market survey and location guidelines when
selecting store sites in order to ensure that our stores are
placed in desirable locations near our core customers. Size
varies by location, but our stores are generally 1,000 to
1,400 square feet, with approximately half of that space
allocated to the customer service representative and back office
areas. Operating hours vary by location, but are typically
extended and designed to cater to those customers who, due to
work schedules, cannot make use of “normal” banking
hours. In certain locations, we operate stores, seven days per
week and twenty-four hours a day. Furthermore, our online and
other remote platforms offer our customers additional access to
our short-term single-payment loan products.
Structure
Our senior management resides at our corporate headquarters in
Berwyn, Pennsylvania, and is responsible for our overall
strategic direction. This corporate staff includes our global
executive management, global strategy, global business
development and acquisitions, corporate finance, investor
relations, global compensation and benefits, global credit,
technology,
e-commerce
and legal functions, as well as global compliance functions,
including internal audit, risk management, and privacy. We also
maintain administrative offices in each of the geographical
markets in which we operate. We maintain separate management and
store support operations and other centralized functions such as
information systems, treasury, accounting, human resources, loss
prevention and marketing for each of the countries in which we
operate.
We maintain, in each country in which we operate a network of
stores, a store-management organization that is responsible for
the
day-to-day
operations of the retail financial services stores in that
country. District managers are directly responsible for the
oversight of our store managers and store operations. Typically,
each district manager oversees eight to ten stores. Each
district manager reports to a regional vice president who
typically supervises approximately five district managers. The
regional vice presidents report to the head of operations in
each of our divisional corporate offices.
We have centralized facilities in Canada, the United Kingdom,
the United States, Scandinavia and Poland to support our
consumer lending activities in each of those countries. Our
staff at each of these locations performs inbound and outbound
customer service for current and prospective consumer loan
customers, including collections for past-due consumer loans.
Our management at these facilities includes experienced
call-center operations, customer service, information technology
and collections personnel. We believe that these centralized
facilities have helped us both to improve our loan servicing
significantly and to reduce credit losses on loans originated by
us, and significantly enhances our ability to manage the
compliance responsibilities related to our consumer lending
operations in the markets in which we operate. We believe that
our ongoing investment in, and organization-wide focus on, our
compliance practices provides us with a competitive advantage
relative to many other companies in our industry.
12
Technology
We maintain an enterprise-wide transaction processing computer
network. We believe that this system improves our customer
service by reducing transaction time and allows us both to
manage our loan-collection efforts and returned-check losses
better and to comply with regulatory recordkeeping and reporting
requirements.
We continue to enhance our
point-of-sale
transaction processing systems, which are composed of a
networked hardware and software package with integrated database
and reporting capabilities. Our
point-of-sale
systems provide our stores with instantaneous customer
information, thereby reducing transaction time and improving the
efficiency of our credit-verification and check cashing
processes. We also utilize an enhanced centralized
loan-management and collection system that provides improved
customer service processing and management of loan transactions.
The loan-management system and collection system uses integrated
automated clearinghouse payment and returns processing, which
facilitates faster notification of returns and faster clearing
of funds as well as utilizing fax server document-processing
technology to reduce both processing and loan-closing times. Our
point-of-sale
systems, together with the loan-management and collection
systems, have enhanced our ability to offer new products and
services and overall customer service.
Security
Robbery and employee theft are significant operational risks
that we face. We have sought to deploy extensive security and
surveillance systems, dedicated loss prevention and security
personnel and management information systems throughout our
operations to address areas of potential risk. We believe that
our systems are among the most effective in our industry.
Accordingly, net security losses represented 0.3% and 0.2% of
total revenues for fiscal 2010 and fiscal 2011, respectively.
To protect against robbery, most store employees work behind
bullet-resistant glass and steel partitions, with back office,
safe and computer areas locked and closed to customers. Security
measures in each of our stores include safes, electronic alarm
systems monitored by third parties, control over entry to teller
areas, detection of entry through perimeter openings, walls, and
ceilings and tracking of all employee movement in and out of
secured areas. Employees use devices to ensure safety and
security whenever they are outside the secure teller area.
Additional security measures include sophisticated alarm
systems, remote control over alarm systems, arming/disarming and
changing user codes and mechanically and electronically
controlled time-delay safes. Because we handle cash and
negotiable instruments at our locations, daily monitoring, an
internal auditing program including periodic unannounced store
audits and cash counts at randomly selected locations, and
immediate responses to irregularities are employed by us in
combating defalcations.
Advertising
and Marketing
We employ a variety of media to advertise the products and
services that we offer in our financial services stores and
online, including point of purchase and in-store promotions,
mass media including television and radio advertisements,
electronic media including text messaging,
e-mail
campaigns, search engine marketing and web site marketing, and
community activities, which we believe allows us to become a
trusted part of the community with locally designed and executed
programs like charity fundraisers and sponsorship of community
events. The nature and type of advertising employed differs by
geographical market and the products we are seeking to
emphasize. Our in-store and online transaction databases allow
us to develop direct marketing strategies to communicate to
existing customers and prospective customers who have similar
demographic characteristics. We actively measure and conduct
testing of our advertising programs to ensure we achieve a
positive return on investment.
Proprietary
Rights
We hold the rights to a variety of service marks relating to the
financial services that we provide in our financial services
stores and in our other businesses. In addition, we maintain
service marks relating to the various names under which our
stores operate. Our registered trademarks include Money
Mart®,
The Money
Shop®,
Insta-Cheques®,
Check
Mart®,
The Check Cashing
Store®,
Cash ‘Til
Payday®,
CustomCash®,
13
Momentum®,
Payday
Express®,
Month End
Money®,
Payday
UK®,
Sefina®,
Helsingin
Panttism,
Cheque In Cash
Out®,
Real People. Fast
Cash®,
EasyTax®,
Zap-It®,
Fast Cash
Advance®,
CC®,
optima®,
mce®,
Business Cash
Advance®,
Suttons and
Robertson®,
Money Now!
®,
Risicum®,
OK
Money®
and
MILES®.
Franchises
As of June 30, 2011, we had 22 franchise locations in
Canada and 49 in the United Kingdom. These franchised locations
are subject to franchise agreements with us that have varying
durations and have been negotiated individually with each
franchisee. We are not actively marketing franchises in any of
our markets.
Employees
As of June 30, 2011, we employed approximately
5,375 persons worldwide, consisting of 764 persons in
our accounting, management information systems, legal, human
resources, treasury, finance and administrative departments, and
4,610 persons in our retail stores and online operations
and other operational functions, including customer service
representatives, store managers, regional supervisors,
operations directors and store administrative personnel. Other
than a small number of our employees in Europe, none of our
employees are represented by a labor union, and we believe that
our relations with all of our employees are good.
Seasonality
Our business is somewhat seasonal primarily due to the impact of
several tax-related service offerings, including cashing tax
refund checks, making electronic tax filings and processing
applications of refund anticipation loans in Canada.
Historically, we have generally experienced our highest revenues
and earnings during our third fiscal quarter ending
March 31, when revenues from these tax-related services
peak. Due to the seasonality of our business, results of
operations for any fiscal quarter are not necessarily indicative
of the results of operations that may be achieved for the full
fiscal year. In addition, quarterly results of operations depend
significantly upon the timing and amount of revenues and
expenses associated with the addition of new stores.
Competition
We face significant competition in each of the countries in
which we operate, and for each of the services and products that
we offer in those countries. Our industry includes companies
that offer automated check cashing machines and franchised kiosk
units that provide check cashing and money order services to
customers, which can be located in places such as convenience
stores, bank lobbies, grocery stores, discount retailers and
shopping malls. We believe that, ultimately, convenience, hours
of operations, accessibility and other aspects of customer
service are the principal factors influencing customers’
selection of a financial services company in our industry, and
that the pricing of products and services is a secondary
consideration.
Because we currently operate in seven countries, and intend to
enter into additional markets, we face different competitive
conditions across our operations. Competition is driven in part
by the demographics of the potential customer base in each
market, laws and regulations affecting the products and services
we offer in a particular country or regional jurisdiction,
platforms from which services are provided, and socio-economic
factors present in each market.
The finalization of provincial regulations in Canada for
single-payment short-term consumer loans has caused certain
existing competitors to expand their operations and some
U.S.-based
competitors have begun to enter the Canadian market.
Notwithstanding this increased competition, we believe that the
regulations adopted by a majority of the Canadian provinces in
which we do business, including Ontario, British Columbia and
Alberta, present an opportunity to leverage our multi-product
platform and to improve our share of the Canadian market by
continuing to offer the lowest product pricing as compared to
our competitors.
Recent research indicates that the U.K. market for small,
short-term single-payment loans is served by approximately 1,200
store locations, which include check cashers, pawn brokers and
home-collected credit companies, in addition to approximately 20
on-line lenders.
14
In Sweden, we believe that the market for pawn lending currently
includes approximately 50 stores. We believe the Finnish
pawn lending industry comprises approximately 30 stores, as well
as 10 to 20 Internet lending competitors.
In the United States, our industry is highly fragmented.
According to Financial Service Centers of America, Inc., there
are approximately 7,000 neighborhood check cashing stores
and, according to published equity research estimates by
Stephens Inc., there are approximately 22,000 short-term
lending stores. There are several public companies in the United
States with large networks of stores offering single-payment
consumer loans, as well as several large pawn shop chains
offering such loans in their store networks in the United
States. Like check cashing, there are also many local chains and
single-unit
operators offering single-payment consumer loans as their
principal business product.
In addition to other check cashing stores and consumer lending
stores and financial services platforms in each of the countries
in which we operate, our competitors include banks and other
financial services entities, as well as retail businesses, such
as grocery and liquor stores, which often cash checks for their
customers. Some competitors, primarily grocery stores, do not
charge a fee to cash a check. However, these merchants generally
provide this service to certain customers with solid credit
ratings or for checks issued by highly recognized companies, or
those written on the customer’s account and made payable to
the store.
Regulation
We are subject to regulation by foreign, federal and state
governments that affects the products and services we provide.
In general, this regulation is designed to protect consumers who
deal with us and not to protect the holders of our securities,
including our common stock. In particular, we are subject to the
regulations described below as well as regulations governing
currency reporting, privacy and other matters described
elsewhere in this Annual Report on Form
10-K,
including under “Item 1A — Risk
Factors”.
Consumer
Lending
Prior to 2007, our consumer lending activities in Canada were
subject to a federal usury ceiling and provincial licensing in
certain provinces. Effective May 3, 2007, the Canadian
Parliament amended the federal usury law to permit each province
to assume jurisdiction over, and the development of, laws and
regulations of short-term single-payment consumer loan products
such as ours. To date, the provinces of British Columbia,
Alberta, Saskatchewan, Manitoba, Ontario and Nova Scotia have
passed legislation regulating short-term single-payment consumer
lenders and each has, or is in the process of, adopting
regulations and rates consistent with those laws. In general,
these regulations require lenders to be licensed, set maximum
limits on the charges to the consumer for a loan and regulate
collection practices. We believe that the short-term
single-payment consumer loan products that we currently offer in
each regulated province conform to the applicable regulations of
such province. We do not offer short-term single-payment
consumer loans in Quebec or Newfoundland.
In the United Kingdom, consumer lending is governed by the
Consumer Credit Act of 1974, and related rules and regulations.
As required by the Consumer Credit Act of 1974, we have obtained
licenses from the Office of Fair Trading, which is responsible
for regulating competition, policy, and for consumer protection.
The Consumer Credit Act of 1974 also contains rules regarding
the presentation, form and content of loan agreements, including
statutory warnings and the layout of financial information.
Beginning July 31, 2009, The Money Laundering Regulations
2007 were enhanced to include consumer credit lenders, and all
consumer credit lenders not authorized by the Financial Services
Authority or HM Revenue and Customs as a Money Service Business
are now required to register with the Office of Fair Trading. We
believe that we have complied with these regulations where we
were not already registered by HM Revenue and Customs.
Short-term single-payment consumer loan products are subject to
a variety of regulations at the federal, state and local levels
in the United States. Currently, short-term single-payment
consumer loan products are primarily regulated at the state
level. Several states prohibit certain short-term single-payment
consumer loan products and, as a result, we only offer check
cashing and other non-loan products in those states. In other
states in which operate, applicable laws and regulations
typically limit the principal amount that we may offer
15
and the maximum fees that we may charge on our short-term
single-payment consumer loans. Some states also limit a
customer’s ability to renew an advance and otherwise
require certain consumer disclosures. These regulations in many
cases also specify minimum and maximum maturity dates and, in
some case, impose mandatory “cooling off” periods
between transactions. We believe that our short-term
single-payment consumer loan products are in compliance with the
applicable laws and regulations of the states in which we offer
such products.
At the federal level, the
Truth-in-Lending
Act, the Equal Credit Opportunity Act, the Fair Credit Reporting
Act, the Fair Debt Collection Practices Act, and the
Gramm-Leach-Bliley Act, and the regulations promulgated pursuant
to each, impact our short-term loan products. Among other
things, these laws and regulations require disclosure of the
principal terms of each transaction to every customer, including
the dollar amount of finance charges and the applicable imputed
annual percentage rate, prohibit false or misleading
advertising, prohibit discriminatory lending practices and
prohibit unfair credit practices.
On July 21, 2010, President Obama in the United States
signed into law the Consumer Financial Protection Act of 2010
which, among other things, created a federal Bureau of Consumer
Protection with regulatory jurisdiction over large
non-depository financial companies, including us. Under this
law, the Bureau of Consumer Protection has broad authority to
prescribe regulations over what it determines to be unfair,
deceptive or abusive practices, including the ability to curtail
or make unlawful any products falling within its regulatory
authority. We cannot predict what, if any, action the Bureau of
Consumer Protection might take with respect to short-term
single-payment consumer loans.
Short-term single-payment consumer loans have also been the
subject of several other proposed bills in the U.S. House
and Senate that would impose limits on the interest and fees on
such products. To date, none of these bills have moved past
committee review.
In addition to state and federal laws and regulations, we are
also subject to various local rules and regulations such as
local zoning regulations and licensing requirements. These local
rules and regulations are subject to change and vary by location.
Check
Cashing
In Canada, the federal government generally does not regulate
check cashing activities, nor do the provincial governments
generally impose any regulations specific to the check cashing
industry. The exceptions are the provinces of Québec and
Saskatchewan, where check cashing stores are not permitted to
charge a fee to cash government checks, and Manitoba, where the
province imposes a maximum fee to cash government checks.
In the United Kingdom, as a result of the Cheques Act of 1992,
banks must refund the fraudulent or dishonest checks that they
clear to the maker. For this reason, banks have invoked more
stringent credit inspection and indemnity criteria for
businesses such as ours. Additionally, in 2003, the Money
Laundering Regulations of 1993 were enhanced, requiring check
cashing, money transfer and foreign currency exchange providers
to be licensed, and in 2007, they were further enhanced to
require background checks of persons running such businesses as
a requirement of granting a license. We believe that we
currently comply with these rules and regulations.
To date, regulation of check cashing fees in the United States
has occurred on the state level. We are currently subject to fee
regulation in seven states in which we operate: Arizona,
California, Hawaii, Louisiana, Ohio, Pennsylvania and Florida,
where regulations set maximum fees for cashing various types of
checks. Our check cashing fees comply with applicable state
regulations. Some states, including California, Ohio,
Pennsylvania and Washington, have enacted licensing requirements
for check cashing stores. Other states, including Ohio, require
the conspicuous posting of the fees charged by each store. A
number of states have also imposed recordkeeping requirements,
while other states require check cashing stores to file fee
schedules with state regulators.
16
Currency
Reporting
The Financial Transactions and Reports Analysis Centre of Canada
is responsible for ensuring that money services businesses
comply with the legislative requirements of the Proceeds of
Crime (Money Laundering) and Terrorist Financing Act. The
Proceeds of Crime (Money Laundering) and Terrorist Financing Act
requires the reporting of large cash transactions involving
amounts of $10,000 or more received in cash and international
electronic funds transfer requests of $10,000 or more. This act
also requires submitting suspicious transactions reports where
there are reasonable grounds to suspect that a transaction is
related to the commission of a money laundering offense or to
the financing of a terrorist activity. We believe that we are in
compliance with the requirements of the Proceeds of Crime (Money
Laundering) and Terrorist Financing Act.
The Terrorism Act of 2000 and the Proceeds of Crime Act 2002
expanded, reformed and consolidated the United Kingdom’s
criminal money laundering offenses. The Money Laundering
Regulations of 2003 impose certain reporting and record keeping
requirements on persons and businesses in the regulated sector.
Her Majesty’s Revenue and Customs has the responsibility
for enforcing the regulations. The regulations require that
identity is taken for any person carrying out single or multiple
foreign exchange transactions exceeding the GBP equivalent of
EUR 15,000 and for the cashing of any third-party check, in
any amount. Additionally, regulations require the submission of
suspicious transaction reports to the Serious Organized Crime
Agency whenever there is a transaction which is inconsistent
with a customer’s known legitimate business activities or
with normal business for that type of account. We have existing
procedures to remain in compliance with these requirements and
believe that we are in compliance with these regulatory
requirements.
Regulations promulgated by the U.S. Treasury Department
under the Bank Secrecy Act require reporting of transactions
involving currency in an amount greater than $10,000, and
maintenance of records regarding the purchase of money orders
and wire transfers for cash in amounts from $3,000 to $10,000.
In general, every financial institution must report each
deposit, withdrawal, exchange of currency or other payment or
transfer that involves currency in an amount greater than
$10,000. In addition, multiple currency transactions must be
treated as a single transaction if the financial institution has
knowledge that the transactions are by, or on behalf of, any one
person and result in either cash in or cash out totaling more
than $10,000 during any one business day. We believe that our
point-of-sale
system and employee training programs support our compliance
with these regulatory requirements.
Also, money services businesses are required by the Money
Laundering Suppression Act of 1994 to register with the
U.S. Treasury Department. Money services businesses include
check cashers and sellers of money orders. Money services
businesses must renew their registrations every two years,
maintain a list of their agents, update the agent list annually
and make the agent list available for examination. In addition,
the Bank Secrecy Act requires money services businesses to file
a Suspicious Activity Report for any transaction conducted or
attempted involving amounts individually or in total equaling
$2,000 or greater, when the money services businesses knows or
suspects that the transaction involves funds derived from an
illegal activity, the transaction is designed to evade the
requirements of the Bank Secrecy Act or the transaction is
considered so unusual that there appears to be no reasonable
explanation for the transaction. The Uniting and Strengthening
America by Providing Appropriate Tools Required to Intercept and
Obstruct Terrorism Act of 2001, or the PATRIOT Act, includes a
number of anti-money-laundering measures designed to assist in
the identification and seizure of terrorist funds, including
provisions that directly impact check cashers and other money
services businesses. Specifically, the PATRIOT Act requires all
check cashers to establish certain programs designed to detect
and report money laundering activities to law enforcement. We
believe we are in compliance with the PATRIOT Act. The
U.S. Treasury Department’s Office of Foreign Assets
Control administers economic sanctions and embargo programs that
require assets and transactions involving target countries and
their nationals (referred to as “specially designated
nationals and blocked persons”) be frozen. We maintain
procedures to assure compliance with these requirements.
17
Privacy
of Personal Information
We are subject to a variety of state, federal and foreign laws
and regulations restricting the use and seeking to protect the
confidentiality of identifying and other personal consumer
information. We believe that the procedures and systems that we
maintain safeguard such information as required.
Corporate
Information
DFC Global Corp. is a Delaware corporation formed in 1990. Prior
to August 2011, our corporate name was “Dollar Financial
Corp.”. We operate our store networks and Internet
businesses through our direct and indirect wholly-owned foreign
and domestic subsidiaries. Our principal executive offices are
located at 1436 Lancaster Avenue, Berwyn, Pennsylvania 19312,
and our telephone number is
(610) 296-3400.
Available
Information
We file annual reports on
Form 10-K,
quarterly reports on
Form 10-Q
and current reports on
Form 8-K
and other information with the SEC. Members of the public may
read and copy materials that we file with the SEC at the
SEC’s Public Reference Room at 100 F Street,
N.E., Washington, D.C. 20549. Members of the public may
also obtain information on the Public Reference Room by calling
the SEC at
1-800-732-0330.
The SEC also maintains an Internet web site that contains
reports, proxy and information statements and other information
regarding issuers, including us, that file electronically with
the SEC. The address of that site is www.sec.gov. Our annual
reports on
Form 10-K,
quarterly reports on
Form 10-Q
and current reports on
Form 8-K
and other information filed by us with the SEC are available,
without charge, on our Internet web site,
www.dfcglobalcorp.com as soon as reasonably practicable
after they are filed electronically with the SEC.
Our current business and future results may be affected by a
number of risks and uncertainties, including those described
below. The risks and uncertainties described below are not the
only risks and uncertainties we face. Additional risks and
uncertainties not currently known to us or that we currently
deem immaterial also may impair our business operations. If any
of the following risks actually occur, our business, results of
operations and financial condition could suffer. The risks
discussed below also include forward-looking statements and our
actual results may differ substantially from those discussed in
these forward-looking statements.
Risks
Related to Our Business and Industry
If we
do not generate a sufficient amount of cash from operations,
which depends on many factors beyond our control, we may not be
able to satisfy our debt service or other liquidity
requirements.
As of June 30, 2011, we had an aggregate of
$870.9 million in outstanding indebtedness. If our cash
flows and capital resources are insufficient to fund our debt
service obligations and to satisfy our working capital and other
liquidity needs, we may be forced to reduce or delay capital
expenditures, seek additional capital or seek to restructure or
refinance our indebtedness. These alternative measures may not
be successful or may not permit us to meet our scheduled debt
service obligations. In the absence of such operating results
and resources, we could face substantial liquidity problems and
might be required to sell material assets or operations to
attempt to meet our debt service and other obligations. If we
are unable to make the required payments on our debt
obligations, we would be in default under the terms of our
indebtedness which could result in an acceleration of our
repayment obligations. Any such default, or any attempt to alter
our business plans and operations to satisfy our obligations
under our indebtedness, could materially adversely affect our
business, prospects, results of operations and financial
condition.
18
Changes
in applicable laws and regulations governing our business may
have a significant negative impact on our results of operations
and financial condition.
Our business is subject to numerous federal, state, local and
foreign laws, ordinances and regulations in each of the
countries in which we operate which are subject to change and
which may impose significant costs or limitations on the way we
conduct or expand our business. These regulations govern or
affect, among other things:
|
|
|
| |
•
|
lending practices, such as truth in lending and installment and
single-payment lending;
|
| |
| |
•
|
interest rates and usury;
|
| |
| |
•
|
loan amount and fee limitations;
|
| |
| |
•
|
check cashing fees;
|
| |
| |
•
|
licensing and posting of fees;
|
| |
| |
•
|
currency reporting;
|
| |
| |
•
|
privacy of personal consumer information;
|
| |
| |
•
|
prompt remittance of proceeds for the sale of money
orders; and
|
| |
| |
•
|
the location of our stores through various rules and regulations
such as local zoning regulations and requirements for special
use permits.
|
As we develop and introduce new products and services, we may
become subject to additional laws and regulations. Future
legislation or regulations may restrict our ability to continue
our current methods of operation or expand our operations and
may have a negative effect on our business, results of
operations and financial condition. Governments at the national
and local levels may seek to impose new licensing requirements
or interpret or enforce existing requirements in new ways. We
and other participants in our industry are currently, and may in
the future be, subject to litigation and regulatory proceedings
which could generate adverse publicity or cause us to incur
substantial expenditures or modify the way we conduct our
business. Changes in laws or regulations, or our failure to
comply with applicable laws and regulations, may have a material
adverse effect on our business, prospects, results of
operations, and financial condition.
Our consumer lending products in particular are subject to
regulations in each of the markets in which we operate that
significantly impact the manner in which we conduct our
business. In Canada, the Canadian Parliament amended the federal
usury law in 2007 to permit each province to assume jurisdiction
over and the development of laws and regulations regarding our
industry. To date, Ontario, British Columbia, Alberta, Manitoba,
Saskatchewan and Nova Scotia have passed legislation regulating
short-term consumer lenders and each has, or is in the process
of adopting, regulations and rates consistent with those laws.
In general, these regulations require lenders to be licensed,
set maximum fees and regulate collection practices. There can be
no assurance that these regulations will not have a detrimental
effect on our consumer lending business in Canada in the future.
In the United Kingdom, our consumer lending activities must
comply with the Consumer Credit Act of 1974 and related rules
and regulations which, among other things, require us to obtain
governmental licenses and prescribe the presentation, form and
content of loan agreements, including statutory warnings and the
layout of financial information. Our non-compliance with these
rules could render a loan agreement unenforceable.
Short-term consumer loans have come under heightened regulatory
scrutiny in the United States in recent years resulting in
increasingly restrictive regulations and legislation at the
state and federal levels that makes offering such loans less
profitable or attractive to us. Regulations adopted by some
states require that all borrowers of certain short-term loan
products be listed on a database and limit the number of such
loans that a borrower may have outstanding. Legislative or
regulatory activities may also limit the amount of interest and
fees to levels that do not permit the offering of cash advance
loans to be feasible, may limit the number of short-term loans
that customers may receive or have outstanding, or may prohibit
entirely short-term loan
19
products. Additionally, the U.S. Congress continues to
receive significant pressure from consumer advocates and other
industry opposition groups to adopt such legislation at the
federal level. In July 2010, President Obama in the United
States signed into law the Consumer Financial Protection Act of
2010 which, among other things, created a federal Bureau of
Consumer Protection with regulatory jurisdiction over large
non-depository financial companies, including us. Under this
law, the Bureau of Consumer Protection has broad authority to
prescribe regulations over what it determines to be unfair,
deceptive or abusive practices, including the ability to curtail
or make unlawful any products falling within its regulatory
authority. We cannot predict what, if any, action the Bureau of
Consumer Protection may take with respect to short-term consumer
loans, and any such actions could have an adverse impact on our
business, prospects, results of operations and financial
condition.
The modification of existing laws or regulations in any of the
jurisdictions in which we operate or in which we contemplate new
operations, or the adoption of new laws or regulations
restricting or imposing more stringent requirements, on our
consumer lending or check cashing activities in particular,
could increase our operating expenses, significantly limit our
business activities in the effected markets limit our expansion
opportunities
and/or could
result in a material adverse effect on our business, results of
operations, and financial condition.
We
have engaged, and may engage in the future, in acquisitions or
investments which present many risks, and we may not realize the
anticipated financial and strategic goals for any of these
transactions.
We have historically expanded our business through strategic
acquisitions, and a key component of our growth strategy is to
continue to pursue acquisition opportunities. We may not,
however, be able to achieve the anticipated benefits from the
acquisition or investment due to a number of factors. The
success of our acquisitions is dependent, in part, upon our
effectively integrating the management, operations and
technology of acquired businesses into our existing management,
operations and technology platforms, of which there can be no
assurance, particularly in the case of a larger acquisition or
multiple acquisitions completed in a short period of time. The
failure to successfully integrate acquired businesses into our
organization could materially adversely affect our business,
prospects, results of operations and financial condition. From
time to time, we may enter into negotiations for acquisitions or
investments that are not ultimately consummated. These
negotiations could result in a significant diversion of our
management’s time, as well as
out-of-pocket
costs.
The consideration paid for an acquisition or investment may also
affect our financial results. If we were to proceed with one or
more significant acquisitions in which the consideration
included cash, we could be required to use a substantial portion
of our available cash or to obtain debt or equity financing. To
the extent that we issue shares of our capital stock or other
rights to purchase shares of our capital stock as consideration
for an acquisition or in connection with the financing of an
acquisition, including options or other rights, our existing
stockholders may be diluted, and our earnings per share may
decrease. In addition, acquisitions may result in the incurrence
of debt, large one-time write-offs, including write-offs of
acquired in-process research and development costs, and
restructuring charges. Acquisitions may require us to incur
additional indebtedness to finance our working capital and may
also result in goodwill and other intangible assets that are
subject to impairment tests, which could result in future
impairment charges.
Adverse
economic conditions may significantly and adversely affect our
business, prospects, results of operations, financial condition
and access to liquidity.
The ongoing global economic uncertainties may adversely affect
our business in several ways. For example, continued high levels
of unemployment in the markets in which we operate may reduce
the number of customers who qualify for our products and
services, which in turn may reduce our revenues. Similarly,
reduced consumer confidence and spending may decrease the demand
for our products. Also, we are unable to predict how the
widespread loss of jobs, housing foreclosures, and general
economic uncertainty may affect our loss experience.
If internal funds are not available from our operations and
after utilizing our excess cash, we may be required to rely on
the banking and credit markets to meet our financial commitments
and short-term liquidity
20
needs. Disruptions in the capital and credit markets, as have
been experienced since 2008, could adversely affect our ability
to draw on our revolving loans. Our access to funds under our
credit facility is dependent on the ability of the banks that
are parties to the facility to meet their funding commitments.
Those banks may not be able to meet their funding commitments to
us if they experience shortages of capital and liquidity or if
they experience excessive volumes of borrowing requests from us
and other borrowers within a short period of time.
Longer term disruptions in the capital and credit markets as a
result of uncertainty, changing or increased regulation, reduced
alternatives, or failures of significant financial institutions
could adversely affect our ability to refinance our outstanding
indebtedness on favorable terms, if at all. The lack of
availability under, and the inability to subsequently refinance,
our indebtedness could require us to take measures to conserve
cash until the markets stabilize or until alternative credit
arrangements or other funding for our business needs can be
arranged. Such measures could include deferring capital
expenditures, including acquisitions, and reducing or
eliminating other discretionary uses of cash.
Public
perception and press coverage of single-payment consumer loans
as being predatory or abusive could negatively affect our
revenues and results of operations.
Consumer advocacy groups, certain media reports, and some
regulators and elected officials in the several jurisdictions in
which we conduct business have from time to time advocated
governmental action to prohibit or severely restrict certain
types of short-term consumer lending. These efforts have often
focused on lenders that charge consumers imputed interest rates
and fees that are higher than those charged by credit card
issuers to more creditworthy consumers and otherwise
characterize our products and services as being predatory or
abusive toward consumers. This difference in credit cost may
become more pronounced if a consumer does not repay a loan
promptly, instead electing to renew the loan for one or more
additional short-term periods. If consumers accept this negative
characterization of certain single-payment consumer loans and
believe that the loans we provide to our customers fit this
characterization, demand for our loans could significantly
decrease. In addition, media coverage and public statements that
assert some form of corporate wrongdoing can lower morale, make
it more difficult for us to attract and retain qualified
employees, management and directors, divert management attention
and increase expenses. These trends could materially adversely
affect our business, prospects, results of operations and
financial condition.
If our
estimates of loan losses are not adequate to absorb losses, our
results of operations and financial condition may be adversely
affected.
We maintain an allowance for loan losses for anticipated losses
on consumer loans and loans in default. To estimate the
appropriate level of loan loss reserves, we consider known and
relevant internal and external factors that affect loan
collectability, including the amount of outstanding loans owed
to us, historical loans charged off, current collection patterns
and current economic trends. Our current allowance for loan
losses is based on our charge-offs, expressed as a percentage of
loan amounts originated for the last twelve months applied
against the principal balance of outstanding loans. As of
June 30, 2011, our allowance for loan losses on consumer
loans that were not in default was $14.9 million and our
allowance for losses on loans in default was $37.7 million.
These reserves, however, are estimates, and if actual loan
losses are materially greater than our loan loss reserves, our
results of operations and financial condition could be adversely
affected.
We
have a significant amount of goodwill which is subject to
periodic review and testing for impairment.
As of June 30, 2011, we had goodwill of
$758.5 million, representing a significant portion of the
$1.7 billion in total assets reflected on our consolidated
balance sheet as of such date. A substantial portion of our
goodwill represents assets capitalized in connection with our
historical acquisitions and business combinations. Accounting
for intangible assets such as goodwill requires us to make
significant estimates and judgments, and as a result we may not
realize the value of such intangible assets. In accordance with
generally accepted accounting principles, we conduct an
impairment analysis of our goodwill annually and at such other
times when an event or change in circumstances occurs which
would indicate potential impairment. A variety of factors could
cause the carrying value of an intangible asset to become
impaired, including that our cash
21
flow from operations is not sufficient to meet our future
liquidity needs. Should such a review indicate impairment, a
write-down of the carrying value of the intangible asset would
occur, resulting in a non-cash charge, which could adversely
affect our reported results of operations and could materially
impact the reported balance of our total stockholders’
equity.
Legal
proceedings may have a material adverse impact on our results of
operations or cash flows in future periods.
We are currently subject to several legal proceedings. We are
vigorously defending these proceedings. In addition, we are
likely to be subject to additional legal proceedings in the
future. The resolution of any current or future legal proceeding
could cause us to have to refund fees
and/or
interest collected, refund the principal amount of advances, pay
damages or other monetary penalties
and/or
modify or terminate our operations in particular local and
federal jurisdictions. We may also be subject to adverse
publicity. Defense of any legal proceedings, even if successful,
requires substantial time and attention of our senior officers
and other management personnel that would otherwise be spent on
other aspects of our business and requires the expenditure of
significant amounts for legal fees and other related costs.
Settlement of lawsuits may also result in significant payments
and modifications to our operations. Any of these events could
have a material adverse effect on our business, prospects,
results of operations and financial condition.
Competition
in the financial services industry could cause us to lose market
share and revenues.
The industry in which we operate is highly fragmented and very
competitive, and we believe that the market may become more
competitive as the industry consolidates. In addition to other
consumer lending, secured pawn lending, and check cashing stores
in the markets in which we operate, we compete with banks and
other financial services entities and retail businesses that
offer consumer loans, extend pawn loans, cash checks, sell money
orders, provide money transfer services or offer other products
and services offered by us. Some of our competitors have larger
and more established customer bases and substantially greater
financial, marketing and other resources than we have. As a
result, we could lose market share and our revenues could
decline, thereby affecting our ability to generate sufficient
cash flow to service our indebtedness and fund our operations.
Risk
and uncertainties related to political and economic conditions
in foreign countries in which we operate could negatively impact
our operations.
We currently conduct significant operations internationally. If
political, regulatory or economic conditions deteriorate in
these countries, our ability to conduct our international
operations could be limited and our costs could be increased.
Moreover, actions or events could occur in these countries that
are beyond our control, which could restrict or eliminate our
ability to operate in such jurisdictions or significantly reduce
product demand and the expected profitability of such operations.
Foreign
currency fluctuations and unexpected changes in foreign tax
rates may adversely affect our reported results of
operations.
We currently generate a majority of our revenue outside the
United States. Our foreign subsidiaries accounted for 77.4% and
81.8% of our total revenues for the years ended June 30,
2010 and 2011, respectively. As a result, our reported results
of operations are vulnerable to currency exchange rate
fluctuations, principally in the Canadian dollar, the British
pound, the Swedish Krona and the Euro against the United States
dollar. Upon consolidation, as exchange rates vary, net sales
and other operating results may differ materially from
expectations, and we may record significant gains or losses on
the remeasurement of intercompany balances. We estimate that a
10.0% change in foreign exchange rates by itself would have
impacted reported pre-tax earnings from continuing operations
(exclusive of unrealized foreign exchange gains of
$49.7 million, losses on derivatives not designated as
hedges of $39.3 million, litigation proceeds of
$3.9 million and losses on store closings of
$0.6 million) by approximately $9.9 million for the
twelve months ended June 30, 2011 and $9.2 million
(exclusive of losses on extinguishment of debt of
$8.4 million, unrealized foreign exchange losses of
$10.2 million, losses on derivatives not designated as
hedges of
22
$12.9 million, litigation expense of $22.6 million and
losses on store closings of $0.9 million) for the twelve
months ended June 30, 2010. This impact represents 10.8% of
our consolidated foreign pre-tax earnings for the twelve months
ended June 30, 2011 and 11.3% of our consolidated foreign
pre-tax earnings for the twelve months ended June 30, 2010.
The
international scope of our operations may contribute to
increased costs that could negatively impact our
operations.
Since international operations increase the complexity of an
organization, we may face additional administrative costs in
managing our business than we would if we only conducted
operations domestically. In addition, most countries typically
impose additional burdens on non-domestic companies through the
use of local regulations, tariffs and labor controls. Unexpected
changes to the foregoing could negatively impact our operations.
Furthermore, our financial results may be negatively impacted to
the extent tax rates in foreign countries where we operate
increase
and/or
exceed those in the United States and as a result of the
imposition of withholding requirements on foreign earnings.
A
reduction in demand for our products and services, and failure
by us to adapt to such potential reduction, could adversely
affect our business and results of operations.
The demand for a particular product or service we offer may be
reduced due to a variety of factors, such as regulatory
restrictions that decrease customer access to particular
products, the availability of competing products, changes in
customers’ preferences or financial conditions.
Furthermore, any changes in economic factors that adversely
affect consumer transactions and employment could reduce the
volume or type of transactions that we process and have an
adverse effect on our revenues and results of operations. Should
we fail to adapt to significant changes in our customers’
demand for, or access to, our products or services, our revenues
could decrease significantly and our operations could be harmed.
Each modification, new product or service, and alternative
method of conducting business is subject to risk and uncertainty
and requires significant investment in time and capital,
including additional marketing expenses, legal costs, and other
incremental
start-up
costs. Even if we do make changes to existing products or
services or introduce new products or services to fulfill
customer demand, customers may resist or may reject such
products or services. The effect of any product change on the
results of our business may not be fully ascertainable until the
change has been in effect for some time and by that time it may
be too late to make further modifications to such product or
service without causing further harm to our business and results
of operations.
Our
check cashing services may further diminish because of
technological advances.
We derive a significant portion of our revenues from fees
associated with cashing payroll, government and personal checks.
In fiscal 2011, we generated approximately 18.3% of our total
consolidated revenues from fees associated with check cashing.
There has been increasing penetration of electronic banking
services into the check cashing and money transfer industry,
including direct deposit of payroll checks and electronic
transfer of government benefits. To the extent that checks
received by our customer base are replaced with such electronic
transfers, demand for our check cashing services could decrease.
Our
business and results of operations may be adversely affected if
we are unable to manage our growth effectively.
Our expansion strategy, which in part contemplates the addition
of new stores, the acquisition of competitor stores and
acquiring or developing new distribution channels for our
products in Canada, the United Kingdom, the United States,
Sweden, Finland, Poland and the Republic of Ireland and other
international markets, is subject to significant risks. Our
continued growth in this manner is dependent upon a number of
factors, including the ability to hire, train and retain an
adequate number of experienced management employees, the
availability of adequate financing for our expansion activities,
the ability to successfully transition acquired stores or their
historical customer base to our operating platform, the ability
to obtain any government permits and licenses that may be
required, the ability to identify and overcome cultural and
linguistic differences which may impact market practices within
a given geographic region, and other
23
factors, some of which are beyond our control. There can be no
assurance that we will be able to successfully grow our business
or that our current business, results of operations and
financial condition will not suffer if we are unable to do so.
Expansion beyond the geographic areas where the stores are
presently located will increase demands on management and divert
their attention. In addition, expansion into new products and
services will present new challenges to our business and will
require additional management time.
Our
ability to open and acquire new stores is subject to outside
factors and circumstances over which we have limited control or
that are beyond our control which could adversely affect our
growth potential.
Our expansion strategy includes acquiring existing retail
financial services stores and opening new ones. The success of
this strategy is subject to numerous outside factors, such as
the availability of attractive acquisition candidates, the
availability of acceptable business locations, the ability to
access capital to acquire and open such stores, the ability to
obtain required permits and licenses and continuing favorable
legal and regulatory conditions. We have limited control, and in
some cases, no control, over these factors. Moreover, the
start-up
costs and the losses we likely would incur from initial
operations attributable to each newly opened store places
demands upon our liquidity and cash flow, and we cannot assure
you that we will be able to satisfy these demands. The failure
to execute our expansion strategy would adversely affect our
ability to expand our business and could materially adversely
affect our revenue, profitability and results of operations and
our ability to service our indebtedness.
Our
MILES program relies upon exclusive and non-exclusive
contractual relationships with its service providers, the loss
of any of which could adversely affect the performance of the
MILES business and our results of operations
generally.
Our MILES program provides fee-based services to junior enlisted
military personnel applying for automobile loans. The MILES
program generates its operating revenue from fees paid by a
major third-party national bank funding the loans, fees from
auto dealers and fees from the sale of ancillary products such
as warranty service contracts and GAP insurance coverage. We
rely upon exclusive contractual relationships with the
third-party national bank for the funding and servicing of auto
loans made in connection with the MILES program, and
non-exclusive arrangement with other providers for warranty
service contracts and GAP insurance contracts. However, if any
or all of these contractual relationships were terminated, or if
events were to occur which resulted in a material reduction in
the services provided, a material increase in the cost of the
services provided or a material reduction in the fees earned by
it for the services provided under these contractual
relationships, we could be required to locate new or alternate
service providers for our MILES program. In such event, and
until we would be able to locate new or alternate service
providers, our MILES program business could be significantly
disrupted. In addition, such new or alternate service providers
may offer services that are more costly to MILES’ customers
or that pay premiums or fees below the level that we currently
receive. These changes could have a material adverse effect on
our business and negatively affect our revenues and results of
operations.
United
States defense budget cuts that reduce enlistments or the number
of active duty military personnel, or high levels of overseas
troop deployments, could harm our MILES program
business.
The number of enlisted active duty military personnel and the
number of recruits joining the military each year are subject to
the U.S. defense budget. In addition, high levels of troop
deployments overseas can decrease the number of
U.S.-based
active military personnel, thus reducing the pool of target
MILES customers. Changes in troop deployment and cuts in the
U.S. defense budget may result in reductions in recruitment
targets, reductions in the number of active duty military
personnel or both, any of which would reduce the overall number
of potential MILES program customers or potentially reduce
demand for the services offered by us through our MILES program
which would cause our revenue to decline and could otherwise
harm our business, financial condition and results of operations.
24
Our
business is seasonal in nature, which causes our revenues and
earnings to fluctuate.
Our business is seasonal due to the impact of several
tax-related services, including cashing tax refund checks and
making electronic tax filings. Historically, we have generally
experienced our highest revenues and earnings during the third
fiscal quarter ending March 31, when revenues from these
tax-related services peak. This seasonality requires us to
manage our cash flows over the course of the year. If our
revenues were to fall substantially below what we would normally
expect during certain periods, our financial results could be
adversely impacted.
Because
we maintain a supply of cash in our stores, we may be subject to
cash shortages due to robbery, employee error and
theft.
Since our business requires us to maintain a supply of cash in
each of our retail financial services stores, we are subject to
the risk of cash shortages resulting from robberies, as well as
employee errors and theft. Although we have implemented various
programs to reduce these risks, maintain insurance coverage for
theft and provide security, systems and processes for our
employees and facilities, we cannot assure you that robberies,
employee error and theft will not occur and lead to cash
shortages that could adversely affect our results of operations.
If we
lose key management or are unable to attract and retain the
talent required for our business, our operating results could
suffer.
Our future success depends to a significant degree upon the
members of our executive management team, which have been
instrumental in procuring capital to assist us in executing our
growth strategies, identifying and negotiating domestic and
international acquisitions, and providing expertise in managing
our developing international operations. The loss of the
services of one or more members of our executive management team
could harm our business and future development. Our continued
growth also will depend upon our ability to attract and retain
additional skilled management personnel. If we are unable to
attract and retain the requisite personnel as needed in the
future, our operating results and growth could suffer.
A
catastrophic event or security breach at our corporate or
international headquarters or our centralized call-center
facilities could significantly disrupt our operations and
adversely affect our business, results of operations and
financial condition.
Our global business management processes are primarily provided
from our corporate headquarters in Berwyn, Pennsylvania, and our
operations headquarters in Victoria, British Columbia,
Bichester, England and Nottingham, England. We also maintain
centralized call-center facilities in each of these locations as
well as in Salt Lake City, Utah that perform customer service,
collection and loan-servicing functions for our consumer lending
business. We have in place disaster recovery plans for each of
these sites, including data redundancy and remote information
back-up
systems, but if any of these locations were severely damaged by
a catastrophic event, such as a flood, significant power outage
or act of terror, our operations could be significantly
disrupted and our business, results of operations and financial
condition could be adversely impacted.
A security breach of our computer systems could also interrupt
or damage our operations or harm our reputation, and could
subject us to significant liability if confidential customer
information is misappropriated from our computer systems.
Despite the implementation of significant security measures,
these systems may still be vulnerable to physical break-ins,
computer viruses, programming errors, attacks by third parties
or similar disruptive problems. Any compromise of security could
deter people from entering into transactions that involve
transmitting confidential information to our systems, which
could have a material adverse effect on our business.
25
Any
disruption in the availability of our information systems could
adversely affect our business operations.
We rely upon our information systems to manage and operate our
retail financial services stores and other businesses. Each
store is part of an information network that is designed to
permit us to maintain adequate cash inventory, reconcile cash
balances on a daily basis and report revenues and expenses to
our headquarters. Our
back-up
systems and security measures could fail to prevent a disruption
in our information systems. Any disruption in our information
systems could adversely affect our business, prospects, results
of operations and financial condition.
The
price of our common stock may be volatile.
The market price of our common stock has been subject to
significant fluctuations and may continue to fluctuate or
decline. Over the course of the twelve months ended
June 30, 2011, the market price of our common stock has
been as high as $23.50, and as low as $9.93. The market price of
our common stock has been, and is likely to continue to be,
subject to significant fluctuations due to a variety of factors,
including global economic and market conditions, quarterly
variations in operating results, operating results which vary
from the expectations of securities analysts and investors,
changes in financial estimates, changes in market valuations of
competitors, announcements by us or our competitors of a
material nature, additions or departures of key personnel,
changes in applicable laws and regulations governing consumer
protection and lending practices, the effects of litigation,
future sales of common stock, and general stock market price and
volume fluctuations. In addition, general political and economic
conditions such as a recession, or interest rate or currency
rate fluctuations may adversely affect the market price of the
common stock of many companies, including our common stock. A
significant decline in our stock price could result in
substantial losses for individual stockholders and could lead to
costly and disruptive securities litigation.
We
have never paid dividends on our common stock and do not
anticipate paying any in the foreseeable future.
We have never declared or paid any cash dividends on our common
stock. We currently expect to retain any future earnings for use
in the growth and expansion of our business and do not
anticipate paying any cash dividends on our common stock in the
foreseeable future.
Our
anti-takeover provisions could prevent or delay a change in
control of our company, even if such change of control would be
beneficial to our stockholders.
Provisions of our amended and restated certificate of
incorporation and amended and restated bylaws as well as
provisions of Delaware law could discourage, delay or prevent a
merger, acquisition or other change in control of our company,
even if such change in control would be beneficial to our
stockholders. These provisions include:
|
|
|
| |
•
|
a board of directors that is classified such that only one-third
of directors are elected each year;
|
| |
| |
•
|
authorizing the issuance of “blank check” preferred
stock that could be issued by our board of directors to increase
the number of outstanding shares and thwart a takeover attempt;
|
| |
| |
•
|
limitations on the ability of stockholders to call special
meetings of stockholders;
|
| |
| |
•
|
prohibiting stockholder action by written consent and requiring
all stockholder actions to be taken at a meeting of our
stockholders; and
|
| |
| |
•
|
establishing advance notice requirements for nominations for
election to the board of directors or for proposing matters that
can be acted upon by stockholders at stockholder meetings.
|
In addition, Section 203 of the Delaware General
Corporation Law limits business combination transactions with
15% stockholders that have not been approved by the board of
directors. These and similar provisions make it more difficult
for a third party to acquire us without negotiation. These
provisions may apply even if the transaction may be considered
beneficial by some stockholders.
26
|
|
|
Item 1B.
|
UNRESOLVED
STAFF COMMENTS
|
None.
All of our company-operated stores and our administrative
offices are leased, generally under leases providing for an
initial multi-year term and renewal terms from one to five
years. The leases for our company-operated stores may contain
provisions for additional rental charges based on revenue and
payment of real estate taxes and common area charges. We
generally assume the responsibility for required leasehold
improvements, including signage, customer service representative
partitions, alarm and recovery systems, computers, time-delayed
safes and other office equipment. With respect to leased
locations open as of June 30, 2011, the following table
shows the total number of leases expiring during the periods
indicated, without assuming the exercise of any applicable
renewal options:
| |
|
|
|
|
|
|
|
Number of
|
|
Period Ending June 30,
|
|
Leases Expiring
|
|
|
|
2012
|
|
|
219
|
|
|
2013 - 2015
|
|
|
570
|
|
|
2016 - 2020
|
|
|
365
|
|
|
2021 - 2025
|
|
|
102
|
|
|
|
|
|
|
|
|
|
|
|
1,256
|
|
|
|
|
|
|
|
Store
Operations
Locations
The following chart sets forth the number of company-operated
and franchised stores in operation as of the specified dates:
| |
|
|
|
|
|
|
|
|
|
|
|
|
|
|
|
June 30,
|
|
|
Markets/Reporting Segments
|
|
2009
|
|
|
2010
|
|
|
2011
|
|
|
|
|
UNITED STATES
|
|
|
|
|
|
|
|
|
|
|
|
|
|
Company-operated
|
|
|
358
|
|
|
|
325
|
|
|
|
312
|
|
|
|
|
|
|
|
|
|
|
|
|
|
|
|
|
|
|
|
358
|
|
|
|
325
|
|
|
|
312
|
|
|
|
|
|
|
|
|
|
|
|
|
|
|
|
|
WE THE PEOPLE*
|
|
|
|
|
|
|
|
|
|
|
|
|
|
Franchised locations
|
|
|
49
|
|
|
|
7
|
|
|
|
—
|
|
|
|
|
|
|
|
|
|
|
|
|
|
|
|
|
|
|
|
49
|
|
|
|
7
|
|
|
|
—
|
|
|
|
|
|
|
|
|
|
|
|
|
|
|
|
|
CANADA
|
|
|
|
|
|
|
|
|
|
|
|
|
|
Company-operated
|
|
|
399
|
|
|
|
403
|
|
|
|
455
|
|
|
Franchised locations
|
|
|
62
|
|
|
|
62
|
|
|
|
22
|
|
|
|
|
|
|
|
|
|
|
|
|
|
|
|
|
|
|
|
461
|
|
|
|
465
|
|
|
|
477
|
|
|
|
|
|
|
|
|
|
|
|
|
|
|
|
|
EUROPE
|
|
|
|
|
|
|
|
|
|
|
|
|
|
Company-operated
|
|
|
274
|
|
|
|
330
|
|
|
|
431
|
|
|
Franchised/agent locations
|
|
|
64
|
|
|
|
53
|
|
|
|
49
|
|
|
|
|
|
|
|
|
|
|
|
|
|
|
|
|
|
|
|
338
|
|
|
|
383
|
|
|
|
480
|
|
|
|
|
|
|
|
|
|
|
|
|
|
|
|
|
Total Stores
|
|
|
1,206
|
|
|
|
1,180
|
|
|
|
1,269
|
|
|
|
|
|
|
|
|
|
|
|
|
|
|
|
|
|
|
|
* |
|
Included in our Other reporting segment. |
27
The following table reflects the change in the number of stores
during fiscal years 2009, 2010 and 2011:
| |
|
|
|
|
|
|
|
|
|
|
|
|
|
|
|
2009
|
|
|
2010
|
|
|
2011
|
|
|
|
|
Number of stores at beginning of period
|
|
|
1,452
|
|
|
|
1,206
|
|
|
|
1,180
|
|
|
New stores opened
|
|
|
28
|
|
|
|
56
|
|
|
|
88
|
|
|
Stores acquired
|
|
|
17
|
|
|
|
7
|
|
|
|
71
|
|
|
Stores closed
|
|
|
(136
|
)
|
|
|
(36
|
)
|
|
|
(19
|
)
|
|
Net change in franchise/agent stores
|
|
|
(155
|
)
|
|
|
(53
|
)
|
|
|
(51
|
)
|
|
|
|
|
|
|
|
|
|
|
|
|
|
|
|
Number of stores at end of period
|
|
|
1,206
|
|
|
|
1,180
|
|
|
|
1,269
|
|
|
|
|
|
|
|
|
|
|
|
|
|
|
|
|
|
|
Item 3.
|
LEGAL
PROCEEDINGS
|
The information required by this Item 3 is incorporated by
reference herein to the section in “Item 8.
Financial Statements and Supplementary Data —
Note 18. Contingent Liabilities” of this Annual
Report on Form 10K.
|
|
|
Item 4.
|
REMOVED
AND RESERVED
|
28
PART II
|
|
|
Item 5.
|
MARKET
FOR REGISTRANT’S COMMON EQUITY, RELATED STOCKHOLDER MATTERS
AND ISSUER PURCHASES OF EQUITY SECURITIES
|
Market
Information
Our common stock is traded on the NASDAQ Global Select Market
under the symbol “DLLR.” Below is a summary of the
high and low sales prices of our common stock for each quarterly
period during the two-year period ending June 30, 2011 as
reported on the NASDAQ Global Select Market. On January 10,
2011, the Company announced a
three-for-two
stock split on all shares of its common stock. The stock split
was distributed on February 4, 2011 in the form of a stock
dividend to all stockholders of record on January 20, 2011.
All amounts presented below were retroactively adjusted for the
common stock split.
| |
|
|
|
|
|
|
|
|
|
Period
|
|
High
|
|
Low
|
|
|
|
July 1, 2009 until September 30, 2009
|
|
$
|
12.66
|
|
|
$
|
8.59
|
|
|
October 1, 2009 until December 31, 2009
|
|
$
|
17.00
|
|
|
$
|
9.99
|
|
|
January 1, 2010 until March 31, 2010
|
|
$
|
16.87
|
|
|
$
|
13.53
|
|
|
April 1, 2010 until June 30, 2010
|
|
$
|
18.14
|
|
|
$
|
11.73
|
|
|
July 1, 2010 until September 30, 2010
|
|
$
|
14.23
|
|
|
$
|
9.93
|
|
|
October 1, 2010 until December 31, 2010
|
|
$
|
19.15
|
|
|
$
|
13.33
|
|
|
January 1, 2011 until March 31, 2011
|
|
$
|
21.79
|
|
|
$
|
18.79
|
|
|
April 1, 2011 until June 30, 2011
|
|
$
|
23.50
|
|
|
$
|
20.00
|
|
Holders
On June 30, 2011, there were approximately 116 holders of
record of our common stock.
Dividends
We have never declared or paid any cash dividends on our common
stock. We currently expect to retain any future earnings for use
in the operation and expansion of our business and do not
anticipate paying any cash dividends on our common stock in the
foreseeable future. Any payment of cash dividends on our common
stock will be dependent upon the ability of Dollar Financial
Group, Inc., our wholly owned subsidiary, to pay dividends or
make cash payments or advances to us. Our global revolving
credit facility contains restrictions on our declaration and
payment of dividends. See “Item 7 —
Management’s Discussion and Analysis of Financial Condition
and Results of Operations” and the notes to consolidated
financial statements included elsewhere in this Annual Report as
Form 10-K.
For example, Dollar Financial Group, Inc.’s ability to pay
dividends or to make other distributions to us, and thus our
ability to pay cash dividends on our common stock, will depend
upon, among other things, its level of indebtedness at the time
of the proposed dividend or distribution, whether it is in
default under its financing agreements and the amount of
dividends or distributions made in the past. Our future dividend
policy will also depend on the requirements of any future
financing agreements to which we may be a party and other
factors considered relevant by our board of directors, including
the General Corporation Law of the State of Delaware, which
provides that dividends are only payable out of surplus or
current net profits.
29
Stock
Performance Graph
The rules of the Securities Exchange Commission require us to
present a chart comparing the cumulative total stockholder
return on our common stock with the cumulative total stockholder
return of (i) a broad equity index and (ii) a
published industry or peer group index. Set forth below is a
graph and table indicating the value at the end of the specified
time periods of a $100 investment made on June 30, 2006 in
our common stock and similar investments made in the Nasdaq
Composite Index and securities of companies in a peer group of
financial services companies comprised of Advance America Cash
Advance Centers, Inc., Cash America International, Inc., EZCorp
Inc., First Cash Financial Services, Inc., and QC Holdings, Inc.
The graph and table assume the reinvestment of any dividends
received.
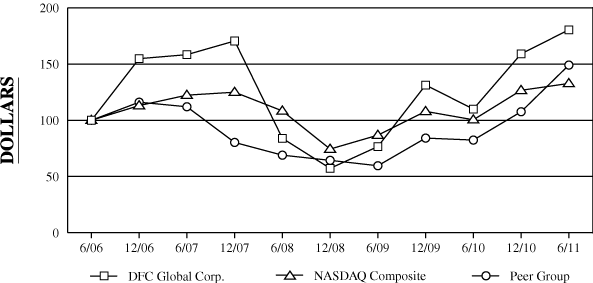
| |
|
|
|
|
|
|
|
|
|
|
|
|
|
|
|
|
|
|
|
|
|
|
|
|
|
|
|
|
|
|
|
|
|
|
|
|
|
|
|
|
|
|
|
|
|
|
|
|
|
|
|
|
|
|
|
|
|
|
|
6/06
|
|
|
|
12/06
|
|
|
|
6/07
|
|
|
|
12/07
|
|
|
|
6/08
|
|
|
|
12/08
|
|
|
|
6/09
|
|
|
|
12/09
|
|
|
|
6/10
|
|
|
|
12/10
|
|
|
|
6/11
|
|
|
DFC Global Corp.
|
|
|
|
100.00
|
|
|
|
|
154.78
|
|
|
|
|
158.33
|
|
|
|
|
170.50
|
|
|
|
|
83.94
|
|
|
|
|
57.22
|
|
|
|
|
76.61
|
|
|
|
|
131.33
|
|
|
|
|
109.94
|
|
|
|
|
159.06
|
|
|
|
|
180.42
|
|
|
NASDAQ Composite
|
|
|
|
100.00
|
|
|
|
|
113.05
|
|
|
|
|
122.33
|
|
|
|
|
124.95
|
|
|
|
|
108.31
|
|
|
|
|
74.39
|
|
|
|
|
86.75
|
|
|
|
|
107.90
|
|
|
|
|
100.42
|
|
|
|
|
126.64
|
|
|
|
|
132.75
|
|
|
Peer Group
|
|
|
|
100.00
|
|
|
|
|
116.06
|
|
|
|
|
112.00
|
|
|
|
|
80.27
|
|
|
|
|
68.95
|
|
|
|
|
64.35
|
|
|
|
|
59.55
|
|
|
|
|
84.14
|
|
|
|
|
82.39
|
|
|
|
|
107.57
|
|
|
|
|
149.08
|
|
|
|
|
|
|
|
|
|
|
|
|
|
|
|
|
|
|
|
|
|
|
|
|
|
|
|
|
|
|
|
|
|
|
|
|
|
|
|
|
|
|
|
|
|
|
|
|
|
|
|
|
|
|
|
|
|
|
30
|
|
|
Item 6.
|
SELECTED
FINANCIAL DATA
|
In millions, except share and per share amounts and store data:
| |
|
|
|
|
|
|
|
|
|
|
|
|
|
|
|
|
|
|
|
|
|
|
|
2007
|
|
|
2008
|
|
|
2009
|
|
|
2010
|
|
|
2011
|
|
|
|
|
Consolidated Statement of Operations Data:
|
|
|
|
|
|
|
|
|
|
|
|
|
|
|
|
|
|
|
|
|
|
Revenues:
|
|
|
|
|
|
|
|
|
|
|
|
|
|
|
|
|
|
|
|
|
|
Consumer lending
|
|
$
|
221.8
|
|
|
$
|
282.5
|
|
|
$
|
266.5
|
|
|
$
|
319.5
|
|
|
$
|
429.2
|
|
|
Check cashing
|
|
|
166.7
|
|
|
|
196.6
|
|
|
|
164.6
|
|
|
|
149.5
|
|
|
|
144.1
|
|
|
Pawn service fees and sales
|
|
|
7.4
|
|
|
|
12.1
|
|
|
|
13.8
|
|
|
|
19.9
|
|
|
|
48.0
|
|
|
Money transfer fees
|
|
|
20.9
|
|
|
|
27.5
|
|
|
|
26.8
|
|
|
|
27.5
|
|
|
|
32.1
|
|
|
Gold sales(1)
|
|
|
—
|
|
|
|
—
|
|
|
|
3.7
|
|
|
|
43.0
|
|
|
|
46.5
|
|
|
Other
|
|
|
38.9
|
|
|
|
53.5
|
|
|
|
54.8
|
|
|
|
73.9
|
|
|
|
88.5
|
|
|
|
|
|
|
|
|
|
|
|
|
|
|
|
|
|
|
|
|
|
|
|
|
Total revenues
|
|
|
455.7
|
|
|
|
572.2
|
|
|
|
530.2
|
|
|
|
633.3
|
|
|
|
788.4
|
|
|
|
|
|
|
|
|
|
|
|
|
|
|
|
|
|
|
|
|
|
|
|
|
Operating expenses:
|
|
|
|
|
|
|
|
|
|
|
|
|
|
|
|
|
|
|
|
|
|
Salaries and benefits
|
|
|
129.5
|
|
|
|
159.4
|
|
|
|
145.7
|
|
|
|
154.0
|
|
|
|
179.9
|
|
|
Provision for loan losses
|
|
|
45.8
|
|
|
|
58.5
|
|
|
|
52.1
|
|
|
|
45.9
|
|
|
|
73.6
|
|
|
Occupancy
|
|
|
32.3
|
|
|
|
43.0
|
|
|
|
41.8
|
|
|
|
43.3
|
|
|
|
51.0
|
|
|
Purchased gold costs(1)
|
|
|
—
|
|
|
|
—
|
|
|
|
2.4
|
|
|
|
30.4
|
|
|
|
31.0
|
|
|
Depreciation
|
|
|
9.4
|
|
|
|
13.7
|
|
|
|
13.1
|
|
|
|
14.3
|
|
|
|
16.8
|
|
|
Other
|
|
|
83.2
|
|
|
|
98.4
|
|
|
|
93.3
|
|
|
|
99.1
|
|
|
|
128.9
|
|
|
|
|
|
|
|
|
|
|
|
|
|
|
|
|
|
|
|
|
|
|
|
|
Total operating expenses
|
|
|
300.2
|
|
|
|
373.0
|
|
|
|
348.4
|
|
|
|
387.0
|
|
|
|
481.2
|
|
|
|
|
|
|
|
|
|
|
|
|
|
|
|
|
|
|
|
|
|
|
|
|
Operating margin
|
|
|
155.5
|
|
|
|
199.2
|
|
|
|
181.8
|
|
|
|
246.3
|
|
|
|
307.2
|
|
|
Corporate and other expenses:
|
|
|
|
|
|
|
|
|
|
|
|
|
|
|
|
|
|
|
|
|
|
Corporate expenses
|
|
|
53.3
|
|
|
|
70.8
|
|
|
|
68.2
|
|
|
|
86.8
|
|
|
|
104.1
|
|
|
Other depreciation and amortization
|
|
|
3.4
|
|
|
|
3.9
|
|
|
|
3.8
|
|
|
|
7.3
|
|
|
|
14.6
|
|
|
Interest expense, net
|
|
|
31.5
|
|
|
|
44.4
|
|
|
|
43.7
|
|
|
|
68.9
|
|
|
|
90.8
|
|
|
Loss on extinguishment of debt
|
|
|
31.8
|
|
|
|
0.1
|
|
|
|
—
|
|
|
|
9.5
|
|
|
|
—
|
|
|
Goodwill impairment and other charges
|
|
|
24.3
|
|
|
|
—
|
|
|
|
—
|
|
|
|
—
|
|
|
|
—
|
|
|
Unrealized foreign exchange loss (gain)
|
|
|
7.6
|
|
|
|
—
|
|
|
|
(5.5
|
)
|
|
|
10.1
|
|
|
|
(47.0
|
)
|
|
Loss on derivatives not designated as hedges
|
|
|
—
|
|
|
|
0.2
|
|
|
|
—
|
|
|
|
12.9
|
|
|
|
39.3
|
|
|
(Proceeds from) provision for litigation settlements
|
|
|
(3.3
|
)
|
|
|
0.3
|
|
|
|
57.9
|
|
|
|
29.1
|
|
|
|
(3.7
|
)
|
|
Other expense, net
|
|
|
1.4
|
|
|
|
0.1
|
|
|
|
5.5
|
|
|
|
5.5
|
|
|
|
6.7
|
|
|
|
|
|
|
|
|
|
|
|
|
|
|
|
|
|
|
|
|
|
|
|
|
Income before income taxes
|
|
|
5.5
|
|
|
|
79.4
|
|
|
|
8.2
|
|
|
|
16.2
|
|
|
|
102.4
|
|
|
Income tax provision
|
|
|
37.7
|
|
|
|
36.0
|
|
|
|
15.0
|
|
|
|
21.4
|
|
|
|
37.1
|
|
|
|
|
|
|
|
|
|
|
|
|
|
|
|
|
|
|
|
|
|
|
|
|
Net (loss) income
|
|
$
|
(32.2
|
)
|
|
$
|
43.4
|
|
|
$
|
(6.8
|
)
|
|
$
|
(5.2
|
)
|
|
$
|
65.3
|
|
|
Less: Net loss attributable to non-controlling interests
|
|
|
—
|
|
|
|
—
|
|
|
|
—
|
|
|
|
(0.3
|
)
|
|
|
(0.5
|
)
|
|
|
|
|
|
|
|
|
|
|
|
|
|
|
|
|
|
|
|
|
|
|
|
Net (loss) income attributable to DFC Global Corp.
|
|
$
|
(32.2
|
)
|
|
$
|
43.4
|
|
|
$
|
(6.8
|
)
|
|
$
|
(4.9
|
)
|
|
$
|
65.8
|
|
|
|
|
|
|
|
|
|
|
|
|
|
|
|
|
|
|
|
|
|
|
|
|
Net (loss) income per share:
|
|
|
|
|
|
|
|
|
|
|
|
|
|
|
|
|
|
|
|
|
|
Basic(2)
|
|
$
|
(0.91
|
)
|
|
$
|
1.20
|
|
|
$
|
(0.19
|
)
|
|
$
|
(0.14
|
)
|
|
$
|
1.73
|
|
|
Diluted(2)
|
|
$
|
(0.91
|
)
|
|
$
|
1.18
|
|
|
$
|
(0.19
|
)
|
|
$
|
(0.14
|
)
|
|
$
|
1.66
|
|
|
Shares used to calculate net (loss) income per share:
|
|
|
|
|
|
|
|
|
|
|
|
|
|
|
|
|
|
|
|
|
|
Basic(2)
|
|
|
35,365,805
|
|
|
|
36,159,588
|
|
|
|
36,019,058
|
|
|
|
36,159,848
|
|
|
|
38,005,387
|
|
|
Diluted(2)
|
|
|
35,365,805
|
|
|
|
36,844,844
|
|
|
|
36,019,058
|
|
|
|
36,159,848
|
|
|
|
39,758,551
|
|
|
Operating and Other Data:
|
|
|
|
|
|
|
|
|
|
|
|
|
|
|
|
|
|
|
|
|
|
Net cash provided by (used in):
|
|
|
|
|
|
|
|
|
|
|
|
|
|
|
|
|
|
|
|
|
|
Operating activities
|
|
$
|
29.3
|
|
|
$
|
80.8
|
|
|
$
|
59.2
|
|
|
$
|
86.7
|
|
|
$
|
16.9
|
|
|
Investing activities
|
|
$
|
(170.7
|
)
|
|
$
|
(167.0
|
)
|
|
$
|
(42.0
|
)
|
|
$
|
(184.4
|
)
|
|
$
|
(330.6
|
)
|
|
Financing activities
|
|
$
|
307.4
|
|
|
$
|
0.3
|
|
|
$
|
2.7
|
|
|
$
|
169.8
|
|
|
$
|
194.4
|
|
|
Stores in operation at end of period:
|
|
|
|
|
|
|
|
|
|
|
|
|
|
|
|
|
|
|
|
|
|
Company-owned
|
|
|
902
|
|
|
|
1,122
|
|
|
|
1,031
|
|
|
|
1,058
|
|
|
|
1,198
|
|
|
Franchised stores/agents
|
|
|
378
|
|
|
|
330
|
|
|
|
175
|
|
|
|
122
|
|
|
|
71
|
|
|
|
|
|
|
|
|
|
|
|
|
|
|
|
|
|
|
|
|
|
|
|
|
Total
|
|
|
1,280
|
|
|
|
1,452
|
|
|
|
1,206
|
|
|
|
1,180
|
|
|
|
1,269
|
|
|
|
|
|
|
|
|
|
|
|
|
|
|
|
|
|
|
|
|
|
|
|
31
| |
|
|
|
|
|
|
|
|
|
|
|
|
|
|
|
|
|
|
|
|
|
|
|
2007
|
|
|
2008
|
|
|
2009
|
|
|
2010
|
|
|
2011
|
|
|
|
|
Consolidated Balance Sheet Data (at end of period):
|
|
|
|
|
|
|
|
|
|
|
|
|
|
|
|
|
|
|
|
|
|
Cash
|
|
$
|
290.9
|
|
|
$
|
209.7
|
|
|
$
|
209.6
|
|
|
$
|
291.3
|
|
|
$
|
189.0
|
|
|
Total assets
|
|
$
|
831.8
|
|
|
$
|
941.4
|
|
|
$
|
921.5
|
|
|
$
|
1,214.6
|
|
|
$
|
1,662.8
|
|
|
Total debt
|
|
$
|
521.2
|
|
|
$
|
535.6
|
|
|
$
|
536.3
|
|
|
$
|
728.6
|
|
|
$
|
870.9
|
|
|
Stockholders’ equity
|
|
$
|
199.9
|
|
|
$
|
239.4
|
|
|
$
|
209.1
|
|
|
$
|
218.3
|
|
|
$
|
426.6
|
|
|
|
|
|
(1) |
|
For the fiscal years ended June 30, 2009 and June 30,
2010, the previously reported amounts of gold sales and
purchased gold costs have been revised to correct certain
immaterial classification errors. Specifically charges
previously netted in calculating total revenues of
$2.3 million and $22.4 million for the fiscal years
ended June 30, 2009 and June 30, 2010, respectively,
have been reclassified to operating expenses. This
reclassification increased other revenue, total revenue, other
operating expense, and total operating expense by
$2.3 million and $22.4 million for the fiscal years
ended June 30, 2009 and June 30, 2010, respectively.
This reclassification did not affect the previously reported
amounts of operating margin for any period. |
| |
|
(2) |
|
On January 10, 2011, we announced a
three-for-two
stock split on all shares of our common stock. The stock split
was distributed on February 4, 2011 in the form of a stock
dividend to all stockholders of record on January 20, 2011.
All share and per share amounts presented above were
retroactively adjusted for the common stock split. |
32
|
|
|
Item 7.
|
MANAGEMENT’S
DISCUSSION AND ANALYSIS OF FINANCIAL CONDITION AND RESULTS OF
OPERATIONS
|
Executive
Summary
Overview
We are a leading international diversified financial services
company serving primarily unbanked and under-banked consumers
who, for reasons of convenience and accessibility, purchase some
or all of their financial services from us rather than from
banks and other financial institutions. Through our nearly 1,300
retail storefront locations, Internet websites and mobile phone
and other remote platforms, we provide a variety of consumer
financial products and services in seven countries across North
America and Europe — Canada, the United Kingdom, the
United States, Sweden, Finland, Poland and the Republic of
Ireland.
Our networks of retail locations in Canada and the United
Kingdom are the largest of their kind by revenue in each of
those countries. As a result of our acquisition of Sefina
Finance AB, we believe that we are also the largest pawn lender
in each of Sweden and Finland and, together with our existing
pawn operation in the United Kingdom, we believe we are the
largest pawn lender in Europe. At June 30, 2011, our global
retail operations consisted of 1,269 retail storefront
locations, of which 1,198 are company-owned financial services
stores, conducting business primarily under the names Money
Mart®,
The Money
Shop®,
Insta-Cheques®,
mce®,
Suttons and
Robertson®,
The Check Cashing
Store®,
Sefina®,
Helsingin
Panttism,
Optima®
and
MoneyNow!®.
In addition to our retail stores, we also offer Internet-based
short-term consumer loans in the United Kingdom primarily under
the brand names Payday
Express®
and
PaydayUK®,
and in Canada under the Money Mart brand.
Our products and services, principally our short-term consumer
loans, check cashing services, secured pawn loans and gold
buying services, provide customers with immediate access to cash
for living expenses or other needs. We strive to offer our
customers additional high-value ancillary services, including
Western
Union®
money order and money transfer products, electronic tax filing,
reloadable prepaid
VISA®
and
MasterCard®
debit cards, foreign currency exchange and prepaid local and
long-distance phone services. In addition to our core products,
we also provide fee-based services to enlisted military
personnel applying for loans to purchase new and used vehicles
that are funded and serviced under an agreement with a major
third-party national bank through our branded Military
Installment Loan and Education Services, or
MILES®,
program.
For our consumer loans, as well as pawn lending, we receive
interest and fees on the loans we provide. For our check cashing
services, we charge our customers fees that are usually equal to
a percentage of the amount of the check being cashed and are
deducted from the cash provided to the customer.
Our expenses primarily relate to the operations of our store
network, including the provision for loan losses, salaries and
benefits for our employees, occupancy expense for our leased
real estate, depreciation of our assets and corporate and other
expenses, including costs related to opening and closing stores.
In each foreign country in which we operate, local currency is
used for both revenues and expenses. Therefore, we record the
impact of foreign currency exchange rate fluctuations related to
our foreign net income.
During the fiscal year ended June 30, 2011, nearly 50% of
our total consolidated revenue was comprised of products and
services which generally carry little or no credit risk, such as
secured pawn lending, check cashing, money transfers, gold
purchasing, foreign exchange, and fee-based income generated
from the MILES program.
We manage our business as three reportable segments —
our financial services offerings in each of Canada, Europe and
the United States. Our Dealers’ Financial Services, LLC
subsidiary, which we operate independently of our other
businesses, is included in Other.
During our fiscal 2010, we entered into settlement agreements in
connection with class action litigation commenced against us in
the Canadian provinces of Ontario, British Columbia, Nova
Scotia, New Brunswick
33
and Newfoundland, in each case related to alleged violations of
Canadian laws regarding usury. Purported class actions against
us in the provinces of Alberta and Manitoba are still open. As
of June 30, 2011, we have included approximately CAD
46.9 million (of which CAD 28.4 million is expected to
relate to vouchers issued to class members that will not result
in any cash outlay from us) in accrued liabilities related to
the settled actions. As a result of these settlements, and the
relatively recent advent of provincial regulation in Canada over
the short term consumer loan industry, we intend to leverage our
multi-product store platform and position as a low cost provider
in the market by offering products and services at prices below
many of our Canadian competitors and otherwise to seek to
enhance our current share of the Canadian market.
Since April 2009, we have acquired thirteen businesses with an
aggregate purchase price of approximately $467 million.
This includes our December 2009 purchase of DFS, for which we
paid a purchase price of approximately $123 million, our
December 31, 2010 acquisition of Sefina, with a purchase
price of approximately $90.6 million, including contingent
consideration, our April 1, 2011 acquisition of Purpose
U.K. Holdings Limited, for which we paid a purchase price of
approximately $195.0 million and our July 6, 2011
purchase of Risicum Oyj, for which we paid a purchase price of
approximately $46.0 million. During fiscal 2011, we also
completed the acquisitions of three of our Canadian franchisees
with 40 stores for an aggregate purchase price of
$39.6 million. We also completed the acquisition of three
U.K. stores during fiscal 2011 for a nominal amount.
Recent
Events
At our Annual Meeting of Stockholders on November 11, 2010,
our stockholders approved an amendment to our Amended and
Restated Certificate of Incorporation to increase the number of
authorized shares of our common stock from 55,500,000 to
100,000,000.
On December 31, 2010, we consummated the acquisition of
Sefina Finance AB, a Scandinavian pawn lending business with its
headquarters in Stockholm, Sweden. Sefina provides pawn loans
primarily secured by gold jewelry, diamonds and watches through
its 16 retail store locations in Sweden and 12 retail store
locations in Finland. The total cash consideration for the
acquisition is estimated to be approximately $90.6 million,
of which approximately $59.1 million was cash paid at
closing. Approximately $14.9 million of additional cash,
excluding accrued interest, is payable to the seller in equal
installments. We paid the first two installments on
March 31, 2011 and June 30, 2011, and the remaining
installment is due on September 30, 2011. Furthermore, we
are obligated to pay the seller additional contingent
consideration based on the financial performance of Sefina
during each of the two successive twelve month periods following
the closing of the acquisition estimated at the time of
acquisition to be approximately $16.6 million.
On January 10, 2011, we announced a
three-for-two
stock split on all shares of our common stock. The stock split
was distributed on February 4, 2011 in the form of a stock
dividend to all stockholders of record on January 20, 2011.
All share and per share amounts presented in this report were
retroactively adjusted to give effect to the stock split.
On March 3, 2011, we replaced our existing bank facility
with a new senior secured credit facility with a syndicate of
lenders, the administrative agent for which is Wells Fargo Bank,
National Association. The new facility provides for a
$200.0 million global revolving credit facility, with
potential to further increase our available borrowings under the
facility to $250.0 million. Availability under the new
global revolving credit facility is based on a borrowing base
comprised of cash and consumer receivables in our U.S. and
Canadian operations, our U.K.-based retail and Express Finance
online operations and our U.K.-based pawn loan collateral. There
is a sublimit for borrowings in the United States based on the
lesser of the U.S. borrowing base or $75 million.
Borrowings under the new global revolving credit facility may be
denominated in United States Dollars, British Pounds Sterling,
Euros or Canadian Dollars, as well as any other currency as may
be approved by the lenders. Interest on borrowings is derived
from a pricing grid based on the our consolidated leverage
ratio, which currently allows borrowing at an interest rate
equal to the applicable London Inter-Bank Offered Rate (LIBOR)
or Canadian Dollar Offer Rate (based on the currency of
borrowing) plus 400 basis points, or in the case of
borrowings in U.S. Dollars only, at the alternate base
rate, which is the greater of the
34
prime rate and the federal funds rate plus 1/2 of 1% plus
300 basis points. The new facility will mature on
March 1, 2015.
On April 1, 2011, we completed our acquisition of Purpose
U.K. Holdings Limited, a leading provider of online short-term
loans in the United Kingdom. Purpose U.K. Holdings Limited,
which is commonly referred to as “Month End Money” or
“MEM” and operates primarily under the brand name
Payday UK, provides loans through both internet and
telephony-based technologies throughout the United Kingdom. The
purchase price for the acquisition was $195.0 million, all
of which was paid in cash at the closing with a combination of
available cash and GBP 95 million ($152.5 million)
borrowed under our new global revolving credit facility.
On April 13, 2011, we completed an underwritten public
offering of 6.0 million shares of our common stock at a
price to the public of $20.75 per share. The net proceeds from
the offering were approximately $117.0 million, after
deducting the underwriting discount and our offering expenses.
On April 25, 2011, the underwriters exercised their
overallotment option under the terms of the underwriting
agreement to purchase 672,142 additional shares of our common
stock and surrendered their rights with respect to the remaining
shares covered by such option. The net proceeds from the sale of
the overallotment shares were approximately $13.2 million.
We used the net proceeds from the equity offering to repay a
portion of the outstanding borrowings under our global revolving
credit facility, which was initially used to fund a portion of
the acquisition price of MEM.
On July 6, 2011, we acquired Risicum Oyj, the leading
provider of Internet loans in Finland with headquarters in
Helsinki, Finland. Risicum, which was established in 2005,
provides loans predominately in Finland through both Internet
and mobile phone technology, utilizing multiple brands to target
specific customer demographics. Risicum also provides Internet
and telephony-based loans in Sweden. The total purchase price of
the transaction at closing was approximately $46.0 million.
On August 24, 2011, we announced that we have changed our
name to DFC Global Corp. We will continue to trade on the NASDAQ
stock market under the ticker symbol “DLLR”.
Discussion
of Critical Accounting Policies
In the ordinary course of business, we have made a number of
estimates and assumptions relating to the reporting of results
of operations and financial condition in the preparation of our
financial statements in conformity with U.S. generally
accepted accounting principles. We evaluate these estimates on
an ongoing basis, including those related to revenue
recognition, loan loss reserves and goodwill and intangible
assets. We base these estimates on the information currently
available to us and on various other assumptions that we believe
are reasonable under the circumstances. Actual results could
vary from these estimates under different assumptions or
conditions.
We believe that the following critical accounting policies
affect the more significant judgments and estimates used in the
preparation of our financial statements:
Revenue
Recognition
With respect to company-operated stores, revenues from our check
cashing, money order sales, money transfer and other ancillary
services reported in other revenues on its statement of
operations are all recognized when the transactions are
completed at the
point-of-sale
in the store.
With respect to our franchised locations, we recognize initial
franchise fees upon fulfillment of all significant obligations
to the franchisee. Royalties from franchisees are recognized as
earned. Our standard franchise agreement forms grant to the
franchisee the right to develop and operate a store and use the
associated trade names, trademarks, and service marks within the
standards and guidelines established by us. As part of the
franchise agreement, we provide certain pre-opening assistance
and after the franchised location has opened, we also provide
updates to the software, samples of certain advertising and
promotional materials and other post-opening assistance.
35
For single-payment consumer loans that we make directly
(company-funded loans), which have terms ranging from 1 to
45 days, revenues are recognized using the interest method.
Loan origination fees are recognized as an adjustment to the
yield on the related loan. Our reserve policy regarding these
loans is summarized below in “Consumer Loan Loss Reserves
Policy.”
Secured pawn loans are offered at most of our retail financial
services locations in the United Kingdom and at our pawn shops
in Europe. Pawn loans are short-term in nature and are secured
by the customer’s personal property (“pledge”).
At the time of pledge, the loan is recorded and interest and
fees, net of costs are accrued for over the life of the loan. If
the loan is not repaid, the collateral is deemed forfeited and
the pledged item will be sold to a smelter, kept for retail sale
or go up for auction. If the item is sold, proceeds are used to
recover the loan value, interest accrued and fees. Generally,
excess funds received from the sale are repaid to the customer.
As with our single-payment consumer loans, revenues are
recognized using the interest rate method and loan origination
fees, net, are recognized as an adjustment to the yield on the
related loan. Since the pawn lawns are secured by the
customer’s pledged item, we do not maintain a loan loss
reserve for potential future losses.
DFS fee income associated with originated loan contracts is
recognized as revenue by us concurrent with the funding of loans
by the third party lending financial institution. We also earn
additional fee income from sales of service agreement and
guaranteed asset protection (“GAP”) insurance
contracts. DFS may be charged back (“chargebacks”) for
service agreement and GAP fees in the event contracts are
prepaid, defaulted or terminated. Service agreement and GAP
contract fees are recorded at the time the contracts are sold
and a reserve for future chargebacks is established based on
historical operating results and the termination provisions of
the applicable contracts. Service warranty and GAP contract
fees, net of estimated chargebacks, are included in Other
Revenues in the accompanying consolidated statements of
operations.
Consumer
Loan Loss Reserves Policy
We maintain a loan loss reserve for anticipated losses for
consumer loans that we directly originate. To estimate the
appropriate level of loan loss reserves, we consider known
relevant internal and external factors that affect loan
collectability, including the amount of outstanding loans owed
to us, historical loans charged off, current collection patterns
and current economic trends. Our current loan loss reserve is
based on its net charge-offs, typically expressed as a
percentage of loan amounts originated for the last twelve months
applied against the principal balance of outstanding loans that
we make directly. As these conditions change, we may need to
make additional allowances in future periods.
Generally, when a loan is originated, the customer receives the
cash proceeds in exchange for a post-dated check or a written
authorization to initiate a charge to the customer’s bank
account on the stated maturity date of the loan. If the check or
the debit to the customer’s account is returned from the
bank unpaid, the loan is placed in default status and an
allowance for this defaulted loan receivable is established and
is included in loan loss provision expense in the period that
the loan is placed in default status. This reserve is reviewed
monthly and any additional provision to the loan loss reserve as
a result of historical loan performance, current collection
patterns and current economic trends is included in loan loss
provision expense. If a loan remains in defaulted status for an
extended period of time, typically 180 days, an allowance
for the entire amount of the loan is recorded and the receivable
is ultimately charged off. Recoveries on loans that were
completely charged off are credited to the allowance when
collected.
The receivable for defaulted single-payment loans, net of the
allowance of $37.7 million at June 30, 2011 and
$21.8 million at June 30, 2010, is reported on our
balance sheet in loans in default, net, and was
$13.8 million at June 30, 2011 and $9.3 million
at June 30, 2010.
Goodwill
and Indefinite-Lived Intangible Assets
Goodwill is the excess of cost over the fair value of the net
assets of the business acquired. In accordance with the
Intangibles Topic of the FASB Codification, goodwill is assigned
to reporting units, which we have determined to be our
reportable operating units of the United States Retail, Canada,
DFS, and the United Kingdom, Sefina, MEM and Poland (which are
collectively reported in Europe). We also have a corporate
36
reporting unit which consists of costs related to corporate
management, oversight and infrastructure, investor relations and
other governance activities. Because of the limited activities
of the corporate reporting unit, no goodwill has been assigned
to it. Goodwill is assigned to the reporting unit that benefits
from the synergies arising from each particular business
combination. The Company determines reporting units based on a
review of operating segments, and to the extent present, the
underlying components. To the extent that two or more operating
segment components have similar economic characteristics, their
results are combined in one reporting unit. Goodwill is
evaluated for impairment on an annual basis on June 30 or
between annual tests if events occur or circumstances change
that would more likely than not reduce the fair value of a
reporting unit below its carrying amount. To accomplish this, we
are required to determine the carrying value of each reporting
unit by assigning the assets and liabilities, including the
existing goodwill and intangible assets, to those reporting
units. We are then required to determine the fair value of each
reporting unit and compare it to the carrying amount of the
reporting unit. To the extent the carrying amount of a reporting
unit exceeds the fair value of the reporting unit, we would be
required to perform a second step to the impairment test because
this is an indication that the reporting unit goodwill may be
impaired. If after the second step of testing, the carrying
amount of a reporting unit exceeds the fair value of the
individual tangible and identifiable intangible assets, an
impairment loss would be recognized in an amount equal to the
excess of the implied fair value of the reporting unit’s
goodwill over its carrying value.
Indefinite-lived intangible assets consist of reacquired
franchise rights and DFS’ MILES program brand name and
Sefina and MEM trade names, which are deemed to have an
indefinite useful life and are not amortized.
Non-amortizable
intangibles with indefinite lives are tested for impairment
annually as of December 31, or whenever events or changes
in business circumstances indicate that an asset may be
impaired. If the estimated fair value is less than the carrying
amount of the intangible assets with indefinite lives, then an
impairment charge would be recognized to reduce the asset to its
estimated fair value.
We consider this to be one of the critical accounting estimates
used in the preparation of our consolidated financial
statements. We estimate the fair value of our reporting units
using a discounted cash flow analysis. This analysis requires us
to make various assumptions about revenues, operating margins,
growth rates, and discount rates. These assumptions are based on
our budgets, business plans, economic projections, anticipated
future cash flows and marketplace data. Assumptions are also
made for perpetual growth rates for periods beyond the period
covered by our long term business plan. We perform our goodwill
impairment test annually as of June 30, and our
non-amortizable
intangibles with indefinite lives are tested annually as of
December 31. At the date of our last evaluations, there was
no impairment of goodwill or reacquired franchise rights.
However, we may be required to evaluate the recoverability of
goodwill and other intangible assets prior to the required
annual assessment if we experience a significant disruption to
our business, unexpected significant declines in our operating
results, divestiture of a significant component of our business,
a sustained decline in market capitalization, particularly if it
falls below our book value, or a significant change to the
regulatory environment in which we operate. While we believe we
have made reasonable estimates and assumptions to calculate the
fair value of goodwill and indefinite-lived intangible assets,
it is possible that a material change could occur, including if
actual experience differs from the assumptions and
considerations used in our analyses. These differences could
have a material adverse impact on the consolidated results of
operations and cause us to perform the second step impairment
test, which could result in a material impairment of our
goodwill.
Derivative
Instruments and Hedging Activities
The Derivative and Hedging Topic of the FASB Codification
requires companies to provide users of financial statements with
an enhanced understanding of: (a) how and why an entity
uses derivative instruments, (b) how derivative instruments
and related hedged items are accounted for, and (c) how
derivative instruments and related hedged items affect an
entity’s financial position, financial performance, and
cash flows. This Topic also requires qualitative disclosures
about objectives and strategies for using derivatives,
quantitative disclosures about the fair value of and gains and
losses on derivative instruments, and disclosures about
credit-risk-related contingent features in derivative
instruments.
37
As required by the Derivative and Hedging Topic of the FASB
Codification, we record all derivatives on the balance sheet at
fair value. The accounting for changes in the fair value of
derivatives depends on the intended use of the derivative,
whether we have elected to designate a derivative in a hedging
relationship and apply hedge accounting and whether the hedging
relationship has satisfied the criteria necessary to apply hedge
accounting. Derivatives designated and qualifying as a hedge of
the exposure to changes in the fair value of an asset,
liability, or firm commitment attributable to a particular risk,
such as interest rate risk, are considered fair value hedges.
Derivatives designated and qualifying as a hedge of the exposure
to variability in expected future cash flows, or other types of
forecasted transactions, are considered cash flow hedges.
Derivatives may also be designated as hedges of the foreign
currency exposure of a net investment in a foreign operation.
Hedge accounting generally provides for the matching of the
timing of gain or loss recognition on the hedging instrument
with the recognition of the changes in the fair value of the
hedged asset or liability that are attributable to the hedged
risk in a fair value hedge or the earnings effect of the hedged
forecasted transactions in a cash flow hedge. We may enter into
derivative contracts that are intended to economically hedge
certain of our risks, even though hedge accounting does not
apply or we elect not to apply hedge accounting.
Put
Options
Our operations in Canada and Europe expose us to shifts in
currency valuations. From time to time, we have purchased put
options in order to protect aspects of our operations in the
Canada and Europe against foreign currency fluctuations. Out of
the money put options are generally used because they cost less
than completely averting risk using at the money put options,
and the maximum loss is limited to the purchase price of the
contracts. We have designated the purchased put options as cash
flow hedges of the foreign exchange risk associated with the
forecasted purchases of foreign-currency-denominated investment
securities. These cash flow hedges have maturities of less than
twelve months. For derivative instruments that are designated
and qualify as cash flow hedges, the effective portions of the
gain or loss on the derivative instrument are initially recorded
in accumulated other comprehensive income as a separate
component of stockholders’ equity and are subsequently
reclassified into earnings in the period during which the hedged
transaction is recognized in earnings. Any ineffective portion
of the gain or loss is reported in other income/expense on the
statement of operations. For options designated as hedges, hedge
effectiveness is measured by comparing the cumulative change in
the hedge contract with the cumulative change in the hedged
forecasted transactions, both of which are based on forward
rates.
Cross-Currency
Interest Rate Swaps
From time to time, we enter into cross-currency interest rate
swaps to protect against changes in cash flows attributable to
changes in both the benchmark interest rate and foreign exchange
rates on its foreign denominated variable rate term loan
borrowing. In the past, the Company designated derivative
contracts as cash flow hedges for accounting purposes. We
recorded foreign exchange re-measurement gains and losses
related to the term loans and also records the changes in fair
value of the cross-currency swaps each period in loss/gain on
derivatives not designated as hedges in our consolidated
statements of operations. Because these derivatives were
designated as cash flow hedges, we recorded the effective
portion of the after-tax gain or loss in other comprehensive
income, which was subsequently reclassified to earnings in the
same period that the hedged transactions affect earnings.
Non-designated
Hedges of Commodity Risk
In the normal course of business, we maintain inventories of
gold at our pawn shops. From time to time, we enter into
derivative financial instruments to manage the price risk
associated with forecasted gold inventory levels. Derivatives
not designated as hedges are not speculative and are used to
manage our exposure to commodity price risk but do not meet the
strict hedge accounting requirements of the Derivatives and
Hedging Topic of the FASB Codification. Changes in the fair
value of derivatives not designated in hedging relationships are
recorded directly in earnings.
38
Income
Taxes
As part of the process of preparing our consolidated financial
statements, we are required to estimate our income taxes in each
of the jurisdictions in which we operate. This process involves
estimating the actual current tax liability together with
assessing temporary differences resulting from differing
treatment of items for tax and accounting purposes. These
differences result in deferred tax assets and liabilities which
are included within our consolidated balance sheet. An
assessment is then made of the likelihood that the deferred tax
assets will be recovered from future taxable income, and to the
extent we believe that recovery is not likely, we establish a
valuation allowance. We intend to reinvest our foreign earnings
and a result, we do not provide a deferred tax liability on
foreign earnings.
We account for uncertainty in income taxes pursuant to Financial
Accounting Standards Board (the “FASB”) Accounting
Codification Statement (“ASC”) 740, Income Taxes
(“ASC 740”), (formerly FIN 48). We recognize
the tax benefit from an uncertain tax position only if it is
more likely than not the tax position will be sustained on
examination by the taxing authorities, based on the technical
merits of the position. The tax benefits recognized in the
financial statements from such positions are then measured based
on the largest benefit that has a greater than 50% likelihood of
being realized upon settlement. Interest and penalties related
to uncertain tax positions, if applicable, are recognized in the
income tax provision.
Results
of Operations
The percentages presented in the following table are based on
each respective fiscal year’s total consolidated revenues:
| |
|
|
|
|
|
|
|
|
|
|
|
|
|
|
|
|
|
|
|
|
|
|
|
|
|
|
|
June 30,
|
|
|
|
|
2009
|
|
|
2010
|
|
|
2011
|
|
|
|
|
Total revenues:
|
|
|
|
|
|
|
|
|
|
|
|
|
|
|
|
|
|
|
|
|
|
|
|
|
|
Consumer lending
|
|
$
|
266,506
|
|
|
|
50.3
|
%
|
|
$
|
319,465
|
|
|
|
50.5
|
%
|
|
$
|
429,152
|
|
|
|
54.4
|
%
|
|
Check cashing
|
|
|
164,598
|
|
|
|
31.0
|
%
|
|
|
149,474
|
|
|
|
23.6
|
%
|
|
|
144,054
|
|
|
|
18.3
|
%
|
|
Pawn service fees and sales
|
|
|
13,794
|
|
|
|
2.6
|
%
|
|
|
19,899
|
|
|
|
3.1
|
%
|
|
|
48,043
|
|
|
|
6.1
|
%
|
|
Money transfer fees
|
|
|
26,823
|
|
|
|
5.1
|
%
|
|
|
27,464
|
|
|
|
4.3
|
%
|
|
|
32,140
|
|
|
|
4.1
|
%
|
|
Gold sales
|
|
|
3,733
|
|
|
|
0.7
|
%
|
|
|
43,018
|
|
|
|
6.8
|
%
|
|
|
46,537
|
|
|
|
5.9
|
%
|
|
Other
|
|
|
54,706
|
|
|
|
10.3
|
%
|
|
|
73,961
|
|
|
|
11.7
|
%
|
|
|
88,441
|
|
|
|
11.2
|
%
|
|
|
|
|
|
|
|
|
|
|
|
|
|
|
|
|
|
|
|
|
|
|
|
|
|
|
|
Total consolidated revenues
|
|
|
530,160
|
|
|
|
100.0
|
%
|
|
|
633,281
|
|
|
|
100.0
|
%
|
|
|
788,367
|
|
|
|
100.0
|
%
|
|
|
|
|
|
|
|
|
|
|
|
|
|
|
|
|
|
|
|
|
|
|
|
|
|
|
|
Operating expenses:
|
|
|
|
|
|
|
|
|
|
|
|
|
|
|
|
|
|
|
|
|
|
|
|
|
|
Salaries and benefits
|
|
|
145,716
|
|
|
|
27.4
|
%
|
|
|
153,976
|
|
|
|
24.4
|
%
|
|
|
179,919
|
|
|
|
22.8
|
%
|
|
Provision for loan losses
|
|
|
52,136
|
|
|
|
9.8
|
%
|
|
|
45,876
|
|
|
|
7.2
|
%
|
|
|
73,551
|
|
|
|
9.3
|
%
|
|
Occupancy
|
|
|
41,812
|
|
|
|
7.9
|
%
|
|
|
43,280
|
|
|
|
6.8
|
%
|
|
|
51,032
|
|
|
|
6.5
|
%
|
|
Purchased gold costs
|
|
|
2,434
|
|
|
|
0.5
|
%
|
|
|
30,408
|
|
|
|
4.8
|
%
|
|
|
30,991
|
|
|
|
3.9
|
%
|
|
Depreciation
|
|
|
13,075
|
|
|
|
2.5
|
%
|
|
|
14,334
|
|
|
|
2.3
|
%
|
|
|
16,769
|
|
|
|
2.1
|
%
|
|
Other
|
|
|
93,183
|
|
|
|
17.5
|
%
|
|
|
99,067
|
|
|
|
15.6
|
%
|
|
|
128,911
|
|
|
|
16.4
|
%
|
|
|
|
|
|
|
|
|
|
|
|
|
|
|
|
|
|
|
|
|
|
|
|
|
|
|
|
Total operating expenses
|
|
|
348,356
|
|
|
|
65.7
|
%
|
|
|
386,941
|
|
|
|
61.1
|
%
|
|
|
481,173
|
|
|
|
61.0
|
%
|
|
|
|
|
|
|
|
|
|
|
|
|
|
|
|
|
|
|
|
|
|
|
|
|
|
|
|
Operating margin
|
|
|
181,804
|
|
|
|
34.3
|
%
|
|
|
246,340
|
|
|
|
38.9
|
%
|
|
|
307,194
|
|
|
|
39.0
|
%
|
|
|
|
|
|
|
|
|
|
|
|
|
|
|
|
|
|
|
|
|
|
|
|
|
|
|
|
Corporate expenses
|
|
|
68,217
|
|
|
|
12.9
|
%
|
|
|
86,824
|
|
|
|
13.7
|
%
|
|
|
104,057
|
|
|
|
13.2
|
%
|
|
Other depreciation and amortization
|
|
|
3,827
|
|
|
|
0.7
|
%
|
|
|
7,325
|
|
|
|
1.2
|
%
|
|
|
14,581
|
|
|
|
1.8
|
%
|
|
Interest expense, net
|
|
|
43,696
|
|
|
|
8.2
|
%
|
|
|
68,932
|
|
|
|
10.9
|
%
|
|
|
90,819
|
|
|
|
11.5
|
%
|
|
Loss on extinguishment of debt
|
|
|
—
|
|
|
|
—
|
%
|
|
|
9,531
|
|
|
|
1.5
|
%
|
|
|
—
|
|
|
|
—
|
%
|
|
Unrealized foreign exchange (gain) loss
|
|
|
(5,499
|
)
|
|
|
(1.0
|
)%
|
|
|
10,145
|
|
|
|
1.6
|
%
|
|
|
(47,031
|
)
|
|
|
(5.9
|
)%
|
|
(Gain) loss on derivatives not designated as hedges
|
|
|
(45
|
)
|
|
|
—
|
%
|
|
|
12,948
|
|
|
|
2.0
|
%
|
|
|
39,320
|
|
|
|
5.0
|
%
|
39
| |
|
|
|
|
|
|
|
|
|
|
|
|
|
|
|
|
|
|
|
|
|
|
|
|
|
|
|
June 30,
|
|
|
|
|
2009
|
|
|
2010
|
|
|
2011
|
|
|
|
|
Provision for (proceeds from)
|
|
|
|
|
|
|
|
|
|
|
|
|
|
|
|
|
|
|
|
|
|
|
|
|
|
litigation settlements
|
|
|
57,920
|
|
|
|
10.9
|
%
|
|
|
29,074
|
|
|
|
4.6
|
%
|
|
|
(3,749
|
)
|
|
|
(0.5
|
)%
|
|
Loss on store closings
|
|
|
10,340
|
|
|
|
2.0
|
%
|
|
|
3,314
|
|
|
|
0.5
|
%
|
|
|
868
|
|
|
|
0.1
|
%
|
|
Other (income) expense, net
|
|
|
(4,853
|
)
|
|
|
(0.9
|
)%
|
|
|
2,070
|
|
|
|
0.3
|
%
|
|
|
5,937
|
|
|
|
0.8
|
%
|
|
|
|
|
|
|
|
|
|
|
|
|
|
|
|
|
|
|
|
|
|
|
|
|
|
|
|
Income before income taxes
|
|
|
8,201
|
|
|
|
1.5
|
%
|
|
|
16,177
|
|
|
|
2.6
|
%
|
|
|
102,392
|
|
|
|
13.0
|
%
|
|
Income tax provision
|
|
|
15,023
|
|
|
|
2.8
|
%
|
|
|
21,369
|
|
|
|
3.4
|
%
|
|
|
37,098
|
|
|
|
4.8
|
%
|
|
|
|
|
|
|
|
|
|
|
|
|
|
|
|
|
|
|
|
|
|
|
|
|
|
|
|
Net (loss) income
|
|
|
(6,822
|
)
|
|
|
(1.3
|
)%
|
|
|
(5,192
|
)
|
|
|
(0.8
|
)%
|
|
|
65,294
|
|
|
|
8.2
|
%
|
|
Less: Net loss attributable to non-controlling interests
|
|
|
—
|
|
|
|
—
|
%
|
|
|
(293
|
)
|
|
|
—
|
%
|
|
|
(525
|
)
|
|
|
(0.1
|
)%
|
|
|
|
|
|
|
|
|
|
|
|
|
|
|
|
|
|
|
|
|
|
|
|
|
|
|
|
Net (loss) income attributable to DFC Global Corp.
|
|
$
|
(6,822
|
)
|
|
|
(1.3
|
)%
|
|
$
|
(4,899
|
)
|
|
|
(0.8
|
)%
|
|
$
|
65,819
|
|
|
|
8.3
|
%
|
|
|
|
|
|
|
|
|
|
|
|
|
|
|
|
|
|
|
|
|
|
|
|
|
|
|
|
Net (loss) income per share attributable to DFC Global Corp.:
|
|
|
|
|
|
|
|
|
|
|
|
|
|
|
|
|
|
|
|
|
|
|
|
|
|
Basic
|
|
$
|
(0.19
|
)
|
|
|
|
|
|
$
|
(0.14
|
)
|
|
|
|
|
|
$
|
1.73
|
|
|
|
|
|
|
Diluted
|
|
$
|
(0.19
|
)
|
|
|
|
|
|
$
|
(0.14
|
)
|
|
|
|
|
|
$
|
1.66
|
|
|
|
|
|
Constant
Currency Analysis
We maintain operations in Canada, Europe and the United States.
Approximately 80% of our revenues are originated in currencies
other than the U.S. Dollar, principally the Canadian Dollar
and British Pound Sterling. As a result, changes in our reported
revenues and profits include the impacts of changes in foreign
currency exchange rates. As additional information to the
reader, we provide “constant currency” assessments in
the following discussion and analysis to remove
and/or
quantify the impact of the fluctuation in foreign exchange rates
and utilize constant currency results in our analysis of segment
performance. Our constant currency assessment assumes foreign
exchange rates in the current fiscal periods remained the same
as in the prior fiscal year periods. For the fiscal year ended
June 30, 2011, the actual average exchange rates used to
translate the Canadian and United Kingdom’s results were
0.9995 and 1.5917, respectively. For constant currency reporting
purposes when comparing fiscal 2011 to fiscal 2010, the average
exchange rates used to translate the Canadian and United
Kingdom’s results for fiscal year ended June 30, 2011
were 0.9484 and 1.5811, which were the actual average exchange
rates used for the fiscal year ended June 30, 2010. For
constant currency reporting purposes when comparing fiscal 2010
to fiscal 2009, the average exchange rates used to translate the
Canadian and United Kingdom’s results for fiscal year ended
June 30, 2010 were 0.8625 and 1.6125, which were the actual
average exchange rates used for the fiscal year ended
June 30, 2009. All conversion rates are based on the
U.S. Dollar equivalent to one Canadian Dollar and one
British Pound Sterling.
We believe that our constant currency assessments are a useful
measure, indicating the actual growth and profitability of our
operations. Earnings from our subsidiaries are not generally
repatriated to the United States; therefore, we do not incur
significant economic gains or losses on foreign currency
transactions with our subsidiaries. To the extent funds are
transmitted between countries, we may be subject to realized
foreign exchange gains or losses. To the extent liabilities are
paid or assets are received in a currency other than the local
currency, we would incur realized transactional foreign exchange
gains or losses. Cash accounts are maintained in Canada and
Europe in local currency, and as a result, there is little, if
any diminution in value from the changes in currency rates.
Therefore, cash balances are available on a local currency basis
to fund the daily operations of the Canada and Europe business
units.
Fiscal
2011 Compared to Fiscal 2010
Revenues Total revenues for the year ended
June 30, 2011 increased by $155.1 million, or 24.5%,
as compared to the year ended June 30, 2010. The impact of
foreign currency accounted for $23.2 million of the
40
revenue increase with an additional increase of
$94.8 million related to the impact of new stores and
acquisitions. On a constant currency basis and excluding the
impacts of new stores and acquisitions, total revenues increased
by $37.1 million, or 5.9%. The increase was primarily the
result of a $40.6 million and $7.6 million increase in
revenues in Europe and Canada, respectively, primarily related
to consumer lending, partially offset by a $5.1 million
decrease in DFS revenues, and a $5.5 million decrease in
United States Retail revenues primarily related to the closure
of 36 under-performing store locations since the third quarter
of fiscal 2010.
Consolidated consumer lending revenue was $429.2 million
for the year ended June 30, 2011 compared to
$319.5 million for the year earlier period, an increase of
$109.7 million or 34.3%. The impact of foreign currency
fluctuations accounted for an increase of approximately
$13.3 million and the impact of new stores and acquisitions
was an increase of $40.1 million, including our
April 1, 2011 acquisition of MEM. On a constant currency
basis and excluding the impacts of new stores and acquisitions,
consumer lending revenues increased by approximately
$56.3 million. Consumer lending revenues in Canada and
Europe were up by $10.1 million and $50.3 million,
respectively (on a constant currency basis and excluding the
impacts of new stores and acquisitions), while United States
Retail consumer lending revenues were down approximately
$4.1 million, due to the closure of stores previously
referenced.
Consolidated check cashing revenue decreased $5.4 million,
or 3.6%, for the year ended June 30, 2011 compared to the
prior year period. There was an increase of approximately
$3.8 million related to foreign exchange rates and
increases from new stores and acquisitions of $5.3 million.
The remaining check cashing revenues were down
$14.5 million, or 9.7%, for the year ended June 30,
2011. On a constant currency basis and excluding the impacts of
new stores and acquisitions, the check cashing revenues in
Canada declined 5.0% and check cashing revenues in Europe were
down 17.0% for the year ended June 30, 2011 as compared to
the prior year period. Check cashing revenue in our United
States Retail business segment decreased by 11.6%, again heavily
influenced by the closure of stores since the third quarter of
fiscal 2010. Further, studies by the Federal Reserve Board and
others suggest that payments made by electronic means may be
displacing a portion of the paper checks traditionally cashed
that could be impacting our check cashing business. On a
consolidated constant currency basis, the face amount of the
average check cashed increased by 1.4% to $524 for the year
ended June 30, 2011 compared to $517 for the prior year
period, while the average fee per check cashed increased by 2.2%
to $20.06. There was also a decline of 8.0% in the number of
checks cashed for the year ended June 30, 2011 as compared
to the year ended June 30, 2010, down from 7.8 million
in the prior year period to 7.2 million in the current year.
Pawn service fees were $48.0 million for the year ended
June 30, 2011, representing an increase of
$28.1 million, compared to the prior year period. The
impact of foreign currency fluctuations accounted for an
increase of $2.2 million and increases of approximately
$22.3 million related to the impact from new stores and
acquisitions, including our December 31, 2010 acquisition
of Sefina. The remaining increase of $3.6 million, or
18.4%, is primarily due to management’s increased emphasis
on promoting and growing our pawn business in Europe.
For the year ended June 30, 2011, money transfer fees, gold
sales and all other revenues increased by $22.7 million. On
a constant currency basis and excluding the impacts of new
stores and acquisitions, these revenues decreased by
$8.4 million, or 5.8%, for the year ended June 30,
2011 as compared to the prior year period. The decrease was
primarily due to lower gold sales in Europe, as well as a
decrease in DFS revenues.
Operating Expenses Operating expenses were
$481.2 million for the year ended June 30, 2011
compared to $387.0 million for the year ended June 30,
2010, an increase of $94.2 million or 24.4%. The impact of
foreign currency accounted for an increase of
$12.6 million. There was an increase in the current
year’s operating expenses related to new stores and
acquisitions of approximately $64.7 million. On a constant
currency basis and excluding the impacts of new stores and
acquisitions, operating expenses increased by $16.9 million
as compared to the prior year. For the year ended June 30,
2011, total operating expenses decreased to 61.0% of total
revenue as compared to 61.1% of total revenue in the prior year.
After adjusting for constant currency reporting and excluding
the impacts of new stores and acquisitions, the percentage of
total operating expenses as compared to total revenue was 60.2%.
41
The consolidated loan loss provision, expressed as a percentage
of gross consumer lending revenue, was 17.1% for the year ended
June 30, 2011 compared to 14.4% for the year ended
June 30, 2010. The higher loan loss provision was
influenced by a changing mix of loan products and countries,
including a stronger mix of Internet-based loans in the United
Kingdom, which typically carry higher loan losses, but lower
overall operating costs than our store based business.
Relative to our primary business units, after excluding the
impacts of foreign currency and new stores and acquisitions,
operating expenses in Europe and Canada increased by
$28.0 million and $2.1 million, respectively, and
decreased by $10.8 million in United States Retail. The
increase in Europe reflects increased salary and benefits costs,
an increase in the provision for loan losses primarily due to
the mix of lending products, increased travel costs,
professional fees and franchise and other taxes, partially
offset by a decrease in costs related to the purchased gold
product. In Canada, increases in the provision for loan losses
and franchise and other taxes were partially offset by lower
professional fees. The decrease in United States Retail was
primarily a result of the closure of 36 store locations since
the third quarter of fiscal 2010.
Corporate Expenses Corporate expenses were
$104.1 million for the year ended June 30, 2011
compared to $86.8 million for the year ended June 30,
2010, or an increase of $17.3 million. The increase is
consistent with our increased investment in our global
infrastructure to support global store, product and platform
expansion plans, as well our investment in our global business
development team which is focused on global acquisition and
business development strategies and execution. The increase is
commensurate with our growth and as a percentage of revenue, is
lower than the prior year.
Other Depreciation and Amortization Other
depreciation and amortization was $14.6 million for the
year ended June 30, 2011 compared to $7.3 million for
the year ended June 30, 2010. The increase of
$7.3 million is primarily related to amortization of
identifiable intangible assets for DFS and MEM, as well as
amortization of recently reacquired franchise rights and
increased depreciation of corporate-related assets.
Interest Expense Interest expense, net was
$90.8 million for the year ended June 30, 2011
compared to $68.9 million for the same period in the prior
year, an increase of $21.9 million. Interest related to the
$600.0 million in principal amount of our
10.375% senior notes due 2016 accounted for
$17.1 million of the increase, net of a decrease in
interest expense associated with our repayment of all of our
U.K. and Canadian term debt. Included in interest expense for
the year ended June 30, 2011 is approximately
$19.0 million of non-cash interest expense related to the
amortization of accumulated charges related to the
discontinuance of hedge accounting for our cross currency
interest rate swaps, the non-cash interest expense associated
with our convertible debt and the amortization of various
deferred issuance costs. This non-cash interest expense was
approximately $16.4 million for the year ended
June 30, 2010, an increase of approximately
$2.6 million. The increase came almost entirely from the
expense related to the cross-currency interest rate swaps and
the amortization of debt issuance costs related to our new
global revolving credit facility.
Subsequent to the prepayment of the majority of our Canadian
term debt on December 23, 2009 with the proceeds from our
$600.0 million senior note offering completed in December
2009, we discontinued hedge accounting on these cross-currency
swaps because we no longer achieved the requirements of hedge
accounting. However, in accordance with the Derivatives and
Hedging Topic of the FASB Codification, we continued to report
the net loss related to the discontinued cash flow hedge in
other accumulated comprehensive income and subsequently
reclassify such amounts into earnings over the remaining
original term of the derivative when the hedged forecasted
transactions are recognized in earnings. This resulted in a
$6.5 million non-cash interest charge for the year ended
June 30, 2011 as compared to a charge of approximately
$4.1 million for the year ended June 30, 2010. Because
the senior notes were issued by our Canadian subsidiary, we will
continue to reclassify such amounts into earnings over the
remaining original term of the derivative, which expires in
October 2012.
Unrealized Foreign Exchange
Gain/Loss Unrealized foreign exchange gains of
$47.0 million for the year ended June 30, 2011 is
primarily due to the unrealized foreign exchange gains
associated with our $600 million in senior notes, partially
offset by unrealized foreign exchange losses on intercompany
debt. The senior notes were issued by our indirectly
wholly-owned Canadian subsidiary and are denominated in a
currency other than the reporting currency of that entity. Near
the end of fiscal 2010, we retired the remaining
42
term debt related to our prior credit agreement, leaving only
the Canadian subsidiary’s $600 million in senior notes
outstanding. The impact of all prospective changes in the
exchange rate between the U.S. Dollar and the Canadian
Dollar will be reflected in our earnings as “unrealized
foreign exchange gains and losses”. The unrealized foreign
exchange loss of $10.1 million for the year ended
June 30, 2010 was primarily due to the unrealized foreign
exchange loss on our senior notes, as well as unrealized foreign
exchange losses on intercompany debt.
Loss on derivatives not designated as
hedges Loss on derivatives not designated as
hedges was $39.3 million and $12.9 million for the
years ended June 30, 2011 and 2010, respectively, related
to the change in fair value and the net additional cash payments
to the swap counter parties associated with our cross-currency
interest rate swaps in Canada that are related to the legacy
term loans. The change in fair value is related to both the
changes in market interest rates and foreign exchange rates.
(Proceeds from) Provision for Litigation
Settlements Proceeds from litigation settlements
during the year ended June 30, 2011 was $3.7 million,
primarily related to cash received from Canadian franchisees for
their portion of settlement costs for the Canadian class
actions. Provisions for litigation settlements during the year
ended June 30, 2010 was $29.1 million primarily
related to the settlements of purported class actions in British
Columbia and Canadian Maritimes and for the potential settlement
of other pending and purported Canadian class action proceedings.
Loss on Store Closings During the year ended
June 30, 2011, we recorded $0.9 million of store
closing expense related closures of underperforming and
overlapping stores primarily in the United States and Canada.
During the year ended June 30, 2010, we recorded additional
expense related to stores closed during fiscal 2009 of
approximately $1.0 million. This additional expense was
related to adjustment assumptions related to the
sub-lease
potential of some of the locations and the closure of other
non-performing U.S. store locations. We also incurred
additional expenses of $1.4 million for current period
store closures. Lastly, we incurred approximately
$0.9 million expense in relation to the buyout of certain
“We The People” franchises.
Other (Income) Expense During the year ended
June 30, 2011, we recorded other expenses of approximately
$5.9 million, primarily due to acquisition-related
activities of $8.7 million, offset by other income items of
$2.8 million.
During the year ended June 30, 2010, we recorded other
expenses of approximately $2.1 million. The primary
elements of these expenses were $2.8 million in expenses
related to acquisition-related activities, and $0.9 million
in expenses associated with our activities to hedge foreign
currency risks in the operating results of Canada and Europe,
partially offset by $1.8 million in other income items.
Income Tax Provision The provision for income
taxes was $37.1 million for the year ended June 30,
2011 compared to a tax provision of $21.4 million for the
year ended June 30, 2010. Our effective tax rate was 36.2%
for the year ended June 30, 2011 and was 132.1% for the
year ended June 30, 2010 which is a combination of an
effective tax rate of 96.1% on continuing operations and other
one- time charges, increased by the impact of a change in the
reserve for an uncertain tax position related to transfer
pricing and the impact of the convertible debt discount. The
impact to our fiscal 2010 provision for income taxes related to
these two items was $5.8 million. The decrease in the
effective tax rate for the year ended June 30, 2011 as
compared to the prior year was primarily a result of improved
results in the United States, lower global statutory tax rates,
the lower statutory tax rates associated with our recently
acquired Scandinavian and UK businesses and the taxation of the
unrealized foreign currency exchange gains (classified as
ordinary) in Canada at the lower statutory rate, as well as the
unrealized foreign currency exchange gains (classified as
capital) in Canada which are only 50% taxable. Our effective tax
rate differs from the U.S. federal statutory rate of 35%
due to foreign taxes, permanent differences and a valuation
allowance on U.S. and foreign deferred tax assets and the
aforementioned changes to our reserve for uncertain tax
positions. Prior to the global debt restructuring completed in
the Company’s fiscal year ended June 30, 2007,
interest expense in the U.S. resulted in U.S. tax
losses, thus generating deferred tax assets.
We provided a valuation allowance against all of its
U.S. deferred tax assets at June 30, 2011 and 2010
which amounted to $98.1 million and $98.3 million,
respectively. The $98.1 million in deferred tax assets
43
consists of $44.9 million related to net operating losses
and the reversal of temporary differences, and
$53.3 million related to excess foreign tax credits
resulting from dividends or deemed dividends from the fiscal
years ended 2007, 2008 and 2010. Because realization is not
assured, we have not recorded the benefit of the deferred tax
assets. The net operating loss carry forward available to offset
future taxable income at June 30, 2011 was
$78.2 million compared to $68.3 million at
June 30, 2010. This increase was the result of an
adjustment required by a Competent Authority settlement and by a
current year U.S. loss. The federal net operating loss
carry forwards will begin to expire in 2025, if not utilized. We
have foreign tax credit carry forwards of approximately
$53.2 million, which will begin to expire in 2017 if not
utilized.
We believe that our ability to utilize pre-2007 net
operating losses in a given year will be limited to
$9.0 million under Section 382 of the Internal Revenue
Code, which we refer to as the Code, because of changes of
ownership resulting from the June 2006 follow-on equity
offering. In addition, any future debt or equity transactions
may reduce our net operating losses or further limit its ability
to utilize the net operating losses under the Code. Our
follow-on equity offering in April 2011 did not impact this
limitation. The net operating loss carry forward as of
June 30, 2011 is $78.2 million. The deferred tax asset
related to excess foreign tax credits is also fully offset by a
valuation allowance of $53.2 million. This represents a
decrease of $1.4 million for the period related to the
Competent Authority settlement discussed above which is
partially offset by a
true-up from
prior periods.
At June 30, 2010 and 2011 we had $10.3 million and
$14.2 million, respectively, of unrecognized tax benefits,
primarily related to transfer pricing matters, which if
recognized, would reduce the effective tax rate. We recognized
interest and penalties related to uncertain tax positions in
income tax expense. As of June 30, 2011, we had
approximately $1.7 million of accrued interest related to
uncertain tax positions which represents a $0.8 million
increase from the prior year. The provision for unrecognized tax
benefits, including accrued interest, is included in income
taxes payable.
The tax years ending June 30, 2008 through 2011 remain open
to examination by the taxing authorities in the United States,
United Kingdom and Canada.
Fiscal
2010 Compared to Fiscal 2009
Revenues Total revenues for the year ended
June 30, 2010 increased by $103.1 million, or 19.5%,
as compared to the year ended June 30, 2009. The impact of
foreign currency accounted for $22.0 million of the
increase and the impact of new stores and acquisitions
contributed $68.2 million of the increase. On a constant
currency basis and excluding the impacts of new stores and
acquisitions, total revenues increased by $12.9 million, or
2.4%. The increase was primarily the result of a
$14.7 million and $25.1 million increase in revenues
in Canada and Europe, respectively, primarily related to
consumer lending and gold sales, partially offset by a
$25.5 million decrease in revenues in United States Retail
primarily related to the closure of 60 under-performing store
locations during the fourth quarter of fiscal 2009.
Consolidated fees from consumer lending were $319.5 million
for the year ended June 30, 2010 compared to
$266.5 million for the year earlier period, an increase of
$53.0 million, or 19.9%. The impact of foreign currency
fluctuations accounted for an increase of approximately
$11.9 million and the impact of new stores and acquisitions
represented an increase of $38.9 million. On a constant
currency basis and excluding the impacts of new stores and
acquisitions, consumer lending revenues increased by
approximately $2.2 million. United States Retail consumer
lending revenues were down approximately $14.0 million
while consumer lending revenues in Canada and Europe were up by
$12.8 million and $3.6 million, respectively (on a
constant currency basis and excluding the impacts of new stores
and acquisitions).
Consolidated check cashing revenue decreased by
$15.1 million, or 9.2%, for the year ended June 30,
2010 compared to the prior year period. There was an increase of
approximately $5.3 million related to foreign exchange
rates and increases from new stores and acquisitions of
$2.6 million. The remaining check cashing revenues were
down $23.0 million, or 14.0%, for the year ended
June 30, 2010. On a constant currency basis and excluding
the impacts of new stores and acquisitions, the check cashing
revenues in Canada declined 6.7% and check cashing revenues in
Europe were down 20.7% for the year ended June 30, 2010 as
compared to the prior year, reflecting the continuing global
recession. Check cashing revenues from our
44
United States Retail business segment decreased by 17.9%, again
significantly influenced by the closure of stores during fiscal
2009 and the economic downturn. On a consolidated constant
currency basis, the face amount of the average check cashed
increased by 0.6% to $484 for the year ended June 30, 2010
compared to $487 for the prior year period, while the average
fee per check cashed increased by 3.8% to $18.46. There was also
a decline of 15.6% in the number of checks cashed for the year
ended June 30, 2010 as compared to the year ended
June 30, 2009, down from 9.3 million in the prior year
to 7.8 million in the current year.
Pawn service fees were $19.9 million for the year ended
June 30, 2010, representing an increase of
$6.1 million, or 44.3%, compared to prior year period. The
impact of foreign currency fluctuations accounted for a nominal
decrease of $0.4 million and increases of approximately
$3.8 million related to the impact from new stores and
acquisitions. The remaining increase of $2.7 million or
19.6% is primarily due to management’s increased emphasis
on promoting and growing the U.K. pawn business.
For the year ended June 30, 2010, money transfer fees, gold
sales and all other revenues increased by $59.2 million. On
a constant currency basis and excluding the impacts of new
stores and acquisitions, these revenues increased by
$30.9 million, or 36.2%, for the year ended June 30,
2010 as compared to the prior year. The increase was primarily
due to increased gold sales in both Europe and Canada, the debit
card business and the success of the foreign exchange product.
Operating Expenses Operating expenses were
$387.0 million for the year ended June 30, 2010
compared to $348.4 million for the year ended June 30,
2009, an increase of $38.6 million or 11.1%. The impact of
foreign currency accounted for an increase of
$11.3 million. There was an increase in the current
year’s operating expenses related to new stores and
acquisitions of approximately $52.7 million. On a constant
currency basis and excluding the impacts of new stores and
acquisitions, operating expenses decreased by $25.4 million
as compared to the prior year. For the year ended June 30,
2010, total operating expenses decreased to 61.1% of total
revenue compared to 65.7% of total revenue in the prior year.
After adjusting for constant currency reporting and excluding
the impacts of new stores and acquisitions, the percentage of
total operating expenses as compared to total revenue was 59.5%.
Relative to our primary business units, after excluding the
impacts of foreign currency and acquisitions, operating expenses
decreased in Canada and United States Retail by
$4.1 million and $34.6 million, respectively, and
increased by $15.1 million in Europe. These decreases in
Canada and United States Retail were a result of a focus on cost
reductions in addition to the closure of approximately 114
United States stores during fiscal 2009. The increase in Europe
is a result of increased purchased gold costs.
Corporate Expenses Corporate expenses were
$86.8 million for the year ended June 30, 2010
compared to $68.2 million for the prior year or an increase
of $18.6 million. On a constant currency basis, corporate
expenses increased by approximately $16.9 million
reflecting an increased investment in our global infrastructure
to support global store, product and platform expansion plans as
well our investment in our global business development team
which is focused on acquisition and business development
strategies and execution.
Other Depreciation and Amortization Other
depreciation and amortization was $7.3 million for the year
ended June 30, 2010 compared to $3.8 million for the
year ended June 30, 2009. The increase of $3.5 million
is primarily related to DFS’ amortization of identifiable
intangible assets.
Extinguishment of Debt In connection with our
refinancing activities during the year ended June 30, 2010,
certain non-recurring expenses have been reported in the current
period’s results. There were $9.5 million of expenses
related to the repayment of our term loan debt and the exchange
of $120.0 million and repurchase of $35.2 million of
our 2.875% Senior Convertible Debt due 2027 that have been
reported as “Extinguishment of Debt”. Of that amount,
approximately $7.0 million related to the write-off of
pre-existing deferred term debt costs that were being amortized
over the life of the term debt. The other primary element of
this expense was a $3.9 million non-cash charge related to
our U.K. cross-currency interest rate swaps that had been
terminated in May 2009. Because the termination of the debt
caused management to conclude that the future cash flows
originally
45
hedged would no longer occur, the net loss related to the
discontinued cash flow hedge that was included in other
comprehensive income was reclassified to the income statement.
Offsetting these charges in part was a $1.5 million gain on
the repurchase of the 2027 Notes.
Interest Expense Interest expense, net was
$68.9 million for the twelve months ended June 30,
2010 compared to $43.7 million for the same period in the
prior year. Interest related to our newly issued
$600.0 million principal 10.375% Senior Notes due 2016
accounted for $19.2 million of the increase, net of a
decrease in interest expense associated with our repayment of
all of our U.K. and Canadian term debt. In addition, interest
expense associated with our revolving credit facility and the
reduction in the amount of interest income earned by us
accounted for $1.3 million of the net increase.
Non-cash interest accounted for $4.7 million of the overall
increase. This increase is comprised of $4.2 million
related to the amortization of accumulated charges related to
the discontinuance of hedge accounting for our cross currency
interest rate swaps and $0.5 million related to the
amortization of deferred issuance costs.
|
|
|
| |
•
|
Subsequent to the prepayment of the majority of the Canadian
term debt on December 23, 2009, with the proceeds from our
$600.0 million senior note offering completed in December
2009 we discontinued hedge accounting on these cross-currency
swaps because we no longer achieved the requirements of hedge
accounting. However, in accordance with the Derivatives and
Hedging Topic of the FASB Codification, we continued to report
the net loss related to the discontinued cash flow hedge in
other accumulated comprehensive income and subsequently
reclassify such amounts into earnings over the remaining
original term of the derivative when the hedged forecasted
transactions are recognized in earnings. This resulted in a
$3.3 million non-cash interest charge for Fiscal 2010. Due
to the newly issued $600.0 million principal
10.375% Senior Notes due 2016 in Canada, we will continue
to reclassify such amounts into earnings over the remaining
original term of the derivative.
|
| |
| |
•
|
Subsequent to the early settlement in May 2009 of its two
cross-currency interest rate swaps hedging variable-rate
borrowings at our foreign subsidiary in the United Kingdom, we
discontinued hedge accounting on these cross-currency swaps. In
accordance with the Derivatives and Hedging Topic of the FASB
Codification, we were required to continue to report the net
loss related to the discontinued cash flow hedge in other
comprehensive income included in shareholders’ equity and
subsequently reclassify such amounts into earnings over the
remaining original term of the derivative when the hedged
forecasted transactions are recognized in earnings. This
resulted in a $0.9 million non-cash interest charge for
Fiscal 2010. As a result of the repayment of all of the United
Kingdom’s term debt, we reclassified all of the U.K.’s
remaining net loss from other comprehensive income into earning.
This charge to earnings is included as “Loss on
Extinguishment of Debt” which is included in the Statement
of Operations.
|
Unrealized Foreign Exchange
Gain/Loss Unrealized foreign exchange loss of
$10.1 million for the year ended June 30, 2010 is due
primarily to the unrealized foreign exchange losses associated
with our newly issued $600 million senior notes and the
remaining term debt balance related to the Company’s 2006
Credit Agreement, as amended. All of this debt was issued by our
indirectly wholly-owned Canadian and U.K. subsidiaries and was
denominated in currencies other than the reporting currency of
those entities. Near the end of the fiscal year, we retired the
remaining term debt related to the 2006 Credit Agreement, as
amended, leaving only the Canadian subsidiary’s
$600 million in senior notes outstanding. The impact of all
prospective changes in the exchange rate between the
U.S. Dollar and the Canadian Dollar will be reflected in
our earnings as “unrealized foreign exchange gains and
losses”. The unrealized foreign exchange gain recorded for
the year ended June 30, 2009 was related to the term debt
outstanding under the 2006 Credit Agreement, as amended.
Loss on derivatives not designated as
hedges Loss on derivatives not designated as
hedges was $12.9 million for the year ended June 30,
2010 related to the change in fair value and the net additional
cash payments to the swap counter parties associated with our
cross-currency interest rate swaps in Canada related to the
legacy term loans. The change in fair value related to both the
changes in market interest and foreign
46
exchange rates and amendments that were made to the swap
agreements required in connection with the debt offerings
completed during fiscal 2010.
Provision for Litigation Settlements Provision
for litigation settlements during the year ended June 30,
2010 was $29.1 million, primarily related to the
settlements of purported class actions during the fiscal 2010 in
British Columbia and the Canadian Maritimes and for the
potential settlement of other pending and purported Canadian
class action proceedings. During the year ended June 30,
2009, we recorded $57.9 million of Canadian litigation
settlement provisions primarily related to the settlement of our
class action litigation in the province of Ontario.
Loss on Store Closings During the year ended
June 30, 2010, we recorded additional expense related to
stores closed during fiscal 2009 of approximately
$1.0 million. This additional expense was related to
adjustment assumptions related to the
sub-lease
potential of some of the locations and the closure of other
non-performing U.S. store locations. We also incurred
additional expenses of approximately $1.4 million for
current period store closures. Lastly, we incurred approximately
$0.9 million of expense in relation to the buy-out of
certain “We the People” franchises. During the fiscal
year ended June 30, 2009, we recorded store closure
expenses of $10.3 million of which $7.2 million
related to the U.S. Retail business, $3.0 million
related to the Canadian business and the remaining
$0.2 million related to the U.K. operations.
Income Tax Provision The provision for income
taxes was $21.4 million for fiscal 2010 compared to a
provision of $15.0 million for fiscal 2009. Our effective
tax rate for fiscal 2010 is 132.1%, which is a combination of an
effective rate of 96.1% on continuing operations and other
one-time charges increased by the impact of a change in the
reserve for an uncertain tax position related to transfer
pricing, and the impact of the convertible debt discount. The
impact to our fiscal 2010 provision for income taxes related to
these two items was $5.8 million. Our effective tax rate
differs from the statutory rate of 35% due to foreign taxes,
permanent differences and a valuation allowance on U.S. and
foreign deferred tax assets and the aforementioned changes to
our reserve for uncertain tax positions.
We believe that our ability to utilize pre-2007 net
operating losses in a given year will be limited to
$9.0 million under Section 382 of the Internal Revenue
Code, which we refer to as the Code, because of changes of
ownership resulting from our June 2006 follow-on equity
offering. In addition, any future debt or equity transactions
may reduce our net operating losses or further limit our ability
to utilize the net operating losses under the Code. The net
operating loss carry forward as of June 30, 2010 is
$68.3 million. The deferred tax asset related to excess
foreign tax credits is also fully offset by a valuation
allowance of $54.6 million. Additionally, we maintain
foreign deferred tax assets in the amount of $24.6 million.
Of this amount, $1.1 million was recorded by our Canadian
affiliate during fiscal 2007 related to a foreign currency loss
sustained in connection with the hedge of its term loan. This
deferred tax asset was offset by a full valuation allowance of
$1.1 million since the foreign currency loss is capital in
nature and at this time we have not identified any potential for
capital gains against which to offset the loss. This deferred
tax asset and valuation allowance was utilized in connection
with the repayment of the 2006 Canadian term debt in December
2009, but was replaced by a $1.0 million deferred tax asset
and valuation allowance related to the Canadian cross-currency
interest rate swap.
We recognize interest and penalties related to uncertain tax
positions in income tax expense. As of June 30, 2010, we
had approximately $0.9 million of accrued interest related
to uncertain tax positions which remained materially unchanged
from the prior year. The provision for unrecognized tax
benefits, including accrued interest, is included in income
taxes payable.
47
Review of
Reportable Segments
The segment discussions that follow describe the significant
factors contributing to the changes in results for each segment.
Fiscal
2011 compared to Fiscal 2010
| |
|
|
|
|
|
|
|
|
|
|
|
|
|
|
|
|
|
|
|
|
|
% Increase/
|
|
|
|
|
|
|
|
|
|
|
Decrease -
|
|
|
|
|
Year Ended June 30,
|
|
|
Margin
|
|
|
|
|
2010
|
|
|
2011
|
|
|
Change
|
|
|
|
|
(Dollars in thousands)
|
|
|
|
|
|
|
|
United States Retail revenues:
|
|
|
|
|
|
|
|
|
|
|
|
|
|
Consumer lending
|
|
$
|
65,675
|
|
|
$
|
61,601
|
|
|
|
−6.2
|
%
|
|
Check cashing
|
|
|
46,459
|
|
|
|
41,083
|
|
|
|
−11.6
|
%
|
|
Money transfer fees
|
|
|
4,841
|
|
|
|
4,810
|
|
|
|
−0.6
|
%
|
|
Gold sales
|
|
|
427
|
|
|
|
2,499
|
|
|
|
485.2
|
%
|
|
Other
|
|
|
10,352
|
|
|
|
12,219
|
|
|
|
18.0
|
%
|
|
|
|
|
|
|
|
|
|
|
|
|
|
|
|
Total United States Retail revenues
|
|
$
|
127,754
|
|
|
$
|
122,212
|
|
|
|
−4.3
|
%
|
|
Operating margin
|
|
|
21.2
|
%
|
|
|
26.4
|
%
|
|
|
5.2 pts.
|
|
|
Canada revenues:
|
|
|
|
|
|
|
|
|
|
|
|
|
|
Consumer lending
|
|
$
|
147,851
|
|
|
$
|
170,667
|
|
|
|
15.4
|
%
|
|
Check cashing
|
|
|
69,414
|
|
|
|
73,379
|
|
|
|
5.7
|
%
|
|
Pawn service fees and sales
|
|
|
—
|
|
|
|
30
|
|
|
|
100.0
|
%
|
|
Money transfer fees
|
|
|
16,439
|
|
|
|
19,203
|
|
|
|
16.8
|
%
|
|
Gold sales
|
|
|
11,917
|
|
|
|
14,767
|
|
|
|
23.9
|
%
|
|
Other
|
|
|
31,199
|
|
|
|
32,556
|
|
|
|
4.3
|
%
|
|
|
|
|
|
|
|
|
|
|
|
|
|
|
|
Total Canada revenues
|
|
$
|
276,820
|
|
|
$
|
310,602
|
|
|
|
12.2
|
%
|
|
Operating margin
|
|
|
48.8
|
%
|
|
|
49.5
|
%
|
|
|
0.7 pts.
|
|
|
Europe revenues:
|
|
|
|
|
|
|
|
|
|
|
|
|
|
Consumer lending
|
|
$
|
105,939
|
|
|
$
|
196,884
|
|
|
|
85.8
|
%
|
|
Check cashing
|
|
|
33,601
|
|
|
|
29,592
|
|
|
|
−11.9
|
%
|
|
Pawn service fees and sales
|
|
|
19,899
|
|
|
|
48,013
|
|
|
|
141.3
|
%
|
|
Money transfer fees
|
|
|
6,184
|
|
|
|
8,127
|
|
|
|
31.4
|
%
|
|
Gold sales
|
|
|
30,674
|
|
|
|
29,271
|
|
|
|
−4.6
|
%
|
|
Other
|
|
|
17,165
|
|
|
|
22,007
|
|
|
|
28.2
|
%
|
|
|
|
|
|
|
|
|
|
|
|
|
|
|
|
Total Europe revenues
|
|
$
|
213,462
|
|
|
$
|
333,894
|
|
|
|
56.4
|
%
|
|
Operating margin
|
|
|
35.6
|
%
|
|
|
32.8
|
%
|
|
|
(2.8 pts.
|
)
|
|
Other revenues:
|
|
|
|
|
|
|
|
|
|
|
|
|
|
Total Other revenues (included in other revenue)
|
|
|
15,245
|
|
|
|
21,659
|
|
|
|
42.1
|
%
|
|
Operating margin
|
|
|
53.7
|
%
|
|
|
53.9
|
%
|
|
|
0.2 pts.
|
|
|
|
|
|
|
|
|
|
|
|
|
|
|
|
|
Total revenue
|
|
$
|
633,281
|
|
|
$
|
788,367
|
|
|
|
24.5
|
%
|
|
|
|
|
|
|
|
|
|
|
|
|
|
|
|
Operating margin
|
|
$
|
246,340
|
|
|
$
|
307,194
|
|
|
|
24.7
|
%
|
|
|
|
|
|
|
|
|
|
|
|
|
|
|
|
Operating margin %
|
|
|
38.9
|
%
|
|
|
39.0
|
%
|
|
|
0.1 pts.
|
|
48
The following table represents each reportable segment’s
revenue as a percentage of total segment revenue and each
reportable segment’s pre-tax income as a percentage of
total segment pre-tax income:
| |
|
|
|
|
|
|
|
|
|
|
|
|
|
|
|
|
|
|
|
Year Ended June 30,
|
|
|
|
|
Revenue
|
|
|
Pre-Tax Income
|
|
|
|
|
2010
|
|
|
2011
|
|
|
2010
|
|
|
2011
|
|
|
|
|
United States Retail
|
|
|
20.2
|
%
|
|
|
15.5
|
%
|
|
|
4.3
|
%
|
|
|
12.3
|
%
|
|
Canada
|
|
|
43.7
|
%
|
|
|
39.4
|
%
|
|
|
60.6
|
%(1)
|
|
|
47.8
|
%(4)
|
|
Europe
|
|
|
33.7
|
%
|
|
|
42.4
|
%
|
|
|
59.7
|
%(2)
|
|
|
60.8
|
%(5)
|
|
Other
|
|
|
2.4
|
%
|
|
|
2.7
|
%
|
|
|
−24.6
|
%(3)
|
|
|
−20.9
|
%(6)
|
|
|
|
|
|
|
|
|
|
|
|
|
|
|
|
|
|
|
|
|
|
|
100.0
|
%
|
|
|
100.0
|
%
|
|
|
100.0
|
%
|
|
|
100.0
|
%
|
|
|
|
|
(1) |
|
Excludes $2.2 million of unrealized foreign exchange
losses, $12.9 million of losses on derivatives not
designated as hedges and $22.6 million of provisions for
litigation settlements. |
| |
|
(2) |
|
Excludes $8.0 million of unrealized foreign exchange losses. |
| |
|
(3) |
|
Excludes $0.1 million of unrealized foreign exchange gains
and $6.4 million of provisions for litigation settlements. |
| |
|
(4) |
|
Excludes $51.7 million of unrealized foreign exchange
gains, $39.3 million of losses on derivatives not
designated as hedges and $3.9 million of proceeds from
litigation settlements. |
| |
|
(5) |
|
Excludes $2.0 million of unrealized foreign exchange losses. |
| |
|
(6) |
|
Excludes $2.7 million of unrealized foreign exchange losses
and $0.2 million of provisions for litigation settlements. |
United
States Retail
Total United States Retail revenues were $122.2 million for
the year ended June 30, 2011 compared to
$127.8 million for the year ended June 30, 2010, a
decrease of $5.5 million or 4.3%. We have closed 36
under-performing store locations in the United States since the
third quarter of fiscal 2010. The closure of these locations was
the primary factor in the
period-over-period
decrease. From a product perspective, this decline is primarily
related to decreases of $4.1 million and $5.4 million
in consumer lending and check cashing revenue, respectively. The
continued high rate of unemployment through all sectors of the
U.S. economy negatively impacts consumer lending volumes.
In this volatile economic environment, we have continued to take
a more cautious approach to lending in all of our segments,
including United States Retail. United States Retail funded loan
originations decreased 3.9% or $19.5 million, for the year
ended June 30, 2011 as compared to the year ended
June 30, 2010, primarily due to the closure of 36 stores in
the United States previously referenced.
The store closures contributed to the decrease in check cashing
revenue, as there were decreases in both the number of checks as
well as the face amount of checks that were presented in the
United States. The number of checks decreased year over year by
approximately 0.5 million with a corresponding decrease in
face value of approximately $216.1 million. The face amount
of the average check cashed by us in the United States increased
by 0.7%, and the average fee per transaction increased from
$13.81 to $14.34.
Operating margins in United States Retail increased to 26.4% for
the year ended June 30, 2011, compared to 21.2% for the
prior year period. United States Retail operating margins are
significantly lower than our other segments. The primary drivers
for this disparity are greater competition in the United States,
which effects revenue per store, higher U.S. salary costs
and somewhat higher occupancy costs. The closure of 36
underperforming stores is consistent with our United States
Retail strategy of closing unprofitable locations and focusing
on states with more favorable and stable regulatory
environments. We believe that this action has shown to be
positive, resulting in improved
year-over-year
operating margins.
United States Retail pre-tax profit was $11.1 million for
the year ended June 30, 2011 compared to $2.3 million
for the prior year. The improvement was primarily the result of
$5.3 million in increased
49
operating profits, decreased net corporate expenses of
$1.6 million, as well as a $1.1 million reduction in
loss on store closings.
Canada
Total revenues in Canada were $310.6 million for the year
ended June 30, 2011, an increase of 12.2%, or
$33.8 million, as compared to the year ended June 30,
2010. The impact of foreign currency rates accounted for
$15.9 million of this increase. On a constant currency
basis and excluding the impact of new stores and acquisitions,
revenues increased by $7.6 million. Consumer lending
revenues in Canada increased by $10.1 million or 6.8% (on a
constant currency basis and excluding new stores and
acquisitions) for the year ended June 30, 2011 as compared
to the prior year, reflecting new customer growth from renewed
television advertising campaigns in that market. Check cashing
revenues were down $3.5 million in Canada due to decreases
in the number of checks and the total value of checks cashed,
down by 3.8% and 3.2%, respectively (also on a constant currency
basis and excluding new stores and acquisitions). The average
face amount per check increased from $569.45 for the year ended
June 30, 2010 to $573.30 for the current year, while the
average fee per check increased by 0.1% for the year ended
June 30, 2011 as compared to the year ended June 30,
2010.
Operating expenses in Canada increased $15.1 million, or
10.7%, from $141.7 million for the year ended June 30,
2010 to $156.8 million for the year ended June 30,
2011. The impacts of changes in foreign currency rates resulted
in an increase of $8.0 million. On a constant currency
basis (excluding the impact of new stores and acquisitions),
operating expenses increased $2.1 million as compared to
the prior year. Increases in the provision for loan losses and
franchise and other taxes were offset by lower professional
fees. On a constant currency basis, provision for loan losses,
as a percentage of loan revenues, increased by 0.9 pts from
10.7% to 11.6%. Overall, Canada’s operating margin
percentage increased slightly from 48.8% for the year ended
June 30, 2010 to 49.5% for the year ended June 30,
2011. The increase in this area is primarily the result of the
lower professional fees.
Canada pre-tax income was $59.8 million for the year ended
June 30, 2011 compared to $3.7 million for the prior
year, an increase of $56.1 million. On a constant currency
basis, pre-tax income was $56.8 million, or an increase of
approximately $53.1 million. On a constant currency basis,
the positive impacts of increased operating margins of
$10.7 million, reduced provisions for litigation
settlements of $26.4 million, increased foreign exchange
gain of $51.1 million related to our senior notes and
intercompany debt, were partially offset by increased interest
expense of $13.9 million and an increased non-cash
valuation loss of $24.3 million on the cross currency
interest rate swaps. The year ended June 30, 2010 also
included a $3.6 million loss on extinguishment of debt
related to our December 2009 refinancing efforts.
Europe
Total revenues in Europe were $333.9 million for the year
ended June 30, 2011, compared to $213.5 million for
the year earlier period, an increase of $120.4 million or
56.4%. Sefina and MEM contributed $16.9 million and
$30.0 million of revenue for the year ended June 30,
2011, respectively. On a constant currency basis and excluding
the impact of new stores and acquisitions,
year-over-year
revenues in Europe have increased by $40.6 million, or
19.0%. Consumer lending and pawn service fees were up by
$50.3 million and $3.7 million, respectively. The
growth in consumer lending revenue reflects strong performance
from the internet lending business and also the continued strong
performance of the store-based business. Other revenues (gold
sales, foreign exchange products and debit cards) decreased by
$7.7 million primarily as a result of lower gold sales. As
in the United States Retail and Canada business segments, check
cashing revenues in Europe were impacted by the economic
downturn and the gradual migration away from paper checks and
decreased by approximately $5.7 million, or 17.0% (also on
a constant currency basis and excluding new stores and
acquisitions).
Operating expenses in Europe increased by $87.2 million, or
63.6%, from $137.2 million for the year ended June 30,
2010 as compared to $224.4 million for the current year. On
a constant currency basis and excluding new stores and
acquisitions (including our December 31, 2010 acquisition
of Sefina and April 1,
50
2011 acquisition of MEM), Europe’s operating expenses
increased by $28.0 million or 20.4%. There was an increase
of 5.2 pts relating to the provision for loan losses as a
percentage of loan revenues primarily due to the mix of lending
products including the Express Finance internet-based lending
business acquired in April 2009 and MEM. On a constant currency
basis, the rate for the year ended June 30, 2010 was 18.4%
while for the current year, the rate increased to 23.6%.
Additionally, salary and benefits costs, travel costs,
professional fees and franchise and other taxes also increased.
These increases were partially offset by decreased costs related
to our purchased gold product. On a constant currency basis, the
operating margin percentage in Europe decreased from 35.6% for
the year ended June 30, 2010 to 32.7% for the current year
primarily due to the increase in the provision for loan losses
noted above.
The pre-tax income in Europe was $53.3 million for the year
ended June 30, 2011 compared to $32.8 million for the
prior year, an increase of $20.5 million — on a
constant currency basis, the increase was $19.7 million.
Increased operating margins of $30.8 million and a reduced
unrealized foreign exchange loss of $6.2 million were
partially offset by increased interest expense of
$3.5 million, increased net corporate expenses of
$9.9 million, increased acquisition-related costs of
$5.6 million and increased amortization of
$3.0 million. The year ended June 30, 2010 also
included a $4.7 million loss on extinguishment of debt
related to the U.K. term loans which were substantially repaid
in December 2009.
Other
We acquired Dealers’ Financial Services (“DFS”)
on December 23, 2009. DFS provides fee based services to
enlisted military personnel seeking to purchase new and used
vehicles. DFS’s revenue comes from fees which are paid by a
third-party national bank and fees from the sale of ancillary
products such as service contracts and guaranteed asset
protection, or GAP insurance. DFS operates through an
established network of arrangements with approximately 690 new
and used car dealerships (both franchised and independent),
according to underwriting protocols specified by the third-party
national bank. DFS expenses are primarily compensation/benefits,
amortization of its identifiable intangible assets, professional
service fees and field management expenses.
DFS revenues were $21.6 million for the year ended
June 30, 2011 compared to $14.7 million for the year
ended June 30, 2010. We acquired Dealers’ Financial
Services, LLC on December 23, 2009 and therefore our
consolidated results for the year ended June 30, 2010
include 189 days of DFS results. Revenue for the DFS
business unit was unfavorably impacted during the period by the
continued high troop deployment to Iraq, Afghanistan and other
countries. We further enhanced our Internet and local media
advertising campaign programs during the year to increase
product awareness amongst the enlisted personnel at the military
bases we serve.
51
Fiscal
2010 compared to Fiscal 2009
| |
|
|
|
|
|
|
|
|
|
|
|
|
|
|
|
|
|
|
|
|
|
% Increase/
|
|
|
|
|
|
|
|
|
|
|
Decrease
|
|
|
|
|
Year Ended
June 30,
|
|
|
Margin
|
|
|
|
|
2009
|
|
|
2010
|
|
|
Change
|
|
|
|
|
(Dollars in thousands)
|
|
|
|
|
|
|
|
United States Retail revenues:
|
|
|
|
|
|
|
|
|
|
|
|
|
|
Consumer lending
|
|
$
|
79,612
|
|
|
$
|
65,675
|
|
|
|
−17.5
|
%
|
|
Check cashing
|
|
|
56,378
|
|
|
|
46,459
|
|
|
|
−17.6
|
%
|
|
Money transfer fees
|
|
|
5,926
|
|
|
|
4,841
|
|
|
|
−18.3
|
%
|
|
Gold sales
|
|
|
110
|
|
|
|
427
|
|
|
|
288.2
|
%
|
|
Other
|
|
|
10,844
|
|
|
|
10,352
|
|
|
|
−4.5
|
%
|
|
|
|
|
|
|
|
|
|
|
|
|
|
|
|
Total United States Retail revenues
|
|
$
|
152,870
|
|
|
$
|
127,754
|
|
|
|
−16.4
|
%
|
|
Operating margin
|
|
|
15.1
|
%
|
|
|
21.2
|
%
|
|
|
6.1 pts.
|
|
|
Canada revenues:
|
|
|
|
|
|
|
|
|
|
|
|
|
|
Consumer lending
|
|
$
|
121,518
|
|
|
$
|
147,851
|
|
|
|
21.7
|
%
|
|
Check cashing
|
|
|
67,830
|
|
|
|
69,414
|
|
|
|
2.3
|
%
|
|
Money transfer fees
|
|
|
15,092
|
|
|
|
16,439
|
|
|
|
8.9
|
%
|
|
Gold sales
|
|
|
170
|
|
|
|
11,917
|
|
|
|
6910.0
|
%
|
|
Other
|
|
|
31,657
|
|
|
|
31,199
|
|
|
|
−1.4
|
%
|
|
|
|
|
|
|
|
|
|
|
|
|
|
|
|
Total Canada revenues
|
|
$
|
236,267
|
|
|
$
|
276,820
|
|
|
|
17.2
|
%
|
|
Operating margin
|
|
|
44.1
|
%
|
|
|
48.8
|
%
|
|
|
4.7 pts.
|
|
|
Europe revenues:
|
|
|
|
|
|
|
|
|
|
|
|
|
|
Consumer lending
|
|
$
|
65,376
|
|
|
$
|
105,939
|
|
|
|
62.0
|
%
|
|
Check cashing
|
|
|
40,390
|
|
|
|
33,601
|
|
|
|
−16.8
|
%
|
|
Pawn service fees and sales
|
|
|
13,794
|
|
|
|
19,899
|
|
|
|
44.3
|
%
|
|
Money transfer fees
|
|
|
5,805
|
|
|
|
6,184
|
|
|
|
6.5
|
%
|
|
Gold sales
|
|
|
3,453
|
|
|
|
30,674
|
|
|
|
788.3
|
%
|
|
Other
|
|
|
10,217
|
|
|
|
17,165
|
|
|
|
68.0
|
%
|
|
|
|
|
|
|
|
|
|
|
|
|
|
|
|
Total Europe revenues
|
|
$
|
139,035
|
|
|
$
|
213,462
|
|
|
|
53.5
|
%
|
|
Operating margin
|
|
|
40.5
|
%
|
|
|
35.6
|
%
|
|
|
(4.9 pts.
|
)
|
|
Other revenues:
|
|
|
|
|
|
|
|
|
|
|
|
|
|
Total Other revenues (included in other revenue)
|
|
|
1,988
|
|
|
|
15,245
|
|
|
|
666.9
|
%
|
|
Operating margin
|
|
|
−96.7
|
%
|
|
|
53.7
|
%
|
|
|
150.4 pts.
|
|
|
|
|
|
|
|
|
|
|
|
|
|
|
|
|
Total revenue
|
|
$
|
530,160
|
|
|
$
|
633,281
|
|
|
|
19.5
|
%
|
|
|
|
|
|
|
|
|
|
|
|
|
|
|
|
Operating margin
|
|
$
|
181,804
|
|
|
$
|
246,340
|
|
|
|
35.5
|
%
|
|
|
|
|
|
|
|
|
|
|
|
|
|
|
|
Operating margin %
|
|
|
34.3
|
%
|
|
|
38.9
|
%
|
|
|
4.6 pts.
|
|
52
The following table represents each reportable segment’s
revenue as a percentage of total segment revenue and each
reportable segment’s pre-tax income as a percentage of
total segment pre-tax income:
| |
|
|
|
|
|
|
|
|
|
|
|
|
|
|
|
|
|
|
|
Year Ended June 30,
|
|
|
|
|
Revenue
|
|
|
Pre-Tax Income
|
|
|
|
|
2009
|
|
|
2010
|
|
|
2009
|
|
|
2010
|
|
|
|
|
United States Retail
|
|
|
28.8
|
%
|
|
|
20.2
|
%
|
|
|
−23.9
|
%
|
|
|
4.3
|
%
|
|
Canada
|
|
|
44.6
|
%
|
|
|
43.7
|
%
|
|
|
105.3
|
%(1)
|
|
|
60.6
|
%(4)
|
|
Europe
|
|
|
26.2
|
%
|
|
|
33.7
|
%
|
|
|
51.5
|
%(2)
|
|
|
59.7
|
%(5)
|
|
Other
|
|
|
0.4
|
%
|
|
|
2.4
|
%
|
|
|
−32.9
|
%(3)
|
|
|
−24.6
|
%(6)
|
|
|
|
|
|
|
|
|
|
|
|
|
|
|
|
|
|
|
|
|
|
|
100.0
|
%
|
|
|
100.0
|
%
|
|
|
100.0
|
%
|
|
|
100.0
|
%
|
|
|
|
|
(1) |
|
Excludes $57.5 million of provisions for litigation
settlements. |
| |
|
(2) |
|
Excludes $5.5 million of unrealized foreign exchange gains. |
| |
|
(3) |
|
Excludes $0.1 million of proceeds from litigation
settlements. |
| |
|
(4) |
|
Excludes $2.2 million of unrealized foreign exchange
losses, and $12.9 million of losses on derivatives not
designated as hedges and $22.6 million of provisions for
litigation settlements. |
| |
|
(5) |
|
Excludes $8.0 million of unrealized foreign exchange losses. |
| |
|
(6) |
|
Excludes $0.1 million of unrealized foreign exchange gains
and $6.4 million of provisions for litigation settlements. |
United
States Retail
Total U.S. Retail revenues were $127.8 million for the
year ended June 30, 2010 compared to $152.9 million
for the year ended June 30, 2009, a decrease of
$25.1 million or 16.4%. The Company closed 114
under-performing U.S. stores during fiscal year 2009 and
significantly reduced the related field management and store
support functions. The closure of these locations was the
primary factor in the
period-over-period
decrease. From a product perspective, this decline is primarily
related to decreases of $9.9 million and $13.9 million
in check cashing and consumer lending revenue, respectively. The
economic downturn contributed to the decrease in check cashing
revenue, as there were decreases in both the number of checks as
well as the face amount of checks that were presented in the
United States. The number of checks decreased year over year by
approximately 784 thousand with a corresponding decrease in face
value of approximately $361.9 million primarily related to
the closure of 114 U.S. stores during fiscal 2009 and the
economic downturn. The face amount of the average check cashed
by the Company decreased by 0.4%, and the average fee per
transaction increased from $13.59 to $13.81.
The continued high rate of unemployment through all sectors of
the U.S. economy negatively impacts consumer lending
volumes. Despite the initial signs of economic improvement, the
Company has continued to take a more cautious approach to
lending in all of our segments, including United States Retail.
U.S. Retail funded loan originations decreased 14.0% or
$81.7 million, for the year ended June 30, 2010 as
compared to the year ended June 30, 2009, primarily due to
the closure of 114 stores in fiscal 2009.
Operating margins in United States Retail increased to 21.2% for
the year ended June 30, 2010 compared to 15.1% for the
prior year. The U.S. Retail operating margins are
significantly lower than the other segments. The primary drivers
for this disparity are greater competition in the United States,
which effects revenue per store, higher U.S. salary costs,
somewhat higher occupancy costs and marginally higher loan loss
provisions. The closure of 60 underperforming stores during the
fourth quarter of fiscal 2009 is consistent with the
Company’s U.S. Retail strategy of closing unprofitable
locations and focusing on states with more favorable and stable
regulatory environments. This action has shown to be positive,
resulting in improved
year-over-year
operating margins.
53
U.S. Retail pre-tax profit was $2.3 million for the
year ended June 30, 2010 compared to a pre-tax loss of
$11.8 million for the prior year. The improvement was the
result of $3.9 million in increased operating profits,
lower store closure costs by $5.0 million and a reduction
in net corporate expenses of $4.8 million.
Canada
Total Canadian revenues were $276.8 million for the year
ended June 30, 2010, an increase of 17.2%, or
$40.6 million as compared to the year ended June 30,
2009. The impact of foreign currency rates accounted for
$25.7 million of this increase. On a constant currency
basis, revenues increased by $14.9 million. On a constant
currency basis, check cashing revenues were down
$4.6 million in Canada with the effects of higher
unemployment resulting in decreases in the number of checks and
the total value of checks cashed — down by 11.0% and
10.7%, respectively. The average face amount per check increased
marginally from $491.03 for the year ended June 30, 2009 to
$492.80 for the current year, while the average fee per check
increased by 4.9% for the year ended June 30, 2010 as
compared to the year ended June 30, 2009. Consumer lending
revenues in Canada increased by $12.8 million or 10.5% (on
a constant currency basis) for the year ended June 30, 2010
as compared to the prior year.
Operating expenses in Canada increased $9.7 million or 7.3%
from $132.0 million for the year ended June 30, 2009
to $141.7 million for the year ended June 30, 2010.
The impacts of changes in foreign currency rates resulted in an
increase of $13.5 million. The constant currency decrease
of approximately $3.8 million is primarily related to
decreases in provision for loan losses and returned check
expenses, offset in part by increased expenses in advertising in
relation to the new regulatory environment in Canada and a
slight increase in salaries and benefits costs. On a constant
currency basis, provision for loan losses, as a percentage of
loan revenues decreased by 8.4 pts from 19.1% to 10.7%. Overall
Canada’s operating margin percentage increased from 44.1%
for the year ended June 30, 2009 to 48.8% for the year
ended June 30, 2010. The solid improvement in this area is
the result of increased consumer lending revenues and lower
consumer lending losses, in addition to efforts to reduce costs
and promote efficiencies. Through June 30, 2010, provinces
which comprise more than 95% of our Canadian company-operated
store base had all announced maximum lending rates that are
above our existing price structure, but generally below the
pricing of many competitors. As a result, we resumed our
television advertising campaign in certain Canadian provinces
and are beginning to experience an increase in the number of new
customers conducting transactions in our Canadian stores.
The Canadian pre-tax income was $3.7 million for the year
ended June 30, 2010 compared to pre-tax income of
$5.8 million for the prior year, a decrease of
$2.1 million. On a constant currency basis, pre-tax income
was $6.7 million or an increase of approximately
$1.0 million. On a constant currency basis, the positive
impacts of increased operating margins of $18.7 million and
lower litigation reserve provisions of $39.3 were principally
offset by increased net corporate expenses of
$13.2 million, additional interest expense of
$25.8 million and $17.5 million of expenses related to
the extinguishment of debt, non-cash valuation loss on the cross
currency interest rate swaps and foreign exchange losses related
to the Company’s senior notes.
Europe
Total Europe revenues were $213.5 million for the year
ended June 30, 2010 compared to $139.0 million for the
year earlier period, an increase of $74.5 million or 53.5%.
On a constant currency basis and excluding the impact of new
stores and acquisitions in the current fiscal year, Europe
year-over-year
revenues have increased by $25.1 million, or 18.1%.
Consumer lending, pawn service fees and other revenues (gold
sales, foreign exchange products and debit cards) were up by
$3.6 million, $2.7 million and $27.8 million,
respectively. As in the United States Retail and Canada business
segments, Europe check cashing revenues was impacted by the
recession and decreased by approximately $8.4 million, or
20.7% (also on a constant currency basis and excluding new
stores and acquisitions).
Europe operating expenses increased by $54.5 million, or
66.0% from $82.7 million for the year ended June 30,
2009 as compared to $137.2 million for the current year. On
a constant currency basis and excluding new stores and
acquisitions, Europe operating expenses increased by
$15.1 million or 18.3%. The increase was the result of
increased purchased gold costs, partially offset by the results
of Company’s overall cost reduction
54
focus. There was an increase of 6.0 pts relating to the
provision for loan losses as a percentage of loan revenues
primarily due to the mix of lending products including the
Express Finance internet-based lending business acquired in
April 2009 and the Poland business acquired in June 2009. On a
constant currency basis, the rate for the year ended
June 30, 2009 was 12.4% while for the current year, the
rate increased to 18.4%. On a constant currency basis, the
Europe operating margin percentage decreased from 40.5% for the
year ended June 30, 2009 to 35.8% for the year ended
June 30, 2010 primarily due to the increase in the
provision for loan losses noted above, as well as the higher mix
of gold sales, which generates a lower margin than our other
products.
The Europe pre-tax income was $33.4 million for the year
ended June 30, 2010 compared to $36.4 million for the
prior year, a decrease of $3.0 million — on a
constant currency basis, the decrease was $2.5 million. On
a constant currency basis, in addition to increased operating
margins of $21.3 million and a reduction in interest
expense of $2.9 million, pre-tax income was negatively
impacted by expenses related to the Company’s recent
refinancing efforts of $4.3 million, increased net
corporate expenses of $5.1 million and a net change of
$17.1 million in realized/unrealized foreign exchange
losses — prior fiscal year had $7.4 million of
gains and current fiscal year results include losses of
$9.7 million.
Other
We acquired DFS on December 23, 2009 and therefore our
consolidated results for the year ended June 30, 2010
include 189 days of DFS results. DFS revenues were
$14.7 million for the year ended June 30, 2010.
Changes
in Financial Condition
On a constant currency basis, cash and cash equivalent balances
and the revolving credit facilities balances fluctuate
significantly as a result of seasonal, intra-month and
day-to-day
requirements for funding check cashing, consumer and pawn
lending and other operating and acquisition activities. For the
year ended June 30, 2011, cash and cash equivalents
decreased $102.3 million, which is net of a
$17.0 million increase as a result of the effect of
exchange rate changes on foreign cash and cash equivalents.
However, as these foreign cash accounts are maintained in Canada
and Europe in local currency, there is little, if any, actual
diminution in value from changes in currency rates, and as a
result, the cash balances are available on a local currency
basis to fund the daily operations of the Canada and Europe
business units.
Consumer loans, net increased by $61.0 million to
$161.9 million at June 30, 2011 from
$100.9 million at June 30, 2010. Consumer loans, gross
increased by $65.5 million and the related allowance for
loan losses increased by $4.5 million. The Europe and
Canada business units showed increases in their consumer loans
balances of $58.1 million and $6.1 million,
respectively. On a constant currency basis, the consumer loans
balance in Europe increased by $51.3 million. The increases
in the Europe consumer loans balances was primarily the result
of the MEM acquisition, with the remaining increase spread
reasonably evenly over the legacy loan products and internet
loan business. On a constant currency basis, the Canada business
had an increase in consumer loans balances of $2.8 million.
The United States Retail business had an increase of
$1.3 million. In constant dollars, the allowance for loan
losses increased by $3.3 million and decreased as a
percentage of the outstanding principal balance to 8.2% at
June 30, 2011 from 9.4% at June 30, 2010. The
following factors impacted this area:
|
|
|
| |
•
|
Continued improvements in United States Retail collections and
our actions, taken in an effort to decrease our risk exposure by
reducing the amount that we are willing to loan to certain
customer segments. The historical loss rates (expressed as a
percentage of loan amounts originated for the last twelve months
applied against the principal balance of outstanding loans) have
continued to decline. The ratio of the allowance for loan losses
related to United States Retail short-term consumer loans
decreased from 4.1% at June 30, 2010 to 1.8% at
June 30, 2011.
|
| |
| |
•
|
In constant currency, the ratio of allowance for loan losses in
Canada as a percentage of consumer loans outstanding has
decreased from 2.7% at June 30, 2010 to 1.6% at
June 30, 2011.
|
55
|
|
|
| |
•
|
In constant currency, Europe’s ratio of allowance for loan
losses as a percentage of consumer loans outstanding has
decreased from 14.8% at June 30, 2010 to 11.6% at
June 30, 2011, primarily as a result of lower loss reserve
applied to the recently acquired MEM current loan portfolio,
partially offset by higher loss reserves applied to our legacy
loan business. The impact of a larger loan portfolio in Poland,
which carries a higher loan loss reserve percentage than our
legacy single payment portfolio, continues to increase the
overall loan loss reserve as a percentage of gross consumer
loans receivable.
|
Liquidity
and Capital Resources
Historically, our principal sources of cash have been from
operations, borrowings under our credit facilities and issuance
of debt and equity securities. We anticipate that our primary
uses of cash will be to provide working capital, finance capital
expenditures, meet debt service requirements, fund
company-originated consumer loans and pawn loans, finance store
expansion, finance acquisitions and finance the expansion of our
products and services. In April 2011, we completed a public
offering of our common stock, which resulted in aggregate net
cash proceeds to us of approximately $130.2 million. We
used the net proceeds from the equity offering to repay a
portion of the outstanding borrowings under our global revolving
credit facility, which was initially used to fund a portion of
the acquisition price of MEM.
Net cash provided by operating activities was $59.2 million
for fiscal 2009, $86.7 million in fiscal 2010 and
$16.9 million for fiscal 2011. The decrease in net cash
provided by operations in 2011 compared to 2010 was primarily
the result of payments related to settled Canadian class action
litigation, as well as an increase in consumer loans and pawn
loans.
Net cash used in investing activities was $42.0 million in
fiscal 2009, $184.4 million in fiscal 2010 and
$330.6 million in fiscal 2011. Our investing activities
primarily related to acquisitions, purchases of property and
equipment for our stores and investments in technology. The
actual amount of capital expenditures each year depends in part
upon the number of new stores opened or acquired and the number
of stores remodeled, as well as businesses acquired. For fiscal
2009, we made capital expenditures of $15.8 million and
acquisitions of $26.2 million compared to capital
expenditures of $29.4 million and acquisitions of
$155.0 million in fiscal 2010. During fiscal 2011, we made
capital expenditures of $41.4 million and acquisitions of
$289.2 million. We currently anticipate that our capital
expenditures, excluding acquisitions, will aggregate
approximately $50.0 to $55.0 million during our fiscal year
ending June 30, 2012. The actual amount of capital
expenditures each year will depend in part upon the number of
new stores opened or acquired and the number of stores remodeled.
Net cash provided by financing activities was $2.7 million
for fiscal 2009, $169.8 million in fiscal 2010 and
$194.4 million in fiscal 2011. The cash provided by
financing activities during fiscal 2009 was primarily a result
of the proceeds from termination of the U.K. cross currency
swaps of $14.4 million and $3.3 million proceeds from
the exercise of stock options. This was partially offset by
$3.6 million in debt payments, a decrease of
$3.8 million in our revolving credit facility and
$7.5 million for stock repurchased in fiscal 2009. The cash
provided by financing activities during fiscal 2010 was
primarily a result of $596.4 million in proceeds from the
issuance of 10.375% Senior Notes due 2016, in part offset
by a repayment of our legacy term debt in the amount of
$369.2 million, $32.0 million for the repurchase of
2.875% Senior Convertible Notes due 2027 and payment of
debt issuance costs of $19.9 million. The cash provided by
financing activities during fiscal 2011 was primarily a result
of $130.2 of net cash proceeds from our April 2011 public
offering of our common stock, as well as $66.0 million in
borrowings under our new global revolving credit facility, in
part offset by the payment of debt issuance costs of
$5.0 million.
Senior Secured Credit Facility On
March 3, 2011, we replaced our existing credit facility
with a new senior secured credit facility with a syndicate of
lenders, the administrative agent for which is Wells Fargo Bank,
National Association. The new facility consists of a
$200.0 million global revolving credit facility, with
potential to further increase our available borrowings under the
facility to $250.0 million. Availability under the global
revolving credit facility is based on a borrowing base comprised
of cash and consumer receivables in our U.S. and Canadian
operations, our U.K.-based retail and Payday Express online
operations and our U.K.
56
retail store-based pawn loan receivables. There is a sublimit
for borrowings in the United States based on the lesser of the
U.S. borrowing base under the global revolving credit
facility or $75 million.
Borrowings under the global revolving credit facility may be
denominated in United States Dollars, British Pounds Sterling,
Euros or Canadian Dollars, as well as any other currency as may
be approved by the lenders. Interest on borrowings under the
global revolving credit facility is derived from a pricing grid
based on our consolidated leverage ratio, which currently allows
borrowing at an interest rate equal to the applicable London
Inter-Bank Offered Rate (LIBOR) or Canadian Dollar Offer Rate
(based on the currency of borrowing) plus 400 basis points,
or in the case of borrowings in U.S. Dollars only, at the
alternate base rate, which is the greater of the prime rate and
the federal funds rate plus
1/2
of 1% plus 300 basis points. The global revolving credit
facility will mature on March 1, 2015.
The global revolving credit facility allows for borrowings by
Dollar Financial Group, Inc., a direct wholly owned subsidiary
of DFC Global Corp., National Money Mart Company, our indirect
wholly owned Canadian subsidiary, and Dollar Financial U.K.
Limited, and Instant Cash Loans Limited, each an indirect wholly
owned U.K. subsidiary. Borrowings by Dollar Financial Group,
Inc. under the global revolving credit facility are guaranteed
by DFC Global Corp. and certain of its direct and indirect
domestic U.S. subsidiaries. Borrowings by
non-U.S. borrowers
under the global revolving credit facility are guaranteed by DFC
Global Corp. and Dollar Financial Group, Inc. and substantially
all of their domestic U.S. subsidiaries, by National Money
Mart Company and substantially all of its direct and indirect
Canadian subsidiaries, and by Dollar Financial U.K. Limited and
Instant Cash Loans Limited and substantially all of the U.K.
subsidiaries of Instant Cash Loans Limited. The obligations of
the respective borrowers and guarantors under the global
revolving credit facility are secured by substantially all the
assets of such borrowers and guarantors.
As of June 30, 2011, there was $65.9 million
outstanding under the global revolving credit facility.
The senior secured credit agreement governing our global
revolving credit agreement contains customary covenants,
representations and warranties and events of default. As of
June 30, 2011, we were in compliance with all such
covenants.
Prior Credit Facility On October 30,
2006, we entered into a $475.0 million credit facility,
which we refer to as the 2006 credit agreement. This facility
consisted of the following: (i) a senior secured revolving
credit facility in an aggregate amount of $75.0 million,
which we refer to as the U.S. Revolving Facility with
Dollar Financial Group, Inc., as the borrower; (ii) a
senior secured term loan facility with an aggregate amount of
$295.0 million, which we refer to as the Canadian Term
Facility, with National Money Mart Company as the borrower;
(iii) a senior secured term loan facility with Dollar
Financial U.K. Limited as the borrower, in an aggregate amount
of $80.0 million (consisting of a $40.0 million
tranche of term loans and another tranche of term loans
equivalent to $40.0 million denominated in Euros), which we
refer to collectively as the U.K. Term Facility; and (iv) a
senior secured revolving credit facility in an aggregate amount
of CAD 28.5 million, which we refer to as the Canadian
Revolving Facility, with National Money Mart Company as the
borrower.
On December 23, 2009, we and our lenders amended and
restated the terms of the 2006 credit agreement. Pursuant to the
terms of the amended and restated credit agreement, lenders
representing approximately 90% of the revolving credit
facilities and approximately 91% of the term loans agreed to the
extension of the maturity of the revolving credit facilities and
term loans to December 2014 (subject to the condition, which was
satisfied in February 2010, that prior to October 30, 2012,
the aggregate principal amount of the 2027 Notes be reduced to
an amount less than or equal to $50 million).
Outstanding amounts under the amended and restated credit
agreement that were owed to lenders which consented to the
extended maturity date received an annual interest spread of
500 basis points with a minimum 2.0% LIBOR (or LIBOR
equivalent) floor and, in the case of the revolving loans, based
on a leverage based pricing grid. Lenders under the 2006 credit
agreement that did not consent to the extended maturity in 2009
received an annual interest spread of 375 basis points with
a minimum 2.0% LIBOR (or LIBOR equivalent) floor and, in the
case of the revolving loans, based on a leverage based pricing
grid.
Prior to the amendment and restatement of the 2006 credit
agreement, the U.S. Revolving Facility and the Canadian
Revolving Facility had an interest rate of LIBOR plus
300 basis points and CDOR plus 300 basis
57
points, respectively, subject to reduction as we reduced our
leverage. The Canadian Term Facility consisted of
$295.0 million at an interest rate of LIBOR plus
275 basis points. Under the 2006 credit agreement, the U.K.
Term Facility consisted of a $40.0 million tranche at an
interest rate of LIBOR plus 300 basis points and a tranche
denominated in Euros equivalent to $40.0 million at an
interest rate of Euribor plus 300 basis points.
We used approximately $350.0 million of the net proceeds
from our December 2009 offering of $600.0 million aggregate
principal amount of our 10.375% Senior Notes due 2016 to
repay substantially all of its outstanding obligations under the
Canadian Term Facility and the U.K. Term Facility. On
June 23, 2010, we used excess cash to repay the remaining
balance of approximately $18.3 million of the Canadian Term
Facility and the U.K. Term Facility. We repaid all then
outstanding balances under the credit facility immediately prior
to its termination on March 3, 2011 in connection with the
execution of our new senior secured credit facility relating to
our global revolving credit facility.
Scandinavian Credit Facilities As a result of
the December 2010 acquisition of Sefina, we assumed
approximately $61.8 million of borrowings under
Sefina’s credit facilities. The loans are secured primarily
by the value of Sefina’s pawn pledge stock. The borrowings
consist of a working capital facility consisting of two loans of
SEK 185 million and SEK 55 million ($38.1 million
at June 30, 2011). These loans are due July 2013 and
December 2015, respectively, at an interest rate of the
lender’s borrowing rate plus 160 basis points (4.23%
at June 30, 2011). Also with the same Scandinavian bank, we
assumed an overdraft facility due December 31, 2011 with a
commitment of up to SEK 85 million. As of June 30,
2011, SEK 34.0 million ($5.4 million) was outstanding
at the lender’s borrowing rate plus 170 basis points
(4.33% at June 30, 2011). We also assumed a Euro overdraft
facility with another Scandinavian bank maturing in April 2012
with a commitment of up to EUR 17.5 million, of which
EUR 16.6 million ($24.1 million) was outstanding
as of June 30, 2011 at a rate of Euribor plus
270 basis points (3.29% at June 30, 2011).
Other Debt Other debt consists of
$8.8 million of debt assumed as part of the
Suttons & Robertsons acquisition in April 2010,
consisting of a $0.2 million overdraft facility, a
$3.0 million revolving loan and a $5.6 million term
loan.
Long-Term Debt As of June 30, 2011, our
long term debt consisted of $597.0 million of
10.375% senior notes due 2016, which we refer to as the
2016 notes, issued by our Canadian subsidiary, National Money
Mart Company, $40.7 million of our 2.875% convertible notes
due 2027, which we refer to as the 2027 notes,
$90.9 million of our 3.00% convertible notes due 2028,
which we refer to as the 2028 notes, $8.6 million of
revolving and term loans owed by S&R and $38.1 million
of borrowings under Sefina’s revolving credit facility and
bank loans which we assumed in the acquisition.
Through a series of privately negotiated transactions with
certain holders of our 2027 notes in December 2009, pursuant to
which such the holders exchanged an aggregate of
$120.0 million principal amount of the 2027 notes held by
such holders for an equal aggregate principal amount of our new
2028 notes. Holders have the right to convert the 2028 notes
into cash and, if applicable, shares of our common stock upon
the satisfaction of certain conditions. The initial conversion
rate of the 2028 notes is 51.8035 per $1,000 principal amount of
2028 notes. The 2028 notes accrue interest at a rate of 3.00%
per annum and mature on April 1, 2028.
In February 2010, we repurchased $35.2 million aggregate
principal amount of our 2027 notes in privately negotiated
transactions with three of the holders of the 2027 notes. The
purchase price paid was 91% of the stated principal amount of
the repurchased 2027 notes for an aggregate price of
$32.0 million.
On December 23, 2009, our Canadian subsidiary, National
Money Mart Company, issued $600 million aggregate principal
amount of the 2016 notes. The 2016 notes will mature on
December 15, 2016.
Future Obligations Our future obligations
include minimum lease payments under operating leases, principal
repayments on our debt obligations, obligations under Canadian
class action agreements payable in cash, and certain
acquisition-related payments. Operating leases are scheduled
payments on existing store and other administrative leases.
These leases typically have initial terms of five years and may
contain provisions for renewal options, additional rental
charges based on revenue and payment of real estate taxes and
common area charges.
58
We entered into the commitments described above and other
contractual obligations in the ordinary course of business as a
source of funds for asset growth and asset/liability management
and to meet required capital needs. Our principal future
obligations and commitments as of June 30, 2011, excluding
periodic interest payments, include the following (in millions):
| |
|
|
|
|
|
|
|
|
|
|
|
|
|
|
|
|
|
|
|
|
|
|
|
|
|
|
Less than
|
|
|
1-3
|
|
|
4-5
|
|
|
After 5
|
|
|
|
|
Total
|
|
|
1 Year
|
|
|
Years
|
|
|
Years
|
|
|
Years
|
|
|
|
|
Revolving credit facilities
|
|
$
|
65.9
|
|
|
$
|
65.9
|
|
|
$
|
—
|
|
|
$
|
—
|
|
|
$
|
—
|
|
|
Long-term debt:
|
|
|
|
|
|
|
|
|
|
|
|
|
|
|
|
|
|
|
|
|
|
10.375% Senior Notes due 2016
|
|
|
600.0
|
|
|
|
—
|
|
|
|
—
|
|
|
|
—
|
|
|
|
600.0
|
|
|
2.875% Senior Convertible Notes due 2027
|
|
|
44.8
|
|
|
|
—
|
|
|
|
—
|
|
|
|
—
|
|
|
|
44.8
|
|
|
3.0% Senior Convertible Notes due 2028
|
|
|
120.0
|
|
|
|
—
|
|
|
|
—
|
|
|
|
—
|
|
|
|
120.0
|
|
|
Scandinavian credit facilities
|
|
|
67.6
|
|
|
|
29.5
|
|
|
|
29.4
|
|
|
|
8.7
|
|
|
|
|
|
|
Other Notes Payable
|
|
|
8.8
|
|
|
|
0.2
|
|
|
|
8.6
|
|
|
|
—
|
|
|
|
—
|
|
|
Obligations under Canadian Class Action
|
|
|
14.1
|
|
|
|
14.1
|
|
|
|
—
|
|
|
|
—
|
|
|
|
—
|
|
|
Settlement Agreements Payable in Cash
|
|
|
|
|
|
|
|
|
|
|
|
|
|
|
|
|
|
|
|
|
|
Express Finance Limited contingent consideration payment
|
|
|
12.1
|
|
|
|
12.1
|
|
|
|
—
|
|
|
|
—
|
|
|
|
—
|
|
|
Sefina acquisition installment payments
|
|
|
5.3
|
|
|
|
5.3
|
|
|
|
—
|
|
|
|
—
|
|
|
|
—
|
|
|
Operating lease obligations(1)
|
|
|
234.5
|
|
|
|
49.8
|
|
|
|
77.9
|
|
|
|
52.8
|
|
|
|
54.0
|
|
|
|
|
|
|
|
|
|
|
|
|
|
|
|
|
|
|
|
|
|
|
|
|
Total contractual cash obligations
|
|
$
|
1,173.1
|
|
|
$
|
176.9
|
|
|
$
|
115.9
|
|
|
$
|
61.5
|
|
|
$
|
818.8
|
|
|
|
|
|
|
|
|
|
|
|
|
|
|
|
|
|
|
|
|
|
|
|
|
|
|
|
(1) |
|
For purposes of the table, operating lease obligations include
one lease renewal option period for leases with initial lease
terms of five years or less. |
| |
|
(2) |
|
Excluded from the table is approximately $17.8 million of
contingent acquisition payments that are dependent on the
operating performance of Sefina. |
| |
|
(3) |
|
Excluded from the table are any potential payments on our
cross-currency interest rate swaps which expire in October 2012,
as these payments are not fixed and determinable. |
We believe that, based on current levels of operations and
anticipated improvements in operating results, cash flows from
operations and borrowings available under our credit facilities
will allow us to fund our liquidity and capital expenditure
requirements for the foreseeable future, build de novo stores
and effectuate various acquisitions and make payment of interest
and principal on our indebtedness. This belief is based upon our
historical growth rate and the anticipated benefits we expect
from operating efficiencies. We also expect operating expenses
to increase, although the rate of increase is expected to be
less than the rate of revenue growth for existing stores.
Furthermore, we do not believe that additional acquisitions or
expansion are necessary to cover our fixed expenses, including
debt service.
Seasonality
Our business is seasonal due to the impact of several
tax-related services, including cashing tax refund checks,
making electronic tax filings and processing applications of
refund anticipation loans. Historically, we have generally
experienced our highest revenues and earnings during our third
fiscal quarter ending March 31, when revenues from these
tax-related services peak. Due to the seasonality of our
business, results of operations for any fiscal quarter are not
necessarily indicative of the results of operations that may be
achieved for the full fiscal year. In addition, quarterly
results of operations depend significantly upon the timing and
amount of revenues and expenses associated with the addition of
new stores.
Impact of
Inflation
We do not believe that inflation has a material impact on our
earnings from operations.
59
Impact of
Recent Accounting Pronouncements
On January 21, 2010, the FASB issued ASU
2010-06,
Improving Disclosures about Fair Value Measurements. The
standard amends ASC Topic 820, Fair Value Measurements and
Disclosures to require additional disclosures related to
transfers between levels in the hierarchy of fair value
measurement. The standard does not change how fair values are
measured. The standard is effective for interim and annual
reporting periods beginning after December 15, 2009. We
adopted this Statement beginning in the quarterly period ended
March 31, 2010, as required, and adoption has not had a
material impact on our consolidated financial statements.
In July 2010, the Financial Accounting Standards Board
(“FASB”) issued ASU
2010-20,
Receivables — Disclosures about the Credit Quality
of Financing Receivables and the Allowance for Credit
Losses. ASU
2010-20
amends Topic 310 to improve the disclosures that an entity
provides about the credit quality of its financing receivables
and the related allowance for credit losses. As a result of
these amendments, an entity is required to disaggregate by
portfolio segment or class certain existing disclosures and
provide new disclosures about its financing receivables and
related allowance for credit losses. These provisions are
effective for interim and annual reporting periods ending on or
after December 15, 2010. We adopted ASU
2010-20 in
our quarter ending December 31, 2010. ASU
2010-20
concerns disclosures only and did not have a material impact on
our financial position or results of operations.
In December 2010, the FASB issued ASU
No. 2010-29,
Business Combinations (Topic 805) — Disclosure of
Supplementary Pro Forma Information for Business
Combinations. This standard update clarifies that, when
presenting comparative financial statements, SEC registrants
should disclose revenue and earnings of the combined entity as
though the current period business combinations had occurred as
of the beginning of the comparable prior annual reporting period
only. The update also expands the supplemental pro forma
disclosures to include a description of the nature and amount of
material, nonrecurring pro forma adjustments directly
attributable to the business combination included in the
reported pro forma revenue and earnings. ASU
2010-29 is
effective prospectively for material (either on an individual or
aggregate basis) business combinations entered into in fiscal
years beginning on or after December 15, 2010 with early
adoption permitted. ASU
2010-29
concerns disclosures only and will not have a material impact on
our financial position or results of operations.
In June 2011, the FASB issued ASU
No. 2011-05,
Comprehensive Income (Topic 220) — Presentation of
Comprehensive Income. This standard update amends Topic 220
to require entities to present the total of comprehensive
income, the components of net income, and the components of
other comprehensive income either in a single continuous
statement of comprehensive income or in two separate but
consecutive statements. These provisions are effective for
fiscal years, and interim periods within those years, beginning
after December 15, 2011, and should be applied
retrospectively. ASU
2011-05
concerns disclosures only and will not have a material impact on
our financial position or results of operations.
60
DFC
GLOBAL CORP.
SUPPLEMENTAL STATISTICAL DATA
The following table presents a summary of our consumer lending
originations, including loan extensions and revenues, for the
following periods:
| |
|
|
|
|
|
|
|
|
|
|
|
|
|
|
|
Year Ended June 30,
|
|
|
|
|
2009
|
|
|
2010
|
|
|
2011
|
|
|
|
|
U.S. company-funded consumer loan originations
|
|
$
|
582.1
|
|
|
$
|
500.3
|
|
|
$
|
480.8
|
|
|
Canadian company-funded consumer loan originations
|
|
|
776.3
|
|
|
|
792.3
|
|
|
|
879.6
|
|
|
U.K. company-funded consumer loan originations
|
|
|
358.7
|
|
|
|
500.4
|
|
|
|
831.9
|
|
|
Poland company-funded consumer loan originations
|
|
|
—
|
|
|
|
11.7
|
|
|
|
15.1
|
|
|
|
|
|
|
|
|
|
|
|
|
|
|
|
|
Total company-funded consumer loan originations
|
|
$
|
1,717.1
|
|
|
$
|
1,804.7
|
(1)
|
|
$
|
2,207.4
|
(2)
|
|
|
|
|
|
|
|
|
|
|
|
|
|
|
|
U.S. servicing revenues, gross
|
|
$
|
2.0
|
|
|
$
|
—
|
|
|
$
|
—
|
|
|
U.S. company-funded consumer loan revenues
|
|
|
77.6
|
|
|
|
65.7
|
|
|
|
61.6
|
|
|
Canadian company-funded consumer loan revenues
|
|
|
121.5
|
|
|
|
147.9
|
|
|
|
170.7
|
|
|
U.K. company-funded consumer loan revenues
|
|
|
65.4
|
|
|
|
98.8
|
|
|
|
187.5
|
|
|
Poland company-funded consumer loan revenues
|
|
|
—
|
|
|
|
7.1
|
|
|
|
9.4
|
|
|
|
|
|
|
|
|
|
|
|
|
|
|
|
|
Total consumer lending revenues
|
|
$
|
266.5
|
|
|
$
|
319.5
|
|
|
$
|
429.2
|
|
|
|
|
|
|
|
|
|
|
|
|
|
|
|
|
Gross charge-offs of company-funded consumer loans
|
|
$
|
185.6
|
|
|
$
|
164.0
|
|
|
$
|
217.2
|
|
|
Recoveries of company-funded consumer loans
|
|
|
(130.9
|
)
|
|
|
(122.5
|
)
|
|
|
(162.1
|
)
|
|
|
|
|
|
|
|
|
|
|
|
|
|
|
|
Net charge-offs on company-funded consumer loans
|
|
$
|
54.7
|
|
|
$
|
41.5
|
|
|
$
|
55.1
|
|
|
|
|
|
|
|
|
|
|
|
|
|
|
|
|
Gross charge-offs of company-funded consumer loans as a
percentage of total company-funded consumer loan originations
|
|
|
10.8
|
%
|
|
|
9.1
|
%
|
|
|
9.8
|
%
|
|
Recoveries of company-funded consumer loans as a percentage of
total company-funded consumer loan originations
|
|
|
7.6
|
%
|
|
|
6.8
|
%
|
|
|
7.3
|
%
|
|
Net charge-offs on company-funded consumer loans as a percentage
of total company-funded consumer loan originations
|
|
|
3.2
|
%
|
|
|
2.3
|
%
|
|
|
2.5
|
%
|
|
|
|
|
(1) |
|
The increase for the fiscal year ended June 30, 2010 is
primarily due to the acquisitions of Express Finance Limited in
the United Kingdom and Optima, S.A. in Poland, partially offset
by a decrease in the United States, related to a reduction in
the number of U.S. stores. Additionally, in fiscal 2010, there
was a $69.8 million increase in Canada and an
$8.7 million decrease in the United Kingdom compared to
fiscal 2009 as a result of the impact of exchange rates for the
year ended June 30, 2010. The effects of the global
economic recession also resulted in diminished loan originations
for the 2009 and 2010 fiscal years. |
| |
|
(2) |
|
The increase for the year ended June 30, 2011 is primarily
due to the acquisition of Month End Money in the United Kingdom,
partially offset by a decrease in the United States, related to
a reduction in the number of U.S. stores. Additionally, in
fiscal 2011, there were increases of $44.9 million and
$7.4 million, respectively, in Canada and the United
Kingdom related to the impact of exchange rates compared to
fiscal 2010. |
61
|
|
|
Item 7A.
|
QUANTITATIVE
AND QUALITATIVE DISCLOSURES ABOUT MARKET RISK
|
Generally
In the operations of our subsidiaries and the reporting of our
consolidated financial results, we are affected by changes in
interest rates and currency translation exchange rates. The
principal risks of loss arising from adverse changes in market
rates and prices to which we and our subsidiaries are exposed
relate to:
|
|
|
| |
•
|
interest rates on revolving credit facilities; and
|
| |
| |
•
|
foreign exchange rates generating translation gains and losses.
|
We and our subsidiaries have no market risk sensitive
instruments entered into for trading purposes, as defined by
U.S. generally accepted accounting principles or GAAP.
Information contained in this section relates only to
instruments entered into for purposes other than trading.
Interest
Rate Risk
Our outstanding indebtedness, and related interest rate risk, is
managed centrally by our finance department by implementing the
financing strategies approved by our Board of Directors. Our
revolving credit facilities carry variable rates of interest.
With the repayment of our legacy variable rate term credit
facilities during fiscal 2010 with the proceeds of a fixed rate
bond issuance without termination of our Canadian cross currency
swaps hedging the debt, we are exposed to adverse changes in
interest rates through the swap that will likely have an impact
on our future consolidated statement of financial position (see
the section entitled “Cross Currency Interest Rate
Swaps” below).
Foreign
Currency Exchange Rate Risk
Put
Options
Operations in Canada and Europe have exposed us to shifts in
currency valuations. From time to time, we may elect to purchase
put options in order to protect certain earnings in Canada and
Europe against the translational impact of foreign currency
fluctuations. Out of the money put options may be purchased
because they cost less than completely averting risk, and the
maximum downside is limited to the difference between the strike
price and exchange rate at the date of purchase and the price of
the contracts. At June 30, 2011, we did not hold any put
options. At times throughout the year we have used, and may
continue to use, purchased options designated as cash flow
hedges to protect against certain of the foreign currency
exchange rate risks inherent in our forecasted earnings
denominated in currencies other than the U.S. dollar. These
cash flow hedges have a duration of less than 12 months.
For derivative instruments that are designated and qualify as
cash flow hedges, the effective portions of the gain or loss on
the derivative instrument are initially recorded in accumulated
other comprehensive income as a separate component of
stockholders’ equity and subsequently reclassified into
earnings in the period during which the hedged transaction is
recognized in earnings. The ineffective portion of the gain or
loss is reported in other expense (income), net on the statement
of operations. For options designated as hedges, hedge
effectiveness is measured by comparing the cumulative change in
the hedge contract with the cumulative change in the hedged
item, both of which are based on forward rates.
Canada operations (exclusive of unrealized foreign exchange
gains of $51.7 million, litigation proceeds of
$3.9 million, loss on derivatives not designated as hedges
of $39.3 million, and loss on store closings of
$0.5 million) accounted for approximately 47.9% of
consolidated pre-tax earnings for the year ended June 30,
2011 and 56.7% of consolidated pre-tax earnings (exclusive of
unrealized foreign exchange losses of $2.2 million, loss on
derivatives not designated as hedges of $12.9 million,
litigation settlements of 22.6 million, loss on
extinguishment of debt of $3.6 million, and loss on store
closings of $0.9 million) for the year ended June 30,
2010. Europe operations (exclusive of unrealized foreign
exchange losses of $2.0 million and loss on store closings
of $0.1 million) accounted for approximately 60.2% of
consolidated pre-tax earnings for the year ended June 30,
2011 and 56.0% of consolidated pre-tax earnings (exclusive of
unrealized foreign exchange losses of $8.0 million and loss
on extinguishment of debt of $4.7 million) for the year
ended June 30, 2010. U.S. operations (exclusive of
unrealized foreign exchange losses of $2.7 million,
litigation expense of
62
$0.2 million and loss on store closings of
$0.3 million) accounted for approximately (8.2)% of
consolidated pre-tax earnings for the year ended June 30,
2011 and (12.7)% of consolidated pre-tax earnings (exclusive of
unrealized foreign exchange gains of $0.1 million,
litigation expense of $6.4 million, loss on extinguishment
of debt of $1.2 million, and loss on store closings of
$2.4 million) for the year ended June 30, 2010. As
currency exchange rates change, translation of the financial
results of the Canada and Europe operations into
U.S. dollars will be impacted. Changes in exchange rates
have resulted in cumulative translation adjustments increasing
our net assets by $14.1 million. These gains and loss are
included in other comprehensive income.
We estimate that a 10.0% change in foreign exchange rates by
itself would have impacted reported pre-tax earnings from
continuing operations (exclusive of unrealized foreign exchange
gains of $49.7 million, loss on derivatives not designated
as hedges of $39.2 million, litigation proceeds of
$3.9 million, and loss on store closings of
$0.6 million) by approximately $9.9 million for the
year ended June 30, 2011 and $9.2 million (exclusive
of the unrealized foreign exchange losses of $10.2 million,
loss on derivatives not designated as hedges of
$12.9 million, litigation settlements of
$22.6 million, loss on extinguishment of debt of
$8.4 million, and loss on store closings of
$0.9 million) for the year ended June 30, 2010. This
impact represents 10.8% of our consolidated foreign pre-tax
earnings for the year ended June 30, 2011 and 11.3% of our
consolidated foreign pre-tax earnings for the year ended
June 30, 2010. A 10% change in the Canadian exchange rate
would additionally impact reported pre-tax earnings from
continuing operations by approximately $32.1 million for
the year ended June 30, 2011 related to the translational
effect of net Canadian liabilities denominated in a currency
other than the Canadian Dollar.
Cross-Currency
Interest Rate Swaps
In December 2006, we entered into cross-currency interest rate
swaps to hedge against the changes in cash flows of our legacy
U.K. and Canadian term loans denominated in a currency other
than our foreign subsidiaries’ functional currency.
In December 2006, our U.K. subsidiary, Dollar Financial U.K.
Limited, entered into a cross-currency interest rate swap with a
notional amount of GBP 21.3 million that was set to mature
in October 2012. Under the terms of this swap, Dollar Financial
U.K. Limited paid GBP at a rate of 8.45% per annum and Dollar
Financial U.K. Limited received a rate of the three-month
EURIBOR plus 3.00% per annum on EUR 31.5 million. In
December 2006, Dollar Financial U.K. Limited also entered into a
cross-currency interest rate swap with a notional amount of GBP
20.4 million that was set to mature in October 2012. Under
the terms of this cross-currency interest rate swap, we paid GBP
at a rate of 8.36% per annum and we received a rate of the
three-month LIBOR plus 3.00% per annum on US$40.0 million.
On May 7, 2009 our UK subsidiary, terminated its two
cross-currency interest rate swaps hedging variable-rate
borrowings. As a result, we discontinued prospectively hedge
accounting on these cross currency swaps. In accordance with the
provisions of FASB Codification Topic Derivatives and Hedging,
we will continue to report the net gain or loss related to the
discontinued cash flow hedge in other comprehensive income and
will subsequently reclassify such amounts to earnings over the
remaining original term of the derivative when hedged forecast
transactions are recognized in earnings.
In December 2006, our Canadian subsidiary, National Money Mart
Company, entered into cross-currency interest rate swaps with
aggregate notional amounts of CAD 339.9 million that mature
in October 2012. Under the terms of the swaps, National Money
Mart Company pays Canadian dollars at a blended rate of 7.12%
per annum and National Mart receives a rate of the three-month
LIBOR plus 2.75% per annum on $295.0 million.
On December 23, 2009, we used a portion of the net proceeds
of our $600 million Senior Note Offering to prepay
$350 million of the then outstanding $368.6 million
term loans. As a result, we discontinued prospectively hedge
accounting on our Canadian cross-currency swaps. In accordance
with the provisions of FASB Codification Topic Derivatives and
Hedging, we will continue to report the net gain or loss related
to the discontinued cash flow hedge in other comprehensive
income and will subsequently reclassify such amounts into
earnings over the remaining original term of the derivative when
the hedged forecasted transactions are recognized in earnings.
63
On a quarterly basis, the cross-currency interest rate swap
agreements call for the exchange of 0.25% of the original
notional amounts without giving effect to the $350 million
prepayment. Upon maturity, these cross-currency interest rate
swap agreements call for the exchange of the remaining notional
amounts. Prior to December 23, 2009, these derivative
contracts were designated as cash flow hedges for accounting
purposes. Because these derivatives were designated as cash flow
hedges, we recorded the effective portion of the after-tax gain
or loss in other comprehensive income, which is subsequently
reclassified to earnings in the same period that the hedged
transactions affect earnings. Subsequent to December 23,
2009, the swaps are no longer designated as hedges therefore we
record foreign exchange re-measurement gains and losses related
to the term loans and also record the changes in fair value of
the cross-currency swaps each period in loss/gain on derivatives
not designated as hedges in our consolidated statements of
operations. The aggregate fair market value of the
cross-currency interest rate swaps at June 30, 2010 and
2011 is a liability of $47.4 million and
$73.8 million, respectively and is included in fair value
of derivatives on the balance sheet. During the years ended
June 30, 2010 and 2011, we recorded $12.9 million and
$39.3 million, respectively, charges in the statement of
operations related to the ineffective portion of these cash flow
hedges.
On January 14, 2010, we entered into an amendment to the
ISDA Master Agreement governing the outstanding cross-currency
interest rate swap relating to a notional amount of CAD
183.6 million to which our Canadian operating subsidiary,
National Money Mart Company, is a party to hedge its
variable-rate Canadian term loans denominated in
U.S. dollars. The amendment eliminates financial covenants
and allows the underlying swap to remain outstanding (with a
similar collateral package in place) in the event that we elect
to terminate our revolving credit facility prior to the maturity
of the swap in October 2012. On February 8, 2010, we
entered into an amendment to the ISDA Master Agreement governing
the outstanding cross-currency interest rate swap relating to a
notional amount of CAD 145.3 million to which National
Money Mart Company is a party to hedge its variable-rate
Canadian term loans denominated in U.S. dollars. The
amendment includes financial covenants similar to those in the
Company’s amended credit facility and allows the underlying
swap to remain outstanding (with a similar collateral package in
place) in the event that we elect to terminate our revolving
credit facility prior to the maturity of the swap in October
2012. We agreed to pay a higher rate on both of the interest
rate swaps in order to secure these amendments.
Non-designated
Hedges of Commodity Risk
In the normal course of business, we maintain inventories of
gold at its pawn shops. From time to time, we enter into
derivative financial instruments to manage the price risk
associated with forecasted gold inventory levels. Derivatives
not designated as hedges are not speculative and are used to
manage our exposure to commodity price risk but do not meet the
strict hedge accounting requirements of the Derivatives and
Hedging Topic of the FASB Codification. Changes in the fair
value of derivatives not designated in hedging relationships are
recorded directly in earnings. As of June 30, 2011, our
subsidiary in the United Kingdom had one outstanding gold collar
with a notional amount of 1,500 ounces of gold bullion.
64
|
|
|
Item 8.
|
FINANCIAL
STATEMENTS
|
MANAGEMENT’S
REPORT ON
INTERNAL CONTROL OVER FINANCIAL REPORTING
Management of DFC Global Corp. (the “Company”) is
responsible for establishing and maintaining adequate internal
control over financial reporting and for the assessment of the
effectiveness of internal control over financial reporting. As
defined by the Securities and Exchange Commission, internal
control over financial reporting is a process designed by, or
under the supervision of, the Company’s principal executive
and principal financial officers and effected by the
Company’s Board of Directors, management and other
personnel, to provide reasonable assurance regarding the
reliability of financial reporting and the preparation of the
financial statements for external purposes in accordance with
U.S. generally accepted accounting principles.
The Company’s internal control over financial reporting is
supported by written policies and procedures that
(1) pertain to the maintenance of records that, in
reasonable detail, accurately and fairly reflect the
Company’s transactions and dispositions of the
Company’s assets; (2) provide reasonable assurance
that transactions are recorded as necessary to permit
preparation of the financial statements in accordance with
generally accepted accounting principles, and that receipts and
expenditures of the Company are being made only in accordance
with authorizations of the Company’s management and
directors; and (3) provide reasonable assurance regarding
prevention or timely detection of unauthorized acquisition, use
or disposition of the Company’s assets that could have a
material effect on the financial statements.
Because of its inherent limitation, internal control over
financial reporting may not prevent or detect misstatements.
Also, projections of any evaluation of effectiveness to future
periods are subject to the risk that controls may become
inadequate because of changes in conditions, or that the degree
of compliance with the policies and procedures may deteriorate.
In connection with the preparation of the Company’s annual
consolidated financial statements, management has undertaken an
assessment of the effectiveness of the Company’s internal
control over financial reporting as of June 30, 2011, based
on criteria established in Internal Control-Integrated Framework
issued by the Committee of Sponsoring Organizations of the
Treadway Commission (the COSO Framework). Management’s
assessment included an evaluation of the design of the
Company’s internal control over financial reporting and
testing of the operational effectiveness of those controls.
Based on this assessment, management has concluded that as of
June 30, 2011, the Company’s internal control over
financial reporting was effective to provide reasonable
assurance regarding the reliability of financial reporting and
the preparation of financial statements for external purposes in
accordance with U.S. generally accepted accounting
principles. Ernst & Young LLP, our independent
registered public accounting firm, which audited our financial
statements included in this report, has audited the
effectiveness of our internal control over financial reporting
as of June 30, 2011. Their report is included herein.
In accordance with SEC rules, management excluded Sefina and MEM
from its evaluation of internal controls over financial
reporting due to the timing of the acquisitions. Sefina and MEM
accounted for 6.0% and 6.2% of net income, respectively, and
10.5% and 13.3% of consolidated total assets of the Company for
the year ended June 30, 2011, respectively.
| |
|
|
|
/s/ Jeffrey A. Weiss
|
|
/s/ Randy Underwood
|
|
|
|
|
|
Jeffrey A. Weiss
|
|
Randy Underwood
|
|
Chief Executive Officer
|
|
Executive Vice President and
|
|
August 29, 2011
|
|
Chief Financial Officer
|
|
|
|
August 29, 2011
|
|
|
|
|
|
/s/ William M. Athas
|
|
|
|
|
|
|
|
William M. Athas
|
|
|
|
Senior Vice President of Finance, Chief Accounting Officer and
Corporate Controller
|
|
|
|
August 29, 2011
|
|
|
65
REPORT OF
INDEPENDENT REGISTERED PUBLIC ACCOUNTING FIRM
The Board of Directors and Stockholders
DFC Global Corp.
We have audited DFC Global Corp.’s internal control over
financial reporting as of June 30, 2011, based on criteria
established in Internal Control — Integrated Framework
issued by the Committee of Sponsoring Organizations of the
Treadway Commission (the COSO criteria). DFC Global Corp’s
management is responsible for maintaining effective internal
control over financial reporting, and for its assessment of the
effectiveness of internal control over financial reporting
included in the accompanying Management’s Report on
Internal Control Over Financial Reporting. Our responsibility is
to express an opinion on the company’s internal control
over financial reporting based on our audit.
We conducted our audit in accordance with the standards of the
Public Company Accounting Oversight Board (United States). Those
standards require that we plan and perform the audit to obtain
reasonable assurance about whether effective internal control
over financial reporting was maintained in all material
respects. Our audit included obtaining an understanding of
internal control over financial reporting, assessing the risk
that a material weakness exists, testing and evaluating the
design and operating effectiveness of internal control based on
the assessed risk, and performing such other procedures as we
considered necessary in the circumstances. We believe that our
audit provides a reasonable basis for our opinion.
A company’s internal control over financial reporting is a
process designed to provide reasonable assurance regarding the
reliability of financial reporting and the preparation of
financial statements for external purposes in accordance with
generally accepted accounting principles. A company’s
internal control over financial reporting includes those
policies and procedures that (1) pertain to the maintenance
of records that, in reasonable detail, accurately and fairly
reflect the transactions and dispositions of the assets of the
company; (2) provide reasonable assurance that transactions
are recorded as necessary to permit preparation of financial
statements in accordance with generally accepted accounting
principles, and that receipts and expenditures of the company
are being made only in accordance with authorizations of
management and directors of the company; and (3) provide
reasonable assurance regarding prevention or timely detection of
unauthorized acquisition, use, or disposition of the
company’s assets that could have a material effect on the
financial statements.
Because of its inherent limitations, internal control over
financial reporting may not prevent or detect misstatements.
Also, projections of any evaluation of effectiveness to future
periods are subject to the risk that controls may become
inadequate because of changes in conditions, or that the degree
of compliance with the policies or procedures may deteriorate.
As set forth in Management’s Report on Internal Control
over Financial Reporting, management’s assessment of and
conclusion on the effectiveness of internal control over
financial reporting did not include the internal controls of
Sefina Finance AB (Sefina) and Purpose UK Holdings, Ltd (Purpose
UK) due to the timing of the acquisitions. Sefina and Purpose UK
accounted for 6.0% and 6.2% of net income, respectively, and
10.5% and 13.3% of consolidated total assets of the Company for
the year ended June 30, 2011, respectively. Our audit of
internal control over financial reporting of DFC Global Corp
also did not include an evaluation of internal control over
financial reporting of Sefina or Purpose UK.
In our opinion, DFC Global Corp. maintained, in all material
respects, effective internal control over financial reporting as
of June 30, 2011, based on the COSO criteria.
We also have audited, in accordance with the standards of the
Public Company Accounting Oversight Board (United States), the
consolidated balance sheets of DFC Global Corp. as of
June 30, 2011 and 2010, and the related consolidated
statements of operations, stockholders’ equity, and cash
flows for each of the three years in the period ended
June 30, 2011 of DFC Global Corp. and our report dated
August 29, 2011 expressed an unqualified opinion thereon.
Philadelphia, Pennsylvania
August 29, 2011
66
REPORT OF
INDEPENDENT REGISTERED PUBLIC ACCOUNTING FIRM
The Board of Directors and Stockholders
DFC Global Corp.
We have audited the accompanying consolidated balance sheets of
DFC Global Corp. as of June 30, 2011 and 2010, and the
related consolidated statements of operations,
stockholders’ equity, and cash flows for each of the three
years in the period ended June 30, 2011. These financial
statements are the responsibility of the Company’s
management. Our responsibility is to express an opinion on these
financial statements based on our audits.
We conducted our audits in accordance with the standards of the
Public Company Accounting Oversight Board (United States). Those
standards require that we plan and perform the audit to obtain
reasonable assurance about whether the financial statements are
free of material misstatement. An audit includes examining, on a
test basis, evidence supporting the amounts and disclosures in
the financial statements. An audit also includes assessing the
accounting principles used and significant estimates made by
management, as well as evaluating the overall financial
statement presentation. We believe our audits provide a
reasonable basis for our opinion.
In our opinion, the financial statements referred to above
present fairly, in all material respects, the consolidated
financial position of DFC Global Corp. at June 30, 2011 and
2010 and the consolidated results of its operations and its cash
flows for each of the three years in the period ended
June 30, 2011, in conformity with U.S. generally
accepted accounting principles.
We also have audited, in accordance with the standards of the
Public Company Accounting Oversight Board (United States), the
effectiveness of DFC Global Corp.’s internal control over
financial reporting as of June 30, 2011, based on criteria
established in Internal Control — Integrated Framework
issued by the Committee of Sponsoring Organizations of the
Treadway Commission and our report dated August 29, 2011
expressed an unqualified opinion thereon.
Philadelphia, Pennsylvania
August 29, 2011
67
DFC
GLOBAL CORP.
CONSOLIDATED
BALANCE SHEETS
(In
millions, except share and per share amounts)
| |
|
|
|
|
|
|
|
|
|
|
|
June 30,
|
|
|
June 30,
|
|
|
|
|
2010
|
|
|
2011
|
|
|
|
|
ASSETS
|
|
Current Assets
|
|
|
|
|
|
|
|
|
|
Cash and cash equivalents
|
|
$
|
291.3
|
|
|
$
|
189.0
|
|
|
Consumer loans, net:
|
|
|
|
|
|
|
|
|
|
Consumer loans
|
|
|
111.3
|
|
|
|
176.8
|
|
|
Less: Allowance for consumer loan losses
|
|
|
(10.4
|
)
|
|
|
(14.9
|
)
|
|
|
|
|
|
|
|
|
|
|
|
Consumer loans, net
|
|
|
100.9
|
|
|
|
161.9
|
|
|
Pawn loans
|
|
|
35.5
|
|
|
|
136.2
|
|
|
Loans in default, net of an allowance of $21.8 and $37.7
|
|
|
9.3
|
|
|
|
13.8
|
|
|
Other receivables
|
|
|
17.1
|
|
|
|
31.2
|
|
|
Prepaid expenses and other current assets
|
|
|
25.8
|
|
|
|
38.5
|
|
|
Current deferred tax asset, net of valuation allowance of $4.9
and $2.7
|
|
|
1.0
|
|
|
|
—
|
|
|
|
|
|
|
|
|
|
|
|
|
Total current assets
|
|
|
480.9
|
|
|
|
570.6
|
|
|
Deferred tax asset, net of valuation allowance of $80.1 and $84.9
|
|
|
22.6
|
|
|
|
21.3
|
|
|
Property and equipment, net of accumulated depreciation of
$117.2 and $146.7
|
|
|
67.5
|
|
|
|
100.0
|
|
|
Goodwill and other intangibles
|
|
|
609.0
|
|
|
|
932.0
|
|
|
Debt issuance costs, net of accumulated amortization of $3.5 and
$7.8
|
|
|
18.7
|
|
|
|
21.0
|
|
|
Other
|
|
|
15.9
|
|
|
|
17.9
|
|
|
|
|
|
|
|
|
|
|
|
|
Total Assets
|
|
$
|
1,214.6
|
|
|
$
|
1,662.8
|
|
|
|
|
|
|
|
|
|
|
|
|
|
|
|
|
|
|
|
|
|
|
|
|
LIABILITIES AND STOCKHOLDERS’ EQUITY
|
|
Current Liabilities
|
|
|
|
|
|
|
|
|
|
Accounts payable
|
|
$
|
44.8
|
|
|
$
|
61.1
|
|
|
Income taxes payable
|
|
|
6.2
|
|
|
|
13.7
|
|
|
Accrued expenses and other liabilities
|
|
|
92.6
|
|
|
|
98.4
|
|
|
Debt due within one year
|
|
|
3.3
|
|
|
|
95.7
|
|
|
Current deferred tax liability
|
|
|
0.3
|
|
|
|
—
|
|
|
|
|
|
|
|
|
|
|
|
|
Total current liabilities
|
|
|
147.2
|
|
|
|
268.9
|
|
|
Fair value of derivatives
|
|
|
47.4
|
|
|
|
73.9
|
|
|
Long-term deferred tax liability
|
|
|
24.0
|
|
|
|
53.8
|
|
|
Long-term debt
|
|
|
725.3
|
|
|
|
775.2
|
|
|
Other non-current liabilities
|
|
|
52.4
|
|
|
|
64.4
|
|
|
Stockholders’ equity:
|
|
|
|
|
|
|
|
|
|
Common stock, $.001 par value: 100,000,000 shares
authorized; 36,539,663 shares and 43,743,941 shares
issued and outstanding at June 30, 2010 and June 30,
2011, respectively
|
|
|
—
|
|
|
|
—
|
|
|
Additional paid-in capital
|
|
|
331.1
|
|
|
|
469.2
|
|
|
Accumulated deficit
|
|
|
(115.5
|
)
|
|
|
(49.7
|
)
|
|
Accumulated other comprehensive income
|
|
|
2.7
|
|
|
|
7.6
|
|
|
|
|
|
|
|
|
|
|
|
|
Total DFC Global Corp. stockholders’ equity
|
|
|
218.3
|
|
|
|
427.1
|
|
|
Non-controlling interest
|
|
|
—
|
|
|
|
(0.5
|
)
|
|
|
|
|
|
|
|
|
|
|
|
Total stockholders’ equity
|
|
|
218.3
|
|
|
|
426.6
|
|
|
|
|
|
|
|
|
|
|
|
|
Total Liabilities and Stockholders’ Equity
|
|
$
|
1,214.6
|
|
|
$
|
1,662.8
|
|
|
|
|
|
|
|
|
|
|
|
|
|
|
|
|
|
|
|
|
|
See accompanying notes to consolidated financial statements
68
DFC
GLOBAL CORP.
CONSOLIDATED
STATEMENTS OF OPERATIONS
(In
millions except share and per share amounts)
| |
|
|
|
|
|
|
|
|
|
|
|
|
|
|
|
Year Ended June 30,
|
|
|
|
|
2009
|
|
|
2010
|
|
|
2011
|
|
|
|
|
Revenues:
|
|
|
|
|
|
|
|
|
|
|
|
|
|
Consumer lending
|
|
$
|
266.5
|
|
|
$
|
319.5
|
|
|
$
|
429.2
|
|
|
Check cashing
|
|
|
164.6
|
|
|
|
149.5
|
|
|
|
144.1
|
|
|
Pawn service fees and sales
|
|
|
13.8
|
|
|
|
19.9
|
|
|
|
48.0
|
|
|
Money transfer fees
|
|
|
26.8
|
|
|
|
27.5
|
|
|
|
32.1
|
|
|
Gold sales
|
|
|
3.7
|
|
|
|
43.0
|
|
|
|
46.5
|
|
|
Other
|
|
|
54.8
|
|
|
|
73.9
|
|
|
|
88.5
|
|
|
|
|
|
|
|
|
|
|
|
|
|
|
|
|
Total revenues
|
|
|
530.2
|
|
|
|
633.3
|
|
|
|
788.4
|
|
|
|
|
|
|
|
|
|
|
|
|
|
|
|
|
Operating expenses:
|
|
|
|
|
|
|
|
|
|
|
|
|
|
Salaries and benefits
|
|
|
145.7
|
|
|
|
154.0
|
|
|
|
179.9
|
|
|
Provision for loan losses
|
|
|
52.1
|
|
|
|
45.9
|
|
|
|
73.6
|
|
|
Occupancy
|
|
|
41.8
|
|
|
|
43.3
|
|
|
|
51.0
|
|
|
Purchased gold costs
|
|
|
2.4
|
|
|
|
30.4
|
|
|
|
31.0
|
|
|
Advertising
|
|
|
8.4
|
|
|
|
16.7
|
|
|
|
27.1
|
|
|
Depreciation
|
|
|
13.1
|
|
|
|
14.3
|
|
|
|
16.8
|
|
|
Maintenance and repairs
|
|
|
11.8
|
|
|
|
11.9
|
|
|
|
14.5
|
|
|
Bank charges and armored carrier service
|
|
|
13.4
|
|
|
|
13.9
|
|
|
|
16.6
|
|
|
Returned checks, net and cash shortages
|
|
|
16.0
|
|
|
|
9.0
|
|
|
|
7.7
|
|
|
Other
|
|
|
43.7
|
|
|
|
47.6
|
|
|
|
63.0
|
|
|
|
|
|
|
|
|
|
|
|
|
|
|
|
|
Total operating expenses
|
|
|
348.4
|
|
|
|
387.0
|
|
|
|
481.2
|
|
|
|
|
|
|
|
|
|
|
|
|
|
|
|
|
Operating margin
|
|
|
181.8
|
|
|
|
246.3
|
|
|
|
307.2
|
|
|
|
|
|
|
|
|
|
|
|
|
|
|
|
|
Corporate and other expenses:
|
|
|
|
|
|
|
|
|
|
|
|
|
|
Corporate expenses
|
|
|
68.2
|
|
|
|
86.8
|
|
|
|
104.1
|
|
|
Other depreciation and amortization
|
|
|
3.8
|
|
|
|
7.3
|
|
|
|
14.6
|
|
|
Interest expense, net
|
|
|
43.7
|
|
|
|
68.9
|
|
|
|
90.8
|
|
|
Loss on extinguishment of debt
|
|
|
—
|
|
|
|
9.5
|
|
|
|
—
|
|
|
Unrealized foreign exchange (gain) loss
|
|
|
(5.5
|
)
|
|
|
10.1
|
|
|
|
(47.0
|
)
|
|
Loss on derivatives not designated as hedges
|
|
|
—
|
|
|
|
12.9
|
|
|
|
39.3
|
|
|
Provision for (proceeds from) litigation settlements
|
|
|
57.9
|
|
|
|
29.1
|
|
|
|
(3.7
|
)
|
|
Loss on store closings
|
|
|
10.3
|
|
|
|
3.3
|
|
|
|
0.9
|
|
|
Other (income) expense, net
|
|
|
(4.8
|
)
|
|
|
2.2
|
|
|
|
5.8
|
|
|
|
|
|
|
|
|
|
|
|
|
|
|
|
|
Income before income taxes
|
|
|
8.2
|
|
|
|
16.2
|
|
|
|
102.4
|
|
|
Income tax provision
|
|
|
15.0
|
|
|
|
21.4
|
|
|
|
37.1
|
|
|
|
|
|
|
|
|
|
|
|
|
|
|
|
|
Net (loss) income
|
|
$
|
(6.8
|
)
|
|
$
|
(5.2
|
)
|
|
$
|
65.3
|
|
|
Less: Net loss attributable to non-controlling interests
|
|
|
—
|
|
|
|
(0.3
|
)
|
|
|
(0.5
|
)
|
|
|
|
|
|
|
|
|
|
|
|
|
|
|
|
Net (loss) income attributable to DFC Global Corp.
|
|
$
|
(6.8
|
)
|
|
$
|
(4.9
|
)
|
|
$
|
65.8
|
|
|
|
|
|
|
|
|
|
|
|
|
|
|
|
|
Net (loss) income per share attributable to DFC Global Corp.:
|
|
|
|
|
|
|
|
|
|
|
|
|
|
Basic
|
|
$
|
(0.19
|
)
|
|
$
|
(0.14
|
)
|
|
$
|
1.73
|
|
|
Diluted
|
|
$
|
(0.19
|
)
|
|
$
|
(0.14
|
)
|
|
$
|
1.66
|
|
|
Weighted average shares outstanding:
|
|
|
|
|
|
|
|
|
|
|
|
|
|
Basic
|
|
|
36,019,058
|
|
|
|
36,159,848
|
|
|
|
38,005,387
|
|
|
Diluted
|
|
|
36,019,058
|
|
|
|
36,159,848
|
|
|
|
39,758,551
|
|
See accompanying notes to consolidated financial statements.
69
DFC
GLOBAL CORP.
CONSOLIDATED
STATEMENTS OF STOCKHOLDERS’ EQUITY
(In
millions, except share data)
| |
|
|
|
|
|
|
|
|
|
|
|
|
|
|
|
|
|
|
|
|
|
|
|
|
|
|
|
|
|
|
|
|
|
|
|
|
|
|
|
|
|
|
|
|
|
|
Accumulated
|
|
|
|
|
|
|
|
Common Stock
|
|
|
Additional
|
|
|
|
|
|
Non-
|
|
|
Other
|
|
|
Total
|
|
|
|
|
Outstanding
|
|
|
Paid-in
|
|
|
Accumulated
|
|
|
Controlling
|
|
|
Comprehensive
|
|
|
Stockholders’
|
|
|
|
|
Shares
|
|
|
Amount
|
|
|
Capital
|
|
|
Deficit
|
|
|
Interest
|
|
|
Income
|
|
|
Equity
|
|
|
|
|
Balance, June 30, 2008
|
|
|
36,344,241
|
|
|
$
|
—
|
|
|
$
|
309.1
|
|
|
$
|
(103.8
|
)
|
|
$
|
—
|
|
|
$
|
34.1
|
|
|
$
|
239.4
|
|
|
Comprehensive income (loss)
|
|
|
|
|
|
|
|
|
|
|
|
|
|
|
|
|
|
|
|
|
|
|
|
|
|
|
|
|
|
Foreign currency translation
|
|
|
|
|
|
|
|
|
|
|
|
|
|
|
|
|
|
|
|
|
|
|
(17.9
|
)
|
|
|
(17.9
|
)
|
|
Cash flow hedges
|
|
|
|
|
|
|
|
|
|
|
|
|
|
|
|
|
|
|
|
|
|
|
(8.1
|
)
|
|
|
(8.1
|
)
|
|
Net loss
|
|
|
|
|
|
|
|
|
|
|
|
|
|
|
(6.8
|
)
|
|
|
|
|
|
|
|
|
|
|
(6.8
|
)
|
|
|
|
|
|
|
|
|
|
|
|
|
|
|
|
|
|
|
|
|
|
|
|
|
|
|
|
|
|
|
|
Total comprehensive loss
|
|
|
|
|
|
|
|
|
|
|
|
|
|
|
|
|
|
|
|
|
|
|
|
|
|
|
(32.8
|
)
|
|
Restricted stock grants
|
|
|
270,983
|
|
|
|
|
|
|
|
|
|
|
|
|
|
|
|
|
|
|
|
|
|
|
|
|
|
|
Stock options exercised
|
|
|
390,818
|
|
|
|
|
|
|
|
3.3
|
|
|
|
|
|
|
|
|
|
|
|
|
|
|
|
3.3
|
|
|
Vested portion of granted restricted
|
|
|
|
|
|
|
|
|
|
|
|
|
|
|
|
|
|
|
|
|
|
|
|
|
|
|
|
|
|
stock and restricted stock units
|
|
|
|
|
|
|
|
|
|
|
3.7
|
|
|
|
|
|
|
|
|
|
|
|
|
|
|
|
3.7
|
|
|
Purchase and retirement of treasury shares
|
|
|
(803,699
|
)
|
|
|
|
|
|
|
(7.5
|
)
|
|
|
|
|
|
|
|
|
|
|
|
|
|
|
(7.5
|
)
|
|
Retirement of common stock
|
|
|
(47,391
|
)
|
|
|
|
|
|
|
|
|
|
|
|
|
|
|
|
|
|
|
|
|
|
|
|
|
|
Other stock compensation
|
|
|
|
|
|
|
|
|
|
|
2.7
|
|
|
|
|
|
|
|
|
|
|
|
|
|
|
|
2.7
|
|
|
Purchase of Optima, S.A.
|
|
|
|
|
|
|
|
|
|
|
|
|
|
|
|
|
|
|
0.3
|
|
|
|
|
|
|
|
0.3
|
|
|
|
|
|
|
|
|
|
|
|
|
|
|
|
|
|
|
|
|
|
|
|
|
|
|
|
|
|
|
|
|
Balance, June 30, 2009
|
|
|
36,154,952
|
|
|
$
|
—
|
|
|
$
|
311.3
|
|
|
$
|
(110.6
|
)
|
|
$
|
0.3
|
|
|
$
|
8.1
|
|
|
$
|
209.1
|
|
|
|
|
|
|
|
|
|
|
|
|
|
|
|
|
|
|
|
|
|
|
|
|
|
|
|
|
|
|
|
|
Comprehensive income (loss)
|
|
|
|
|
|
|
|
|
|
|
|
|
|
|
|
|
|
|
|
|
|
|
|
|
|
|
|
|
|
Foreign currency translation
|
|
|
|
|
|
|
|
|
|
|
|
|
|
|
|
|
|
|
|
|
|
|
(7.8
|
)
|
|
|
(7.8
|
)
|
|
Cash flow hedges
|
|
|
|
|
|
|
|
|
|
|
|
|
|
|
|
|
|
|
|
|
|
|
2.4
|
|
|
|
2.4
|
|
|
Net loss
|
|
|
|
|
|
|
|
|
|
|
|
|
|
|
(4.9
|
)
|
|
|
|
|
|
|
|
|
|
|
(4.9
|
)
|
|
|
|
|
|
|
|
|
|
|
|
|
|
|
|
|
|
|
|
|
|
|
|
|
|
|
|
|
|
|
|
Total comprehensive loss
|
|
|
|
|
|
|
|
|
|
|
|
|
|
|
|
|
|
|
|
|
|
|
|
|
|
|
(10.3
|
)
|
|
Restricted stock grants
|
|
|
346,626
|
|
|
|
|
|
|
|
|
|
|
|
|
|
|
|
|
|
|
|
|
|
|
|
|
|
|
Stock options exercised
|
|
|
132,762
|
|
|
|
|
|
|
|
1.5
|
|
|
|
|
|
|
|
|
|
|
|
|
|
|
|
1.5
|
|
|
Vested portion of granted restricted
|
|
|
|
|
|
|
|
|
|
|
|
|
|
|
|
|
|
|
|
|
|
|
|
|
|
|
|
|
|
stock and restricted stock units
|
|
|
|
|
|
|
|
|
|
|
2.8
|
|
|
|
|
|
|
|
|
|
|
|
|
|
|
|
2.8
|
|
|
Retirement of common stock
|
|
|
(94,677
|
)
|
|
|
|
|
|
|
|
|
|
|
|
|
|
|
|
|
|
|
|
|
|
|
|
|
|
Other stock compensation
|
|
|
|
|
|
|
|
|
|
|
3.0
|
|
|
|
|
|
|
|
|
|
|
|
|
|
|
|
3.0
|
|
|
Net loss attributable to non-controlling interest
|
|
|
|
|
|
|
|
|
|
|
|
|
|
|
|
|
|
|
(0.3
|
)
|
|
|
|
|
|
|
(0.3
|
)
|
|
Debt discount
|
|
|
|
|
|
|
|
|
|
|
32.9
|
|
|
|
|
|
|
|
|
|
|
|
|
|
|
|
32.9
|
|
|
Retirement of debt discount
|
|
|
|
|
|
|
|
|
|
|
(20.4
|
)
|
|
|
|
|
|
|
|
|
|
|
|
|
|
|
(20.4
|
)
|
|
|
|
|
|
|
|
|
|
|
|
|
|
|
|
|
|
|
|
|
|
|
|
|
|
|
|
|
|
|
|
Balance, June 30, 2010
|
|
|
36,539,663
|
|
|
$
|
—
|
|
|
$
|
331.1
|
|
|
$
|
(115.5
|
)
|
|
$
|
—
|
|
|
$
|
2.7
|
|
|
$
|
218.3
|
|
|
|
|
|
|
|
|
|
|
|
|
|
|
|
|
|
|
|
|
|
|
|
|
|
|
|
|
|
|
|
|
Comprehensive income (loss)
|
|
|
|
|
|
|
|
|
|
|
|
|
|
|
|
|
|
|
|
|
|
|
|
|
|
|
|
|
|
Foreign currency translation
|
|
|
|
|
|
|
|
|
|
|
|
|
|
|
|
|
|
|
|
|
|
|
—
|
|
|
|
—
|
|
|
Cash flow hedges
|
|
|
|
|
|
|
|
|
|
|
|
|
|
|
|
|
|
|
|
|
|
|
4.9
|
|
|
|
4.9
|
|
|
Net income
|
|
|
|
|
|
|
|
|
|
|
|
|
|
|
65.8
|
|
|
|
|
|
|
|
|
|
|
|
65.8
|
|
|
|
|
|
|
|
|
|
|
|
|
|
|
|
|
|
|
|
|
|
|
|
|
|
|
|
|
|
|
|
|
Total comprehensive income
|
|
|
|
|
|
|
|
|
|
|
|
|
|
|
|
|
|
|
|
|
|
|
|
|
|
|
70.7
|
|
|
Issuance of common stock
|
|
|
6,672,142
|
|
|
|
|
|
|
|
130.2
|
|
|
|
|
|
|
|
|
|
|
|
|
|
|
|
130.2
|
|
|
Restricted stock grants
|
|
|
378,819
|
|
|
|
|
|
|
|
|
|
|
|
|
|
|
|
|
|
|
|
|
|
|
|
|
|
|
Stock options exercised
|
|
|
320,498
|
|
|
|
|
|
|
|
3.2
|
|
|
|
|
|
|
|
|
|
|
|
|
|
|
|
3.2
|
|
|
Vested portion of granted restricted
|
|
|
|
|
|
|
|
|
|
|
|
|
|
|
|
|
|
|
|
|
|
|
|
|
|
|
|
|
|
stock and restricted stock units
|
|
|
|
|
|
|
|
|
|
|
2.0
|
|
|
|
|
|
|
|
|
|
|
|
|
|
|
|
2.0
|
|
|
Retirement of common stock
|
|
|
(167,181
|
)
|
|
|
|
|
|
|
|
|
|
|
|
|
|
|
|
|
|
|
|
|
|
|
|
|
|
Other stock compensation
|
|
|
|
|
|
|
|
|
|
|
2.7
|
|
|
|
|
|
|
|
|
|
|
|
|
|
|
|
2.7
|
|
|
Net loss attributable to non-controlling interest
|
|
|
|
|
|
|
|
|
|
|
|
|
|
|
|
|
|
|
(0.5
|
)
|
|
|
|
|
|
|
(0.5
|
)
|
|
|
|
|
|
|
|
|
|
|
|
|
|
|
|
|
|
|
|
|
|
|
|
|
|
|
|
|
|
|
|
Balance, June 30, 2011
|
|
|
43,743,941
|
|
|
$
|
—
|
|
|
$
|
469.2
|
|
|
$
|
(49.7
|
)
|
|
$
|
(0.5
|
)
|
|
$
|
7.6
|
|
|
$
|
426.6
|
|
|
|
|
|
|
|
|
|
|
|
|
|
|
|
|
|
|
|
|
|
|
|
|
|
|
|
|
|
|
|
See accompanying notes to consolidated financial statements.
70
DFC
GLOBAL CORP.
CONSOLIDATED
STATEMENTS OF CASH FLOWS
(In
millions)
| |
|
|
|
|
|
|
|
|
|
|
|
|
|
|
|
Twelve Months Ended
|
|
|
|
|
June 30,
|
|
|
|
|
2009
|
|
|
2010
|
|
|
2011
|
|
|
|
|
Cash flows from operating activities:
|
|
|
|
|
|
|
|
|
|
|
|
|
|
Net (loss) income
|
|
$
|
(6.8
|
)
|
|
$
|
(5.2
|
)
|
|
$
|
65.3
|
|
|
Adjustments to reconcile net (loss) income to net cash provided
by operating activities:
|
|
|
|
|
|
|
|
|
|
|
|
|
|
Depreciation and amortization
|
|
|
19.9
|
|
|
|
25.0
|
|
|
|
35.5
|
|
|
Loss on extinguishment of debt
|
|
|
—
|
|
|
|
9.5
|
|
|
|
—
|
|
|
Change in fair value of derivatives not designated as hedges
|
|
|
—
|
|
|
|
3.6
|
|
|
|
20.7
|
|
|
Provision for loan losses
|
|
|
52.1
|
|
|
|
45.9
|
|
|
|
73.6
|
|
|
Non-cash stock compensation
|
|
|
6.4
|
|
|
|
5.8
|
|
|
|
4.6
|
|
|
Loss on disposal of fixed assets
|
|
|
3.2
|
|
|
|
1.2
|
|
|
|
0.1
|
|
|
Unrealized foreign exchange (gain) loss
|
|
|
(5.5
|
)
|
|
|
9.9
|
|
|
|
(47.4
|
)
|
|
Deferred tax (benefit) provision
|
|
|
(10.5
|
)
|
|
|
0.7
|
|
|
|
15.2
|
|
|
Accretion of debt discount and deferred issuance costs
|
|
|
8.9
|
|
|
|
13.4
|
|
|
|
15.3
|
|
|
Change in assets and liabilities (net of effect of acquisitions):
|
|
|
|
|
|
|
|
|
|
|
|
|
|
Increase in loans and other receivables
|
|
|
(44.3
|
)
|
|
|
(66.7
|
)
|
|
|
(121.9
|
)
|
|
Increase in prepaid expenses and other
|
|
|
(5.6
|
)
|
|
|
(3.6
|
)
|
|
|
(8.4
|
)
|
|
Provision for litigation settlements
|
|
|
49.2
|
|
|
|
24.6
|
|
|
|
—
|
|
|
(Decrease) increase in accounts payable, accrued expenses and
other liabilities
|
|
|
(7.8
|
)
|
|
|
22.6
|
|
|
|
(35.7
|
)
|
|
|
|
|
|
|
|
|
|
|
|
|
|
|
|
Net cash provided by operating activities
|
|
|
59.2
|
|
|
|
86.7
|
|
|
|
16.9
|
|
|
Cash flows from investing activities:
|
|
|
|
|
|
|
|
|
|
|
|
|
|
Acquisitions, net of cash acquired
|
|
|
(26.2
|
)
|
|
|
(155.0
|
)
|
|
|
(289.2
|
)
|
|
Additions to property and equipment
|
|
|
(15.8
|
)
|
|
|
(29.4
|
)
|
|
|
(41.4
|
)
|
|
|
|
|
|
|
|
|
|
|
|
|
|
|
|
Net cash used in investing activities
|
|
|
(42.0
|
)
|
|
|
(184.4
|
)
|
|
|
(330.6
|
)
|
|
Cash flows from financing activities:
|
|
|
|
|
|
|
|
|
|
|
|
|
|
Proceeds from the issuance of 10.375% senior notes due 2016
|
|
|
—
|
|
|
|
596.4
|
|
|
|
—
|
|
|
Proceeds from cross currency swaps
|
|
|
14.4
|
|
|
|
—
|
|
|
|
—
|
|
|
Proceeds from the exercise of stock options
|
|
|
3.3
|
|
|
|
1.5
|
|
|
|
3.2
|
|
|
Proceeds from offering of common stock, net
|
|
|
—
|
|
|
|
—
|
|
|
|
130.2
|
|
|
Purchase of company common stock
|
|
|
(7.5
|
)
|
|
|
—
|
|
|
|
—
|
|
|
Repayment of term loan notes
|
|
|
—
|
|
|
|
(369.2
|
)
|
|
|
—
|
|
|
Other debt payments
|
|
|
(3.6
|
)
|
|
|
(7.0
|
)
|
|
|
—
|
|
|
Purchase of 2.875% Senior Convertible Notes due 2011
|
|
|
—
|
|
|
|
(32.0
|
)
|
|
|
—
|
|
|
Net (decrease) increase in revolving credit facilities
|
|
|
(3.8
|
)
|
|
|
—
|
|
|
|
66.0
|
|
|
Payment of debt issuance and other costs
|
|
|
(0.1
|
)
|
|
|
(19.9
|
)
|
|
|
(5.0
|
)
|
|
|
|
|
|
|
|
|
|
|
|
|
|
|
|
Net cash provided by financing activities
|
|
|
2.7
|
|
|
|
169.8
|
|
|
|
194.4
|
|
|
Effect of exchange rate changes on cash and cash equivalents
|
|
|
(20.0
|
)
|
|
|
9.6
|
|
|
|
17.0
|
|
|
|
|
|
|
|
|
|
|
|
|
|
|
|
|
Net (decrease) increase in cash and cash equivalents
|
|
|
(0.1
|
)
|
|
|
81.7
|
|
|
|
(102.3
|
)
|
|
Cash and cash equivalents at beginning of period
|
|
|
209.7
|
|
|
|
209.6
|
|
|
|
291.3
|
|
|
|
|
|
|
|
|
|
|
|
|
|
|
|
|
Cash and cash equivalents at end of period
|
|
$
|
209.6
|
|
|
$
|
291.3
|
|
|
$
|
189.0
|
|
|
|
|
|
|
|
|
|
|
|
|
|
|
|
|
|
|
|
|
|
|
|
|
|
|
|
|
|
|
Supplemental disclosures of cash flow information:
|
|
|
|
|
|
|
|
|
|
|
|
|
|
Interest paid
|
|
$
|
32.9
|
|
|
$
|
48.3
|
|
|
$
|
90.4
|
|
|
Income taxes paid
|
|
$
|
25.8
|
|
|
$
|
22.9
|
|
|
$
|
25.1
|
|
See accompanying notes to consolidated financial statements
71
DFC
GLOBAL CORP.
NOTES TO
CONSOLIDATED FINANCIAL STATEMENTS
|
|
|
1.
|
Organization
and Business
|
The accompanying consolidated financial statements are those of
DFC Global Corp. and its wholly-owned subsidiaries
(collectively, the “Company” or “DFC”). DFC
Global Corp. is the parent company of Dollar Financial Group,
Inc. (“DFG”). The activities of DFC Global Corp.
consist primarily of its investment in DFG. DFC Global Corp. has
no employees or operating activities.
DFC Global Corp. is a Delaware corporation formed in 1990. Prior
to August 2011, our corporate name was “Dollar Financial
Corp.”. The Company, through its subsidiaries, provides
retail financial services to the general public through a
network of 1,269 locations (of which 1,198 are company owned)
operating principally as Money
Mart®,
The Money Shop,
Insta-Cheques®,
mce®,
Suttons and
Robertson®,
The Check Cashing
Store®,
Sefina®,
Optima®,
Helsingin
Panttism
and
MoneyNow!®
in Canada, the United Kingdom, the United States, Poland, the
Republic of Ireland, Sweden and Finland. This network of stores
offers a variety of financial services including consumer loans,
pawn services, gold buying, check cashing, money transfer
services and various other related services. In addition, the
Company provides financial services to primarily unbanked and
underbanked consumers in Poland through in-home servicing under
the trade name
Optima®.
The Company also offers Internet-based short term consumer loans
in the United Kingdom primarily under the brand names Payday
Express®
and Payday
UK®
and in Canada under the Money Mart name, as well as a U.K.-based
merchant cash advance business that primarily provides working
capital to small retail businesses by providing cash advances
against a future receivable calculated as a percentage of future
credit card receipts. Through its Dealers’ Financial
Services, (“DFS”) subsidiary, the Company provides fee
based services to enlisted military personnel seeking to
purchase new and used vehicles who make applications for auto
loans that are funded and serviced under an agreement with a
major third-party national bank based in the United States.
The Company’s common stock trades on the NASDAQ Global
Select Market under the symbol “DLLR”.
|
|
|
2.
|
Summary
of Significant Accounting Policies
|
Use of
Estimates
The preparation of financial statements in conformity with
United States generally accepted accounting principles
(“GAAP”) requires management to make estimates and
assumptions that affect the amounts reported in the consolidated
financial statements and accompanying notes. On an ongoing
basis, management evaluates its estimates and judgments,
including those related to revenue recognition, loss reserves,
valuation allowance for income taxes, litigation reserves and
impairment assessment of goodwill and other intangible assets.
Management bases its estimates on historical experience and
various other assumptions that are believed to be reasonable
under the circumstances, the results of which form the basis for
making judgments about the carrying values of assets and
liabilities. Actual results may differ from these estimates.
Principles
of Consolidation
The accompanying consolidated financial statements include the
accounts of the Company. All significant intercompany accounts
and transactions have been eliminated in consolidation.
Reclassifications
Certain prior year amounts have been reclassified to conform to
current year presentation. These reclassifications have no
effect on net income or stockholders’ equity. These
reclassifications include:
|
|
|
| |
•
|
Reclassifying $2.0 million ($9.4 million of loans and
a related allowance of $7.4 million) from Consumer Loans,
net, to Loans in Default, net, in the Company’s
Consolidated Balance Sheet as of
|
72
DFC
GLOBAL CORP.
NOTES TO
CONSOLIDATED FINANCIAL
STATEMENTS — (Continued)
|
|
|
2.
|
Summary
of Significant Accounting Policies (continued)
|
|
|
|
| |
|
June 30, 2010, to conform the presentation of our Poland
business to the remainder of the Company’s operations.
|
|
|
|
| |
•
|
Reclassifying $35.5 million of pawn loans from Consumer
Loans, net, to Pawn Loans in the Company’s Consolidated
Balance Sheet as of June 30, 2010.
|
| |
| |
•
|
Reclassifying $1.4 million and $20.7 million of gold
sales from Other Revenue, to Gold Sales Revenue, and
$0.1 million and $8.1 million of purchased gold costs
from Other Operating Expense, to Purchased Gold Costs in the
Company’s Consolidated Statement of Operations for the
years ended June 30, 2009 and 2010, respectively. For the
years ended June 30, 2009 and 2010, the previously reported
amounts of gold sales and purchased gold costs have been revised
to correct certain immaterial classification errors.
Specifically, charges previously netted in calculating total
revenues of $2.3 million and $22.4 million for the
years ended June 30, 2009 and 2010, respectively, have been
reclassified to operating expenses. This reclassification
increased other revenue, total revenue, other operating expense,
and total operating expense by $2.3 million and
$22.4 million for the years ended June 30, 2009 and
2010, respectively. This reclassification did not affect the
previously reported amounts of operating margin for any period.
|
Revenue
Recognition
With respect to company-operated stores, revenues from the
Company’s check cashing, money order sales, money transfer
and other miscellaneous services reported in other revenues on
its statement of operations are all recognized when the
transactions are completed at the
point-of-sale
in the store.
With respect to the Company’s franchised locations, the
Company recognizes initial franchise fees upon fulfillment of
all significant obligations to the franchisee. Royalties from
franchisees are recognized as earned. The Company’s
standard franchise agreement forms grant to the franchisee the
right to develop and operate a store and use the associated
trade names, trademarks, and service marks within the standards
and guidelines established by the Company. As part of the
franchise agreement, the Company provides certain pre-opening
assistance and after the franchised location has opened, the
Company also provides updates to the software, samples of
certain advertising and promotional materials and other
post-opening assistance.
For single-payment consumer loans that the Company makes
directly (company-funded loans), which have terms ranging from 1
to 45 days, revenues are recognized using the interest
method. Loan origination fees are recognized as an adjustment to
the yield on the related loan. The Company’s reserve policy
regarding these loans is summarized below in “Consumer Loan
Loss Reserves Policy.”
Secured pawn loans are offered at most of the Company’s
retail financial services locations in the United Kingdom and at
the Company’s pawn shops in Europe. Pawn loans are
short-term in nature and are secured by the customer’s
personal property (“pledge”). At the time of pledge,
the loan is recorded and interest and fees, net of costs are
accrued for over the life of the loan. If the loan is not
repaid, the collateral is deemed forfeited and the pawned item
will go up for auction. If the item is sold, proceeds are used
to recover the loan value, interest accrued and fees. Generally,
excess funds received from the sale are repaid to the customer.
As with the Company’s single-payment consumer loans,
revenues are recognized using the interest rate method and loan
origination fees, net, are recognized as an adjustment to the
yield on the related loan.
DFS fee income associated with originated loan contracts is
recognized as revenue by the Company concurrent with the funding
of loans by the third party lending financial institution. The
Company also earns additional fee income from sales of service
agreement and guaranteed asset protection (“GAP”)
insurance contracts. DFS may be charged back
(“chargebacks”) for service agreement and GAP fees in
the event contracts are prepaid, defaulted or terminated.
Service agreement and GAP contract fees are recorded at the time
the contracts are sold and a reserve for future chargebacks is
established based on historical operating
73
DFC
GLOBAL CORP.
NOTES TO
CONSOLIDATED FINANCIAL
STATEMENTS — (Continued)
|
|
|
2.
|
Summary
of Significant Accounting Policies (continued)
|
results and the termination provisions of the applicable
contracts. Service warranty and GAP contract fees, net of
estimated chargebacks, are included in Other Revenues in the
accompanying consolidated statements of operations.
Cash
and Cash Equivalents
Cash includes cash in stores and demand deposits with financial
institutions. Cash equivalents are defined as short-term, highly
liquid investments both readily convertible to known amounts of
cash and so near maturity that there is insignificant risk of
changes in value because of changes in interest rates.
Consumer
Loans, Net
Unsecured short-term and longer-term installment loans that the
Company originates on its own behalf are reflected on the
balance sheet in consumer loans receivable, net. Consumer loans,
net are reported net of a reserve as described below in
“Consumer Loan Loss Reserves Policy”.
Loans
in Default
Loans in default consist of short-term consumer loans originated
by the Company which are in default status. An allowance for the
defaulted loans receivable is established and is included in the
loan loss provisions in the period that the loan is placed in
default status. The reserve is reviewed monthly and any
additional provision to the loan loss reserve as a result of
historical loan performance, current and expected collection
patterns and current economic trends is included with the
Company’s loan loss provisions. If the loans remain in a
defaulted status for an extended period of time, an allowance
for the entire amount of the loan is recorded and the receivable
is ultimately charged off.
Consumer
Loan Loss Reserves Policy
The Company maintains a loan loss reserve for anticipated losses
for consumer loans that the Company directly originates. To
estimate the appropriate level of loan loss reserves, the
Company considers known relevant internal and external factors
that affect loan collectability, including the amount of
outstanding loans owed to the Company, historical loans charged
off, current collection patterns and current economic trends.
The Company’s current loan loss reserve is based on its net
charge-offs, typically expressed as a percentage of loan amounts
originated for the last twelve months applied against the
principal balance of outstanding loans that the Company makes
directly. As these conditions change, the Company may need to
make additional allowances in future periods.
Generally, when a loan is originated, the customer receives the
cash proceeds in exchange for a post-dated check or a written
authorization to initiate a charge to the customer’s bank
account on the stated maturity date of the loan. If the check or
the debit to the customer’s account is returned from the
bank unpaid, the loan is placed in default status and an
allowance for this defaulted loan receivable is established and
is included in loan loss provision expense in the period that
the loan is placed in default status. This reserve is reviewed
monthly and any additional provision to the loan loss reserve as
a result of historical loan performance, current collection
patterns and current economic trends is included in loan loss
provision expense. If a loan remains in defaulted status for an
extended period of time, typically 180 days, an allowance
for the entire amount of the loan is recorded and the receivable
is ultimately charged off. Recoveries on loans that were
completely charged off are credited to the allowance when
collected.
The Company does not maintain a loan loss reserve for potential
future losses on pawn loans. Pawn lawns are secured by the
customer’s pledged item, which is generally 50% to 80% of
the appraised fair value of the pledged item, thus reducing the
Company’s exposure to losses on defaulted pawn loans. The
Company’s
74
DFC
GLOBAL CORP.
NOTES TO
CONSOLIDATED FINANCIAL
STATEMENTS — (Continued)
|
|
|
2.
|
Summary
of Significant Accounting Policies (continued)
|
historical redemption rate on pawn loans is in excess of 85%,
which means that for more than 85% of its pawn loans, the
customer pays back the dollars borrowed, plus interest and fees,
and the Company returns the pledged item to the customer. In the
instance where the customer defaults on a pawn loan (fails to
redeem), the pledged item either sold at auction or sold to a
third party in the Company’s retail stores within several
weeks of the customer default. Except in very isolated
instances, the amount received at auction or in the
Company’s store is in excess of the original loan principal
plus accrued interest and fees. Generally, excess amounts
received over and above the Company’s recorded asset are
returned to the customer.
Other
receivables
Other receivables consist primarily of franchise and other
third-party receivables.
Property
and Equipment
Property and equipment are carried at cost less accumulated
depreciation. Depreciation is computed using the straight-line
method over the estimated useful lives of the assets, which vary
from three to five years. Leasehold improvements are amortized
using the straight-line method over the shorter of the lease
term (including renewal options that are reasonably assured) or
the estimated useful life of the related asset.
Goodwill
and Other Intangible Assets
Goodwill is the excess of cost over the fair value of the net
assets of the business acquired. In accordance with
ASC 350, goodwill is assigned to reporting units, which the
Company has determined to be its reportable operating units of
the United States Retail, Canada, DFS, and the United Kingdom,
Sefina, MEM and Poland (which are collectively reported in
Europe). The Company also has a corporate reporting unit which
consists of costs related to corporate management, oversight and
infrastructure, investor relations and other governance
activities. Because of the limited activities of the corporate
reporting unit, no goodwill has been assigned to it. Goodwill is
assigned to the reporting unit that benefits from the synergies
arising from each particular business combination. The Company
determines reporting units based on a review of operating
segments, and to the extent present, the underlying components.
To the extent that two or more operating segment components have
similar economic characteristics, their results are combined in
one reporting unit. Goodwill is evaluated for impairment on an
annual basis on June 30 or between annual tests if events occur
or circumstances change that would more likely than not reduce
the fair value of a reporting unit below its carrying amount. To
accomplish this, the Company is required to determine the
carrying value of each reporting unit by assigning the assets
and liabilities, including the existing goodwill and intangible
assets, to those reporting units. The Company is then required
to determine the fair value of each reporting unit and compare
it to the carrying amount of the reporting unit. To the extent
the carrying amount of a reporting unit exceeds the fair value
of the reporting unit, the Company would be required to perform
a second step to the impairment test because this is an
indication that the reporting unit goodwill may be impaired. If
after the second step of testing, the carrying amount of a
reporting unit exceeds the fair value of the individual tangible
and identifiable intangible assets, an impairment loss would be
recognized in an amount equal to the excess of the implied fair
value of the reporting unit’s goodwill over its carrying
value.
Indefinite-lived intangible assets consist of reacquired
franchise rights, DFS’ MILES program brand name and Sefina
and MEM trade names, which are deemed to have an indefinite
useful life and are not amortized.
Non-amortizable
intangibles with indefinite lives are tested for impairment
annually as of December 31, or whenever events or changes
in business circumstances indicate that an asset may be
impaired. If the estimated fair value is less than the carrying
amount of the intangible assets with indefinite lives, then an
impairment charge would be recognized to reduce the asset to its
estimated fair value.
75
DFC
GLOBAL CORP.
NOTES TO
CONSOLIDATED FINANCIAL
STATEMENTS — (Continued)
|
|
|
2.
|
Summary
of Significant Accounting Policies (continued)
|
The Company considers the goodwill impairment and indefinite
intangible impairment testing process to be one of the critical
accounting estimates used in the preparation of its consolidated
financial statements. The Company estimates the fair value of
its reporting units by using a discounted cash flow analysis or
a market-based approach, or a combination thereof. The
discounted cash flow analysis requires the Company to make
various assumptions about revenues, operating margins, growth
rates, and discount rates. These assumptions are based on the
Company’s budgets, business plans, economic projections,
anticipated future cash flows and marketplace data. Assumptions
are also made for perpetual growth rates for periods beyond the
period covered by the Company’s long term business plan.
The Company performs its goodwill impairment test annually as of
June 30, and its other intangibles impairment test annually
as of December 31. At the date of its last evaluations,
there was no impairment of goodwill or other intangibles.
However, the Company may be required to evaluate the
recoverability of goodwill and other intangible assets prior to
the required annual assessment if the Company experiences a
significant disruption to its business, unexpected significant
declines in its operating results, divestiture of a significant
component of its business, a sustained decline in market
capitalization, particularly if it falls below the
Company’s book value, or a significant change to the
regulatory environment in which the Company operates. While the
Company believes it has made reasonable estimates and
assumptions to calculate the fair value of goodwill and
indefinite-lived intangible assets, it is possible that a
material change could occur, including if actual experience
differs from the assumptions and considerations used in the
Company’s analyses. These differences could have a material
adverse impact on the consolidated results of operations and
cause the Company to perform the second step impairment test,
which could result in a material impairment of the
Company’s goodwill.
Debt
Issuance Costs
Debt issuance costs are amortized using the effective yield
method over the remaining term of the related debt (see
Note 10).
Operating
Expenses
The direct costs incurred in operating the Company’s
business have been classified as operating expenses. Operating
expenses include salaries and benefits of store and regional
employees, provisions for loan losses, rent and other occupancy
costs, purchased gold costs, depreciation of property and
equipment used to operate our business, bank charges, armored
carrier services, returned checks, net and cash shortages,
advertising, maintenance and repairs and other costs incurred by
the stores. Excluded from operating expenses are the corporate
expenses of the Company, which include salaries and benefits of
corporate employees, professional fees and travel costs.
Check
Cashing Returned Item Policy
The Company charges operating expense for losses on returned
checks during the period in which such checks are returned.
Recoveries on returned checks are credited to operating expense
in the period during which recovery is made. This direct method
for recording returned check losses and recoveries eliminates
the need for an allowance for returned checks.
Income
Taxes
The Company accounts for uncertainty in income taxes pursuant to
Financial Accounting Standards Board (the “FASB”)
Accounting Codification Statement (“ASC”) 740,
Income Taxes (“ASC 740”). The Company
recognizes the tax benefit from an uncertain tax position only
if it is more likely than not the tax position will be sustained
on examination by the taxing authorities, based on the technical
merits of the position. The tax benefits recognized in the
financial statements from such positions are then measured based
on the largest
76
DFC
GLOBAL CORP.
NOTES TO
CONSOLIDATED FINANCIAL
STATEMENTS — (Continued)
|
|
|
2.
|
Summary
of Significant Accounting Policies (continued)
|
benefit that has a greater than 50% likelihood of being realized
upon settlement. Interest and penalties related to uncertain tax
positions, if applicable, are recognized in the income tax
provision.
Advertising
Costs
The Company expenses advertising costs as incurred. Advertising
costs charged to expense were $8.4 million,
$16.7 million and $27.1 million for the three years
ended June 30, 2009, 2010 and 2011, respectively.
Fair
Value of Financial Instruments
The fair value of the 2.875% Senior Convertible Notes due
2027 issued by DFC (the “2027 Notes”), the
3.00% Senior Convertible Notes due 2028 issued by DFC (the
“2028 Notes”) and the 10.375% Senior Notes due
2016 issued by the Company’s Canadian subsidiary, National
Money Mart Company (the “2016 Notes”) are based on
broker quotations.
The total fair value of the 2027 Notes and the 2028 Notes were
approximately $40.0 million and $110.9 million,
respectively, at June 30, 2010, and $42.1 million and
$154.5 million, respectively, at June 30, 2011. These
fair values relate to the face value of the 2027 Notes and the
2028 Notes, and not the carrying value recorded on the
Company’s balance sheet. The fair value of the 2016 Notes
was approximately $609.0 million and $658.5 million at
June 30, 2010 and June 30, 2011, respectively.
The outstanding borrowings under the Company’s Global
Revolving Credit Facility and Scandinavian Credit Facilities are
variable interest debt instruments and their fair value
approximates their carrying value.
The Company’s other financial instruments consist of cash
and cash equivalents and derivatives, consumer loans and pawn
loans, which are short-term in nature and their fair value
approximates their carrying value net of allowance for loan loss.
Derivative
Instruments and Hedging Activities
The Derivative and Hedging Topic of the FASB Codification
requires companies to provide users of financial statements with
an enhanced understanding of: (a) how and why an entity
uses derivative instruments, (b) how derivative instruments
and related hedged items are accounted for, and (c) how
derivative instruments and related hedged items affect an
entity’s financial position, financial performance, and
cash flows. This Topic also requires qualitative disclosures
about objectives and strategies for using derivatives,
quantitative disclosures about the fair value of and gains and
losses on derivative instruments, and disclosures about
credit-risk-related contingent features in derivative
instruments.
As required by the Derivative and Hedging Topic of the FASB
Codification, the Company records all derivatives on the balance
sheet at fair value. The accounting for changes in the fair
value of derivatives depends on the intended use of the
derivative, whether we have elected to designate a derivative in
a hedging relationship and apply hedge accounting and whether
the hedging relationship has satisfied the criteria necessary to
apply hedge accounting. Derivatives designated and qualifying as
a hedge of the exposure to changes in the fair value of an
asset, liability, or firm commitment attributable to a
particular risk, such as interest rate risk, are considered fair
value hedges. Derivatives designated and qualifying as a hedge
of the exposure to variability in expected future cash flows, or
other types of forecasted transactions, are considered cash flow
hedges. Derivatives may also be designated as hedges of the
foreign currency exposure of a net investment in a foreign
operation. Hedge accounting generally provides for the matching
of the timing of gain or loss recognition on the hedging
instrument with the recognition of the changes in the fair value
of the hedged asset or liability that are attributable to the
hedged risk in a fair value hedge or the earnings effect of the
hedged forecasted transactions in a cash flow hedge. The Company
may enter into derivative contracts that
77
DFC
GLOBAL CORP.
NOTES TO
CONSOLIDATED FINANCIAL
STATEMENTS — (Continued)
|
|
|
2.
|
Summary
of Significant Accounting Policies (continued)
|
are intended to economically hedge certain of our risks, even
though hedge accounting does not apply or we elect not to apply
hedge accounting.
Put
Options
Operations in Europe and Canada expose the Company to shifts in
currency valuations. From time to time, the Company purchases
put options in order to protect aspects of the Company’s
operations in the Europe and Canada against foreign currency
fluctuations. Out of the money put options are generally used
because they cost less than completely averting risk using at
the money put options, and the maximum loss is limited to the
purchase price of the contracts. The Company has designated the
purchased put options as cash flow hedges of the foreign
exchange risk associated with the forecasted purchases of
foreign-currency-denominated investment securities. These cash
flow hedges have maturities of less than twelve months. For
derivative instruments that are designated and qualify as cash
flow hedges, the effective portions of the gain or loss on the
derivative instrument are initially recorded in accumulated
other comprehensive income as a separate component of
stockholders’ equity and are subsequently reclassified into
earnings in the period during which the hedged transaction is
recognized in earnings. Any ineffective portion of the gain or
loss is reported in other income/expense on the statement of
operations. For options designated as hedges, hedge
effectiveness is measured by comparing the cumulative change in
the hedge contract with the cumulative change in the hedged
forecasted transactions, both of which are based on forward
rates.
Cross-Currency
Interest Rate Swaps
From time to time, the Company enters into cross-currency
interest rate swaps to protect against changes in cash flows
attributable to changes in both the benchmark interest rate and
foreign exchange rates on its foreign denominated variable rate
term loan borrowing. In the past, the Company designated
derivative contracts as cash flow hedges for accounting
purposes. The Company recorded foreign exchange re-measurement
gains and losses related to the term loans and also records the
changes in fair value of the cross-currency swaps each period in
loss/gain on derivatives not designated as hedges in the
Company’s consolidated statements of operations. Because
these derivatives were designated as cash flow hedges, the
Company recorded the effective portion of the after-tax gain or
loss in other comprehensive income, which was subsequently
reclassified to earnings in the same period that the hedged
transactions affect earnings.
Foreign
Currency Translation and Transactions
Outside the United States, the Company operates financial
service outlets in Canada, the United Kingdom, Sweden, Finland,
Poland and the Republic of Ireland. The financial statements of
these foreign businesses have been translated into
U.S. dollars in accordance with GAAP. All balance sheet
accounts are translated at the current exchange rate at each
period end and income statement items are translated at the
average exchange rate for the period; resulting translation
adjustments are made directly to a separate component of
stockholders’ equity. Gains or losses resulting from
foreign currency transactions excluding the revaluation of
non-functional denominated debt are included in other expense
(income), net. Gains or losses resulting from the revaluation of
non-functional denominated debt are included in unrealized
foreign exchange gain (loss).
Common
Stock and Stock Split
At the Annual Meeting of Stockholders of the Company on
November, 11, 2010, the stockholders of the Company approved an
amendment to the Company’s Amended and Restated Certificate
of Incorporation to increase the number of authorized shares of
the Company’s common stock from 55,500,000 to 100,000,000.
On January 10, 2011, the Company announced a
three-for-two
stock split on all shares of its common stock. The stock split
was distributed on February 4, 2011 in the form of a stock
dividend to all stockholders
78
DFC
GLOBAL CORP.
NOTES TO
CONSOLIDATED FINANCIAL
STATEMENTS — (Continued)
|
|
|
2.
|
Summary
of Significant Accounting Policies (continued)
|
of record on January 20, 2011. All share and per share
amounts presented in this report were retroactively adjusted for
the common stock split.
On April 13, 2011, the Company completed an underwritten
public offering of 6.0 million shares of DFC common stock
at a price to the public of $20.75 per share. Net proceeds to
the Company from the offering were approximately
$117.0 million, after deducting the underwriting discount
and the Company’s offering expenses. On April 25,
2011, the underwriters exercised their overallotment option
under the terms of the underwriting agreement to purchase
672,142 additional shares of DFC common stock and surrendered
their rights with respect to the remaining shares covered by
such option. Net proceeds to the Company from the sale of the
overallotment shares were approximately $13.2 million.
Earnings
per Share
Basic earnings per share are computed by dividing net
income/loss by the weighted average number of shares of common
stock outstanding. Diluted earnings per share are computed by
dividing net income/loss by the weighted average number of
shares of common stock outstanding, after adjusting for the
dilutive effect of stock options restricted stock and restricted
stock units. The following table presents the reconciliation of
the numerator and denominator used in the calculation of basic
and diluted earnings per share (in millions):
| |
|
|
|
|
|
|
|
|
|
|
|
|
|
|
|
Year Ended June 30,
|
|
|
|
|
2009
|
|
|
2010
|
|
|
2011
|
|
|
|
|
Net (loss) income attributable to DFC Global Corp.
|
|
$
|
(6.8
|
)
|
|
$
|
(4.9
|
)
|
|
$
|
65.8
|
|
|
Reconciliation of denominator:
|
|
|
|
|
|
|
|
|
|
|
|
|
|
Weighted average number of common shares outstanding —
basic(1)
|
|
|
36.0
|
|
|
|
36.2
|
|
|
|
38.0
|
|
|
Effect of dilutive stock options(2)
|
|
|
—
|
|
|
|
—
|
|
|
|
1.1
|
|
|
Effect of unvested restricted stock and restricted stock unit
grants(2)
|
|
|
—
|
|
|
|
—
|
|
|
|
0.4
|
|
|
Dilutive effect of convertible debt
|
|
|
—
|
|
|
|
—
|
|
|
|
0.3
|
|
|
|
|
|
|
|
|
|
|
|
|
|
|
|
|
Weighted average number of shares of common stock
outstanding — diluted
|
|
|
36.0
|
|
|
|
36.2
|
|
|
|
39.8
|
|
|
|
|
|
|
|
|
|
|
|
|
|
|
|
|
|
|
|
(1) |
|
Excludes 0.2, 0.2 and 0.1 shares of unvested restricted
stock which are included in total outstanding shares of common
stock as of June 30, 2009, 2010 and 2011, respectively. The
dilutive effect of restricted stock and restricted stock units
is included in the calculation of diluted earnings per share
using the treasury stock method. |
| |
|
(2) |
|
The effect of dilutive stock options was determined under the
treasury stock method. Due to net losses during fiscal 2009 and
2010, the effect of the dilutive options and unvested shares of
restricted stock and restricted stock unit grants were
considered to be anti-dilutive, and therefore were not included
in the calculation of diluted earnings per share. |
Recent
Accounting Pronouncements
On January 21, 2010, the FASB issued ASU
2010-06,
Improving Disclosures about Fair Value Measurements. The
standard amends ASC Topic 820, Fair Value Measurements and
Disclosures to require additional disclosures related to
transfers between levels in the hierarchy of fair value
measurement. The standard does not change how fair values are
measured. The standard is effective for interim and annual
reporting periods beginning after December 15, 2009. The
Company adopted this Statement beginning in the quarterly period
ended March 31, 2010, as required, and adoption has not had
a material impact on the Company’s consolidated financial
statements.
79
DFC
GLOBAL CORP.
NOTES TO
CONSOLIDATED FINANCIAL
STATEMENTS — (Continued)
|
|
|
2.
|
Summary
of Significant Accounting Policies (continued)
|
In July 2010, the FASB issued ASU
2010-20,
Receivables — Disclosures about the Credit Quality
of Financing Receivables and the Allowance for Credit
Losses. ASU
2010-20
amends Topic 310 to improve the disclosures that an entity
provides about the credit quality of its financing receivables
and the related allowance for credit losses. As a result of
these amendments, an entity is required to disaggregate by
portfolio segment or class certain existing disclosures and
provide new disclosures about its financing receivables and
related allowance for credit losses. These provisions are
effective for interim and annual reporting periods ending on or
after December 15, 2010. The Company adopted ASU
2010-20 for
its quarter ending December 31, 2010. ASU
2010-20
concerns disclosures only and did not have a material impact on
the Company’s financial position or results of operations.
In December 2010, the FASB issued ASU
No. 2010-29,
Business Combinations (Topic 805) — Disclosure of
Supplementary Pro Forma Information for Business
Combinations. This standard update clarifies that, when
presenting comparative financial statements, SEC registrants
should disclose revenue and earnings of the combined entity as
though the current period business combinations had occurred as
of the beginning of the comparable prior annual reporting period
only. The update also expands the supplemental pro forma
disclosures to include a description of the nature and amount of
material, nonrecurring pro forma adjustments directly
attributable to the business combination included in the
reported pro forma revenue and earnings. ASU
2010-29 is
effective prospectively for material (either on an individual or
aggregate basis) business combinations entered into in fiscal
years beginning on or after December 15, 2010 with early
adoption permitted. ASU
2010-29
concerns disclosures only and will not have a material impact on
the Company’s financial position or results of operations.
The Company plans to adopt ASU
2010-29 on
July 1, 2011.
In June 2011, the FASB issued ASU
No. 2011-05,
Comprehensive Income (Topic 220) — Presentation of
Comprehensive Income. This standard update amends Topic 220
to require entities to present the total of comprehensive
income, the components of net income, and the components of
other comprehensive income either in a single continuous
statement of comprehensive income or in two separate but
consecutive statements. These provisions are effective for
fiscal years, and interim periods within those years, beginning
after December 15, 2011, and should be applied
retrospectively. ASU
2011-05
concerns disclosures only and will not have a material impact on
the Company’s financial position or results of operations.
|
|
|
3.
|
Supplementary
Cash Flow Information
|
Non-Cash
Transactions
In fiscal 2010, the Company wrote-off $9.5 million related
to losses on extinguishment of debt, consisting of
$5.0 million of unamortized deferred issuance costs related
to the Company’s amended and restated credit agreement,
$3.9 million of non-cash interest from the terminated U.K.
cross-currency swaps and $0.6 million of charges related to
the repurchase of $35.2 million aggregate principal amount
of the 2027 Notes in February 2010.
|
|
|
4.
|
Stock
Based Compensation Plan
|
The DFC Global Corp. 2005 Stock Incentive Plan (the “2005
Plan”), after giving effect for the Company’s three
for two stock split for stockholders of record on
January 20, 2011, states that 2,578,043 shares of the
Company’s common stock may be awarded to employees or
consultants of the Company. The awards may be issued at the
discretion of the Company’s Board of Directors as
nonqualified stock options, incentive stock options or
restricted stock awards. The number of shares issued under the
2005 Plan is subject to adjustment as specified in the 2005 Plan
provisions. No options may be granted under the 2005 Plan after
January 24, 2015.
80
DFC
GLOBAL CORP.
NOTES TO
CONSOLIDATED FINANCIAL
STATEMENTS — (Continued)
|
|
|
4.
|
Stock
Based Compensation Plan (continued)
|
On November 15, 2007, the Company’s stockholders
adopted the DFC Global Corp. 2007 Equity Incentive Plan (the
“2007 Plan”). The 2007 Plan provides for the grant of
stock options, stock appreciation rights, stock awards,
restricted stock unit awards and performance awards
(collectively, the “Awards”) to non-employee members
of the Company’s Board of Directors and officers,
employees, independent consultants and contractors of the
Company and any subsidiary of the Company. On November 11,
2010, the Company’s stockholders approved an amendment to
the 2007 Plan. Under the terms of the amendment, the maximum
aggregate number of shares of the Company’s common stock
that may be issued pursuant to Awards granted under the 2007
Plan is 10,500,000, after giving effect for the Company’s
three for two stock split for stockholders of record as of
January 20, 2011; provided, however, that 1.67 shares
will be deducted from the number of shares available for grant
under the 2007 Plan for each share that underlies an Award
granted under the 2007 Plan on or after November 11, 2010
for restricted stock, restricted stock units, performance awards
or other Awards for which the full value of such share is
transferred by the Company to the award recipient. The shares
that may be issued under the 2007 Plan may be authorized, but
unissued or reacquired shares of the Company’s common
stock. No grantee may receive an Award relating to more than
750,000 shares in the aggregate per fiscal year under the
2007 Plan.
Stock options and stock appreciation rights granted under the
aforementioned plans have an exercise price equal to the closing
price of the Company’s common stock on the date of grant.
To date no stock appreciation rights have been granted.
Compensation expense, net of the related tax benefit related to
share-based compensation included in the statement of operations
for the twelve months ended June 30, 2009, 2010 and 2011
was $4.1 million, $4.9 million and $5.0 million,
respectively.
81
DFC
GLOBAL CORP.
NOTES TO
CONSOLIDATED FINANCIAL
STATEMENTS — (Continued)
|
|
|
4.
|
Stock
Based Compensation Plan (continued)
|
The following table presents information on stock options:
| |
|
|
|
|
|
|
|
|
|
|
|
|
|
|
|
|
|
|
|
|
|
|
|
|
|
Weighted
|
|
|
|
|
|
|
|
|
|
|
Weighted
|
|
|
Average
|
|
|
|
|
|
|
|
|
|
|
Average
|
|
|
Contractual
|
|
|
Aggregate
|
|
|
|
|
|
|
|
Exercise
|
|
|
Term
|
|
|
Intrinsic
|
|
|
|
|
|
|
|
Price
|
|
|
(years)
|
|
|
Value
|
|
|
|
|
|
|
|
|
|
|
|
|
|
($ in millions)
|
|
|
|
|
Options outstanding at June 30, 2008
|
|
|
|
|
|
|
|
|
|
|
|
|
|
|
|
|
|
(1,543,167 shares exercisable)
|
|
|
2,313,557
|
|
|
$
|
10.83
|
|
|
|
|
|
|
|
|
|
|
Granted
|
|
|
686,578
|
|
|
$
|
5.66
|
|
|
|
|
|
|
|
|
|
|
Exercised
|
|
|
(390,818
|
)
|
|
$
|
8.49
|
|
|
|
|
|
|
|
|
|
|
Forfeited
|
|
|
(246,542
|
)
|
|
$
|
10.95
|
|
|
|
|
|
|
|
|
|
|
|
|
|
|
|
|
|
|
|
|
|
|
|
|
|
|
|
|
Options outstanding at June 30, 2009
|
|
|
|
|
|
|
|
|
|
|
|
|
|
|
|
|
|
(1,367,434 shares exercisable)
|
|
|
2,362,775
|
|
|
$
|
9.71
|
|
|
|
|
|
|
|
|
|
|
Granted
|
|
|
734,436
|
|
|
$
|
12.00
|
|
|
|
|
|
|
|
|
|
|
Exercised
|
|
|
(132,772
|
)
|
|
$
|
10.98
|
|
|
|
|
|
|
|
|
|
|
Forfeited
|
|
|
(56,421
|
)
|
|
$
|
10.12
|
|
|
|
|
|
|
|
|
|
|
|
|
|
|
|
|
|
|
|
|
|
|
|
|
|
|
|
|
Options outstanding at June 30, 2010
|
|
|
|
|
|
|
|
|
|
|
|
|
|
|
|
|
|
(1,798,522 shares exercisable)
|
|
|
2,908,018
|
|
|
$
|
10.22
|
|
|
|
|
|
|
|
|
|
|
Granted
|
|
|
299,158
|
|
|
$
|
19.56
|
|
|
|
|
|
|
|
|
|
|
Exercised
|
|
|
(320,694
|
)
|
|
$
|
9.91
|
|
|
|
|
|
|
|
|
|
|
Forfeited
|
|
|
(114,037
|
)
|
|
$
|
9.85
|
|
|
|
|
|
|
|
|
|
|
|
|
|
|
|
|
|
|
|
|
|
|
|
|
|
|
|
|
Options outstanding at June 30, 2011
|
|
|
2,772,445
|
|
|
$
|
11.28
|
|
|
|
6.7
|
|
|
$
|
28.8
|
|
|
|
|
|
|
|
|
|
|
|
|
|
|
|
|
|
|
|
|
Exercisable at June 30, 2011
|
|
|
2,044,088
|
|
|
$
|
10.51
|
|
|
|
5.9
|
|
|
$
|
22.8
|
|
|
|
|
|
|
|
|
|
|
|
|
|
|
|
|
|
|
|
The aggregate intrinsic value in the above table reflects the
total pre-tax intrinsic value (the difference between the
Company’s closing stock price on the last trading day of
the period and the exercise price of the options, multiplied by
the number of
in-the-money
stock options) that would have been received by the option
holders had all option holders exercised their options on
June 30, 2011. The intrinsic value of the Company’s
stock options changes based on the closing price of the
Company’s common stock. The total intrinsic value of
options exercised for the years ended June 30, 2009, 2010
and 2011 was $1.5 million, $0.7 million and
$3.6 million, respectively. As of June 30, 2011, the
total unrecognized compensation to be recognized over an
estimated weighted-average period of 2.4 years related to
stock options is expected to be $3.4 million. Cash received
from stock options exercised for the twelve months ended
June 30, 2010 and 2011 was $1.5 million and
$3.2 million, respectively.
82
DFC
GLOBAL CORP.
NOTES TO
CONSOLIDATED FINANCIAL
STATEMENTS — (Continued)
|
|
|
4.
|
Stock
Based Compensation Plan (continued)
|
The weighted average fair value of each employee option grant
was estimated on the date of grant using the Black-Scholes
option pricing model with the following weighted-average
assumptions used for grants during the fiscal years ended 2009,
2010 and 2011:
| |
|
|
|
|
|
|
|
|
|
|
|
|
|
|
|
Year Ended June 30,
|
|
|
|
|
2009
|
|
|
2010
|
|
|
2011
|
|
|
|
|
Expected volatility
|
|
|
49.6
|
%
|
|
|
53.9
|
%
|
|
|
51.4
|
%
|
|
Expected life (years)
|
|
|
5.8
|
|
|
|
5.9
|
|
|
|
5.7
|
|
|
Risk-free interest rate
|
|
|
2.51
|
%
|
|
|
2.97
|
%
|
|
|
2.08
|
%
|
|
Expected dividends
|
|
|
None
|
|
|
|
None
|
|
|
|
None
|
|
|
Weighted average fair value
|
|
$
|
2.75
|
|
|
$
|
6.35
|
|
|
$
|
9.66
|
|
Restricted stock awards granted under the 2005 Plan and 2007
Plan become vested (i) upon the Company attaining certain
annual pre-tax earnings targets (“performance-based”)
and (ii) after a designated period of time
(“time-based”), which is generally three years.
Compensation expense is recorded ratably over the requisite
service period based upon an estimate of the likelihood of
achieving the performance goals. Compensation expense related to
restricted stock awards is measured based on the fair value
using the closing market price of the Company’s common
stock on the date of the grant.
Information concerning restricted stock awards is as follows:
| |
|
|
|
|
|
|
|
|
|
|
|
Restricted
|
|
|
Weighted
|
|
|
|
|
Stock
|
|
|
Average
|
|
|
|
|
Awards
|
|
|
Price
|
|
|
|
|
Outstanding at June 30, 2008
|
|
|
78,459
|
|
|
$
|
14.60
|
|
|
Granted
|
|
|
145,128
|
|
|
$
|
6.25
|
|
|
Vested
|
|
|
(60,830
|
)
|
|
$
|
13.71
|
|
|
Forfeited
|
|
|
(4,569
|
)
|
|
$
|
12.33
|
|
|
|
|
|
|
|
|
|
|
|
|
Outstanding at June 30, 2009
|
|
|
158,188
|
|
|
$
|
7.35
|
|
|
Granted
|
|
|
47,849
|
|
|
$
|
15.24
|
|
|
Vested
|
|
|
(55,193
|
)
|
|
$
|
7.89
|
|
|
|
|
|
|
|
|
|
|
|
|
Outstanding at June 30, 2010
|
|
|
150,844
|
|
|
$
|
9.66
|
|
|
Vested
|
|
|
(70,568
|
)
|
|
$
|
9.47
|
|
|
|
|
|
|
|
|
|
|
|
|
Outstanding at June 30, 2011
|
|
|
80,276
|
|
|
$
|
9.82
|
|
|
|
|
|
|
|
|
|
|
|
Restricted Stock Unit awards (RSUs) granted under the 2005 Plan
and 2007 Plan become vested after a designated period of time
(“time-based”), which is generally on a quarterly
basis over three years. Compensation expense is recorded ratably
over the requisite service period. Compensation expense related
to RSUs is measured based on the fair value using the closing
market price of the Company’s common stock on the date of
the grant.
83
DFC
GLOBAL CORP.
NOTES TO
CONSOLIDATED FINANCIAL
STATEMENTS — (Continued)
|
|
|
4.
|
Stock
Based Compensation Plan (continued)
|
Information concerning restricted stock unit awards is as
follows:
| |
|
|
|
|
|
|
|
|
|
|
|
Restricted
|
|
|
Weighted
|
|
|
|
|
Stock Unit
|
|
|
Average
|
|
|
|
|
Awards
|
|
|
Grant
|
|
|
|
|
Outstanding at June 30, 2008
|
|
|
340,244
|
|
|
$
|
14.21
|
|
|
Granted
|
|
|
459,508
|
|
|
$
|
5.25
|
|
|
Vested
|
|
|
(154,326
|
)
|
|
$
|
14.54
|
|
|
Forfeited
|
|
|
(24,489
|
)
|
|
$
|
14.08
|
|
|
|
|
|
|
|
|
|
|
|
|
Outstanding at June 30, 2009
|
|
|
620,937
|
|
|
$
|
7.50
|
|
|
Granted
|
|
|
721,338
|
|
|
$
|
11.85
|
|
|
Vested
|
|
|
(399,690
|
)
|
|
$
|
9.47
|
|
|
Forfeited
|
|
|
(33,559
|
)
|
|
$
|
10.41
|
|
|
|
|
|
|
|
|
|
|
|
|
Outstanding at June 30, 2010
|
|
|
909,026
|
|
|
$
|
9.98
|
|
|
Granted
|
|
|
312,190
|
|
|
$
|
19.77
|
|
|
Vested
|
|
|
(415,004
|
)
|
|
$
|
10.65
|
|
|
Forfeited
|
|
|
(89,239
|
)
|
|
$
|
10.79
|
|
|
|
|
|
|
|
|
|
|
|
|
Outstanding at June 30, 2011
|
|
|
716,973
|
|
|
$
|
13.75
|
|
|
|
|
|
|
|
|
|
|
|
As of June 30, 2011, there was $10.6 million of total
unrecognized compensation cost related to unvested restricted
share-based compensation arrangements granted under the plans.
That cost is expected to be recognized over a weighted average
period of 1.5 years. The total fair value of shares vested
during twelve months ended June 30, 2009, 2010 and 2011 was
$3.1 million $4.2 million and $5.1 million,
respectively.
|
|
|
5.
|
Employee
Retirement Plans
|
Retirement benefits are provided to substantially all
U.S. full-time employees who have completed
1,000 hours of service through a defined contribution
retirement plan. Prior to January 1, 2011, the Company
matched 50% of each employee’s contribution, up to 8% of
the employee’s compensation. Effective January 1, 2011
the Company changed its matching contributions, now matching
100% of employee contributions up to 3% and 50% of employee
contributions exceeding 3% up to 5%. The Company’s foreign
subsidiaries offer similar plans, the terms of which vary based
on statutory requirements.
Total contributions charged to expense were $1.2 million,
$1.3 million and $1.8 million for the years ended
June 30, 2009, 2010 and 2011, respectively.
The DFC Global Corp. Deferred Compensation Plan’s (the
“Plan”) primary purpose is to provide tax-advantageous
asset accumulation for a select group of management and highly
compensated employees. Eligible employees may elect to defer up
to fifty percent of base salary
and/or one
hundred percent of bonus earned. The Administrator, a person
appointed by the Company’s Board of Directors, may further
limit the minimum or maximum amount deferred by any plan
participants, for any reason.
During fiscal 2007, the Compensation Committee of the Board of
Directors approved discretionary contributions to the Plan in
the amount of $1.1 million. Each such award was granted
July 1, 2007 and vests ratably on an annual basis over a
three-year period if, and only if, the Company attains certain
strategic objectives as established by the Board of Directors
for each fiscal year during the three-year period. The Company
attained those strategic objectives for fiscal years 2009, 2010
and 2011.
84
DFC
GLOBAL CORP.
NOTES TO
CONSOLIDATED FINANCIAL
STATEMENTS — (Continued)
|
|
|
5.
|
Employee
Retirement Plans (continued)
|
There were no discretionary contributions to the Plan approved
by the Board of Directors during fiscal years 2009, 2010 or 2011.
Compensation expense related to discretionary contributions was
$0.7 and $0.3 million for the years ended June 30,
2009 and 2010, respectively.
The Company offers a variety of short-term loan products and
credit services to customers who typically cannot access other
traditional sources of credit and have non-traditional loan
histories. Accordingly, the Company has implemented proprietary
predictive scoring models that are designed to limit the dollar
amount of loans it offers to customers who statistically would
likely be unable to repay their loan. The Company has instituted
control mechanisms and a credit analytics function designed to
manage risk in its consumer loan activities. Collection
activities are also an important aspect of the Company’s
operations, particularly with respect to its consumer loan
products due to the relatively high incidence of unpaid balances
beyond stated terms. The Company operates centralized collection
centers to coordinate a consistent approach to customer service
and collections in each of its markets. The Company’s risk
control mechanisms include, among others, the daily monitoring
of initial return rates with respect to payments made on its
consumer loan portfolio. Because the Company’s revenue from
its consumer lending activities is generated through a high
volume of small-dollar financial transactions, its exposure to
loss from a single customer transaction is minimal.
The following reflects the credit quality of the Company’s
loans receivable. Generally, loans are determined to be
nonperforming when they are one day past due without a payment
for short term consumer loans and one hundred eighty days past
due without a payment for longer-term (less than one year)
installment loans:
Consumer
Credit Exposure
Credit Risk Profile Based on Payment Activity
(in millions)
| |
|
|
|
|
|
|
|
|
|
|
|
|
|
|
|
Consumer Loans,
|
|
|
Consumer Loans,
|
|
|
Pawn
|
|
|
|
|
Gross
|
|
|
Allowance
|
|
|
Loans
|
|
|
|
|
Performing
|
|
$
|
176.8
|
|
|
$
|
14.9
|
|
|
$
|
136.2
|
|
|
Non-performing
|
|
|
51.5
|
|
|
|
37.7
|
|
|
|
—
|
|
|
|
|
|
|
|
|
|
|
|
|
|
|
|
|
|
|
$
|
228.3
|
|
|
$
|
52.6
|
|
|
$
|
136.2
|
|
|
|
|
|
|
|
|
|
|
|
|
|
|
|
The following presents the aging of the Company’s past due
loans receivable as of June 30, 2011:
Age Analysis
of Past Due Loans Receivable
As of June 30, 2011
(in millions)
| |
|
|
|
|
|
|
|
|
|
|
|
|
|
|
|
|
|
|
|
|
|
|
|
|
|
|
|
|
|
|
|
|
|
|
|
|
|
|
|
|
|
|
|
|
|
|
|
|
|
|
|
|
|
|
|
|
Recorded
|
|
|
|
|
|
|
|
|
|
|
|
|
|
Greater Than
|
|
|
|
|
|
|
|
|
Total
|
|
|
Investment
|
|
|
|
|
1-30 days
|
|
|
30-59 days
|
|
|
60-89 days
|
|
|
90 days
|
|
|
Total
|
|
|
|
|
|
Financing
|
|
|
> 90 Days and
|
|
|
|
|
Past Due
|
|
|
Past Due
|
|
|
Past Due
|
|
|
Past Due
|
|
|
Past Due
|
|
|
Current
|
|
|
Receivables
|
|
|
Accruing
|
|
|
|
|
Consumer Loans
|
|
$
|
17.2
|
|
|
$
|
9.7
|
|
|
$
|
6.6
|
|
|
$
|
24.9
|
|
|
$
|
58.4
|
|
|
$
|
169.9
|
|
|
$
|
228.3
|
|
|
$
|
1.9
|
|
|
Pawn Loans
|
|
|
—
|
|
|
|
—
|
|
|
|
—
|
|
|
|
—
|
|
|
|
—
|
|
|
|
136.2
|
|
|
|
136.2
|
|
|
|
—
|
|
|
|
|
|
|
|
|
|
|
|
|
|
|
|
|
|
|
|
|
|
|
|
|
|
|
|
|
|
|
|
|
|
|
|
|
Total
|
|
$
|
17.2
|
|
|
$
|
9.7
|
|
|
$
|
6.6
|
|
|
$
|
24.9
|
|
|
$
|
58.4
|
|
|
$
|
306.1
|
|
|
$
|
364.5
|
|
|
$
|
1.9
|
|
|
|
|
|
|
|
|
|
|
|
|
|
|
|
|
|
|
|
|
|
|
|
|
|
|
|
|
|
|
|
|
|
|
|
85
DFC
GLOBAL CORP.
NOTES TO
CONSOLIDATED FINANCIAL
STATEMENTS — (Continued)
|
|
|
6.
|
Financing
Receivables (continued)
|
The following details the Company’s loans receivable that
are on nonaccrual status as of June 30, 2011:
Loans
Receivable on Nonaccrual Status
As of June 30, 2011
(in millions)
| |
|
|
|
|
|
Consumer Loans
|
|
$
|
51.5
|
|
|
Pawn Loans
|
|
|
—
|
|
|
|
|
|
|
|
|
Total
|
|
$
|
51.5
|
|
|
|
|
|
|
|
The following table presents changes in the allowance for
consumer loans credit losses (in millions):
| |
|
|
|
|
|
|
|
Year Ended
|
|
|
|
|
June 30, 2011
|
|
|
|
|
Allowance for Consumer Loan Losses:
|
|
|
|
|
|
Balance at beginning of period
|
|
$
|
32.2
|
|
|
Provision for loan losses
|
|
|
73.6
|
|
|
Charge-offs
|
|
|
(72.9
|
)
|
|
Recoveries
|
|
|
16.0
|
|
|
Effect of foreign currency translation
|
|
|
3.7
|
|
|
|
|
|
|
|
|
Balance at end of period
|
|
$
|
52.6
|
|
|
|
|
|
|
|
|
|
|
7.
|
Property
and Equipment and Supplementary Financial Information
|
Property and equipment at June 30, 2010 and 2011 consist of
(in millions):
| |
|
|
|
|
|
|
|
|
|
|
|
June 30,
|
|
|
|
|
2010
|
|
|
2011
|
|
|
|
|
Land
|
|
$
|
0.1
|
|
|
$
|
0.3
|
|
|
Leasehold improvements
|
|
|
70.4
|
|
|
|
93.1
|
|
|
Equipment and furniture
|
|
|
114.2
|
|
|
|
153.3
|
|
|
|
|
|
|
|
|
|
|
|
|
|
|
|
184.7
|
|
|
|
246.7
|
|
|
Less: accumulated depreciation
|
|
|
(117.2
|
)
|
|
|
(146.7
|
)
|
|
|
|
|
|
|
|
|
|
|
|
Property and equipment, net
|
|
$
|
67.5
|
|
|
$
|
100.0
|
|
|
|
|
|
|
|
|
|
|
|
Depreciation expense amounted to $16.9 million,
$18.4 million and $22.3 million for the years ended
June 30, 2009, 2010 and 2011, respectively.
Accrued expenses and other liabilities consist of the following
(in millions):
| |
|
|
|
|
|
|
|
|
|
|
|
June 30,
|
|
|
|
|
2010
|
|
|
2011
|
|
|
|
|
Accrued legal settlements(1)
|
|
$
|
40.2
|
|
|
$
|
15.2
|
|
|
Accrued payroll and incentives
|
|
|
25.9
|
|
|
|
35.0
|
|
|
Other accrued expenses and liabilities
|
|
|
26.5
|
|
|
|
48.2
|
|
|
|
|
|
|
|
|
|
|
|
|
Total accrued expenses and other liabilities
|
|
$
|
92.6
|
|
|
$
|
98.4
|
|
|
|
|
|
|
|
|
|
|
|
|
|
|
|
(1) |
|
Other long-term liabilities include an accrual for legal
settlements of $37.8 million and $33.4 million at
June 30, 2010 and 2011, respectively. |
86
DFC
GLOBAL CORP.
NOTES TO
CONSOLIDATED FINANCIAL
STATEMENTS — (Continued)
The following acquisitions have been accounted for under the
purchase method of accounting.
On October 3, 2009, the Company acquired all of the
outstanding shares of Merchant Cash Express Limited
(“MCE”), a U.K. entity which primarily provides
working capital to small retail businesses by providing cash
advances against a percentage of future credit card receipts.
The aggregate purchase price for the acquisition was
approximately $4.6 million. The Company used excess cash to
fund the acquisition. The Company allocated approximately
$2.6 million to net assets acquired. The excess purchase
price over the preliminary fair value of the identifiable assets
acquired was $2.0 million and was recorded as goodwill.
On December 23, 2009, the Company acquired Dealers’
Financial Services, LLC (“DFS”). DFS provides
fee-based services for military personal who obtain auto loans
in the United States made by a major third-party national bank.
The aggregate purchase price for the acquisition was
approximately $121.9 million, including approximately
$1.9 million in related transaction costs. Of the aggregate
purchase price, $5.7 million was allocated to net tangible
assets acquired, $28.7 million was allocated to
definite-lived intangible assets acquired and $35.4 million
was allocated to indefinite-lived intangible assets, with the
remainder of the purchase price allocated to goodwill. During
fiscal 2011, the Company has recorded a net decrease of
$1.4 million to goodwill that is primarily related to the
resolution of a working capital purchase price dispute with the
sellers. The Company anticipates that the entire amount of the
goodwill recorded in connection with the acquisition will be
deductible for income tax purposes.
On April 13, 2010, the Company acquired all of the
outstanding shares of Suttons & Robertsons
(“S&R”), which operated three high-end pawn shops
in the United Kingdom. The aggregate purchase price for the
acquisition was approximately $25.8 million. The Company
used excess cash to fund the acquisition. The Company allocated
approximately $5.9 million of the purchase price to net
assets acquired. The excess purchase price over the preliminary
fair value of the identifiable assets acquired was
$19.9 million and was recorded as goodwill.
During fiscal 2010, the Company completed various smaller
acquisitions in the United Kingdom that resulted in an aggregate
increase in goodwill of $0.7 million, calculated as the
excess purchase price over the preliminary fair value of the
identifiable assets acquired. Also in fiscal 2010,
$0.3 million and $2.2 million of purchase accounting
adjustments were made with respect to the Company’s Robert
Biggar Limited (“Biggar”) and Optima, S.A.
(“Optima”) acquisitions, respectively. Additionally in
fiscal 2010 and fiscal 2011, $6.3 million and
$13.5 million, respectively, of purchase accounting
adjustments related to contingent consideration payments were
made or accrued with respect to the Company’s Express
Finance Limited (“Express”) acquisition.
On December 31, 2010, the Company consummated the
acquisition of Sefina Finance AB (“Sefina”), a
Scandinavian pawn lending business with its headquarters in
Stockholm, Sweden. Sefina provides pawn loans primarily secured
by gold jewelry, diamonds and watches through 16 retail store
locations in Sweden and 12 retail store locations in
Finland. The total cash consideration for the acquisition is
estimated to be approximately $90.6 million, of which
approximately $59.1 million was cash paid at closing.
Approximately $14.9 million of additional cash, excluding
accrued interest, is payable to the seller in three equal
installments. The Company paid the first two installments on
March 31, 2011 and June 30, 2011 and the remaining
installment is due on September 30, 2011. Furthermore, the
Company is obligated to pay the seller additional contingent
consideration based on the financial performance of Sefina
during each of the two successive
87
DFC
GLOBAL CORP.
NOTES TO
CONSOLIDATED FINANCIAL
STATEMENTS — (Continued)
|
|
|
8.
|
Acquisitions (continued)
|
twelve month periods following the closing of the acquisition,
the aggregate amount of which the Company estimated at the time
of acquisition to be approximately $16.6 million. All
future payments have been recorded as liabilities on the balance
sheet of the acquiring U.K. entity. In connection with the
acquisition, the Company also incurred transaction costs of
approximately $1.0 million.
Under the purchase method of accounting, the total estimated
purchase price is allocated to Sefina’s net tangible and
intangible assets based on their current estimated fair values.
Management’s valuation of the fair value of tangible and
intangible assets acquired and liabilities assumed, is based on
estimates and assumptions subject to the finalization of the
Company’s fair value allocation. The purchase price,
subject to the finalization of the fair value allocation, is
allocated as follows (in millions):
| |
|
|
|
|
|
Cash
|
|
$
|
4.0
|
|
|
Pawn loans
|
|
|
71.5
|
|
|
Prepaid expenses and other current assets
|
|
|
3.5
|
|
|
Property and equipment
|
|
|
3.0
|
|
|
Other assets
|
|
|
0.1
|
|
|
Accounts payable
|
|
|
(0.4
|
)
|
|
Accrued expenses and other liabilities
|
|
|
(3.9
|
)
|
|
Debt
|
|
|
(61.8
|
)
|
|
Other non-current liabilities
|
|
|
(1.5
|
)
|
|
|
|
|
|
|
|
Net tangible assets acquired
|
|
|
14.5
|
|
|
Indefinite-lived intangible assets acquired
|
|
|
0.3
|
|
|
Goodwill
|
|
|
75.8
|
|
|
|
|
|
|
|
|
Total purchase price
|
|
$
|
90.6
|
|
|
|
|
|
|
|
Prior to the end of the measurement period for finalizing the
purchase price allocation, if information becomes available
which would indicate adjustments are required to the purchase
price allocation, such adjustments will be included in the
purchase price allocation retrospectively.
Of the total estimated purchase price for Sefina, an estimate of
$14.5 million has been allocated to net tangible assets
acquired and $0.3 million has been allocated to
indefinite-lived intangible assets acquired. The remaining
purchase price has been allocated to goodwill.
On April 1, 2011, the Company’s wholly owned U.K.
subsidiary, Dollar Financial U.K. Ltd., completed its
acquisition of Purpose U.K. Holdings Limited (“Purpose
U.K.”), a leading provider of online short-term loans in
the United Kingdom. Purpose U.K. Holdings Limited, which
operates primarily under the brand name “Payday U.K.”,
provides loans through both Internet and telephony-based
technologies throughout the United Kingdom. The total cash
consideration for the acquisition was approximately
$195.0 million. In connection with the acquisition, the
Company also incurred transaction costs of approximately
$3.7 million.
Under the purchase method of accounting, the total estimated
purchase price is allocated to Purpose U.K.’s net tangible
and intangible assets based on their current estimated fair
values. Management’s valuation of the fair value of
tangible and intangible assets acquired and liabilities assumed,
is based on estimates and
88
DFC
GLOBAL CORP.
NOTES TO
CONSOLIDATED FINANCIAL
STATEMENTS — (Continued)
|
|
|
8.
|
Acquisitions (continued)
|
assumptions subject to the finalization of the Company’s
fair value allocation. The purchase price, subject to the
finalization of the fair value allocation, is allocated as
follows (in millions):
| |
|
|
|
|
|
Cash
|
|
$
|
8.3
|
|
|
Consumer loans
|
|
|
33.3
|
|
|
Prepaid expenses and other current assets
|
|
|
0.7
|
|
|
Property and equipment
|
|
|
2.1
|
|
|
Accounts payable
|
|
|
(1.2
|
)
|
|
Accrued expenses and other liabilities
|
|
|
(2.5
|
)
|
|
Other non-current liabilities
|
|
|
(21.1
|
)
|
|
|
|
|
|
|
|
Net tangible assets acquired
|
|
|
19.6
|
|
|
Definite-lived intangible assets acquired
|
|
|
56.3
|
|
|
Indefinite-lived intangible assets acquired
|
|
|
3.3
|
|
|
Goodwill
|
|
|
115.8
|
|
|
|
|
|
|
|
|
Total purchase price
|
|
$
|
195.0
|
|
|
|
|
|
|
|
Prior to the end of the measurement period for finalizing the
purchase price allocation, if information becomes available
which would indicate adjustments are required to the purchase
price allocation, such adjustments will be included in the
purchase price allocation retrospectively.
Of the total estimated purchase price for Purpose U.K., an
estimate of $19.6 million has been allocated to net
tangible assets acquired, $56.3 million has been allocated
to definite-lived intangible assets and $3.3 million has
been allocated to indefinite-lived intangible assets acquired.
The remaining purchase price has been allocated to goodwill.
During fiscal 2011, the Company completed the acquisitions of
the assets of three Canadian franchisees with 40 stores for an
aggregate purchase price of $39.6 million that resulted in
an increase in goodwill of $29.0 million, calculated as the
excess purchase price over the preliminary fair value of the
identifiable assets acquired. The Company also purchased five
stores in the United Kingdom during the fiscal 2011 that
resulted in an aggregate increase in goodwill of
$0.5 million. Also during fiscal 2011, $13.5 million
of purchase accounting adjustments related to contingent
consideration payments were made with respect to the Express
Finance Limited acquisition. These payments are treated as
adjustments to purchase price and are accordingly recognized as
goodwill.
One of the core strategies of the Company is to capitalize on
its competitive strengths and enhance its leading marketing
positions. One of the key elements in the Company’s
strategy is the intention to grow its network through
acquisitions. The Company believes that acquisitions provide it
with increased market penetration or in some cases the
opportunity to enter new platforms and geographies. The purchase
price of each acquisition is primarily based on a multiple of
historical earnings. The Company’s standard business model,
and that of its industry, is one that does not rely heavily on
tangible assets and therefore, it is common to have majority of
the purchase price allocated to goodwill, or in some cases,
intangible assets.
89
DFC
GLOBAL CORP.
NOTES TO
CONSOLIDATED FINANCIAL
STATEMENTS — (Continued)
|
|
|
8.
|
Acquisitions (continued)
|
The following reflects the change in goodwill during the periods
presented (in millions):
| |
|
|
|
|
|
Balance at June 30, 2010
|
|
$
|
496.8
|
|
|
Acquisitions:
|
|
|
|
|
|
Sefina Finance AB
|
|
|
75.8
|
|
|
Purpose U.K.
|
|
|
115.8
|
|
|
Canadian franchisee acquisitions
|
|
|
29.0
|
|
|
Various small acquisitions
|
|
|
0.5
|
|
|
Purchase accounting adjustments:
|
|
|
|
|
|
Dealers’ Financial Services, LLC
|
|
|
(1.4
|
)
|
|
Express Finance Limited
|
|
|
13.5
|
|
|
Foreign currency translation adjustment
|
|
|
28.5
|
|
|
|
|
|
|
|
|
Balance at June 30, 2011
|
|
$
|
758.5
|
|
|
|
|
|
|
|
Pro forma
Information
The following pro forma information for the periods ended
June 30, 2010 and 2011 presents the results of operations
as if the acquisitions had occurred on July 1, 2009. The
pro forma operating results include the results of these
acquisitions for the indicated periods and reflect the increased
interest expense on acquisition debt and the income tax impact
as of the respective purchase dates of the MCE, DFS, S&R,
Sefina and Purpose U.K. Holdings Limited acquisitions. Pro forma
results of operations are not necessarily indicative of the
results of operations that would have occurred had the purchase
been made on the date above or the results which may occur in
the future.
| |
|
|
|
|
|
|
|
|
|
|
|
Fiscal Year Ended
|
|
|
|
|
June 30,
|
|
|
|
|
2010
|
|
|
2011
|
|
|
|
|
(Unaudited — in
|
|
|
|
|
thousands except per
|
|
|
|
|
share amounts)
|
|
|
|
|
Revenues
|
|
$
|
758.1
|
|
|
$
|
886.9
|
|
|
Net income
|
|
$
|
14.6
|
|
|
$
|
87.5
|
|
|
Net income per common share — basic
|
|
$
|
0.40
|
|
|
$
|
2.30
|
|
|
Net income per common share — diluted
|
|
$
|
0.39
|
|
|
$
|
2.20
|
|
On August 25, 2010, the Company entered into a share
purchase agreement (the “Folkia Agreement”) to acquire
all of the capital stock of Folkia AS (“Folkia”), with
the closing contingent on customary closing conditions. On
December 31, 2010, the Company announced that it had
informed the sellers’ representative that the conditions
precedent to closing under the Folkia Agreement had not been
satisfied. Subsequent thereto, each party asserted material
breach of the Folkia Agreement by the other party. There has
been no communication with the sellers since March 24,
2011, and the Company believes that the Folkia Agreement is
terminated and that the likelihood of further communication in
respect of the proposed deal is remote.
90
DFC
GLOBAL CORP.
NOTES TO
CONSOLIDATED FINANCIAL
STATEMENTS — (Continued)
|
|
|
9.
|
Goodwill
and Other Intangibles
|
The changes in the carrying amount of goodwill by reportable
segment for the fiscal years ended June 30, 2010 and
June 30, 2011 are as follows (in millions):
| |
|
|
|
|
|
|
|
|
|
|
|
|
|
|
|
|
|
|
|
|
|
|
|
United States
|
|
|
|
|
|
|
|
|
|
|
|
|
|
|
|
|
Retail
|
|
|
Canada
|
|
|
Europe
|
|
|
Other
|
|
|
Total
|
|
|
|
|
Balance at June 30, 2009
|
|
$
|
205.7
|
|
|
$
|
124.4
|
|
|
$
|
76.4
|
|
|
$
|
—
|
|
|
$
|
406.5
|
|
|
Acquisitions
|
|
|
—
|
|
|
|
—
|
|
|
|
31.5
|
|
|
|
53.5
|
|
|
|
85.0
|
|
|
Foreign currency translation adjustments
|
|
|
—
|
|
|
|
12.0
|
|
|
|
(6.7
|
)
|
|
|
—
|
|
|
|
5.3
|
|
|
|
|
|
|
|
|
|
|
|
|
|
|
|
|
|
|
|
|
|
|
|
|
Balance at June 30, 2010
|
|
$
|
205.7
|
|
|
$
|
136.4
|
|
|
$
|
101.2
|
|
|
$
|
53.5
|
|
|
$
|
496.8
|
|
|
Acquisitions and purchase accounting adjustments
|
|
|
—
|
|
|
|
29.0
|
|
|
|
205.6
|
|
|
|
(1.4
|
)
|
|
|
233.2
|
|
|
Foreign currency translation adjustments
|
|
|
—
|
|
|
|
14.5
|
|
|
|
14.0
|
|
|
|
—
|
|
|
|
28.5
|
|
|
|
|
|
|
|
|
|
|
|
|
|
|
|
|
|
|
|
|
|
|
|
|
Balance at June 30, 2011
|
|
$
|
205.7
|
|
|
$
|
179.9
|
|
|
$
|
320.8
|
|
|
$
|
52.1
|
|
|
$
|
758.5
|
|
|
|
|
|
|
|
|
|
|
|
|
|
|
|
|
|
|
|
|
|
|
|
The following table reflects the components of intangible assets
(in millions):
| |
|
|
|
|
|
|
|
|
|
|
|
Gross Carrying Amount
|
|
|
|
|
June 30,
|
|
|
June 30,
|
|
|
|
|
2010
|
|
|
2011
|
|
|
|
|
Non-amortizing
intangible assets:
|
|
|
|
|
|
|
|
|
|
Goodwill
|
|
$
|
496.8
|
|
|
$
|
758.5
|
|
|
Reacquired franchise rights
|
|
|
51.3
|
|
|
|
56.4
|
|
|
DFS MILES Program
|
|
|
35.4
|
|
|
|
35.4
|
|
|
Tradenames
|
|
|
—
|
|
|
|
3.6
|
|
|
|
|
|
|
|
|
|
|
|
|
|
|
$
|
583.5
|
|
|
$
|
853.9
|
|
|
|
|
|
|
|
|
|
|
|
|
Amortizable intangible assets:
|
|
|
|
|
|
|
|
|
|
Various contracts
|
|
$
|
28.7
|
|
|
$
|
85.1
|
|
|
Reacquired franchise rights
|
|
|
—
|
|
|
|
5.2
|
|
|
Accumulated amortization:
|
|
|
|
|
|
|
|
|
|
Various contracts
|
|
|
(3.2
|
)
|
|
|
(11.8
|
)
|
|
Reacquired franchise rights
|
|
|
—
|
|
|
|
(0.4
|
)
|
|
|
|
|
|
|
|
|
|
|
|
Total intangible assets
|
|
$
|
609.0
|
|
|
$
|
932.0
|
|
|
|
|
|
|
|
|
|
|
|
Goodwill is the excess of cost over the fair value of the net
assets of the business acquired.
Goodwill is evaluated for impairment on an annual basis on June
30 or between annual tests if events occur or circumstances
change that would more likely than not reduce the fair value of
a reporting unit below its carrying amount. As of June 30,
2011, there was no impairment of goodwill.
Other indefinite-lived intangible assets consist of reacquired
franchise rights, DFS’ MILES program brand name and the
Sefina and Purpose U.K. trade names, which are deemed to have an
indefinite useful life and are not amortized.
Non-amortizable
intangibles with indefinite lives are tested for impairment
annually as of December 31, or whenever events or changes
in business circumstances indicate that an asset may be
impaired. If the estimated fair value is less than the carrying
amount of the intangible assets with indefinite lives, then an
impairment charge would be recognized to reduce the asset to its
estimated fair value. The increase in indefinite-lived
reacquired franchise rights is due to changes in foreign
exchange rates from June 30, 2010 to June 30, 2011. As
prescribed under ASC 805, beginning with franchisee
acquisitions
91
DFC
GLOBAL CORP.
NOTES TO
CONSOLIDATED FINANCIAL
STATEMENTS — (Continued)
|
|
|
9.
|
Goodwill
and Other Intangibles (continued)
|
consummated in fiscal 2010 or later, reacquired franchise rights
are no longer considered indefinite-lived; rather they are
amortized over the remaining contractual life of the franchise
agreement.
The fair value of the Company’s goodwill and
indefinite-lived intangible assets are estimated based upon a
present value technique using discounted future cash flows or a
market-based
approach, or a combination thereof. The Company uses management
business plans and projections as the basis for expected future
cash flows. Assumptions in estimating future cash flows are
subject to a high degree of judgment. The Company makes every
effort to forecast its future cash flows as accurately as
possible at the time the forecast is developed. However, changes
in assumptions and estimates may affect the implied fair value
of goodwill and indefinite-lived intangible assets and could
result in an additional impairment charge in future periods.
Amortization expense of intangible assets was $0,
$3.2 million and $9.0 million for the years ended
June 30, 2009, 2010 and 2011, respectively.
Estimated amortization expense of intangible assets during the
next five fiscal years is shown below (in millions):
| |
|
|
|
|
|
Fiscal Year Ended June 30,
|
|
Amount
|
|
|
|
|
2012
|
|
$
|
17.3
|
|
|
2013
|
|
|
16.2
|
|
|
2014
|
|
|
13.9
|
|
|
2015
|
|
|
11.0
|
|
|
2016
|
|
|
7.9
|
|
|
|
|
|
|
|
|
|
|
$
|
66.3
|
|
|
|
|
|
|
|
The Company had debt obligations at June 30, 2010 and
June 30, 2011 as follows (in millions):
| |
|
|
|
|
|
|
|
|
|
|
|
June 30,
|
|
|
June 30,
|
|
|
|
|
2010
|
|
|
2011
|
|
|
|
|
Revolving credit facility
|
|
$
|
—
|
|
|
$
|
65.9
|
|
|
National Money Mart Company 10.375% Senior Notes due
December 15, 2016
|
|
|
600.0
|
|
|
|
600.0
|
|
|
Issuance discount on 10.375% Senior Notes due 2016
|
|
|
(3.3
|
)
|
|
|
(3.0
|
)
|
|
DFC Global Corp. 2.875% Senior Convertible Notes due 2027
|
|
|
38.3
|
|
|
|
40.7
|
|
|
DFC Global Corp. 3.000% Senior Convertible Notes due 2028
|
|
|
84.9
|
|
|
|
90.9
|
|
|
Scandinavian credit facilities
|
|
|
—
|
|
|
|
67.6
|
|
|
Other
|
|
|
8.7
|
|
|
|
8.8
|
|
|
|
|
|
|
|
|
|
|
|
|
Total debt
|
|
|
728.6
|
|
|
|
870.9
|
|
|
|
|
|
|
|
|
|
|
|
|
Less: current portion of debt
|
|
|
(3.3
|
)
|
|
|
(95.7
|
)
|
|
|
|
|
|
|
|
|
|
|
|
Long-term debt
|
|
$
|
725.3
|
|
|
$
|
775.2
|
|
|
|
|
|
|
|
|
|
|
|
Senior
Notes
On December 23, 2009, the Company’s wholly owned
indirect Canadian subsidiary, National Money Mart Company
(“NMM”), issued $600.0 million aggregate
principal amount of its 10.375% Senior Notes due
December 15, 2016 (the “2016 Notes”). The 2016
Notes were issued pursuant to an indenture, dated as of
December 23, 2009, among NMM, as issuer, and Dollar
Financial Corp. and certain of its direct and indirect
92
DFC
GLOBAL CORP.
NOTES TO
CONSOLIDATED FINANCIAL
STATEMENTS — (Continued)
wholly owned U.S. and Canadian subsidiaries, as guarantors,
and U.S. Bank National Association, as trustee. The 2016
Notes bear interest at the rate of 10.375% per year, payable on
June 15 and December 15 of each year, commencing on
June 15, 2010. The 2016 Notes will mature on
December 15, 2016. Upon the occurrence of certain change of
control transactions, NMM will be required to make an offer to
repurchase the 2016 Notes at 101% of the principal amount
thereof, plus any accrued and unpaid interest to the repurchase
date, unless certain conditions are met. At any time prior to
December 15, 2012, NMM may redeem up to 35% of the
aggregate principal amount of the 2016 Notes at a redemption
price of 110.375% of the principal amount of the 2016 Notes
redeemed if; (1) such redemption is made with the proceeds
of one or more public equity offerings by DFC; (2) at least
$390 million in aggregate principal amount of the 2016
Notes remain outstanding immediately after the occurrence of
such redemption; and (3) the redemption occurs within
90 days of such public equity offering by DFC. On or after
December 15, 2013, NMM will have the right to redeem the
2016 Notes, in whole at any time or in part from time to time,
(i) at a redemption price of 105.188% of the principal
amount thereof if the redemption occurs prior to
December 15, 2014, (ii) at a redemption price of
102.594% of the principal amount thereof if the redemption
occurs before December 15, 2015, and (iii) at a
redemption price of 100% of the principal amount thereof if the
redemption occurs after December 15, 2015.
Convertible
Notes
Senior
Convertible Notes due 2027
On June 27, 2007, DFC issued $200.0 million aggregate
principal amount of its 2.875% Senior Convertible Notes due
2027 (the “2027 Notes”). The 2027 Notes were issued
under an indenture between DFC and U.S. Bank National
Association, as trustee, dated as of June 27, 2007 (the
“2027 Indenture”).
In February 2010, DFC repurchased $35.2 million aggregate
principal amount of the 2027 Notes in privately negotiated
transactions with three of the holders of the 2027 Notes. The
purchase price paid by DFC in the transactions was 91% of the
stated principal amount of the repurchased 2027 Notes, for an
aggregate price of $32.0 million. As a result of these
repurchase transactions and the privately negotiated exchange
transactions described below that were completed in December
2009, $44.8 million aggregate principal amount of 2027
Notes remains outstanding as of June 30, 2010 and
June 30, 2011. The Company recognized a net loss of
$0.7 million during fiscal 2010 related to the repurchased
Notes.
The 2027 Notes are general unsecured obligations of DFC and rank
equally in right of payment with all of its other existing and
future obligations that are unsecured and unsubordinated. The
2027 Notes bear interest at the rate of 2.875% per year, payable
in cash in arrears on June 30 and December 31 of each year
beginning on December 31, 2007. The 2027 Notes mature on
June 30, 2027, unless earlier converted, redeemed or
repurchased by the Company. Holders of the 2027 Notes may
require DFC to repurchase in cash some or all of the 2027 Notes
at any time before the 2027 Notes’ maturity following a
“fundamental change” (as defined in the 2027
Indenture).
The 2027 Indenture includes a “net share settlement”
provision that allows DFC, upon redemption or conversion, to
settle the principal amount of the 2027 Notes in cash and the
additional conversion value, if any, in shares of DFC’s
common stock. Holders of the 2027 Notes may convert their 2027
Notes based at an initial conversion rate of 38.6641 shares
per $1,000 principal amount of 2027 Notes, subject to
adjustment, prior to stated maturity under the following
circumstances:
|
|
|
| |
•
|
during any calendar quarter commencing after September 30,
2007, if the closing sale price of DFC’s common stock is
greater than or equal to 130% of the applicable conversion price
for at least 20 trading days in the period of 30 consecutive
trading days ending on the last day of the preceding calendar
quarter;
|
93
DFC
GLOBAL CORP.
NOTES TO
CONSOLIDATED FINANCIAL
STATEMENTS — (Continued)
|
|
|
| |
•
|
during the five day period following any five consecutive
trading day period in which the trading price of the 2027 Notes
for each day of such period was less than 98.0% of the product
of the closing sale price per share of DFC’s common stock
on such day and the conversion rate in effect for the 2027 Notes
on each such day;
|
| |
| |
•
|
if the 2027 Notes are called for redemption; or
|
| |
| |
•
|
upon the occurrence of specified corporate transactions as
described in the 2027 Indenture.
|
If a “fundamental change” (as defined in the 2027
Indenture) occurs prior to December 31, 2014 and a holder
elects to convert its 2027 Notes in connection with such
transaction, DFC will pay a make-whole provision, as defined in
the 2027 Indenture.
On or after December 31, 2012, but prior to
December 31, 2014, DFC may redeem for cash all or part of
the 2027 Notes, if during any period of 30 consecutive trading
days ending not later than December 31, 2014, the closing
sale price of a share of DFC’s common stock is for at least
120 trading days within such period of 30 consecutive trading
days greater than or equal to 120% of the conversion price on
each such day. On or after December 31, 2014, DFC may
redeem for cash all or part of the 2027 Notes upon at least 30
but not more than 60 days notice before the redemption date
by mail to the trustee, the paying agent and each holder of 2027
Notes. The amount of cash paid in connection with each such
redemption will be 100% of the principal amount of the 2027
Notes to be redeemed, plus accrued and unpaid interest,
including any additional amounts, up to but excluding the
redemption date.
Holders have the right to require DFC to purchase all or a
portion of the 2027 Notes on each of December 31, 2012,
December 31, 2014, June 30, 2017 and June 30,
2022 for a purchase price payable in cash equal to 100% of the
principal amount of the 2027 Notes purchased plus any accrued
and unpaid interest, up to but excluding the purchase date.
If a “fundamental change” (as defined in the 2027
Indenture) occurs before maturity of the 2027 Notes, holders
will have the right, subject to certain conditions, to require
DFC to repurchase for cash all or a portion of the 2027 Notes at
a repurchase price equal to 100% of the principal amount of the
2027 Notes being repurchased, plus accrued and unpaid interest,
including any additional amounts, up to but excluding the date
of repurchase.
Senior
Convertible Notes due 2028
In December 2009, DFC entered into privately negotiated exchange
agreements with certain holders of its 2027 Notes, pursuant to
which such holders exchanged an aggregate of $120.0 million
aggregate principal amount of the 2027 Notes for an equal
aggregate principal amount of 3.0% Senior Convertible Notes
due 2028 issued by DFC (the “2028 Notes”).
The 2028 Notes are general unsecured obligations of DFC and rank
equally in right of payment with all of DFC’s other
existing and future obligations that are unsecured and
unsubordinated. The 2028 Notes accrue interest at a rate of
3.00% per annum, payable in cash in arrears on April 1 and
October 1 of each year beginning on April 1, 2010. The
maturity date of the new 2028 Notes is April 1, 2028. The
2028 Notes were issued under an indenture between DFC and
U.S. Bank National Association, as trustee, dated as of
December 21, 2009 (the “2028 Indenture”).
The 2028 Indenture includes a “net share settlement”
provision that allows DFC, upon redemption or conversion, to
settle the principal amount of the 2028 Notes in cash and the
additional conversion value, if any, in shares of DFC’s
common stock. Holders of the 2028 Notes may convert their 2028
Notes based at an
94
DFC
GLOBAL CORP.
NOTES TO
CONSOLIDATED FINANCIAL
STATEMENTS — (Continued)
initial conversion rate of 51.8032 shares per $1,000
principal amount of 2028 Notes, subject to adjustment, prior to
stated maturity under the following circumstances:
|
|
|
| |
•
|
during any calendar quarter commencing after December 31,
2009, if the closing sale price of DFC’s common stock is
greater than or equal to 130% of the applicable conversion price
for at least 20 trading days in the period of 30 consecutive
trading days ending on the last day of the preceding calendar
quarter;
|
| |
| |
•
|
during the five day period following any five consecutive
trading day period in which the trading price of the 2028 Notes
for each day of such period was less than 98.0% of the product
of the closing sale price per share of DFC’s common stock
on such day and the conversion rate in effect for the 2028 Notes
on each such day;
|
| |
| |
•
|
if the 2028 Notes are called for redemption; and at any time on
or after December 31, 2026; or
|
| |
| |
•
|
upon the occurrence of specified corporate transactions as
described in the 2028 Indenture.
|
If a “fundamental change” (as defined in the 2028
Indenture) occurs prior to December 31, 2014 and a holder
elects to convert its 2028 Notes in connection with such
transaction, DFC will pay a make-whole provision, as defined in
the 2028 Indenture.
On or after April 5, 2015, DFC may redeem for cash all or
part of the 2028 Notes upon at least 30 but not more than
60 days notice before the redemption date by mail to the
trustee, the paying agent and each holder of 2028 Notes. The
amount of cash paid in connection with each such redemption will
be 100% of the principal amount of the 2028 Notes to be
redeemed, plus accrued and unpaid interest, including any
additional amounts, up to but excluding the redemption date.
Holders of the 2028 Notes have the right to require DFC to
purchase all or a portion of the 2028 Notes on each of
April 1, 2015, April 1, 2018 and April 1, 2023
for a purchase price payable in cash equal to 100% of the
principal amount of the 2028 Notes to be purchased plus any
accrued and unpaid interest, up to but excluding the date of
purchase.
If a “fundamental change” (as defined in the 2028
Indenture) occurs before the maturity of the 2028 Notes, the
holders will have the right, subject to certain conditions, to
require DFC to repurchase for cash all or a portion of their
2028 Notes at a repurchase price equal to 100% of the principal
amount of the 2028 Notes being repurchased, plus accrued and
unpaid interest, up to but excluding the date of repurchase.
Treatment
of Convertible Notes
The Company follows the guidance issued in
ASC 470-20,
which clarifies the accounting for convertible debt instruments
that may be settled in cash (including partial cash settlement)
upon conversion. This accounting standard requires issuers of
convertible debt that can be settled in cash to separately
account for (i.e., bifurcate) a portion of the debt associated
with the conversion feature and reclassify this portion to
stockholders’ equity. The liability portion, which
represents the fair value of the debt without the conversion
feature, is accreted to its face value using the effective
interest method by amortizing the discount between the face
amount and the fair value. The amortization is recorded as
non-cash interest expense.
ASC 470-20
is effective for financial statements issued for fiscal years
beginning after December 15, 2008, and interim periods
within those fiscal years, and must be applied retrospectively
to all periods presented. We adopted
ASC 470-20
as of July 1, 2009 and have applied it to our 2027 Notes
for fiscal years 2009, 2008 and 2007, as required. The 2028
Notes issued during fiscal year 2010 are also subject to the
application of the accounting standard. The Company is required
to record the liability portion of the 2027 Notes and the 2028
Notes (collectively, the “Convertible Notes”) at their
fair value as of the date of issuance and amortize the discount
95
DFC
GLOBAL CORP.
NOTES TO
CONSOLIDATED FINANCIAL
STATEMENTS — (Continued)
into interest expense over the life of the Convertible Notes
during the periods in which the Notes are outstanding. As of
June 30, 2011, the remaining discount of $4.1 million
on the 2027 Notes will be amortized using the effective interest
method through December 31, 2012, and the remaining
discount of $29.1 million on the 2028 Notes similarly will
be amortized through April 1, 2015. There is no effect,
however, on the Company’s cash interest payments.
The Company has considered the guidance in the Debt topic
of the FASB Codification, and has determined that the
Convertible Notes do not contain a beneficial conversion
feature, as the fair value of DFC’s common stock on the
date of issuance was less than the initial conversion price.
Upon conversion, DFC will have the option to either deliver:
|
|
|
| |
1.
|
cash equal to the lesser of the aggregate principal amount of
the Convertible Notes to be converted ($1,000 per note) or the
total conversion value; and shares of DFC’s common stock in
respect of the remainder, if any, of the conversion value over
the principal amount of the Convertible Notes; or
|
| |
| |
2.
|
shares of DFC’s common stock to the holders, calculated at
the initial conversion price which is subject to any of the
conversion price adjustments discussed above.
|
The Company has made a policy election to settle the principal
amount of the Convertible Notes in cash. As such, in accordance
with the Earnings Per Share topic of the FASB
Codification, the Convertible Notes will be excluded from the
Company’s calculation of diluted earnings per share.
Credit
Facility
Global
Revolving Credit Facility
On March 3, 2011, the Company replaced its existing credit
facility with a new senior secured credit facility with a
syndicate of lenders, the administrative agent for which is
Wells Fargo Bank, National Association. The new facility
consists of a $200.0 million global revolving credit
facility (the “Global Revolving Credit Facility”),
with the potential to further increase the Company’s
available borrowings under the facility to $250.0 million.
Availability under the Global Revolving Credit Facility is based
on a borrowing base comprised of cash and consumer receivables
in the Company’s U.S. and Canadian operations, and its
U.K.-based retail and Express Finance operations, and its
U.K.-based pawn loan receivables. There is a sublimit for
borrowings in the United States based on the lesser of the
U.S. borrowing base under the Global Revolving Credit
Facility or $75 million.
Borrowings under the Global Revolving Credit Facility may be
denominated in United States Dollars, British Pounds Sterling,
Euros or Canadian Dollars, as well as any other currency as may
be approved by the lenders. Interest on borrowings under the
Global Revolving Credit Facility is derived from a pricing grid
based on the Company’s consolidated leverage ratio, which
currently allows borrowing at an interest rate equal to the
applicable London Inter-Bank Offered Rate (LIBOR) or Canadian
Dollar Offer Rate (based on the currency of borrowing) plus
400 basis points, or in the case of borrowings in
U.S. Dollars only, at an alternate base rate which is the
greater of the prime rate or the federal funds rate plus
1/2
of 1%, plus 300 basis points. The Global Revolving Credit
Facility will mature on March 1, 2015.
The Global Revolving Credit Facility allows for borrowings by
DFG, NMM, Dollar Financial U.K. Limited, an indirect U.K.
subsidiary of DFC, and Instant Cash Loans Limited, a direct U.K.
subsidiary of Dollar Financial U.K. Limited. Borrowings by DFG
under the Global Revolving Credit Facility are guaranteed by DFC
and certain direct and indirect domestic U.S. subsidiaries
of DFC. Borrowings by
non-U.S. borrowers
under the Global Revolving Credit Facility are guaranteed by DFC
and DFG and substantially all of their domestic
U.S. subsidiaries, by NMM and substantially all of the
Company’s other direct and indirect Canadian
96
DFC
GLOBAL CORP.
NOTES TO
CONSOLIDATED FINANCIAL
STATEMENTS — (Continued)
subsidiaries, and by Dollar Financial U.K. Limited and Instant
Cash Loans Limited and substantially all of the U.K.
subsidiaries of Instant Cash Loans Limited. The obligations of
the respective borrowers and guarantors under the Global
Revolving Credit Facility are secured by substantially all the
assets of such borrowers and guarantors.
As of June 30, 2011, there was $65.9 million
outstanding under the Global Revolving Credit Facility.
Prior
Credit Facility
On October 30, 2006, the Company entered into a
$475.0 million credit facility (“2006 Credit
Agreement”). The 2006 Credit Agreement consisted of the
following: (i) a senior secured revolving credit facility
in an aggregate amount of $75.0 million (the
“U.S. Revolving Facility”) with DFG as the
borrower; (ii) a senior secured term loan facility with an
aggregate amount of $295.0 million (the “Canadian Term
Facility”) with NMM as the borrower; (iii) a senior
secured term loan facility with Dollar Financial U.K. Limited as
the borrower, in an aggregate amount of $80.0 million
(consisting of a $40.0 million tranche of term loans and
another tranche of term loans equivalent to $40.0 million
denominated in Euros) (the “U.K. Term Facility”); and
(iv) a senior secured revolving credit facility in an
aggregate amount of CAD 28.5 million (the “Canadian
Revolving Facility”) with NMM as the borrower.
On December 23, 2009, the Company and its lenders amended
and restated the terms of the 2006 Credit Agreement (the
“Amended and Restated Credit Agreement”). Pursuant to
the Amended and Restated Credit Agreement, lenders representing
approximately 90% of the revolving credit facilities and
approximately 91% of the term loans agreed to the extension of
the maturity of the revolving credit facilities and term loans
to December 2014 (subject to the condition, which was satisfied
in February 2010, that prior to October 30, 2012, the
aggregate principal amount of the 2027 Notes be reduced to an
amount less than or equal to $50 million).
Outstanding amounts under the Amended and Restated Credit
Agreement that were owed to lenders which consented to the
extended maturity date received an annual interest spread of
500 basis points with a minimum 2.0% LIBOR (or LIBOR
equivalent) floor and, in the case of the revolving loans, based
on a leverage based pricing grid. Lenders under the 2006 Credit
Agreement that did not consent to the extended maturity in 2009
received an annual interest spread of 375 basis points with
a minimum 2.0% LIBOR (or LIBOR equivalent) floor and, in the
case of the revolving loans, based on a leverage based pricing
grid.
Prior to the Amended and Restated Credit Agreement, the
U.S. Revolving Facility and the Canadian Revolving Facility
had an interest rate of LIBOR plus 300 basis points and
CDOR plus 300 basis points, respectively, subject to
reduction as the Company reduced its leverage. The Canadian Term
Facility consisted of $295.0 million at an interest rate of
LIBOR plus 275 basis points. Under the 2006 Credit
Agreement, the U.K. Term Facility consisted of a
$40.0 million tranche at an interest rate of LIBOR plus
300 basis points and a tranche denominated in Euros
equivalent to $40.0 million at an interest rate of Euribor
plus 300 basis points.
The Company used approximately $350.0 million of the net
proceeds from its December 2009 offering of $600.0 million
aggregate principal amount of the 2016 Notes to repay
substantially all of its outstanding obligations under the
Canadian Term Facility and the U.K. Term Facility. On
June 23, 2010, the Company used excess cash to repay the
remaining balance of approximately $18.3 million of the
Canadian Term Facility and the U.K. Term Facility. The Company
repaid the outstanding balances under the Amended and Restated
Credit Agreement immediately prior to its termination on
March 3, 2011 in connection with the execution of the
Company’s new senior secured credit facility relating to
the Global Revolving Credit Facility.
97
DFC
GLOBAL CORP.
NOTES TO
CONSOLIDATED FINANCIAL
STATEMENTS — (Continued)
Scandinavian
Credit Facilities
As a result of the December 2010 acquisition of Sefina, the
Company assumed borrowings under Sefina’s existing credit
facilities. The loans are secured primarily by the value of
Sefina’s pawn pledge stock. The borrowings consist of a
working capital facility consisting of two loans of SEK
185 million and SEK 55 million ($38.1 million at
June 30, 2011). These loans are due July 2013 and December
2015, respectively, at an interest rate of the lender’s
borrowing rate plus 160 basis points (4.23% at
June 30, 2011). Also with the same Scandinavian bank, the
Company assumed an overdraft facility due December 31, 2011
with a commitment of up to SEK 85 million. As of
June 30, 2011, SEK 34.0 million ($5.4 million)
was outstanding at the lender’s borrowing rate plus
170 basis points (4.33% at June 30, 2011). The Company
also assumed a Euro overdraft facility with another Scandinavian
bank maturing in April 2012 with a commitment of up to
EUR 17.5 million, of which EUR 16.6 million
($24.1 million) was outstanding as of June 30, 2011 at
a rate of Euribor plus 250 basis points (3.29% at
June 30, 2011).
Other
Debt
Other debt consists of $8.8 million of debt assumed as part
of the S&R acquisition, consisting of a $0.2 million
overdraft facility, a $3.0 million revolving loan and a
$5.6 million term loan.
Interest expense, net was $43.7 million,
$68.9 million, and $90.8 million for the three years
ended June 30, 2009, 2010 and 2011, respectively. Included
in interest expense for the year ended June 30, 2011 is
approximately $19.0 million of non-cash interest expense
related to the amortization of accumulated charges related to
the discontinuance of hedge accounting for our cross currency
interest rate swaps, the non-cash interest expense associated
with our Convertible Notes and the amortization of various
deferred issuance costs. This non-cash interest expense was
approximately $16.4 million and $11.8 million for the
years ended June 30, 2010 and 2009, respectively.
|
|
|
11.
|
Fair
Value Measurements
|
The Fair Value Measurements and Disclosures Topic of the FASB
Codification establishes a fair value hierarchy that
distinguishes between observable and unobservable market
participant assumptions. Level 1 inputs utilize quoted
prices (unadjusted) in active markets for identical assets or
liabilities that the Company has the ability to access.
Level 2 inputs include quoted prices for similar assets and
liabilities in active markets and inputs other than quoted
prices that are observable for the asset or liability.
Level 3 inputs are unobservable inputs for the asset or
liability and include situations where there is little, if any,
market activity for the asset or liability. In certain cases,
the inputs used to measure fair value may fall into different
levels of the fair value hierarchy. In such cases, the level in
the fair value hierarchy is based on the lowest level input that
is significant to the fair value measurement in its entirety.
The Company’s assessment of the significance of a
particular input to the fair value in its entirety requires
judgment and considers factors specific to the asset or
liability.
Currently, the Company uses foreign currency options and cross
currency interest rate swaps to manage its interest rate and
foreign currency risk and a gold collar to manage its exposure
to variability in gold prices. The valuation of these
instruments is determined using widely accepted valuation
techniques including discounted cash flow analysis on the
expected cash flows of each derivative. This analysis reflects
the contractual terms of the derivatives, including the period
to maturity and uses observable market-based inputs, including
interest rate curves, foreign exchange rates, gold forward
curves and implied volatilities. The Company incorporates credit
valuation adjustments to appropriately reflect both its own
nonperformance risk and the respective counterparty’s
nonperformance risk in the fair value measurements. In adjusting
the fair value of its derivative contracts for the effect of
nonperformance risk, the Company has considered the impact
98
DFC
GLOBAL CORP.
NOTES TO
CONSOLIDATED FINANCIAL
STATEMENTS — (Continued)
|
|
|
11.
|
Fair
Value Measurements (continued)
|
of netting and any applicable credit enhancements, such as
collateral postings, thresholds, mutual puts, and guarantees.
Although the Company has determined that the majority of the
inputs used to value its derivatives fall within Level 2 of
the fair value hierarchy, the credit valuation adjustments
associated with its derivatives utilize Level 3 inputs,
such as estimates of current credit spreads to evaluate the
likelihood of default by itself and its counterparties. However,
as of June 30, 2011, the Company has assessed the
significance of the impact of the credit valuation adjustments
on the overall valuation of its derivative positions and has
determined that the credit valuation adjustments are not
significant to the overall valuation of its derivatives. As a
result, the Company has determined that its derivative
valuations in their entirety are classified in Level 2 of
the fair value hierarchy.
During fiscal 2011, the Company recorded a liability for
contingent consideration of $16.6 million arising from the
acquisition of Sefina which is payable over two years. The fair
value of the contingent consideration was determined at the
acquisition date using a probability weighted income approach
based on the net present value of estimated payments and is
re-measured in each reporting period. The contingent
consideration was classified within Level 3 as management
assumptions for the valuation included discount rates and
estimated probabilities of achievement of pre-tax income levels
which are unobservable in the market. Changes in fair value of
the contingent consideration due to time value are recorded in
other income, net. As of June 30, 2011, the balance of the
contingent consideration was $17.8 million and the
assumptions for the valuation did not materially change.
The table below presents the Company’s assets and
liabilities measured at fair value on a recurring basis as of
June 30, 2011, aggregated by the level in the fair value
hierarchy within which those measurements fall.
Assets
and Liabilities Measured at Fair Value on a Recurring Basis at
June 30, 2011
(in millions)
| |
|
|
|
|
|
|
|
|
|
|
|
|
|
|
|
|
|
|
|
Quoted Prices in
|
|
|
|
|
|
|
|
|
|
Active Markets
|
|
Significant
|
|
|
|
|
|
|
|
for Identical Assets
|
|
Other
|
|
Significant
|
|
Balance at
|
|
|
|
and Liabilities
|
|
Observable
|
|
Unobservable
|
|
June 30,
|
|
|
|
(Level 1)
|
|
Inputs (Level 2)
|
|
Inputs (Level 3)
|
|
2011
|
|
|
|
Assets
|
|
|
|
|
|
|
|
|
|
|
|
|
|
|
|
|
|
Derivative financial instruments
|
|
$
|
—
|
|
|
$
|
—
|
|
|
$
|
—
|
|
|
$
|
—
|
|
|
Liabilities
|
|
|
|
|
|
|
|
|
|
|
|
|
|
|
|
|
|
Derivative financial instruments
|
|
$
|
—
|
|
|
$
|
73.9
|
|
|
$
|
—
|
|
|
$
|
73.9
|
|
|
Contingent consideration - Sefina acquisition
|
|
$
|
—
|
|
|
$
|
—
|
|
|
$
|
17.8
|
|
|
$
|
17.8
|
|
The following table reconciles the change in the Level 3
liabilities for the year ended June 30, 2011 (in millions):
| |
|
|
|
|
|
|
|
Fair Value Measurements
|
|
|
|
|
Using Significant
|
|
|
|
|
Unobservable Inputs
|
|
|
|
|
Level 3
|
|
|
|
|
Balances as of June 30, 2010
|
|
$
|
—
|
|
|
Contingent Consideration -— Sefina acquisition
|
|
|
16.6
|
|
|
Unrealized foreign exchange loss on contingent consideration
|
|
|
1.2
|
|
|
|
|
|
|
|
|
Balance as of June 30, 2011
|
|
$
|
17.8
|
|
|
|
|
|
|
|
99
DFC
GLOBAL CORP.
NOTES TO
CONSOLIDATED FINANCIAL
STATEMENTS — (Continued)
|
|
|
12.
|
Derivative
Instruments and Hedging Activities
|
Risk
Management Objective of Using Derivatives
The Company is exposed to certain risks arising from both its
business operations and economic conditions. The Company
principally manages its exposures to a wide variety of business
and operational risks through management of its core business
activities. The Company manages economic risks, including
interest rate, liquidity, and credit risk primarily by managing
the amount, sources, and duration of its debt funding and by the
use of derivative financial instruments. The primary risks
managed by using derivative instruments are interest rate risk,
foreign currency exchange risk and commodity price risk.
Specifically, the Company enters into derivative financial
instruments to manage exposures that arise from business
activities that result in the receipt or payment of future known
and uncertain cash amounts, the value of which are determined by
interest rates, foreign exchange rates or commodity prices.
Certain parts of the Company’s operations in Canada and
Europe expose the Company to fluctuations in foreign exchange
rates. The Company’s goal is to reduce its exposure to such
foreign exchange risks on its foreign currency cash flows and
fair value fluctuations on recognized foreign currency
denominated assets, liabilities and unrecognized firm
commitments to acceptable levels primarily through the use of
foreign exchange-related derivative financial instruments. From
time to time, the Company enters into derivative financial
instruments to protect the value or fix the amount of certain
obligations in terms of its functional currency, the
U.S. dollar.
The Company maintains gold inventory in quantities expected to
be sold in a reasonable period of time in the normal course of
business. The Company generally enters into agreements for
forward delivery. The prices paid in the forward delivery
contracts are generally variable within a capped or collared
price range. Forward derivative contracts on gold are entered
into to manage the price risk associated with forecasted sales
of gold inventory in the Company’s pawn shops.
Cash Flow
Hedges of Foreign Exchange Risk
Operations in the United Kingdom and Canada have exposed the
Company to changes in the CAD-USD and GBP-USD foreign exchange
rates. From time to time, the Company’s U.K. and Canadian
subsidiaries purchase investment securities denominated in a
currency other than their functional currency. The subsidiaries
from time to time hedge the related foreign exchange risk
typically with the use of out of the money put options because
they cost less than completely averting risk using at the money
put options, and the maximum loss is limited to the purchase
price of the contracts.
The effective portion of changes in the fair value of
derivatives designated and that qualify as cash flow hedges of
foreign exchange risk is recorded in other comprehensive income
and subsequently reclassified into earnings in the period that
the hedged forecasted transaction affects earnings. The
ineffective portion of the change in fair value of the
derivative, as well as amounts excluded from the assessment of
hedge effectiveness, is recognized directly in earnings. As of
June 30, 2011, the Company did not have any outstanding
foreign currency derivatives that were designated as hedges.
Cash Flow
Hedges of Multiple Risks
Prior to the Company’s refinancing activities in December
2009, the Company’s foreign subsidiaries in the United
Kingdom and Canada had variable-rate term loan borrowings
denominated in currencies other than the foreign
subsidiaries’ functional currencies. The foreign
subsidiaries were exposed to fluctuations in both the underlying
variable borrowing rate and the foreign currency of the
borrowing against its functional currency. To hedge these risks,
the Company had entered into cross-currency interest rate swaps.
These derivatives were originally designated as cash flow hedges
of both interest rate and foreign exchange risks. On
December 23, 2009, the Company used a portion of the net
proceeds of its $600 million offering of
100
DFC
GLOBAL CORP.
NOTES TO
CONSOLIDATED FINANCIAL
STATEMENTS — (Continued)
|
|
|
12.
|
Derivative
Instruments and Hedging Activities (continued)
|
Cash Flow
Hedges of Multiple Risks (continued)
10.375% Senior Notes due 2016 to prepay $350 million
of the $368.6 million outstanding term loans in both the
United Kingdom and Canada. Simultaneously, the Company
discontinued hedge accounting prospectively on its outstanding
cross currency swaps as they no longer met the strict hedge
accounting requirements of the Derivatives and Hedging Topic of
the FASB Codification.
As a result of the Company repaying the majority of its term
loans in the United Kingdom, the Company terminated its UK
cross-currency swaps and accelerated the reclassification of
amounts in other comprehensive income to earnings as a missed
forecasted transaction as the hedged transactions were no longer
probable to occur. The accelerated amount was a loss of
$3.9 million and was included in Loss on Extinguishment of
Debt in fiscal 2010. The Company continues to report a net loss
related to the discontinued cash flow hedges in accumulated
other comprehensive income included in stockholders’
equity, and is subsequently reclassifying this amount into
earnings (interest expense) over the remaining original term of
the derivative, when the hedged forecasted transactions are
recognized in earnings.
The Canadian cross-currency swaps continue to be outstanding
with prospective changes in fair value of these instruments
being recorded directly through the income statement. The
Company continues to report the net loss related to the
discontinued cash flow hedges in accumulated other comprehensive
income included in stockholders’ equity, and is
subsequently reclassifying this amount into earnings (interest
expense) over the remaining original term of the derivative,
when the hedged forecasted transactions are recognized in
earnings.
As of June 30, 2011, the Company had the following
outstanding derivatives:
| |
|
|
|
|
|
|
|
|
|
|
|
|
|
|
|
|
|
|
|
|
Pay Fixed
|
|
|
Receive Floating
|
|
|
Receive Floating
|
|
Foreign Currency Derivatives
|
|
Pay Fixed Notional
|
|
|
Strike Rate
|
|
|
Notional
|
|
|
Index
|
|
|
|
USD-CAD Cross Currency Swap
|
|
|
CAD180,709,529
|
|
|
|
8.75
|
%
|
|
$
|
157,162,500
|
|
|
3 mo. LIBOR +
2.75% per annum
|
|
USD-CAD Cross Currency Swap
|
|
|
CAD60,502,848
|
|
|
|
7.47
|
%
|
|
$
|
52,387,500
|
|
|
3 mo. LIBOR +
2.75% per annum
|
|
USD-CAD Cross Currency Swap
|
|
|
CAD82,538,888
|
|
|
|
7.41
|
%
|
|
$
|
71,437,500
|
|
|
3 mo. LIBOR +
2.75% per annum
|
Non-designated
Hedges of Commodity Risk
In the normal course of business, the Company maintains
inventories of gold at its pawn shops. From time to time, the
Company enters into derivative financial instruments to manage
the price risk associated with forecasted gold inventory levels.
Derivatives not designated as hedges are not speculative and are
used to manage the Company’s exposure to commodity price
risk but do not meet the strict hedge accounting requirements of
the Derivatives and Hedging Topic of the FASB Codification.
Changes in the fair value of derivatives not designated in
hedging relationships are recorded directly in earnings. As of
June 30, 2011, the Company’s subsidiary in the United
Kingdom had one outstanding gold collar with a notional amount
of 1,500 ounces of gold bullion.
101
DFC
GLOBAL CORP.
NOTES TO
CONSOLIDATED FINANCIAL
STATEMENTS — (Continued)
|
|
|
12.
|
Derivative
Instruments and Hedging Activities (continued)
|
Non-designated
Hedges of Commodity Risk (continued)
The table below presents the fair values of the Company’s
derivative financial instruments on the consolidated balance
sheet as of June 30, 2010 and 2011 (in millions).
| |
|
|
|
|
|
|
|
|
|
|
|
|
|
Tabular Disclosure of Fair Values of Derivative
Instruments
|
|
|
|
|
Asset Derivatives
|
|
|
Liability Derivatives
|
|
|
|
|
As of June 30, 2010
|
|
|
As of June 30, 2010
|
|
|
|
|
Balance Sheet
|
|
Fair
|
|
|
|
|
Fair
|
|
|
|
|
Location
|
|
Value
|
|
|
Balance Sheet Location
|
|
Value
|
|
|
|
|
Derivatives not designated as hedging instruments:
|
|
|
|
|
|
|
|
|
|
|
|
|
|
Cross Currency Swaps
|
|
Derivatives
|
|
$
|
—
|
|
|
Derivatives
|
|
$
|
47.4
|
|
|
|
|
|
|
|
|
|
|
|
|
|
|
|
|
Total derivatives not designated as hedging instruments
|
|
|
|
$
|
—
|
|
|
|
|
$
|
47.4
|
|
|
|
|
|
|
|
|
|
|
|
|
|
|
|
| |
|
|
|
|
|
|
|
|
|
|
|
|
|
|
|
Asset Derivatives
|
|
|
Liability Derivatives
|
|
|
|
|
As of June 30, 2011
|
|
|
As of June 30, 2011
|
|
|
|
|
Balance Sheet
|
|
Fair
|
|
|
|
|
Fair
|
|
|
|
|
Location
|
|
Value
|
|
|
Balance Sheet Location
|
|
Value
|
|
|
|
|
Derivatives not designated as hedging instruments:
|
|
|
|
|
|
|
|
|
|
|
|
|
|
Commodity Options
|
|
Derivatives
|
|
$
|
—
|
|
|
Derivatives
|
|
$
|
0.1
|
|
|
Cross Currency Swaps
|
|
Derivatives
|
|
|
—
|
|
|
Derivatives
|
|
|
73.8
|
|
|
|
|
|
|
|
|
|
|
|
|
|
|
|
|
Total derivatives not designated as hedging instruments
|
|
|
|
$
|
—
|
|
|
|
|
$
|
73.9
|
|
|
|
|
|
|
|
|
|
|
|
|
|
|
|
The tables below present the effect of the Company’s
derivative financial instruments on the consolidated statement
of operations for the years ending June 30, 2010 and 2011
(in millions).
| |
|
|
|
|
|
|
|
|
|
|
|
|
|
|
|
|
|
Tabular Disclosure of the Effect of Derivative Instruments on
the Consolidated Statement of Operations for the Year Ending
June 30, 2010
|
|
|
|
|
|
|
|
|
|
|
|
|
Location of
|
|
|
|
|
|
|
|
|
|
|
|
|
|
|
Gain or (Loss)
|
|
Amount of Gain or
|
|
|
|
|
|
|
|
|
|
|
|
|
Recognized
|
|
(Loss) Recognized
|
|
|
|
|
Amount of Gain or
|
|
|
|
|
|
|
|
in Income on
|
|
in Income on
|
|
|
|
|
(Loss) Recognized
|
|
|
Location of
|
|
|
|
|
Derivative
|
|
Derivative
|
|
|
|
|
in OCI on
|
|
|
Gain or (Loss)
|
|
Amount of Gain or
|
|
|
(Ineffective
|
|
(Ineffective
|
|
|
|
|
Derivative
|
|
|
Reclassified
|
|
(Loss) Reclassified
|
|
|
Portion and Amount
|
|
Portion and Amount
|
|
Derivatives in Cash
|
|
(Effective
|
|
|
from Accumulated
|
|
from Accumulated
|
|
|
Excluded from
|
|
Excluded from
|
|
Flow Hedging
|
|
Portion), net of
|
|
|
OCI into Income
|
|
OCI into Income
|
|
|
Effectiveness
|
|
Effectiveness
|
|
|
Relationships
|
|
tax
|
|
|
(Effective Portion)
|
|
(Effective Portion)
|
|
|
Testing)
|
|
Testing)
|
|
|
|
|
Commodity Options
|
|
$
|
—
|
|
|
|
|
$
|
—
|
|
|
Other income /
(expense)
|
|
$
|
—
|
|
|
Foreign Exchange Contracts
|
|
|
—
|
|
|
Foreign currency
gain / (loss)
|
|
|
—
|
|
|
Other income /
(expense)
|
|
|
—
|
|
|
Cross Currency Swaps
|
|
|
(2.7
|
)
|
|
Extinguishment
of Debt
|
|
|
(3.9
|
)
|
|
Other income /
(expense)
|
|
|
(13.0
|
)
|
|
|
|
|
|
|
|
Interest Expense
|
|
|
(3.9
|
)
|
|
|
|
|
|
|
|
|
|
|
|
|
|
Tax Benefit
|
|
|
2.3
|
|
|
|
|
|
|
|
|
|
|
|
|
|
|
|
|
|
|
|
|
|
|
|
|
|
|
Total
|
|
$
|
(2.7
|
)
|
|
|
|
$
|
(5.5
|
)
|
|
|
|
$
|
(13.0
|
)
|
|
|
|
|
|
|
|
|
|
|
|
|
|
|
|
|
|
|
102
DFC
GLOBAL CORP.
NOTES TO
CONSOLIDATED FINANCIAL
STATEMENTS — (Continued)
|
|
|
12.
|
Derivative
Instruments and Hedging Activities (continued)
|
Non-designated
Hedges of Commodity Risk (continued)
| |
|
|
|
|
|
|
|
|
|
|
|
|
|
|
|
|
|
Tabular Disclosure of the Effect of Derivative Instruments on
the Consolidated Statement of Operations for the Year Ending
June 30, 2011
|
|
|
|
|
|
|
|
|
|
|
|
|
Location of
|
|
|
|
|
|
|
|
|
|
|
|
|
|
|
Gain or (Loss)
|
|
Amount of Gain or
|
|
|
|
|
|
|
|
|
|
|
|
|
Recognized
|
|
(Loss) Recognized
|
|
|
|
|
Amount of Gain or
|
|
|
|
|
|
|
|
in Income on
|
|
in Income on
|
|
|
|
|
(Loss) Recognized
|
|
|
Location of
|
|
|
|
|
Derivative
|
|
Derivative
|
|
|
|
|
in OCI on
|
|
|
Gain or (Loss)
|
|
Amount of Gain or
|
|
|
(Ineffective
|
|
(Ineffective
|
|
|
|
|
Derivative
|
|
|
Reclassified
|
|
(Loss) Reclassified
|
|
|
Portion and Amount
|
|
Portion and Amount
|
|
Derivatives in Cash
|
|
(Effective
|
|
|
from Accumulated
|
|
from Accumulated
|
|
|
Excluded from
|
|
Excluded from
|
|
Flow Hedging
|
|
Portion), net of
|
|
|
OCI into Income
|
|
OCI into Income
|
|
|
Effectiveness
|
|
Effectiveness
|
|
|
Relationships
|
|
tax
|
|
|
(Effective Portion)
|
|
(Effective Portion)
|
|
|
Testing)
|
|
Testing)
|
|
|
|
|
Commodity Options
|
|
$
|
—
|
|
|
|
|
$
|
—
|
|
|
Purchased gold
costs
|
|
$
|
(0.1
|
)
|
|
Cross Currency Swaps
|
|
$
|
—
|
|
|
Interest
Expense
|
|
$
|
(6.5
|
)
|
|
Loss on derivatives
not designated as
hedges
|
|
$
|
(39.3
|
)
|
|
|
|
|
|
|
|
Tax Benefit
|
|
|
1.7
|
|
|
|
|
|
|
|
|
|
|
|
|
|
|
|
|
|
|
|
|
|
|
|
|
|
|
Total
|
|
$
|
—
|
|
|
|
|
$
|
(4.8
|
)
|
|
|
|
$
|
(39.4
|
)
|
|
|
|
|
|
|
|
|
|
|
|
|
|
|
|
|
|
|
Credit-risk-related
Contingent Features
The Company has agreements with each of its derivative
counterparties that contain a provision where if the Company
defaults on any of its indebtedness, including default where
repayment of the indebtedness has not been accelerated by the
lender, then the Company could also be declared in default on
its derivative obligations.
The Company’s agreements with certain of its derivative
counterparties also contain provisions requiring it to maintain
certain minimum financial covenant ratios related to its
indebtedness. Failure to comply with the covenant provisions
would result in the Company being in default on any derivative
instrument obligations covered by the agreement.
As of June 30, 2011, the fair value of derivatives is in a
net liability position of $74.5 million. This amount
includes accrued interest but excludes any adjustment for
non-performance risk. As of June 30, 2011, the Company has
not posted, nor is it required to post, any collateral related
to these agreements. If the Company breached any of these
provisions it would be required to settle its obligations under
the agreements at its termination value of $74.6 million at
June 30, 2011.
Comprehensive income encompasses all changes in
stockholders’ equity (except those arising from
transactions with stockholders) and includes net income (loss),
foreign currency translation adjustments and
103
DFC
GLOBAL CORP.
NOTES TO
CONSOLIDATED FINANCIAL
STATEMENTS — (Continued)
|
|
|
13.
|
Comprehensive
Income (continued)
|
fair value adjustments for cash flow hedges (see Note 12).
The following shows the comprehensive income for the periods
stated (in millions):
| |
|
|
|
|
|
|
|
|
|
|
|
|
|
|
|
June 30,
|
|
|
|
|
2009
|
|
|
2010
|
|
|
2011
|
|
|
|
|
Net income
|
|
$
|
(6.8
|
)
|
|
$
|
(5.2
|
)
|
|
$
|
65.3
|
|
|
Foreign currency translation adjustment(1)
|
|
|
(17.9
|
)
|
|
|
(7.8
|
)
|
|
|
—
|
|
|
Fair value adjustments for derivatives, net(2)
|
|
|
(8.1
|
)
|
|
|
0.5
|
|
|
|
—
|
|
|
Amortization of accumulated other comprehensive income related
to dedesignated cash flow hedges(3)
|
|
|
—
|
|
|
|
1.9
|
|
|
|
4.9
|
|
|
|
|
|
|
|
|
|
|
|
|
|
|
|
|
Comprehensive income
|
|
|
(32.8
|
)
|
|
|
(10.6
|
)
|
|
|
70.2
|
|
|
Net income (loss) applicable to non-controlling interests
|
|
|
—
|
|
|
|
(0.3
|
)
|
|
|
(0.5
|
)
|
|
|
|
|
|
|
|
|
|
|
|
|
|
|
|
Comprehensive income attributable to Dollar Financial Corp.
|
|
$
|
(32.8
|
)
|
|
$
|
(10.3
|
)
|
|
$
|
70.7
|
|
|
|
|
|
|
|
|
|
|
|
|
|
|
|
|
|
|
|
(1) |
|
The ending balance of the foreign currency translation
adjustments included in accumulated other comprehensive income
on the balance sheet were gains of $20.2 million,
$13.3 million and $14.1 million as of June 30,
2009, 2010 and 2011, respectively. |
| |
|
(2) |
|
Net of $7.7 million and $0.9 million of tax for the
years ended June 30, 2009 and 2010, respectively. |
| |
|
(3) |
|
Net of $1.4 million and $1.6 million of tax for the
years ended June 30, 2010 and 2011, respectively. |
Accumulated other comprehensive income, net of related tax,
consisted of unrealized losses on terminated cross-currency
interest rate swaps of $6.5 million at June 30, 2011,
compared to $10.6 million of net unrealized losses on
terminated cross-currency interest rate swaps at June 30,
2010.
U.S. income taxes have not been provided on the
undistributed earnings of international subsidiaries. The
Company’s intention is to reinvest these earnings
indefinitely. As of June 30, 2010 all of the foreign
earnings were deemed distributed under Section 304 of the
Internal Revenue Code as a result of the sale by DFG World, a
DFC indirect U.S. subsidiary, of 2.2 million shares of
Dollar Financial U.K. Ltd. to National Money Mart Company, an
indirect wholly owned Canadian subsidiary for $165 million.
As of June 30, 2011, there are $91.2 million in
undistributed foreign earnings. Upon repatriation of these
earnings, the Company could be subject to both US income taxes
(subject to possible adjustment for foreign credits) and
withholding taxes payable to various foreign countries.
Determination of the amount of unrecognized deferred US income
tax liability and foreign withholding tax on these unremitted
earnings is not practicable at this time because such liability
is dependent upon circumstances existing if and when remittance
occurs.
The Company’s U.S. and foreign income before income
taxes for the years ended June 30, 2009, 2010 and 2011 is
set forth below ( in millions):
| |
|
|
|
|
|
|
|
|
|
|
|
|
|
|
|
June 30,
|
|
|
|
|
2009
|
|
|
2010
|
|
|
2011
|
|
|
|
|
United States
|
|
$
|
(34.0
|
)
|
|
$
|
(20.3
|
)
|
|
$
|
(10.7
|
)
|
|
Foreign
|
|
|
42.2
|
|
|
|
36.5
|
|
|
$
|
113.1
|
|
|
|
|
|
|
|
|
|
|
|
|
|
|
|
|
Total
|
|
$
|
8.2
|
|
|
$
|
16.2
|
|
|
$
|
102.4
|
|
|
|
|
|
|
|
|
|
|
|
|
|
|
|
104
DFC
GLOBAL CORP.
NOTES TO
CONSOLIDATED FINANCIAL
STATEMENTS — (Continued)
|
|
|
14.
|
Income
Taxes (continued)
|
The details of the Company’s income tax provision for the
years ended June 30, 2009, 2010 and 2011 are set forth
below (in millions):
| |
|
|
|
|
|
|
|
|
|
|
|
|
|
|
|
|
|
|
|
June 30,
|
|
|
|
|
|
|
2009
|
|
|
2010
|
|
|
2011
|
|
|
|
|
Current:
|
|
U.S. Federal
|
|
$
|
—
|
|
|
$
|
—
|
|
|
$
|
—
|
|
|
|
|
Foreign
|
|
|
25.1
|
|
|
|
16.5
|
|
|
|
20.5
|
|
|
|
|
State
|
|
|
0.2
|
|
|
|
0.3
|
|
|
|
0.1
|
|
|
|
|
|
|
|
|
|
|
|
|
|
|
|
|
|
|
|
|
Total
|
|
$
|
25.3
|
|
|
$
|
16.8
|
|
|
$
|
20.6
|
|
|
Deferred:
|
|
U.S. Federal
|
|
$
|
4.9
|
|
|
$
|
5.2
|
|
|
$
|
5.7
|
|
|
|
|
Foreign
|
|
|
(15.2
|
)
|
|
|
(0.6
|
)
|
|
|
10.8
|
|
|
|
|
|
|
|
|
|
|
|
|
|
|
|
|
|
|
|
|
Total
|
|
$
|
(10.3
|
)
|
|
$
|
4.6
|
|
|
$
|
16.5
|
|
|
|
|
|
|
|
|
|
|
|
|
|
|
|
|
|
|
Total income tax provision
|
|
$
|
15.0
|
|
|
$
|
21.4
|
|
|
$
|
37.1
|
|
|
|
|
|
|
|
|
|
|
|
|
|
|
|
Below is the reconciliation of income tax expense from the
U.S. federal statutory rate to the Company’s effective
tax rate for the years ended June 30, 2009, 2010 and 2011
(in millions):
| |
|
|
|
|
|
|
|
|
|
|
|
|
|
|
|
June 30,
|
|
|
|
|
2009
|
|
|
2010
|
|
|
2011
|
|
|
|
|
Tax provision at federal statutory rate
|
|
$
|
2.9
|
|
|
$
|
5.7
|
|
|
$
|
35.8
|
|
|
Add(deduct)
|
|
|
|
|
|
|
|
|
|
|
|
|
|
State tax provision
|
|
|
0.2
|
|
|
|
0.3
|
|
|
|
0.1
|
|
|
Canadian withholding
|
|
|
0.3
|
|
|
|
0.5
|
|
|
|
—
|
|
|
Convertible debt discount
|
|
|
3.1
|
|
|
|
3.1
|
|
|
|
2.9
|
|
|
Effect of foreign operations
|
|
|
(2.8
|
)
|
|
|
(3.4
|
)
|
|
|
(9.8
|
)
|
|
Change in uncertain tax position related to transfer pricing
|
|
|
(0.8
|
)
|
|
|
2.5
|
|
|
|
2.8
|
|
|
Other permanent differences
|
|
|
1.2
|
|
|
|
4.1
|
|
|
|
8.5
|
|
|
Foreign exchange gain
|
|
|
3.4
|
|
|
|
0.6
|
|
|
|
—
|
|
|
UK goodwill amortization
|
|
|
0.5
|
|
|
|
0.2
|
|
|
|
0.3
|
|
|
Valuation allowance
|
|
|
7.0
|
|
|
|
7.8
|
|
|
|
(3.5
|
)
|
|
|
|
|
|
|
|
|
|
|
|
|
|
|
|
Tax provision at effective tax rate
|
|
$
|
15.0
|
|
|
$
|
21.4
|
|
|
$
|
37.1
|
|
|
|
|
|
|
|
|
|
|
|
|
|
|
|
The Company provided a valuation allowance against all of its
U.S. deferred tax assets at June 30, 2011 and 2010
which amounted to $98.1 million and $98.3 million,
respectively. Because realization is not assured, the Company
has not recorded the benefit of the deferred tax assets. The net
operating loss carry forward available to offset future taxable
income at June 30, 2011 was $78.2 million compared to
$68.3 million at June 30, 2010. This increase was the
result of an adjustment required by a Competent Authority
settlement and by a current year U.S. loss. The federal net
operating loss carry forwards will begin to expire in 2025, if
not utilized. The Company has foreign tax credit carry forwards
of approximately $53.2 million, which will begin to expire
in 2017 if not utilized. Additionally, in fiscal 2007 the
Company recorded a valuation allowance of $1.1 million
against a Canadian foreign currency loss. This valuation
allowance was utilized in connection with the repayment of the
2006 term debt, in December 2009, but was replaced by a
$1.0 million valuation allowance related to the Canadian
cross-currency interest rate swap. This has been reduced by
$0.5 million related to a June 30, 2010
true-up. At
this time the Company has not identified any potential capital
gains against which to offset the remaining loss.
105
DFC
GLOBAL CORP.
NOTES TO
CONSOLIDATED FINANCIAL
STATEMENTS — (Continued)
|
|
|
14.
|
Income
Taxes (continued)
|
The details of the Company’s deferred tax assets and
liabilities as of June 30, 2009, 2010 and 2011 are set
forth below (in millions):
| |
|
|
|
|
|
|
|
|
|
|
|
|
|
|
|
June 30,
|
|
|
|
|
2009
|
|
|
2010
|
|
|
2011
|
|
|
|
|
Deferred tax assets
|
|
|
|
|
|
|
|
|
|
|
|
|
|
Loss reserves
|
|
$
|
3.8
|
|
|
$
|
2.8
|
|
|
$
|
1.9
|
|
|
Depreciation and amortization
|
|
|
10.7
|
|
|
|
9.5
|
|
|
|
4.3
|
|
|
Accrued compensation
|
|
|
2.9
|
|
|
|
3.8
|
|
|
|
5.7
|
|
|
Other accrued expenses
|
|
|
18.7
|
|
|
|
19.0
|
|
|
|
14.5
|
|
|
Net operating loss carryforwards
|
|
|
37.0
|
|
|
|
23.9
|
|
|
|
27.3
|
|
|
Foreign tax credit carryforwards
|
|
|
45.6
|
|
|
|
54.6
|
|
|
|
53.2
|
|
|
Foreign capital loss carryforwards
|
|
|
1.3
|
|
|
|
1.0
|
|
|
|
0.6
|
|
|
Foreign currency swaps
|
|
|
9.9
|
|
|
|
8.0
|
|
|
|
9.0
|
|
|
Other
|
|
|
0.5
|
|
|
|
0.2
|
|
|
|
3.8
|
|
|
|
|
|
|
|
|
|
|
|
|
|
|
|
|
Total deferred tax assets
|
|
|
130.4
|
|
|
|
122.8
|
|
|
|
120.3
|
|
|
Valuation Allowance
|
|
|
(89.8
|
)
|
|
|
(85.0
|
)
|
|
|
(87.6
|
)
|
|
|
|
|
|
|
|
|
|
|
|
|
|
|
|
Net deferred tax asset
|
|
$
|
40.6
|
|
|
$
|
37.8
|
|
|
$
|
32.7
|
|
|
|
|
|
|
|
|
|
|
|
|
|
|
|
|
Deferred tax liabilities
|
|
|
|
|
|
|
|
|
|
|
|
|
|
Amortization and other temporary differences
|
|
$
|
(18.9
|
)
|
|
$
|
(24.0
|
)
|
|
$
|
(53.8
|
)
|
|
Convertible debt discount
|
|
|
(13.5
|
)
|
|
|
(14.6
|
)
|
|
|
(11.4
|
)
|
|
Foreign currency transactions
|
|
|
(0.1
|
)
|
|
|
—
|
|
|
|
—
|
|
|
|
|
|
|
|
|
|
|
|
|
|
|
|
|
Total deferred tax liability
|
|
|
(32.5
|
)
|
|
|
(38.6
|
)
|
|
|
(65.2
|
)
|
|
|
|
|
|
|
|
|
|
|
|
|
|
|
|
Net deferred tax liability
|
|
$
|
(8.2
|
)
|
|
$
|
(0.8
|
)
|
|
$
|
(32.5
|
)
|
|
|
|
|
|
|
|
|
|
|
|
|
|
|
The analysis of the change in the Company’s valuation
allowance for the years ended June 30, 2009, 2010 and 2011
is set forth below (in millions):
| |
|
|
|
|
|
|
|
|
|
|
|
|
|
|
|
June 30,
|
|
|
|
|
2009
|
|
|
2010
|
|
|
2011
|
|
|
|
|
Balance at beginning of year
|
|
$
|
(80.9
|
)
|
|
$
|
(89.8
|
)
|
|
$
|
(85.0
|
)
|
|
(Provision)/benefit
|
|
|
(7.0
|
)
|
|
|
(7.8
|
)
|
|
|
3.5
|
|
|
Other additions/(deductions)
|
|
|
(1.9
|
)
|
|
|
12.6
|
|
|
|
(6.1
|
)
|
|
|
|
|
|
|
|
|
|
|
|
|
|
|
|
Balance at end of year
|
|
$
|
(89.8
|
)
|
|
$
|
(85.0
|
)
|
|
$
|
(87.6
|
)
|
|
|
|
|
|
|
|
|
|
|
|
|
|
|
The Company believes that its ability to utilize
pre-2007 net operating losses in a given year will be
limited to $9.0 million under Section 382 of the
Internal Revenue Code, which the Company refers to as the Code,
because of changes of ownership resulting from the June 2006
follow-on equity offering. In addition, any future debt or
equity transactions may reduce the Company’s net operating
losses or further limit its ability to utilize the net operating
losses under the Code. The Company’s follow-on equity
offering in April 2011 did not impact this limitation. The net
operating loss carry forward as of June 30, 2011 is
$78.2 million. The deferred tax asset related to excess
foreign tax credits is also fully offset by a valuation
allowance of $53.2 million. This represents a decrease of
$1.3 million for the period related to the Competent
Authority settlement discussed above which is partially offset
by a true-up
from prior periods.
106
DFC
GLOBAL CORP.
NOTES TO
CONSOLIDATED FINANCIAL
STATEMENTS — (Continued)
|
|
|
14.
|
Income
Taxes (continued)
|
At June 30, 2010 and 2011 the Company had
$10.3 million and $14.2 million, respectively, of
unrecognized tax benefits, primarily related to transfer pricing
matters, which if recognized, would reduce the effective tax
rate.
The tax years ending June 30, 2008 through 2011 remain open
to examination by the taxing authorities in the United States,
United Kingdom and Canada.
The Company recognizes interest and penalties related to
uncertain tax positions in income tax expense. As of
June 30, 2011, the Company had approximately
$1.7 million of accrued interest related to uncertain tax
positions which represents a $0.8 million increase from the
prior year. The provision for unrecognized tax benefits,
including accrued interest, is included in income taxes payable.
A reconciliation of the liability for uncertain tax positions
for fiscal 2011 follows (in millions):
| |
|
|
|
|
|
Balance at June 30, 2010
|
|
$
|
10.3
|
|
|
Net increases due to current year tax positions
|
|
|
3.9
|
|
|
|
|
|
|
|
|
Balance at June 30, 2011
|
|
$
|
14.2
|
|
|
|
|
|
|
|
|
|
|
15.
|
Loss on
Extinguishment of Debt
|
On December 21, 2009, the Company entered into privately
negotiated transactions with several holders of the 2027 Notes
for the exchange of $120.0 million of the 2027 Notes for an
equal amount of 2028 Notes. Pursuant to the accounting guidance
related to convertible debt, those exchange transactions created
a gain that was more than offset by the write-off of previously
capitalized unamortized deferred debt costs associated with the
offering of the 2027 Notes offered in June 2007. The net
extinguishment gain was $0.2 million.
On December 23, 2009, the Company and its lenders amended
and restated the 2006 Credit Agreement and the Company repaid a
substantial portion of its term indebtedness there-under. All
previously capitalized unamortized deferred debt costs were
reclassified from the balance sheet and recorded as expense in
the income statement. In addition, there was a non-cash charge
related to our U.K. cross currency interest rate swaps that had
been terminated in May 2009. The accumulated net loss at the
time the swaps were terminated was a component of other
comprehensive income and was being amortized over the remaining
life of the related underlying U.K. term debt. Because the
termination of the debt caused management to conclude that the
future cash flows originally hedged would no longer occur, a
proportional amount of the remaining other comprehensive income
was reclassified from accumulated other comprehensive income and
recorded as expense in the income statement.
In February 2010, the Company repurchased $35.2 million
aggregate principal amount of its 2027 Notes in privately
negotiated transactions with three of the holders of the 2027
Notes. The repurchase transactions created a loss that included
the write-off of previously capitalized unamortized deferred
debt costs associated with the original 2027 Notes offered in
June 2007. The net extinguishment loss was $0.7 million.
107
DFC
GLOBAL CORP.
NOTES TO
CONSOLIDATED FINANCIAL
STATEMENTS — (Continued)
|
|
|
15.
|
Loss on
Extinguishment of Debt (continued)
|
The details related to all elements of the loss on
extinguishment of debt during the fiscal year ended
June 30, 2010 are as follows (in thousands):
| |
|
|
|
|
|
|
|
Loss/(Gain)
|
|
|
|
|
Write-off of previously capitalized Term Loan deferred debt
issuance costs, net
|
|
$
|
4.9
|
|
|
Reclassification of other comprehensive income related to U.K.
term debt repayment
|
|
|
3.9
|
|
|
Net gain on repurchase of 2027 Notes
|
|
|
(1.5
|
)
|
|
Write-off of previously capitalized deferred debt issuance costs
related to the 2027 Notes, net
|
|
|
2.0
|
|
|
Other
|
|
|
0.2
|
|
|
|
|
|
|
|
|
Total
|
|
$
|
9.5
|
|
|
|
|
|
|
|
|
|
|
16.
|
Loss on
Store Closing and Other Restructuring
|
On June 30, 2008 the Company, as part of a process to
rationalize its United States markets, made a determination to
close 24 of its unprofitable stores in various United States
markets. For all but one of these stores, the cease-use date was
July 11, 2008 while one other store had a cease-use date of
July 25, 2008. In August 2008, the Company identified an
additional 29 stores in the United States and 17 stores in
Canada that were underperforming or overlapping and which were
closed or merged into a geographically proximate store. The
cease-use date for 44 of these stores was in September and
October 2008. Customers from these stores were transitioned to
other Company stores in close proximity to the stores affected.
The Company recorded costs for severance and other retention
benefits of $0.6 million and store closure costs of
$5.8 million consisting primarily of lease obligations and
leasehold improvement write-offs related to June 2008 and August
2008 store closings. These charges were expensed within loss on
store closings on the statements of operations. Of the
$6.4 million charge, $3.3 million related to the
United States segment and $3.1 million for the Canadian
segment.
During the fourth quarter of the year ended June 30, 2009,
the Company announced the closure of 60
U.S. under-performing stores located in states with
uncertain or less favorable regulation, or were located in
states where the Company only had a few locations resulting in
an inefficient and more costly infrastructure. For all of these
locations, the cease-use date was prior to June 30, 2009.
The Company recorded costs for severance and other retention
benefits of $0.4 million and store closure costs of
$2.9 million consisting primarily of lease obligations and
leasehold improvement write-offs related to this program. Most
of these locations were either at or near their lease-end term.
During the year ended June 30, 2010, the Company recorded
additional expense related to store closures during fiscal 2009
of approximately $1.0 million. This additional expense was
related to adjustment of assumptions related to the
sub-lease
potential of some of the locations that were closed during
fiscal 2009. The Company also recorded additional expenses of
approximately $1.4 million for closures of other
non-performing U.S. stores and $0.9 million of expense
in relation to the buy-out of certain “We The People”
franchises.
During the year ended June 30, 2011, the Company recorded
$0.9 million of store closing expense related closures of
underperforming and overlapping stores primarily in the United
States and Canada. The remaining amount of liability associated
with store closings is $0.4 million at June 30, 2011.
108
DFC
GLOBAL CORP.
NOTES TO
CONSOLIDATED FINANCIAL
STATEMENTS — (Continued)
|
|
|
16.
|
Loss on
Store Closing and Other Restructuring (continued)
|
The Company has various non-cancelable operating leases for
office and retail space and certain equipment with terms
primarily ranging from one to five years, most of which contain
standard optional renewal clauses. Total rent expense under
operating leases amounted to $36.0 million,
37.7 million and $48.0 million for the years ended
June 30, 2009, 2010 and 2011, respectively.
At June 30, 2011, future minimum lease payments for
operating leases are as follows (in millions):
| |
|
|
|
|
|
Year
|
|
Amount
|
|
|
|
|
2012
|
|
$
|
49.8
|
|
|
2013
|
|
|
42.1
|
|
|
2014
|
|
|
35.8
|
|
|
2015
|
|
|
29.4
|
|
|
2016
|
|
|
23.4
|
|
|
Thereafter
|
|
|
54.0
|
|
|
|
|
|
|
|
|
Total
|
|
$
|
234.5
|
|
|
|
|
|
|
|
|
|
|
18.
|
Contingent
Liabilities
|
Contingent
Liabilities
The Company is subject to various asserted and unasserted claims
during the course of business. Due to the uncertainty
surrounding the litigation process, except for those matters for
which an accrual is described below, the Company is unable to
reasonably estimate the range of loss, if any, in connection
with the asserted and unasserted legal actions against it.
Although the outcome of many of these matters is currently not
determinable, the Company believes that it has meritorious
defenses and that the ultimate cost to resolve these matters
will not have a material impact on the Company’s
consolidated financial position, results of operations or cash
flows. In addition to the legal proceedings discussed below, the
Company is involved in routine litigation and administrative
proceedings arising in the ordinary course of business.
The Company assesses the materiality of litigation by reviewing
a range of qualitative and quantitative factors. These factors
include the size of the potential claims, the merits of the
Company’s defenses and the likelihood of plaintiffs’
success on the merits, the regulatory environment that could
impact such claims and the potential impact of the litigation on
our business. The Company evaluates the likelihood of an
unfavorable outcome of the legal or regulatory proceedings to
which it is a party in accordance with the
“Contingencies” Topic of the FASB Codification. This
assessment is subjective based on the status of the legal
proceedings and is based on consultation with in-house and
external legal counsel. The actual outcomes of these proceedings
may differ from the Company’s assessments.
Settled
Canadian Class Actions
Ontario
Class Action
In 2003, a former customer in Ontario, Canada, Margaret Smith,
commenced an action against Dollar Financial Group, Inc. and the
Company’s indirect wholly owned Canadian subsidiary,
National Money Mart Company (“NMM”), on behalf of a
purported class of Ontario borrowers who, Smith claimed, were
subjected to usurious charges in payday-loan transactions (the
“Ontario Litigation”). The action alleged violations
of a Canadian federal law proscribing usury and sought
restitution and damages, including punitive damages, and
injunctive relief prohibiting further alleged usurious charges.
Effective March 3, 2010, the Ontario Superior Court of
Justice approved a settlement of the Ontario Litigation, and the
settlement became final upon the expiration of a
30-day
appeal period.
109
DFC
GLOBAL CORP.
NOTES TO
CONSOLIDATED FINANCIAL
STATEMENTS — (Continued)
|
|
|
18.
|
Contingent
Liabilities (continued)
|
Settled
Canadian Class Actions (continued)
British
Columbia Class Action
In 2003, a former customer, Kurt MacKinnon, commenced an action
against NMM and 26 other Canadian lenders on behalf of a
purported class of British Columbia residents (the “British
Columbia Litigation”). The allegations were substantially
similar to the Ontario Litigation. Effective July 19, 2010,
the court approved a settlement of the British Columbia
Litigation, and the settlement became final upon the expiration
of a 30-day
appeal period.
New
Brunswick, Newfoundland and Nova Scotia
Class Actions
Litigation similar in nature to the Ontario Litigation and the
British Columbia Litigation was commenced against NMM in New
Brunswick, Nova Scotia and Newfoundland (collectively, the
“Maritimes Litigation”). Effective May 26, 2010,
courts in those three provinces approved settlements of all of
the Maritimes Litigation, and those settlements became final
upon the expiration of a
30-day
appeal period.
Purported
Alberta Class Actions
In 2003, Gareth Young, a former customer, commenced a
representative action (the “Young Litigation”) against
NMM, Dollar Financial Group, Inc. and two other individual
defendants in the Court of Queen’s Bench of Alberta, Canada
on behalf of a class of consumers. The allegations are
substantially similar to the Ontario and British Columbia
Litigation. The action seeks restitution and damages, including
punitive damages. In 2004, NMM served Mr. Young a demand
for arbitration. In July 2010, Dollar Financial Group, Inc. and
the individual defendants in the case were dismissed.
In 2006, a former customer, H. Craig Day, commenced a purported
class action against Dollar Financial Group, Inc., NMM and
several of the Company’s franchisees in the Court of
Queen’s Bench of Alberta, Canada on behalf of a putative
class of consumers who obtained short-term loans from NMM in
Alberta (the “Day Litigation” and, together with the
Young Litigation, the “Alberta Litigation”). The
allegations and relief sought in the Day Litigation action are
substantially the same as those in the Young Litigation, but
relate to a claim period that commences before and ends after
the claim period in the Young Litigation and excludes the claim
period described in the Young Litigation. In 2007, a demand for
arbitration was served on the Day action plaintiffs; in April
2010, plaintiffs’ indicated that they would proceed with
the claims in the Alberta Litigation; NMM and the franchisees
have filed motions to enforce the arbitration clause and to stay
the actions.
Neither of the actions comprising the Alberta Litigation has
been certified to date as a class action. The Company intends to
defend these actions vigorously.
Purported
Manitoba Class Action
In 2004, an action was filed against NMM in Manitoba on behalf
of a purported class of consumers who obtained short-term loans
from NMM. The allegations are substantially similar to the
Ontario and British Columbia Litigation. The action has not been
certified to date as a class action. If the action proceeds, NMM
intends to seek a stay of the action on the grounds that the
plaintiff entered into an arbitration and mediation agreement
with NMM with respect to the matters which are the subject of
this action. The Company intends to defend this action
vigorously.
Provisions
for Settlement of Canadian Actions
As of June 30, 2011, an aggregate of approximately CAD
46.9 million is included in the Company’s accrued
liabilities relating to the Canadian class action proceedings
described above. The class action
110
DFC
GLOBAL CORP.
NOTES TO
CONSOLIDATED FINANCIAL
STATEMENTS — (Continued)
|
|
|
18.
|
Contingent
Liabilities (continued)
|
Provisions
for Settlement of Canadian Actions (continued)
proceedings settled to date have consisted of a cash component
and vouchers to the class members for future services. The
component of the accrual that relates to vouchers is
approximately CAD 28.4 million, the majority of which is
expected to be non-cash. Although we believe that we have
meritorious defenses to the claims in the purported class
proceedings in Alberta and Manitoba described above and intend
vigorously to defend against such remaining pending claims, the
ultimate cost of resolution of such claims may exceed the amount
accrued at June 30, 2011 and additional accruals may be
required in the future.
Other
Canadian Litigation
In 2006, two former employees, Peggy White and Kelly Arseneau,
commenced companion actions against NMM and Dollar Financial
Group, Inc. The actions, which are pending in the Superior Court
of Ontario, allege negligence on the part of the defendants in
security training procedures and breach of fiduciary duty to
employees in violation of applicable statutes. The companion
lawsuits seek combined damages of CAD 5.0 million plus
interest and costs. The Company continues to defend these
actions vigorously and believes it has meritorious defenses.
In October 2010, The Cash Store Financial Services, Inc. and its
subsidiaries, The Cash Store Inc. and InstaLoans Inc.
(“Cash Store”), filed a complaint and motion for
injunctive relief in Ontario Superior Court against NMM alleging
trademark violations and false/misleading advertising, along
with claims for CAD 60 million in damages, against
NMM’s print, television and internet advertising which
features Cash Store’s higher payday loan costs as compared
to NMM. NMM filed its opposition to Cash Store’s motion
based, in part, on data gathered from Cash Store loan
transactions that supported NMM’s advertising statements.
In late October 2010, the Cash Store abandoned its motion to
enjoin NMM’s advertising, and the Court granted NMM’s
request for reimbursement from the Cash Store of NMMs’
attorneys’ fees incurred to defeat Cash Store’s
injunction motion. In April 2011, having been notified that the
Cash Store intends to further pursue the claims alleged in its
complaint, NMM intends to file a Statement of Defence in May
2011. NMM will vigorously defend this matter and its
advertising. At this time, it is too early to determine the
likelihood of an unfavorable outcome or the ultimate liability,
if any, resulting from this case.
California
Legal Proceedings
On April 26, 2007, the San Francisco City Attorney
(the “City Attorney”) filed a complaint in the name of
the People of the State of California alleging that certain of
the Company’s subsidiaries engaged in unlawful and
deceptive business practices in violation of California Business
and Professions Code Section 17200 by either themselves
making installment loans under the guise of marketing and
servicing for co-defendant First Bank of Delaware (the
“Bank”) or by brokering installment loans made by the
Bank in California in violation of the prohibition on usury
contained in the California Constitution and the California
Finance Lenders Law and that they have otherwise violated the
California Finance Lenders Law and the California Deferred
Deposit Transaction Law. The complaint seeks broad injunctive
relief as well as civil penalties. In 2009, the City Attorney
filed an amended complaint, restating the claims in the original
complaint, adding Dollar Financial Group, Inc. as a defendant
and adding a claim that short-term deferred deposit loans made
by the Bank, which were marketed and serviced by Dollar
Financial Group, Inc.
and/or its
subsidiaries, violated the California Deferred Deposit
Transaction law. Dollar Financial Group, Inc. and its
subsidiaries named in the complaint have denied the allegations
of the amended complaint. Discovery is proceeding and no trial
date has been set. At this time, it is too early to determine
the likelihood of an unfavorable outcome or the ultimate
liability, if any, resulting from this case.
111
DFC
GLOBAL CORP.
NOTES TO
CONSOLIDATED FINANCIAL
STATEMENTS — (Continued)
|
|
|
18.
|
Contingent
Liabilities (continued)
|
California
Legal Proceedings (continued)
We The
People Legal Proceedings
In February 2010, the subsidiaries through which the Company
operated its We The People (“WTP”) business, We The
People USA, Inc. and its wholly owned subsidiary, We The People
LLC (collectively, the “WTP Debtors”) filed voluntary
petitions for relief under Chapter 11 of Title 11 of
the U.S. Bankruptcy Code (the “WTP Bankruptcy
Proceedings”) in U.S. Bankruptcy Court for the
District of Delaware (the “Bankruptcy Court”). In
October 2010, the WTP Debtors filed with the Bankruptcy Court a
plan of liquidation under Chapter 11 of the bankruptcy code
(the “Plan”). The Plan was approved by the Bankruptcy
Court in December 2010 and became effective as of
December 30, 2010 (the “Effective Date”). As of
the Effective Date, the WTP Debtors were released from all
claims against them and certain assets of the WTP business were
transferred to the remaining WTP franchisees. In accordance with
the Plan, the Company funded $1.8 million into the
bankruptcy estates of the WTP Debtors during the three months
ended December 31, 2010 in order to satisfy creditors’
claims. An aggregate of approximately $1.8 million had been
included in the Company’s accrued expenses relating to WTP
Bankruptcy Proceedings and the litigation that had been pending
against the WTP Debtors and the Company related to the WTP
business prior to the approval of the Plan by the Bankruptcy
Court as of the Effective Date. On March 30, 2011, the
Bankruptcy Court entered a final decree approving final
distributions, allowing the liquidation trust to abandon WTP
Debtors property and formally closing the WTP Bankruptcy
Proceedings.
In September 2007, Jacqueline Fitzgibbons, a former customer of
a WTP store, commenced a lawsuit against WTP and Dollar
Financial Group, Inc. and others in California Superior Court
for Alameda County. In January 2009, an individual named Robert
Blau replaced Fitzgibbons as lead plaintiff. The suit alleged on
behalf of a class of consumers and senior citizens that, from
2003 to 2007, WTP violated California law by advertising and
selling living trusts and wills to certain California residents.
A motion to certify the class was heard and the court granted
class certification of the claim that WTP’s business model
violates certain unfair competition laws in California. On
April 8, 2010, the parties reached an agreement to settle
the case with a settlement fund to be funded by Dollar Financial
Group, Inc. In June 2010, the Bankruptcy Court approved the
terms of the settlement in so far as the terms affected the
bankruptcy estates of the WTP Debtors. On September 17,
2010, the court granted final approval of the class settlement,
and the settlement became final on November 16, 2010 upon
the expiration of the appeal period. The Company paid
approximately $3.2 million into the settlement fund during
the three months ended December 31, 2010 to satisfy its
obligations under the settlement.
The Company classifies its businesses into three reportable
segments: United States Retail, Canada and Europe. These three
reporting segments have been identified giving consideration to
geographic area, products offered and regulatory environment and
management’s view of the business. The Company provides
financial services primarily to unbanked and under-banked
consumers and small businesses that are typically not well
serviced by banks due to their lack of credit history, smaller
transaction size and the necessity for a quick and convenient
response. The types of service offered to this customer group is
the primary commonality enjoining all of the Company’s
products and services and delivery channel methodologies. The
Company’s strategy is to deliver its various products and
services through the most convenient means its customers are
accustomed to and comfortable with in each market, and in many
instances a single customer may choose multiple delivery methods
over time to access the same financial service or product. Due
to similarities with respect to customer demographics, the
Company’s principle products and services may be offered in
all of its geographic jurisdictions. The Europe reporting
segment includes the Company’s operating segments in the
United Kingdom, the Sefina pawn business (acquired in December
2010) in Sweden and Finland and the Company’s
112
DFC
GLOBAL CORP.
NOTES TO
CONSOLIDATED FINANCIAL
STATEMENTS — (Continued)
|
|
|
19.
|
Segment
Information (continued)
|
businesses in Poland. These operating segments generally offer
the same services distributed in similar fashions, have the same
types of customers, are subject to similar regulatory
requirements and have similar economic characteristics, allowing
these operations to be aggregated into one reporting segment.
The amounts reported as “Other”, includes
Dealers’ Financial Services as well as all corporate
headquarters expenses that support the expansion of the global
business that have not been charged out to the reporting
segments in United States Retail, Canada and Europe.
The primary service offerings of the United States Retail,
Canada, and Europe reportable segments are single-payment
consumer loans, check cashing, money transfers, pawn loans and
sales, gold sales and other ancillary services. As a result of
the maturation level of the retail locations, mix of service
offerings and diversity in the respective geographic regulatory
environments, there are differences in each reporting
segment’s profit margins.
| |
|
|
|
|
|
|
|
|
|
|
|
|
|
|
|
|
|
|
|
|
|
|
|
United States
|
|
|
|
|
|
|
|
|
|
|
|
|
|
|
|
|
Retail
|
|
|
Canada
|
|
|
Europe
|
|
|
Other
|
|
|
Total
|
|
|
|
|
(In millions)
|
|
|
|
|
2009
|
|
|
|
|
|
|
|
|
|
|
|
|
|
|
|
|
|
|
|
|
|
Total assets
|
|
$
|
249.4
|
|
|
$
|
446.2
|
|
|
$
|
194.2
|
|
|
$
|
31.7
|
|
|
$
|
921.5
|
|
|
Goodwill and other intangibles, net
|
|
|
206.1
|
|
|
|
166.2
|
|
|
|
76.4
|
|
|
|
5.6
|
|
|
|
454.3
|
|
|
Sales to unaffiliated customers:
|
|
|
|
|
|
|
|
|
|
|
|
|
|
|
|
|
|
|
|
|
|
Consumer lending
|
|
|
79.6
|
|
|
|
121.5
|
|
|
|
65.4
|
|
|
|
—
|
|
|
|
266.5
|
|
|
Check cashing
|
|
|
56.4
|
|
|
|
67.8
|
|
|
|
40.4
|
|
|
|
—
|
|
|
|
164.6
|
|
|
Pawn service fees and sales
|
|
|
—
|
|
|
|
—
|
|
|
|
13.8
|
|
|
|
—
|
|
|
|
13.8
|
|
|
Money transfer fees
|
|
|
5.9
|
|
|
|
15.1
|
|
|
|
5.8
|
|
|
|
—
|
|
|
|
26.8
|
|
|
Gold sales
|
|
|
0.1
|
|
|
|
0.2
|
|
|
|
3.4
|
|
|
|
—
|
|
|
|
3.7
|
|
|
Other
|
|
|
10.9
|
|
|
|
31.7
|
|
|
|
10.2
|
|
|
|
2.0
|
|
|
|
54.8
|
|
|
|
|
|
|
|
|
|
|
|
|
|
|
|
|
|
|
|
|
|
|
|
|
Total sales to unaffiliated customers
|
|
|
152.9
|
|
|
|
236.3
|
|
|
|
139.0
|
|
|
|
2.0
|
|
|
|
530.2
|
|
|
Provision for loan losses
|
|
|
20.8
|
|
|
|
23.2
|
|
|
|
8.1
|
|
|
|
—
|
|
|
|
52.1
|
|
|
Depreciation and amortization
|
|
|
4.2
|
|
|
|
5.9
|
|
|
|
5.4
|
|
|
|
1.4
|
|
|
|
16.9
|
|
|
Interest expense, net
|
|
|
—
|
|
|
|
16.5
|
|
|
|
6.6
|
|
|
|
20.6
|
|
|
|
43.7
|
|
|
Unrealized foreign exchange gain
|
|
|
—
|
|
|
|
—
|
|
|
|
(5.5
|
)
|
|
|
—
|
|
|
|
(5.5
|
)
|
|
Provision for litigation settlements
|
|
|
—
|
|
|
|
57.5
|
|
|
|
—
|
|
|
|
0.4
|
|
|
|
57.9
|
|
|
Loss on store closings
|
|
|
6.5
|
|
|
|
3.0
|
|
|
|
0.2
|
|
|
|
0.6
|
|
|
|
10.3
|
|
|
Other expense (income), net
|
|
|
0.4
|
|
|
|
(3.3
|
)
|
|
|
(1.9
|
)
|
|
|
—
|
|
|
|
(4.8
|
)
|
|
(Loss) income before income taxes
|
|
|
(11.8
|
)
|
|
|
0.8
|
|
|
|
36.4
|
|
|
|
(17.2
|
)
|
|
|
8.2
|
|
|
Income tax provision (benefit)
|
|
|
10.0
|
|
|
|
—
|
|
|
|
9.9
|
|
|
|
(4.9
|
)
|
|
|
15.0
|
|
113
DFC
GLOBAL CORP.
NOTES TO
CONSOLIDATED FINANCIAL
STATEMENTS — (Continued)
|
|
|
19.
|
Segment
Information (continued)
|
| |
|
|
|
|
|
|
|
|
|
|
|
|
|
|
|
|
|
|
|
|
|
|
|
United States
|
|
|
|
|
|
|
|
|
|
|
|
|
|
|
|
|
Retail
|
|
|
Canada
|
|
|
Europe
|
|
|
Other
|
|
|
Total
|
|
|
|
|
(In millions)
|
|
|
|
|
2010
|
|
|
|
|
|
|
|
|
|
|
|
|
|
|
|
|
|
|
|
|
|
Total assets
|
|
$
|
255.4
|
|
|
$
|
516.0
|
|
|
$
|
288.6
|
|
|
$
|
154.6
|
|
|
$
|
1,214.6
|
|
|
Goodwill and other intangibles, net
|
|
|
206.1
|
|
|
|
182.1
|
|
|
|
105.9
|
|
|
|
114.9
|
|
|
|
609.0
|
|
|
Sales to unaffiliated customers:
|
|
|
|
|
|
|
|
|
|
|
|
|
|
|
|
|
|
|
|
|
|
Consumer lending
|
|
|
65.7
|
|
|
|
147.9
|
|
|
|
105.9
|
|
|
|
—
|
|
|
|
319.5
|
|
|
Check cashing
|
|
|
46.5
|
|
|
|
69.4
|
|
|
|
33.6
|
|
|
|
—
|
|
|
|
149.5
|
|
|
Pawn service fees and sales
|
|
|
—
|
|
|
|
—
|
|
|
|
19.9
|
|
|
|
—
|
|
|
|
19.9
|
|
|
Money transfer fees
|
|
|
4.9
|
|
|
|
16.4
|
|
|
|
6.2
|
|
|
|
—
|
|
|
|
27.5
|
|
|
Gold sales
|
|
|
0.4
|
|
|
|
11.9
|
|
|
|
30.7
|
|
|
|
—
|
|
|
|
43.0
|
|
|
Other
|
|
|
10.3
|
|
|
|
31.2
|
|
|
|
17.2
|
|
|
|
15.2
|
|
|
|
73.9
|
|
|
|
|
|
|
|
|
|
|
|
|
|
|
|
|
|
|
|
|
|
|
|
|
Total sales to unaffiliated customers
|
|
|
127.8
|
|
|
|
276.8
|
|
|
|
213.5
|
|
|
|
15.2
|
|
|
|
633.3
|
|
|
Provision for loan losses
|
|
|
10.5
|
|
|
|
15.8
|
|
|
|
19.6
|
|
|
|
—
|
|
|
|
45.9
|
|
|
Depreciation and amortization
|
|
|
3.8
|
|
|
|
6.7
|
|
|
|
6.5
|
|
|
|
4.6
|
|
|
|
21.6
|
|
|
Interest expense, net
|
|
|
—
|
|
|
|
47.9
|
|
|
|
4.2
|
|
|
|
16.8
|
|
|
|
68.9
|
|
|
Loss on extinguishment of debt
|
|
|
—
|
|
|
|
3.6
|
|
|
|
4.7
|
|
|
|
1.2
|
|
|
|
9.5
|
|
|
Unrealized foreign exchange loss (gain)
|
|
|
—
|
|
|
|
2.2
|
|
|
|
8.0
|
|
|
|
(0.1
|
)
|
|
|
10.1
|
|
|
Loss on derivatives not designated as hedges
|
|
|
—
|
|
|
|
12.9
|
|
|
|
—
|
|
|
|
—
|
|
|
|
12.9
|
|
|
Provision for litigation settlements
|
|
|
—
|
|
|
|
22.7
|
|
|
|
—
|
|
|
|
6.4
|
|
|
|
29.1
|
|
|
Loss on store closings
|
|
|
1.5
|
|
|
|
0.9
|
|
|
|
—
|
|
|
|
0.9
|
|
|
|
3.3
|
|
|
Other (income) expense, net
|
|
|
—
|
|
|
|
(0.9
|
)
|
|
|
1.0
|
|
|
|
2.1
|
|
|
|
2.2
|
|
|
Income (loss) before income taxes
|
|
|
2.9
|
|
|
|
3.7
|
|
|
|
32.8
|
|
|
|
(23.2
|
)
|
|
|
16.2
|
|
|
Income tax provision (benefit)
|
|
|
16.3
|
|
|
|
5.2
|
|
|
|
10.2
|
|
|
|
(10.3
|
)
|
|
|
21.4
|
|
114
DFC
GLOBAL CORP.
NOTES TO
CONSOLIDATED FINANCIAL
STATEMENTS — (Continued)
|
|
|
19.
|
Segment
Information (continued)
|
| |
|
|
|
|
|
|
|
|
|
|
|
|
|
|
|
|
|
|
|
|
|
|
|
United States
|
|
|
|
|
|
|
|
|
|
|
|
|
|
|
|
|
Retail
|
|
|
Canada
|
|
|
Europe
|
|
|
Other
|
|
|
Total
|
|
|
|
|
(In millions)
|
|
|
|
|
2011
|
|
|
|
|
|
|
|
|
|
|
|
|
|
|
|
|
|
|
|
|
|
Total assets
|
|
$
|
261.7
|
|
|
$
|
466.9
|
|
|
$
|
792.1
|
|
|
$
|
142.1
|
|
|
$
|
1,662.8
|
|
|
Goodwill and other intangibles, net
|
|
|
206.0
|
|
|
|
235.1
|
|
|
|
383.4
|
|
|
|
107.5
|
|
|
|
932.0
|
|
|
Sales to unaffiliated customers:
|
|
|
|
|
|
|
|
|
|
|
|
|
|
|
|
|
|
|
|
|
|
Consumer lending
|
|
|
61.6
|
|
|
|
170.7
|
|
|
|
196.9
|
|
|
|
—
|
|
|
|
429.2
|
|
|
Check cashing
|
|
|
41.1
|
|
|
|
73.4
|
|
|
|
29.6
|
|
|
|
—
|
|
|
|
144.1
|
|
|
Pawn service fees and sales
|
|
|
—
|
|
|
|
—
|
|
|
|
48.0
|
|
|
|
—
|
|
|
|
48.0
|
|
|
Money transfer fees
|
|
|
4.8
|
|
|
|
19.2
|
|
|
|
8.1
|
|
|
|
—
|
|
|
|
32.1
|
|
|
Gold sales
|
|
|
2.5
|
|
|
|
14.7
|
|
|
|
29.3
|
|
|
|
—
|
|
|
|
46.5
|
|
|
Other
|
|
|
12.2
|
|
|
|
32.6
|
|
|
|
22.0
|
|
|
|
21.7
|
|
|
|
88.5
|
|
|
|
|
|
|
|
|
|
|
|
|
|
|
|
|
|
|
|
|
|
|
|
|
Total sales to unaffiliated customers
|
|
|
122.2
|
|
|
|
310.6
|
|
|
|
333.9
|
|
|
|
21.7
|
|
|
|
788.4
|
|
|
Provision for loan losses
|
|
|
7.4
|
|
|
|
19.8
|
|
|
|
46.4
|
|
|
|
—
|
|
|
|
73.6
|
|
|
Depreciation and amortization
|
|
|
2.6
|
|
|
|
7.7
|
|
|
|
12.7
|
|
|
|
8.4
|
|
|
|
31.4
|
|
|
Interest expense, net
|
|
|
—
|
|
|
|
65.2
|
|
|
|
8.2
|
|
|
|
17.4
|
|
|
|
90.8
|
|
|
Unrealized foreign exchange (gain) loss
|
|
|
—
|
|
|
|
(51.7
|
)
|
|
|
2.0
|
|
|
|
2.7
|
|
|
|
(47.0
|
)
|
|
Loss on derivatives not designated as hedges
|
|
|
—
|
|
|
|
39.3
|
|
|
|
—
|
|
|
|
—
|
|
|
|
39.3
|
|
|
(Proceeds from) provision for litigation settlements
|
|
|
—
|
|
|
|
(3.9
|
)
|
|
|
—
|
|
|
|
0.2
|
|
|
|
(3.7
|
)
|
|
Loss (gain) on store closings
|
|
|
0.4
|
|
|
|
0.5
|
|
|
|
0.1
|
|
|
|
(0.1
|
)
|
|
|
0.9
|
|
|
Other (income) expense, net
|
|
|
(0.8
|
)
|
|
|
(2.3
|
)
|
|
|
7.0
|
|
|
|
1.9
|
|
|
|
5.8
|
|
|
Income (loss) before income taxes
|
|
|
11.2
|
|
|
|
59.8
|
|
|
|
53.3
|
|
|
|
(21.9
|
)
|
|
|
102.4
|
|
|
Income tax provision
|
|
|
5.7
|
|
|
|
13.4
|
|
|
|
17.9
|
|
|
|
0.1
|
|
|
|
37.1
|
|
|
|
|
20.
|
Subsidiary
Guarantor Financial Information
|
National Money Mart Company’s payment obligations under its
10.375% Senior Notes due 2016 are jointly and severally
guaranteed (such guarantees, the “Guarantees”) on a
full and unconditional basis by DFC and certain of its direct
and indirect wholly owned U.S. and Canadian subsidiaries
(the “Guarantors”).
The Guarantees of the 2016 Notes will:
|
|
|
| |
•
|
be senior unsecured obligations of the applicable Guarantor;
|
| |
| |
•
|
rank equal in right or payment with existing and future
unsubordinated indebtedness of the applicable Guarantor;
|
| |
| |
•
|
rank senior in right of payment to all existing and future
subordinated indebtedness of the applicable Guarantor; and
|
| |
| |
•
|
be effectively junior to an indebtedness of such Guarantor,
including indebtedness under the Company’s Global Revolving
Credit Facility, which is secured by assets of such Guarantor to
the extent of the value of the assets securing such Indebtedness.
|
Separate financial statements of each subsidiary Guarantor have
not been presented because they are not required by securities
laws and management has determined that they would not be
material to investors. The accompanying tables set forth the
condensed consolidating balance sheets at June 30, 2011 and
June 30, 2010
115
DFC
GLOBAL CORP.
NOTES TO
CONSOLIDATED FINANCIAL
STATEMENTS — (Continued)
|
|
|
20.
|
Subsidiary
Guarantor Financial Information (continued)
|
and the condensed consolidating statements of operations and
cash flows for the years ended June 30, 2011, 2010 and 2009
of DFC Global Corp., National Money Mart Company, the combined
Guarantors, the combined Non-Guarantors and the consolidated
Company.
Consolidating
Condensed Statements Of Operations
Twelve Months ended June 30, 2009
| |
|
|
|
|
|
|
|
|
|
|
|
|
|
|
|
|
|
|
|
|
|
|
|
|
|
|
|
DFC
|
|
|
National
|
|
|
DFG
|
|
|
|
|
|
|
|
|
|
|
|
|
|
Global
|
|
|
Money
|
|
|
and
|
|
|
Non-
|
|
|
|
|
|
|
|
|
|
|
Corp.
|
|
|
Mart
|
|
|
Guarantors
|
|
|
Guarantors
|
|
|
Eliminations
|
|
|
Consolidated
|
|
|
|
|
(In millions)
|
|
|
|
|
Revenues:
|
|
|
|
|
|
|
|
|
|
|
|
|
|
|
|
|
|
|
|
|
|
|
|
|
|
Consumer lending
|
|
$
|
—
|
|
|
$
|
121.5
|
|
|
$
|
79.6
|
|
|
$
|
65.4
|
|
|
$
|
—
|
|
|
$
|
266.5
|
|
|
Check cashing
|
|
|
—
|
|
|
|
67.8
|
|
|
|
56.4
|
|
|
|
40.4
|
|
|
|
—
|
|
|
|
164.6
|
|
|
Other
|
|
|
—
|
|
|
|
47.0
|
|
|
|
16.9
|
|
|
|
35.2
|
|
|
|
—
|
|
|
|
99.1
|
|
|
|
|
|
|
|
|
|
|
|
|
|
|
|
|
|
|
|
|
|
|
|
|
|
|
|
|
Total revenues
|
|
|
—
|
|
|
|
236.3
|
|
|
|
152.9
|
|
|
|
141.0
|
|
|
|
—
|
|
|
|
530.2
|
|
|
|
|
|
|
|
|
|
|
|
|
|
|
|
|
|
|
|
|
|
|
|
|
|
|
|
|
Operating expenses:
|
|
|
|
|
|
|
|
|
|
|
|
|
|
|
|
|
|
|
|
|
|
|
|
|
|
Salaries and benefits
|
|
|
—
|
|
|
|
51.7
|
|
|
|
58.6
|
|
|
|
35.4
|
|
|
|
—
|
|
|
|
145.7
|
|
|
Provision for loan losses
|
|
|
—
|
|
|
|
23.2
|
|
|
|
20.8
|
|
|
|
8.1
|
|
|
|
—
|
|
|
|
52.1
|
|
|
Occupancy
|
|
|
—
|
|
|
|
14.5
|
|
|
|
16.3
|
|
|
|
11.0
|
|
|
|
—
|
|
|
|
41.8
|
|
|
Depreciation
|
|
|
—
|
|
|
|
4.7
|
|
|
|
4.2
|
|
|
|
4.2
|
|
|
|
—
|
|
|
|
13.1
|
|
|
Other
|
|
|
—
|
|
|
|
37.9
|
|
|
|
29.9
|
|
|
|
27.9
|
|
|
|
—
|
|
|
|
95.7
|
|
|
|
|
|
|
|
|
|
|
|
|
|
|
|
|
|
|
|
|
|
|
|
|
|
|
|
|
Total operating expenses
|
|
|
—
|
|
|
|
132.0
|
|
|
|
129.8
|
|
|
|
86.6
|
|
|
|
—
|
|
|
|
348.4
|
|
|
|
|
|
|
|
|
|
|
|
|
|
|
|
|
|
|
|
|
|
|
|
|
|
|
|
|
Operating margin
|
|
|
—
|
|
|
|
104.3
|
|
|
|
23.1
|
|
|
|
54.4
|
|
|
|
—
|
|
|
|
181.8
|
|
|
|
|
|
|
|
|
|
|
|
|
|
|
|
|
|
|
|
|
|
|
|
|
|
|
|
|
Corporate and other expenses:
|
|
|
|
|
|
|
|
|
|
|
|
|
|
|
|
|
|
|
|
|
|
|
|
|
|
Corporate expenses
|
|
|
—
|
|
|
|
16.3
|
|
|
|
39.5
|
|
|
|
12.4
|
|
|
|
—
|
|
|
|
68.2
|
|
|
Intercompany charges
|
|
|
(5.3
|
)
|
|
|
7.4
|
|
|
|
(8.8
|
)
|
|
|
6.7
|
|
|
|
—
|
|
|
|
—
|
|
|
Other depreciation and amortization
|
|
|
—
|
|
|
|
1.2
|
|
|
|
1.2
|
|
|
|
1.4
|
|
|
|
—
|
|
|
|
3.8
|
|
|
Interest expense, net
|
|
|
15.5
|
|
|
|
16.5
|
|
|
|
5.1
|
|
|
|
6.6
|
|
|
|
—
|
|
|
|
43.7
|
|
|
Unrealized foreign exchange gain
|
|
|
—
|
|
|
|
—
|
|
|
|
—
|
|
|
|
(5.5
|
)
|
|
|
—
|
|
|
|
(5.5
|
)
|
|
Provision for litigation settlements
|
|
|
—
|
|
|
|
57.5
|
|
|
|
0.3
|
|
|
|
0.1
|
|
|
|
—
|
|
|
|
57.9
|
|
|
Loss on store closings
|
|
|
—
|
|
|
|
3.0
|
|
|
|
6.9
|
|
|
|
0.4
|
|
|
|
—
|
|
|
|
10.3
|
|
|
Other income, net
|
|
|
—
|
|
|
|
(1.8
|
)
|
|
|
(1.7
|
)
|
|
|
(1.3
|
)
|
|
|
—
|
|
|
|
(4.8
|
)
|
|
|
|
|
|
|
|
|
|
|
|
|
|
|
|
|
|
|
|
|
|
|
|
|
|
|
|
(Loss) income before income taxes
|
|
|
(10.2
|
)
|
|
|
4.2
|
|
|
|
(19.4
|
)
|
|
|
33.6
|
|
|
|
—
|
|
|
|
8.2
|
|
|
Income tax provision
|
|
|
—
|
|
|
|
—
|
|
|
|
5.1
|
|
|
|
9.9
|
|
|
|
—
|
|
|
|
15.0
|
|
|
|
|
|
|
|
|
|
|
|
|
|
|
|
|
|
|
|
|
|
|
|
|
|
|
|
|
Net (loss) income
|
|
|
(10.2
|
)
|
|
|
4.2
|
|
|
|
(24.5
|
)
|
|
|
23.7
|
|
|
|
—
|
|
|
|
(6.8
|
)
|
|
Equity in net (loss) income of subsidiaries:
|
|
|
|
|
|
|
|
|
|
|
|
|
|
|
|
|
|
|
|
|
|
|
|
|
|
National Money Mart Company
|
|
|
4.2
|
|
|
|
—
|
|
|
|
—
|
|
|
|
—
|
|
|
|
(4.2
|
)
|
|
|
—
|
|
|
Guarantors
|
|
|
(24.5
|
)
|
|
|
—
|
|
|
|
—
|
|
|
|
—
|
|
|
|
24.5
|
|
|
|
—
|
|
|
Non-guarantors
|
|
|
23.7
|
|
|
|
—
|
|
|
|
—
|
|
|
|
—
|
|
|
|
(23.7
|
)
|
|
|
—
|
|
|
|
|
|
|
|
|
|
|
|
|
|
|
|
|
|
|
|
|
|
|
|
|
|
|
|
|
Net (loss) income attributable to DFC Global Corp.
|
|
$
|
(6.8
|
)
|
|
$
|
4.2
|
|
|
$
|
(24.5
|
)
|
|
$
|
23.7
|
|
|
$
|
(3.4
|
)
|
|
$
|
(6.8
|
)
|
|
|
|
|
|
|
|
|
|
|
|
|
|
|
|
|
|
|
|
|
|
|
|
|
|
|
116
DFC
GLOBAL CORP.
NOTES TO
CONSOLIDATED FINANCIAL
STATEMENTS — (Continued)
|
|
|
20.
|
Subsidiary
Guarantor Financial Information (continued)
|
Consolidating
Condensed Statements Of Cash Flows
Year Ended June 30, 2009
| |
|
|
|
|
|
|
|
|
|
|
|
|
|
|
|
|
|
|
|
|
|
|
|
|
|
|
|
DFC
|
|
|
National
|
|
|
DFG
|
|
|
|
|
|
|
|
|
|
|
|
|
|
Global
|
|
|
Money
|
|
|
and
|
|
|
Non-
|
|
|
|
|
|
|
|
|
|
|
Corp.
|
|
|
Mart
|
|
|
Guarantors
|
|
|
Guarantors
|
|
|
Eliminations
|
|
|
Consolidated
|
|
|
|
|
(In millions)
|
|
|
|
|
Cash flows from operating activities:
|
|
|
|
|
|
|
|
|
|
|
|
|
|
|
|
|
|
|
|
|
|
|
|
|
|
Net (loss) income
|
|
$
|
(6.8
|
)
|
|
|
4.2
|
|
|
|
(24.5
|
)
|
|
|
23.7
|
|
|
|
(3.4
|
)
|
|
$
|
(6.8
|
)
|
|
Adjustments to reconcile net (loss) income to net cash provided
by operating activities:
|
|
|
|
|
|
|
|
|
|
|
|
|
|
|
|
|
|
|
|
|
|
|
|
|
|
Undistributed income of subsidiaries
|
|
|
(3.4
|
)
|
|
|
—
|
|
|
|
—
|
|
|
|
—
|
|
|
|
3.4
|
|
|
|
—
|
|
|
Depreciation and amortization
|
|
|
0.9
|
|
|
|
7.1
|
|
|
|
5.9
|
|
|
|
6.0
|
|
|
|
|
|
|
|
19.9
|
|
|
Provision for loan losses
|
|
|
—
|
|
|
|
23.2
|
|
|
|
20.8
|
|
|
|
8.1
|
|
|
|
—
|
|
|
|
52.1
|
|
|
Non-cash stock compensation
|
|
|
6.4
|
|
|
|
—
|
|
|
|
—
|
|
|
|
—
|
|
|
|
—
|
|
|
|
6.4
|
|
|
Losses on disposal of fixed assets
|
|
|
—
|
|
|
|
1.2
|
|
|
|
1.7
|
|
|
|
0.3
|
|
|
|
—
|
|
|
|
3.2
|
|
|
Unrealized foreign exchange gain
|
|
|
—
|
|
|
|
—
|
|
|
|
—
|
|
|
|
(5.5
|
)
|
|
|
—
|
|
|
|
(5.5
|
)
|
|
Deferred tax (benefit) provision
|
|
|
—
|
|
|
|
(15.2
|
)
|
|
|
4.9
|
|
|
|
(0.2
|
)
|
|
|
—
|
|
|
|
(10.5
|
)
|
|
Accretion of debt discount and deferred issuance costs
|
|
|
8.9
|
|
|
|
—
|
|
|
|
—
|
|
|
|
—
|
|
|
|
—
|
|
|
|
8.9
|
|
|
Change in assets and liabilities (net of effect of acquisitions):
|
|
|
|
|
|
|
|
|
|
|
|
|
|
|
|
|
|
|
|
|
|
|
|
|
|
Increase in loans and other receivables
|
|
|
—
|
|
|
|
(16.1
|
)
|
|
|
(14.7
|
)
|
|
|
(13.5
|
)
|
|
|
—
|
|
|
|
(44.3
|
)
|
|
(Increase) decrease in prepaid expenses and other
|
|
|
—
|
|
|
|
(13.5
|
)
|
|
|
(1.4
|
)
|
|
|
(12.1
|
)
|
|
|
21.4
|
|
|
|
(5.6
|
)
|
|
Provision for litigation settlements
|
|
|
—
|
|
|
|
49.2
|
|
|
|
—
|
|
|
|
—
|
|
|
|
—
|
|
|
|
49.2
|
|
|
(Decrease) increase in accounts payable, accrued expenses and
other liabilities
|
|
|
—
|
|
|
|
(17.0
|
)
|
|
|
21.9
|
|
|
|
8.7
|
|
|
|
(21.4
|
)
|
|
|
(7.8
|
)
|
|
|
|
|
|
|
|
|
|
|
|
|
|
|
|
|
|
|
|
|
|
|
|
|
|
|
|
Net cash provided by operating activities
|
|
|
6.0
|
|
|
|
23.1
|
|
|
|
14.6
|
|
|
|
15.5
|
|
|
|
—
|
|
|
|
59.2
|
|
|
Cash flows from investing activities:
|
|
|
|
|
|
|
|
|
|
|
|
|
|
|
|
|
|
|
|
|
|
|
|
|
|
Acquisitions, net of cash acquired
|
|
|
—
|
|
|
|
(0.1
|
)
|
|
|
(0.1
|
)
|
|
|
(26.0
|
)
|
|
|
—
|
|
|
|
(26.2
|
)
|
|
Additions to property and equipment
|
|
|
—
|
|
|
|
(2.9
|
)
|
|
|
(3.8
|
)
|
|
|
(9.1
|
)
|
|
|
—
|
|
|
|
(15.8
|
)
|
|
Net (increase) decrease in due from affiliates
|
|
|
(2.0
|
)
|
|
|
13.0
|
|
|
|
(30.4
|
)
|
|
|
19.4
|
|
|
|
—
|
|
|
|
—
|
|
|
|
|
|
|
|
|
|
|
|
|
|
|
|
|
|
|
|
|
|
|
|
|
|
|
|
|
Net cash (used in) provided by investing activities
|
|
|
(2.0
|
)
|
|
|
10.0
|
|
|
|
(34.3
|
)
|
|
|
(15.7
|
)
|
|
|
—
|
|
|
|
(42.0
|
)
|
|
Cash flows from financing activities:
|
|
|
|
|
|
|
|
|
|
|
|
|
|
|
|
|
|
|
|
|
|
|
|
|
|
Proceeds from termination of cross currency swaps
|
|
|
—
|
|
|
|
—
|
|
|
|
—
|
|
|
|
14.4
|
|
|
|
—
|
|
|
|
14.4
|
|
|
Proceeds from the exercise of stock options
|
|
|
3.3
|
|
|
|
—
|
|
|
|
—
|
|
|
|
—
|
|
|
|
—
|
|
|
|
3.3
|
|
|
Purchase of company stock
|
|
|
(7.5
|
)
|
|
|
—
|
|
|
|
—
|
|
|
|
—
|
|
|
|
—
|
|
|
|
(7.5
|
)
|
|
Other debt payments
|
|
|
—
|
|
|
|
(2.9
|
)
|
|
|
—
|
|
|
|
(0.7
|
)
|
|
|
—
|
|
|
|
(3.6
|
)
|
|
Net increase in revolving credit facilities
|
|
|
—
|
|
|
|
—
|
|
|
|
—
|
|
|
|
(3.8
|
)
|
|
|
—
|
|
|
|
(3.8
|
)
|
|
Payment of debt issuance and other costs
|
|
|
—
|
|
|
|
—
|
|
|
|
(0.1
|
)
|
|
|
—
|
|
|
|
—
|
|
|
|
(0.1
|
)
|
|
|
|
|
|
|
|
|
|
|
|
|
|
|
|
|
|
|
|
|
|
|
|
|
|
|
|
Net cash (used in) provided by financing activities
|
|
|
(4.2
|
)
|
|
|
(2.9
|
)
|
|
|
(0.1
|
)
|
|
|
9.9
|
|
|
|
—
|
|
|
|
2.7
|
|
|
Effect of exchange rate changes on cash and cash equivalents
|
|
|
—
|
|
|
|
(11.2
|
)
|
|
|
—
|
|
|
|
(8.8
|
)
|
|
|
—
|
|
|
|
(20.0
|
)
|
|
|
|
|
|
|
|
|
|
|
|
|
|
|
|
|
|
|
|
|
|
|
|
|
|
|
|
Net (decrease) increase in cash and cash equivalents
|
|
|
(0.2
|
)
|
|
|
19.0
|
|
|
|
(19.8
|
)
|
|
|
0.9
|
|
|
|
—
|
|
|
|
(0.1
|
)
|
|
Cash and cash equivalents balance-beginning of period
|
|
|
0.3
|
|
|
|
119.4
|
|
|
|
50.1
|
|
|
|
39.9
|
|
|
|
—
|
|
|
|
209.7
|
|
|
|
|
|
|
|
|
|
|
|
|
|
|
|
|
|
|
|
|
|
|
|
|
|
|
|
|
Cash and cash equivalents balance-end of period
|
|
$
|
0.1
|
|
|
$
|
138.4
|
|
|
$
|
30.3
|
|
|
$
|
40.8
|
|
|
$
|
—
|
|
|
$
|
209.6
|
|
|
|
|
|
|
|
|
|
|
|
|
|
|
|
|
|
|
|
|
|
|
|
|
|
|
|
117
DFC
GLOBAL CORP.
NOTES TO
CONSOLIDATED FINANCIAL
STATEMENTS — (Continued)
|
|
|
20.
|
Subsidiary
Guarantor Financial Information (continued)
|
Consolidating
Condensed Balance Sheets
June 30, 2010
| |
|
|
|
|
|
|
|
|
|
|
|
|
|
|
|
|
|
|
|
|
|
|
|
|
|
|
|
DFC
|
|
|
National
|
|
|
DFG
|
|
|
|
|
|
|
|
|
|
|
|
|
|
Global
|
|
|
Money Mart
|
|
|
and
|
|
|
Non-
|
|
|
|
|
|
|
|
|
|
|
Corp.
|
|
|
Company
|
|
|
Guarantors
|
|
|
Guarantors
|
|
|
Eliminations
|
|
|
Consolidated
|
|
|
|
|
(In millions)
|
|
|
|
|
Current Assets
|
|
|
|
|
|
|
|
|
|
|
|
|
|
|
|
|
|
|
|
|
|
|
|
|
|
Cash and cash equivalents
|
|
$
|
5.4
|
|
|
$
|
218.6
|
|
|
$
|
18.3
|
|
|
$
|
49.0
|
|
|
$
|
—
|
|
|
$
|
291.3
|
|
|
Consumer loans, net
|
|
|
—
|
|
|
|
29.8
|
|
|
|
20.9
|
|
|
|
50.2
|
|
|
|
—
|
|
|
|
100.9
|
|
|
Pawn loans
|
|
|
—
|
|
|
|
—
|
|
|
|
—
|
|
|
|
35.5
|
|
|
|
—
|
|
|
|
35.5
|
|
|
Loans in default, net
|
|
|
—
|
|
|
|
6.1
|
|
|
|
0.6
|
|
|
|
2.6
|
|
|
|
—
|
|
|
|
9.3
|
|
|
Other receivables
|
|
|
0.4
|
|
|
|
9.8
|
|
|
|
1.8
|
|
|
|
6.8
|
|
|
|
(1.7
|
)
|
|
|
17.1
|
|
|
Prepaid expenses and other current assets
|
|
|
—
|
|
|
|
7.5
|
|
|
|
3.6
|
|
|
|
18.6
|
|
|
|
(2.9
|
)
|
|
|
26.8
|
|
|
|
|
|
|
|
|
|
|
|
|
|
|
|
|
|
|
|
|
|
|
|
|
|
|
|
|
Total current assets
|
|
|
5.8
|
|
|
|
271.8
|
|
|
|
45.2
|
|
|
|
162.7
|
|
|
|
(4.6
|
)
|
|
|
480.9
|
|
|
Deferred tax asset, net of valuation allowance
|
|
|
—
|
|
|
|
22.5
|
|
|
|
—
|
|
|
|
0.1
|
|
|
|
—
|
|
|
|
22.6
|
|
|
Intercompany receivables
|
|
|
253.0
|
|
|
|
41.6
|
|
|
|
—
|
|
|
|
—
|
|
|
|
(294.6
|
)
|
|
|
—
|
|
|
Property and equipment, net
|
|
|
—
|
|
|
|
27.5
|
|
|
|
14.4
|
|
|
|
25.6
|
|
|
|
—
|
|
|
|
67.5
|
|
|
Goodwill and other intangibles
|
|
|
—
|
|
|
|
182.1
|
|
|
|
206.6
|
|
|
|
220.3
|
|
|
|
—
|
|
|
|
609.0
|
|
|
Debt issuance costs, net
|
|
|
1.5
|
|
|
|
14.7
|
|
|
|
2.4
|
|
|
|
0.1
|
|
|
|
—
|
|
|
|
18.7
|
|
|
Investment in subsidiaries
|
|
|
82.4
|
|
|
|
285.9
|
|
|
|
103.1
|
|
|
|
—
|
|
|
|
(471.4
|
)
|
|
|
—
|
|
|
Other
|
|
|
—
|
|
|
|
0.7
|
|
|
|
12.2
|
|
|
|
3.0
|
|
|
|
—
|
|
|
|
15.9
|
|
|
|
|
|
|
|
|
|
|
|
|
|
|
|
|
|
|
|
|
|
|
|
|
|
|
|
|
Total Assets
|
|
$
|
342.7
|
|
|
$
|
846.8
|
|
|
$
|
383.9
|
|
|
$
|
411.8
|
|
|
$
|
(770.6
|
)
|
|
$
|
1,214.6
|
|
|
|
|
|
|
|
|
|
|
|
|
|
|
|
|
|
|
|
|
|
|
|
|
|
|
|
|
Current Liabilities
|
|
|
|
|
|
|
|
|
|
|
|
|
|
|
|
|
|
|
|
|
|
|
|
|
|
Accounts payable
|
|
$
|
0.3
|
|
|
$
|
14.2
|
|
|
$
|
11.8
|
|
|
$
|
18.5
|
|
|
$
|
—
|
|
|
$
|
44.8
|
|
|
Income taxes payable
|
|
|
—
|
|
|
|
—
|
|
|
|
1.0
|
|
|
|
6.9
|
|
|
|
(1.7
|
)
|
|
|
6.2
|
|
|
Accrued expenses and other liabilities
|
|
|
0.9
|
|
|
|
50.3
|
|
|
|
27.8
|
|
|
|
15.4
|
|
|
|
(1.8
|
)
|
|
|
92.6
|
|
|
Debt due within one year
|
|
|
—
|
|
|
|
—
|
|
|
|
—
|
|
|
|
3.3
|
|
|
|
—
|
|
|
|
3.3
|
|
|
Current deferred tax liability
|
|
|
—
|
|
|
|
—
|
|
|
|
—
|
|
|
|
0.3
|
|
|
|
—
|
|
|
|
0.3
|
|
|
|
|
|
|
|
|
|
|
|
|
|
|
|
|
|
|
|
|
|
|
|
|
|
|
|
|
Total current liabilities
|
|
|
1.2
|
|
|
|
64.5
|
|
|
|
40.6
|
|
|
|
44.4
|
|
|
|
(3.5
|
)
|
|
|
147.2
|
|
|
Fair value of derivatives
|
|
|
—
|
|
|
|
47.4
|
|
|
|
—
|
|
|
|
—
|
|
|
|
—
|
|
|
|
47.4
|
|
|
Long-term deferred tax liability
|
|
|
—
|
|
|
|
6.7
|
|
|
|
17.3
|
|
|
|
—
|
|
|
|
—
|
|
|
|
24.0
|
|
|
Long-term debt
|
|
|
123.2
|
|
|
|
596.7
|
|
|
|
—
|
|
|
|
5.4
|
|
|
|
—
|
|
|
|
725.3
|
|
|
Intercompany payables
|
|
|
—
|
|
|
|
—
|
|
|
|
232.5
|
|
|
|
62.2
|
|
|
|
(294.7
|
)
|
|
|
—
|
|
|
Other non-current liabilities
|
|
|
—
|
|
|
|
40.6
|
|
|
|
10.0
|
|
|
|
1.8
|
|
|
|
—
|
|
|
|
52.4
|
|
|
|
|
|
|
|
|
|
|
|
|
|
|
|
|
|
|
|
|
|
|
|
|
|
|
|
|
Total liabilities
|
|
|
124.4
|
|
|
|
755.9
|
|
|
|
300.4
|
|
|
|
113.8
|
|
|
|
(298.2
|
)
|
|
|
996.3
|
|
|
|
|
|
|
|
|
|
|
|
|
|
|
|
|
|
|
|
|
|
|
|
|
|
|
|
|
Total DFC Global Corp. stockholders’ equity
|
|
|
218.3
|
|
|
|
90.9
|
|
|
|
83.5
|
|
|
|
298.0
|
|
|
|
(472.4
|
)
|
|
|
218.3
|
|
|
|
|
|
|
|
|
|
|
|
|
|
|
|
|
|
|
|
|
|
|
|
|
|
|
|
|
Total stockholders’ equity
|
|
|
218.3
|
|
|
|
90.9
|
|
|
|
83.5
|
|
|
|
298.0
|
|
|
|
(472.4
|
)
|
|
|
218.3
|
|
|
|
|
|
|
|
|
|
|
|
|
|
|
|
|
|
|
|
|
|
|
|
|
|
|
|
|
Total Liabilities and Stockholders’ Equity
|
|
$
|
342.7
|
|
|
$
|
846.8
|
|
|
$
|
383.9
|
|
|
$
|
411.8
|
|
|
$
|
(770.6
|
)
|
|
$
|
1,214.6
|
|
|
|
|
|
|
|
|
|
|
|
|
|
|
|
|
|
|
|
|
|
|
|
|
|
|
|
118
DFC
GLOBAL CORP.
NOTES TO
CONSOLIDATED FINANCIAL
STATEMENTS — (Continued)
|
|
|
20.
|
Subsidiary
Guarantor Financial Information (continued)
|
Consolidating
Condensed Statements Of Operations
Twelve Months ended June 30, 2010
| |
|
|
|
|
|
|
|
|
|
|
|
|
|
|
|
|
|
|
|
|
|
|
|
|
|
|
|
DFC
|
|
|
National
|
|
|
DFG
|
|
|
|
|
|
|
|
|
|
|
|
|
|
Global
|
|
|
Money Mart
|
|
|
and
|
|
|
Non-
|
|
|
|
|
|
|
|
|
|
|
Corp.
|
|
|
Company
|
|
|
Guarantors
|
|
|
Guarantors
|
|
|
Eliminations
|
|
|
Consolidated
|
|
|
|
|
(In millions)
|
|
|
|
|
Revenues:
|
|
|
|
|
|
|
|
|
|
|
|
|
|
|
|
|
|
|
|
|
|
|
|
|
|
Consumer lending
|
|
$
|
—
|
|
|
$
|
147.9
|
|
|
$
|
65.7
|
|
|
$
|
105.9
|
|
|
$
|
—
|
|
|
$
|
319.5
|
|
|
Check cashing
|
|
|
—
|
|
|
|
69.4
|
|
|
|
46.5
|
|
|
|
33.6
|
|
|
|
—
|
|
|
|
149.5
|
|
|
Other
|
|
|
—
|
|
|
|
59.5
|
|
|
|
15.6
|
|
|
|
89.2
|
|
|
|
—
|
|
|
|
164.3
|
|
|
|
|
|
|
|
|
|
|
|
|
|
|
|
|
|
|
|
|
|
|
|
|
|
|
|
|
Total revenues
|
|
|
—
|
|
|
|
276.8
|
|
|
|
127.8
|
|
|
|
228.7
|
|
|
|
—
|
|
|
|
633.3
|
|
|
|
|
|
|
|
|
|
|
|
|
|
|
|
|
|
|
|
|
|
|
|
|
|
|
|
|
Operating expenses:
|
|
|
|
|
|
|
|
|
|
|
|
|
|
|
|
|
|
|
|
|
|
|
|
|
|
Salaries and benefits
|
|
|
—
|
|
|
|
58.1
|
|
|
|
49.3
|
|
|
|
46.6
|
|
|
|
—
|
|
|
|
154.0
|
|
|
Provision for loan losses
|
|
|
—
|
|
|
|
15.8
|
|
|
|
10.6
|
|
|
|
19.5
|
|
|
|
—
|
|
|
|
45.9
|
|
|
Occupancy
|
|
|
—
|
|
|
|
16.1
|
|
|
|
14.0
|
|
|
|
13.2
|
|
|
|
—
|
|
|
|
43.3
|
|
|
Depreciation
|
|
|
—
|
|
|
|
5.4
|
|
|
|
3.7
|
|
|
|
5.2
|
|
|
|
—
|
|
|
|
14.3
|
|
|
Other
|
|
|
—
|
|
|
|
46.3
|
|
|
|
23.2
|
|
|
|
60.0
|
|
|
|
—
|
|
|
|
129.5
|
|
|
|
|
|
|
|
|
|
|
|
|
|
|
|
|
|
|
|
|
|
|
|
|
|
|
|
|
Total operating expenses
|
|
|
—
|
|
|
|
141.7
|
|
|
|
100.8
|
|
|
|
144.5
|
|
|
|
—
|
|
|
|
387.0
|
|
|
|
|
|
|
|
|
|
|
|
|
|
|
|
|
|
|
|
|
|
|
|
|
|
|
|
|
Operating margin
|
|
|
—
|
|
|
|
135.1
|
|
|
|
27.0
|
|
|
|
84.2
|
|
|
|
—
|
|
|
|
246.3
|
|
|
|
|
|
|
|
|
|
|
|
|
|
|
|
|
|
|
|
|
|
|
|
|
|
|
|
|
Corporate and other expenses:
|
|
|
|
|
|
|
|
|
|
|
|
|
|
|
|
|
|
|
|
|
|
|
|
|
|
Corporate expenses
|
|
|
—
|
|
|
|
20.8
|
|
|
|
50.3
|
|
|
|
15.7
|
|
|
|
—
|
|
|
|
86.8
|
|
|
Intercompany charges
|
|
|
—
|
|
|
|
20.0
|
|
|
|
(30.3
|
)
|
|
|
10.3
|
|
|
|
—
|
|
|
|
—
|
|
|
Other depreciation and amortization
|
|
|
—
|
|
|
|
1.3
|
|
|
|
1.4
|
|
|
|
4.6
|
|
|
|
—
|
|
|
|
7.3
|
|
|
Interest expense, net
|
|
|
15.1
|
|
|
|
47.9
|
|
|
|
1.8
|
|
|
|
4.1
|
|
|
|
—
|
|
|
|
68.9
|
|
|
Loss on extinguishment of debt
|
|
|
0.5
|
|
|
|
3.6
|
|
|
|
0.7
|
|
|
|
4.7
|
|
|
|
—
|
|
|
|
9.5
|
|
|
Unrealized foreign exchange loss (gain)
|
|
|
—
|
|
|
|
2.2
|
|
|
|
(0.1
|
)
|
|
|
8.0
|
|
|
|
—
|
|
|
|
10.1
|
|
|
Loss on derivatives not designated as hedges
|
|
|
—
|
|
|
|
12.9
|
|
|
|
—
|
|
|
|
—
|
|
|
|
—
|
|
|
|
12.9
|
|
|
Provision for litigation settlements
|
|
|
—
|
|
|
|
22.7
|
|
|
|
6.4
|
|
|
|
—
|
|
|
|
—
|
|
|
|
29.1
|
|
|
Loss on store closings
|
|
|
—
|
|
|
|
0.9
|
|
|
|
1.5
|
|
|
|
0.9
|
|
|
|
—
|
|
|
|
3.3
|
|
|
Other expense (income), net
|
|
|
—
|
|
|
|
0.6
|
|
|
|
(139.1
|
)
|
|
|
0.7
|
|
|
|
140.0
|
|
|
|
2.2
|
|
|
|
|
|
|
|
|
|
|
|
|
|
|
|
|
|
|
|
|
|
|
|
|
|
|
|
|
(Loss) income before income taxes
|
|
|
(15.6
|
)
|
|
|
2.2
|
|
|
|
134.4
|
|
|
|
35.2
|
|
|
|
(140.0
|
)
|
|
|
16.2
|
|
|
Income tax (benefit) provision
|
|
|
(0.3
|
)
|
|
|
5.1
|
|
|
|
6.3
|
|
|
|
10.3
|
|
|
|
—
|
|
|
|
21.4
|
|
|
|
|
|
|
|
|
|
|
|
|
|
|
|
|
|
|
|
|
|
|
|
|
|
|
|
|
Net (loss) income
|
|
|
(15.3
|
)
|
|
|
(2.9
|
)
|
|
|
128.1
|
|
|
|
24.9
|
|
|
|
(140.0
|
)
|
|
|
(5.2
|
)
|
|
Less: Net loss attributable to non-controlling interests
|
|
|
—
|
|
|
|
—
|
|
|
|
—
|
|
|
|
(0.3
|
)
|
|
|
—
|
|
|
|
(0.3
|
)
|
|
Equity in net (loss) income of subsidiaries:
|
|
|
|
|
|
|
|
|
|
|
|
|
|
|
|
|
|
|
|
|
|
|
|
|
|
National Money Mart Company
|
|
|
(2.9
|
)
|
|
|
—
|
|
|
|
—
|
|
|
|
—
|
|
|
|
2.9
|
|
|
|
—
|
|
|
Guarantors
|
|
|
128.1
|
|
|
|
—
|
|
|
|
—
|
|
|
|
—
|
|
|
|
(128.1
|
)
|
|
|
—
|
|
|
Non-guarantors
|
|
|
25.2
|
|
|
|
—
|
|
|
|
—
|
|
|
|
—
|
|
|
|
(25.2
|
)
|
|
|
—
|
|
|
|
|
|
|
|
|
|
|
|
|
|
|
|
|
|
|
|
|
|
|
|
|
|
|
|
|
Net (loss) income attributable to DFC Global Corp.
|
|
$
|
135.1
|
|
|
$
|
(2.9
|
)
|
|
$
|
128.1
|
|
|
$
|
25.2
|
|
|
$
|
(290.4
|
)
|
|
$
|
(4.9
|
)
|
|
|
|
|
|
|
|
|
|
|
|
|
|
|
|
|
|
|
|
|
|
|
|
|
|
|
119
DFC
GLOBAL CORP.
NOTES TO
CONSOLIDATED FINANCIAL
STATEMENTS — (Continued)
|
|
|
20.
|
Subsidiary
Guarantor Financial Information (continued)
|
Consolidating
Condensed Statements Of Cash Flows
Twelve Months Ended June 30, 2010
| |
|
|
|
|
|
|
|
|
|
|
|
|
|
|
|
|
|
|
|
|
|
|
|
|
|
|
|
DFC
|
|
|
National
|
|
|
DFG
|
|
|
|
|
|
|
|
|
|
|
|
|
|
Global
|
|
|
Money Mart
|
|
|
and
|
|
|
Non-
|
|
|
|
|
|
|
|
|
|
|
Corp.
|
|
|
Company
|
|
|
Guarantors
|
|
|
Guarantors
|
|
|
Eliminations
|
|
|
Consolidated
|
|
|
|
|
(In millions)
|
|
|
|
|
Cash flows from operating activities:
|
|
|
|
|
|
|
|
|
|
|
|
|
|
|
|
|
|
|
|
|
|
|
|
|
|
Net income
|
|
$
|
135.1
|
|
|
$
|
(2.9
|
)
|
|
$
|
128.1
|
|
|
$
|
24.9
|
|
|
$
|
(290.4
|
)
|
|
$
|
(5.2
|
)
|
|
Adjustments to reconcile net income to net cash provided by
(used in) operating activities:
|
|
|
|
|
|
|
|
|
|
|
|
|
|
|
|
|
|
|
|
|
|
|
|
|
|
Undistributed income of subsidiaries
|
|
|
(150.4
|
)
|
|
|
—
|
|
|
|
—
|
|
|
|
—
|
|
|
|
150.4
|
|
|
|
—
|
|
|
Depreciation and amortization
|
|
|
0.6
|
|
|
|
8.6
|
|
|
|
5.9
|
|
|
|
9.9
|
|
|
|
—
|
|
|
|
25.0
|
|
|
Loss on extinguishment of debt
|
|
|
0.5
|
|
|
|
3.6
|
|
|
|
0.7
|
|
|
|
4.7
|
|
|
|
|
|
|
|
9.5
|
|
|
Change in fair value of derivatives not designated as hedges
|
|
|
—
|
|
|
|
3.6
|
|
|
|
—
|
|
|
|
—
|
|
|
|
|
|
|
|
3.6
|
|
|
Provision for loan losses
|
|
|
—
|
|
|
|
15.8
|
|
|
|
10.5
|
|
|
|
19.6
|
|
|
|
—
|
|
|
|
45.9
|
|
|
Non-cash stock compensation
|
|
|
5.8
|
|
|
|
—
|
|
|
|
—
|
|
|
|
—
|
|
|
|
—
|
|
|
|
5.8
|
|
|
Losses on disposal of fixed assets
|
|
|
—
|
|
|
|
0.3
|
|
|
|
0.8
|
|
|
|
0.1
|
|
|
|
—
|
|
|
|
1.2
|
|
|
Unrealized foreign exchange (gain) loss
|
|
|
—
|
|
|
|
1.9
|
|
|
|
(0.1
|
)
|
|
|
8.1
|
|
|
|
—
|
|
|
|
9.9
|
|
|
Deferred tax provision
|
|
|
—
|
|
|
|
0.1
|
|
|
|
5.2
|
|
|
|
(4.6
|
)
|
|
|
—
|
|
|
|
0.7
|
|
|
Accretion of debt discount and deferred issuance costs
|
|
|
8.9
|
|
|
|
3.6
|
|
|
|
0.1
|
|
|
|
0.8
|
|
|
|
—
|
|
|
|
13.4
|
|
|
Change in assets and liabilities (net of effect of acquisitions):
|
|
|
|
|
|
|
|
|
|
|
|
|
|
|
|
|
|
|
|
|
|
|
|
|
|
(Increase) in loans and other receivables
|
|
|
—
|
|
|
|
(20.2
|
)
|
|
|
(9.9
|
)
|
|
|
(36.9
|
)
|
|
|
0.3
|
|
|
|
(66.7
|
)
|
|
Decrease (increase) in prepaid expenses and other
|
|
|
—
|
|
|
|
10.6
|
|
|
|
(2.2
|
)
|
|
|
6.5
|
|
|
|
(18.5
|
)
|
|
|
(3.6
|
)
|
|
Provision for litigation settlements
|
|
|
|
|
|
|
19.8
|
|
|
|
—
|
|
|
|
4.8
|
|
|
|
|
|
|
|
24.6
|
|
|
Increase (decrease) in accounts payable, accrued expenses and
other liabilities
|
|
|
1.2
|
|
|
|
4.4
|
|
|
|
(7.8
|
)
|
|
|
6.6
|
|
|
|
18.2
|
|
|
|
22.6
|
|
|
|
|
|
|
|
|
|
|
|
|
|
|
|
|
|
|
|
|
|
|
|
|
|
|
|
|
Net cash provided by (used in) operating activities
|
|
|
1.7
|
|
|
|
49.2
|
|
|
|
131.3
|
|
|
|
44.5
|
|
|
|
(140.0
|
)
|
|
|
86.7
|
|
|
Cash flows from investing activities:
|
|
|
|
|
|
|
|
|
|
|
|
|
|
|
|
|
|
|
|
|
|
|
|
|
|
Acquisitions, net cash acquired
|
|
|
—
|
|
|
|
—
|
|
|
|
(0.3
|
)
|
|
|
(154.7
|
)
|
|
|
—
|
|
|
|
(155.0
|
)
|
|
Additions to property and equipment
|
|
|
—
|
|
|
|
(7.4
|
)
|
|
|
(6.7
|
)
|
|
|
(15.3
|
)
|
|
|
—
|
|
|
|
(29.4
|
)
|
|
Net decrease (increase) in due from affiliates
|
|
|
36.3
|
|
|
|
(270.6
|
)
|
|
|
(134.5
|
)
|
|
|
228.8
|
|
|
|
140.0
|
|
|
|
—
|
|
|
|
|
|
|
|
|
|
|
|
|
|
|
|
|
|
|
|
|
|
|
|
|
|
|
|
|
Net cash provided by (used in) investing activities
|
|
|
36.3
|
|
|
|
(278.0
|
)
|
|
|
(141.5
|
)
|
|
|
58.8
|
|
|
|
140.0
|
|
|
|
(184.4
|
)
|
|
Cash flows from financing activities:
|
|
|
|
|
|
|
|
|
|
|
|
|
|
|
|
|
|
|
|
|
|
|
|
|
|
Proceeds from sale of 10.375% Senior Notes due 2016
|
|
|
—
|
|
|
|
596.4
|
|
|
|
—
|
|
|
|
—
|
|
|
|
—
|
|
|
|
596.4
|
|
|
Proceeds from exercise of stock options
|
|
|
1.5
|
|
|
|
—
|
|
|
|
—
|
|
|
|
—
|
|
|
|
—
|
|
|
|
1.5
|
|
|
Repayment of term loan notes
|
|
|
—
|
|
|
|
(286.7
|
)
|
|
|
—
|
|
|
|
(82.5
|
)
|
|
|
—
|
|
|
|
(369.2
|
)
|
|
Other debt payments
|
|
|
—
|
|
|
|
—
|
|
|
|
—
|
|
|
|
(7.0
|
)
|
|
|
—
|
|
|
|
(7.0
|
)
|
|
Repurchase of convertible debt
|
|
|
(32.0
|
)
|
|
|
—
|
|
|
|
—
|
|
|
|
—
|
|
|
|
—
|
|
|
|
(32.0
|
)
|
|
Payment of debt issuance and other costs
|
|
|
(2.2
|
)
|
|
|
(15.8
|
)
|
|
|
(1.8
|
)
|
|
|
(0.1
|
)
|
|
|
—
|
|
|
|
(19.9
|
)
|
|
|
|
|
|
|
|
|
|
|
|
|
|
|
|
|
|
|
|
|
|
|
|
|
|
|
|
Net cash (used in) provided by financing activities
|
|
|
(32.7
|
)
|
|
|
293.9
|
|
|
|
(1.8
|
)
|
|
|
(89.6
|
)
|
|
|
—
|
|
|
|
169.8
|
|
|
Effect of exchange rate changes on cash and cash equivalents
|
|
|
—
|
|
|
|
15.1
|
|
|
|
—
|
|
|
|
(5.5
|
)
|
|
|
—
|
|
|
|
9.6
|
|
|
|
|
|
|
|
|
|
|
|
|
|
|
|
|
|
|
|
|
|
|
|
|
|
|
|
|
Net increase (decrease) in cash and cash equivalents
|
|
|
5.3
|
|
|
|
80.2
|
|
|
|
(12.0
|
)
|
|
|
8.2
|
|
|
|
—
|
|
|
|
81.7
|
|
|
Cash and cash equivalents balance-beginning of period
|
|
|
0.1
|
|
|
|
138.4
|
|
|
|
30.3
|
|
|
|
40.8
|
|
|
|
—
|
|
|
|
209.6
|
|
|
|
|
|
|
|
|
|
|
|
|
|
|
|
|
|
|
|
|
|
|
|
|
|
|
|
|
Cash and cash equivalents balance-end of period
|
|
$
|
5.4
|
|
|
$
|
218.6
|
|
|
$
|
18.3
|
|
|
$
|
49.0
|
|
|
$
|
—
|
|
|
$
|
291.3
|
|
|
|
|
|
|
|
|
|
|
|
|
|
|
|
|
|
|
|
|
|
|
|
|
|
|
|
120
DFC
GLOBAL CORP.
NOTES TO
CONSOLIDATED FINANCIAL
STATEMENTS — (Continued)
|
|
|
20.
|
Subsidiary
Guarantor Financial Information (continued)
|
Consolidating
Condensed Balance Sheets
June 30, 2011
| |
|
|
|
|
|
|
|
|
|
|
|
|
|
|
|
|
|
|
|
|
|
|
|
|
|
|
|
DFC
|
|
|
National
|
|
|
DFG
|
|
|
|
|
|
|
|
|
|
|
|
|
|
Global
|
|
|
Money Mart
|
|
|
and
|
|
|
Non-
|
|
|
|
|
|
|
|
|
|
|
Corp.
|
|
|
Company
|
|
|
Guarantors
|
|
|
Guarantors
|
|
|
Eliminations
|
|
|
Consolidated
|
|
|
|
|
(In millions)
|
|
|
|
|
Current Assets
|
|
|
|
|
|
|
|
|
|
|
|
|
|
|
|
|
|
|
|
|
|
|
|
|
|
Cash and cash equivalents
|
|
$
|
—
|
|
|
$
|
95.2
|
|
|
$
|
23.2
|
|
|
$
|
70.6
|
|
|
$
|
—
|
|
|
$
|
189.0
|
|
|
Consumer loans, net
|
|
|
—
|
|
|
|
35.7
|
|
|
|
23.2
|
|
|
|
103.0
|
|
|
|
—
|
|
|
|
161.9
|
|
|
Pawn loans, net
|
|
|
—
|
|
|
|
0.1
|
|
|
|
—
|
|
|
|
136.1
|
|
|
|
—
|
|
|
|
136.2
|
|
|
Loans in default, net
|
|
|
—
|
|
|
|
5.0
|
|
|
|
0.1
|
|
|
|
8.7
|
|
|
|
—
|
|
|
|
13.8
|
|
|
Other receivables
|
|
|
0.3
|
|
|
|
16.6
|
|
|
|
3.7
|
|
|
|
10.6
|
|
|
|
—
|
|
|
|
31.2
|
|
|
Prepaid expenses and other current assets
|
|
|
—
|
|
|
|
6.0
|
|
|
|
6.6
|
|
|
|
25.9
|
|
|
|
—
|
|
|
|
38.5
|
|
|
|
|
|
|
|
|
|
|
|
|
|
|
|
|
|
|
|
|
|
|
|
|
|
|
|
|
Total current assets
|
|
|
0.3
|
|
|
|
158.6
|
|
|
|
56.8
|
|
|
|
354.9
|
|
|
|
—
|
|
|
|
570.6
|
|
|
Deferred tax asset, net of valuation allowance
|
|
|
—
|
|
|
|
20.2
|
|
|
|
—
|
|
|
|
1.1
|
|
|
|
—
|
|
|
|
21.3
|
|
|
Intercompany receivables
|
|
|
392.7
|
|
|
|
148.0
|
|
|
|
—
|
|
|
|
—
|
|
|
|
(540.7
|
)
|
|
|
—
|
|
|
Property and equipment, net
|
|
|
—
|
|
|
|
32.6
|
|
|
|
16.4
|
|
|
|
51.0
|
|
|
|
—
|
|
|
|
100.0
|
|
|
Goodwill and other intangibles
|
|
|
—
|
|
|
|
235.1
|
|
|
|
313.5
|
|
|
|
383.4
|
|
|
|
—
|
|
|
|
932.0
|
|
|
Debt issuance costs, net
|
|
|
1.1
|
|
|
|
16.0
|
|
|
|
1.6
|
|
|
|
2.3
|
|
|
|
—
|
|
|
|
21.0
|
|
|
Investment in subsidiaries
|
|
|
166.8
|
|
|
|
302.0
|
|
|
|
56.3
|
|
|
|
—
|
|
|
|
(525.1
|
)
|
|
|
—
|
|
|
Other
|
|
|
—
|
|
|
|
0.7
|
|
|
|
17.1
|
|
|
|
0.1
|
|
|
|
—
|
|
|
|
17.9
|
|
|
|
|
|
|
|
|
|
|
|
|
|
|
|
|
|
|
|
|
|
|
|
|
|
|
|
|
Total Assets
|
|
$
|
560.9
|
|
|
$
|
913.2
|
|
|
$
|
461.7
|
|
|
$
|
792.8
|
|
|
$
|
(1,065.8
|
)
|
|
$
|
1,662.8
|
|
|
|
|
|
|
|
|
|
|
|
|
|
|
|
|
|
|
|
|
|
|
|
|
|
|
|
|
Current Liabilities
|
|
|
|
|
|
|
|
|
|
|
|
|
|
|
|
|
|
|
|
|
|
|
|
|
|
Accounts payable
|
|
$
|
0.6
|
|
|
$
|
16.0
|
|
|
$
|
12.8
|
|
|
$
|
31.7
|
|
|
$
|
—
|
|
|
$
|
61.1
|
|
|
Income taxes payable
|
|
|
—
|
|
|
|
0.5
|
|
|
|
1.3
|
|
|
|
11.9
|
|
|
|
—
|
|
|
|
13.7
|
|
|
Accrued expenses and other liabilities
|
|
|
0.9
|
|
|
|
32.7
|
|
|
|
26.2
|
|
|
|
38.6
|
|
|
|
—
|
|
|
|
98.4
|
|
|
Debt due within one year
|
|
|
—
|
|
|
|
—
|
|
|
|
6.5
|
|
|
|
89.2
|
|
|
|
—
|
|
|
|
95.7
|
|
|
|
|
|
|
|
|
|
|
|
|
|
|
|
|
|
|
|
|
|
|
|
|
|
|
|
|
Total current liabilities
|
|
|
1.5
|
|
|
|
49.2
|
|
|
|
46.8
|
|
|
|
171.4
|
|
|
|
—
|
|
|
|
268.9
|
|
|
Fair value of derivatives
|
|
|
—
|
|
|
|
73.8
|
|
|
|
—
|
|
|
|
0.1
|
|
|
|
—
|
|
|
|
73.9
|
|
|
Long-term deferred tax liability
|
|
|
—
|
|
|
|
14.3
|
|
|
|
23.0
|
|
|
|
16.5
|
|
|
|
—
|
|
|
|
53.8
|
|
|
Long-term debt
|
|
|
131.6
|
|
|
|
597.0
|
|
|
|
—
|
|
|
|
46.6
|
|
|
|
—
|
|
|
|
775.2
|
|
|
Intercompany payables
|
|
|
—
|
|
|
|
—
|
|
|
|
214.0
|
|
|
|
326.7
|
|
|
|
(540.7
|
)
|
|
|
—
|
|
|
Other non-current liabilities
|
|
|
—
|
|
|
|
38.8
|
|
|
|
18.3
|
|
|
|
7.3
|
|
|
|
—
|
|
|
|
64.4
|
|
|
|
|
|
|
|
|
|
|
|
|
|
|
|
|
|
|
|
|
|
|
|
|
|
|
|
|
Total liabilities
|
|
|
133.1
|
|
|
|
773.1
|
|
|
|
302.1
|
|
|
|
568.6
|
|
|
|
(540.7
|
)
|
|
|
1,236.2
|
|
|
|
|
|
|
|
|
|
|
|
|
|
|
|
|
|
|
|
|
|
|
|
|
|
|
|
|
Total DFC Global Corp. stockholders’ equity
|
|
|
427.8
|
|
|
|
140.1
|
|
|
|
159.6
|
|
|
|
224.7
|
|
|
|
(525.1
|
)
|
|
|
427.1
|
|
|
Non-controlling interest
|
|
|
—
|
|
|
|
—
|
|
|
|
—
|
|
|
|
(0.5
|
)
|
|
|
—
|
|
|
|
(0.5
|
)
|
|
|
|
|
|
|
|
|
|
|
|
|
|
|
|
|
|
|
|
|
|
|
|
|
|
|
|
Total stockholders’ equity
|
|
|
427.8
|
|
|
|
140.1
|
|
|
|
159.6
|
|
|
|
224.2
|
|
|
|
(525.1
|
)
|
|
|
426.6
|
|
|
|
|
|
|
|
|
|
|
|
|
|
|
|
|
|
|
|
|
|
|
|
|
|
|
|
|
Total Liabilities and Stockholders’ Equity
|
|
$
|
560.9
|
|
|
$
|
913.2
|
|
|
$
|
461.7
|
|
|
$
|
792.8
|
|
|
$
|
(1,065.8
|
)
|
|
$
|
1,662.8
|
|
|
|
|
|
|
|
|
|
|
|
|
|
|
|
|
|
|
|
|
|
|
|
|
|
|
|
121
DFC
GLOBAL CORP.
NOTES TO
CONSOLIDATED FINANCIAL
STATEMENTS — (Continued)
|
|
|
20.
|
Subsidiary
Guarantor Financial Information (continued)
|
Consolidating
Condensed Statements Of Operations
Twelve Months ended June 30, 2011
| |
|
|
|
|
|
|
|
|
|
|
|
|
|
|
|
|
|
|
|
|
|
|
|
|
|
|
|
DFC
|
|
|
National
|
|
|
DFG
|
|
|
|
|
|
|
|
|
|
|
|
|
|
Global
|
|
|
Money Mart
|
|
|
and
|
|
|
Non-
|
|
|
|
|
|
|
|
|
|
|
Corp.
|
|
|
Company
|
|
|
Guarantors
|
|
|
Guarantors
|
|
|
Eliminations
|
|
|
Consolidated
|
|
|
|
|
(In millions)
|
|
|
|
|
Revenues:
|
|
|
|
|
|
|
|
|
|
|
|
|
|
|
|
|
|
|
|
|
|
|
|
|
|
Consumer lending
|
|
$
|
—
|
|
|
$
|
170.7
|
|
|
$
|
61.6
|
|
|
$
|
196.9
|
|
|
$
|
—
|
|
|
$
|
429.2
|
|
|
Check cashing
|
|
|
—
|
|
|
|
73.4
|
|
|
|
41.1
|
|
|
|
29.6
|
|
|
|
—
|
|
|
|
144.1
|
|
|
Other
|
|
|
—
|
|
|
|
66.5
|
|
|
|
41.2
|
|
|
|
107.4
|
|
|
|
—
|
|
|
|
215.1
|
|
|
|
|
|
|
|
|
|
|
|
|
|
|
|
|
|
|
|
|
|
|
|
|
|
|
|
|
Total revenues
|
|
|
—
|
|
|
|
310.6
|
|
|
|
143.9
|
|
|
|
333.9
|
|
|
|
—
|
|
|
|
788.4
|
|
|
|
|
|
|
|
|
|
|
|
|
|
|
|
|
|
|
|
|
|
|
|
|
|
|
|
|
Operating expenses:
|
|
|
|
|
|
|
|
|
|
|
|
|
|
|
|
|
|
|
|
|
|
|
|
|
|
Salaries and benefits
|
|
|
—
|
|
|
|
63.1
|
|
|
|
50.3
|
|
|
|
66.5
|
|
|
|
—
|
|
|
|
179.9
|
|
|
Provision for loan losses
|
|
|
—
|
|
|
|
19.9
|
|
|
|
7.3
|
|
|
|
46.4
|
|
|
|
—
|
|
|
|
73.6
|
|
|
Occupancy
|
|
|
—
|
|
|
|
18.3
|
|
|
|
13.1
|
|
|
|
19.6
|
|
|
|
—
|
|
|
|
51.0
|
|
|
Purchased gold costs
|
|
|
|
|
|
|
8.8
|
|
|
|
1.5
|
|
|
|
20.7
|
|
|
|
|
|
|
|
31.0
|
|
|
Depreciation
|
|
|
—
|
|
|
|
6.0
|
|
|
|
2.8
|
|
|
|
8.0
|
|
|
|
—
|
|
|
|
16.8
|
|
|
Other
|
|
|
—
|
|
|
|
40.7
|
|
|
|
24.7
|
|
|
|
63.5
|
|
|
|
—
|
|
|
|
128.9
|
|
|
|
|
|
|
|
|
|
|
|
|
|
|
|
|
|
|
|
|
|
|
|
|
|
|
|
|
Total operating expenses
|
|
|
—
|
|
|
|
156.8
|
|
|
|
99.7
|
|
|
|
224.7
|
|
|
|
—
|
|
|
|
481.2
|
|
|
|
|
|
|
|
|
|
|
|
|
|
|
|
|
|
|
|
|
|
|
|
|
|
|
|
|
Operating margin
|
|
|
—
|
|
|
|
153.8
|
|
|
|
44.2
|
|
|
|
109.2
|
|
|
|
—
|
|
|
|
307.2
|
|
|
|
|
|
|
|
|
|
|
|
|
|
|
|
|
|
|
|
|
|
|
|
|
|
|
|
|
Corporate and other expenses:
|
|
|
|
|
|
|
|
|
|
|
|
|
|
|
|
|
|
|
|
|
|
|
|
|
|
Corporate expenses
|
|
|
—
|
|
|
|
23.3
|
|
|
|
61.6
|
|
|
|
19.2
|
|
|
|
—
|
|
|
|
104.1
|
|
|
Intercompany charges
|
|
|
—
|
|
|
|
21.9
|
|
|
|
(36.9
|
)
|
|
|
15.0
|
|
|
|
—
|
|
|
|
—
|
|
|
Other depreciation and amortization
|
|
|
—
|
|
|
|
1.7
|
|
|
|
8.2
|
|
|
|
4.7
|
|
|
|
—
|
|
|
|
14.6
|
|
|
Interest expense, net
|
|
|
13.7
|
|
|
|
65.1
|
|
|
|
3.8
|
|
|
|
8.2
|
|
|
|
—
|
|
|
|
90.8
|
|
|
Unrealized foreign exchange (gain) loss
|
|
|
—
|
|
|
|
(51.7
|
)
|
|
|
2.7
|
|
|
|
2.0
|
|
|
|
—
|
|
|
|
(47.0
|
)
|
|
Loss on derivatives not designated as hedges
|
|
|
—
|
|
|
|
39.3
|
|
|
|
—
|
|
|
|
—
|
|
|
|
—
|
|
|
|
39.3
|
|
|
(Proceeds from) provision for litigation settlements
|
|
|
—
|
|
|
|
(3.9
|
)
|
|
|
0.2
|
|
|
|
—
|
|
|
|
—
|
|
|
|
(3.7
|
)
|
|
Loss on store closings
|
|
|
—
|
|
|
|
0.5
|
|
|
|
0.3
|
|
|
|
0.1
|
|
|
|
—
|
|
|
|
0.9
|
|
|
Other expense (income), net
|
|
|
—
|
|
|
|
0.2
|
|
|
|
(1.3
|
)
|
|
|
6.9
|
|
|
|
—
|
|
|
|
5.8
|
|
|
|
|
|
|
|
|
|
|
|
|
|
|
|
|
|
|
|
|
|
|
|
|
|
|
|
|
(Loss) income before income taxes
|
|
|
(13.7
|
)
|
|
|
57.4
|
|
|
|
5.6
|
|
|
|
53.1
|
|
|
|
—
|
|
|
|
102.4
|
|
|
Income tax provision
|
|
|
—
|
|
|
|
13.4
|
|
|
|
5.8
|
|
|
|
17.9
|
|
|
|
—
|
|
|
|
37.1
|
|
|
|
|
|
|
|
|
|
|
|
|
|
|
|
|
|
|
|
|
|
|
|
|
|
|
|
|
Net (loss) income
|
|
|
(13.7
|
)
|
|
|
44.0
|
|
|
|
(0.2
|
)
|
|
|
35.2
|
|
|
|
—
|
|
|
|
65.3
|
|
|
Less: Net loss attributable to non-controlling interests
|
|
|
—
|
|
|
|
—
|
|
|
|
—
|
|
|
|
(0.5
|
)
|
|
|
—
|
|
|
|
(0.5
|
)
|
|
Equity in net income (loss) of subsidiaries:
|
|
|
|
|
|
|
|
|
|
|
|
|
|
|
|
|
|
|
|
|
|
|
|
|
|
National Money Mart Company
|
|
|
44.0
|
|
|
|
—
|
|
|
|
—
|
|
|
|
—
|
|
|
|
(44.0
|
)
|
|
|
—
|
|
|
Guarantors
|
|
|
(0.2
|
)
|
|
|
—
|
|
|
|
—
|
|
|
|
—
|
|
|
|
0.2
|
|
|
|
—
|
|
|
Non-guarantors
|
|
|
35.7
|
|
|
|
—
|
|
|
|
—
|
|
|
|
—
|
|
|
|
(35.7
|
)
|
|
|
—
|
|
|
|
|
|
|
|
|
|
|
|
|
|
|
|
|
|
|
|
|
|
|
|
|
|
|
|
|
Net income (loss) attributable to DFC Global Corp.
|
|
$
|
65.8
|
|
|
$
|
44.0
|
|
|
$
|
(0.2
|
)
|
|
$
|
35.7
|
|
|
$
|
(79.5
|
)
|
|
$
|
65.8
|
|
|
|
|
|
|
|
|
|
|
|
|
|
|
|
|
|
|
|
|
|
|
|
|
|
|
|
122
DFC
GLOBAL CORP.
NOTES TO
CONSOLIDATED FINANCIAL
STATEMENTS — (Continued)
|
|
|
20.
|
Subsidiary
Guarantor Financial Information (continued)
|
Consolidating
Condensed Statements Of Cash Flows
Twelve Months Ended June 30, 2011
| |
|
|
|
|
|
|
|
|
|
|
|
|
|
|
|
|
|
|
|
|
|
|
|
|
|
|
|
DFC
|
|
|
National
|
|
|
DFG
|
|
|
|
|
|
|
|
|
|
|
|
|
|
Global
|
|
|
Money Mart
|
|
|
and
|
|
|
Non-
|
|
|
|
|
|
|
|
|
|
|
Corp.
|
|
|
Company
|
|
|
Guarantors
|
|
|
Guarantors
|
|
|
Eliminations
|
|
|
Consolidated
|
|
|
|
|
(In millions)
|
|
|
|
|
Cash flows from operating activities:
|
|
|
|
|
|
|
|
|
|
|
|
|
|
|
|
|
|
|
|
|
|
|
|
|
|
Net income (loss)
|
|
$
|
65.8
|
|
|
$
|
44.0
|
|
|
$
|
(0.2
|
)
|
|
$
|
35.2
|
|
|
$
|
(79.5
|
)
|
|
$
|
65.3
|
|
|
Adjustments to reconcile net income to net cash provided by
operating activities:
|
|
|
|
|
|
|
|
|
|
|
|
|
|
|
|
|
|
|
|
|
|
|
|
|
|
Undistributed income of subsidiaries
|
|
|
(79.5
|
)
|
|
|
—
|
|
|
|
—
|
|
|
|
—
|
|
|
|
79.5
|
|
|
|
—
|
|
|
Depreciation and amortization
|
|
|
0.4
|
|
|
|
10.5
|
|
|
|
11.9
|
|
|
|
12.7
|
|
|
|
—
|
|
|
|
35.5
|
|
|
Change in fair value of derivative not
|
|
|
|
|
|
|
|
|
|
|
|
|
|
|
|
|
|
|
|
|
|
|
|
|
|
designated as a hedge
|
|
|
—
|
|
|
|
20.7
|
|
|
|
—
|
|
|
|
—
|
|
|
|
—
|
|
|
|
20.7
|
|
|
Provision for loan losses
|
|
|
—
|
|
|
|
19.9
|
|
|
|
7.3
|
|
|
|
46.4
|
|
|
|
—
|
|
|
|
73.6
|
|
|
Non-cash stock compensation
|
|
|
4.6
|
|
|
|
—
|
|
|
|
—
|
|
|
|
—
|
|
|
|
—
|
|
|
|
4.6
|
|
|
Losses (gains) on disposal of fixed assets
|
|
|
—
|
|
|
|
0.3
|
|
|
|
(0.2
|
)
|
|
|
—
|
|
|
|
—
|
|
|
|
0.1
|
|
|
Unrealized foreign exchange (gain) loss
|
|
|
—
|
|
|
|
(52.0
|
)
|
|
|
—
|
|
|
|
4.6
|
|
|
|
—
|
|
|
|
(47.4
|
)
|
|
Deferred tax provision
|
|
|
—
|
|
|
|
9.3
|
|
|
|
5.8
|
|
|
|
0.1
|
|
|
|
—
|
|
|
|
15.2
|
|
|
Accretion of debt discount and deferred issuance costs
|
|
|
8.4
|
|
|
|
6.9
|
|
|
|
—
|
|
|
|
—
|
|
|
|
—
|
|
|
|
15.3
|
|
|
Change in assets and liabilities (net of effect of acquisitions):
|
|
|
|
|
|
|
|
|
|
|
|
|
|
|
|
|
|
|
|
|
|
|
|
|
|
Increase in loans and other receivables
|
|
|
—
|
|
|
|
(21.2
|
)
|
|
|
(8.8
|
)
|
|
|
(91.9
|
)
|
|
|
—
|
|
|
|
(121.9
|
)
|
|
Decrease (increase) in prepaid expenses and other
|
|
|
—
|
|
|
|
0.3
|
|
|
|
(2.9
|
)
|
|
|
(5.8
|
)
|
|
|
—
|
|
|
|
(8.4
|
)
|
|
Increase (decrease) in accounts payable, accrued expenses and
other liabilities
|
|
|
1.0
|
|
|
|
(30.8
|
)
|
|
|
3.2
|
|
|
|
(9.1
|
)
|
|
|
—
|
|
|
|
(35.7
|
)
|
|
|
|
|
|
|
|
|
|
|
|
|
|
|
|
|
|
|
|
|
|
|
|
|
|
|
|
Net cash provided by operating activities
|
|
|
0.7
|
|
|
|
7.9
|
|
|
|
16.1
|
|
|
|
(7.8
|
)
|
|
|
—
|
|
|
|
16.9
|
|
|
Cash flows from investing activities:
|
|
|
|
|
|
|
|
|
|
|
|
|
|
|
|
|
|
|
|
|
|
|
|
|
|
Acquisitions, net of cash acquired
|
|
|
—
|
|
|
|
(36.3
|
)
|
|
|
1.4
|
|
|
|
(254.3
|
)
|
|
|
—
|
|
|
|
(289.2
|
)
|
|
Additions to property and equipment
|
|
|
—
|
|
|
|
(8.1
|
)
|
|
|
(6.8
|
)
|
|
|
(26.5
|
)
|
|
|
—
|
|
|
|
(41.4
|
)
|
|
Net (increase) decrease in due from affiliates
|
|
|
(139.7
|
)
|
|
|
(100.2
|
)
|
|
|
(12.3
|
)
|
|
|
252.2
|
|
|
|
—
|
|
|
|
—
|
|
|
|
|
|
|
|
|
|
|
|
|
|
|
|
|
|
|
|
|
|
|
|
|
|
|
|
|
Net cash used in investing activities
|
|
|
(139.7
|
)
|
|
|
(144.6
|
)
|
|
|
(17.7
|
)
|
|
|
(28.6
|
)
|
|
|
—
|
|
|
|
(330.6
|
)
|
|
Cash flows from financing activities:
|
|
|
|
|
|
|
|
|
|
|
|
|
|
|
|
|
|
|
|
|
|
|
|
|
|
Proceeds from the exercise of stock options
|
|
|
3.2
|
|
|
|
—
|
|
|
|
—
|
|
|
|
—
|
|
|
|
—
|
|
|
|
3.2
|
|
|
Proceeds from offering of common stock, net
|
|
|
130.2
|
|
|
|
—
|
|
|
|
—
|
|
|
|
—
|
|
|
|
—
|
|
|
|
130.2
|
|
|
Net increase in revolving credit facilities
|
|
|
—
|
|
|
|
—
|
|
|
|
6.5
|
|
|
|
59.5
|
|
|
|
—
|
|
|
|
66.0
|
|
|
Payment of debt issuance and other costs
|
|
|
0.2
|
|
|
|
(2.8
|
)
|
|
|
—
|
|
|
|
(2.4
|
)
|
|
|
—
|
|
|
|
(5.0
|
)
|
|
|
|
|
|
|
|
|
|
|
|
|
|
|
|
|
|
|
|
|
|
|
|
|
|
|
|
Net cash provided by (used in) financing activities
|
|
|
133.6
|
|
|
|
(2.8
|
)
|
|
|
6.5
|
|
|
|
57.1
|
|
|
|
—
|
|
|
|
194.4
|
|
|
Effect of exchange rate changes on cash and cash equivalents
|
|
|
—
|
|
|
|
16.1
|
|
|
|
—
|
|
|
|
0.9
|
|
|
|
—
|
|
|
|
17.0
|
|
|
|
|
|
|
|
|
|
|
|
|
|
|
|
|
|
|
|
|
|
|
|
|
|
|
|
|
Net (decrease) increase in cash and cash equivalents
|
|
|
(5.4
|
)
|
|
|
(123.4
|
)
|
|
|
4.9
|
|
|
|
21.6
|
|
|
|
—
|
|
|
|
(102.3
|
)
|
|
Cash and cash equivalents balance-beginning of period
|
|
|
5.4
|
|
|
|
218.6
|
|
|
|
18.3
|
|
|
|
49.0
|
|
|
|
—
|
|
|
|
291.3
|
|
|
|
|
|
|
|
|
|
|
|
|
|
|
|
|
|
|
|
|
|
|
|
|
|
|
|
|
Cash and cash equivalents balance-end of period
|
|
$
|
—
|
|
|
$
|
95.2
|
|
|
$
|
23.2
|
|
|
$
|
70.6
|
|
|
$
|
—
|
|
|
$
|
189.0
|
|
|
|
|
|
|
|
|
|
|
|
|
|
|
|
|
|
|
|
|
|
|
|
|
|
|
|
123
DFC
GLOBAL CORP.
NOTES TO
CONSOLIDATED FINANCIAL
STATEMENTS — (Continued)
|
|
|
20.
|
Subsidiary
Guarantor Financial Information (continued)
|
|
|
|
21.
|
Unaudited
Quarterly Operating Results
|
Summarized quarterly financial data for the fiscal years ended
June 30, 2011 and 2010 are as follows:
| |
|
|
|
|
|
|
|
|
|
|
|
|
|
|
|
|
|
|
|
|
|
|
|
|
|
|
|
|
|
|
|
|
|
|
|
Year
|
|
|
|
|
Three Months Ended
|
|
|
Ended
|
|
|
|
|
September 30
|
|
|
December 31
|
|
|
March 31
|
|
|
June 30
|
|
|
June 30
|
|
|
|
|
(Unaudited)
|
|
|
|
|
(In millions except per share data)
|
|
|
|
|
Fiscal 2011:
|
|
|
|
|
|
|
|
|
|
|
|
|
|
|
|
|
|
|
|
|
|
Revenues
|
|
$
|
174.2
|
|
|
$
|
182.5
|
|
|
$
|
197.8
|
|
|
$
|
233.9
|
|
|
$
|
788.4
|
|
|
Income before income taxes
|
|
$
|
18.2
|
|
|
$
|
30.3
|
|
|
$
|
25.3
|
|
|
$
|
28.6
|
|
|
$
|
102.4
|
|
|
Net income attributable to DFC Global Corp.
|
|
$
|
12.2
|
|
|
$
|
20.0
|
|
|
$
|
15.7
|
|
|
$
|
17.9
|
|
|
$
|
65.8
|
|
|
Basic earnings per share
|
|
$
|
0.34
|
|
|
$
|
0.55
|
|
|
$
|
0.43
|
|
|
$
|
0.42
|
|
|
$
|
1.73
|
|
|
Diluted earnings per share
|
|
$
|
0.33
|
|
|
$
|
0.53
|
|
|
$
|
0.41
|
|
|
$
|
0.40
|
|
|
$
|
1.66
|
|
|
Fiscal 2010:
|
|
|
|
|
|
|
|
|
|
|
|
|
|
|
|
|
|
|
|
|
|
Revenues
|
|
$
|
145.5
|
|
|
$
|
160.7
|
|
|
$
|
163.3
|
|
|
$
|
163.8
|
|
|
$
|
633.3
|
|
|
Income before income taxes
|
|
$
|
13.4
|
|
|
$
|
12.9
|
|
|
$
|
(14.6
|
)
|
|
$
|
4.5
|
|
|
$
|
16.2
|
|
|
Net income attributable to DFC Global Corp.
|
|
$
|
5.3
|
|
|
$
|
7.1
|
|
|
$
|
(12.2
|
)
|
|
$
|
(5.1
|
)
|
|
$
|
(4.9
|
)
|
|
Basic earnings per share
|
|
$
|
0.15
|
|
|
$
|
0.20
|
|
|
$
|
(0.34
|
)
|
|
$
|
(0.14
|
)
|
|
$
|
(0.14
|
)
|
|
Diluted earnings per share
|
|
$
|
0.14
|
|
|
$
|
0.19
|
|
|
$
|
(0.34
|
)
|
|
$
|
(0.14
|
)
|
|
$
|
(0.14
|
)
|
On July 6, 2011, the Company acquired Risicum Oyj
(“Risicum”), the leading provider of Internet loans in
Finland with headquarters in Helsinki, Finland. Risicum, which
was established in 2005, provides loans predominately in Finland
through both Internet and mobile phone technology, utilizing
multiple brands to target specific customer demographics.
Risicum also provides Internet and telephony-based loans in
Sweden. The total purchase price of the transaction at closing
was approximately $46.0 million.
124
|
|
|
Item 9.
|
CHANGES
IN AND DISAGREEMENTS WITH ACCOUNTANTS ON ACCOUNTING AND
FINANCIAL DISCLOSURE
|
None.
|
|
|
Item 9A.
|
CONTROLS
AND PROCEDURES
|
Evaluation
of Disclosure Controls and Procedures
As of the end of the period covered by this report, our
management conducted an evaluation, with the participation of
our Chief Executive Officer, Chief Financial Officer and Senior
Vice President, Finance, Corporate Controller and Chief
Accounting Officer, of the effectiveness of our disclosure
controls and procedures (as defined in
Rules 13a-15(e)
and
15d-15(e)
under the Securities Exchange Act of 1934 (the “Exchange
Act”)). Based on this evaluation, our Chief Executive
Officer, Chief Financial Officer and Senior Vice President,
Finance, Corporate Controller and Chief Accounting Officer have
concluded that our disclosure controls and procedures are
effective to ensure that information required to be disclosed by
us in the reports that we file or submit under the Exchange Act
is recorded, processed, summarized and reported within the time
periods specified in Securities and Exchange Commission’s
rules and forms and that such information is accumulated and
communicated to management, including our Chief Executive
Officer, Chief Financial Officer and Senior Vice President,
Finance, Corporate Controller and Chief Accounting Officer, as
appropriate to allow timely decisions regarding required
disclosure.
The Company acquired Sefina on December 31, 2010 and
Purpose UK on April 1, 2011. These companies are included
in our 2011 financial statements as of the dates of the
acquisitions and accounted for 6.0% and 6.3% of net income,
respectively, and 10.5% and 13.3% of consolidated total assets,
respectively, of the Company for the year ended June 30,
2011. Because of the timing of the acquisitions, the internal
controls over financial reporting of Sefina and Purpose UK were
excluded from a formal evaluation of effectiveness of the
Company’s internal control over financial reporting and
disclosure controls and procedures. The Company is evaluating
changes to processes, information technology systems and other
components of internal controls over financial reporting as part
of its ongoing integration activities.
Changes
in Internal Control over Financial Reporting
|
|
|
(a)
|
Management’s
Annual Report in Internal Control over Financial
Reporting
|
Our management’s annual report on internal control over
financial reporting required by this Items is incorporated by
reference herein to the section in Part II, Item 8 of
this Annual Report on
Form 10-K
titled “Financial Statements and Supplementary Data.”
|
|
|
(b)
|
Report of
Independent Registered Public Accounting Firm
|
The report of our independent registered public accounting firm
required by this Item is incorporated by reference herein to the
section in Part II, Item 8 of this Annual Report on
Form 10-K
titled “Financial Statements and Supplementary Data.”
|
|
|
(c)
|
Changes
in Internal Control over Financial Reporting
|
DFC Global Corp.’s principal executive officer and
principal financial officer have concluded that the Sefina and
Purpose UK acquisitions created a material change to its
internal control over financial reporting. Sefina and Purpose UK
are significant subsidiaries for DFC Global Corp. that operated
under their pre-acquisition internal control over financial
reporting for the time from acquisition through June 30,
2011. DFC Global Corp. has expanded its consolidation and
disclosure controls and procedures to include the acquired
companies, and DFC Global Corp. continues to assess the current
internal control over financial reporting at Sefina and Purpose
UK.
|
|
|
Item 9B.
|
OTHER
INFORMATION.
|
None.
125
PART III
|
|
|
Item 10.
|
DIRECTORS,
EXECUTIVE OFFICERS AND CORPORATE GOVERNANCE
|
Directors
and Officers
We incorporate by reference the information required by this
Item from the information set forth under the captions
“Elections of Directors”, “Executive Officers and
Executive Compensation”, “Other Information” and
“Corporate Governance” in our definitive proxy
statement for our 2011 annual meeting of stockholders, to be
filed within 120 days after the end of the year covered by
this Annual Report on
Form 10-K,
pursuant to Regulation 14A under the Securities Exchange
Act of 1934, as amended (“the 2011 Proxy Statement”).
We have adopted a code of ethics applicable to our principal
executive officer, principal financial officer and principal
accounting officer or controller, as well as other senior
officers. The Code of Business Conduct and Ethics (the
“Code”) is publicly available on our website at
http://www.dfcglobalcorp.com/ethics.asp.
Amendments to the Code and any grant of a waiver from a
provision of the Code requiring disclosure under applicable SEC
rules will be disclosed on the Company’s website.
|
|
|
Item 11.
|
EXECUTIVE
COMPENSATION
|
We incorporate by reference the information required by this
Item from the information set forth under the caption
“Securities Ownership” in our 2011 Proxy Statement.
|
|
|
Item 12.
|
SECURITY
OWNERSHIP OF CERTAIN BENEFICIAL OWNERS AND MANAGEMENT AND
RELATED SHAREHOLDER MATTERS
|
The information required by this Item with respect to security
ownership or certain beneficial owners and management will be
set forth in our Proxy Statement, to be filed within
120 days after the end of the fiscal year covered by this
Annual Report on
Form 10-K,
and is incorporated herein by reference to our Proxy Statement.
Securities
Authorized For Issuance Under Equity Compensation Plans
As of June 30, 2011:
The following table sets forth, as of June 30, 2011,
information concerning equity compensation plans under which our
securities are authorized for issuance. The table does not
reflect grants, awards, exercises, terminations or expirations
since that date. All share amounts and exercise prices have been
adjusted to reflect stock splits that occurred after the date on
which any particular underlying plan was adopted, to the extent
applicable.
| |
|
|
|
|
|
|
|
|
|
|
|
|
|
|
|
Number of
|
|
|
|
|
|
Number of Securities
|
|
|
|
|
Securities to
|
|
|
Weighted-Average
|
|
|
Remaining
|
|
|
|
|
be Issued
|
|
|
Exercise Price of
|
|
|
Available for
|
|
|
|
|
Upon
|
|
|
Outstanding
|
|
|
Future Issuance
|
|
|
|
|
Exercise of
|
|
|
Options,
|
|
|
Under Equity
|
|
|
|
|
Outstanding Options,
|
|
|
Warrants and
|
|
|
Compensation
|
|
|
Plan Category
|
|
Warrants and Rights
|
|
|
Rights
|
|
|
Plans
|
|
|
|
|
Equity compensation Plans approved by Stockholders:
|
|
|
|
|
|
|
|
|
|
|
|
|
|
Options
|
|
|
2,772,445
|
|
|
$
|
11.28
|
|
|
|
6,830,820
|
(a)
|
|
Restricted Shares/Restricted Stock Unit Awards
|
|
|
797,249
|
|
|
|
(b
|
)
|
|
|
(a
|
)
|
|
Equity compensation Plans not approved by Stockholders
|
|
|
—
|
|
|
|
—
|
|
|
|
—
|
|
|
Total
|
|
|
3,569,694
|
|
|
$
|
11.28
|
|
|
|
6,830,820
|
|
|
|
|
|
(a) |
|
On November 11, 2010, DFC’s stockholders approved an
amendment to the 2007 Plan. Under the terms of the amendment,
the maximum aggregate number of shares of DFC’s common
stock that may be issued |
126
|
|
|
|
|
|
pursuant to Awards granted under the 2007 Plan is 10,500,000,
after giving effect for DFC’s three for two stock split for
stockholders of record as of January 20, 2011; provided,
however, that 1.67 shares will be deducted from the number
of shares available for grant under the 2007 Plan for each share
that underlies an Award granted under the 2007 Plan on or after
November 11, 2010 for restricted stock, restricted stock
units, performance awards or other Awards for which the full
value of such share is transferred by DFC to the award recipient. |
| |
|
(b) |
|
Not applicable |
|
|
|
Item 13.
|
CERTAIN
RELATIONSHIPS AND RELATED TRANSACTIONS, AND DIRECTOR
INDEPENDENCE
|
We incorporate by reference the information required by this
Item from the information set forth under the captions
“Corporate Governance” and “Certain Relationships
and Related Transactions” in our 2011 Proxy Statement.
|
|
|
Item 14.
|
PRINCIPAL
ACCOUNTANT FEES AND SERVICES
|
We incorporate by reference the information required by this
Item from the information set forth under the caption
“Ratification of the Appointment of Independent Registered
Public Accounting Firm” in our 2011 Proxy Statement.
127
PART IV
|
|
|
Item 15.
|
EXHIBITS,
FINANCIAL STATEMENT SCHEDULES
|
|
|
|
(a)
|
Documents
Filed as Part of this Report.
|
(1) Financial Statements. All financial statements required
to be filed by Item 8 of Form
10-K and
included in this Annual Report on
Form 10-K
are listed in Item 8 hereof. No additional financial
statements are filed herein or are attached as exhibits hereto.
(2) Financial Statement Schedules. All financial statement
schedules have been omitted here because they are not
applicable, not required or the information is shown in the
financial statements or related notes.
(3) Exhibits.
| |
|
|
|
|
|
Exhibit No.
|
|
Description of Document
|
|
|
|
|
2
|
.1
|
|
Asset Purchase Agreement, by and among CCS Financial Services,
Inc., Allen Eager, the Allen Eager Revocable Trust, Paul P.
Hauser, Barry E. Hershman, and the Barry E. Hershman Revocable
Trust and Check Mart of Florida, Inc., dated October 11,
2007(8)
|
|
|
2
|
.2
|
|
Purchase Agreement dated as of October 28, 2009 by and
among Dollar Financial Corp., Military Financial Services, LLC,
Southfield Partners, LLC, Joseph S. Minor, Don Jacobs, Larry
Mountford and Robert Nelson(17)
|
|
|
2
|
.3
|
|
Amendment to Purchase Agreement dated as of December 23,
2009 by and among Dollar Financial Corp., Military Financial
Services, LLC, Southfield Partners, LLC, Joseph S. Minor, Don
Jacobs, Larry Mountford and Robert Nelson(18)
|
|
|
2
|
.4
|
|
Stock Purchase Agreement dated December 2, 2010 between NSF
Nordic Special Finance AB and Dollar Financial U.K. Limited(23)
|
|
|
2
|
.5
|
|
Share Purchase Agreement dated December 31, 2010 among
Dollar Financial U.K. Limited, Dollar Financial Corp., CCRT
International Holdings B.V. and CompuCredit Holdings
Corporation(26)
|
|
|
3
|
.1(a)#
|
|
Amended and Restated Certificate of Incorporation of DFC Global
Corp. (formerly Dollar Financial Corp.), as amended
|
|
|
3
|
.1(b)#
|
|
Amended and Restated Bylaws of DFC Global Corp. (formerly known
as Dollar Financial Corp.), as amended
|
|
|
4
|
.1
|
|
Indenture dated June 27, 2007, between Dollar Financial
Corp. and U.S. Bank National Association, as trustee, governing
the terms of the 2.875% Senior Convertible Notes due 2027(5)
|
|
|
4
|
.2
|
|
Registration Rights Agreement dated June 27, 2007 by and
among Dollar Financial Corp. and Wachovia Capital Markets, LLC
and Bear, Sterns & Co. Inc., as representatives of the
initial purchasers(5)
|
|
|
4
|
.3
|
|
Indenture dated December 23, 2009, between Dollar Financial
Corp. and U.S. Bank National Association, as trustee, governing
the terms of the 3.00% Senior Convertible Notes due 2028(18)
|
|
|
4
|
.4
|
|
Indenture dated December 23, 2009 by and among National
Money Mart Company, Dollar Financial Corp. and the guarantors
party thereto and U.S. Bank National Association, as trustee,
governing the terms of the 10.375% Senior Notes due 2016(18)
|
|
|
4
|
.5
|
|
Registration Rights Agreement dated December 23, 2009 by
and among National Money Mart Company, Dollar Financial Corp.
and the guarantors party thereto and Credit Suisse Securities
(USA) LLC and Wells Fargo Securities, LLC, as representatives of
the initial purchasers(18)
|
|
|
4
|
.6
|
|
Supplemental Indenture dated December 2, 2010 among DFG
Acquisition Services, Inc. Military Financial Services, LLC,
Dealers’ Financial Services, LLC and U.S. Bank National
Association, as trustee(24)
|
|
|
4
|
.7
|
|
Guarantee dated December 2, 2010 executed by DFG
Acquisition Services, Inc. Military Financial Services, LLC and
Dealers’ Financial Services, LLC(24)
|
|
|
4
|
.8
|
|
Supplemental Indenture dated February 25, 2011 between
Dollar Financial U.S., Inc. and U.S. Bank National Association,
as trustee(27)
|
|
|
4
|
.9
|
|
Guarantee dated February 25, 2011 executed by Dollar
Financial U.S., Inc.(27)
|
128
| |
|
|
|
|
|
Exhibit No.
|
|
Description of Document
|
|
|
|
|
10
|
.1
|
|
Second Amended and Restated Credit Agreement dated as of
March 3, 2011 among Dollar Financial Corp., Dollar
Financial Group, Inc., National Money Mart Company, Dollar
Financial U.K. Limited and Instant Cash Loans Limited, the
several lenders from time to time parties thereto, and Wells
Fargo Bank, National Association, as Administrative Agent and as
Security Trustee, and a syndicate of lenders(25)
|
|
|
10
|
.2
|
|
Second Amended and Restated Stockholders Agreement, dated as of
November 13, 2003, by and among Green Equity Investors II,
L.P., Stone Street Fund 1998, L.P. Bridge Street
Fund 1998, GS Mezzanine Partners, L.P., GS Mezzanine
Partners Offshore, L.P., Ares Leveraged Investment Fund, L.P. a
Delaware limited partnership, Ares Leveraged Investment
Fund II, L.P., a Delaware limited partnership, C.L.
Jeffrey, Sheila Jeffrey, certain signatories thereto and DFG
Holdings, Inc.(1)
|
|
|
10
|
.3
|
|
Amendment No. 2 to Second Amended and Restated Stockholders
Agreement, dated as of April 14, 2004, by and among Dollar
Financial Corp., Green Equity Investors II, L.P., GS Mezzanine
Partners, L.P., GS Mezzanine Partners Offshore, L.P., Stone
Street Fund 1998, L.P., Bridge Street Fund 1998, L.P.,
Ares Leveraged Investment Fund, L.P., Ares Leveraged Investment
Fund II, L.P. and Jeffrey Weiss(2)
|
|
|
10
|
.4
|
|
Amendment No. 3 to Second Amended and Restated Stockholders
Agreement, dated as of July 6, 2004, by and among Dollar
Financial Corp., Green Equity Investors II, L.P., GS Mezzanine
Partners, L.P., GS Mezzanine Partners Offshore, L.P., Stone
Street Fund 1998, L.P., Bridge Street Fund 1998, L.P.,
Ares Leveraged Investment Fund, L.P., Ares Leveraged Investment
Fund II, L.P., and Jeffrey Weiss(3)
|
|
|
10
|
.5
|
|
Form of Director Indemnification Agreement(2)
|
|
|
10
|
.6*
|
|
Employment Agreement, dated as of October 30, 2009, by and
among Dollar Financial Group, Inc., Dollar Financial Corp. and
Jeffrey Weiss(15)
|
|
|
10
|
.7*
|
|
Amended and Restated Employment Agreement by and among Norman
Miller, the Company and Dollar Financial Group, Inc., dated as
of May 14, 2008(10)
|
|
|
10
|
.8*
|
|
Amended and Restated Employment Agreement by and among Randy
Underwood, the Company and Dollar Financial Group, Inc., dated
as of May 17, 2010(20)
|
|
|
10
|
.9*
|
|
Employment Agreement by and between National Money Mart and
Sydney Franchuk dated March 18, 2009(13)
|
|
|
10
|
.10*
|
|
Dollar Financial Corp. Amended and Restated 2005 Stock Incentive
Plan(6)
|
|
|
10
|
.11*
|
|
Form of Stock Option Agreement for the Dollar Financial Corp.
Amended and Restated 2005 Stock Incentive Plan(4)
|
|
|
10
|
.12*
|
|
Form of Stock Option Grant Notice for the Dollar Financial Corp.
Amended and Restated 2005 Stock Incentive Plan(4)
|
|
|
10
|
.13*
|
|
Canadian Form of Restricted Stock Unit Award Agreement under the
Dollar Financial Corp. Amended and Restated 2005 Stock Incentive
Plan(9)
|
|
|
10
|
.14*
|
|
Form of Restricted Stock Grant Document for the Dollar Financial
Corp. Amended and Restated 2005 Stock Incentive Plan(14)
|
|
|
10
|
.15*
|
|
Form of Restricted Stock Grant Document for the 2005 Stock
Incentive Plan (International Grantee)(14)
|
|
|
10
|
.16*
|
|
Dollar Financial Corp. 2007 Equity Incentive Plan, as amended(28)
|
|
|
10
|
.17*
|
|
Form of Restricted Stock Unit Award Agreement for 2007 Equity
Incentive Plan
|
|
|
10
|
.18*#
|
|
Form of Stock Option Agreement for 2007 Equity Incentive Plan
|
|
|
10
|
.19*#
|
|
Form of Stock Option Grant Notice for 2007 Equity Incentive Plan
|
|
|
10
|
.20*
|
|
Form of Restricted Stock Unit Award Agreement for 2007 Equity
Incentive Plan (International Grantee)(12)
|
|
|
10
|
.21*
|
|
Form of Restricted Stock Grant Document for the 2007 Stock
Incentive Plan(14)
|
|
|
10
|
.22*
|
|
Dollar Financial Corp. Amended and Restated Deferred
Compensation Plan effective as of January 1, 2009(11)
|
129
| |
|
|
|
|
|
Exhibit No.
|
|
Description of Document
|
|
|
|
|
10
|
.23*
|
|
Dollar Financial Corp. Amended and Restated Supplemental
Executive Conditional Deferred Award Plan for U.K.
Participants(11)
|
|
|
10
|
.24*
|
|
Dollar Financial Corp. Supplemental Executive Deferred Award
Plan for Canadian Participants(7)
|
|
|
10
|
.25*#
|
|
DFC Global Corp. Executive and Key Managment Bonus Program(22)
|
|
|
10
|
.26*#
|
|
DFC Global Corp. Long Term Incentive Compensation Program
|
|
|
10
|
.27
|
|
Detailed Settlement Agreement by and among Kenneth Smith, as
Estate Trustee of the last Will and Testament of Margaret Smith,
deceased, and Ronald Adrien Oriet, as plaintiffs, and National
Money Mart Company and Dollar Financial Group, Inc., as
defendants, dated November 6, 2009(16)
|
|
|
10
|
.28
|
|
Settlement Agreement effective as of March 4, 2010 and
executed as of May 6, 2010 by and among Kurt MacKinnan and
Louise Parsons, as plaintiffs, and National Money Mart Company
and Dollar Financial Group, Inc., as defendants(19)
|
|
|
21
|
.1#
|
|
Subsidiaries of DFC Global Corp.
|
|
|
23
|
.1#
|
|
Consent of Ernst & Young LLP
|
|
|
31
|
.1#
|
|
Certification of Chief Executive Officer Pursuant to
Title 17, Code of Federal Regulations,
Section 240.13a — 14(a) or
Section 240.15d — 14(a)
|
|
|
31
|
.2#
|
|
Certification of Executive Vice President and Chief Financial
Officer Pursuant to Title 17, Code of Federal Regulations,
Section 240.13a — 14(a) or
Section 240.15d — 14(a)
|
|
|
31
|
.3#
|
|
Certification of Senior Vice President, Finance, Chief
Accounting Officer and Corporate Controller Pursuant to
Title 17, Code of Federal Regulations,
Section 240.13a — 14(a) or
Section 240.15d — 14(a)
|
|
|
32
|
.1#
|
|
Certification of Chief Executive Officer Pursuant to
Title 18, United States Code, Section 1350, as Adopted
Pursuant to Section 906 of the Sarbanes-Oxley Act of 2002
|
|
|
32
|
.2#
|
|
Certification of Executive Vice President and Chief Financial
Officer Pursuant to Title 18, United States Code,
Section 1350, as Adopted Pursuant to Section 906 of
the Sarbanes-Oxley Act of 2002
|
|
|
32
|
.3#
|
|
Certification of Senior Vice President, Finance, Chief
Accounting Officer and Corporate Controller Pursuant to
Title 18, United States Code, Section 1350, as Adopted
Pursuant to Section 906 of the Sarbanes-Oxley Act of 2002
|
|
|
(1)
|
|
|
Incorporated by reference to the Registration Statement on
Form S-4
filed by Dollar Financial Group, Inc. on December 23, 2003
(File No.
333-111473)
|
|
|
(2)
|
|
|
Incorporated by reference to the Registration Statement on
Form S-1/A
filed by Dollar Financial Corp. on June 3, 2004 (File
No. 333-113570)
|
|
|
(3)
|
|
|
Incorporated by reference to Amendment No. 4 to the
Registration Statement on
Form S-1
filed by Dollar Financial Corp. on July 16, 2004 (File
No. 333-113570)
|
|
|
(4)
|
|
|
Incorporated by reference to the Quarterly Report on
Form 10-Q
filed by Dollar Financial Corp. on February 11, 2005 (File
No. 000-50866)
|
|
|
(5)
|
|
|
Incorporated by reference to the Current Report on
Form 8-K
filed by Dollar Financial Corp. on June 27, 2007 (File
No. 000-50866)
|
|
|
(6)
|
|
|
Incorporated by reference to the Current Report on
Form 8-K
filed by Dollar Financial Corp. on July 5, 2007 (File
No. 000-50866)
|
|
|
(7)
|
|
|
Incorporated by reference to the Current Report on
Form 8-K
filed by Dollar Financial Corp. on July 17, 2007 (File
No. 000-50866)
|
|
|
(8)
|
|
|
Incorporated by reference to the Quarterly Report on
Form 10-Q
filed by Dollar Financial Corp. on November 9, 2007 (File
No. 000-50866)
|
|
|
(9)
|
|
|
Incorporated by reference to the Quarterly Report on
Form 10-Q
filed by Dollar Financial Corp. on May 9, 2008 (File
No. 000-50866)
|
|
|
(10)
|
|
|
Incorporated by reference to the Current Report on
Form 8-K
filed by Dollar Financial Corp. on May 15, 2008 (File
No. 000-50866)
|
|
|
(11)
|
|
|
Incorporated by reference to the Current Report on
Form 8-K
filed by Dollar Financial Corp. on September 29, 2008 (File
No. 000-50866)
|
130
| |
|
|
|
|
|
Exhibit No.
|
|
Description of Document
|
|
|
|
|
(12)
|
|
|
Incorporated by reference to the Current Report on
Form 8-K
filed by Dollar Financial Corp. on December 5, 2008 (File
No. 000-50866)
|
|
|
(13)
|
|
|
Incorporated by reference to the Current Report on
Form 8-K
filed by Dollar Financial Corp. on March 20, 2009 (File
No. 000-50866)
|
|
|
(14)
|
|
|
Incorporated by reference to the Annual Report on
Form 10-K
filed by Dollar Financial Corp. on September 3, 2009 (File
No. 000-50866)
|
|
|
(15)
|
|
|
Incorporated by reference to the Current Report on
Form 8-K
filed by Dollar Financial Corp. on November 2, 2009 (File
No. 000-50866)
|
|
|
(16)
|
|
|
Incorporated by reference to the Quarterly Report on
Form 10-Q
filed by Dollar Financial Corp. on November 9, 2009 (File
No. 000-50866)
|
|
|
(17)
|
|
|
Incorporated by reference to the Current Report on
Form 8-K
filed by Dollar Financial Corp. on December 2, 2009 (File
No. 000-50866)
|
|
|
(18)
|
|
|
Incorporated by reference to the Current Report on
Form 8-K
filed by Dollar Financial Corp. on December 24, 2009 (File
No. 000-50866)
|
|
|
(19)
|
|
|
Incorporated by reference to the Quarterly Report on
Form 10-Q
filed by Dollar Financial Corp. on May 10, 2010 (File
No. 000-50866)
|
|
|
(20)
|
|
|
Incorporated by reference to the Current Report on
Form 8-K
filed by Dollar Financial Corp. on May 18, 2010 (File
No. 000-50866)
|
|
|
(21)
|
|
|
Incorporated by reference to the Registration Statement on
Form S-4/A
filed by National Money Mart Company and Dollar Financial Corp.
on May 21, 2010 (File
No. 333-165617)
|
|
|
(22)
|
|
|
Incorporated by reference to the Annual Report on
Form 10-K
filed by Dollar Financial Corp. on August 31, 2010 (File
No. 000-50866)
|
|
|
(23)
|
|
|
Incorporated by reference to the Current Report on
Form 8-K
filed by Dollar Financial Corp. on January 5, 2011 (File
No. 000-50866)
|
|
|
(24)
|
|
|
Incorporated by reference to the Quarterly Report on
Form 10-Q
filed by Dollar Financial Corp. on February 9, 2011 (File
No. 000-50866)
|
|
|
(25)
|
|
|
Incorporated by reference to the Current Report on
Form 8-K
filed by Dollar Financial Corp. on March 9, 2011 (File
No. 000-50866)
|
|
|
(26)
|
|
|
Incorporated by reference to the Current Report on
Form 8-K
filed by Dollar Financial Corp. on April 5, 2011 (File
No. 000-50866)
|
|
|
(27)
|
|
|
Incorporated by reference to the Quarterly Report on
Form 10-Q
filed by Dollar Financial Corp. on May 10, 2011 (File
No. 000-50866)
|
|
|
(28)
|
|
|
Incorporated by reference to the Current Report on
Form 8-K
filed by Dollar Financial Corp. on June 27, 2011 (File
No. 000-50866)
|
|
|
|
|
* |
|
Management contracts and compensatory plans and arrangements |
|
# |
|
Filed herewith. |
131
SIGNATURES
Pursuant to the requirements of Section 13 or 15(d) of the
Securities Exchange Act of 1934, the Registrant has duly caused
this report to be signed on its behalf by the undersigned,
thereunto duly authorized.
DFC GLOBAL CORP.
Randy Underwood
Executive Vice President and Chief Financial
Officer (principal financial officer)
Pursuant to the requirements of the Securities Exchange Act of
1934, this report has been signed below by the following persons
on behalf of the registrant and in the capacities and on the
dates indicated:
| |
|
|
|
|
|
|
|
Signature
|
|
Title
|
|
Date
|
|
|
|
|
|
|
|
|
|
/s/ JEFFREY
A. WEISS
Jeffrey
A. Weiss
|
|
Chairman of the Board of Directors and Chief Executive Officer
(principal executive officer)
|
|
August 29, 2011
|
|
|
|
|
|
|
|
/s/ RANDY
UNDERWOOD
Randy
Underwood
|
|
Executive Vice President and Chief Financial Officer (principal
financial officer)
|
|
August 29, 2011
|
|
|
|
|
|
|
|
/s/ WILLIAM
M. ATHAS
William
M. Athas
|
|
Senior Vice President, Finance, Chief Accounting Officer and
Corporate Controller (principal accounting officer)
|
|
August 29, 2011
|
|
|
|
|
|
|
|
/s/ DAVID
JESSICK
David
Jessick
|
|
Director
|
|
August 29, 2011
|
|
|
|
|
|
|
|
/s/ KENNETH
SCHWENKE
Kenneth
Schwenke
|
|
Director
|
|
August 29, 2011
|
|
|
|
|
|
|
|
/s/ CLIVE
KAHN
Clive
Kahn
|
|
Director
|
|
August 29, 2011
|
|
|
|
|
|
|
|
/s/ JOHN
GAVIN
John
Gavin
|
|
Director
|
|
August 29, 2011
|
|
|
|
|
|
|
|
/s/ RON
MCLAUGHLIN
Ron
McLaughlin
|
|
Director
|
|
August 29, 2011
|
|
|
|
|
|
|
|
/s/ MICHAEL
KOOPER
Michael
Kooper
|
|
Director
|
|
August 29, 2011
|
132