Attached files
| file | filename |
|---|---|
| EX-31.1 - CERTIFICATION PURSUANT TO SECTION 302 OF THE SARBANES-OXLEY ACT - WESTERGAARD COM INC | f10q0611ex31i_westergaard.htm |
| EX-32.1 - CERTIFICATION PURSUANT TO SECTION 906 OF THE SARBANES-OXLEY ACT - WESTERGAARD COM INC | f10q0611ex32i_westergaard.htm |
| EX-31.2 - CERTIFICATION PURSUANT TO SECTION 302 OF THE SARBANES-OXLEY ACT - WESTERGAARD COM INC | f10q0611ex31ii_westergaard.htm |
UNITED STATES
SECURITIES AND EXCHANGE COMMISSION
Washington, D.C. 20549
FORM 10-Q
(Mark One)
x QUARTERLY REPORT PURSUANT TO SECTION 13 OR 15 (d) OF THE SECURITIES EXCHANGE ACT OF 1934
For the quarterly period ended June 30, 2011
or
o TRANSITION REPORT PURSUANT TO SECTION 13 OR 15 (d) OF THE SECURITIES EXCHANGE ACT OF 1934
For the transition period from __________ to __________
Commission File Number: 000-29761
WESTERGAARD.COM, INC.
(Name of Registrant as specified in its charter)
| DELAWARE | 52-2002729 | |
| State or other jurisdiction of incorporation of organization) | (I.R.S. Employer Identification No.) |
Chendai Andou Industry Park, Jinjiang,
Quanzhou, Fujian, China 362211
(Address of principal executive offices)
86-13808527788
Indicate by check mark whether the registrant (1) has filed all reports required to be filed by Section 13 or 15(d) of the Securities Exchange Act of 1934 during the preceding 12 months (or for such shorter period that the registrant was required to file such reports), and (2) has been subject to such filing requirements for the past 90 days. Yes þ No o
Indicate by check mark whether the registrant has submitted electronically and posted on its corporate Web site, if any, every Interactive Data File required to be submitted and posted pursuant to Rule 405 of Regulation S-T (§232.405 of this chapter) during the preceding 12 months (or for such shorter period that the registrant was required to submit and post such files). Yes o No þ
Indicate by check mark whether the registrant is a large accelerated filer, an accelerated filer, a non-accelerated filer, or a smaller reporting company. See the definitions of "large accelerated filer," "accelerated filer" and "smaller reporting company" in Rule 12b-2 of the Exchange Act.
|
Large accelerated filer
|
o
|
Accelerated filer
|
o
|
|
Non-accelerated filer
(Do not check if smaller reporting company)
|
þ
|
Smaller reporting company
|
o
|
Indicate by check mark whether the registrant is a shell company (as defined in Rule 12b-2 of the Exchange Act) Yes o No þ
Indicate the number of shares outstanding of each of the issuer's classes of common stock, as of the latest practicable date. 34,431,262 shares of common stock are issued and outstanding as of August 15, 2011.
WESTERGAARD.COM, INC. AND SUBSIDIARIES
FORM 10-Q
June 30, 2011
TABLE OF CONTENTS
|
Page No.
|
||
|
PART I. - FINANCIAL INFORMATION
|
||
|
Item 1.
|
Financial Statements
|
|
|
Consolidated Balance Sheets as of June 30, 2011 (Unaudited) and December 31, 2010
|
3
|
|
|
Consolidated Statements of Income and Comprehensive Income for the Three and Six Months Ended June 30, 2011 and 2010 (Unaudited)
|
4
|
|
|
Consolidated Statements of Cash Flows for the Six Months Ended June 30, 2011 and 2010 (Unaudited)
|
5
|
|
| Notes to Unaudited Consolidated Financial Statements |
6
|
|
|
Item 2.
|
Management's Discussion and Analysis of Financial Condition and Results of Operations.
|
27
|
|
Item 3
|
Quantitative and Qualitative Disclosures About Market Risk.
|
38
|
|
Item 4
|
Controls and Procedures.
|
39
|
|
PART II - OTHER INFORMATION
|
||
|
Item 6.
|
Exhibits.
|
40
|
FORWARD LOOKING STATEMENTS
This report contains forward-looking statements regarding our business, financial condition, results of operations and prospects. Words such as “expects,” “anticipates,” “intends,” “plans,” “believes,” “seeks,” “estimates” and similar expressions or variations of such words are intended to identify forward-looking statements, but are not deemed to represent an all-inclusive means of identifying forward-looking statements as denoted in this report. Additionally, statements concerning future matters are forward-looking statements.
Although forward-looking statements in this report reflect the good faith judgment of our management, such statements can only be based on facts and factors currently known by us. Consequently, forward-looking statements are inherently subject to risks and uncertainties and actual results and outcomes may differ materially from the results and outcomes discussed in or anticipated by the forward-looking statements. Factors that could cause or contribute to such differences in results and outcomes include, without limitation, those specifically addressed under the headings “Risks Factors” and “Management’s Discussion and Analysis of Financial Condition and Results of Operations” in our Form 8-K filed on February 11, 2011, as amended, in “Management’s Discussion and Analysis of Financial Condition and Results of Operations” in this Form 10-Q and in other reports that we file with the SEC. You are urged not to place undue reliance on these forward-looking statements, which speak only as of the date of this report.
We file reports with the SEC. The SEC maintains a website (www.sec.gov) that contains reports, proxy and information statements, and other information regarding issuers that file electronically with the SEC, including us. You can also read and copy any materials we file with the SEC at the SEC’s Public Reference Room at 100 F Street, NE, Washington, DC 20549. You can obtain additional information about the operation of the Public Reference Room by calling the SEC at 1-800-SEC-0330.
We undertake no obligation to revise or update any forward-looking statements in order to reflect any event or circumstance that may arise after the date of this report, except as required by law. Readers are urged to carefully review and consider the various disclosures made throughout the entirety of this quarterly report, which are designed to advise interested parties of the risks and factors that may affect our business, financial condition, results of operations and prospects.
2
PART 1 - FINANCIAL INFORMATION
Item 1. Financial Statements.
WESTERGAARD.COM, INC. AND SUBSIDIARIES
CONSOLIDATED BALANCE SHEETS
|
June 30,
|
December 31,
|
|||||||
|
2011
|
2010
|
|||||||
|
(Unaudited)
|
||||||||
|
ASSETS
|
||||||||
|
CURRENT ASSETS:
|
||||||||
|
Cash and cash equivalents
|
$ | 38,508,638 | $ | 15,544,035 | ||||
|
Restricted cash
|
606,300 | - | ||||||
|
Accounts receivable
|
15,653,354 | 17,727,064 | ||||||
|
Advance to suppliers
|
- | 2,260,517 | ||||||
|
Prepaid expenses
|
42,543 | 18,906 | ||||||
|
Inventories
|
4,080,247 | 5,206,012 | ||||||
|
Total Current Assets
|
58,891,082 | 40,756,534 | ||||||
|
Property and equipment, net
|
1,370,857 | 951,816 | ||||||
|
Land use rights, net
|
237,100 | 234,765 | ||||||
|
TOTAL ASSETS
|
$ | 60,499,039 | $ | 41,943,115 | ||||
|
LIABILITIES AND SHAREHOLDERS' EQUITY
|
||||||||
|
CURRENT LIABILITIES:
|
||||||||
|
Short-term bank loans
|
$ | 3,635,520 | $ | 3,289,573 | ||||
|
Note payable
|
202,661 | - | ||||||
|
Accounts payable
|
6,588,234 | 2,724,057 | ||||||
|
Other payable and accrued liabilities
|
390,391 | 495,697 | ||||||
|
Due to related parties
|
381,797 | 514 | ||||||
|
Income taxes payable
|
1,887,305 | 693,031 | ||||||
|
Other taxes payable
|
826,694 | 593,046 | ||||||
|
|
||||||||
|
Total Current Liabilities
|
13,912,602 | 7,795,918 | ||||||
|
LONG-TERM LIABILITIES:
|
||||||||
|
Convertible debt, net
|
108,589 | 324,367 | ||||||
|
Total Liabilities
|
14,021,191 | 8,120,285 | ||||||
|
Commitments and contingencies
|
||||||||
|
SHAREHOLDERS' EQUITY:
|
||||||||
|
Series B convertible preferred stock ($0.001 par value; 4,000,000 authorized, 866,666
|
||||||||
|
and no shares issued and outstanding at June 30, 2011 and December 31, 2010, respectively,
|
||||||||
|
liquidation preference $1,300,000 at June 30, 2011)
|
867 | - | ||||||
|
Common stock ($0.001 par value; 100,000,000 shares authorized; 34,431,262 and
|
||||||||
|
33,949,212 share issued and outstanding at June 30, 2011 and December 31, 2010, respectively)
|
34,431 | 33,949 | ||||||
|
Additional paid-in capital
|
3,489,804 | 1,677,175 | ||||||
|
Subscription receivable
|
(35,000 | ) | (35,000 | ) | ||||
|
Retained earnings
|
39,474,903 | 29,555,834 | ||||||
|
Statutory reserve
|
837,048 | 837,048 | ||||||
|
Accumulated other comprehensive income
|
2,675,795 | 1,753,824 | ||||||
|
Total Shareholders' Equity
|
46,477,848 | 33,822,830 | ||||||
|
TOTAL LIABILITIES AND SHAREHOLDERS' EQUITY
|
$ | 60,499,039 | $ | 41,943,115 | ||||
See notes to the unaudited consolidated financial statements
3
WESTERGAARD.COM, INC. AND SUBSIDIARIES
CONSOLIDATED STATEMENTS OF INCOME AND COMPREHENSIVE INCOME
(UNAUDITED)
|
For the Three Months Ended June 30,
|
For the Six Months Ended June 30,
|
|||||||||||||||
|
2011
|
2010
|
2011
|
2010
|
|||||||||||||
|
NET SALES
|
$ | 27,779,852 | $ | 19,892,644 | $ | 52,195,438 | $ | 37,545,091 | ||||||||
|
COST OF SALES
|
19,191,669 | 14,192,420 | 35,759,083 | 26,886,869 | ||||||||||||
|
GROSS PROFIT
|
8,588,183 | 5,700,224 | 16,436,355 | 10,658,222 | ||||||||||||
|
OPERATING EXPENSES:
|
||||||||||||||||
|
Selling expenses
|
761,177 | 640,825 | 1,477,078 | 1,286,267 | ||||||||||||
|
Research and development expenses
|
65,642 | 45,421 | 129,134 | 102,865 | ||||||||||||
|
Professional fees
|
60,862 | 62,263 | 373,249 | 62,263 | ||||||||||||
|
General and administrative expenses
|
360,646 | 238,059 | 628,136 | 468,332 | ||||||||||||
|
Total Operating Expenses
|
1,248,327 | 986,568 | 2,607,597 | 1,919,727 | ||||||||||||
|
INCOME FROM OPERATIONS
|
7,339,856 | 4,713,656 | 13,828,758 | 8,738,495 | ||||||||||||
|
OTHER INCOME (EXPENSE):
|
||||||||||||||||
|
Interest income
|
38,572 | 13,098 | 56,447 | 23,961 | ||||||||||||
|
Debt issuance costs
|
- | (15,000 | ) | - | (15,000 | ) | ||||||||||
|
Interest expense
|
(95,302 | ) | (27,613 | ) | (166,872 | ) | (72,458 | ) | ||||||||
|
Total Other Expense
|
(56,730 | ) | (29,515 | ) | (110,425 | ) | (63,497 | ) | ||||||||
|
INCOME BEFORE INCOME TAXES
|
7,283,126 | 4,684,141 | 13,718,333 | 8,674,998 | ||||||||||||
|
INCOME TAXES
|
1,853,110 | 1,184,849 | 3,540,930 | 2,185,636 | ||||||||||||
|
NET INCOME
|
5,430,016 | 3,499,292 | 10,177,403 | 6,489,362 | ||||||||||||
|
DEEMED SERIES B CONVERTIBLE PREFERRED STOCK DIVIDEND
|
(258,334 | ) | - | (258,334 | ) | - | ||||||||||
|
NET INCOME AVAILABLE TO COMMON SHAREHOLDERS
|
$ | 5,171,682 | $ | 3,499,292 | $ | 9,919,069 | $ | 6,489,362 | ||||||||
|
COMPREHENSIVE INCOME:
|
||||||||||||||||
|
NET INCOME
|
$ | 5,430,016 | $ | 3,499,292 | $ | 10,177,403 | $ | 6,489,362 | ||||||||
|
OTHER COMPREHENSIVE INCOME:
|
||||||||||||||||
|
Foreign currency translation adjustment
|
690,493 | 97,468 | 921,971 | 100,313 | ||||||||||||
|
COMPREHENSIVE INCOME
|
$ | 6,120,509 | $ | 3,596,760 | $ | 11,099,374 | $ | 6,589,675 | ||||||||
|
NET INCOME PER COMMON SHARE:
|
||||||||||||||||
|
Basic
|
$ | 0.15 | $ | 0.10 | $ | 0.29 | $ | 0.19 | ||||||||
|
Diluted
|
$ | 0.15 | $ | 0.10 | $ | 0.28 | $ | 0.19 | ||||||||
|
WEIGHTED AVERAGE COMMON SHARES OUTSTANDING:
|
||||||||||||||||
|
Basic
|
34,431,262 | 33,949,212 | 34,319,405 | 33,949,212 | ||||||||||||
|
Diluted
|
35,666,338 | 34,138,212 | 35,149,674 | 34,043,712 | ||||||||||||
See notes to the unaudited consolidated financial statements
4
WESTERGAARD.COM, INC. AND SUBSIDIARIES
CONSOLIDATED STATEMENTS OF CASH FLOWS
(UNAUDITED)
|
For the Six Months Ended June 30,
|
||||||||
|
2011
|
2010
|
|||||||
|
CASH FLOWS FROM OPERATING ACTIVITIES:
|
||||||||
|
Net income
|
$ | 10,177,403 | $ | 6,489,362 | ||||
|
Adjustments to reconcile net income from operations to net cash
|
||||||||
|
provided by operating activities:
|
||||||||
|
Depreciation
|
77,078 | 74,970 | ||||||
|
Amortization of land use rights
|
2,994 | 2,869 | ||||||
|
Amortization of debt discount
|
65,867 | 8,544 | ||||||
|
Stock-based compensation
|
46,500 | - | ||||||
|
Changes in assets and liabilities:
|
||||||||
|
Restricted cash
|
(606,300 | ) | (272,710 | ) | ||||
|
Accounts receivable
|
2,447,172 | (5,362,735 | ) | |||||
|
Advance to suppliers
|
2,282,480 | - | ||||||
|
Prepaid expenses
|
(22,907 | ) | (21,947 | ) | ||||
|
Inventories
|
1,228,797 | (1,046,200 | ) | |||||
|
Note payable
|
202,661 | - | ||||||
|
Accounts payable
|
3,753,022 | 1,741,309 | ||||||
|
Other payable and accrued liabilities
|
(114,604 | ) | 1,332,730 | |||||
|
Income taxes payable
|
1,163,279 | 17,690 | ||||||
|
Other taxes payable
|
217,258 | 137,655 | ||||||
|
NET CASH PROVIDED BY OPERATING ACTIVITIES
|
20,920,700 | 3,101,537 | ||||||
|
CASH FLOWS FROM INVESTING ACTIVITIES:
|
||||||||
|
Purchase of property and equipment
|
(469,248 | ) | (31,244 | ) | ||||
|
NET CASH USED IN INVESTING ACTIVITIES
|
(469,248 | ) | (31,244 | ) | ||||
|
CASH FLOWS FROM FINANCING ACTIVITIES:
|
||||||||
|
Proceeds from bank loans
|
1,298,071 | 724,240 | ||||||
|
Repayment of bank loans
|
(1,030,821 | ) | - | |||||
|
Proceeds from convertible debt
|
- | 350,000 | ||||||
|
Net proceeds from sale of Series B convertible preferred stock
|
1,227,499 | - | ||||||
|
Proceeds from related party
|
376,570 | - | ||||||
|
NET CASH PROVIDED BY FINANCING ACTIVITIES
|
1,871,319 | 1,074,240 | ||||||
|
EFFECT OF FOREIGN CURRENCY FLUCTUATIONS ON
|
||||||||
|
CASH AND CASH EQUIVALENTS
|
641,832 | 69,640 | ||||||
|
NET INCREASE IN CASH AND CASH EQUIVALENTS
|
22,964,603 | 4,214,173 | ||||||
|
CASH AND CASH EQUILAVENTS - BEGINNING OF YEAR
|
15,544,035 | 12,789,430 | ||||||
|
CASH AND CASH EQUIVALENTS - END OF PERIOD
|
$ | 38,508,638 | $ | 17,003,603 | ||||
|
SUPPLEMENTAL DISCLOSURE OF CASH FLOW INFORMATION:
|
||||||||
|
Cash paid for:
|
||||||||
|
Interest
|
$ | 101,005 | $ | 63,914 | ||||
|
Income taxes
|
$ | 2,377,652 | $ | 2,037,667 | ||||
|
NON-CASH INVESTING AND FINANCING ACTIVITIES:
|
||||||||
|
Deemed series B convertible preferred stock dividend
|
$ | 258,334 | $ | - | ||||
See notes to the unaudited consolidated financial statements
5
WESTERGAARD.COM, INC. AND SUBSIDIARIES
NOTES TO UNAUDITED CONSOLIDATED FINANCIAL STATEMENTS
June 30, 2011
NOTE 1 – ORGANIZATION AND SUMMARY OF SIGNIFICANT ACCOUNTING POLICIES
Organization
Westergaard.com, Inc. (the “Company” or Westergaard”) was incorporated under the laws of the State of Delaware on August 15, 1996, as "Westergaard Online Systems, Inc." On February 18, 1999, the Company’s corporate name was changed to Westergaard.com, Inc.
On February 9, 2011, prior to the Exchange Agreement, the directors of the Company authorized a 100 for 1 reverse stock split with the record date effective as of February 9, 2011 and FINRA declared the reverse split effective on February 11, 2011. The reverse split was effective immediately prior to the closing of a Share Exchange Agreement (“Exchange Agreement”) and did not have the effect of reducing any of the shares issued in connection with the Exchange Agreement. The reverse split did, however, reduce the 48,200,927 shares outstanding immediately prior to the closing of the Exchange Agreement to 482,050 shares.
On February 11, 2011, the Company entered into the Exchange Agreement by and among (i) the Company, (ii) the principal stockholders of Westergaard, (iii) Anbailun International Holdings Limited (“Anbailun”), a holding company formed under the laws of the British Virgin Islands on April 12, 2010, and (iv) Ansheng International, Inc., Anbailun’s sole shareholder. Pursuant to the terms of the Exchange Agreement, the Company issued 33,949,212 shares of its common stock, par value US$0.001 per share (the “Common Stock”) representing approximately 98.6 % of the fully diluted outstanding shares of the Company (the “Share Exchange”) for all of the outstanding shares of Anbailun. As a result of the Share Exchange, Anbailun became a wholly-owned subsidiary of the Company.
Concurrent with the Share Exchange, Mr. Jinbiao Ding (“Mr. Ding”) was appointed the Chief Executive Officer of the Company and Mr. Lam, Director of Ansheng (HK) Holdings Limited, and Mr. Ding entered into a Share Transfer Agreement (the “Share Transfer Agreement”) dated February 11, 2011 and fully discussed below, pursuant to which Mr. Lam granted to Mr. Ding the option to purchase all of the 30,000 outstanding ordinary shares (the “Option Shares”) of Ansheng International, Inc. held by Mr. Lam at the nominal price of $30,000 or US$1.00 per share.
Anbailun is a holding company formed under the laws of the British Virgin Islands on April 12, 2010. Anbailun is the sole shareholder and incorporator of Ansheng (HK) Holdings Limited (“Ansheng (HK)”). Ansheng (HK) was incorporated under the laws of Hong Kong on June 18, 2010.
Pursuant to a restructuring plan intended to ensure compliance with the PRC rules and regulations (the “Restructuring”) and in order to effectuate a merger with a shell company, on September 15, 2010, Anbailun, through its directly wholly-owned subsidiary Ansheng (HK), signed an agreement to acquire 100% equity interests in Fujian Jinjiang Chendai Ansheng Shoes & Clothing Co., Ltd. (“Fujian Ansheng”), a limited liability company incorporated under the laws of the People’s Republic of China (the “PRC”) on July 25, 1995 and 100% owned and controlled by Mr. Ding for a cash payment to Mr. Ding of RMB 12,580,000 or approximately US$1,900,000, which was paid to Mr. Ding in February 2011 and represents the amount of original registered capital of Fujian Ansheng contributed by Mr. Ding. Also as part of the Restructuring, in February 2011, Ansheng (HK)’s capital was established by way of contributions from Mr. Ding of RMB 12,580,000, which aggregate amount equaled the total transfer price Mr. Ding was entitled to receive pursuant to the Restructuring and which he was paid by Ansheng (HK) for the transfer of his equity interests in Fujian Ansheng.
The acquisition of Ansheng Fujian by Ansheng (HK) was specifically intended to ensure compliance with the PRC M&A rules and regulations and to structure these entities to complete a recapitalization and reverse merger with a public shell. The Company anticipates that pursuant to the Share Transfer Agreement entered into by and between Mr. Lam and Mr. Ding, the ordinary shares of Ansheng International, Inc. will be transferred from Mr. Lam to Mr. Ding. As a result, Mr. Ding has continued to bear the residual risks of the combined entity.
6
The Fujian Ansheng Share Transfer Agreement was approved by the Fujian Provincial Government on December 1, 2010 and such acquisition took effect when Ansheng (HK) was registered as the sole shareholder of Fujian Ansheng with the Fujian Branch Office of the State Administration for Industry and Commerce on December 13, 2010. Although the Fujian Ansheng Share Transfer Agreement took effect on December 13, 2010, the necessary consideration of RMB 12,580,000 or approximately US$1,900,000 was not paid until February 2011. Accordingly, at December 13, 2010, we recorded a contribution receivable of approximately $1,900,000 from Mr. Ding which was offset by the distribution payable to Mr. Ding. Since it was the intent of all parties to complete a reverse merger with a public shell, the consideration was not paid until such a transaction occurred in February 2011, and Mr. Ding and Mr. Lam entered into the Share Transfer Agreement as described above.
Pursuant to ASC 805-10 and 805-40, the Share Exchange has been accounted for as a recapitalization, whereby the Company is deemed to be the accounting acquiree (legal acquirer) and Anbailun is the accounting acquirer (legal acquiree). The financial statements before the date of the Share Exchange are those of Anbailun with the results of the Company being consolidated from the date of the Share Exchange. The equity section and earnings per share has been retroactively restated to reflect the reverse acquisition and no goodwill was recorded.
On July 25, 1995, Fujian Ansheng was incorporated with registered capital of US$274,689 contributed by three owners Mr. Jinbiao Ding (50%), Mr. Choumou Ding (25%) and Ms. Jinfang Ding (25%). The registered capital was increased to US$636,715 by the three owners proportionately on December 20, 2001. In September 2007, Mr. Choumou Ding and Ms. Jinfang Ding transferred their ownership to Mr. Jinbiao Ding, and Mr. Jinbiao Ding contributed additional US$971,054 to Fujian Ansheng which increased its registered capital to US$1,607,769. Until Ansheng (HK)’s acquisition of Fujian Ansheng effective December 13, 2010, Fujian Ansheng was 100% owned by Mr. Ding.
As of June 30, 2011, details of the subsidiaries of the Company are as follows:
|
Subsidiaries’ names
|
Domicile date of incorporation
|
Paid -in capital
|
Effective ownership
|
Principal activities
|
||||
|
Anbailun
|
British Virgin
|
USD$35,000
|
100%
|
Holding company of
|
||||
|
Islands
|
Ansheng (HK)
|
|||||||
|
April 12, 2010
|
||||||||
|
Ansheng (HK)
|
Hong Kong
|
HK$10,000
|
100%
|
Holding company of
|
||||
|
|
June 18, 2010
|
Fujian Ansheng
|
||||||
|
Fujian Ansheng
|
People’s Republic of
|
RMB12,580,000
|
100%
|
Sports footwear
|
||||
|
China (“PRC”)
July 25, 1995
|
designer and
|
|||||||
|
manufacturer in China's domestic market in and rural areas.
|
7
The table below sets forth the proportion of equity interests in all entities and individuals involved before and after the Restructuring based on subscribed registered capital:
|
Ansheng International, Inc.
|
ANBAILUM
|
Ansheng (HK)
|
Fujian Ansheng
|
|||||||||||||||||||||||||||||
|
Before
|
After
|
Before
|
After
|
Before
|
After
|
Before
|
After
|
|||||||||||||||||||||||||
|
%
|
%
|
%
|
%
|
%
|
%
|
%
|
%
|
|||||||||||||||||||||||||
|
Shareholder
|
||||||||||||||||||||||||||||||||
|
Mr. Lam Chiu Ming ("Mr. Lam")
|
100 | 100 | * | — | — | — | — | — | — | |||||||||||||||||||||||
|
Ansheng International, Inc.
|
— | — | 100 | 100 | — | — | — | — | ||||||||||||||||||||||||
|
ANBAILUN
|
— | — | — | — | 100 | 100 | — | — | ||||||||||||||||||||||||
|
Ansheng (HK)
|
— | — | — | — | — | — | — | 100 | ||||||||||||||||||||||||
|
Mr. Ding
|
— | — | — | — | — | — | 100 | — | ||||||||||||||||||||||||
| 100 | 100 | 100 | 100 | 100 | 100 | 100 | — | |||||||||||||||||||||||||
* As part of the Restructuring, Mr. Lam and Mr. Ding entered into a Share Transfer Agreement (the “Share Transfer Agreement”) dated February 11, 2011, pursuant to which Mr. Lam granted to Mr. Ding the option to purchase all of the 30,000 ordinary shares (the “Option Shares”) of Ansheng International, Inc. held by Mr. Lam at the nominal price of US$1.00 per share. The option shares vest and become exercisable upon Fujian Ansheng attaining consolidated net income performance targets for fiscal 2011 of at least 120% of the audited consolidated net income of the year ended December 31, 2010 or alternatively if the performance target has not been met, by the payment of the alternative exercise price of US$30,000. Accordingly, upon exercise of such option, Mr. Ding will directly own and control 33,949,212 shares, or 98.6%, of the Company’s Common Stock.
As part of the Restructuring, Mr. Lam, a resident of Hong Kong and the sole shareholder of Ansheng International, Inc. agreed that without the prior written consent of Mr. Ding, Mr. Lam shall not vote his shares in the Company such that the Company shall (i) issue or create any new shares, equity, registered capital, ownership interest, or equity linked securities, or any options or warrants that are directly convertible into, or exercisable or exchangeable for, shares, equity, registered capital, ownership interest, or equity-linked securities of the Company, or other similar equivalent arrangements, (ii) alter the shareholding structure of the Company, (iii) cancel or otherwise alter the Option Shares, (iv) amend the register of members or the memorandum and articles of association of the Company, (v) liquidate or wind up the Company, or (vi) act or omit to act in such a way that would be detrimental to the interest of Mr. Ding in the Option Shares. Additionally, Mr. Lam agreed that no further directors would be appointed to the board of either Ansheng International, Inc., Anbailun, Ansheng (HK), or Fujian Ansheng without the prior written consent of Mr. Ding. Mr. Ding is able to control and manage the operational, investment and business decisions of these companies, including the ability to control decisions regarding any change in these companies’ capital structure or payment of dividends. Further, Mr. Ding has the ultimate authority to determine the composition of the board of directors for these companies.
The purpose of the Share Transfer Agreement is to enable Mr. Ding to re-acquire the ultimate legal ownership of Fujian Ansheng in compliance with PRC rules and regulations. The arrangement for Mr. Ding to control the holding companies and Fujian Ansheng as well as the Share Transfer Agreement are each an inseparable and indispensable part of the Restructuring which enables Mr. Ding to continue to have residual rewards of the combined entity.
Mr. Ding has retained a financial controlling interest in the combined entity through the above-discussed residual risks and rewards. Furthermore, during and after the Restructuring, there has been no change to Anbailun’s principal managers and Mr. Ding continues to act as the principal managing officer and employee of Anbailun and Fujian Ansheng has remained under common operating, management and financial control. As a result, the Restructuring has been accounted for as a combination of entities under common control and recapitalization of Fujian with no adjustment to the historical basis of the assets and liabilities of Fujian Ansheng, and the operations were consolidated as if the Restructuring occurred as of the beginning of the first accounting period presented in these consolidated financial statements.
8
The Company, through its operating subsidiary, Fujian Ansheng which is located in Fujian, China, is a sports footwear designer and manufacturer in China’s domestic market in Tier 3 cities and towns and rural areas. The Company’s products include skateboard shoes, sneakers, jogging shoes, basketball shoes, tennis shoes, boots, classic shoes and cotton-padded shoes. The Company’s operations include: (1) research and development of sports footwear with original design under its own brand names; (2) manufacturing of sports footwear; (3) manufacturing technologies that support the realization of its designs as well as ensure the quality of shoe products, and (4) a distribution network that covers several small cities and towns in northern and northeastern China.
Basis of presentation
The consolidated interim financial statements include the financial statements of the Company and its subsidiaries. All significant inter-company transactions and balances have been eliminated in consolidation.
The consolidated interim financial information as of June 30, 2011 and for the six months ended June 30, 2011 and 2010 have been prepared without audit, pursuant to the rules and regulations of the Securities and Exchange Commission (the “SEC”). These consolidated financial statements should be read in conjunction with the summary of significant accounting policies and notes to consolidated financial statements included in the Company’s Form 8-K/A that we filed on April 26, 2011.
In the opinion of management, all adjustments (which include normal recurring adjustments) necessary to present a fair statement of the Company’s consolidated financial position as of June 30, 2011, its consolidated results of operations and cash flows for the three and six months ended June 30, 2011 and 2010, as applicable, have been made. The interim results of operations are not necessarily indicative of the operating results for the full fiscal year or any future periods.
Use of estimates
The preparation of the consolidated financial statements in conformity with U.S. GAAP requires management to make estimates and assumptions that affect the reported amounts of assets, liabilities, revenues, expenses, and the related disclosures at the date of the consolidated financial statements and during the reporting period. Actual results could differ from these estimates. Significant estimates include the allowance for doubtful accounts, the allowance for obsolete inventory, the useful life of property and equipment and intangible assets, assumptions used in assessing impairment of long-term assets, and the fair value of embedded beneficial conversion features and warrants.
Cash and cash equivalents
Cash and cash equivalents are carried at cost and represent cash on hand, demand deposits placed with banks or other financial institutions with maturities of three months or less when purchased. The Company maintains cash and cash equivalents with various financial institutions in the PRC and the balances in banks in the PRC are uninsured.
Fair value of financial instruments
The Company adopted the guidance of Accounting Standards Codification (“ASC”) 820 for fair value measurements which clarifies the definition of fair value, prescribes methods for measuring fair value, and establishes a fair value hierarchy to classify the inputs used in measuring fair value as follows:
|
●
|
Level 1-Inputs are unadjusted quoted prices in active markets for identical assets or liabilities available at the measurement date.
|
|
●
|
Level 2-Inputs are unadjusted quoted prices for similar assets and liabilities in active markets, quoted prices for identical or similar assets and liabilities in markets that are not active, inputs other than quoted prices that are observable, and inputs derived from or corroborated by observable market data.
|
|
●
|
Level 3-Inputs are unobservable inputs which reflect the reporting entity’s own assumptions on what assumptions the market participants would use in pricing the asset or liability based on the best available information.
|
9
The carrying amounts reported in the balance sheets for cash, accounts receivable, advances to suppliers, loans payable, accounts payable and accrued expenses, and amounts due to related parties approximate their fair market value based on the short-term maturity of these instruments. The Company did not have any non-financial assets or liabilities that are measured at fair value on a recurring basis as of June 30, 2011 and December 31, 2010.
ASC 825-10 “Financial Instruments”, allows entities to voluntarily choose to measure certain financial assets and liabilities at fair value (fair value option). The fair value option may be elected on an instrument-by-instrument basis and is irrevocable, unless a new election date occurs. If the fair value option is elected for an instrument, unrealized gains and losses for that instrument should be reported in earnings at each subsequent reporting date. The Company did not elect to apply the fair value option to any outstanding instruments.
Concentrations of credit risk
The Company’s operations are carried out in the PRC. Accordingly, the Company's business, financial condition and results of operations may be influenced by the political, economic and legal environment in the PRC, and by the general state of the PRC's economy. The Company's operations in the PRC are subject to specific considerations and significant risks not typically associated with companies in North America. The Company's results may be adversely affected by changes in governmental policies with respect to laws and regulations, anti-inflationary measures, currency conversion and remittance abroad, and rates and methods of taxation, among other things.
Financial instruments which potentially subject the Company to concentrations of credit risk consist principally of cash and trade accounts receivable. Substantially all of the Company’s cash is maintained with state-owned banks within the PRC, and no deposits are covered by insurance. The Company has not experienced any losses in such accounts and believes it is not exposed to any risks on its cash in bank accounts. A significant portion of the Company’s sales are credit sales which are primarily to customers who have the ability to pay; however, concentrations of credit risk with respect to trade accounts receivables is limited due to generally short payment terms. The Company also performs ongoing credit evaluations of its customers to help further reduce credit risk.
Accounts receivable
Accounts receivable are presented net of an allowance for doubtful accounts. The Company maintains allowances for doubtful accounts for estimated losses. The Company reviews the accounts receivable on a periodic basis and makes general and specific allowances when there is doubt as to the collectability of individual balances. In evaluating the collectability of individual receivable balances, the Company considers many factors, including the age of the balance, a customer’s historical payment history, its current credit-worthiness and current economic trends. Accounts are written off after exhaustive efforts at collection. The Company recognized the probability of the collection for each customer and believes the amount of the balance as of June 30, 2011 and December 31, 2010 could be collected and accordingly, the Company did not record any allowance for doubtful accounts.
Advance to suppliers
Advance to suppliers represent partial payments or deposits for future inventory purchases. These advances to suppliers are non-interest bearing and unsecured. From time to time, vendors require a certain amount of monies to be deposited with them as a guarantee that the Company will receive their purchases on a timely basis and to secure inventory pricing. As of June 30, 2011 and December 31, 2010, the Company’s advances to suppliers amounted to US$0 and US$2,260,517, respectively.
Inventories
Inventories, consisting of raw materials, work in process and finished goods related to the Company’s products are stated at the lower of cost or market utilizing the weighted average method. An allowance is established when management determines that certain inventories may not be saleable. If inventory costs exceed expected market value due to obsolescence or quantities in excess of expected demand, the Company will record reserves for the difference between the cost and the market value. These reserves are recorded based on estimates. At June 30, 2011 and December 31, 2010, the Company did not record any inventory reserve.
10
Property and equipment
Property and equipment are carried at cost and are depreciated on a straight-line basis (after taking into account their respective estimated residual value) over the estimated useful lives of the assets. The cost of repairs and maintenance is expensed as incurred; major replacements and improvements are capitalized. When assets are retired or disposed of, the cost and accumulated depreciation are removed from the accounts, and any resulting gains or losses are included in income in the year of disposition. The Company examines the possibility of decreases in the value of fixed assets when events or changes in circumstances reflect the fact that their recorded value may not be recoverable.
The estimated useful lives are as follows:
|
Years
|
Residual Value
|
|||||||
|
Building
|
20 | 5 | % | |||||
|
Plant and machinery
|
10 | 5 | % | |||||
|
Furniture, fixtures and electronic equipment
|
5 | 5 | % | |||||
Land use rights
All land in the PRC is owned by the PRC government and cannot be sold to any individual or company. The Company has recorded the amounts paid to the PRC government to acquire long-term interests to utilize land underlying the Company’s facilities as land use rights. This type of arrangement is common for the use of land in the PRC. Land use rights are amortized on the straight-line method over the terms of the land use rights, which is 50 years.
Impairment of long-lived assets
In accordance with ASC Topic 360, the Company reviews long-lived assets for impairment whenever events or changes in circumstances indicate that the carrying amount of the assets may not be fully recoverable, or at least annually. The Company recognizes an impairment loss when the sum of expected undiscounted future cash flows is less than the carrying amount of the asset. The amount of impairment is measured as the difference between the asset’s estimated fair value and its book value. The Company did not record any impairment charges for the six months ended June 30, 2011 and 2010.
Revenue recognition
Pursuant to the guidance of ASC Topic 605 and ASC Topic 360, the Company recognizes revenue when persuasive evidence of an arrangement exists, delivery has occurred or services have been rendered, the purchase price is fixed or determinable and collectability is reasonably assured.
The Company organizes and attends two product trading fairs each year in May and October. The product trading fairs are attended by more than 100 existing and potential distributors and the Company receives a majority of its product orders from its independent distributors at these trade fairs, with certain amounts of follow-up orders thereafter. Revenue is recognized when products are delivered to its distributors and generally payment is due 60 days from the date of delivery. The Company's sales consist of the invoiced value of goods, net of a value-added tax (VAT).
Provisions for estimated returns and allowances, rebates to customers, and any other adjustments are provided for in the same period the related sales are recorded. Generally, the Company will record a reduction to gross sales based on estimated customer returns and allowances and rebates. These reductions are influenced by historical rates of customer returns and allowances and rebates as well as the specific identification of certain returns and allowances and rebates.
The actual amount of sales returns and allowances realized may differ from our estimates. If we determine that sales returns or allowances should be either increased or decreased, then the adjustment would be made to net sales in the period in which such a determination is made. No product returns allowance is made as products delivered and accepted by customers are normally not returned. Generally, pursuant to the Company’s sales agreements, the customer has seven days to return any damaged product. For the six months ended June 30, 2011 and 2010, the Company did not record any sales return or allowances.
11
The Company offers its customers a sales rebate if the respective customer’s sales of the Company’s products exceed certain levels. If the respective customers sales of product exceed specified sales levels, within one year, the Company shall award the customer between approximately 3% or 4% of the respective customer’s total yearly sales in cash or by writing-down the same amount from the accounts receivable at the end of the period. For the six months ended June 30, 2011 and 2010, sales rebates were netted against gross sales and amounted to US$1,557,685 or 3.0% of gross sales and US$1,492,374 or 3.8% of gross sales, respectively. For the three months ended June 30, 2011 and 2010, sales rebates were netted against gross sales and amounted to US$783,715 or 2.8% of gross sales and US$746,327 or 3.8% of gross sales, respectively.
Income taxes
The Company is governed by the Income Tax Law of the People’s Republic of China, Hong Kong and the British Virgin Islands. The Company accounts for income tax using the liability method prescribed by ASC 740, “Income Taxes”. Under this method, deferred tax assets and liabilities are determined based on the difference between the financial reporting and tax bases of assets and liabilities using enacted tax rates that will be in effect in the year in which the differences are expected to reverse. The Company records a valuation allowance to offset deferred tax assets if based on the weight of available evidence, it is more-likely-than-not that some portion, or all, of the deferred tax assets will not be realized. The effect on deferred taxes of a change in tax rates is recognized as income or loss in the period that includes the enactment date.
The Company applied the provisions of ASC 740-10-50, “Accounting for Uncertainty in Income Taxes”, which provides clarification related to the process associated with accounting for uncertain tax positions recognized in our financial statements. Audit periods remain open for review until the statute of limitations has passed. The completion of review or the expiration of the statute of limitations for a given audit period could result in an adjustment to the Company’s liability for income taxes. Any such adjustment could be material to the Company’s results of operations for any given quarterly or annual period based, in part, upon the results of operations for the given period. As of June 30, 2011 and December 31, 2010, the Company had no uncertain tax positions, and will continue to evaluate for uncertain positions in the future.
Value added tax
The Company is subject to value added tax (“VAT”) for manufacturing products. The applicable VAT rate is 17% for products sold in the PRC. The amount of VAT liability is determined by applying the applicable tax rate to the amount of goods sold (output VAT) less VAT accrued on purchases made with the relevant supporting invoices (input VAT).
Employee benefits
The Company’s operations and employees are all located in the PRC. The Company makes mandatory contributions to the PRC government’s health, retirement benefit and unemployment funds in accordance with the relevant Chinese social security laws. The costs of these payments are charged to income in the same period as the related salary costs and are not material.
Advertising
Advertising is expensed as incurred and is included in selling expenses on the accompanying consolidated statements of income. Advertising expenses amounted to US$1,374,428 and US$1,229,152 for the six months ended June 30, 2011 and 2010, respectively. Advertising expenses amounted to US$691,513 and US$614,622 for the three months ended June 30, 2011 and 2010, respectively.
Research and development
Research and development costs are expensed as incurred. These costs primarily consist of cost of materials used and salaries paid for the development of the Company’s products, and depreciation amount from machinery used. Research and development expenses amounted to US$129,134 and US$102,865 for the six months ended June 30, 2011 and 2010, respectively. Research and development expenses amounted to US$65,642 and US$45,421 for the three months ended June 30, 2011 and 2010, respectively.
12
Shipping costs
Shipping costs, if any, are included in selling expenses and were not material for the six months ended June 30, 2011 and 2010, respectively, since both the Company’s customers and suppliers pay for their respective shipping costs. The Company does not charge its customers for shipping and handling fees.
Related parties
Parties are considered to be related to the Company if the parties that, directly or indirectly, through one or more intermediaries, control, are controlled by, or are under common control with the Company. Related parties also include principal owners of the Company, its management, members of the immediate families of principal owners of the Company and its management and other parties with which the Company may deal if one party controls or can significantly influence the management or operating policies of the other to an extent that one of the transacting parties might be prevented from fully pursuing its own separate interests. The Company discloses all related party transactions. All transactions shall be recorded at fair value of the goods or services exchanged.
Foreign currency translation
The reporting currency of the Company is the U.S. dollar. The functional currency of the parent company and its subsidiary Anbailun is the U.S. dollar. The functional currency of Ansheng (HK) is the Hong Kong dollar, the functional currency of the Company’s subsidiary, Ansheng Fujian, is the Chinese Renminbi (“RMB”). For the subsidiaries whose functional currencies are the Hong Kong dollar or RMB, results of operations and cash flows are translated at average exchange rates during the period, assets and liabilities are translated at the unified exchange rate at the end of the period, and equity is translated at historical exchange rates. As a result, amounts relating to assets and liabilities reported on the statements of cash flows may not necessarily agree with the changes in the corresponding balances on the balance sheets. Translation adjustments resulting from the process of translating the local currency financial statements into U.S. dollars are included in determining comprehensive income. The foreign currency translation adjustment included in comprehensive income for the six months ended June 30, 2011 and 2010 amounted to US$921,971 and US$100,313, respectively, and for three months ended June 30, 2011 and 2010, amounted to US$690,493 and US$97,468, respectively Transactions denominated in foreign currencies are translated into the functional currency at the exchange rates prevailing on the transaction dates. Assets and liabilities denominated in foreign currencies are translated into the functional currency at the exchange rates prevailing at the acquisition date with any transaction gains and losses that arise from exchange rate fluctuations on transactions denominated in a currency other than the functional currency are included in the results of operations as incurred.
All of the Company’s revenue transactions are transacted in the functional currency. The Company does not enter any material transaction in foreign currencies and, accordingly, transaction gains or losses have not had, and are not expected to have, a material effect on the results of operations of the Company.
Asset and liability accounts at June 30, 2011 and December 31, 2010 were translated at 6.4640 RMB to US$1.00 and 6.61180 RMB to US$1.00, respectively, which were the exchange rates on the balance sheet dates. Equity accounts were stated at their historical rate. The average translation rates applied to the statements of income and comprehensive income for the six months ended June 30, 2011 and 2010 were 6.54818 RMB and 6.83475 RMB to US$1.00, respectively. Cash flows from the Company’s operations are calculated based upon the local currencies using the average translation rate. As a result, amounts related to assets and liabilities reported on the consolidated statements of cash flows will not necessarily agree with changes in the corresponding balances on the consolidated balance sheets.
Net income per share of common stock
ASC 260 “Earnings Per Share,” requires dual presentation of basic and diluted earnings per share (“EPS”) with a reconciliation of the numerator and denominator of the basic EPS computation to the numerator and denominator of the diluted EPS computation. Basic EPS excludes dilution. Diluted EPS reflects the potential dilution that could occur if securities or other contracts to issue common stock were exercised or converted into common stock or resulted in the issuance of common stock that then shared in the earnings of the entity.
13
Basic net income per share is computed by dividing net income available to common shareholders by the weighted average number of shares of common stock outstanding during the period. Diluted income per share is computed by dividing net income by the weighted average number of shares of common stock, common stock equivalents and potentially dilutive securities outstanding during each period. Potentially dilutive common stock consists of common stock issuable upon the conversion of convertible debt stock and series B convertible preferred stock (using the if-converted method) and common stock purchase warrants (using the treasury stock method).
The following table presents a reconciliation of basic and diluted net income per share:
|
Three Months Ended
|
Six Months Ended
|
|||||||||||||||
|
June 30,
|
June 30,
|
|||||||||||||||
|
2011
|
2010
|
2011
|
2010
|
|||||||||||||
|
Net income available to common stockholders for basic and diluted net income per share of common stock
|
$ | 5,171,682 | $ | 3,499,292 | $ | 9,919,069 | $ | 6,489,362 | ||||||||
|
Weighted average common stock outstanding - basic
|
34,431,262 | 33,949,212 | 34,319,405 | 33,949,212 | ||||||||||||
|
Effect of dilutive securities:
|
||||||||||||||||
|
Convertible debt
|
384,615 | 189,000 | 376,654 | 94,500 | ||||||||||||
|
Series B convertible preferred stock
|
745,333 | - | 372,666 | - | ||||||||||||
|
Warrants
|
105,128 | - | 80,949 | - | ||||||||||||
|
Weighted average common stock outstanding - diluted
|
35,666,338 | 34,138,212 | 35,149,674 | 34,043,712 | ||||||||||||
|
Net income per common share - basic and diluted
|
$ | 0.15 | $ | 0.10 | $ | 0.29 | $ | 0.19 | ||||||||
|
Net income per common share - basic and diluted
|
$ | 0.15 | $ | 0.10 | $ | 0.28 | $ | 0.19 | ||||||||
Accumulated other comprehensive income
Comprehensive income is comprised of net income and all changes to the statements of stockholders' equity, except those due to investments by stockholders, changes in paid-in capital and distributions to stockholders. For the Company, comprehensive income for the three and six months ended June 30, 2011 and 2010 included net income and unrealized gains from foreign currency translation adjustments.
Recent accounting pronouncements
In May 2011, the FASB issued ASU No. 2011-04, “Amendments to Achieve Common Fair Value Measurement and Disclosure Requirements in U.S. GAAP and IFRSs”, which is not expected to have a material impact on the consolidated financial statements upon adoption.
In June 2011, the FASB issued ASU No. 2011-05, “Presentation of Comprehensive Income”. Under the amendments in this ASU, an entity has two options for presenting its total comprehensive income: to present total comprehensive income and its components along with the components of net income in a single continuous statement, or in two separate but consecutive statements. The amendments in this ASU are required to be applied retrospectively and are effective for fiscal years, and interim periods within those years, beginning after December 15, 2011, with early adoption permitted. The Company intends to conform to the new presentation required in this ASU beginning with its Form 10-Q for the three months ended March 31, 2012.
Other accounting standards that have been issued or proposed by FASB that do not require adoption until a future date are not expected to have a material impact on the consolidated financial statements upon adoption.
14
NOTE 2 – ACCOUNTS RECEIVABLE
Accounts receivable at June 30, 2011 and December 31, 2010 consisted of the following:
|
June 30, 2011
|
December 31, 2010
|
|||||||
|
(Unaudited)
|
||||||||
|
Accounts receivable
|
$ | 15,653,354 | $ | 17,727,064 | ||||
|
Less: allowance for doubtful accounts
|
- | - | ||||||
|
Total
|
$ | 15,653,354 | $ | 17,727,064 | ||||
Management recognizes allowance for doubtful accounts by specific identification method. No allowance for doubtful accounts was recorded as of June 30, 2011 and December 31, 2010 as management believes no accounts are uncollectible as of June 30, 2011 and December 31, 2010. In evaluating the collectability of individual receivable balances, the Company considers many factors, including the age of the balance, a customer’s historical payment history, its current credit-worthiness and current economic trends. Accounts are written off after exhaustive efforts at collection.
NOTE 3 – INVENTORIES
At June 30, 2011 and December 31, 2010, inventories consisted of the following:
|
June 30, 2011
|
December 31, 2010
|
|||||||
|
(Unaudited)
|
||||||||
|
Raw materials
|
$ | 789,580 | $ | 764,016 | ||||
|
Work in process
|
2,427,221 | 3,681,100 | ||||||
|
Finished goods
|
863,446 | 760,896 | ||||||
| $ | 4,080,247 | $ | 5,206,012 | |||||
NOTE 4 – PROPERTY AND EQUIPMENT
At June 30, 2011 and December 31, 2010, property and equipment consist of the following:
|
June 30, 2011
|
December 31, 2010
|
|||||||
|
(Unaudited)
|
||||||||
|
Building and building improvements
|
$ | 1,942,760 | $ | 1,451,950 | ||||
|
Manufacturing equipment
|
771,880 | 805,973 | ||||||
|
Office equipment and furniture
|
65,874 | 67,723 | ||||||
| 2,780,514 | 2,325,646 | |||||||
|
Less: accumulated depreciation
|
(1,409,657 | ) | (1,373,830 | ) | ||||
|
Total
|
$ | 1,370,857 | $ | 951,816 | ||||
For the six months ended June 30, 2011 and 2010, depreciation expense amounted to US$77,078 and US$74,970, of which US$51,805 and US$51,087 was included in cost of sales, respectively. For the three months ended June 30, 2011 and 2010, depreciation expense amounted to US$37,811 and US$39,423, of which US$26,142 and US$26,224 was included in the cost of sales, respectively.
As of June 30, 2011, the buildings with net value of US$573,948 were collateralized for short-term bank loans of US$773,515 from Industrial and Commercial Bank of China Ltd. (“ICBC”) Jinjiang Branch. As of December 31, 2010, the buildings with net value of US$526,634 were collateralized for short-term bank loans of US$756,224 from ICBC Jinjiang Branch.
15
NOTE 5 – LAND USE RIGHTS
At June 30, 2011 and December 31, 2010, land use rights consist of the following:
|
Useful Life
|
June 30, 2011
|
December 31, 2010
|
|||||||
|
(Unaudited)
|
|||||||||
|
Land use rights
|
50 Years
|
$ | 303,326 | $ | 296,545 | ||||
|
Less: accumulated amortization
|
(66,226 | ) | (61,780 | ) | |||||
|
Total
|
$ | 237,100 | $ | 234,765 | |||||
Amortization expense for the six months ended June 30, 2011 and 2010 amounted to US$2,994 and US$2,869 and amortization expense for three months ended June 30, 2011 and 2010 amounted to US$1,506 and US$1,435, respectively.
As of June 30, 2011, land use right with net value of US$237,100 was collateralized for short-term bank loans of US$773,515 from ICBC Jinjiang Branch. As of December 31, 2010, land use right with net value of US$234,765 was collateralized for short-term bank loans from ICBC Jinjiang Branch.
Amortization of land use rights attributable to future periods is as follows:
|
Amount
|
||
|
The periods ending December 31:
|
(Unaudited)
|
|
|
2011
|
$
|
3,034
|
|
2012
|
6,067
|
|
|
2013
|
6,067
|
|
|
2014
|
6,067
|
|
|
2015
|
6,067
|
|
|
2016 and thereafter
|
209,798
|
|
|
Total
|
$
|
237,100
|
NOTE 6 – SHORT-TERM BANK LOANS
At June 30, 2011 and December 31, 2010, short-term bank loan consisted of the following:
|
June 30, 2011
|
December 31, 2010
|
|||
|
(Unaudited)
|
||||
|
Loan payable to Industrial and Commercial Bank of China, due on February 1, 2011 and bears annual interest based on the benchmark interest rate multiplied by 1.05 (6.1005% as of December 31, 2010), collateralized by accounts receivables and repaid on due date.
|
$
|
-
|
$
|
264,678
|
|
Loan payable to Industrial and Commercial Bank of China, due on July 15, 2011 with an annual interest rate based on the benchmark interest rate multiplied by 1.05 (6.6255% as of June 30, 2011) and collateralized by accounts receivables and guaranteed by Jinjiang Qiuzhi East Asia Shoes and Clothing Ltd and repaid on due date
|
495,050
|
483,983
|
||
|
Loan payable to Industrial and Commercial Bank of China, due on August 2, 2011 with an annual interest rate based on the benchmark interest rate multiplied by 1.05 (6.6255% as of June 30, 2011) and guaranteed by Jinjiang Qiuzhi East Asia Shoes and Clothing Ltd and repaid on due date
|
464,109
|
453,734
|
16
|
Loan payable to Industrial and Commercial Bank of China, due on June 2, 2011 with an annual interest rate based on the benchmark interest rate multiplied by 1.15 (7.2565% as of June 30, 2011) and repaid on due date.
|
-
|
756,224
|
||
|
Loan payable to Industrial and Commercial Bank of China, due on December 1, 2011 with annual interest rate based on the benchmark interest rate multiplied by 1.05 (6.6255% as of June 30, 2011) and collateralized by its accounts receivables and guaranteed by Jinjiang Qiuzhi East Asia Shoes and Clothing Ltd.
|
1,361,386
|
1,330,954
|
||
|
Loan payable to Industrial and Commercial Bank of China, due on November 11, 2011 with annual interest rate based on the benchmark interest rate multiplied by 1.05 (6.6255% as of June 30, 2011) and collateralized by the buildings and land use rights. See Note 5.
|
773,515
|
-
|
||
|
Loan payable to Industrial and Commercial Bank of China, due on March 10, 2012 with annual interest rate based on the benchmark interest rate multiplied by 1.05 (6.6255% as of June 30, 2011) and collateralized by its accounts receivables and guaranteed by Jinjiang Qiuzhi East Asia Shoes and Clothing Ltd.
|
541,460
|
-
|
||
|
Total
|
$
|
3,635,520
|
$
|
3,289,573
|
For the six months ended June 30, 2011 and 2010, interest expense related to loans amounted to US$101,005 and US$63,914 and for three months ended June 30, 2011 and 2010 amounted to US$57,841 and US$19,069, respectively. Weighted average annual interest rate for the six months ended June 30, 2011 and 2010 are 5.58% and 7.18% respectively.
NOTES 7 – NOTES PAYABLE
At June 30, 2011, notes payable amounting to $202,661 were issued by the Company to creditors with the banker’s acceptance payable at the maturity date for the purpose of raw materials for production. The Company has to repay the notes within six months from date of issuance and 5% service fees will be charged by banks for the issuance of the notes. The notes payable were collateralized by restricted cash of $202,661 as reflected on the accompanying consolidated balance sheets.
NOTE 8 – OTHER PAYABLE AND ACCRUED LIABILITIES
At June 30, 2011 and December 31, 2010, other payables and accrued liabilities consist of the following:
|
June 30, 2011
|
December 31, 2010
|
|||||||
|
(Unaudited)
|
||||||||
|
Accrued payroll payable
|
$ | 360,075 | $ | 411,193 | ||||
|
Other liabilities
|
30,316 | 84,504 | ||||||
| $ | 390,391 | $ | 495,697 | |||||
17
NOTE 9 – RELATED PARTY TRANSACTIONS
From time to time, Mr. Jinbiao Ding and Mrs. Shunmei Ding advanced funds to company for working capital purposes. These advances are non-interest bearing, unsecured and payable on demand. At June 30, 2011 and December 31, 2010, due to related parties was as follows:
|
Name
|
June 30, 2011
|
December 31, 2010
|
||||||
|
(Unaudited)
|
||||||||
|
Mr. Jinbiao Ding
|
$ | 15,151 | $ | 514 | ||||
|
Mrs. Shunmei Ding
|
366,646 | - | ||||||
|
Total
|
$ | 381,797 | $ | 514 | ||||
NOTE 10 – CONVERTIBLE DEBT
On May 12, 2010, Anbailun and Silver Rock Capital Limited (“Silver Rock Capital”) entered into a series of agreements (a securities purchase agreement and other related agreements (the “Bridge Loan Agreement)). Pursuant to the Bridge Loan Agreement, Silver Rock Capital provided capital in the form of a senior secured convertible note to Anbailun in the principal amount up to US$350,000 to be solely used for the fees and expenses incurred in preparation of the Offering in the U.S. capital market. In connection with the loan, Silver Rock Capital received a senior secured convertible note (the “Note”) in the aggregate principal amount of US$350,000. Pursuant to the original May 12, 2010 secured convertible note, the Note will mature on May 12, 2011, and carry no interest. Pursuant to the convertible note agreement, commencing at such time Anbailun becomes a publicly traded entity in the U.S. the holders of the Note have the right to convert the Note to the common stock of Anbailun with an initial conversion price (the “Conversion Price”) of (i) US$1.00 assuming that 35,000,000 shares of Anbailun's common or ordinary stock is issued and outstanding subject to adjustment for future share splits or (ii) eighty percent (80%) of the price of any securities sold in any financing of Anbailun. The convertible note included common stock warrants (the "Warrants") exercisable for a period of 5 years from issuance to purchase common stock of Anbailun up to the same amount of shares of the common stock issuable upon conversion of the Notes. Each warrant was exercisable with an initial exercise price equal to 120% of the Conversion Price of the Notes. On the agreement date, Anbailun was an inactive company with no assets or operations and was formed in contemplation of setting an offshore structure to eventually acquire the Company’s current operating subsidiary Fujian Ansheng which became effective on December 13, 2010 upon the approval of the applicable Chinese administrative agency.
On May 12, 2010, the Company evaluated whether or not the convertible debt contained embedded conversion options, which meet the definition of a derivatives under ASC Topic 815 - “Derivatives and Hedging” and related interpretations. The Company concluded that the convertible debt did not contain any embedded conversion options and was not a derivative. Since Anbailun was a private company, the common shares underlying the convertible debt could not be converted into cash and there was no net settlement.
In accordance with ASC Topic 470-20 – “Debt with Conversion and Other Options”, the convertible notes were considered not to have an embedded beneficial conversion feature because the convertible note was not fully convertible at the issuance date due to the contingency.
Pursuant to the terms of the initial Warrant, Silver Rock Capital was entitled to initially purchase 350,000 shares of common stock of Anbailun at an initial exercise price of US$1.20 per share. The Warrants had a term of 5 years after the issuance date. The warrant was treated as a discount to the convertible debt and was valued at US$68,355 and is being amortized over the one year initial note term. The fair market value of the stock warrant was estimated on the date of grant using the Black-Scholes option-pricing model using the following weighted-average assumptions: stock price of $0.75; expected dividend yield 0%; risk-free interest rate of 2.29%; volatility of 50% and an expected term of five years. For the six months ended June 30, 2011 and 2010, amortization of the debt discount into interest expense amounted US$65,867 and US$8,544, respectively. For the three months ended June 30, 2011 and 2010, amortization of the debt discount into interest expense amounted US$37,461 and US$8,544, respectively.
18
On February 11, 2011, the Company amended the convertible note agreement and the related warrants. Simultaneously with the Exchange Agreement with Anbailun, the Company amended its Bridge Loan Agreement dated May 12, 2010 with Silver Rock Capital, whereby (i) the note due date was extended to the mature on the earlier to occur of: (a) two (2) years from the closing of a reverse merger with a US Public Company; or (b) February 15, 2013, and (ii) the note became convertible into shares of common stock of the Company at a fixed conversion price of US$0.91 per share to replace the Conversion Price. Additionally, pursuant to the amended Bridge Loan Agreement, in replacement of the Warrants, Silver Rock Capital received a five (5) year warrant (“Amended Warrant”) to purchase 384,615 shares of the Company’s common stock at an initial fixed exercise price of US$1.09 per share. The fixed conversion price for the note and fixed exercise price for the warrants replaced any down-round provisions in the amendment.
The fair market value of the Amended Warrant was estimated to be $0.78 using the Black-Scholes option-pricing model using the following weighted-average assumptions: stock price of $1.50; expected dividend yield 0%; risk-free interest rate of 2.38%; volatility of 50% and an expected term of 4.25 years.
Pursuant to ASC Topic 470-20-35-1 to 35-3, since the initial terms of a contingent conversion option did not permit the Company to compute the number of shares that the Silver Rock Capital would receive if the contingent event occurred and the conversion price was adjusted, the Company waited until the contingent event occurred and then computed the resulting number of shares that would be received pursuant to the new conversion price. The number of shares that would be received upon conversion based on the adjusted conversion price would was compared with the number that would have been received before the occurrence of the contingent event. The excess number of shares multiplied by the commitment date stock price equals the incremental intrinsic value that resulted from the resolution of the contingency and the corresponding adjustment to the conversion price. That incremental amount shall be recognized when the triggering event occurs.
Accordingly, the Company recorded an Amended Warrant and additional beneficial conversion feature of US$281,645, the difference between the total debt (US$350,000) and the warrant value previously recorded (US$68,355).
The convertible debt liability is as follows at June 30, 2011 and December 31, 2010:
|
June 30, 2011
|
December 31, 2010
|
|||||||
|
(Unaudited)
|
$ | |||||||
|
Convertible debt
|
$ | 350,000 | 350,000 | |||||
|
Less: unamortized discount on convertible debt
|
(241,411 | ) | (25,633 | ) | ||||
|
Convertible debt, net
|
$ | 108,589 | $ | 324,367 | ||||
NOTE 11 – INCOME TAXES
The Company accounts for income tax pursuant to the accounting standards that requires the recognition of deferred tax assets and liabilities for both the expected impact of differences between the financial statements and the tax basis of assets and liabilities, and for the expected future tax benefit to be derived from tax losses and tax credit carryforwards. Additionally, the accounting standards require the establishment of a valuation allowance to reflect the likelihood of realization of deferred tax assets. Realization of deferred tax assets, including those related to the U.S. net operating loss carryforwards, are dependent upon future earnings, if any, of which the timing and amount are uncertain. The Company recognized no deferred tax asset or liability as of June 30, 2011 and December 31, 2010 since there was no difference between the financial statements and the tax basis of assets and liabilities, nor the expected future tax benefit to be derived from tax losses and tax credit carryforwards.
The Company and its subsidiaries file separate income tax returns.
United States
Westergaard was incorporated in Delaware. Westergaard did not earn any income that was derived in the United States for the three and six months ended June 30, 2011 and 2010 and therefore was not subject to income taxes. No deferred US taxes were reported as of June 30, 2011 and 2010 as all earnings in the PRC are intended to be permanently reinvested in the PRC operation.
19
British Virgin Islands
Anbailun was incorporated in the British Virgin Islands. Under the current laws of the British Virgin Islands, Anbailun is not subject to tax on income or capital gains. In addition, upon payments of dividends by Anbailun, no British Virgin Islands withholding tax is imposed.
Hong Kong
Ansheng (HK) was incorporated in Hong Kong. Ansheng (HK) did not earn any income that was derived in Hong Kong for the three and six months ended June 30, 2011 and 2010 and therefore was not subject to Hong Kong Profits Tax. The payments of dividends by Hong Kong companies are not subject to any Hong Kong withholding tax.
PRC
Fujian Ansheng is governed by the Income Tax Law of the People’s Republic of China. In the six months ended June 30, 2011 and 2010, under the Income Tax Laws of PRC, Chinese companies are generally subject to an income tax at an effective rate of 25%, on income reported in the statutory financial statements after appropriate tax adjustments. The tables below summarize the differences between the PRC statutory rate and the Company’s effective tax rate and are as follows for the six months ended June 30, 2011 and 2010:
|
Six months ended June 30,
|
||||||||
|
2011
|
2010
|
|||||||
|
(Unaudited)
|
(Unaudited)
|
|||||||
|
Statutory tax rates
|
25.00
|
% |
25.00
|
% | ||||
|
Non-deductible expenses (non-taxable income)
|
0.06 | % | 0.06 | % | ||||
|
Total provision for income taxes
|
25.06 | % | 25.06 | % | ||||
The Company and its subsidiaries did not have any unrecognized tax benefit as of June 30, 2011 and December 31, 2010.
NOTE 12 – OTHER TAXES PAYABLE
The following table reflects other taxes payable as of June 30, 2011 and December 31, 2010:
|
June 30, 2011
|
December 31, 2010
|
|||||||
|
(Unaudited)
|
||||||||
|
Value added taxes
|
$ | 758,435 | $ | 544,079 | ||||
|
Other taxes
|
68,259 | 48,967 | ||||||
|
Total
|
$ | 826,694 | $ | 593,046 | ||||
NOTE 13 – SHAREHOLDERS’ EQUITY
Preferred stock
Pursuant the Company’s articles of incorporation, the Company is authorized to issue 10,000,000 shares of preferred stock with a par value of $0.001, and that the Board of Directors have the authority to attach such terms as they deem fit with respect to the preferred stock. On April 13, 2011, the Company’s Board of Directors, adopted a resolution providing for the designation, rights, powers and preferences and the qualifications, limitations and restrictions of 4,000,000 shares of Series B Convertible Preferred Stock (the “Series B Preferred Stock”).
20
The Series B Preferred Stock has the following rights, preferences and limitations:
|
●
|
There are 4,000,000 authorized shares of series B preferred stock.
|
|
●
|
The holders of shares of Series B Preferred Stock shall not be entitled to dividends.
|
|
●
|
The Series B Preferred Stock shall have the following class voting rights (in addition to the voting rights set forth in Section 3(b) hereof). So long as any shares of the Series B Preferred Stock remain outstanding, the Company shall not, without the affirmative vote or consent of the holders of a majority of the shares of the Series B Preferred Stock outstanding at the time (the “Majority Holders”), given in person or by proxy, either in writing or at a meeting in which the holders of the Series B Preferred Stock vote separately as a class:
(i) authorize, create, issue or increase the authorized or issued amount of any class or series of Preferred Stock, which class or series, in any such case, ranks pari passu or senior to the Series B Preferred Stock, with respect to the distribution of assets on Liquidation (as defined below);
(ii) amend, alter or repeal the provisions of the Series B Preferred Stock, whether by merger, consolidation or otherwise, so as to adversely affect any right, preference, privilege or voting power of the Series B Preferred Stock; provided, however, that any creation and issuance of another series of Junior Stock shall not be deemed to adversely affect such rights, preferences, privileges or voting powers;
(iii) issue any shares of Series B Preferred Stock (or any securities convertible into or exercisable for, directly or indirectly, any shares of Series B Preferred Stock or other security, other than Junior Stock) other than pursuant to the Securities Purchase Agreement;
(iv) amend the Articles of Incorporation or By-Laws of the Company so as to affect materially and adversely any right, preference, privilege or voting power of the Series B Preferred Stock; provided, however, that any creation and issuance of another series of Junior Stock shall not be deemed to adversely affect such rights, preferences, privileges or voting powers;
Except with respect to transactions upon which the Series B Preferred Stock shall be entitled to vote separately as a class pursuant to Section 3(a) above and as otherwise required by Delaware law, the Series B Preferred Stock shall have no voting rights with the Common Stock or other equity securities of the Company. The Common Stock into which the Series B Preferred Stock is convertible shall, when issued, have all of the same voting rights as other issued and outstanding Common Stock of the Company, and none of the rights of the Series B Preferred Stock.
|
|
●
|
Upon any liquidation, dissolution or winding-up of the Company, whether voluntary or involuntary, the holders of the series B preferred stock have a liquidation preference of $1.50 per share.
|
|
●
|
Each share of series B preferred stock is convertible at any time (subject to the 9.99% limitations described below) into one share of common stock, subject to adjustment.
|
On April 13, 2011 (the “Closing Date”), the Company completed a private offering (the “Offering”), where it sold to certain institutional investors (the “Investors”), an aggregate of 866,666 investment units (each a “Unit” and collectively, the “Units”) at a price of $1.50 per unit (the “Unit Price”), for aggregate offering proceeds of $1,299,999 (the “Offering Proceeds”). Each Unit consists of (i) one (1) share of the series B convertible preferred stock of the Company, par value $0.001 per share (the “Series B Preferred Stock”), convertible into one (1) share (the “Conversion Shares”) of the common stock (the “Common Stock”), (ii) one (1) Class A Warrant (the “Class A Warrant”) to purchase 0.5 share of the common stock at a purchase price of $1.875 per share, which is equal to 125% of the Unit Price and (iii) one (1) Class B Warrant (the “Class B Warrant”) to purchase 0.5 share of the common stock at a purchase price of $2.25 per share, which is equal to 150% of the Unit Price (the Class A Warrant and the Class B Warrant, collectively as the “Investor Warrants”).
As a result of the Offering, the Company issued an aggregate of 866,666 shares of Series B Preferred Stock, 866,666 Class A Warrants to purchase an aggregate of 433,333 shares of its common stock, and 866,666 Class B Warrants to purchase an aggregate of 433,333 shares of its common stock.
21
Securities Purchase Agreement
We entered into a securities purchase agreement with each of the Investors evidencing such Investor’s investment (each a “Securities Purchase Agreement” and collectively the “Securities Purchase Agreements”). Pursuant to the Securities Purchase Agreements, the Investors were also granted the following rights:
|
●
|
Each holder of Series B Preferred Shares will have the right, at the option of the holder at any time following the Closing Date, without the payment of additional consideration, to convert Series B Preferred Shares into shares of common stock at an initial conversion price of $1.50 or a conversion ratio of one-to-one. The ratio for conversion of Series B Preferred Shares will be proportionally adjusted for any stock splits, dividends, recapitalizations, and the like. Provided that the common stock underlying the Series B Preferred Shares is registered in an effective registration statement or is available for resale under Rule 144, without limitation, all Series B Preferred Shares will be automatically converted into common stock at the date of the 24 month anniversary of the Closing Date.
|
|
●
|
For a period of 24 months following the Closing Date, the purchase price and the conversion price of the Series B Preferred Stock will be subject to full ratchet anti-dilution protection for issuances of Common Stock or any other financial instrument that is convertible into common stock (subject to certain customary carve outs) at a purchase price less than the Unit Price.
|
|
●
|
Each holder of Series B Preferred Shares shall have the right to participate pro rata (as defined in the Securities Purchase Agreement) on any subsequent financings of the Company within 24 months following the Closing Date, subject to certain carve-outs contained in the Securities Purchase Agreements.
|
Accounting for Series B convertible preferred stock
The Series B preferred stock has been classified as permanent equity as there was no redemption provision at the option of the holders that is not within our control on or after an agreed upon date. The Company evaluated the embedded conversion feature in the Series B preferred stock to determine if there was an embedded derivative requiring bifurcation. The Company concluded that the embedded conversion feature of the Series B preferred stock is not required to be bifurcated because the conversion feature is clearly and closely related to the host instrument.
The following table summarizes the allocation of proceeds to the Series B preferred stock and the Warrants:
|
Gross
proceeds
Allocated
|
Number of
instruments
|
Allocated
value per
instrument
|
||||||||||
|
US$
|
US$
|
|||||||||||
|
Class A Warrant
|
143,296
|
866,666
|
0.17
|
|||||||||
|
Class B Warrant
|
115,038
|
866,666
|
0.13
|
|||||||||
|
Series B preferred stock
|
1,041,665
|
866,666
|
1.20
|
|||||||||
|
Total
|
1,299,999
|
|||||||||||
The Company then evaluated whether a beneficial conversion feature exists by comparing the operable conversion price of Series B preferred stock with the fair value of the common stock at the commitment date. We concluded that the fair value of common stock was greater than the operable conversion price of Series B preferred stock at the commitment date and the intrinsic value of the beneficial conversion feature is less than the proceeds allocated to the Series B preferred stock. Accordingly, a portion of the total proceeds allocated to the Series B preferred stock were allocated to the beneficial conversion feature with a credit to additional paid-in capital upon the issuance of the Series B preferred stock. Since the Series B preferred stock may convert to the company’s common stock at any time on or after the initial issue date, all discount was immediately recognized as a deemed dividend amounting to $258,334 and a reduction to net income attributable to common shareholders. The fair value of the warrants was computed using the Black-Scholes model under the following assumptions: (1) expected life of 3 years; (2) volatility of 50.0%; (3) risk free interest of 1.26%, and (4) dividend rate of 0%.
22
Warrants
The Series A Warrants and the Series B Warrants, are respectively exercisable for a period of three years from the original issue date. The exercise price with respect to the Series A Warrants, in whole or in part, is $1.875 per share of Common Stock, which is equal to 125% of the Unit Price. The exercise price with respect to the Series B Warrants, in whole or in part, is $2.25 per share of Common Stock, which is equal to 150% of the Unit Price. The exercise prices of the Investor Warrants are subject to adjustment upon certain events, such as stock splits, combinations, dividends, distributions, reclassifications, mergers or other corporate changes.
On May 1, 2011, the Company issued 62,500 Series A Warrants and 62,500 Series B Warrants to is chief financial officer pursuant to an engagement letter. The fair value of the warrants amounted to $46,500 and was computed using the Black-Scholes model under the following assumptions: (1) expected life of 3 years; (2) volatility of 50.0%; (3) risk free interest of 1.26%, and (4) dividend rate of 0%. In connection with issuance of these warrants, for the three and six months ended June 30, 2011, the Company recorded stock-based compensation of $46,500.
Warrant activities for the six months ended June 30, 2011 are summarized as follows:
|
Six Months Ended June 30, 2011
|
||||||||
|
Number of Warrants
|
Weighted Average Exercise Price
|
|||||||
|
Balance at December 31, 2010
|
350,000 | $ | 1.20 | |||||
|
Granted
|
1,376,281 | 1.80 | ||||||
|
Exercised
|
- | - | ||||||
|
Forfeited
|
(350,000 | ) | (1.20 | ) | ||||
|
Balance at June 30, 2011
|
1,376,281 | $ | 1.79 | |||||
|
Warrants exercisable at June 30, 2011
|
1,376,281 | $ | 1.79 | |||||
The following table summarizes the shares of the Company's common stock issuable upon exercise of warrants outstanding at June 30, 2011:
|
Warrants Outstanding
|
Warrants Exercisable
|
|||||||||||||||||||||
|
Range of Exercise Price
|
Number Outstanding at June 30, 2011
|
Weighted Average Remaining Contractual Life (Years)
|
Weighted Average Exercise Price
|
Number
Exercisable at
June 30, 2011
|
Weighted Average Exercise Price
|
|||||||||||||||||
| $ | 1.875 | 495,833 | 2.79 | $ | 1.875 | 495,833 | $ | 1.875 | ||||||||||||||
| $ | 2.25 | 495,833 | 2.79 | 2.25 | 495,833 | 2.25 | ||||||||||||||||
| $ | 1.09 | 384,615 | 4.62 | 1.09 | 384,615 | 1.09 | ||||||||||||||||
| 1,376,281 | 3.38 | $ | 1.79 | 1,376,281 | $ | 1.79 | ||||||||||||||||
Registration Rights
In connection with the Offering, the Company entered into a registration rights agreement with the Investors (the “Registration Rights Agreement”), pursuant to which, the Company agreed to file a registration statement (the “Registration Statement”) with the Commission to register the Conversion Shares and the shares of common stock underlying the Investor Warrants within 60 days after the final closing of the Offering (“Required Filing Date”) and use its best efforts to have it declared effective within 150 days after the final closing of the Offering (“Required Effectiveness Date”). In the event of a full review of the Registration Statement by the Commission, the Required Effectiveness Date will be extended by 30 days. If the Registration Statement is not filed by the Required Filing Date or is not declared effective by the Required Effectiveness Date, the Company is required to pay cash liquidated damages to each Investor in the amount equal to 1% of such Investor’s subscription amount subscribed for by such Investor for each 30-day period for which the Company is not compliance, subject to a cap of ten percent (10%) of such Investor’s purchase amount.
23
On August 15, 2011, the Company entered into a Waiver of Penalties Related to Registration Rights Agreement (the “Waiver Agreement”) whereby the Company and substantially all of the Investors agreed to remove all references to penalty payments from the Registration Rights Agreement and each of the investors fully and irrevocably waive all penalty payments (Note 18– Subsequent Events).
Securities Escrow Agreement
In connection with the Offering, the Company entered into a securities escrow agreement with its principal stockholder, Ansheng International, and the Investors (the “Securities Escrow Agreement”), pursuant to which Ansheng International pledged 866,666 shares of our Common Stock in favor of the Investors to secure certain performance target obligations described below (the “Escrowed Shares”).
In the event that (i) the Company’s net income, subject to certain adjustments provided for in the Securities Purchase Agreement, for the fiscal year ended December 31, 2010 and 2011, are respectively less than 95% but above or equal to 85% of $15,160,000 (the “2010 Performance Threshold”) and $21,320,000 (the “2011 Performance Threshold”), then the Company shall deliver to the Investors, on a pro rata basis, additional shares of the Company’s common stock to account for such shortfall with respect to the applicable Performance Threshold, in an amount equal to the number of Escrowed Shares multiplied by 100 minus the percentage of the Performance Threshold that was achieved. The remaining Escrowed Shares not delivered to the Investors shall promptly be released from escrow and returned to Ansheng International. If the Company achieves less than 85% of the 2010 Performance threshold or 2011 Performance Threshold, then 100% of the number of the Escrowed Shares of such year will be made available to Investors and delivered pro rata based on the number of Series B Preferred Shares owned by such Investor at such date. The Company has completed its audit of fiscal year ended December 31, 2010 and has reached its 2010 Performance Threshold. Accordingly, one-half, or 433,333 of the Escrowed Shares were returned to Ansheng International, Inc.
In accordance to ASC Topic 718 and ASU No. 2010-05—Compensation—Stock Compensation: Escrowed Share Arrangements and the Presumption of Compensation. The Company evaluated the substance of this arrangement and whether the presumption of compensation has been overcome. According to the Security Escrow Agreement signed between the Company and its investors, the release of these escrow shares to the Principal Stockholder was not contingent on continued employment, and this arrangement is in substance an inducement made to facilitate the financing transaction on behalf of the Company, rather than compensatory. Therefore, the Company has accounted for the escrowed share arrangement according to its nature, and therefore did not recognize a non-cash compensation charge as a result of the Company satisfying the 2010 performance thresholds.
Lockup Agreements
In connection with the Offering, the Company entered into a lockup agreement with its principal stockholder, Ansheng International (the “Lockup Agreement”), pursuant to which, Ansheng International agreed not to transfer any shares of the Company’s common stock that it owns on the Closing Date, or may acquire on or after the closing of the Offering (the “Lockup Shares”), for a 24 month period following the closing of the Offering.
Investor Relation and Public Relation Escrow Agreement and Public Company Expenses Escrow Agreement
In connection with the Offering, the Company entered into an investor and public relation escrow agreement (the “IR and PR Escrow Agreement”) pursuant to which it agreed to deposit an amount of $300,000 from the Offering Proceeds with an escrow agent (the “IR and PR Escrowed Funds”). Subject to certain conditions provided in the IR and PR Escrow Agreement, the IR and PR Escrowed Funds will be released to the Company or directly to such creditors as invoices become due for all investor relation and public relation activities. Additionally, in connection with the Offering, the Company entered into a public company expenses escrow agreement with certain investor (the “Public Company Expenses Escrow Agreement”) pursuant to which it agreed to deposit an amount of $200,000 from the Offering Proceeds with an escrow agent (the “Public Company Expenses Escrowed Fund”). Subject to certain conditions provided in the Public Company Expenses Escrow Agreement, the Public Company Expenses Escrowed Fund will be released to the Company or directly to such creditors as invoices become due for all expenses related to being a public company in the US. At June 30, 2011, the Company had $403,639 remaining in these escrow accounts which has been reflected on the accompanying balance sheet as restricted cash.
24
NOTE 14 – STATUTORY RESERVES
The Company is required to make appropriations to reserve funds, comprising the statutory surplus reserve, statutory public welfare fund and discretionary surplus reserve, based on after-tax net income determined in accordance with PRC Corporation Law. Appropriation to the statutory surplus reserve should be at least 10% of the after tax net income determined in accordance with the PRC Company Law until the reserve is equal to 50% of the entities’ registered capital or members’ equity. The Company did not make any such appropriation for the six months ended June 30, 2011 and 2010 since the reserve balance as of December 31, 2007 reached 50% of its registered capital. The accumulated balance of the statutory reserve of the Company as of June 30, 2011 and December 31, 2010 was US$837,048.
In accordance with the PRC laws and regulations, the Company is restricted in their ability to transfer a portion of its net assets to the Company’s owner in the form of dividends. This portion US$837,048, as of June 30, 2011, represents the accumulated balance of statutory reserve maintained by the Company.
NOTE 15 – CONCENTRATIONS AND CREDIT RISKS
As of June 30, 2011 and December 31, 2010, the Company held cash in banks of US$38,486,715 and US$15,544,035, respectively that is uninsured by the PRC government authority. To limit exposure to credit risk relating to deposits, the Company primarily places cash deposits only with large financial institution in the PRC with acceptable credit rating.
The Company’s operations are carried out in the PRC. Accordingly, the Company’s business, financial condition and results of operations may be influenced by the political, economic and legal environments in the PRC as well as by the general state of the PRC’s economy. The business may be influenced by changes in governmental policies with respect to laws and regulations, anti-inflationary measures, currency conversion and remittance abroad, and rates and methods of taxation, among other things.
Customers
During the six months ended June 30, 2011, no customer accounted for 10% of the Company’s total sales. During the six months ended June 30, 2010, one customer accounted for 10% of the Company’s total sales and this customer accounted for 10% of the Company’s accounts receivable as of June 30, 2010. At December 31, 2010, no customer accounted for 10% or more of the Company’s total accounts receivable balance. During three months ended June 30, 2011, no customer accounted for 10% of the Company’s total sales. During three months ended June 30, 2010, two customer accounted for 21.72% of the Company’s total sales.
Suppliers
Three suppliers provided 39% of the Company’s purchases of raw materials (15%, 12% and 12%, respectively) for six months ended June 30, 2011, and these suppliers accounted for 35% of the Company’s accounts payable balance as of June 30, 2011. One supplier provided 15% of the Company’s purchases of raw materials for the six months ended June 30, 2010. Three suppliers provided 37% of the Company’s purchases of raw materials (13%, 12% and 12%, respectively) for three months ended June 30, 2011, and one supplier provided 17% of the Company’s purchase of raw materials for three months ended June 30, 2010.
NOTE 16 – SEGMENT INFORMATION
ASC 280, Segment Reporting, establishes standards for reporting information about operating segments. Operating segments are defined as components of an enterprise about which separate financial information is available that is evaluated regularly by the chief operating decision maker, or decision making group, in deciding how to allocate resources and in assessing performance. The Company’s chief operating decision maker is the Chief Executive Officer, who reviews consolidated results of operations prepared in accordance with U.S. GAAP when making decisions about allocating resources and assessing performance of the Company. The Company has only one operating segment.
25
NOTE 17 – COMMITMENTS AND CONTINGENCY
Operating lease
On June 1, 2009, the Company leased office space under an operating lease that expires on May 31, 2012. On December 26, 2010, the Company leased office space under an operating lease that expires on December 31, 2013. For the six months ended June 30, 2011 and 2010, rent expense amounted US$45,814 and US$40,382, respectively. For the three months ended June 30, 2011 and 2010, rent expense amounted US$23,050 and US$20,195, respectively. Future minimum rental payments required under the operating lease are as follows:
|
For the period ending December 31:
|
||||
|
2011
|
$ | 46,411 | ||
|
2012
|
65,749 | |||
|
2013
|
46,411 | |||
|
|
||||
|
Total
|
$ | 158,571 | ||
NOTE 18 – SUBSEQUENT EVENTS
Management has considered all events occurring through the date the financial statements have been issued, and has determined that there are no such events that are material to the financial statements, or all such material events have been fully disclosed.
On August 2, 2011, the Company entered to a short-term bank loan for approximately $496,000. The loan is due on May 11, 2012. The annual interest rate for the loan is 5.74% and the loan was guaranteed by Jinjiang Qiuzhi East Asia Shoes & Clothes LLP.
On August 15, 2011, the Company entered into a Waiver of Penalties Related to Registration Rights Agreement (the “Waiver Agreement”) whereby the Company and substantially all of the Investors agreed to remove all references to penalty payments from the Registration Rights Agreement and each of the investors fully and irrevocably waive all penalty payments. The Company is attempting to receive the Waiver Agreement from the one Investor that has yet to sign the agreement and believes that it will be successful in receiving it. If the Waiver Agreement from this Investor is not received, the maximum penalty will not exceed $30,000 and will be accrued in the third quarter of 2011.
26
Item 2. Management’s Discussion and Analysis of Financial Condition and Results of Operations.
The following discussion and analysis of the results of operations and financial condition of WESTERGAARD.COM INC. and its wholly owned subsidiaries, for the six months ended June 30, 2011 and 2010. This discussion and analysis below should be read in conjunction with our consolidated financial statements, and the notes to those financial statements that are included in Form 8-K filed with the SEC on February 11, 2011, as amended.
Overview
Operating through our wholly foreign owned subsidiary Fujian Ansheng located in Fujian, China, the Company is a sports footwear designer and manufacturer in China’s domestic market in smaller cities and towns and rural areas. Our products include skateboard shoes, sneakers, jogging shoes, basketball shoes, tennis shoes, boots, classic shoes and cotton-padded shoes. Our operations include: (1) research and development of sports footwear with original design under our own brand names; (2) manufacturing of sports footwear; (3) manufacturing technologies that support the realization of our designs as well as ensure the high quality of shoe products, (4) an effective distribution network that covers several small cities and towns in north and northeast China; (5) a strong management team consisting of experts with proven track records in the shoe business industry; and (6) well-recognized brand names and robust customer base.
Recent Development
Share Exchange
On February 11, 2011, we entered into the Share Exchange Agreement by and among (i) us, (ii) the principal stockholders of Westergaard (ii) ANBAILUN, and (iii) Ansheng International, ANBAILUN’s sole shareholder. Pursuant to the terms of the Exchange Agreement, we issued 33,949,212 shares of our Common Stock, par value $0.001 per share, representing approximately 98.6 % of the fully diluted outstanding shares of Westergaard in exchange for all of the shares of ANBAILUN. As a result of the Share Exchange, ANBAILUN and its subsidiaries, Ansheng (HK) and Fujian Jinjiang became our wholly-owned subsidiaries. As a result, the Share Exchange has been accounted for as a recapitalization, whereby ANBAILUN is deemed to be the accounting acquirer (legal acquiree) and Westergaard is the accounting acquiree (legal acquirer). The financial statements before the date of the Share Exchange are those of ANBAILUN with the results of Westergaard being consolidated from the date of the Share Exchange. The equity section and earnings per share will be retroactively restated to reflect the reverse acquisition and no goodwill will be recorded. ANBAILUN was incorporated under the laws of the British Virgin Islands on April 12, 2010 and Mr. Lam Chiu Ming is the sole shareholder of ANBAILUN since its inception. ANBAILUN, as the sole shareholder, incorporated Ansheng (HK).
Legal Structure and Corporate History
Our current corporate structure is set forth below:
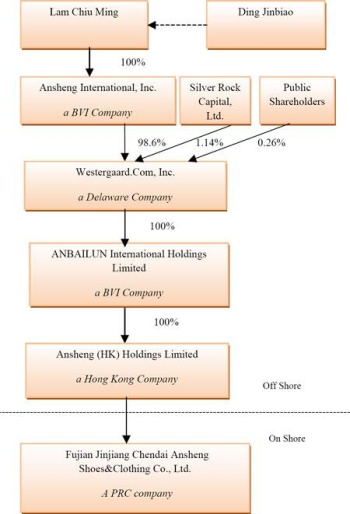
27
Accounting Treatment
Pursuant to the Restructuring, Mr. Ding is deemed to have retained financial controlling interests in the combined entity, and the combined entity remains under common control. As a result, the Restructuring has been accounted for as a combination of entities under common control and recapitalization of Fujian Ansheng with no adjustment to the historical basis of the assets and liabilities of Fujian Ansheng, and the operations were consolidated as if the Restructuring occurred as of the beginning of the first accounting period presented in these consolidated financial statements.
Critical accounting policies and estimates
Our discussion and analysis of our financial condition and results of operations are based upon our financial statements, which have been prepared in accordance with accounting principles generally accepted in the United States. The preparation of these financial statements requires us to make estimates and judgments that affect the reported amounts of assets, liabilities, revenues and expenses, and related disclosure of contingent assets and liabilities. We continually evaluate our estimates, including those related to bad debts, inventories, recovery of long-lived assets and the fair value of beneficial conversion features and warrants. We base our estimates on historical experience and on various other assumptions that we believed to be reasonable under the circumstances, the results of which form the basis for making judgments about the carrying values of assets and liabilities that are not readily apparent from other sources. Any future changes to these estimates and assumptions could cause a material change to our reported amounts of revenues, expenses, assets and liabilities. Actual results may differ from these estimates under different assumptions or conditions. We believe the following critical accounting policies affect our more significant judgments and estimates used in the preparation of the financial statements.
Revenue recognition
We recognize revenue when persuasive evidence of an arrangement exists, delivery has occurred or services have been rendered, the purchase price is fixed or determinable and collectability is reasonably assured.
We organize and attend two product trading fairs each year in May and October. The product trading fairs are attended by more than 100 existing and potential distributors and we receive a majority of our product orders from our independent distributors at these trade fairs, with certain amounts of follow-up orders thereafter. Revenue is recognized when products are delivered to our distributors and generally payment is due 60 days from the date of delivery. Our sales consist of the invoiced value of goods, net of a value-added tax (VAT).
Provisions for estimated returns and allowances, rebates to customers, and any other adjustments are provided for in the same period the related sales are recorded. Generally, we will record a reduction to gross sales based on estimated customer returns and allowances and rebates. These reductions are influenced by historical rates of customer returns and allowances and rebates as well as the specific identification of certain returns and allowances and rebates.
The actual amount of sales returns and allowances realized may differ from our estimates. If we determine that sales returns or allowances should be either increased or decreased, then the adjustment would be made to net sales in the period in which such a determination is made. No product return allowance is made as products delivered and accepted by customers are normally not returned. Generally, pursuant to our sales agreements, the customer has seven days to return any damaged product. Accordingly, for the six months ended June 30, 2011 and 2010, we did not record any sales return or allowances.
We offer our customers a sales rebate if the respective distributor’s sales of our products exceeds certain levels. If the respective customers sales of product exceed specified sales levels, within one year, we shall award the customer between 3% and 4% of the respective customer’s total annual sales, in cash or by writing-down the same amount from the accounts receivable at the end of the period. For the six months ended June 30, 2011 and 2010, sales rebates were netted against gross sales and amounted to US$1,557,685 or 3.0% of gross sales and US$1,492,374 or 3.8% of gross sales, respectively. For the three months ended June 30, 2011 and 2010, sales rebates were netted against gross sales and amounted to US$783,715 or 2.8% of gross sales and US$746,327 or 3.8% of gross sales, respectively.
28
Foreign currency translation
Our reporting currency is the U.S. dollar. The functional currency of the parent company and its subsidiary Anbailun is the U.S. dollar. The functional currency of Ansheng (HK) is the Hong Kong dollar. The functional currency of our subsidiary, Ansheng Fujian, is the Chinese Renminbi (“RMB”). For the subsidiaries whose functional currencies are the Hong Kong dollar or RMB, results of operations and cash flows are translated at average exchange rates during the period, assets and liabilities are translated at the unified exchange rate at the end of the period, and equity is translated at historical exchange rates. As a result, amounts relating to assets and liabilities reported on the statements of cash flows may not necessarily agree with the changes in the corresponding balances on the balance sheets. Translation adjustments resulting from the process of translating the local currency financial statements into U.S. dollars are included in determining comprehensive income. Transactions denominated in foreign currencies are translated into the functional currency at the exchange rates prevailing on the transaction dates. Assets and liabilities denominated in foreign currencies are translated into the functional currency at the exchange rates prevailing at the acquisition date with any transaction gains and losses that arise from exchange rate fluctuations on transactions denominated in a currency other than the functional currency are included in the results of operations as incurred.
All of our revenue transactions are transacted in RMB. We do not enter any material transaction in foreign currencies and, accordingly, transaction gains or losses have not had, and are not expected to have, a material effect on our results of operations.
Recent accounting pronouncements
In May 2011, the FASB issued ASU No. 2011-04, “’ Amendments to Achieve Common Fair Value Measurement and Disclosure Requirements in U.S. GAAP and IFRSs”, which is not expected to have a material impact on the consolidated financial statements upon adoption.
In June 2011, the FASB issued ASU No. 2011-05, “Presentation of Comprehensive Income”. Under the amendments in this ASU, an entity has two options for presenting its total comprehensive income: to present total comprehensive income and its components along with the components of net income in a single continuous statement, or in two separate but consecutive statements. The amendments in this ASU are required to be applied retrospectively and are effective for fiscal years, and interim periods within those years, beginning after December 15, 2011, with early adoption permitted. The Company intends to conform to the new presentation required in this ASU beginning with its Form 10-Q for the three months ended March 31, 2012.
Other accounting standards that have been issued or proposed by FASB that do not require adoption until a future date are not expected to have a material impact on the consolidated financial statements upon adoption.
29
RESULTS OF OPERATIONS FOR THE THREE AND SIX MONTHS ENDED JUNE 30, 2011 AND 2010 (Unaudited)
The following tables set forth key components of our results of operations for the periods indicated, in dollars, and key components of our revenue for the periods indicated, in dollars. The discussion following the table is based on these results.
|
For the Three Month Ended June 30,
|
For the Six Month Ended
June 30,
|
|||||||||||||||
|
2011
|
2010
|
2011
|
2010
|
|||||||||||||
|
(Unaudited)
|
(Unaudited)
|
(Unaudited)
|
(Unaudited)
|
|||||||||||||
|
NET SALES
|
$ | 27,779,852 | $ | 19,892,644 | $ | 52,195,438 | $ | 37,545,091 | ||||||||
|
COST OF SALES
|
19,191,669 | 14,192,420 | 35,759,083 | 26,886,869 | ||||||||||||
|
GROSS PROFIT
|
8,588,183 | 5,700,224 | 16,436,355 | 10,658,222 | ||||||||||||
|
OPERATING EXPENSES:
|
||||||||||||||||
|
Selling expenses
|
761,177 | 640,825 | 1,477,078 | 1,286,267 | ||||||||||||
|
Research and development expenses
|
65,642 | 45,421 | 129,134 | 102,865 | ||||||||||||
|
Professional fees
|
60,862 | 62,263 | 373,249 | 62,263 | ||||||||||||
|
General and administrative expenses
|
360,646 | 238,059 | 628,136 | 468,332 | ||||||||||||
|
Total Operating Expenses
|
1,248,327 | 986,568 | 2,607,597 | 1,919,727 | ||||||||||||
|
INCOME FROM OPERATIONS
|
7,339,856 | 4,713,656 | 13,828,758 | 8,738,495 | ||||||||||||
|
OTHER INCOME (EXPENSE):
|
||||||||||||||||
|
Interest income
|
38,572 | 13,098 | 56,447 | 23,961 | ||||||||||||
|
Debt issuance costs
|
- | (15,000 | ) | - | (15,000 | ) | ||||||||||
|
Interest expense
|
(95,302 | ) | (27,613 | ) | (166,872 | ) | (72,458 | ) | ||||||||
|
Total Other Expense
|
(56,730 | ) | (29,515 | ) | (110,415 | ) | (63,497 | ) | ||||||||
|
INCOME BEFORE INCOME TAXES
|
7,283,126 | 4,684,141 | 13,718,333 | 8,674,998 | ||||||||||||
|
INCOME TAXES
|
1,853,110 | 1,184,849 | 3,540,930 | 2,185,636 | ||||||||||||
|
NET INCOME
|
5,430,016 | 3,499,292 | 10,177,403 | 6,489,362 | ||||||||||||
|
OTHER COMPREHENSIVE INCOME:
|
||||||||||||||||
|
Foreign currency translation adjustment
|
690,493 | 97,468 | 921,971 | 100,313 | ||||||||||||
|
COMPREHENSIVE INCOME
|
$ | 6,120,509 | $ | 3,596,760 | $ | 11,099,374 | $ | 6,589,675 | ||||||||
Three and Six Months Ended June 30, 2011 Compared to Three and Six Months Ended June 30, 2010
Net sales. For the six months ended June 30, 2011, we had sales of $52,195,438, as compared to sales of $37,545,091 for the six months ended June 30, 2010, an increase of $14,650,347 or 39.0%. For the three months ended June 30, 2011, we had sales of $27,779,852 as compared to sales of $19,892,644 for the three months ended June 30, 2010, an increase of $7,887,208 or 39.6%. Sales and changes for each product line were summarized as follows:
|
Six Months Ended June 30,
|
||||||||||||||||
|
Increase
|
Percentage
|
|||||||||||||||
|
2011
|
2010
|
(Decrease)
|
Change
|
|||||||||||||
|
(Unaudited)
|
(Unaudited)
|
|||||||||||||||
|
Skateboard shoes
|
$ | 14,623,352 | $ | 8,854,001 | $ | 5,769,351 | 65.2 | % | ||||||||
|
Cotton shoes
|
469,751 | 182,673 | 287,078 | 157.2 | % | |||||||||||
|
Basketball shoes
|
- | 2,654,314 | (2,654,314 | ) | (100.0 | )% | ||||||||||
|
Running shoes
|
13,382,647 | 5,935,840 | 7,446,807 | 125.5 | % | |||||||||||
|
Tennis shoes
|
8,377,786 | 4,931,579 | 3,446,207 | 69.9 | % | |||||||||||
|
Casual shoes
|
15,341,902 | 10,374,930 | 4,966,972 | 47.9 | % | |||||||||||
|
Hiking shoes
|
- | 2,826,552 | (2,826,552 | ) | (100.0 | )% | ||||||||||
|
Retro shoes
|
- | 1,785,202 | (1,785,202 | ) | (100.0 | )% | ||||||||||
|
Total sales
|
$ | 52,195,438 | $ | 37,545,091 | $ | 14,650,347 | 39.0 | % | ||||||||
30
|
Three Months Ended June 30,
|
||||||||||||||||
|
Increase
|
Percentage
|
|||||||||||||||
|
2011
|
2010
|
(Decrease)
|
Change
|
|||||||||||||
|
Skateboard shoes
|
$ | 7,546,244 | $ | 5,052,885 | $ | 2,493,359 | 49.3 | % | ||||||||
|
Cotton shoes
|
3,778 | 474 | 3,304 | 697.0 | % | |||||||||||
|
Basketball shoes
|
- | 522,265 | (522,265 | ) | (100.0 | )% | ||||||||||
|
Running shoes
|
7,461,921 | 3,034,296 | 4,427,625 | 145.9 | % | |||||||||||
|
Tennis shoes
|
4,358,893 | 2,206,861 | 2,152,032 | 97.5 | % | |||||||||||
|
Casual shoes
|
8,409,016 | 7,421,100 | 987,916 | 13.3 | % | |||||||||||
|
Hiking shoes
|
- | 1,298,129 | (1,298,129 | ) | (100.0 | )% | ||||||||||
|
Retro shoes
|
- | 356,634 | (356,634 | ) | (100.0 | )% | ||||||||||
|
Total sales
|
$ | 27,779,852 | $ | 19,892,644 | $ | 7,887,208 | 39.6 | % | ||||||||
In the six and three months ended June 30, 2011, we classified the following retro shoe styles into its respective shoe style. In the six months ended June 30, 2010, we did not track retro shoes by these categories and all retro shoe types are included under retro shoes. Accordingly, in the six months ended June, 2011:
|
(a)
|
Sales of retro Skateboard shoes are included in Skateboard shoes
|
|
(b)
|
Sales of retro running shoes are included in Running shoes
|
|
(c)
|
Sales of retro tennis shoes are included in tennis shoes and
|
|
(d)
|
Sales of retro casual shoes are included in casual shoes.
|
During the six months ended June 30, 2011, we continued to see increased demand for our shoe products especially our casual shoe category which in 2010 includes our popular retro casual styles as discussed below. Overall, in the six months ended June 30, 2011, we sold approximately 4,409,000 pairs of shoes as compared to approximately 3,734,000 pairs of shoes in the six months ended June 30, 2010, an 18.1% increase in volume. Overall, we saw an increase in the selling price of 17.8% for the six months ended June 30, 2011 as compared to the selling price for the six months ended June 30, 2010. Overall, in the second quarter of fiscal 2011, we sold approximately 2,331,000 pairs of shoes as compared to approximately 1,986,000 pairs of shoes in the second quarter of fiscal 2010, a 17.4% increase in volume. Overall, we saw an increase in the selling price of 19.0% for the second quarter of fiscal 2011 as compared to the selling price for the second quarter of fiscal 2010.
We believe that the increase in sales volume was attributable to an increase in market demands caused by an increase in marketing and advertising efforts to enhance visibility and by the expansion of our sales distribution network. We believe the primary drivers behind the increase in market demand that contributed to our growth include:
|
(a)
|
During the six months ended June 30, 2011 and in 2010, we spent approximately $1,374,428 and $1,229,152 in selling and advertising to promote our brands. We advertise through TV commercials, roadside billboards, down town street lamps, promotional sales points in department stores and in key outdoor shopping areas to promote our products to target customers. In addition, we organize and participate in holiday sales, exhibition/trade fairs, school activity sponsorships and other promotional activities. In 2009 and 2010, we promoted our brand name by using pop star endorsements. We believe that with our advertising campaigns and the popularity of our a new stylish shoe marketed to young people between 18 to 35 years old mainly consisting of students in middle school, high school, and college, as well as young professionals, and people pursuing vogue, fashion and cutting edge style, have help us increase market demand and help drive our growth.
|
|
(b)
|
We focus on mid-to-low income populations in Tier 3 or below cities, as defined elsewhere herein, that consist of small cities and towns and rural areas, where there is a strong force of urbanization and potential rapid growth of disposable income. This particular segment has seen a substantial growth in part upon an increase of people moving to Tier 2 and Tier 3 cities. We formed this positioning strategy because the low barrier for market entry, the relatively lesser competition and the potential in that market. We believe that the population growth in our targeted cities in conjunction with our advertising campaign have helped drive sales.
|
31
|
(c)
|
Our distributors have gained more confidence in our products after they saw large sales increases year over and accordingly, they have increased the size of their orders which we primarily receive at product trading fairs attended by more than 100 existing and potential distributors. In order to drive sales, in cooperation with our distributors. In 2010 and during 2011, we began and continue to refurbish, decorate, and upgrade our sales counters, we increased counter space, and we also relocated our sales point in stores, supermarkets and outlets to better locations. In 2011, we sold to 37 distributors as compared 37 distributors in 2010. In 2011, sales to existing distributors increased by approximately $14,650,347. Additionally, in 2011, we added four new distributors to our distribution channels with net sales of approximately $3,580,175.
|
|
(d)
|
Since 2009, we have seen increased demand for four styles of shoes: Skateboard shoes, Running shoes, Tennis shoes and Casual shoes. This increase was primarily driven by the introduction of our retro shoe products. In 2009, we developed and began selling Retro shoes, a new stylish shoe marketed to young people between 18 to 35 years old mainly consisting of students in middle school, high school, and college, as well as young professionals, and people pursuing vogue, fashion and cutting edge style. Retro Shoes are designed to be fashionable, unique personality and emphasize flash/bright color and focus more on reflecting unique personality and life style, and are non-comparable in the niche market and thus face less competition. Since the launch of our retro shoe style launch in 2009, retro shoes have been very popular with our target customers and have become one of our best selling product lines. In 2010, we developed new retro products and expanded production. In 2010, we also re-classified our retro shoes products into five sub-categories retro skateboard shoes, retro casual shoes, retro running shoes, retro tennis shoes, and other retro shoes. In 2011 and 2010, sales of basketball shoes in the market have declined, instead sports-casual and life-casual series increased. Because of this change of customer’s preference, the sales of our basketball shoes have decreased.
|
China’s sports footwear market is expected to continue to grow and we expect our revenues to grow as we expand our distribution network into other cities. Our sales growth is dependent on our ability to expand our distribution network, the acceptance in the market of our cutting edge styles, and our competitive pricing model.
Cost of sales. For the six months ended June 30, 2011, cost of sales amounted to $35,759,083 as compared to $26,886,869 for the six months ended June 30, 2010, an increase of $8,872,214 or 33.0%. For the three months ended June 30, 2011, cost of sales amounted to $19,191,669 as compared to $14,192,420 for the three months ended June 30, 2010, an increase of $4,999,249 or 35.2%. For the six months ended June 30, 2011, cost of sales accounted for 68.5% of net sales compared to 71.6% of net sales for the six months ended June 30, 2010. For the three months ended June 30, 2011, cost of sales accounted for 69.1% of net sales compared to 71.3% of net sales for the three months ended June 30, 2010. The decrease in cost of sales as a percentage of net sales for the three and six months ended June 30, 2011 as compared to the three and six months ended June 30, 2010 was primarily attributable to the increase in our sales price as discussed above offset by an approximate 13.6% and 16.2% increase in production costs, respectively, attributable to rising raw material costs caused by an increase in the price of certain oil-based rubbers used in the manufacturing process which have increased due the price of oil.
Gross profit and gross margin. For the six months ended June 30, 2011, gross profit was $16,436,355 as compared to $10,658,222 for the six months ended June 30, 2010, representing gross margins of 31.5% and 28.3%, respectively. For the three months ended June 30, 2011, gross profit was $8,588,183 as compared to $5,700,724 for the three months ended June 30, 2010, representing gross margins of 30.9% and 28.7%, respectively. The increase in our overall gross margin percentage was primarily attributable to an increase in our selling price offset by an increase in production costs as described above. We expect gross margin will remain at its current level with small improvement in the near future.
32
Selling expenses. For the six months ended June 30, 2011, selling expenses were $1,477,078 as compared to $1,286,267 for the six months ended June 30, 2010, an increase of $190,811 or 14.8%. For the three months ended June 30, 2011, selling expenses were $761,177 as compared to $643,157 for the three months ended June 30, 2010, an increase of $118,020 or 18.4%. Selling expenses consisted of the following:
|
Three Months Ended June 30,
|
Six Months Ended June 30,
|
|||||||||||||||
|
2011
|
2010
|
2011
|
2010
|
|||||||||||||
|
(Unaudited)
|
(Unaudited)
|
(Unaudited)
|
(Unaudited)
|
|||||||||||||
|
Salaries and benefits
|
$ | 25,559 | $ | 15,039 | $ | 46,981 | $ | 34,790 | ||||||||
|
Depreciation
|
176 | 189 | 357 | 379 | ||||||||||||
|
Advertising
|
691,513 | 614,622 | 1,374,428 | 1,229,152 | ||||||||||||
|
Rent
|
11,524 | 10,975 | 22,907 | 21,946 | ||||||||||||
|
Other
|
32,405 | - | 32,405 | - | ||||||||||||
|
Total
|
$ | 761,177 | $ | 640,825 | $ | 1,477,078 | $ | 1,286,267 | ||||||||
|
●
|
For the three and six months ended June 30, 2011, salaries and benefits increased by$10.520 or 70% and $12,101 or 35.0%, respectively, attributable to an increase in salaries.
|
|
●
|
For the three and six months ended June 30, 2011, advertising expense increased by $76,891 or 12.5% and $145,276 or 11.8%, respectively, During the 2011 period, we spent more on advertising to promote our products and to enhance our visibility.
|
Research and development expenses. For the six months ended June 30, 2011, research and development expenses amounted to $129,134 as compared to $102,865 for the six months ended June 30, 2010, an increase of $26,269 or 25.5%. For the three months ended June 30, 2011, research and development expenses amounted to $65,642 as compared to $45,421 for the three months ended June 30, 2010, an increase of $20,221 or 44.5%. The increase was primarily attributable to the increase in salaries and benefits paid to our research and development department staff.
Professional fees. For the six months ended June 30, 2011, professional fees amounted to $373,249 as compared to $62,263 for the six months ended June 30, 2010, an increase of $310,986 or 499.5%. For the three months ended June 30, 2011, professional fees amounted to $60,862 as compared to $62,263 for the six months ended June 30, 2010, a decrease of $31,401 or 2.3%. During the 2011 period, we incurred professional fees related to our efforts to enter into a share exchange agreement with a publicly listed company in the United States and fees incurred in connection with our financial and legal reporting requirements. These fees included consulting fees, auditing, and legal fees. We will continue to incur such professional fees in the future since we completed our share exchange with a publicly traded company in February 2011.
General and administrative expenses. For the six months ended June 30, 2011, general and administrative expenses amounted to $581,636 as compared to $468,332 for the six months ended June 30, 2010, an increase of $113,304 or 24.2%. For the three months ended June 30, 2011, general and administrative expenses amounted to $314,146 as compared to $238,059 for the three months ended June 30, 2010, an increase of $76,087 or 32.0%. General and administrative expenses consisted of the following:
|
Three Months Ended June 30,
|
Six Months Ended June 30,
|
|||||||||||||||
|
2011
|
2010
|
2011
|
2010
|
|||||||||||||
|
(Unaudited)
|
(Unaudited)
|
(Unaudited)
|
(Unaudited)
|
|||||||||||||
|
Compensation and related benefits
|
$ | 160,263 | $ | 95,068 | $ | 261,101 | $ | 193,012 | ||||||||
|
Depreciation and amortization
|
13,065 | 12,104 | 26,486 | 25,679 | ||||||||||||
|
Travel and entertainment
|
79,207 | 70,971 | 163,722 | 139,500 | ||||||||||||
|
Rent
|
11,525 | 9,220 | 22,907 | 18,436 | ||||||||||||
|
Other
|
96,586 | 50,696 | 153,920 | 91,705 | ||||||||||||
|
Total
|
$ | 360,646 | $ | 238,059 | $ | 628,136 | $ | 468,332 | ||||||||
33
|
●
|
For the three and six months ended June 30, 2011, compensation and related benefits increased by $65,195 or 68.6% and $68,089 or 35.3%, respectively, as compared to the three and six months ended June 30, 2010. The increase was attributable the hiring of our chief executive officer in May 2011. Additionally, in May 2011, we recorded stock-based compensation of $46,500 related to issuance of warrants to our chief financial officer.
|
|
●
|
For the three and six months ended June 30, 2011, travel and entertainment expenses increased by $8,236 or 11.6% and $24,222 or 17.4%, respectively, as compared to the three and six months ended June 30, 2010. The increase was attributable the increased travel and entertainment activities incurred in fiscal 2011 related to our going public activities.
|
|
●
|
For the three and six months ended June 30, 2011, other general and administrative expenses which consist of office supplies, miscellaneous taxes, office maintenance, security fees, union fees and bank service charges increased by $45,890 or 90.5% and $62,215 or 67.8%, respectively, as compared to the three and six months ended June 30, 2010. The increase was mainly attributable to an increase in union fees, an increase in other miscellaneous items. And other fees related to our increased operations.
|
Income from operations. For the six months ended June 30, 2011, income from operations was $13,828,758 as compared to $8,738,495 for the six months ended June 30, 2010, an increase of $5,090,263 or 58.3%. For the three months ended June 30, 2011, income from operations was $7,339,856 as compared to $4,713,656, for the three months ended June 30, 2010, an increase of $2,626,200 or 55.7%.
Other income (expense). For the six months ended June 30, 2011, other expenses amounted to $110,425 as compared to other expenses of $63,497 for the six months ended June 30, 2010, an increase of $46,928 or 73.9%. For the three months ended June 30, 2011, other expenses amounted to $56,730 as compared to 29,515 for the six months ended June 30, 2010, an increase of $27,215 or 92.2%. The changes in other expenses included:
|
●
|
For the six months ended June 30, 2011, interest income increased by $32,486 or 135.6% as compared to the comparable period in 2010. For the three months ended June 30, 2011, interest income increased by $25,474 or 194.5% as compared to the comparable period in 2010. The increase in interest income was primarily attributable to the increase in funds in interest bearing accounts.
|
|
●
|
During the three and six months ended June 30, 2010, we paid debt issuance costs of $15,000 related to our convertible debt .We did not incur such expense in the 2011 periods.
|
|
●
|
For the six months ended June 30, 2011, interest expense increased by $94,414 or 130.3% as compared to the comparable period in 2010. For the three months ended June 30, 2011 interest expense increased by $67,689 or 245.1% as compared to the comparable period in 2010. The increase in interest expense was primarily attributable to recording of interest expense from the amortization debt discount of $65,867 for the six months ended June 30, 2011 and an increase in interest-bearing bank loans.
|
Income taxes expense. For the six months ended June 30, 2011, income tax expense increased by $1,355,294, or 62.0%, as compared to the six months ended June 30, 2010. For the three months ended June 30, 2011, income tax expense increased by $668,261, or 56.4%, as compared to the three months ended June 30, 2010. The increases in income taxes were attributed to the increase in taxable income.
Net income. As a result of the factors described above, our net income for the six months ended June 30, 2011 was $10,177,403 as compared to $6,489,362 for the six months ended June 30, 2010 and our net income for the three months ended June 30, 2011 was $5,430,016 as compared to $3,499,292 for the three months ended June 30, 2010.
Deemed preferred stock dividend. During the six months ended June 30, 2010, we did not have any deemed preferred stock dividend. In April 2011, we sold 866,666 shares of series B preferred stock for $1,299,999, Each share of series B preferred stock is convertible into one share of common stock. The effective price per share of common stock issuable upon conversion of the series B preferred stock was less than the market price on the dates of these sales. We recognized a deemed preferred stock dividend equal to the difference between the relative fair market value of the 866,666 shares of series B preferred stock, determined on an “as if converted” basis and the consideration we received for the series B preferred stock ($1,299,999), which was $258,334.
34
Net income available to common shareholders. For the six months ended June 30, 2011, our net income available to common shareholders was $9,919,069 or $0.29 per share (basic) and $0.28 per share (diluted) as compared to $6,489,362 or $0.19 per share (basic) and $0.19 per share (diluted). For the three months ended June 30, 2011, our net income available to common shareholders was $5,171,682 or $0.15 per share (basic) and $0.14 per share (diluted) as compared to $3,499,292 or $0.10 per share (basic) and $0.10 per share (diluted),
Foreign currency translation adjustment. For the three and six months ended June 30, 2011, we reported an unrealized gain on foreign currency translation of $762,828 and $994,306 as compared to $97,468 and $100,313 for the three and six months ended June 30, 2010. The change reflects the effect of the value of the U.S. dollar in relation to RMB. These gains are non-cash items. As described elsewhere herein, our operating subsidiary Fujian Ansheng’s functional currency is the Chinese Renminbi. The accompanying financial statements have been translated and presented in U.S. dollars using period end rates of exchange for assets and liabilities, and average rates of exchange for the period for net revenues, costs, and expenses. Net gains resulting from foreign exchange transactions, if any, are included in the statements of income and do not have a significant effect on our financial statements.
Comprehensive income. For the six months ended June 30, 2011, comprehensive income of $11,099,374 was derived from the sum of our net income of $10,177,403 plus a foreign currency translation gain of $921,971. For the three months ended June 30, 2011, comprehensive income of $6,120,509 was derived from the sum of our net income of $5,430,016 plus a foreign currency translation gain of $690,493. For the six months ended June 30, 2010, comprehensive income of $6,589,675 was derived from the sum of our net income of $6,489,362 plus a foreign currency translation gain of $100,313. For the three months ended June 30, 2010, comprehensive income of $3,596,760 was derived from the sum of our net income of $3,499,292 plus a foreign currency translation gain of $97,468.
Liquidity and Capital Resources
Liquidity is the ability of a company to generate funds to support its current and future operations, satisfy its obligations and otherwise operate on an ongoing basis. At June 30, 2011 and December 31, 2010, we had cash balances of $38,508,638 and $15,544,035, respectively. These funds are located in financial institutions located in China.
Working capital
The following table sets forth information as to the principal changes in the components of our working capital from December 31, 2010 to June 30, 2011:
|
December 31, 2010 to June 30, 2011
|
||||||||||||||||
|
Category
|
June 30, 2011
|
December 31, 2010
|
Change ($)
|
Change (%)
|
||||||||||||
|
(Unaudited)
|
||||||||||||||||
|
Current assets:
|
||||||||||||||||
|
Cash and cash equivalents
|
$ | 38,509,000 | $ | 15,544,000 | $ | 22,965,000 | 147.7 | |||||||||
|
Restricted cash
|
606,000 | - | 606,000 | 100.0 | ||||||||||||
|
Accounts receivable
|
15,653,000 | 17,727,000 | (2,074,000 | ) | (11.7 | ) | ||||||||||
|
Advance to suppliers
|
- | 2,261,000 | (2,261,000 | ) | (100.0 | ) | ||||||||||
|
Prepaid expenses
|
43,000 | 19,000 | 24,000 | 125.0 | ||||||||||||
|
Inventories
|
4,080,000 | 5,206,000 | (1,126,000 | ) | (21.6 | ) | ||||||||||
|
Current liabilities:
|
||||||||||||||||
|
Short-term bank loans
|
3,636,000 | 3,290,000 | 346,000 | (10.5 | ) | |||||||||||
|
Note payable
|
203,000 | - | 203,000 | 100.0 | ||||||||||||
|
Accounts payable
|
6,588,000 | 2,724,000 | 3,864,000 | 141.8 | ||||||||||||
|
Other payable and accrued liabilities
|
390,000 | 496,000 | (106,000 | ) | (21.2 | ) | ||||||||||
|
Due to related party
|
382,000 | 500 | 381,000 |
NM
|
||||||||||||
|
Income taxes payable
|
1,887,000 | 693,000 | 1,194,000 | 172.3 | ||||||||||||
|
Other taxes payable
|
827,000 | 593,000 | 233,000 | 19.4 | ||||||||||||
|
Working capital:
|
||||||||||||||||
|
Total current assets
|
$ | 58,891,000 | $ | 40,757,000 | $ | 18,134,000 | 44.5 | |||||||||
|
Total current liabilities
|
13,913,000 | 7,796,000 | 6,117,000 | 78.5 | ||||||||||||
|
Working capital
|
$ | 44,978,000 | $ | 32,961,000 | $ | 12,017,000 | 36.5 | |||||||||
35
Our working capital increased by $12,017,000 from working capital of $32,961,000 at December 31, 2010 to $44,978,000 at June 30, 2011. This increase in working capital is primarily attributable to:
|
●
|
an increase in cash and cash equivalents of $22,965,000 primarily due to our net income and the receipt of net proceeds from sale of Series B convertible preferred stock,
|
|
●
|
an increase in restricted capital of $606,000 attributable to funds escrowed pursuant to an escrow agreement related to the sale of Series B convertible preferred stock, and
|
|
●
|
a decrease in other payable and accrued liabilities of $106,000,
|
offset by:
|
●
|
a decrease in accounts receivable of $2,074,000 due to collections,
|
|
●
|
a decrease in advance to suppliers of $2,261,000 which has been applied to current purchases,
|
|
●
|
a decrease in inventories of $1,126,000,
|
|
●
|
an increase in short-term bank loans of $346,000,
|
|
●
|
an increase in note payable of $203,000,
|
|
●
|
an increase in accounts payable of $3,864,000,
|
|
●
|
an increase in due to related party of $381,000,
|
|
●
|
an increase in income taxes payable of $1,194,000, and
|
|
●
|
an increase in other taxes payable of $233,000.
|
At June 30, 2011, we had short-term bank loans outstanding of $3,636,000 as compared to $3,290,000 at December 31, 2010. These loans bear interest at rates ranging from 5.61% to 7.26%. Generally, we repay these loans on the due date and enter into new loan agreements with similar terms, if needed.
Cash Flows
The following summarizes the key components of the Company’s cash flows for the six months ended June 30, 2011 and 2010:
|
For the Six months ended
|
||||||||
|
2011
|
2010
|
|||||||
|
(Unaudited)
|
(Unaudited)
|
|||||||
|
Net cash provided by operating activities
|
$ | 20,920,700 | $ | 3,101,537 | ||||
|
Cash flows used in investing activities
|
(469,248 | ) | (31,244 | ) | ||||
|
Cash flows provided by financing activities
|
1,871,319 | 1,074,240 | ||||||
|
Effect of foreign currency fluctuations on cash and cash equivalents
|
641,832 | 69,640 | ||||||
|
Net increase in cash and cash equivalents
|
$ | 22,964,603 | $ | 4,214,173 | ||||
Net cash provided by operating activities
For the six months ended June 30, 2011, net cash flow provided by operating activities was primarily due to:
|
●
|
net income of $10,177,403 adjusted for the add-back of non-cash items such as depreciation of $77,000, the amortization of land use rights of $3,000, the amortization of debt discount of $66,000, and stock-based compensation of $46,500 and,
|
|
●
|
the receipt of cash from the changes in operating assets and liabilities such as:
|
|
Ø
|
a decrease in accounts receivable of $2,447,000 due to collections,
|
|
Ø
|
a decrease in advance to suppliers of $2,282,000 related to the application of advances to the purchase of raw materials,
|
|
Ø
|
a decrease in inventories of $1,229,000,
|
|
Ø
|
an increase in accounts payable of $3,698,000,
|
|
Ø
|
an increase in notes payable of $200,000 related to a bank acceptance payable for the purchase of raw materials,
|
|
Ø
|
an increase in income taxes payable of $1,163,000, and
|
|
Ø
|
an increase in other taxes payable of $217,000.
|
36
Offset by cash used in operating activities of:
|
●
|
use of cash from changes in operating assets and liabilities such as:
|
|
¨
|
an increase in restricted cash of approximately $404,000,
|
|
¨
|
an increase in prepaid expenses of $23,000, and
|
|
¨
|
a decrease in other payable and accrued liabilities of $59,000
|
For the six months ended June 30, 2010, net cash flow provided by operating activities was primarily due to:
|
●
|
net income of $6,575,000 adjusted for the add-back of non-cash items such as depreciation of $75,000, amortization of land use rights of $3,000, and the amortization of debt discount of $8,500, and
|
|
●
|
the receipt of cash from the changes in operating assets and liabilities such as:
|
|
Ø
|
an increase in accounts payable of $1,741,000,
|
|
Ø
|
an increase in other payable and accrued liabilities of $1,333,000,
|
|
Ø
|
an increase in income taxes payable of $18,000, and
|
|
Ø
|
an increase in other taxes payable of $138,000.
|
Offset by cash used in operating activities of:
|
●
|
use of cash from changes in operating assets and liabilities such as:
|
|
¨
|
an increase in accounts receivable of approximately $5,363,000 due to an increase in sales,
|
|
¨
|
an increase in prepaid expenses of $22,000, and
|
|
¨
|
an increase in inventories of $1,046,000
|
Cash flows used in investing activities
For the six months ended June 30, 2011 and 2010, net cash flow used in investing activities was $469,248 and $31,244 and related to the purchase of property and equipment.
Cash flows provided by financing activities
For the six months ended June 30, 2011, net cash flow provided by financing activities was primarily attributable to the proceeds from bank loans of $1,298,000, the proceeds from related party of $362,000, offset by the repayment of bank loans of $1,031,000. For the six months ended June 30, 2010, we received proceeds from bank loans of $724,000.
We reported a net increase in cash for the six months ended June 30, 2011 of $22,964,603 as compared to a net increase in cash of $4,214,173 for the six months ended June 30, 2010.
RESTRICTED NET ASSETS
Our ability to pay dividends is primarily dependent on us receiving distributions of funds from our subsidiaries. Relevant PRC statutory laws and regulations permit payments of dividends by the Fujian Ansheng only out of their retained earnings, if any, as determined in accordance with PRC accounting standards and regulations. The results of operations reflected in the financial statements prepared in accordance with U.S. GAAP differ from those reflected in the statutory financial statements of the Fujian Ansheng.
In accordance with the Regulations on Enterprises with Foreign Investment of China and their articles of association, a foreign invested enterprise established in the PRC is required to provide certain statutory reserves, namely general reserve fund, the enterprise expansion fund and staff welfare and bonus fund which are appropriated from net profit as reported in the enterprise’s PRC statutory accounts. A wholly-owned foreign invested enterprise is required to allocate at least 10% of its annual after-tax profit to the general reserve until such reserve has reached 50% of its respective registered capital based on the enterprise’s PRC statutory accounts. Appropriations to the enterprise expansion fund and staff welfare and bonus fund are at the discretion of the board of directors for all foreign invested enterprises. The aforementioned reserves can only be used for specific purposes and are not distributable as cash dividends. Fujian Ansheng was established as a foreign invested enterprise and therefore is subject to the above mandated restrictions on distributable profits.
37
As a result of these PRC laws and regulations that require annual appropriations of 10% of after-tax income to be set aside prior to payment of dividends as general reserve fund, Fujian Ansheng is restricted in their ability to transfer a portion of their net assets to the Company.
Amounts restricted include paid-in capital and statutory reserve funds of the Fujian Ansheng as determined pursuant to the PRC accounting standards and regulations, totaling approximately $2,445,000 as of June 30, 2011 and December 31, 2010, respectively.
Contractual Obligations and Off-balance Sheet Arrangements
We have certain fixed contractual obligations and commitments that include future estimated payments. Changes in our business needs, cancellation provisions, changing interest rates, and other factors may result in actual payments differing from the estimates. We cannot provide certainty regarding the timing and amounts of payments. We have presented below a summary of the most significant assumptions used in our determination of amounts presented in the tables, in order to assist in the review of this information within the context of our financial position, results of operations, and cash flows.
The following tables summarize our contractual obligations as of June 30, 2011 and the effect these obligations are expected to have on our liquidity and cash flows in future periods.
|
Payments due by period
|
||||||||||||||||||||
|
Contractual obligations
|
Total
|
Less than 1 year
|
1-3 Years
|
3-5 Years
|
5+ Years
|
|||||||||||||||
|
Bank indebtedness
|
$ | 3,636,000 | $ | 3,636,000 | $ | - | $ | - | $ | - | ||||||||||
|
Notes payable
|
203,000 | 203,000 | - | - | - | |||||||||||||||
|
Lease obligations
|
159,000 | 89,000 | 70,000 | - | - | |||||||||||||||
|
Total contractual obligations
|
$ | 3,998,000 | $ | 3,928,000 | $ | 70,000 | $ | - | $ | - | ||||||||||
We have not entered into any other financial guarantees or other commitments to guarantee the payment obligations of any third parties. We have not entered into any derivative contracts that are indexed to our shares and classified as shareholder’s equity or that are not reflected in our financial statements. Furthermore, we do not have any retained or contingent interest in assets transferred to an unconsolidated entity that serves as credit, liquidity or market risk support to such entity. We do not have any variable interest in any unconsolidated entity that provides financing, liquidity, market risk or credit support to us or engages in leasing, hedging or research and development services with us.
Item 3. Quantitative and Qualitative Disclosures About Market Risk.
Interest Rate Risk
Changes in interest rates may affect the interest paid (or earned) and therefore affect our cash flows and results of operations. However, we do not believe that this interest rate change risk is significant.
Inflation
Inflation in China has not materially impacted our results of operations. According to the National Bureau of Statistics of China, the consumer price index in China rose 4.8% and 5.9% in 2007 and 2008, respectively, and decreased by 0.7% in 2009. In September 2010, the consumer price index increased by 2.9% as compared to September 2009. Although we have not in the past been materially affected by inflation, we may be affected in the future by higher rates of inflation in China. For example, certain operating costs and expenses, such as personnel expenses, travel expenses and office operating expenses may increase as a result of higher inflation. Additionally, because a substantial portion of our assets consists of cash and cash equivalents, high inflation could significantly reduce the value and purchasing power of these assets. Inflation has not had a material impact on the Company’s business for the Company’s three most recent fiscal years.
38
Currency Exchange Fluctuations
All of the Company’s revenues are denominated in Chinese Renminbi, while its expenses are denominated primarily in Chinese Renminbi (“RMB”). The value of the RMB-to-U.S. dollar and other currencies may fluctuate and is affected by, among other things, changes in political and economic conditions. Since 1994, the conversion of Renminbi into foreign currencies, including U.S. dollars, has been based on rates set by the People’s Bank of China (“PBOC”), which are set daily based on the previous day’s inter-bank foreign exchange market rates and current exchange rates on the world financial markets. Since 1994, the official exchange rate for the conversion of Renminbi to U.S. dollars had generally been stable and the Renminbi had appreciated slightly against the U.S. dollar. However, on July 21, 2005, the Chinese government changed its policy of pegging the value of Chinese Renminbi to the U.S. dollar. Under the new policy, Chinese Renminbi may fluctuate within a narrow and managed band against a basket of certain foreign currencies. Recently there has been increased political pressure on the Chinese government to decouple the Renminbi from the United States dollar. At the recent quarterly regular meeting of PBOC, its Currency Policy Committee affirmed the effects of the reform on Chinese Renminbi exchange rate. Since February 2006, the new currency rate system has been operated; the currency rate of Renminbi has become more flexible while basically maintaining stable and the expectation for a larger appreciation range is shrinking. The Company has never engaged in currency hedging operations and has no present intention to do so.
Country Risk
A substantial portion of our assets and operations are located and conducted in China. While the PRC economy has experienced significant growth in the past twenty years, growth has been uneven, both geographically and among various sectors of the economy. The Chinese government has implemented various measures to encourage economic growth and guide the allocation of resources. Some of these measures benefit the overall economy of China, but may also have a negative effect on us. For example, our operating results and financial condition may be adversely affected by government control over capital investments or changes in tax regulations applicable to us. If there are any changes in any policies by the Chinese government and our business is negatively affected as a result, then our financial results, including our ability to generate revenue and profits, will also be negatively affected.
Item 4. Controls and Procedures.
Disclosure Controls and Procedures
As required by Rule 13a-15 under the Exchange Act, our management evaluated the effectiveness of the design and operation of our disclosure controls and procedures as of June 30, 2011.
Disclosure controls and procedures refer to controls and other procedures designed to ensure that information required to be disclosed in the reports we file or submit under the Securities Exchange Act is recorded, processed, summarized and reported within the time periods specified in the rules and forms of the SEC and that such information is accumulated and communicated to our management, including our chief executive officer and chief financial officer, as appropriate, to allow timely decisions regarding required disclosure. In designing and evaluating our disclosure controls and procedures, management recognizes that any controls and procedures, no matter how well designed and operated, can provide only reasonable assurance of achieving the desired control objectives, and management is required to apply its judgment in evaluating and implementing possible controls and procedures.
Management conducted its evaluation of disclosure controls and procedures under the supervision of our chief executive officer and our chief financial officer. Based on that evaluation, our management concluded that our disclosure controls and procedures were not effective to ensure that information required to be included in our periodic SEC filings is recorded, processed, summarized, and reported within the time periods specified in the SEC’s rules and forms, due to the significant deficiencies related to (i) lack of U.S. GAAP expertise of our internal accounting staff, (ii) our internal audit functions, (iii) lack of segregation of duties within accounting functions, and (iv) lack of an independent board of directors or audit committee. Although our management believes that these deficiencies do not amount to a material weakness, our management concluded that our disclosure controls and procedures were not effective as of June 30, 2011.
39
Remediation Measures
In order to correct the foregoing deficiencies, we have taken the following remediation measures:
|
●
|
In May 2011, we hired our chief financial officer who has extensive experience in SEC and financial reporting for publicly-traded companies.
|
|
●
|
We have committed to the establishment of effective internal audit functions and we plan on hiring a Sarbanes-Oxley consulting firm to assist us with implementation of stronger internal controls and procedures.
|
| ● |
Due to our size and nature, segregation of all conflicting duties may not always be possible and may not be economically feasible and except hiring our chief financial officer we have not been able to take steps to improve our internal controls over financial reporting during the six months ended June 30, 2011. We plan on adopting a formal plan and we expect to take significant steps to implement this plan during 2011. However, to the extent possible, we are implementing procedures to assure that the initiation of transactions, the custody of assets and the recording of transactions will be performed by separate individuals.
|
A material weakness (within the meaning of PCAOB Auditing Standard No. 5) is a deficiency, or a combination of deficiencies, in internal control over financial reporting, such that there is a reasonable possibility that a material misstatement of our annual or interim financial statements will not be prevented or detected on a timely basis. A significant deficiency is a deficiency, or a combination of deficiencies, in internal control over financial reporting that is less severe than a material weakness; yet important enough to merit attention by those responsible for oversight of the company’s financial reporting.
Changes in Internal Controls over Financial Reporting
There were no changes in our internal controls over financial reporting during the period covered by this report that have materially affected, or are reasonably likely to materially affect, our internal control over financial reporting.
PART II - OTHER INFORMATION
31.1 Rule 13a-14(a)/15d-14(a) certification of Chief Executive Officer
31.2 Rule 13a-14(a)/15d-14(a) certificate of Principal Financial Officer
32.1 Section 1350 certification of Chief Executive Officer and Chief Financial Officer
101* XBRL data files of Financial Statements and Notes contained in this Quarterly Report on Form 10-Q. (The registrant will furnish Exhibit 101 within 30 days of the filing date of this Form 10-Q, as permitted under the rules of the Securities and Exchange Commission.)
* Furnished and not filed or a part of a registration statement or prospectus for purposes of Sections 11 or 12 of the Securities Act of 1933, as amended, deemed not filed for purposes of Section 18 of the Securities Exchange Act of 1934, as amended, and otherwise not subject to liability under these sections.
40
SIGNATURES
Pursuant to the requirements of the Securities Exchange Act, the registrant has duly caused this report to be signed on its behalf by the undersigned thereunto duly authorized.
|
WESTERGAARD.COM, INC.
|
|||
|
Date: August 22, 2011
|
By:
|
/s/ Jinbiao Ding
|
|
|
Jinbiao Ding, Chief Executive Officer
|
|||
|
(Duly Authorized Officer and Principal Executive Officer)
|
|||
|
Date: August 22, 2011
|
By:
|
/s/ Adam Wasserman
|
|
|
Adam Wasserman, Chief Financial Officer
|
|||
|
(Principal Financial Officer and Chief Accounting Officer)
|
|||
41