Attached files
| file | filename |
|---|---|
| 8-K - TAIWAN FUND INC | v232862_8k.htm |
|
THE TAIWAN FUND, INC. (THE ‘FUND’)
MONTHLY INSIGHT
|
 |
AT JULY 31, 2011
|
IN BRIEF
|
||||
|
Net asset value per share
|
US$22.09 | |||
|
Market price
|
US$19.50 | |||
|
Premium/(discount)
|
(11.72%) | |||
|
Fund size
|
US$410.2m | |||
Source: State Street Bank and Trust Company.
|
At July 31, 2011
|
US$ return
|
|||||||
|
Fund*
|
TAIEX Index†
|
|||||||
|
%
|
%
|
|||||||
|
One month
|
4.4 | 1.9 | ||||||
|
Three months
|
2.1 | (1.9 | ) | |||||
|
One year
|
38.4 | 28.9 | ||||||
|
Three years % pa
|
12.2 | 13.5 | ||||||
Past performance is not a guide to future returns.
Returns are annualized, except for periods of less than one year.
*Source: State Street Bank and Trust Company.
NAV performance.
†Source: TWSE. The index shown is the TAIEX Total Return Index.
PORTFOLIO MANAGER

Shifeng Ke
MANAGER’S COMMENTARY
The TAIEX Total Return Index rose in July to end the month up 1.9%. The bearish tone came from concerns over whether squabbling US government officials could raise the debt ceiling, as well as Apple’s proposed lawsuit against Taiwanese blue chip HTC, the second-largest smartphone provider. The Fund was up by 4.4%, thanks to our low exposure to Taiwan’s exporters. Our top three performers were Mercuries & Associates (an undervalued holding company for retail and life-insurance assets), China Petrochemical Development (the margins on its principal chemical product is increasing) and PC Home Online (which is delivering strong sales growth from online shopping).
The Information Technology (‘IT’) sector continues to suffer. Apple is not only dominating consumers’ attention with its iPad and iPhone, but is also keeping them waiting for the launches of the next generation of these products. Given an unexciting product pipeline, we don’t see any positive catalysts for IT stocks. Meanwhile, wage inflation in China is still severe, putting more pressure on the gross margin for original equipment manufacturers. The demand from advanced countries is weak, exacerbated by concerns over the downgrading of US Treasuries.
In contrast, domestic consumption remains robust. June’s sales numbers for retail, wholesale and food and beverages hit a record high of NT$1.2 trillion – year-on-year growth of 5.3%. Consumer confidence in July hit a record high, breaking through the level seen before the financial crisis. Sales of new cars grew by 7.9% year-on-year in July and are expected to grow by 10% this year. July’s inflation increased by just 1.9% – lower than the 3% wage increment received by government employees from July. And disposable incomes are generally rising.
There has also been further progress in the cross-strait rapprochement. Medical cooperation has been effective since June 26, 2011, and the respective food and medicine administrations are to open official dialogue on disease controls, medical research and development, and the safety of herbal remedies and other medicine. There is to be further negotiation over an agreement to ensure Taiwanese human rights in China. And, according to Taiwan’s President Ma Ying-jeou, the investment restrictions on financial companies entering China are to be eased. For the moment, the gap in the polls between President Ma and his opponent Tsai Ying-wen remains slim. With the presidential election looming in January, we expect Ma to announce further positive measures. Boosting domestic consumption and the island’s economy will be his immediate concerns.
MONTHLY INSIGHT
INVESTMENT STRATEGY
The Fund is 83.2% invested, with holdings in 51 companies.
After strong rallies, we took profits in and sold Taiwan Surface Mounting Technology and Chunghwa Telecom. We also took profits in and reduced: China Petrochemical Development, Lien Hwa Industrial, Li Peng Enterprise and Continental Holdings. We reduced Acer because its turnaround will be delayed, given a sluggish European market and an extended management reshuffle. We continued to sell Globe Union Industrial, where gross margin is under pressure from costs.
We topped up CHIPBOND Technology, the leading provider of bumping for panel-driver ICs, as well as the underperforming Shin Kong Financial Holding, on the huge discount to its embedded value.
Shifeng Ke, Martin Currie Inc*
*Martin Currie Ltd and Heartland Capital Management Ltd (‘HCML’) have established MC China Ltd (‘MCCL’), as a joint venture company, to provide investment consultancy services to the range of China investment products managed by Marin Currie and its affiliates. HCML has seconded Shifeng Ke to Martin Currie Inc. and its affiliates, on a full time basis. Effective July 29, 2011, Chris Ruffle ceased performing client portfolio management functions for Martin Currie. Shifeng Ke is the lead manager of the Fund.
Martin Currie Inc. took over management of the Fund on May 9, 2010.
|
FUND DETAILS
|
||||
|
July 31, 2011
|
||||
|
Market cap
|
US$362.22m | |||
|
Shares outstanding
|
18,575,214 | |||
|
Exchange listed
|
NYSE
|
|||
|
Listing date
|
1986 | |||
|
Investment manager
|
Martin Currie Inc
|
|||
Source: State Street Bank and Trust Company.
|
PERFORMANCE
|
(US$ RETURNS)
|
|||||||
|
(US$ returns)
|
NAV %
|
Market price %
|
||||||
|
One month
|
4.4 | 1.8 | ||||||
|
Three months
|
2.1 | (1.3 | ) | |||||
|
Three years % pa
|
12.2 | 9.8 | ||||||
Past performance is not a guide to future returns. Returns are annualized, except for periods of less than one year.
Source: State Street Bank and Trust Company.
|
SECTOR ALLOCATION
|
||||||||
|
Fund %*
|
Benchmark %†
|
|||||||
|
Finance
|
19.1 | 13.9 | ||||||
|
Wholesale and retail
|
19.0 | 6.4 | ||||||
|
Electronics
|
12.9 | 47.9 | ||||||
|
Construction
|
6.4 | 2.0 | ||||||
|
Plastics
|
5.3 | 9.3 | ||||||
|
Healthcare
|
3.7 | — | ||||||
|
Textiles
|
3.3 | 2.1 | ||||||
|
Foods
|
3.2 | 1.7 | ||||||
|
Steel and iron
|
2.8 | 2.7 | ||||||
|
Transportation
|
2.4 | 2.2 | ||||||
|
Electric and machinery
|
2.3 | 1.4 | ||||||
|
Cement
|
1.0 | 1.5 | ||||||
|
Others
|
0.9 | 1.9 | ||||||
|
Chemicals
|
0.9 | 2.3 | ||||||
|
Rubber
|
— | 1.6 | ||||||
|
Automobile
|
— | 1.3 | ||||||
|
Electrical appliance and cable
|
— | 0.5 | ||||||
|
Glass and ceramics
|
— | 0.5 | ||||||
|
Tourism
|
— | 0.5 | ||||||
|
Paper and pulp
|
— | 0.3 | ||||||
|
Other assets and liabilities, net
|
16.8 | — | ||||||
*Source: State Street Bank and Trust Company.
†Source: TWSE.
|
15 LARGEST HOLDINGS*
|
|||||
|
43.6% of holdings
|
Sector
|
% of net
|
|||
|
assets
|
|||||
|
President Chain Store
|
Wholesale and retail
|
4.4 | |||
|
Chinatrust Financial Holding
|
Finance
|
3.5 | |||
|
Far Eastern Department Stores
|
Wholesale and retail
|
3.5 | |||
|
Clevo
|
Electronics
|
3.0 | |||
|
Fubon Financial Holding
|
Finance
|
2.9 | |||
|
Wah Lee Industrial
|
Electronics
|
2.9 | |||
|
KGI Securities
|
Finance
|
2.9 | |||
|
SinoPac Financial Holdings
|
Finance
|
2.9 | |||
|
Tung Ho Steel Enterprise
|
Steel and iron
|
2.8 | |||
|
Yuanta Financial Holding
|
Finance
|
2.7 | |||
|
Uni-President Enterprises
|
Foods
|
2.6 | |||
|
Mercuries & Associates
|
Wholesale and retail
|
2.6 | |||
|
Test-Rite International
|
Wholesale and retail
|
2.4 | |||
|
WT Microelectronics
|
Electronics
|
2.3 | |||
|
Nan Ya Plastics
|
Plastics
|
2.2 | |||
*Source: State Street Bank and Trust Company.
|
PERFORMANCE
|
(US$ returns at July 31, 2011)
|
|||||||||||||||||||||||||||||||
|
One month
|
Three months
|
Calendar year
|
One year
|
Three years
|
Five years
|
Ten years
|
Since launch
|
|||||||||||||||||||||||||
|
%
|
%
|
to date
|
%
|
% pa
|
% pa
|
% pa
|
% pa
|
|||||||||||||||||||||||||
|
%
|
||||||||||||||||||||||||||||||||
|
The Taiwan Fund, Inc.*
|
4.4 | 2.1 | 6.0 | 38.4 | 12.2 | 10.5 | 9.6 | 9.9 | ||||||||||||||||||||||||
|
TAIEX Index†
|
(0.5 | ) | (4.7 | ) | (2.6 | ) | 23.8 | 9.3 | 8.8 | 9.1 | 9.6 | |||||||||||||||||||||
|
TAIEX Total Return Index†
|
1.9 | (1.9 | ) | 0.3 | 28.9 | 13.5 | 13.1 |
na
|
na
|
|||||||||||||||||||||||
|
MSCI Taiwan Index†
|
1.1 | (3.6 | ) | (1.6 | ) | 26.4 | 10.1 | 9.4 | 9.4 |
na
|
||||||||||||||||||||||
Past performance is not a guide to future returns. Returns are annualized, except for periods of less than one year.
*Source: State Street Bank and Trust Company. Launch date December 23, 1986. Returns for the Fund are historical total returns that reflect changes in net asset value per share during each period and assume that dividends and capital gains, if any, were reinvested.
†Source: MSCI for the MSCI Taiwan Index and TWSE for the TAIEX Total Return Index and the TAIEX Index. For a full description of each index please see the index descriptions section.
Returns for the TAIEX Index are not total returns and reflect only changes in the share price but do not assume that cash dividends, if any, were reinvested, and thus are not strictly comparable to the Fund returns.
The TAIEX Total Return Index commenced January 1, 2003.
MONTHLY INSIGHT
PORTFOLIO IN FULL
|
Company
|
% of
|
||||||||||||||
|
Sector
|
(BGB ticker)
|
Price
|
Holding
|
Value US$
|
net assets
|
||||||||||
|
FINANCE
|
19.1 | ||||||||||||||
|
Chinatrust Financial Holding
|
2891 |
TT
|
NT$26.0
|
16,067,000 |
$14,487,073
|
3.5 | |||||||||
|
Fubon Financial Holding
|
2881 |
TT
|
NT$47.0
|
7,349,624 |
$11,979,412
|
2.9 | |||||||||
|
KGI Securities
|
6008 |
TT
|
NT$16.3
|
20,740,000 |
$11,723,813
|
2.9 | |||||||||
|
SinoPac Financial Holdings
|
2890 |
TT
|
NT$12.5
|
26,935,000 |
$11,676,146
|
2.9 | |||||||||
|
Yuanta Financial Holding
|
2885 |
TT
|
NT$20.6
|
15,741,000 |
$11,245,326
|
2.7 | |||||||||
|
Shin Kong Financial Holding
|
2888 |
TT
|
NT$12.5
|
18,446,000 |
$7,964,235
|
1.9 | |||||||||
|
China Life Insurance
|
2823 |
TT
|
NT$40.5
|
4,743,182 |
$6,653,663
|
1.6 | |||||||||
|
Union Bank of Taiwan
|
2838 |
TT
|
NT$10.5
|
7,507,000 |
$2,720,541
|
0.7 | |||||||||
|
WHOLESALE AND RETAIL
|
19.0 | ||||||||||||||
|
President Chain Store
|
2912 |
TT
|
NT$184.5
|
2,840,000 |
$18,171,351
|
4.4 | |||||||||
|
Far Eastern Department Stores
|
2903 |
TT
|
NT$62.8
|
6,559,500 |
$14,285,745
|
3.5 | |||||||||
|
Clevo
|
2362 |
TT
|
NT$56.2
|
6,288,000 |
$12,255,227
|
3.0 | |||||||||
|
Mercuries & Associates
|
2905 |
TT
|
NT$39.2
|
7,704,100 |
$10,473,226
|
2.6 | |||||||||
|
Test-Rite International
|
2908 |
TT
|
NT$26.5
|
10,622,000 |
$9,761,683
|
2.4 | |||||||||
|
PC Home Online
|
8044 |
TT
|
NT$189.0
|
1,071,588 |
$7,023,639
|
1.7 | |||||||||
|
Taiwan Tea
|
2913 |
TT
|
NT$20.5
|
8,231,000 |
$5,837,386
|
1.4 | |||||||||
|
ELECTRONICS
|
12.9 | ||||||||||||||
|
Wah Lee Industrial
|
3010 |
TT
|
NT$51.5
|
6,644,000 |
$11,866,137
|
2.9 | |||||||||
|
WT Microelectronics
|
3036 |
TT
|
NT$51.6
|
5,156,936 |
$9,228,136
|
2.3 | |||||||||
|
CHIPBOND Technology
|
6147 |
TT
|
NT$33.6
|
5,411,000 |
$6,295,679
|
1.5 | |||||||||
|
Aurora
|
2373 |
TT
|
NT$57.0
|
2,711,000 |
$5,358,915
|
1.3 | |||||||||
|
Advantech
|
2395 |
TT
|
NT$97.5
|
1,475,100 |
$4,987,680
|
1.2 | |||||||||
|
Taiflex Scientific
|
8039 |
TT
|
NT$67.6
|
1,600,000 |
$3,750,932
|
0.9 | |||||||||
|
MPI
|
6223 |
TT
|
NT$94.6
|
1,077,000 |
$3,533,291
|
0.9 | |||||||||
|
Acer
|
2353 |
TT
|
NT$40.0
|
2,042,000 |
$2,829,079
|
0.7 | |||||||||
|
Tatung
|
2371 |
TT
|
NT$14.8
|
4,770,897 |
$2,448,693
|
0.6 | |||||||||
|
Powercom
|
3043 |
TT
|
NT$38.6
|
1,830,000 |
$2,446,515
|
0.6 | |||||||||
|
CONSTRUCTION
|
6.4 | ||||||||||||||
|
Hung Poo Real Estate Development
|
2536 |
TT
|
NT$42.5
|
4,482,000 |
$6,605,920
|
1.6 | |||||||||
|
Ruentex Development
|
9945 |
TT
|
NT$43.2
|
3,829,000 |
$5,736,429
|
1.4 | |||||||||
|
King’s Town Construction
|
2524 |
TT
|
NT$31.0
|
3,946,000 |
$4,242,201
|
1.0 | |||||||||
|
Taiwan Land Development
|
2841 |
TT
|
NT$16.8
|
7,142,183 |
$4,161,144
|
1.0 | |||||||||
|
Goldsun Development & Construction
|
2504 |
TT
|
NT$16.0
|
6,865,980 |
$3,797,832
|
0.9 | |||||||||
|
Continental Holdings
|
3703 |
TT
|
NT$12.7
|
4,143,000 |
$1,817,515
|
0.5 | |||||||||
|
PLASTICS
|
5.3 | ||||||||||||||
|
Nan Ya Plastics
|
1303 |
TT
|
NT$79.7
|
3,217,000 |
$8,891,641
|
2.2 | |||||||||
|
China Petrochemical Development
|
1314 |
TT
|
NT$44.8
|
4,372,000 |
$6,792,516
|
1.7 | |||||||||
|
Yem Chio
|
4306 |
TT
|
NT$29.9
|
5,701,316 |
$5,911,787
|
1.4 | |||||||||
|
HEALTHCARE
|
3.7 | ||||||||||||||
|
St.Shine Optical
|
1565 |
TT
|
NT$444.5
|
392,000 |
$6,042,691
|
1.4 | |||||||||
|
Pacific Hospital Supply
|
4126 |
TT
|
NT$114.0
|
1,223,142 |
$4,835,643
|
1.2 | |||||||||
|
Excelsior Medical
|
4104 |
TT
|
NT$85.3
|
1,507,729 |
$4,460,102
|
1.1 | |||||||||
|
Company
|
% of
|
|||||||||||||||
|
Sector
|
(BGB ticker)
|
Price
|
Holding
|
Value US$
|
net assets
|
|||||||||||
|
TEXTILES
|
3.3 | |||||||||||||||
|
Far Eastern New Century
|
1402 |
TT
|
NT$46.3
|
3,121,200 |
$5,006,173
|
1.2 | ||||||||||
|
Makalot Industrial
|
1477 |
TT
|
NT$71.3
|
1,828,000 |
$4,519,998
|
1.1 | ||||||||||
|
Li Peng Enterprise
|
1447 |
TT
|
NT$15.3
|
7,696,000 |
$4,083,466
|
1.0 | ||||||||||
|
FOODS
|
3.2 | |||||||||||||||
|
Uni-President Enterprises
|
1216 |
TT
|
NT$47.3
|
6,600,000 |
$10,826,239
|
2.6 | ||||||||||
|
Gourmet Master
|
2723 |
TT
|
NT$234.0
|
204,000 |
$1,655,459
|
0.4 | ||||||||||
|
Lien Hwa Industrial
|
1229 |
TT
|
NT$23.6
|
673,000 |
$550,807
|
0.2 | ||||||||||
|
STEEL AND IRON
|
2.8 | |||||||||||||||
|
Tung Ho Steel Enterprise
|
2006 |
TT
|
NT$32.8
|
10,099,000 |
$11,487,479
|
2.8 | ||||||||||
|
TRANSPORTATION
|
2.4 | |||||||||||||||
|
Farglory F T Z Investment Holding
|
5607 |
TT
|
NT$28.8
|
7,485,000 |
$7,475,785
|
1.8 | ||||||||||
|
Taiwan High Speed Rail
|
2633 |
TT
|
NT$5.0
|
12,597,600 |
$2,197,497
|
0.6 | ||||||||||
|
ELECTRIC AND MACHINERY
|
2.3 | |||||||||||||||
|
Yungtay Engineering
|
1507 |
TT
|
NT$54.9
|
3,274,000 |
$6,233,379
|
1.5 | ||||||||||
|
Good Friend International Holdings
|
2398 |
TT
|
NT$22.8
|
4,145,000 |
$3,270,231
|
0.8 | ||||||||||
|
CEMENT
|
1.0 | |||||||||||||||
|
Wei Mon Industry
|
8925 |
TT
|
NT$19.2
|
6,433,854 |
$4,272,799
|
1.0 | ||||||||||
|
OTHERS
|
0.9 | |||||||||||||||
|
Globe Union Industrial
|
9934 |
TT
|
NT$24.1
|
4,395,000 |
$3,673,233
|
0.9 | ||||||||||
|
CHEMICALS
|
0.9 | |||||||||||||||
|
China Steel Chemical
|
1723 |
TT
|
NT$164.0
|
654,000 |
$3,719,582
|
0.9 | ||||||||||
|
OTHER ASSETS AND LIABILITIES, NET
|
$68,973,957
|
16.8 | ||||||||||||||
MONTHLY INSIGHT
THE TAIWAN FUND, INC. PREMIUM/DISCOUNT
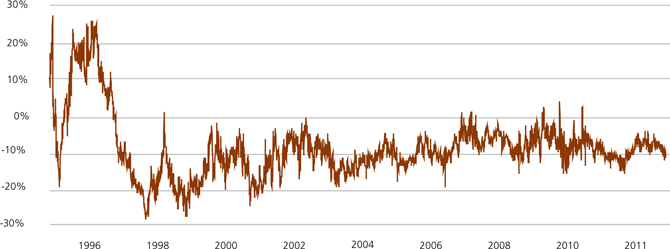
Source: State Street Bank and Trust Company as of July 31, 2011.
INDEX DESCRIPTIONS
TAIEX Index
The TWSE, or TAIEX Index is a capitalization-weighted index of all listed common shares traded on the Taiwan Stock Exchange. The index was based in 1966 and does not include re-invested dividends.
TAIEX Total Return Index
The TAIEX Total Return Index is a capitalization-weighted index of all listed common shares traded on the Taiwan Stock Exchange, based in 1966, which includes re-invested dividends.
MSCI Taiwan Index
The MSCI Total Return Taiwan Index is a free-float adjusted market capitalization index. The index represents Taiwanese companies that are available to investors worldwide. The Index has a base date of December 31, 1987. As of July 31, 2011, it contained 125 constituents.
OBJECTIVE
The Fund was launched on December 23, 1986 to allow US and other investors to access and participate in the growth of the economy and the stock market in Taiwan, the Republic of China. The Fund’s investment objective is to seek long-term capital appreciation primarily through investments in equity securities listed in Taiwan. The Fund is a diversified, closed-end management investment company listed on the New York Stock Exchange (NYSE) under the symbol ‘TWN’.
Taiwan, with its global market leadership in high technology goods and its significant investments throughout mainland China and Southeast Asian economies, is now an integral economic player in the Asia Pacific Region as well as around the world. Investing in Taiwan not only allows investors to capitalize on Taiwan’s dynamic economy, but also allows investors to reap the growth and investment potential of the mainland China and other emerging economies of the region.
CONTACTS
The Taiwan Fund, Inc.
c/o State Street Bank and Trust Company
2 Avenue de Lafayette
PO Box 5049
Boston, MA 02111
Tel: (1) 877-864-5056
www.thetaiwanfund.com
IMPORTANT INFORMATION
This document is issued and approved by Martin Currie Inc (MC Inc), as investment adviser of The Taiwan Fund, Inc. (the ‘Fund’). MC Inc is authorised and regulated by the Financial Services Authority (FSA) and incorporated under limited liability in New York, USA. Registered in Scotland (No BR2575), registered address Saltire Court, 20 Castle Terrace, Edinburgh, EH1 2ES. Information herein is believed to be reliable but has not been verified by MC Inc. MC Inc makes no representation or warranty and does not accept any responsibility in relation to such information or for opinion or conclusion which the reader may draw from this newsletter.
Martin Currie Ltd and Heartland Capital Management Ltd (‘HCML’) have established MC China Ltd (‘MCCL’), as a joint venture company, to provide investment consultancy services to the range of China investment products managed by Martin Currie and its affiliates. HCML has seconded Shifeng Ke to Martin Currie Inc. and its affiliates, on a full time basis. Effective July 29, 2011, Chris Ruffle ceased performing client portfolio management functions for Martin Currie.
Heartland Capital Investment Consulting (Shanghai) Ltd (‘HCIC’) is a wholly owned subsidiary of MC China Ltd. Research is undertaken by HCIC for MC China Ltd and provided to MC Inc (the investment manager of The Taiwan Fund, Inc.) and Martin Currie Investment Management Ltd., an affiliate of the investment manager. HCIC may change its opinions and views without prior notice. Any information provided within does not constitute investment advice nor is it an invitation to invest in this company.
The Fund is classified as a diversified investment company under the US Investment Company Act of 1940 as amended. It meets the criteria of a closed ended US mutual fund and its shares are listed on the New York Stock Exchange. MC Inc has been appointed investment adviser to the Fund.
Investors are advised that they will not generally benefit from the rules and regulations of the United Kingdom Financial Services and Markets Act 2000 and the FSA for the protection of investors, nor benefit from the United Kingdom Financial Services Compensation Scheme, nor have access to the Financial Services Ombudsman in the event of a dispute. Investors will also have no rights of cancellation under the FSA’s Conduct of Business Sourcebook of the United Kingdom.
This newsletter does not constitute an offer of shares. MC Inc, its ultimate and intermediate holding companies, subsidiaries, affiliates, clients, directors or staff may, at any time, have a position in the market referred to herein, and may buy or sell securities, currencies, or any other financial instruments in such markets. The information or opinion expressed in this newsletter should not be construed to be a recommendation to buy or sell the securities, commodities, currencies or financial instruments referred to herein.
The information provided in this report should not be considered a recommendation to purchase or sell any particular security. There is no assurance that any securities discussed herein will remain in an account’s portfolio at the time you receive this report or that securities sold have not been repurchased.
It should not be assumed that any of the securities transactions or holdings discussed here were or will prove to be profitable, or that the investment recommendations or decisions we make in the future will be profitable or will equal the investment performance of the securities discussed herein.
Investing in the Fund involves certain considerations in addition to the risks normally associated with making investments in securities. The value of the shares issued by the Fund, and the income from them, may go down as well as up and there can be no assurance that upon sale, or otherwise, investors will receive back the amount originally invested. There can be no assurance that you will receive comparable performance returns, or that investments will reflect the performance of the stock examples contained in this document. Movements in foreign exchange rates may have a separate effect, unfavorable as well as favorable, on the gain or loss otherwise experienced on an investment. Past performance is not a guide to future returns. Accordingly, the Fund is only suitable for investment by investors who are able and willing to withstand the total loss of their investment. In particular, prospective investors should consider the following risks:
 |
It should be noted that investment in the Fund is only suitable for sophisticated investors who are aware of the risk of investing in Taiwan and should be regarded as long term. Funds which invest in one country carry a higher degree of risk than those with portfolios diversified across a number of markets.
|
|
|
Investment in the securities of smaller and unquoted companies can involve greater risk than is customarily associated with investment in larger, more established, companies. In particular, smaller companies often have limited product lines, markets or financial resources and their management may be dependent on a smaller number of key individuals. In addition, the market for stock in smaller companies is often less liquid than that for stock in larger companies, bringing with it potential difficulties in acquiring, valuing and disposing of such stock. Proper information for determining their value, or the risks to which they are exposed, may not be available.
|
|
|
Investments within emerging markets such as Taiwan can be of higher risk. Many emerging markets, and the companies quoted on their stock exchanges, are exposed to the risks of political, social and religious instability, expropriation of assets or nationalization, rapid rates of inflation, high interest rates, currency depreciation and fluctuations and changes in taxation which may affect the Fund’s income and the value of its investments.
|
|
|
The marketability of quoted shares may be limited due to foreign investment restrictions, wide dealing spreads, exchange controls, foreign ownership restrictions, the restricted opening of stock exchanges and a narrow range of investors. Trading volume may be lower than on more developed stockmarkets, and equities are less liquid. Volatility of prices can also be greater than in more developed stockmarkets. The infrastructure for clearing, settlement and registration on the primary and secondary markets may be undeveloped. Under certain circumstances, there may be delays in settling transactions in some of the markets.
|


Martin Currie Inc registered in Scotland (no BR2575)
Registered office: Saltire Court, 20 Castle Terrace, Edinburgh EH1 2ES
Tel: 44 (0) 131 229 5252 Fax: 44 (0) 131 228 5959 www.martincurrie.com
North American office: 1350 Avenue of the Americas, Suite 3010, New York, NY
10019, USA Tel: (1) 212 258 1900 Fax: (1) 212 258 1919
Authorised and regulated by the Financial Services Authority and incorporated with
limited liability in New York, USA. Registered with the SEC as an investment adviser.
Please note: calls to the above numbers may be recorded.