Attached files
| file | filename |
|---|---|
| EX-99.2 - PRESS RELEASE - PANTRY INC | exhibit99_2.htm |
| 8-K - THE PANTRY, INC. VARIOUS ITEMS - PANTRY INC | form8kvar.htm |
Investor Relations Presentation

Safe Harbor Statement
Some of the statements in this presentation constitute “forward-looking
statements” within the meaning of the Private Securities Litigation Reform Act
of 1995. All statements other than those of historical facts included herein,
including those related to the company’s financial outlook, goals, business
strategy, projected plans and objectives of management for future operations
and liquidity, are forward-looking statements. These forward-looking
statements are based on the company’s plans and expectations and involve a
number of risks and uncertainties that could cause actual results to vary
materially from the results and events anticipated or implied by such forward-
looking statements. Please refer to the company’s Annual Report on Form 10-
K and its other filings with the SEC for a discussion of significant risk factors
applicable to the company. In addition, the forward-looking statements
included in this presentation are based on the company’s estimates and plans
as of the date of this presentation. While the company may elect to update
these forward-looking statements at some point in the future, it specifically
disclaims any obligation to do so.
2

Leading convenience store retailer concentrated in the
southeastern United States
southeastern United States
3
_____________________
Note: Map is illustrative
1,655 Stores Located in Thirteen States as of August 8, 2011
Pantry Store Locations

Key Strategies
4
n Improve same store sales and merchandise gross margin with
focus on coffee, bakery, cold dispensed, and meals and snacks
focus on coffee, bakery, cold dispensed, and meals and snacks
n Invest in technology to drive effectiveness and efficiency
n Improve cost structure
n Reduce working capital investment
n Divest of nonproductive assets
n Accelerate EBITDA and cash flow growth

5
Why Meals & Snacks?
_____________________
(1) Represents trailing twelve months June, 2011 total merchandise gross margin for The Pantry
(2) Industry data is foodservice only for Calendar Year 2010 and Industry source is NACS SOI
1
2
Gross Margin Comparison

Focused on capturing the foodservice opportunity
6
_____________________
(1) Pantry Foodservice includes Fast Foodservice, Self-Service Fast Foods and Beverages and is for trailing twelve months June, 2011
(2) Industry Data is for Calendar Year 2010 and Industry source is NACS
Industry2
Pantry1
17%
9%
Foodservice Mix of Total Inside Sales
QSR is 4.5% of Pantry Foodservice
7
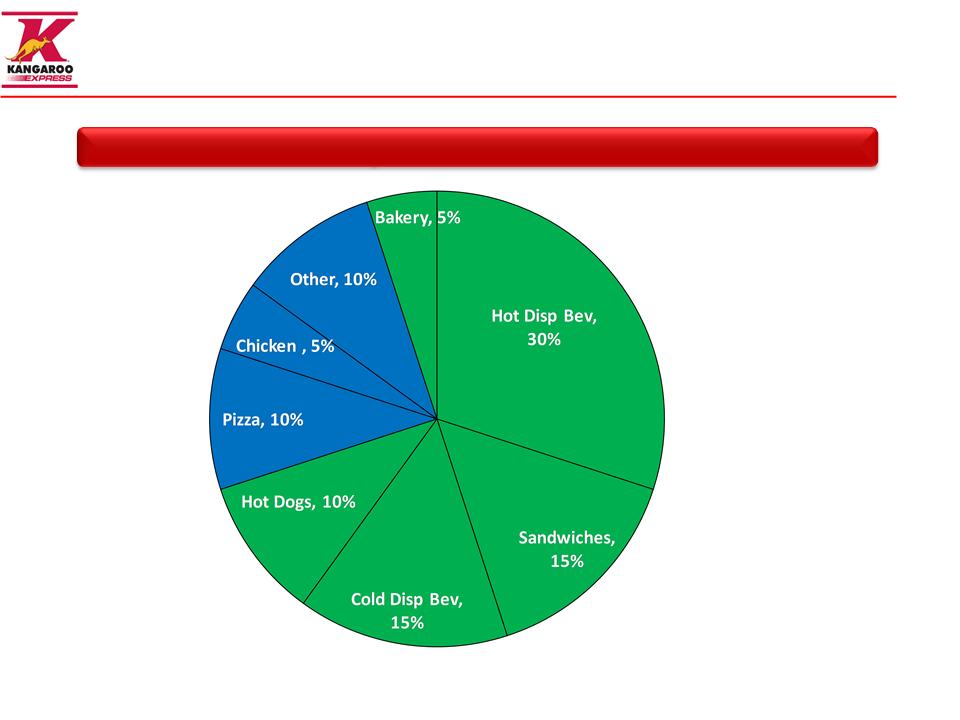
Why Coffee?
Industry Foodservice Sales Mix
_____________________
Source: Convenience Store News 2009 Extended Foodservice Study. Figures based on annual 2008 average per store sales and rounded to nearest 5% interval
75% can be implemented
without an investment in
a full kitchen
without an investment in
a full kitchen

8
DISPENSING
PREPARATION
Bean Street Coffee Focus

9
Cold Dispensed Beverages
Bakery
Other Areas of Focus

10
Getting the word out (Raleigh marketing plan)
Sampling
Strategic Partnerships
Digital Relationship Marketing
“Battle for Bean Street”
Radio

FRESH focus on breakfast, lunch, all day snacks
Lunch and Snacks
Breakfast

Fast, Friendly and Clean Platform
12

FRESH Program Highlights
13
n Estimated $80-100K average investment per store for Fresh elements
n Goal of increasing foodservice mix to 13% of sales
n Target margin improvement of 150 bps over time
n Expect 20% cash on cash returns
n Coffee is King
n Breakfast, lunch and all day snack occasions
n Includes cold dispensed, grill, and bakery
n Fast, Friendly and Clean foundation
n 150 stores completed by end of June, 2011
n Expect 400 stores completed by end of calendar 2011
n Completed the following markets: Raleigh, Charlotte, Birmingham,
Gulf Coast/Hattiesburg
Gulf Coast/Hattiesburg
Financials
Focus
Roll-out

Systems investment to drive effectiveness and
efficiency
efficiency
14
n KSS Fuels system (pricing)
n Automatic Tank Gauges (inventory visibility, compliance)
n Rebranding
n Segmentation and Analytics focus
n PCI Compliant
n Promotional flexibility
n Capturing transaction level detail
n Reducing to two main POS platforms
n Workforce Management
- Task Management, launched in Q1 2011
- Labor Scheduling, phase 1 launched Q3 2011
- Time and Attendance
n Streamlining back room processes to redeploy more hours to foodservice
n Focused on expense efficiency
n Target reduction of G&A to historical levels of approximately $90 million
over the course of the next three years
over the course of the next three years
Fuel
Point of Sale
Store &
Corporate
Corporate
_____________________
(1) Includes 53 weeks
(2) 2011 represents trailing twelve months June, 2011
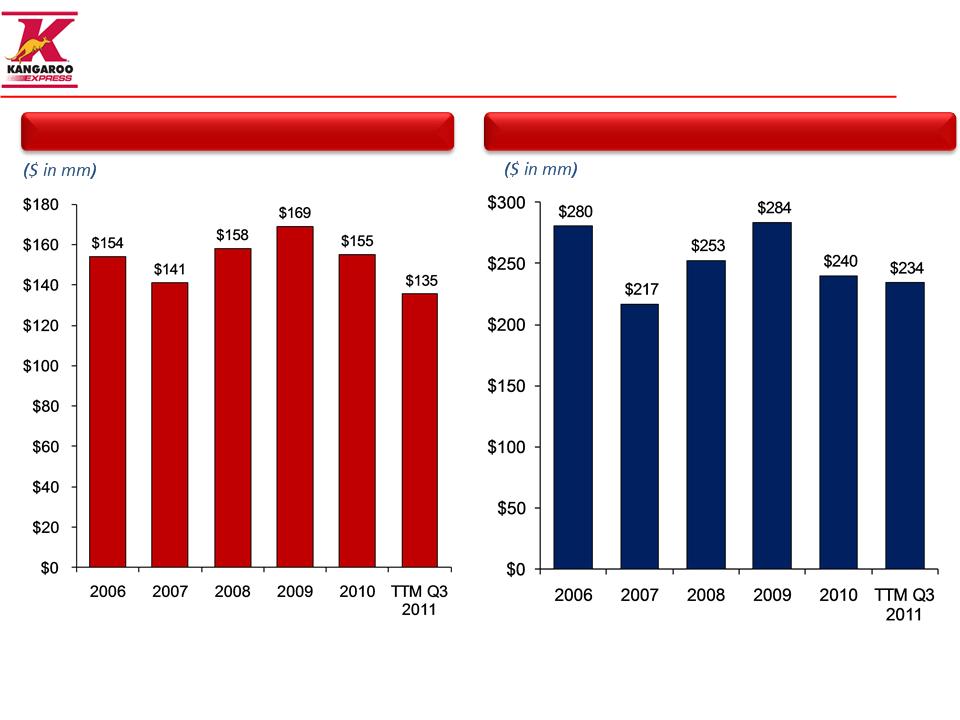
(3) See slides 25 and 26, which include a reconciliation of Adjusted EBITDA to the most comparable U.S. GAAP financial measures.
History of consistent cash flows & Adjusted EBITDA
15
Adjusted EBITDA 3
Operating Cash Flow
Fiscal Year
Fiscal Year
1
1
1,2
1,2

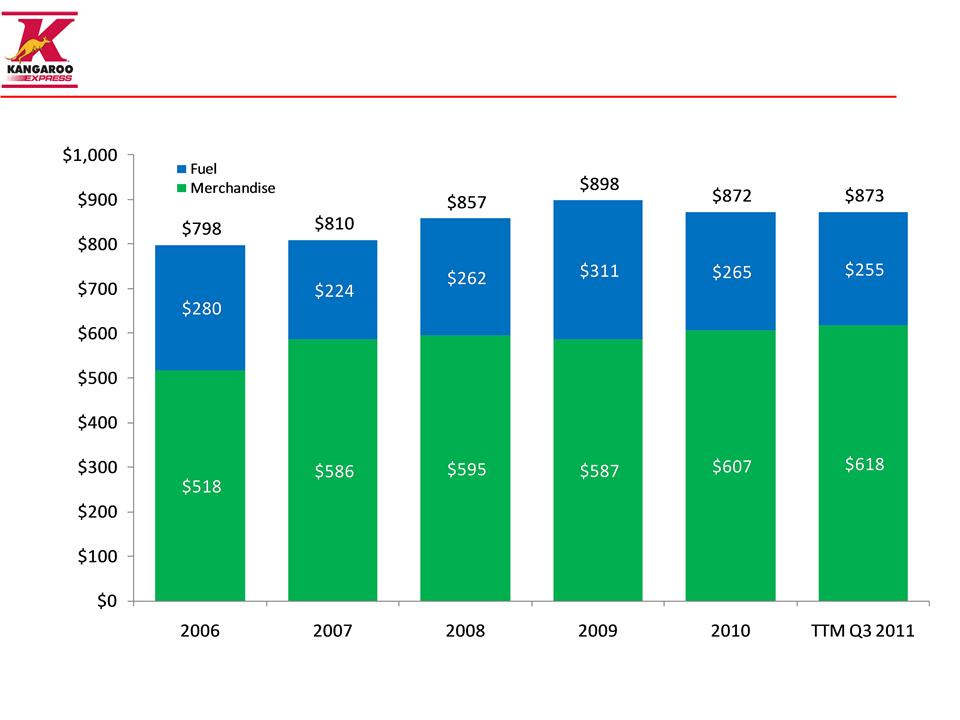
Fuel comprises the majority of revenue
16
Revenue Split: Merchandise vs. Fuel
($ in mm)
Fiscal Year
_____________________
(1) Includes 53 weeks
(2) 2011 represents trailing twelve months June, 2011
1
1,2
Gross profit is driven by merchandise
17
Gross Profit Split: Merchandise vs. Fuel
($ in mm)
Fiscal Year
_____________________
(1) Includes 53 weeks
(2) 2011 represents trailing twelve months June, 2011
1,2
1

Oil price changes drive volatility in quarterly retail
gasoline margins
gasoline margins
18
_____________________
Source: Energy Information Administration. Data represents daily average futures contract price per barrel of light sweet crude (contract 1) and CPG is net of credit card fees and repairs and
maintenance
maintenance
FY2006
FY2007
FY2008
FY2009
¢
¢
¢
¢
¢
¢
¢
FY2010
FY2011

Annual CPG tends to remain relatively stable
19
Fiscal Year
_____________________
Note: Shaded area represents average historical CPG range and CPG is net of credit card fees and repairs and maintenance
(1) 2011 represents trailing twelve months June, 2011.
Annual Net CPG Margins Typically Range from 12.0¢ to 13.5¢
¢
¢
¢
¢
¢
¢
¢
¢
¢
¢
1

Historical averages reinforce the stability
20
Historical CPG Averages
_____________________
Note: Historical averages are non-weighted averages of each fiscal year. CPG is net of credit card fees and repairs and maintenance

High degree of fragmentation presents opportunities
21
75% of U.S. Convenience
Stores are Single Stores or
Small Chains
Stores are Single Stores or
Small Chains
146,000 Total U.S. C-Stores
_____________________
Source: U.S. Convenience December 2010 Store Count (Gas and Non-Gas) from NACS/TDLinx;
Small chains are defined as those having 50 or fewer stores
19,000 C-Stores in FL, NC and SC
Kangaroo Express has 1,057 or 6%
75% of C-Stores in FL, NC and SC are
single stores or small chains
single stores or small chains

Financial Flexibility
22
n Meaningful liquidity
} $182 million in cash-on-hand
} $225 million revolver - $0 drawn, approximately $116 million
available after LOCs
available after LOCs
n Long-term debt profile; earliest maturity is the convertible debt in
November 2012
November 2012
} Recently amended credit facility to allow the junior payment
basket to grow on an annual basis with full carryover of unused
amounts
basket to grow on an annual basis with full carryover of unused
amounts
n Covenant-light bank facility
} 6.25x Adj. Net Debt / EBITDAR Leverage
} 2.25x Interest Coverage
_____________________
Note: Balance Sheet data as of June 30, 2011

Key Strategies
23
n Improve same store sales and merchandise gross margin with
focus on coffee, bakery, cold dispensed, and meals and snacks
focus on coffee, bakery, cold dispensed, and meals and snacks
n Invest in technology to drive effectiveness and efficiency
n Improve cost structure
n Reduce working capital investment
n Divest of nonproductive assets
n Accelerate EBITDA and cash flow growth

Appendix

Reconciliation of Non-GAAP Measures
25
Adjusted EBITDA Reconciled to Net Income/(Loss)
_____________________
(1) 2011 represents trailing twelve months June, 2011

Reconciliation of Non-GAAP Measures
26
Adjusted EBITDA Reconciled to Cash Flows
_____________________
(1) 2011 represents trailing twelve months June, 2011