Attached files
| file | filename |
|---|---|
| 8-K - FORM 8-K - MOSAIC CO | d8k.htm |
Exhibit 99.1


Market Mosaic is a quarterly newsletter published for our customers, suppliers and stakeholders by the Market and Strategic Analysis group of The Mosaic Company. This issue recaps our assessment of the near term outlook for agricultural and crop nutrient markets.
Michael R. Rahm
Vice President Market and Strategic Analysis
mike.rahm@mosaicco.com
Luis F. Dowling
Manager Market and Strategic Analysis
luis.dowling@mosaicco.com
Joseph Fung
Sr. Market Analyst
joseph.fung@mosaicco.com
Mathew Philippi
Data Analyst
matt.philippi@mosaicco.com
If this was a poker game, many analysts likely would conclude that agricultural and crop nutrient markets are “betting on the come” or counting on developments that remain uncertain. Agricultural commodity markets are betting on a record harvest in order to prevent another large drawdown of global inventories. The phosphate market is betting on new and even some old supplies to meet accelerating demand. And the potash market is betting on producers to achieve full production capabilities in order to meet record demand this year.
Unfortunately, this isn’t a quarter-ante poker game and the stakes are high this year. However, many of these needed developments have much higher odds than drawing to a straight or full house. Nevertheless, a smaller-than-expected U.S. corn crop or a larger-than-expected drop in Chinese phosphate exports or longer-than-planned downtime to tie in a potash expansion would further tighten markets and potentially result in disruptive price spikes.
Despite the recent turbulence in global financial markets, agricultural commodity and crop nutrient fundamentals continue to look strong and we expect limited fallout from these outside market developments. One thing looks like a sure bet – farmers still will need to plant record area and reap a bin-buster crop in 2012 in order to begin to rebuild global grain and oilseed stocks. And that is expected to result once again in record global phosphate and potash shipments.
Agriculture: Betting on a Record Harvest
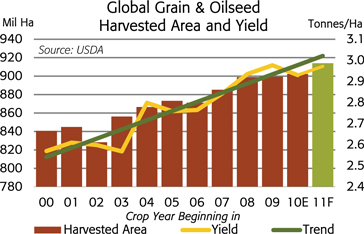
Farmers have responded to high agricultural commodity prices by planting record area this year. U.S. Department of Agriculture (USDA) estimates released on August 11 show that farmers around the globe are expected to harvest a record 914 million hectares (mil ha) of the 16 leading grain and oilseed crops during the 2011/12 crop year, an increase of about 12 mil ha or roughly one-half of the typical harvested area in Canada. The response this year is a couple million hectares less than the large increases that occurred in 2007 and again in 2008.
Farmers have anted up area this year, but Mother Nature is not dealing the much needed trend-or-better yield card. For example, the same USDA estimates indicate that the average global grain and oilseed yield will total 2.97 tonnes per hectare (mt ha) this year, up from 2.93 mt ha last year but slightly less than the record of 2.98 mt ha in 2009 and less than the 2011/12 trend of 3.02 mt ha. More importantly, it looks like there is more downside than upside risk to yields right now due to excessive rainfall and late planting in some regions, heat stress in other areas and severe drought in yet other regions. This would mark the second year in a row that the average yield was less than trend.
Absent further deterioration of this year’s crop, the world still is expected to produce a record harvest this year. According to current USDA estimates, farmers likely will harvest 2.72 billion tonnes of the 16 leading crops this year, up from 2.64 billion
– continued inside
tonnes in 2010 and greater than the previous high mark of 2.68 billion tonnes in 2009. Nevertheless, the supply response this year pales in comparison to those of the past few years when
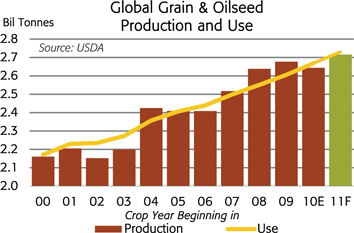
global grain and oilseed production surged from 2.41 billion tonnes in 2006 to 2.68 billion tonnes in 2009 following the run-up in agricultural commodity prices. Those gains were the result of large increases in harvested area in 2007 and 2008 as well as above-trend yields in 2008 and again in 2009.
On the demand side of the ledger, grain and oilseed use continues to increase at a brisk pace. The most recent USDA estimates indicate that global grain and oilseed use will increase 2.4% or 62 million tonnes to a record 2.67 billion tonnes in 2010/11 and then increase another 2.3% or 62 million tonnes to 2.73 million in 2011/12.
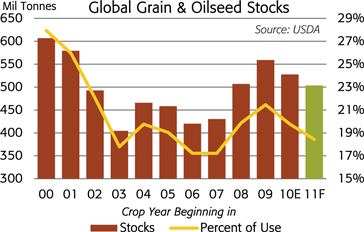
Based on the August 11 USDA supply and demand estimates, global grain and oilseed inventories are projected to drop another 24 million tonnes to 504 million tonnes or 18.4% of projected use by the end of the 2011/12 crop year. That is the lowest level and percentage of use since the end of the 2007/08 crop year and it follows an estimated 32 million tonne drop in 2010/11.
Of the major crops, corn is this year’s poster child for tight agricultural commodity markets. Global inventories at the end of the 2011/12 crop year are forecast to decline to just 13.2% of projected use, the lowest percentage since 1973/74. The projected decline in global corn stocks results from exceptional demand growth outpacing large production increases. For example, global demand climbed 4.0% or 33 million tonnes in 2010/11 and is forecast to increase another 2.8% or 23 million tonnes in 2011/12. Projected demand growth of 56 million tonnes during these two years is roughly equal to the size of recent Brazilian corn crops.
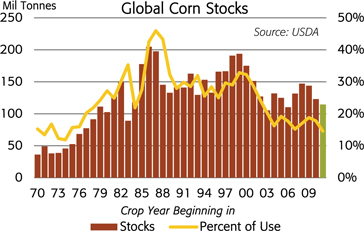
The exponential growth of U.S. corn based ethanol production accounted for about one-third of the increase in global corn use during the last decade, but the rate of increase in U.S. ethanol production has slowed considerably. For example, the increase in the U.S. net ethanol grind is projected to account for 24% of the growth in global corn use in 2010/11 and just 6% of growth in 2011/12. Most of the growth in demand is the result of increases in corn fed to hogs in China or to poultry in Thailand and Indonesia. In short, it’s the food story.


| U.S. Corn Supply / Demand | ||||||||||||||||||||||||||||
| (mil bu unless noted) |
06/07 | 07/08 | 08/09 | 09/10 | 10/11E | 11/12F | 12/13F | |||||||||||||||||||||
| Acreage |
||||||||||||||||||||||||||||
| Planted (mil acres) |
78.3 | 93.5 | 86.0 | 86.4 | 88.2 | 92.3 | 94.0 | |||||||||||||||||||||
| Harvested (mil acres) |
70.6 | 86.5 | 78.6 | 79.5 | 81.4 | 84.4 | 86.0 | |||||||||||||||||||||
| Yield (bu/acre) |
149.1 | 150.7 | 153.9 | 164.7 | 152.8 | 153.0 | 164.0 | |||||||||||||||||||||
| Supply |
||||||||||||||||||||||||||||
| Beginning Stocks |
1,967 | 1,304 | 1,624 | 1,673 | 1,708 | 940 | 714 | |||||||||||||||||||||
| Production |
10,531 | 13,038 | 12,092 | 13,092 | 12,447 | 12,914 | 14,106 | |||||||||||||||||||||
| Imports |
12 | 20 | 14 | 8 | 30 | 20 | 20 | |||||||||||||||||||||
| Total |
12,510 | 14,361 | 13,729 | 14,773 | 14,185 | 13,874 | 14,839 | |||||||||||||||||||||
| Use |
||||||||||||||||||||||||||||
| Feed & Residual |
5,540 | 5,858 | 5,182 | 5,125 | 5,000 | 4,900 | 5,250 | |||||||||||||||||||||
| FIS |
3,541 | 4,442 | 5,025 | 5,961 | 6,420 | 6,510 | 6,575 | |||||||||||||||||||||
| Ethanol for Fuel | 2,119 | 3,026 | 3,709 | 4,568 | 5,050 | 5,100 | 5,150 | |||||||||||||||||||||
| Exports |
2,125 | 2,437 | 1,849 | 1,980 | 1,825 | 1,750 | 2,000 | |||||||||||||||||||||
| Total |
11,207 | 12,737 | 12,056 | 13,066 | 13,245 | 13,160 | 13,825 | |||||||||||||||||||||
| Ending Stocks |
1,304 | 1,624 | 1,673 | 1,708 | 940 | 714 | 1,014 | |||||||||||||||||||||
| Stocks as % of Use |
11.6% | 12.8% | 13.9% | 13.1% | 7.1% | 5.4% | 7.3% | |||||||||||||||||||||
Source: USDA and Mosaic (for 12/13F)
U.S. Corn Supply and Demand
The U.S. corn supply and demand balance is especially tight. The USDA surprised the corn market by slashing its estimate of the U.S. corn crop in the August 11 Crop Production report. Based on the first field surveys of the year, the agency lowered the national average yield 5.7 bushels to 153.0 bushels per acre due to excessive heat and below average precipitation across much of the Corn Belt during July. In addition, harvested area was reduced by one-half million acres to 84.4 million acres due primarily to severe flooding along wide swaths of the Missouri River basin this spring. As a result, the USDA reduced its estimate of the U.S. corn crop 556 million bushels to 12.91 billion bushels.
Given smaller supplies, USDA made deep cuts in use for each major demand category and also lowered ending stocks. Feed and residual use was dropped 150 million bushels, food, seed and industrial use was lowered 40 million bushels (the ethanol grind was reduced 50 million bushels to a record 5.10 billion bushel) and exports were cut 150 million bushels. In total, projected use was slashed 340 mil bu. The agency forecast that stocks at the end of the 2011/12 crop year would drop to 714 mil bu or just 5.4% of use.
Corn prices are expected to increase in order to destroy this much demand and USDA acknowledged this by taking their average farm price estimate up to $6.20 to $7.20 per bushel from their estimate of $5.50 to $6.50 per bushel just 30 days earlier. The most significant implication for crop input suppliers is that record acreage is required in 2012 – the crop farmers will begin to fertilize this Fall with product companies are selling to dealers right now. We expected 2012 corn acreage in the 93 to 95 million acre range next year. Today it looks like the market will need to bid for acreage at the upper end of this range due to the smaller than expected crop this year and assuming a moderate demand recovery in 2012/13.
Phosphate: Betting on New and Even Some Old Supplies
The global phosphate market is betting on new and even some old supplies to meet accelerating demand growth. Phosphate demand growth is on quite a run. Global shipments of the main solid phosphate products are forecast to increase to 60 to 62 million tonnes in 2011, up from 58.1 million tonnes in 2010 and up from 52.4 million tonnes in 2009. If this forecast is on target, this would be the third year in a row of record-shattering shipments. In fact, projected shipments in 2011 are expected to top the 2007 high mark of 50.9 million tonnes by about 10.5 million tonnes or the equivalent of four Ma’aden facilities operating at 90% of capacity!
No let-up is in sight. Based on a first peak at 2012, it looks like shipments will climb to 62 to 64 million tonnes next year due to prospects of continued high agricultural commodity prices and outstanding farm economics worldwide.
A good way to frame the current situation is to examine import demand and export supply for these products. Based on current farm economics, import demand is forecast to increase 1.0 million tonnes to a record 25.8 million tonnes in 2011. On the supply side of the ledger, Chinese exports are expected to drop about 850,000 tonnes this year due to the implementation of a progressive export tax during the low-tax season that runs from June 1 through September 30. Phosphate prices are expected to move to the level that will close this potential 1.85 million tonne gap by pulling additional supplies from key swing producers or by slowing demand growth in some regions.
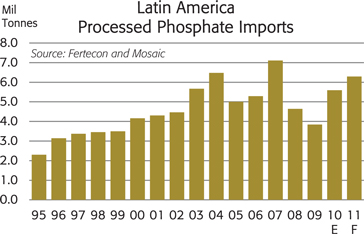
The Americas are the main engines of growth this year. In Latin America, the projected growth in import demand is expected to account for two-thirds of the total increase. According to statistics released by the Brazilian fertilizer association (ANDA), total fertilizer shipments increased 30% to 11.2 million tonnes during the first half of 2011. That ranked second only to the 11.5 million tonnes shipped during the first half of 2008. Shipments this year are forecast to climb to a record 26.0 million tonnes, topping the previous high mark of 24.6 million tonnes in 2007 and implying record shipments during the last half of 2011.
Brazilian phosphate shipments increased 35% and imports surged 77% to 1.7 million tonnes during the first half of the year. The jump in imports resulted from both strong end-user demand as well as a drop in domestic production (MAP output was down 20% during the first half of 2011). Phosphate imports are projected to increase to 3.4 to 3.5 million tonnes for the entire year so about one-half of projected imports still needs to be shipped during the second half of 2011.
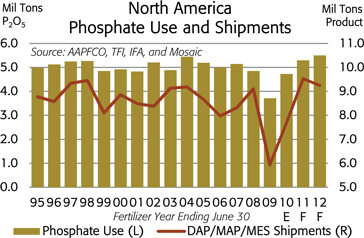
In North America, phosphate shipments surged to a modern era record 9.8 million tons during the fertilizer year that ended June 30, 2011. That was up 23% or 1.8 million tons from the previous year and it was up 59% or 3.7 million tons from the depressed level of 2008/09. Shipments in 2010/11 exceeded the 10-year Olympic average by 1.0 million tons.


North American phosphate shipments are projected to remain at high levels in 2011/12 due in large part to the prospect of U.S. farmers planting 93 to 95 million acres of corn next spring. Phosphate use is forecast to increase another 1% to 2% to the 5.5 million ton P2O5 range. Shipments of the leading solid phosphate products are projected to total 9.0 to 9.5 million tons in 2011/12. The small drop this year is the result of larger-than-normal shipments in May and June. Unlike last year, many distributors bought summer fill tonnage early to avoid potential shipment delays and to position product ahead of expected price increases.
Some analysts questioned whether North American phosphate and potash shipments would ever recover from the collapse two years ago. Well, just two years later it looks more like a Renaissance in North American P&K use. Recent shipment statistics support the analysis by the International Plant Nutrition Institute (IPNI) that shows high-yielding crops have removed more P&K from soils than farmers have replaced during the past several years and that rebounds in application rates are needed to maintain soil fertility.
In India, phosphate demand is projected to increase nearly 4%, but DAP shipments are forecast to dip slightly to 10.9 million tonnes in 2011/12 due in part to supply limitations. DAP shipments last year were up 9% or more than 950,000 tonnes from two years ago and were 64% or 4.0 million tonnes greater than levels just five years ago. DAP imports are projected to decline modestly from 7.5 million tonnes in 2010/11 to 7.1 million tonnes in 2011/12 due to expected increases in domestic DAP fabrication.
Statistics from the Fertilizer Association of India (FAI) for the first quarter of the fertilizer year (Apr-Jun) indicate that India is off to a slow start this year. DAP shipments picked up in June but sales for the first quarter totaled 1.4 million tonnes, off 29% from a year ago and less than half the record level two years ago. DAP imports surged to 840,000 tonnes in June, but the total for the first quarter of the fertilizer year was only 950,000 tonnes, down more than 40% from last year and off almost 55% from two years ago. Imports are expected to top 1.0 million tonnes in both July and August based on first half (Apr-Sep) contract settlements. Domestic DAP fabrication also was off 9% during the first quarter.
Import demand is projected to increase in several other countries. For example, Australian phosphate imports are projected to jump 40% or more than 300,000 tonnes this year and Argentine imports are forecast to increase 12% or about 130,000 tonnes this year.
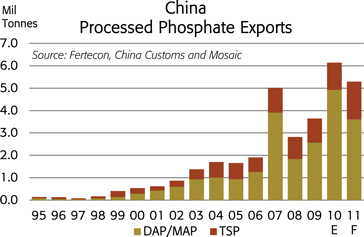
Demand prospects continue to look outstanding, but several supply uncertainties still overhang the global phosphate market. China remains the biggest uncertainty. China emerged as the second largest exporter of finished phosphate products last year. Chinese producers exported a record 6.1 million tonnes in 2010, just less than the 6.3 million tonnes exported by the United States last year. DAP/MAP accounted for 80% or 4.9 million tonnes while TSP accounted for 20% or 1.2 million tonnes of the total last year. Exports are expected to drop to about 5.3 million tonnes this year due to the implementation of a progressive tax on DAP/MAP exports during the off peak domestic season (Jun 1 to Sep 30). Under the new scheme the government captures much of the profit on DAP/MAP exports if export realizations exceed a base price that is aligned with a domestic price target. As a result, offshore DAP/MAP shipments are expected to drop 1.3 million tonnes to 3.6 million tonnes but TSP exports are forecast to increase 475,000 tonnes to 1.7 million tonnes in 2011.
Trade statistics from China Customs indicate that high prices pulled more phosphate out of China during the first half of this year. DAP/MAP/TSP exports increased 29% to 1.7 million tonnes during the first six months of 2011. However, the new export tax has slowed DAP/MAP exports. DAP/MAP exports declined 13% to 774,000 tonnes during the first half of 2011. However, TSP exports surged 112% to 935,000 tonnes during the first half. TSP exports are taxed at a low flat rate of 7%.
A second uncertainty is production from the new Ma’aden facility in Saudi Arabia. According to company press releases and industry reports, Ma’aden initiated operations on June 17 and the first vessel of DAP was scheduled to sail for India during the first week of August. Analysts expect that Ma’aden will export 200,000 to 500,000 tonnes of DAP during the second half of 2011 and most project that Ma’aden will export more than two million tonnes in 2012.
New supplies from Ma’aden will fill only a small part of the potential gap between import demand and export supply this year. Additional supplies will need to come from current producers, yet several producers are having production issues of their own. Civil unrest and labor strikes have disrupted phosphate production in Tunisia. Tunisia typically exports about two million tonnes of
DAP and TSP each year, but exports likely will drop to less than 1.5 million tonnes this year – more than offsetting expected new supplies from Ma’aden during the second half of the year. In addition, Arab Spring also threatens phosphate supplies from Syria and Egypt, the fourth and fifth largest exporters of phosphate rock to non-integrated producers around the world.
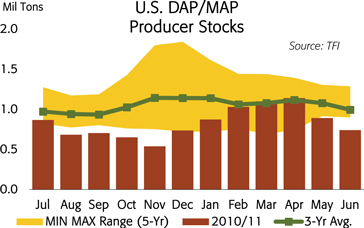
The recent drop in U.S. producer stocks illustrates the tight conditions in the global phosphate market. U.S. phosphate producers reported holding just 741,000 tons of DAP/MAP at both off- and on-site facilities at the end of June, down 31% from a year earlier and off 28% from the five-year average for this date.
Potash – Betting on Full Production Capability
The global potash market is betting on producers to achieve full production capabilities in order to meet record demand this year. The demand outlook remains outstanding – underpinned by high agricultural commodity prices and profitable farm economics worldwide.
Despite the delays in settling 2011/12 contract prices in India, we still forecast that global muriate of potash (MOP) shipments will increase from 53 million tonnes KCl in 2010 to 55 to 58 million tonnes in 2011. The mix obviously has changed from earlier forecasts with lower than expected shipments to India more than offset by greater than expected shipments to other Asian countries and the Americas. Our first look at next year indicates that global shipments likely will climb to 58 to 61 million tonnes in 2012.
Global MOP trade is projected to climb to 36 million tonnes KCl in 2011, up from 34 million tonnes last year. Trade is projected to increase to a record 38 million tonnes in 2012 and eclipse the previous high mark of just more than 37 million tonnes in 2007.
In Latin America, MOP import demand is projected to increase 1.0 to 1.3 million tonnes KCl in 2011. Imports by most countries in this region are expected to increase, but Brazil accounts for about 80% of Latin American imports and will take the lion’s share of the projected increase this year. In particular, Brazilian imports are forecast to increase from 6.0 million tonnes in 2010 to 6.7 to 7.0 million tonnes in 2011. Brazil is on pace to easily reach this range. Potash shipments were up 37% and MOP imports jumped 36% to 3.7 million tonnes during
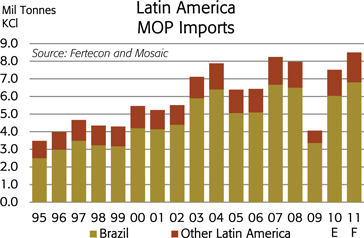
the first six months of 2011. The increase in imports mostly was the result of strong end user demand but domestic MOP production dropped 19% during the first half of the year.
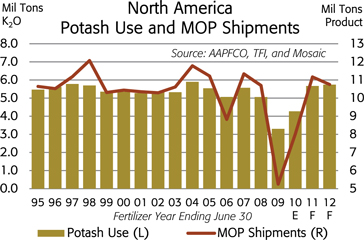
In North America, MOP shipments jumped to 11.2 million tons KCl during the fertilizer year that ended June 30, 2011. That was up 39% or 3.2 million tons from the previous year and it was up 113% or 6.0 million tons from the depressed level of 2008/09. North American shipments last year exceeded the 10-year Olympic average of 10.2 million tons by 1.0 million tons! Again, this looks more like a demand Renaissance to us than the permanent decline that several analysts hypothesized two years ago.
North American potash demand and shipments are projected to remain at high levels in 2011/12. North American potash use is forecast to increase 1% to 2% to the 5.7 million tons K2O range and MOP shipments are projected to total 10.5 to 11.0 million tons in 2011/12. The small expected drop this year also is the result of larger-than-normal shipments during the last several weeks of 2010/11 that will carry over for the 2011/12 fertilizer year.
In China, MOP imports are projected to register a respectable increase this year even though the total still will fall far short of the previous record. China is projected to import 5.5 to 5.8 million tonnes in 2011, up from less than 5.3 million tonnes last year but off from the peaks of 9.4 million tonnes in 2007 and 8.8 million tonnes in 2005. Chinese MOP imports totaled 2.9 million tonnes during the first six months of 2011, up 16% from a year earlier. Imports from Canada during the first half were

up 87% from last year. Chinese buyers concluded second half contracts with major suppliers in late June at delivered prices that were up $70 per tonne from the first half. This timely settlement has kept potash flowing to customers during the second half of the year.
In India, MOP imports are projected to drop to 4.5 to 5.0 million tonnes KCl this calendar year after climbing to a record 6.3 million tonnes in 2010. The projected decline is due in part to supply limitations given record global demand and is expected to result in a near-empty distribution pipeline at the end of the year. Imports during the first half of 2011 totaled 1.5 million tonnes, down from 2.9 million tonnes from a year earlier. Based on recent contract settlements, India is expected to import 3.0 to 3.5 million tonnes of this contracted volume before the end of 2011. India imported about 2.6 million tonnes of MOP during the last five months of 2010 and 3.6 million tonnes during the last five months of 2009.
In the rest of Asia, imports are forecast to surge to a record high and offset a big chunk of the expected decline in India this
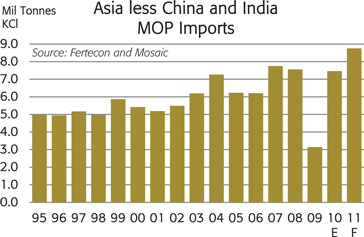
year. Imports by Asian countries other than China and India are projected to increase to 8.7 to 9.0 million tonnes this year, a gain of 1.2 to 1.5 million tonnes from last year. Indonesia and Malaysia are the main drivers of growth in this region with imports by each country expected to increase about 400,000 tonnes this year. Canpotex shipments alone to this region increased 24% or 540,000 tonnes during the first half of 2011.
Import demand in regions not often making headlines also is on the rise. For example, import demand from Europe, North America, Africa and the Mideast combined is projected to increase 1.1 to 1.3 million tonnes in 2011.
Record demand once again is expected to stress the supply capabilities of potash producers worldwide. We estimate that global MOP operational capacity was a whisker shy of 63 million tonnes at the start of 2011. The global industry would have to operate at high rates of 87% to 92% of operational capacity in order to meet projected demand this year. On the supply side, there is little margin for error such as having an unexpected mine or mill breakdown, hitting a vein of poor ore or taking more time than planned to tie in a brownfield expansion.
Global potash shipments surged 15% or 7.0 million tonnes to 55 million tonnes in 2007. This surge stress tested the supply capabilities of the global industry back then. Operational capacity was 58 million tonnes at the time and global output jumped from 48 million tonnes in 2006 to more than 54 million tonnes or 93% of operational capacity in 2007. Producers also depleted inventories in order to ship 55 million tonnes to meet this unprecedented demand. The situation this year may not be as acute as four years ago, but demand growth once again is expected to stress the production capabilities of potash producers around the globe. As noted before, we expect that the global potash market will remain tight until significant new capacity comes on line during the next few years.