Attached files
| file | filename |
|---|---|
| EX-5.1 - EX-5.1 - Carbon Energy Corp | a11-24044_1ex5d1.htm |
| EX-23.1 - EX-23.1 - Carbon Energy Corp | a11-24044_1ex23d1.htm |
| EX-99.2 - EX-99.2 - Carbon Energy Corp | a11-24044_1ex99d2.htm |
| EX-21.1 - EX-21.1 - Carbon Energy Corp | a11-24044_1ex21d1.htm |
| EX-10.3 - EX-10.3 - Carbon Energy Corp | a11-24044_1ex10d3.htm |
| EX-23.2 - EX-23.2 - Carbon Energy Corp | a11-24044_1ex23d2.htm |
| EX-10.5 - EX-10.5 - Carbon Energy Corp | a11-24044_1ex10d5.htm |
| EX-99.1 - EX-99.1 - Carbon Energy Corp | a11-24044_1ex99d1.htm |
| EX-10.4 - EX-10.4 - Carbon Energy Corp | a11-24044_1ex10d4.htm |
| EX-23.3 - EX-23.3 - Carbon Energy Corp | a11-24044_1ex23d3.htm |
As Filed with the Securities and Exchange Commission on August 12, 2011
Registration No. 333-
UNITED STATES
SECURITIES AND EXCHANGE COMMISSION
Washington, D.C. 20549
Form S-1
Registration Statement
Under
The Securities Act of 1933
CARBON NATURAL GAS COMPANY
|
Delaware |
|
1311 |
|
26-0818050 |
|
(State or other jurisdiction of |
|
(Primary Standard Industrial |
|
(I.R.S. Employer |
1700 Broadway, Suite 2020, Denver, Colorado 80290; telephone 720.407.7043
(Address, including zip code, and telephone number, including area code,
of registrant’s principal executive offices)
Kevin D. Struzeski
Chief Financial Officer
Carbon Natural Gas Company
1700 Broadway, Suite 2020
Denver, Colorado 80290
T. 303.720.7030 F. 303.720.7031
(Name, address, including zip code, and telephone number, including area code, of agent for service)
Copies of all communications, including communications sent to agent for service, should be sent to:
Theresa M. Mehringer
Burns Figa & Will P.C.
6400 S. Fiddler’s Green Circle, Suite 1000
Greenwood Village, Colorado 80111
T. 303.796.2626 F. 303.796.2777
Jeffrey J. Peterson
Welborn Sullivan Meck & Tooley, P.C.
1125 Seventeenth Street, Suite 2200
Denver, Colorado 80202
T. 303.830.2500 F. 303.832.2366
Approximate date of commencement of proposed sale to public: From time to time after the effective date of this Registration Statement.
If any of the securities being registered on this Form are to be offered on a delayed or continuous basis pursuant to Rule 415 under the Securities Act of 1933, check the following box. x
If this Form is filed to register additional securities for an offering pursuant to Rule 462(b) under the Securities Act, check the following box and list the Securities Act registration statement number of the earlier effective registration statement for the same offering. o
If this Form is a post-effective amendment filed pursuant to Rule 462(c) under the Securities Act, check the following box and list the Securities Act registration statement number of the earlier effective registration statement for the same offering. o
If this Form is a post-effective amendment filed pursuant to Rule 462(d) under the Securities Act, check the following box and list the Securities Act registration statement number of the earlier effective registration statement for the same offering. o
Indicate by check mark whether the registrant is a large accelerated filer, an accelerated filer, a non-accelerated filer, or a smaller reporting company. See the definitions of “large accelerated filer,” “accelerated filer” and “smaller reporting company” in Rule 12b-2 of the Exchange Act. (Check one):
|
Large accelerated filer o |
Accelerated filer o |
Non-accelerated filer o |
Smaller reporting company x |
CALCULATION OF REGISTRATION FEE
|
Title of Each Class of |
|
Amount to be |
|
Proposed Maximum |
|
Proposed Maximum |
|
Amount of Registration |
| |||
|
Common Stock, $0.01 Par Value per Share |
|
44,444,444 |
|
$ |
0.95 |
(2) |
$ |
42,222,222 |
(2) |
$ |
4,902 |
|
|
(1) |
|
Pursuant to Rule 416 under the Securities Act, the shares being registered hereunder include such indeterminate number of shares as may be issuable with respect to the shares being registered hereunder as a result of stock splits, stock dividends or similar transactions. |
|
(2) |
|
Estimated solely for the purpose of calculating the amount of registration fee pursuant to Rule 457(c) under the Securities Act. The proposed maximum offering price per share and proposed maximum aggregate offering price are based upon the average of the bid and asked price of the common stock as of August 8, 2011. |
We will amend this registration statement on such date or dates as may be necessary to delay our effective date until we will file a further amendment which specifically states that this Registration Statement shall thereafter become effective in accordance with Section 8(a) of the Securities Act of 1933 or until this Registration Statement will become effective on such date as the Securities and Exchange Commission, in accordance with Section 8(a) may determine.
The information in this prospectus is not complete and may be changed. We may not sell these securities until the registration statement filed with the Securities and Exchange Commission is effective. This prospectus is not an offer to sell these securities, and we are not soliciting an offer to buy these securities in any state where the offer or sale is not permitted.
SUBJECT TO COMPLETION, DATED AUGUST , 2011
PRELIMINARY PROSPECTUS
CARBON NATURAL GAS COMPANY
44,444,444 Shares of Common Stock
This prospectus relates to the sale or other disposition from time to time by selling securityholders of some or all of 44,444,444 shares of our common stock, originally issued by us pursuant to the Common Stock Purchase Agreement, dated as of June 29, 2011, by and among us and the investors party thereto (the “Private Placement Purchase Agreement”) in connection with a private placement of our common stock which closed on June 29, 2011 (the “Private Placement”).
The selling securityholders, which as used herein includes donees, pledgees, transferees or other successors-in-interest selling shares of our common stock or interests in shares of our common stock received after the date of this prospectus from a selling securityholder as a gift, pledge, partnership distribution or other transfer, may, from time to time, sell, transfer or otherwise dispose of any or all of their shares of our common stock or interests in shares of our common stock on any stock exchange, market or trading facility on which the shares are traded or in private transactions. These dispositions may be at fixed prices, at prevailing market prices at the time of sale, at prices related to the prevailing market price, at varying prices determined at the time of sale, or at negotiated prices. If these shares are sold through underwriters, broker-dealers or agents, the selling securityholders will be responsible for underwriting discounts or commissions or agents’ commissions. We will pay the expenses of registering these securities.
Our Common Stock is not listed on an exchange, and we do not currently have plans to list them on any exchange.
Our common stock is quoted on the OTC Bulletin Board under the symbol “CRBO.” On August 8, 2011, the last reported closing bid price of our common stock was $0.80 per share. These over-the-counter quotations reflect inter-dealer prices, without retail mark-up, mark-down or commission and may not necessarily represent actual transactions. You are urged to obtain current market quotations of the common stock.
Investing in the securities involves a high degree of risk. See “Risk Factors” beginning on page 5 of this prospectus.
Neither the Securities and Exchange Commission (the “SEC”) nor any state securities commission has approved or disapproved of the securities offered hereby or passed upon the adequacy or accuracy of this prospectus. Any representation to the contrary is a criminal offense.
The date of this prospectus is , 2011
|
|
Page No. |
|
|
|
|
3 | |
|
5 | |
|
5 | |
|
19 | |
|
19 | |
|
22 | |
|
23 | |
|
25 | |
|
25 | |
|
26 | |
|
38 | |
|
42 | |
|
42 | |
|
42 | |
|
Management’s Discussion and Analysis of Financial Condition and Results of Operations |
44 |
|
63 | |
|
65 | |
|
Security Ownership of Certain Beneficial Owners and Management |
70 |
|
72 | |
|
Changes In And Disagreements With Accountants On Accounting And Financial Disclosure |
74 |
|
74 | |
|
F-1 | |
|
F-28 | |
|
II-6 |
ABOUT THIS PROSPECTUS
Upon the closing of the Merger (as defined and discussed below under “Prospectus Summary”), Carbon Natural Gas Company (f/k/a St. Lawrence Seaway Corporation), a Delaware corporation, succeeded to the business of Nytis Exploration (USA) Inc., a Delaware corporation (“Nytis USA”). In connection with the Merger, effective May 2, 2011, we changed our corporate name to Carbon Natural Gas Company. Unless the context otherwise requires, “we,” “our,” “us,” “our company” and similar expressions used in this prospectus refer to Nytis USA and its consolidated subsidiaries, collectively, prior to the closing of the Merger on February 14, 2011, and Carbon Natural Gas Company (f/k/a St. Lawrence Seaway Corporation), as successor to the business of Nytis USA, and its consolidated subsidiaries, collectively, following the closing of the Merger.
This prospectus is part of a registration statement that we filed with the SEC.
You should rely only on the information contained in this prospectus. We have not authorized anyone to provide you with information different from that contained in this prospectus. This prospectus is offering to sell, and is seeking offers to buy, the securities only in jurisdictions where offers and sales are permitted. The information contained in this prospectus speaks only as of the date of this prospectus unless the information specifically indicates that another date applies, regardless of the time of delivery of this prospectus or of any sale of our common stock.
We may provide a prospectus supplement containing specific information about the terms of a particular offering by the selling securityholders, or their transferees. The prospectus supplement may add, update or change information in this prospectus. If information in a prospectus supplement is inconsistent with the information in this prospectus, you should rely on the information in that prospectus supplement. You should read both this prospectus and, if applicable, any prospectus supplement hereto. See “Where You Can Find More Information” for more information.
This prospectus includes industry and market data and other information, which we have obtained from, or is based upon, market research, independent industry publications or other publicly available information. Although we believe each such source to have been reliable as of its respective date, we have not independently verified the information contained in such sources. Any such data and other information is subject to change based on various factors, including those described below under the heading “Risk Factors” and elsewhere in this prospectus.
This summary highlights information contained elsewhere in this prospectus. It may not contain all of the information that you should consider before investing in our common stock. You should read this entire prospectus carefully, including the “Risk Factors”, Glossary of Natural Gas and Oil Terms and the financial statements and related notes and the unaudited pro forma combined financial statements included herein. This prospectus includes forward-looking statements that involve risks and uncertainties. See “Cautionary Note Regarding Forward-Looking Statements.”
About the Company
Carbon Natural Gas Company (a Delaware corporation reincorporated from Indiana in August 2007 and formerly known as St. Lawrence Seaway Corporation “SLSC”), owns and operates natural gas and crude oil interests in the Appalachian and Illinois Basins of the United States. It produces and sells natural gas, natural gas condensate and natural gas liquids, as well as crude oil. Carbon’s acreage is held and its exploration and production activities are conducted indirectly through wholly owned and majority-owned subsidiaries.
· Nytis Exploration (USA) Inc. (“Nytis USA”) was organized as a Delaware corporation in 2004. Nytis now is owned 100% by Carbon.
· Soon after formation, Nytis USA identified natural gas and oil interests located in Clearfield County, Pennsylvania, and organized (along with a minority owner) a subsidiary limited liability company, Nytis Exploration of Pennsylvania LLC, a Pennsylvania limited liability company (“Nytis PA”), which acquired those interests. Nytis PA is owned 85% by Nytis.
· Thereafter, Nytis USA identified natural gas and oil interests (owned by Addington Exploration, LLC (“Addington”)) located primarily in Illinois, Indiana, Kentucky, Ohio, Tennessee and West Virginia. To acquire the Addington assets, Nytis USA formed (along with a different unaffiliated person) Nytis Exploration Company LLC (“Nytis LLC”). Nytis LLC is owned 98.1% by Nytis USA. Nytis LLC continued acquiring interests complementary to the Addington assets, including the 2006 acquisition of Pennsylvania properties from DCPA, LLC (an affiliate of Delta Petroleum Corporation). In the spring of 2010, Nytis PA and Nytis LLC sold all of the Pennsylvania assets and received total proceeds of approximately $30.3 million ($21 million to Nytis LLC and $9.3 million to Nytis PA). In this transaction, Nytis PA sold all of its assets, and this subsidiary is being dissolved and its business wound up.
Now, substantially all the natural gas and oil interests are owned by Nytis LLC, which continues to acquire and exploit its properties. As of June 30, 2011, Nytis LLC owns interests in approximately 826 gross (480 net) productive natural gas and oil wells on approximately 321,000 (248,000 net) undeveloped acres in the Appalachian and Illinois Basins.
· On January 31, 2011, Nytis USA entered into an Agreement and Plan of Merger (the “Merger Agreement”) with SLSC, which was closed on February 14, 2011. At that date, SLSC acquired all of the issued and outstanding shares of Nytis USA from the Nytis USA stockholders, and thereby became the indirect owner of all of Nytis USA’s equity interests in Nytis LLC and Nytis PA, in exchange for the issuance by SLSC to the Nytis USA stockholders of 47,000,003 restricted shares of SLSC common stock (which then constituted 98.9% of SLSC’s issued and outstanding common stock), and Nytis USA became a wholly-owned subsidiary of SLSC, and Nytis LLC and Nytis PA became majority-owned indirect subsidiaries of SLSC (the “Merger”) .
In connection with the closing of the Merger, the officers and directors of Nytis USA became the officers and directors of SLSC.
On May 2, 2011, SLSC’s name was changed to Carbon Natural Gas Company.
Carbon now is a holding company which conducts substantially all its natural gas and oil operations through Nytis LLC.
Unless stated otherwise below, “Carbon,” “Company” and “we” (and related first person plural nouns and adjectives) collectively refer to Carbon Natural Gas Company, and its subsidiaries Nytis USA, Nytis LLC, and Nytis PA.
Our principal executive offices are located at 1700 Broadway, Suite 2020, Denver CO 80290. Our telephone number is (720) 407-7043.
Shares Covered by This Prospectus
This prospectus relates to the resale or other disposition by the selling securityholders of 44,444,444 shares of our common stock that are currently outstanding and were issued on or about June 29, 2011. On June 29, 2011, we entered into the Private Placement Purchase Agreement with 23 accredited investors, pursuant to which we issued to these investors an aggregate of 44,444,444 shares of our common stock at a purchase price of $0.45 per share. In connection with the Private Placement, we entered into a registration rights agreement with the investors who purchased common stock in the Private Placement (the “Registration Rights Agreement”). Pursuant to the Registration Rights Agreement, we agreed to file the registration statement to which this prospectus is a part with the Securities and Exchange Commission covering the resale of the shares of common stock purchased by the investors in the Private Placement.
The Offering
|
Common stock covered hereby: |
|
44,444,444 shares |
|
|
|
|
|
Common stock outstanding as of August 11, 2011: |
|
114,185,405 shares |
|
|
|
|
|
Use of Proceeds: |
|
We will not receive any proceeds from the sale of the shares of common stock covered by this prospectus. |
|
|
|
|
|
Trading Symbol: |
|
CRBO |
|
|
|
|
|
Risk Factors: |
|
Investing in our securities involves a high degree of risk. See “Risk Factors” beginning on page 5. |
CAUTIONARY STATEMENT REGARDING FORWARD-LOOKING STATEMENTS
Information in this prospectus includes “forward-looking statements” within the meaning of Section 27A of the Securities Act of 1933 (the “1933 Act”) and Section 21E of the Securities Exchange Act of 1934 (the “1934 Act”). All statements, other than statements of historical fact, are forward-looking statements.
Examples of such statements in this prospectus concern planned capital expenditures for oil and natural gas exploration in 2011; cash expected to be available for continued work programs; recovered volumes and values of oil and natural gas approximating estimates of oil and natural gas reserves; drilling and completion activities in the Appalachian and Illinois Basins; timing for drilling of additional wells; expected spacing for wells; compliance with all oil and gas exploration and environmental regulations; and all the other statements regarding future conditions and operations.
These forward-looking statements are identified by their use of terms and phrases such as “may,” expect,” “estimate,” “project,” “plan,” “believe,” “intend,” “anticipate,” “will,” “continue,” “potential,” and similar terms and phrases. Though we believe that the expectations reflected in these statements are reasonable, they do involve certain assumptions, risks and uncertainties.
Investing in our common stock involves a high degree of risk. You should consider carefully the risks, uncertainties and other factors described below, in addition to the other information set forth in this prospectus, before deciding whether to invest in shares of our common stock. Any of these risks, uncertainties and other factors could materially and adversely affect our business, financial condition, results of operations, cash flows or prospects. In that case, the market price of our common stock could decline, and you may lose all or part of your investment in our common stock. See also “Cautionary Note Regarding Forward-Looking Statements.”
Risks Related to our Business and Industry
Natural gas and oil prices are volatile. A substantial or extended decline in natural gas and oil prices may adversely affect our business, financial condition or results of operations and our ability to meet our capital expenditure obligations and financial commitments.
Our financial condition, operating results, and future rate of growth depend upon the prices that we receive for our natural gas and oil. Prices also affect our cash flow available for capital expenditures and our ability to access funds under our bank credit facility and through the capital markets. The amount available for borrowing under our bank credit facility is subject to a borrowing base, which is determined by our lender taking into account our estimated proved developed reserves and is subject to periodic redeterminations based on pricing models determined by the lender at such time. Declines in natural gas and oil prices have in the past adversely impacted the value of our estimated proved developed reserves and, in turn, the market values used by our lenders to determine our borrowing base. Future commodity price declines may have similar adverse effects on our reserves and borrowing base. See “Management’s Discussion and Analysis of Financial Condition and Results of Operations—Liquidity and Capital Resources—Bank Credit Facilities,” for more details. Further, because we have elected to use the full cost accounting method, each quarter we must perform a “ceiling test” that is impacted by declining prices. Significant price declines could cause us to take one or more ceiling test write-downs, which would be reflected as non-cash charges against current earnings. See Risk Factor below entitled “Lower natural gas and oil prices and other factors have resulted, and in the future may result, in ceiling test write-downs and other impairments of our asset carrying values.”
The markets for natural gas and oil have been volatile historically and are likely to remain volatile in the future. Oil spot prices reached historical highs in July 2008 and natural gas spot prices reached near historical highs in July 2008. Prices have declined significantly since that time and may continue to fluctuate widely in the future. The prices we receive for our natural gas and oil depend upon factors beyond our control, including among others:
· worldwide and regional economic conditions impacting the global supply and demand for natural gas and oil;
· the price and quantity of imports of foreign natural gas, including liquefied natural gas, and oil;
· political conditions in or affecting other natural gas and oil-producing countries, including the current conflicts in the Middle East and conditions in Latin America, Russia and the independent states of the former Soviet Union;
· the level of global natural gas and oil exploration and production;
· the level of global natural gas and oil inventories;
· prevailing prices on local natural gas and oil price indexes in the areas in which we operate;
· localized and global supply and demand fundamentals and transportation availability;
· weather conditions;
· technological advances affecting energy consumption;
· the price and availability of alternative energy; and
· domestic, local and foreign governmental regulation and taxes.
These factors make it very difficult to predict future commodity price movements with any certainty. We sell the majority of our natural gas and oil production at current prices rather than through fixed-price contracts. However, we do enter into derivative instruments to reduce our exposure to fluctuations in natural gas and oil prices. See Risk Factor below entitled “Our future use of hedging arrangements could result in financial losses or reduce income.” At June 30, 2011, 99% of our estimated proved reserves were natural gas, and, as a result, our financial results will be more sensitive to fluctuations in natural gas prices.
Furthermore, the worldwide financial and credit crisis has reduced the availability of liquidity and credit to fund the continuation and expansion of industrial business operations worldwide. The shortage of liquidity and credit combined with recent substantial losses in worldwide equity markets has led to a worldwide economic recession. The slowdown in economic activity caused by such recession has reduced worldwide demand for energy and resulted in lower natural gas and oil prices. Natural gas spot prices have recently been particularly volatile and declined from record high levels in early July 2008 of over $13.00 per MMBtu to below $3.00 per MMBtu in September 2009 and below $4.00 per MMBtu for portions of 2010, and have been in excess of $4.50 per MMBtu for portions of calendar 2011. More recently, oil prices have been generally increasing due in part to the unrest and uncertainty in the Middle East, however, this has not had a similar effect on the price of natural gas.
We have indebtedness and may incur more debt in the future. Our leverage may materially affect our operations and financial condition.
We (through Nytis LLC) have a bank credit facility with the Bank of Oklahoma, the outstanding balance of which was $9.8 million at June 30, 2011, and we may incur more debt in the future. This indebtedness may have several important effects on our business and operations; among other things, it may:
· require us to use a significant portion of our cash flow to pay principal and interest on the debt, which will reduce the amount available to fund working capital, capital expenditures, and other general corporate purposes;
· limit our access to the capital markets;
· increase our borrowing costs, and impact the terms, conditions, and restrictions contained in our debt agreements, including the addition of more restrictive covenants;
· limit our flexibility in planning for and reacting to changes in our business as covenants and restrictions contained in our existing and possible future debt arrangements may require that we meet certain financial tests and place restrictions on the incurrence of additional indebtedness;
· place us at a disadvantage compared to similar companies in our industry that have less debt; and
· make us more vulnerable to economic downturns and adverse developments in our business.
Our bank credit facility contains various restrictive covenants. A failure on our part to comply with the financial and other restrictive covenants contained in our bank credit facility could result in a default under these agreements. Any default under our bank credit facility could adversely affect our business and our financial condition and results of operations, and would impact our ability to obtain financing in the future. In addition, the borrowing base included in our bank credit facility is subject to periodic redetermination by our lender. A lowering of our borrowing base could require us to repay indebtedness in excess of the redetermined (lower) borrowing base. See “Management’s Discussion and Analysis of Financial Condition and Results of Operations—Liquidity and Capital Resources—Bank Credit Facility.”
A higher level of debt will increase the risk that we may default on our financial obligations. Our ability to meet our debt obligations and other expenses will depend on our future performance. Our future performance will be primarily affected by natural gas prices (and to a lesser extent, oil prices), financial, business, domestic and global economic conditions, governmental regulations and environmental regulations, and other factors, many of which we are unable to control. If our cash flow is not sufficient to service our debt, we may be required to refinance the debt, sell assets, or sell shares of our stock on terms that we do not find attractive, if it can be done at all.
A portion of our borrowings from time to time may be at variable interest rates, making us vulnerable to increases in interest rates.
Our estimates of proved reserves at June 30, 2011 and at December 31, 2010 and 2009 have been prepared under the SEC’s new rule that went into effect for fiscal years ending on or after December 31, 2009. The new SEC rule could limit our ability to book additional proved undeveloped reserves in the future.
This prospectus includes estimates of our proved reserves as of June 30, 2011, and as of December 31, 2010 and 2009, which have been prepared and presented under the SEC’s new rule relating to the reporting of natural gas and oil exploration activities. These new rules are effective for fiscal years ending on or after December 31, 2009, and require that, subject to limited exceptions, proved undeveloped reserves may only be booked if they relate to wells scheduled to be drilled within five years of the date of booking. This new rule has limited and may continue to limit our potential to book additional proved undeveloped reserves as we pursue our drilling program. Moreover, we may be required to write down any proved undeveloped reserves that are not developed within the required five-year timeframe.
The SEC has released only limited interpretive guidance regarding reporting of reserve estimates under this new rule and may not issue further interpretive guidance on the new rule. Accordingly, while the estimates of our proved reserves at June 30, 2011 and December 31, 2010 and 2009 included in this prospectus have been prepared based on what we believe to be reasonable interpretations of the new SEC rule, those estimates could differ materially from any estimates we might prepare applying more specific SEC interpretive guidance as it becomes available.
Neither the estimated quantities of proved reserves and their discounted present value of future net cash flows attributable to those reserves included in this prospectus nor the independent audit of proved developed producing reserves and the Company’s estimated discounted present value of future net cash flows are intended to represent their fair, or current, market value.
Reserve estimates depend on many assumptions that may turn out to be inaccurate. Any material inaccuracies in these reserve estimates or underlying assumptions will materially affect the quantities and present value of our reserves.
The estimates of our reserves and the future net cash flows attributable to those reserves, were prepared internally by us and those estimates related to proved developed producing reserves were audited as of January 1, 2011 by the independent petroleum consultants Cawley, Gillespie & Associates, Inc. (“CG&A”). Estimates as of our reserves as of June 30, 2011 as included in this prospectus have not been audited by CG&A. The process of estimating natural gas reserves is complex. It requires interpretations of available technical data and many assumptions, including assumptions relating to current and future economic conditions and commodity prices. Any significant inaccuracies in these interpretations or assumptions could materially affect the estimated quantities and present value of our reserves and could also materially affect the results of CG&A’s audit. See “Description of Business—Reserves—
Estimated Proved Reserves” for information about our estimated natural gas reserves and the PV-10 and standardized measure of discounted future net cash flows.
In order to prepare our estimates, we must project production rates, the extent of our eventual working and net revenue interests and timing of development expenditures. We must also analyze available geological, geophysical, production and engineering data. The extent, quality and reliability of this data can vary. The process also requires economic assumptions about matters such as natural gas prices, drilling and operating expenses, capital expenditures, taxes and availability of funds.
Actual future production, natural gas and oil prices, revenues, taxes, development expenditures, operating expenses and quantities of recoverable natural gas reserves will vary from our estimates. Any significant variance could materially affect the estimated quantities and present value of our reserves. In addition, we may adjust estimates of our proved reserves to reflect production history, results of exploration and development, prevailing commodity prices and other factors, many of which are beyond our control.
It should not be assumed that the present value of future net revenues from our proved reserves is the current market value of our estimated reserves. We generally base the estimated discounted future net cash flows from our proved reserves under the revised SEC regulations. Actual future prices and costs may differ materially from those used in the present value estimate.
The estimates of our proved developed non-producing and proved undeveloped reserves were prepared internally by us and have not been audited by an independent engineer. An independent audit of these reserves might cause us to adjust our estimates of these reserves which could materially affect the quantities and present value of our reserves.
An independent engineer might interpret the available geological, geophysical, production and engineering data concerning our proved developed non-producing and proved undeveloped reserves differently than we have and might make different economic assumptions about prices, drilling and operating expenses, capital expenditures, taxes and availability of funds. If such an independent audit were undertaken on these reserves, it might have resulted in materially different estimates of the estimated quantities and present value of our reserves which would have materially affected the amounts of depreciation, depletion and amortization expense available to and the net income of the Company.
46% of our total proved reserves as of June 30, 2011 consist of undeveloped and developed non-producing reserves, and those reserves may not ultimately be developed or produced.
As of June 30, 2011 45% of our total proved reserves were undeveloped and 1% were developed non-producing, which includes the reserves acquired in the June purchase of assets from The Interstate Natural Gas Company LLC (and related parties). Although we plan to develop and produce all the proved reserves, ultimately some may not be developed or produced. In addition, not all of the undeveloped or developed non-producing reserves may begin producing at the expected times or within budget.
Lower natural gas and oil prices and other factors have resulted, and in the future may result, in ceiling test write-downs and other impairments of our asset carrying values.
We use the full cost method of accounting to report our natural gas and oil operations. Under this method, we capitalize the cost to acquire, explore for, and develop natural gas and oil properties. Under full cost accounting rules, the net capitalized costs of proved natural gas and oil properties may not exceed a “ceiling limit,” which is based upon the present value of estimated future net cash flows from proved reserves, discounted at 10%. If net capitalized costs of proved natural gas and oil properties exceed the ceiling limit, we must charge the amount of the excess to earnings. This is called a “ceiling test write-down.” Under the accounting rules, we are required to perform a ceiling test each quarter. A ceiling test write-down would not impact cash flow from operating activities, but it would reduce our stockholders’ equity. See “Management’s Discussion and Analysis of Financial Condition and Results of Operations—Critical Accounting Policies, Estimates, Judgments, and Assumptions—Full Cost Method of Accounting,” for further detail.
Investments in unproved properties, including capitalized interest costs, are also assessed periodically to ascertain whether impairment has occurred. Unproved properties whose costs are individually significant are assessed individually by considering the primary lease terms of the properties, the holding period of the properties, and geographic and geologic data relating to the properties. The amount of impairment assessed, if any, is added to the costs to be amortized in the appropriate full cost pool. If an impairment of unproved properties results in a reclassification to proved natural gas reserves, the amount by which the ceiling limit exceeds the capitalized costs of proved natural gas reserves would be reduced.
We also assess the carrying amount of goodwill in the fourth quarter of each year and at other periods when events occur that may indicate an impairment exists. These events include, for example, a significant decline in natural gas prices.
The risk that we will be required to write-down the carrying value of our natural gas and oil properties, our unproved properties, or goodwill increases when natural gas and oil prices are low. In addition, write-downs may occur if we experience substantial downward adjustments to our estimated proved reserves or our unproved property values, or if estimated future development costs increase. For example, we recorded (i) a non-cash ceiling test write-down of approximately $16.1 million in 2009 and (ii) a non-cash ceiling test write-down of approximately $7.3 million for the quarter ended March 31, 2011. These write-downs are reflected as a charge to net earnings. Additional write-downs of our full cost pool may be required if natural gas prices decline further, unproved property values decrease, estimated proved reserve volumes are revised downward or costs incurred in exploration, development, or acquisition activities in our full cost pool exceed the discounted future net cash flows from the additional reserves, if any, attributable to our cost pool.
Our exploration, development and exploitation projects require substantial capital expenditures. We may be unable to obtain required capital or financing on satisfactory terms, which could lead to a decline in our reserves.
The natural gas and oil industry is capital intensive. We make and expect to continue to make substantial capital expenditures for the development, exploitation, production and acquisition of natural gas and oil reserves. Cash flow used in investing activities related to capital and exploration expenditures was approximately $4.9 million and $3.8 million in 2010 and 2009, respectively.
The Company anticipates its budget for exploration and completion work on existing acreage will range between $6 million and $8 million for all of 2011. As we recognized an operating loss of approximately $648,000 for the year ended December 31, 2010 (approximately $1.3 million excluding $692,000 of hedging gains), our planned exploration and development drilling and completion activities may be limited or delayed if cash flow from producing activities or funds available from our credit facility are not sufficient to fund the anticipated level of capital expenditures.
We intend to finance future capital expenditures, to the extent that is prudent, through cash flow from operations, and significantly from borrowings under our bank credit facility. However, our financing needs may exceed those resources, and thus require a substantial increase in capitalization through the issuance of debt or equity securities or sale or joint venturing of selected assets. The issuance of additional indebtedness may require that a portion of operating cash flow be used to service the debt, thereby reducing the amount of cash flow available for other purposes. The actual amount and timing of future capital expenditures may differ materially from estimates as a result of, among other things, availability of personnel, commodity prices, actual drilling results, the availability of drilling rigs and other services, materials and equipment, and regulatory, technological and competitive developments. A reduction in commodity prices from current levels may result in a decrease in our actual capital expenditures. Conversely, a significant improvement in product prices could result in an increase in our capital expenditures.
Our cash flow from operations and access to capital are subject to a number of variables, primarily proved reserves, production volumes and prices, and the ability of our bank to lend.
Adverse events or trends related to these factors could reduce our ability to achieve or obtain the cash flow from operations, debt and/or equity capital necessary to sustain operations at current levels. Our Company, like the majority of smaller and mid-size independent oil and gas exploration companies, must continue acquiring and
exploiting properties to replace depleting reserves, and the budget for these activities often will not be fully funded by operating cash flow. Accordingly, the inability to access outside capital could result in a curtailment of operations relating to the development of our properties, which in turn could lead to a decline in reserves and adversely affect the business, and our financial condition and results of operations.
Distressed economic conditions also may adversely affect the collectability of trade receivables. For example, our accounts receivable are primarily from purchasers of our natural gas production and other exploration and production companies that own working interests in the properties that we operate. This industry concentration could adversely impact our overall credit risk, because customers and working interest owners may be similarly affected by the same adverse changes. In addition, the possibility of a renewed credit crisis and turmoil in financial markets could cause our commodity derivative instruments to be ineffective because a counterparty might be unable to perform its obligations or even seek bankruptcy protection.
Due to these factors, we cannot be certain that funding, if needed, will be available to the extent required, or on acceptable terms. If we are unable to access funding when needed on acceptable terms, we may not be able to fully implement our business plans, complete new property acquisitions to replace reserves, take advantage of business opportunities, respond to competitive pressures, or refinance debt obligations as they come due, any of which could have a material adverse effect on operations and financial results.
Our identified drilling locations are scheduled out over many years, making them susceptible to uncertainties that could materially alter the occurrence or timing of their drilling. In addition, we may not be able to raise the substantial amount of capital that would be necessary to drill a substantial portion of our potential drilling locations.
We have approximately 3,000 potential drilling locations. Our management team has specifically identified and scheduled certain drilling locations as an estimation of future multi-year drilling activities on existing acreage. These locations represent a significant part of our growth strategy. Our ability to drill and develop these locations depends on a number of uncertainties, including natural gas and oil prices, the availability and cost of capital, availability of qualified personnel, drilling and production costs, availability of drilling services and equipment, drilling results, lease expirations, gathering systems and pipeline transportation constraints, regulatory approvals and other factors. Accordingly, we cannot predict when or if the identified drilling locations will be drilled.
We could lose our undeveloped mineral leases if we don’t drill and complete wells in a timely manner.
Leased mineral properties give the holder the right to drill and complete wells in a timely manner. Leases have a contract term that is negotiated with the mineral owners. Generally, if a well is drilled and completed (thus “held by production”), the lease term continues so long as there is production from the well.
However, a sizeable portion of our acreage is currently undeveloped, and certain of our undeveloped leasehold acreage is subject to leases that will expire over the next several years. Renewing leases on undrilled acreage may not be feasible due to increased cost or other reasons. If we are unable to renew leases on undrilled acreage, we would have to write off the initial acquisition cost of such acreage, which could be substantial and our reserve estimates and the financial information related thereto may be found to be inaccurate which could have a material adverse effect on us.
Some of these leases will only allow us to hold a portion of the lease even after one or more wells have been completed. As is customary in the natural gas and oil industry, Company management continually prioritizes the timing of all of drilling locations against drilling and completion costs, available capital, expected returns on capital (net of debt taken on for drilling and completion work), and lease expirations.
Unless we replace our reserves, our reserves and production will decline, which would adversely affect our future cash flows and results of operations.
Producing natural gas reservoirs generally are characterized by declining production rates that vary depending upon reservoir characteristics and other factors. As a result, we must locate, acquire and develop new reserves to replace those being depleted by production. We must do this even during periods of low prices when it is difficult to raise
capital. Unless we conduct successful ongoing exploration, development and exploitation activities or continually acquire properties containing proved reserves, our proved reserves will decline as those reserves are produced. Our future natural gas and oil reserves and production, and therefore our future cash flow and results of operations, are highly dependent on our success in efficiently developing and exploiting our current reserves and economically finding or acquiring additional recoverable reserves. We may not be able to develop, exploit, find or acquire sufficient additional reserves to replace our current and future production. If we are unable to replace our current and future production, the value of our reserves will decrease, and our business, financial condition and results of operations will be adversely affected.
Drilling for and producing natural gas and oil are high risk activities with many uncertainties that could adversely affect our business, financial condition and results of operations.
Our future financial condition and results of operations will depend on the success of our exploitation, exploration, development and production activities. Exploration, exploitation, development and production are subject to numerous risks beyond our control, including the risk that drilling will not result in commercially viable natural gas or oil production. The Company’s decisions to purchase, explore, develop or otherwise exploit prospects or properties will depend in part on the evaluation of data obtained through geophysical and geological analyses, production data and engineering studies, the results of which are often inconclusive or subject to varying interpretations. For a discussion of the uncertainty involved in these processes See the Risk Factor “Reserve estimates depend on many assumptions that may turn out to be inaccurate. Any material inaccuracies in these reserve estimates or underlying assumptions will materially affect the quantities and present value of our reserves.” In addition, drilling and completion costs always are subject to change before the work is finished. Further, many factors may curtail, delay or cancel scheduled drilling projects, including:
· delays imposed by or resulting from compliance with regulatory requirements;
· pressure or irregularities in geological formations;
· shortages of or delays in obtaining equipment, materials and qualified personnel;
· equipment failures or accidents;
· adverse weather;
· declines in commodity prices;
· limited availability of financing at acceptable rates;
· title problems; and
· limitations in getting production to market due to transportation issues (see the Risk Factor entitled “Our business depends on gathering and transportation facilities owned by others. Any limitation in the availability of those facilities would interfere with our ability to market the natural gas we produce.”)
As part of our ongoing operations, we sometimes drill in new or emerging plays. As a result, drilling in these areas is subject to greater risk and uncertainty.
We have an operations group that is responsible for identifying new or emerging plays. These activities are more uncertain as to ultimate profitability than drilling in areas that are developed and have established production, because of little or sometimes no past drilling results by third parties to guide lease acquisition and drilling work. We cannot assure you that our future drilling activities in emerging plays will be successful or, if successful, will achieve the potential resource levels that we currently anticipate based on the drilling activities that have been completed, or that we will achieve the anticipated economic returns based on our current cost models.
Increasing costs could impact operating results.
Areas throughout the United States, including the Appalachian and Illinois Basins, are experiencing steadily rising costs for drilling and completion rigs, pipe, cement, electrical power, and other goods and services. Over time, a failure of commodity prices to keep pace with the cost creep environment could adversely affect cash flow.
We may suffer losses or incur liability for events for which we or the operator of a property have chosen not to obtain insurance.
Operations are subject to hazards and risks inherent in drilling, producing and transporting production, such as fires, natural disasters, explosions, pipeline ruptures, spills, and acts of terrorism, all of which can result in the loss of hydrocarbons, environmental pollution, personal injury claims and other property damage. We maintain insurance coverage against some, but not all, potential losses. Pollution and environmental risks generally are not fully insurable. Existing insurance coverage may not be renewed. The occurrence of an event that is not covered, or not fully covered, by insurance could have a material adverse effect on our business, financial condition and results of operations.
Future use of hedging arrangements could result in financial losses or reduce income.
We may engage in hedging arrangements for a significant part of production to reduce exposure to price fluctuations in commodity prices. These arrangements would expose the Company to risk of financial loss in some circumstances, including when production is less than expected, the counterparty to the hedging contract defaults on its contract obligations, or there is a change in the expected differential between the underlying price in the hedging agreement and the actual price received. In addition, these hedging arrangements may limit the benefits we would otherwise receive from increased commodity prices.
The use of derivatives may, in some cases, require the posting of cash collateral with counterparties. If we enter into derivative instruments that require cash collateral and commodity prices or interest rates change in a manner adverse to us, our cash otherwise available for use in our operations would be reduced which could limit our ability to make future capital expenditures and to make payments on our indebtedness, which could also limit our ability to borrow funds. Future collateral requirements will depend on arrangements with our counterparties, highly volatile natural gas prices and interest rates.
As of December 31, 2010, receivables from our derivatives counterparty were approximately $171,000 ($112,000 at June 30, 2011). Any default by this counterparty on its obligations to us would have a material adverse effect on the Company’s financial condition and results of operations.
Our business depends on gathering and transportation facilities owned by others. Any limitation in the availability of those facilities would interfere with our ability to market the natural gas we produce.
The marketability of our natural gas production depends in part on the availability, proximity and capacity of gathering and pipeline systems owned by third parties. The amount of natural gas that can be produced and sold is subject to curtailment in certain circumstances, such as pipeline interruptions due to scheduled and unscheduled maintenance, excessive pressure, physical damage to the gathering or transportation system, or lack of contracted capacity on such systems. The curtailments arising from these and similar circumstances may last from a few days to several months. We may be provided with only minimal, if any, notice as to when these circumstances will arise, or their duration. In addition, future properties may be acquired which are not currently serviced by gathering and transportation pipelines, or the gathering and transportation pipelines in the area may not have sufficient capacity to transport the additional production. As a result, we may not be able to sell production from these wells until the necessary systems are built.
We may incur losses as a result of title deficiencies.
We typically do not retain attorneys to examine title before acquiring leases or mineral interests. Prior to drilling a well, however, we (or the company that is the operator) obtain a preliminary title review to initially determine that no obvious title deficiencies are anticipated. As a result of some such examinations, certain curative work must be done to correct deficiencies in title, and such curative work may be expensive. In some instances, curative work may not be feasible or possible, and the interest is demonstrated to have been bought in error from someone who is not the owner. In that event, our interest would be worthless.
In addition, the Company’s reserve estimates assume that we have proper title for the properties we have acquired. Therefore, in the event we are unable to perform curative work to correct deficiencies and our interest is deemed to be worthless, our reserve estimates and the financial information related thereto may be found to be inaccurate, which could have a material adverse effect on us.
We are subject to complex federal, state, local and other laws and regulations that could adversely affect the cost, manner or feasibility of conducting our operations or expose us to significant liabilities.
Our exploration, production and transportation operations are subject to complex and stringent laws and regulations. In order to conduct our operations in compliance with these laws and regulations, we must obtain and maintain numerous permits, approvals and certificates from various federal, state and local governmental authorities. We may incur substantial costs in order to maintain compliance with these existing laws and regulations. In addition, our costs of compliance may increase if existing laws and regulations are revised or reinterpreted, or if new laws and regulations become applicable to our operations. Such costs could have a material adverse effect on our business, financial condition and results of operations.
Our business is subject to federal, state and local laws and regulations as interpreted and enforced by governmental authorities possessing jurisdiction over various aspects of the exploration for, and the production and transportation of, natural gas and oil. Failure to comply with such laws and regulations, including any evolving interpretation and enforcement by governmental authorities, could have a material adverse effect on our business, financial condition and results of operations.
Changes to existing or new regulations may unfavorably impact the Company, could result in increased operating costs, and could have a material adverse effect on our financial condition and results of operations. For example, Congress is currently considering legislation that, if adopted in its proposed form, would subject companies involved in natural gas and oil exploration and production activities to, among other items, additional regulation of and restrictions on hydraulic fracturing of wells, the elimination of certain U.S. federal tax incentives and deductions available for such activities, and the prohibition or additional regulation of private energy commodity derivative and hedging activities. These and other potential regulations, particularly at the local level, could increase our operating costs, reduce our liquidity, delay or halt our operations or otherwise alter the way we conduct our business, which could in turn have a material adverse effect on our financial condition, results of operations and cash flows.
Operations may be exposed to significant delays, costs and liabilities as a result of environmental, health and safety requirements applicable to our business activities.
We may incur significant delays, costs and liabilities as a result of environmental, health and safety requirements applicable to our exploration, development and production activities. These delays, costs and liabilities could arise under a wide range of federal, state and local laws and regulations relating to protection of the environment, health and safety, including regulations and enforcement policies that have tended to become increasingly strict over time. Failure to comply with these laws and regulations may result in the assessment of administrative, civil and criminal penalties, imposition of cleanup and site restoration costs and liens, and, in some instances, issuance of orders or injunctions limiting or requiring discontinuation of certain operations. We are often required to prepare and present to federal, state or local authorities data pertaining to the effect or impact that a proposed project may have on the environment, threatened and endangered species, and cultural and archaeological artifacts. The public may comment on and otherwise engage in the permitting process, including through judicial intervention. As a result, the permits we need may not be issued, or if issued, may not be issued in a timely manner or may impose requirements that restrict our ability to conduct operations.
In addition, claims for damages to persons or property, including natural resources, may result from the environmental, health and safety impacts of our operations. Strict liability and joint and several liability may be imposed under certain environmental laws, which could cause us to become liable for the conduct of others or for consequences of our own actions that were in compliance with all applicable laws at the time those actions were taken.
New laws, regulations or enforcement policies could be more stringent and impose unforeseen liabilities or significantly increase compliance costs. If we are not able to recover the resulting costs through insurance or increased revenues, our business, financial condition or results of operations could be adversely affected.
The adoption of climate change legislation or regulations restricting emissions of “greenhouse gases” could result in increased operating costs and reduced demand for the natural gas and oil we produce.
The U.S. Congress has considered legislation to mandate reductions of greenhouse gas emissions and certain states have already implemented, or may be in the process of implementing, similar legislation. Additionally, the U.S. Supreme Court has held in its decisions that carbon dioxide can be regulated as an “air pollutant” under the Clean Air Act, which could result in future regulations even if the U.S. Congress does not adopt new legislation regarding emissions. At this time, it is not possible to predict how legislation or new federal or state government mandates regarding the emission of greenhouse gases could impact our business; however, any such future laws or regulations could require us or our customers to devote potentially material amounts of capital or other resources in order to comply with such regulations. These expenditures could have a material adverse impact on our financial condition, results of operations, or cash flows.
Even though such legislation has not yet been adopted at the national level, nearly one-half of the states have begun taking actions to control and/or reduce emissions of greenhouse gases. Although most of the state-level initiatives have to date been focused on large sources of greenhouse gas emissions, such as coal-fired electric power plants, it is possible that smaller sources of emissions could become subject to greenhouse gas emission limitations or allowance purchase requirements in the future. Any one of these climate change regulatory and legislative initiatives could have a material adverse effect on our business, financial condition and results of operations.
Federal and state legislation and regulatory initiatives relating to hydraulic fracturing could result in increased costs and additional operating restrictions or delays.
In June 2009, legislation was introduced in both the House and Senate to amend the federal Safe Drinking Water Act to require the disclosure of chemicals used by the natural gas industry in the hydraulic fracturing process. Hydraulic fracturing involves the injection of water, sand and chemicals under pressure into rock formations to stimulate natural gas production. Sponsors of bills have asserted that chemicals used in the fracturing process could adversely affect drinking water supplies. The proposed legislation would require the reporting and public disclosure of chemicals used in the fracturing process, which could make it easier for third parties opposing the hydraulic fracturing process to initiate legal proceedings based on allegations that specific chemicals used in the fracturing process could adversely affect groundwater. Both bills are still in committee.
Separately, the EPA has commenced the process of studying the possible relationship between hydraulic fracturing and drinking water, the initial results of which the EPA expects in late 2012. To receive input on development of the draft study plan, the EPA held public meetings in four locations across the country in July and September 2010, which attracted hundreds of protestors. Also in September 2010, the EPA issued voluntary information requests to nine of the leading national and regional hydraulic fracturing service providers. Although eight of the nine hydraulic fracturing companies agreed to voluntarily compile and submit the information requested by the EPA, one company refused and the EPA issued a subpoena. Because of heightened public awareness and concern related to hydraulic fracturing, additional federal regulation by the EPA, Congress, or both is likely in the coming years. If adopted, such rules could lead to operational delays or increased operating costs and could result in additional regulatory burdens that would make it more difficult to perform hydraulic fracturing and increase our costs of compliance and doing business.
The adoption of derivatives legislation by Congress could have an adverse impact on our ability to hedge risks associated with our business.
The recently enacted Dodd-Frank Wall Street Reform and Consumer Protection Act (the “Dodd-Frank Act”) is comprehensive financial reform legislation that establishes federal oversight and regulation of the over-the-counter derivatives market and entities that participate in that market. The Dodd-Frank Act requires the Commodity Futures Trading Commission (“CFTC”) and the SEC to promulgate rules and regulations implementing certain portions of it by mid-July 2011 (which have in part been delayed). The CFTC has also proposed regulations to set position limits for certain futures and option contracts in the major energy markets, although it is not possible at this time to predict whether or when the CFTC will adopt similar rules or include comparable provisions in its rulemaking under the new legislation. The financial reform legislation may require us to comply with margin requirements and with certain clearing and trade-execution requirements, although the application of those provisions to us is uncertain at this time. The financial reform legislation may also require the counterparties to our derivative contracts to spin off some of their derivatives contracts to a separate entity, which may not be as creditworthy as the current counterparty. The Dodd-Frank Act and any new regulations could significantly increase the cost of derivative
contracts (including through requirements to post collateral), materially alter the terms of derivative contracts, reduce the availability of derivatives to protect against risks we encounter, reduce our ability to monetize or restructure our existing derivative contracts, and increase our exposure to less creditworthy counterparties. If we reduce our use of derivatives as a result of the legislation and regulations, our results of operations may become more volatile and our cash flows may be less predictable, which could adversely affect our ability to plan for and fund capital expenditures. Finally, the Dodd-Frank Act was intended, in part, to reduce the volatility of oil and natural gas prices, which some legislators attributed to speculative trading in derivatives and commodity contracts related to oil and natural gas. Our revenues could therefore be adversely affected if a consequence of the legislation and regulations is to lower the commodity prices we realize. Any of these consequences could have a material adverse effect on us, our financial condition, and our results of operations.
Any laws or regulations that subject us to additional capital or margin requirements relating to, or to additional restrictions on, our trading and commodity positions could have an adverse effect on our ability to hedge risks associated with our business or on the cost of our hedging activity.
Competition in the natural gas and oil industry is intense, making it more difficult for us to acquire properties, market natural gas and oil and secure trained personnel.
Our ability to acquire additional prospects and to find and develop reserves in the future will depend on our ability to evaluate and select suitable properties and to consummate transactions in a highly competitive environment for acquiring properties, marketing our production and securing trained personnel. Also, there is substantial competition for investment capital in the industry. Many of our competitors possess and employ financial, technical and personnel resources substantially greater than ours. Those companies may be able to pay more for productive properties and exploratory prospects and to evaluate, bid for and purchase a greater number of properties and prospects than our financial or personnel resources permit. In addition, other companies may be able to offer better compensation packages to attract and retain qualified personnel than we are able to offer. The cost to attract and retain qualified personnel has increased over the past few years due to competition and may increase substantially in the future. We may not be able to compete successfully in the future in acquiring prospective reserves, developing reserves, marketing hydrocarbons, attracting and retaining quality personnel and raising additional capital, which could have a material adverse effect on our business, financial condition and results of operations.
The unavailability or high cost of drilling rigs, equipment, supplies, personnel and field services could adversely affect our ability to execute our exploration and development plans within our budget and on a timely basis.
The demand for qualified and experienced field personnel to drill wells and conduct field operations, geologists, geophysicists, engineers and other professionals in the industry can fluctuate significantly, often in correlation with natural gas and oil prices, causing periodic shortages. Historically, there have been shortages of qualified personnel, drilling and workover rigs, pipe and other equipment and materials as demand for rigs and equipment has increased along with the number of wells being drilled. We cannot predict whether these conditions will exist in the future and, if so, what their timing and duration will be. Such shortages could delay or cause us to incur significant expenditures that are not provided for in our capital budget, which could have a material adverse effect on our business, financial condition or results of operations.
The loss of senior management or technical personnel could adversely affect operations.
We depend on the services of our senior management and technical personnel. The loss of the services of our senior management or technical personnel, including Patrick McDonald, our Chairman, President and Chief Executive Officer, and Kevin Struzeski, our Chief Financial Officer, Treasurer and Secretary, could have a material adverse effect on our operations. We do not maintain, nor do we plan to obtain, any insurance against the loss of any of these individuals.
Our senior management and administrative staff also provide services to Nytis Exploration Company, a corporation separate from the Company and its subsidiaries. The time that such personnel devote to the other company will impact the time each will have to devote to the Company and could adversely affect operations.
Prior to the closing of the Merger, all of the persons providing services to Nytis USA were employees of Nytis Exploration Company, a company that is separate from the Company and its subsidiaries. Effective July 1, 2011, these persons now serve as the the administrative staff and senior management of the Company. However, the Company allows these persons, including Mr. McDonald (CEO) and Mr. Struzeski (CFO), to continue to provide services to Nytis Exploration Company. The Company is paid a flat fee equal to $15,000 per month for all services performed for Nytis Exploration Company, and to the extent the Company incurs out of pocket costs and expenses to third parties in connection with providing such services to Nytis Exploration Company, such costs and expenses are reimbursed by Nytis Exploration Company to the Company.
As a consequence of this arrangement, the time that the Company’s administrative staff and senior management spend on and such persons’ obligations with respect to matters other than Company matters could adversely affect the operations of the Company.
The Company has limited control over activities on properties we do not operate, which could reduce our production and revenues.
A portion of our business is conducted through joint operating agreements under which we own partial interests in oil and gas properties. If we do not operate the properties in which we own an interest, we do not have control over normal operating procedures, expenditures or future development of the underlying properties. The failure of an operator of our wells to adequately perform operations or an operator’s breach of the applicable agreements could reduce our production and revenues. The success and timing of our drilling and development activities on properties operated by others, therefore, depends upon a number of factors outside of our control, including the operator’s timing and amount of capital expenditures, expertise and financial resources, inclusion of other participants in drilling wells and use of technology. Because we do not have a majority interest in most wells that we do not operate, we may not be in a position to remove the operator in the event of poor performance.
We may be subject to risks in connection with acquisitions of properties.
The successful acquisition of producing properties requires an assessment of several factors, including:
· recoverable reserves;
· future commodity prices and their applicable differentials;
· operating costs; and
· potential environmental and other liabilities.
The accuracy of these assessments is inherently uncertain. In connection with these assessments, we perform a review of the subject properties that we believe to be generally consistent with industry practices. Our review will not reveal all existing or potential problems nor will it permit us to become sufficiently familiar with the properties to fully assess their deficiencies and capabilities. Inspections may not always be performed on every well, and environmental problems are not necessarily observable even with inspections. Additionally, when problems are identified, the seller may be unwilling or unable to provide effective contractual protection against all or part of the problems. We often are not entitled to contractual indemnification for environmental liabilities and acquire properties on an “as is” basis.
We may be unable to make attractive acquisitions or successfully integrate acquired businesses, and any inability to do so may disrupt our business and hinder our ability to grow.
In the future we may make acquisitions of businesses that complement or expand our current business. We may not be able to identify attractive acquisition opportunities. Even if we do identify attractive acquisition opportunities, we may not be able to complete the acquisition or do so on commercially acceptable terms.
The success of any completed acquisition will depend on our ability to integrate effectively the acquired business into our existing operations. The process of integrating acquired businesses may involve unforeseen difficulties and may require a disproportionate amount of our managerial and financial resources. In addition, possible future acquisitions may be larger and for purchase prices significantly higher than those paid for earlier acquisitions. No assurance can be given that we will be able to identify additional suitable acquisition opportunities, negotiate
acceptable terms, obtain financing for acquisitions on acceptable terms or successfully acquire identified targets. Our failure to achieve consolidation savings, to integrate the acquired businesses and assets into our existing operations successfully, or to minimize any unforeseen operational difficulties could have a material adverse effect on the business, financial condition and results of operations.
We may incur more taxes and certain of our projects may become uneconomic if certain federal income tax deductions currently available with respect to natural gas and oil exploration and development are eliminated as a result of future legislation.
The passage of any legislation as a result of the budget proposal, the Senate bill or any other similar change in U.S. federal income tax law could eliminate certain tax deductions that are currently available with respect to natural gas and oil exploration and development. Any such change could negatively impact our financial condition and results of operations by increasing the costs we incur which would in turn make it uneconomic to drill some prospects if commodity prices are not sufficiently high, resulting in lower revenues and decreases in production and reserves.
Risks Related to the Ownership of our Common Stock
We have incurred and will continue to incur increased costs and demands upon management and accounting and finance resources as a result of complying with the laws and regulations affecting public companies; any failure to establish and maintain adequate internal control over financial reporting or to recruit, train and retain necessary accounting and finance personnel could have an adverse effect on our ability to accurately and timely prepare our consolidated financial statements.
As a public operating company, we incur significant administrative, legal, accounting and other burdens and expenses beyond those of a private company, including those associated with corporate governance requirements and public company reporting obligations. In particular, we have had to and will continue to expend resources to supplement our internal accounting and financial resources to obtain technical and public company training and expertise, as well as refine our quarterly and annual financial statement closing process, to enable us to satisfy such reporting obligations. However, even if we are successful in doing so, there can be no assurance that our finance and accounting organization will be able to adequately meet the increased demands that result from being a public company.
Our management team must comply with various requirements of being a public company. We have devoted, and will continue to devote, significant resources to address these public company-associated requirements, including compliance programs and investor relations, as well as our financial reporting obligations. Complying with these rules and regulations has and will substantially increase our legal and financial compliance costs and make some activities more time-consuming and costly.
An active, liquid and orderly trading market for our common stock may not develop, and the price of our stock may be volatile and may decline in value.
There currently is not an active public market for our common stock. An active trading market may not develop or, if developed, may not be sustained. The lack of an active market may impair your ability to sell your shares of common stock at the time you wish to sell them or at a price that you consider reasonable. An inactive market may also impair our ability to raise capital by selling shares of common stock and may impair our ability to acquire other companies or assets by using shares of our common stock as consideration.
Our common stock may not be eligible for listing on a national securities exchange.
Our common stock is not currently listed on a national securities exchange, and we do not currently meet the initial quantitative listing standards of a national securities exchange. We cannot assure you that we will be able to meet the initial listing standards of any national securities exchange, or, if we do meet such initial qualitative listing standards, that we will be able to maintain any such listing. Until our common stock is listed on a national securities exchange, we expect that it will continue to be eligible and quoted on the OTC Bulletin Board. In those venues, however, an investor may find it difficult to obtain accurate quotations as to the market value of our common stock. In addition, if we fail to meet the criteria set forth in SEC regulations, various requirements would be imposed by
law on broker-dealers who sell our securities to persons other than established customers and accredited investors. Consequently, such regulations may deter broker-dealers from recommending or selling our common stock, which may further affect its liquidity. This would also make it more difficult for us to raise additional capital.
Our common stock may be considered a “penny stock.”
The SEC has adopted regulations which generally define “penny stock” to be an equity security that has a market price of less than $5.00 per share, subject to specific exemptions. The market price of our common stock may be less than $5.00 per share and therefore may be a “penny stock.” Broker and dealers effecting transactions in “penny stock” must disclose certain information concerning the transaction, obtain a written agreement from the purchaser and determine that the purchaser is reasonably suitable to purchase the securities. These rules may restrict the ability of brokers or dealers to sell our common stock and may affect your ability to sell shares of our common stock in the future.
As a result of the registration of the shares covered by this prospectus, a significant number of shares of our common stock have become eligible for sale, which could depress the market price for our common stock. Future sales by us or our existing shareholders could similarly depress the market price of our common stock.
As a result of the registration of the shares covered by this prospectus, a significant number of shares of our common stock have become eligible for sale in the public market, which could cause the market price for our common stock to decline significantly. If we or our existing shareholders sell a large number of shares of our common stock, or if we sell additional securities that are convertible into common stock, in the future, the market price of our common stock similarly could decline. Further, even the perception in the public market that we or our existing shareholders might sell shares of common stock could depress the market price of our common stock.
Control of our stock by current stockholders is expected to remain significant.
Currently, our directors directly and indirectly beneficially own a majority of our outstanding common stock. As a result, these affiliates have the ability to exercise significant influence over matters submitted to our stockholders for approval, including the election and removal of directors, amendments to our certificate of incorporation and bylaws and the approval of any business combination. This concentration of ownership may also have the effect of delaying or preventing a change of control of our company or discouraging others from making tender offers for our shares, which could prevent our stockholders from receiving a premium for their shares.
It is not likely that we will pay dividends.
We currently intend to retain our future earnings to support operations and to finance expansion and, therefore, we do not anticipate paying any cash dividends to holders of our common stock in the foreseeable future.
Terms of subsequent financings may adversely impact your investment.
We may have to raise additional equity or debt in the future. In that event, your rights and the value of your investment in the common stock could be reduced. For example, if we issue debt securities, the holders of the debt would have a claim to our assets that would be prior to the rights of shareholders until the debt is paid. Interest on these debt securities would increase costs and could negatively impact operating results.
Additionally, the borrowing base under our secured lending facility presently is $20 million (subject to increase depending on additions to reserves, and other factors), and all borrowings under the facility are secured by our oil and natural gas assets. Borrowings outside the facility may have to be unsecured, and accordingly, such borrowings, if obtainable, would have a higher interest rate, which would increase debt service and more negatively impact operating results.
Preferred stock could be issued in series from time to time with such designations, rights, preferences, and limitations as needed to raise capital. The terms of preferred stock will be determined by our Board of Directors and could be more advantageous to those investors than to the holders of common stock. In addition, if we need to raise
more equity capital from sale of common stock, institutional or other investors may negotiate terms at least and possibly more favorable than the terms of this Offering.
The Company’s Certificate of Incorporation does not provide shareholders the pre-emptive right to buy shares from the Company. As a result, you will not have the automatic ability to avoid dilution in your percentage ownership of the company.
This prospectus relates to the sale or other disposition of shares of our common stock by the selling securityholders listed under “Selling Securityholders” and their transferees. We will not receive any proceeds from any sale of the shares by the selling securityholders.
We are registering for resale or other disposition by the selling securityholders named herein or their transferees an aggregate of 44,444,444 shares of our common stock.
On June 29, 2011, we entered into the Private Placement Purchase Agreement with 23 accredited investors, pursuant to which we issued to the investors an aggregate of 44,444,444 common shares. An additional 22,222,222 common shares were issued to Yorktown Energy Partners IX, L.P. upon the automatic conversion of the 100 shares of Series A Convertible Preferred Stock which occurred on July 18, 2011, but these shares of common stock are not, and will not be, included in the 44,444,444 common shares covered by this Resale Registration Statement.
The following table sets forth, as of July 31, 2011, (i) the number of shares of our common stock beneficially owned by each selling securityholder named below, (ii) the number of shares of our common stock that may be sold or otherwise disposed of by each of the selling securityholders named below pursuant to this prospectus, and (iii) the number of shares of our common stock, and the percent of the class, beneficially owned by each selling securityholder named below assuming all of the shares registered hereby are sold by the selling securityholders
As of July 31, 2011, 114,185,405 shares of our common stock were issued and outstanding.
Information in the table below, and under the heading “Material Relationship with Selling Securityholders,” has been provided to us by the selling securityholders. We do not know when or in what amounts the selling securityholders may sell or otherwise dispose of the shares of our common stock covered hereby. The selling securityholders may sell or otherwise dispose of all, some or none of the shares offered by this prospectus. Because the selling securityholders may sell or otherwise dispose of all, some, or none of the shares covered hereby, we cannot estimate the number of the shares that will be sold or otherwise disposed of by the selling securityholders pursuant to this prospectus. Accordingly, for purposes of this prospectus, we have assumed that all of the shares covered by this prospectus will be sold by the selling securityholders.
Information about the selling securityholders may change over time, and changed information will be set forth in supplements to this prospectus if and when required.
|
Name |
|
Number of Shares of |
|
Number of |
|
Number of |
|
|
MFP Partners, L.P. (3) |
|
4,222,222 |
|
4,222,222 |
|
— |
|
|
Lusman Partners, LP (4) |
|
2,944,444 |
|
2,944,444 |
|
— |
|
|
Lusman Master Fund, Ltd. (4) |
|
1,500,000 |
|
1,500,000 |
|
— |
|
|
Berl Eckstein |
|
222,222 |
|
222,222 |
|
— |
|
|
Arbiter Partners QP, LP (5) |
|
8,888,889 |
|
8,888,889 |
|
— |
|
|
Isaac Brothers LLC (5) |
|
2,222,222 |
|
2,222,222 |
|
— |
|
|
75 Prospect Partners LLC (5) |
|
1,955,556 |
|
1,955,556 |
|
— |
|
|
Marjorie F. Dornette |
|
88,889 |
|
88,889 |
|
— |
|
|
Anna C. Dornette |
|
88,889 |
|
88,889 |
|
— |
|
|
David P. Dornette |
|
88,889 |
|
88,889 |
|
— |
|
|
Morris Smith |
|
444,444 |
|
444,444 |
|
— |
|
|
Resolute Partners, L.P. (10) |
|
500,000 |
|
500,000 |
|
— |
|
|
Richard Shuster |
|
222,222 |
|
222,222 |
|
— |
|
|
Ralph Shuster, Inc. (6) |
|
333,334 |
|
333,334 |
|
— |
|
|
Edwin H. Morgens and Linda Morgens as JTWROS |
|
1,666,667 |
|
1,666,667 |
|
— |
|
|
Michael H. Weiss |
|
444,444 |
|
444,444 |
|
— |
|
|
Low Tide Partners LLC (10) |
|
444,444 |
|
444,444 |
|
— |
|
|
Special Situations Fund III QP, L.P. (7) |
|
7,555,556 |
|
7,555,556 |
|
— |
|
|
Special Situations Cayman Fund, L.P. (7) |
|
2,222,222 |
|
2,222,222 |
|
— |
|
|
Special Situations Private Equity Fund, L.P. (7) |
|
1,111,111 |
|
1,111,111 |
|
— |
|
|
Uncle Mills Partners (8) |
|
669,644 |
|
611,111 |
|
58,533 |
(> 1%) |
|
Wynnefield Small Cap Value Offshore Fund, Ltd. (9) |
|
1,559,556 |
|
1,559,556 |
|
— |
|
|
Wynnefield Partners Small Cap Value, LP (9) |
|
1,997,778 |
|
1,997,778 |
|
— |
|
|
Wynnefield Partners Small Cap Value, LP I (9) |
|
2,887,111 |
|
2,887,111 |
|
— |
|
|
John Fox |
|
222,222 |
|
222,222 |
|
— |
|
|
TOTAL |
|
44,502,977 |
|
44,444,444 |
|
58,533 |
|
(1) The beneficial ownership of the common stock by the selling stockholder set forth in the table is determined in accordance with Rule 13d-3 under the Securities Exchange Act of 1934, as amended, and the information is not necessarily indicative of beneficial ownership for any other purpose. Under such rule, beneficial ownership includes any shares as to which the selling stockholders has sole or shared voting power or investment power and also any shares, which the selling stockholders has the right to acquire within 60 days. Further, the inclusion of shares in the following table of those shares does not constitute an admission that the named selling securityholder is a direct or indirect beneficial owner of such shares.
(2) Assumes that all securities registered will be sold.
(3) Michael F Price is the managing partner and member of MFP Partners, L.P, and has voting and dispositive power over the shares held by MFP Partners, L.P.
(4) Lusman Capital Management, LLC has voting and dispositive power over the shares held by both Lusman Partners, LP and Lusman Master Fund, Ltd. Joel Lusman is the control person of Lusman Capital Management, LLC and is the individual with voting and dispositive power over the shares held by each of Lusman Partners, LP and Lusman Master Fund, Ltd.
(5) Paul J. Isaac is the (i) managing general partner of Arbiter Partners QP, LP; (ii) manager of Isaac Brothers LLC; and (iii) manager of 75 Prospect Partners LLC. Through his control of such entities Mr. Isaac has voting and dispositive power over the shares held by each of the entities named in this footnote.
(6) David Malkin is the President of Ralph Shuster, Inc. and holds voting and dispositive power over the shares held by the entity.
(7) MGP Advisers Limited Partnership (“MGP”) is the general partner of the Special Situations Fund III, QP, L.P. AWM Investment Company, Inc. (“AWM”) is the general partner of MGP, the general partner of and investment adviser to the Special Situations Cayman Fund, L.P. and the investment adviser to the Special Situations Fund III, QP, L.P. and the Special Situations Private Equity Fund, L.P. Austin W. Marxe and David M. Greenhouse are the principal owners of MGP and AWM. Through their control of MGP and AWM, Messrs. Marxe and Greenhouse share voting and investment control over the portfolio securities of each of the funds listed above.
(8) Walter Carucci is a partner of Uncle Mills Partners and is the individual with voting and dispositive power over the shares held by Uncle Mills Partners. Mr. Carucci has represented that he beneficially owns a total of 58,553 shares of Company common stock outside of his relationship with Uncle Mills Partners, and such shares are included in Uncle Mills Partners’ beneficial ownership above, but are not included in the column labeled “Number of Shares of Common Stock Offered Hereby”. Mr. Carucci has identified himself as the owner and control person of Carr Securities, a Broker/Dealer. Carr Securities served as the placement agent for the Private Placement closed on June 29, 2011. Uncle Mills Partners has represented to the Company that it purchased the shares of Company common stock that may be offered and sold pursuant to this prospectus on its own behalf in the ordinary course of business, and at the time of the purchase of the shares had no agreements or understandings, directly or indirectly, with any party to distribute the shares.
(9) Nelson Obus is the control person of each of Wynnefield Small Cap Value Offshore Fund, Ltd., Wynnefield Partners Small Cap Value, LP; and Wynnefield Partners Small Cap Value, LP I, and is the individual with voting and dispositive power over the shares held by each fund.
(10) After reasonable efforts to contact Resolute Partners, L.P. and Low Tide Partners, L.P. the Company was unable to confirm the natural persons who exercise voting and/or dispositive powers on behalf of those entities.
Material Relationship with Selling Securityholders
Except for Uncle Mills Partners (described in note 8 of the above Selling Securityholder Table) each of the selling securityholders has certified to us that such selling securityholder is not a broker-dealer and that such selling securityholder is either (a) not an affiliate of a broker-dealer or (b) is an affiliate of a broker-dealer, but acquired the shares being registered hereby for resale in the ordinary course of business, and at the time of such acquisition, such selling securityholder had no agreements or understandings, directly or indirectly, with any person to distribute such shares.
There are not and, since the closing of the Private Placement until the date of this prospectus there have not been at any time any, relationships between us and any selling securityholder, other than any relationships directly relating to such selling securityholder’s investment in securities issued in the Private Placement.
The selling securityholders, which as used herein includes donees, pledgees, transferees or other successors-in-interest selling shares of common stock or interests in shares of common stock received after the date of this prospectus from a selling stockholder as a gift, pledge, partnership distribution or other transfer, may, from time to time, sell, transfer or otherwise dispose of any or all of their shares of common stock or interests in shares of common stock on any stock exchange, market or trading facility on which the shares are traded or in private transactions. These dispositions may be at fixed prices, at prevailing market prices at the time of sale, at prices related to the prevailing market price, at varying prices determined at the time of sale, or at negotiated prices.
The selling securityholders may use any one or more of the following methods when disposing of shares or interests therein:
· ordinary brokerage transactions and transactions in which the broker-dealer solicits purchasers;
· block trades in which the broker-dealer will attempt to sell the shares as agent, but may position and resell a portion of the block as principal to facilitate the transaction;
· purchases by a broker-dealer as principal and resale by the broker-dealer for its account;
· an exchange distribution in accordance with the rules of the applicable exchange;
· privately negotiated transactions;
· short sales effected after the date the registration statement of which this prospectus is a part is declared effective by the SEC;
· through the writing or settlement of options or other hedging transactions, whether through an options exchange or otherwise;
· broker-dealers may agree with the selling securityholders to sell a specified number of such shares at a stipulated price per share;
· a combination of any such methods of sale; and
· any other method permitted by applicable law.
The selling securityholders may, from time to time, pledge or grant a security interest in some or all of the shares of common stock owned by them and, if they default in the performance of their secured obligations, the pledgees or secured parties may offer and sell the shares of common stock, from time to time, under this prospectus, or under an amendment to this prospectus under Rule 424(b)(3) or other applicable provision of the Securities Act amending the list of selling securityholders to include the pledgee, transferee or other successors in interest as selling securityholders under this prospectus. The selling securityholders also may transfer the shares of common stock in other circumstances, in which case the transferees, pledgees or other successors in interest will be the selling beneficial owners for purposes of this prospectus.
In connection with the sale of our common stock or interests therein, the selling securityholders may enter into hedging transactions with broker-dealers or other financial institutions, which may in turn engage in short sales of the common stock in the course of hedging the positions they assume. The selling securityholders may also sell shares of our common stock short and deliver these securities to close out their short positions, or loan or pledge the common stock to broker-dealers that in turn may sell these securities. The selling securityholders may also enter into option or other transactions with broker-dealers or other financial institutions or the creation of one or more derivative securities which require the delivery to such broker-dealer or other financial institution of shares offered
by this prospectus, which shares such broker-dealer or other financial institution may resell pursuant to this prospectus (as supplemented or amended to reflect such transaction).
The aggregate proceeds to the selling securityholders from the sale of the common stock offered by them will be the purchase price of the common stock less discounts or commissions, if any. Each of the selling securityholders reserves the right to accept and, together with their agents from time to time, to reject, in whole or in part, any proposed purchase of common stock to be made directly or through agents. We will not receive any of the proceeds from this offering.
The selling securityholders also may resell all or a portion of the shares in open market transactions in reliance upon Rule 144 under the Securities Act of 1933, provided that they meet the criteria and conform to the requirements of that rule.
The selling securityholders and any underwriters, broker-dealers or agents that participate in the sale of the common stock or interests therein may be “underwriters” within the meaning of Section 2(11) of the Securities Act. Any discounts, commissions, concessions or profit they earn on any resale of the shares may be underwriting discounts and commissions under the Securities Act. Selling securityholders who are “underwriters” within the meaning of Section 2(11) of the Securities Act will be subject to the prospectus delivery requirements of the Securities Act.
To the extent required, the shares of our common stock to be sold, the names of the selling securityholders, the respective purchase prices and public offering prices, the names of any agents, dealer or underwriter, any applicable commissions or discounts with respect to a particular offer will be set forth in an accompanying prospectus supplement or, if appropriate, a post-effective amendment to the registration statement that includes this prospectus.
In order to comply with the securities laws of some states, if applicable, the common stock may be sold in these jurisdictions only through registered or licensed brokers or dealers. In addition, in some states the common stock may not be sold unless it has been registered or qualified for sale or an exemption from registration or qualification requirements is available and is complied with.
We have advised the selling securityholders that the anti-manipulation rules of Regulation M under the Exchange Act may apply to sales of shares in the market and to the activities of the selling securityholders and their affiliates. In addition, to the extent applicable we will make copies of this prospectus (as it may be supplemented or amended from time to time) available to the selling securityholders for the purpose of satisfying the prospectus delivery requirements of the Securities Act. The selling securityholders may indemnify any broker-dealer that participates in transactions involving the sale of the shares against certain liabilities, including liabilities arising under the Securities Act.
We have agreed to indemnify the selling securityholders against liabilities, including liabilities under the Securities Act and state securities laws, relating to the registration of the shares offered by this prospectus.
We have agreed with the selling securityholders to keep the registration statement of which this prospectus constitutes a part effective until the earlier of (1) such time as all of the shares covered by this prospectus have been disposed of pursuant to and in accordance with the registration statement or (2) the date on which all of the shares may be sold without restriction pursuant to Rule 144 of the Securities Act.
Description of Our Common Stock
We are authorized to issue up to an aggregate of 200,000,000 shares of our common stock, par value $0.01 per share. As of July 31, 2011, an aggregate of 114,185,405 shares of our common stock were issued and outstanding. Our amended and restated certificate of incorporation, as amended, does not provide for cumulative voting. The holders of our common stock are entitled to receive ratably such dividends, if any, as may be declared by our board of directors out of legally available funds. However, the current policy of our board of directors is to retain earnings, if any, for our operations and expansion. Upon any liquidation, dissolution or winding-up of our company, the holders of our common stock are entitled to share ratably in all of our assets which are legally available for
distribution, after payment of or provision for all liabilities and the preferences of any then outstanding shares of preferred stock. The holders of our common stock have no preemptive, subscription, redemption or conversion rights. All issued and outstanding shares of our common stock are fully-paid and non-assessable.
Description of the Preferred Stock
We are authorized to issue up to an aggregate of 1,000,000 shares of preferred stock, par value $0.01 per share, in one or more series as may be determined by our board of directors, which may establish from time to time the number of shares to be included in such series, and fix the designations, powers, preferences and relative, participating, optional or other special rights, and qualifications, limitations, or restrictions thereof, including without limitation, the dividend rate, conversion rights, redemption price and liquidation preference thereof. As of July 31, 2011 we did not have any shares of preferred stock issued and outstanding. Any preferred stock established and designated by our board of directors may rank senior to our common stock with respect to the payment of dividends or amounts upon liquidation, dissolution or winding up of us, or both. The issuance of shares of preferred stock, the existence of unissued preferred stock, or the issuance of rights to purchase such shares of preferred stock, may have the effect of delaying or deterring an unsolicited merger or other change of control transaction.
In connection with the Private Placement, on June 16, 2011, we filed a Certificate of Designation with the Delaware Secretary of State and on June 27, 2011, we filed an Amended and Restated Certificate of Designation with the Delaware Secretary of State, which set forth the designation, preferences, relative rights, qualifications, limitations and restrictions of the Series A Convertible Preferred Stock issued in the Private Placement. On July 18, 2011, all 100 shares of our Series A Convertible Preferred Stock automatically converted into an aggregate of 22,222,222 shares of our common stock. Upon that conversion, all shares of our Series A Convertible Preferred Stock were cancelled, retired, and eliminated from the shares of Series A Convertible Preferred Stock that the Corporation was authorized to issue and become authorized but unissued shares of the Company’s preferred stock and may be reissued as part of a new series of the our preferred stock subject to the conditions and restriction on issuance set forth in any certificate of designation creating a series of preferred stock or any similar stock or as otherwise required by law.
Outstanding Warrants
There are three warrants outstanding that represent the right to purchase a total of 2,696,133 shares of our common stock. Two of these warrants are held by individuals who prior to the Merger were officers and directors of the Company. These two warrants represent the right to purchase an aggregate of 250,000 shares of our common stock at an exercise price of $1.00 per share and each expires on August 31, 2017.
The remaining warrant is held by McDonald Energy, LLC, a single member limited liability company owned by our Chairman, Chief Executive Officer and President, Patrick R. McDonald. This warrant represents the right to purchase 2,446,133 shares of our common stock at a purchase price of $0.8498 per share. It was issued by Nytis USA to McDonald Energy, LLC on May 19, 2005 and was assumed by the Company in connection with the Merger. In connection with the closing of the Merger, the number of shares and the exercise price of the Nytis USA warrant was adjusted in accordance with the exchange ratio pursuant to the Merger Agreement. This warrant expires on June 1, 2015.
Registration Rights
In connection with the Private Placement, we entered into a registration rights agreement with the investors in the Private Placement that requires us to file the registration statement of which this prospectus is a part, no later than August 13, 2011, and to have this registration statement declared effective by the SEC prior to the earlier of September 27, 2011 or five business days after the SEC has informed us that no review of this registration statement will be made or that the SEC has no further comments on this registration statement. Further, if this registration statement covers less than all of the 44,444,444 common stock shares issued in the Private Placement to the selling securityholders and if any one or less than all selling securityholders have sold all the shares covered by this registration statement, we will be required to file a second registration statement for the remaining shares, subject to any SEC restriction on our ability to do so.
We are required to keep each registration statement in effect until the earlier of (i) the date on which all the shares covered thereby have been sold or (ii) the date on which all such shares may be sold without restriction pursuant to Rule 144. If we fail to satisfy our obligations under the registration rights agreement, we may be required to pay liquidated damages equal to 1.5% of the purchase price for the common stock purchased by the investors in the Private Placement (or, in the circumstances under which we fail to timely file a second registration statement as described in the last sentence of the prior paragraph, 1.5% of the purchase price for the common stock to be included in such second registration statement), for each 30-day period or pro rata for any portion thereof during which such failure continues.
In addition, if we fail to file periodic reports with the SEC during specified time periods, we may be required to pay additional liquidated damages to affected holders.
Anti-Takeover Effects of our Amended and Restated Certificate of Incorporation, Bylaws and Delaware Law
We currently have authorized but unissued shares of our common stock which will be available for future issuance without any further vote or action by our stockholders. In addition, pursuant to the terms of our amended and restated certificate of incorporation, we are authorized to issue, without stockholder approval, up to an aggregate of 1,000,000 shares of preferred stock, par value $0.01 per share, in one or more series as may be determined by our board of directors, which may establish from time to time the number of shares to be included in such series, and fix the designations, powers, preferences and relative, participating, optional or other special rights, and qualifications, limitations, or restrictions thereof, including without limitation, the dividend rate, conversion rights, redemption price and liquidation preference thereof. Any preferred stock so established and designated by our board of directors may rank senior to our common stock with respect to the payment of dividends or amounts upon liquidation, dissolution or winding up of us, or both.
These shares of common stock and preferred stock may be utilized for a variety of corporate purposes, including future public offerings to raise additional capital, corporate acquisitions and employee benefit plans. The existence of authorized but unissued shares of our common stock and our preferred stock, and our ability to fix the designations, powers, preferences and rights of shares of our preferred stock, could render more difficult or discourage an attempt to obtain control over us by means of a proxy contest, tender offer or merger, or otherwise.
The validity of the shares of common stock offered hereby will be passed upon for us by our counsel, Welborn Sullivan Meck & Tooley, P.C.
The financial statements as of December 31, 2010 and 2009, and for each of the two years in the period ended December 31, 2010, included in this prospectus, have been audited by Ehrhardt Keefe Steiner & Hottman PC, an independent registered public accounting firm, as stated in their report appearing herein and elsewhere in the Registration Statement. Such financial statements have been so included in reliance upon the report of such firm given upon their authority as experts in accounting and auditing.
The audits, dated April 7, 2011, of our internally generated estimates, as of January 1, 2011, of the proved developed producing reserves of each of Interstate Natural Gas Company and Nytis LLC (collectively, the “Audit Reports”), included in this prospectus, were prepared by Cawley, Gillespie & Associaties, Inc., independent petroleum engineers, as stated in the Audit Reports. Such Audit Reports have been so included in reliance upon the report of such firm given upon their authority as experts in petroleum engineering.
Glossary of Natural Gas and Oil Terms
Many of the following terms are used throughout this prospectus. The definitions of proved developed reserves, proved reserves, and proved undeveloped reserves have been abbreviated from the applicable definitions contained in Rule 4-10(a) of Regulation S-X adopted by the Securities and Exchange Commission (the “SEC”). The entire definitions of those terms can be viewed on the SEC’s website at http://www.sec.gov.
|
Bbl |
|
means one stock tank barrel, or 42 U.S. gallons liquid volume, of crude oil or liquid hydrocarbons. |
|
|
|
|
|
Bcf |
|
means one billion cubic feet of natural gas. |
|
|
|
|
|
Bcfe |
|
means one billion cubic feet equivalent, determined using the ratio of six Mcf of natural gas to one bbl of crude oil, condensate, or natural gas liquids. |
|
|
|
|
|
Bbtu |
|
means one billion British Thermal Units. |
|
|
|
|
|
Btu |
|
means a British Thermal Unit, or the amount of heat necessary to raise the temperature of one pound of water one degree Fahrenheit. |
|
|
|
|
|
CBM |
|
means coalbed methane. |
|
|
|
|
|
Condensate |
|
means liquid hydrocarbons associated with the production of a primarily natural gas reserve. |
|
|
|
|
|
Developed acreage |
|
means the number of acres which are allocated or held by producing wells or wells capable of production. |
|
|
|
|
|
Development well |
|
means a well drilled within the proved area of an oil or natural gas reservoir to the depth of a stratigraphic horizon known to be productive. |
|
|
|
|
|
Dry hole; dry well |
|
means a well found to be incapable of producing either oil or natural gas in sufficient quantities to justify completion as an oil or natural gas well. |
|
|
|
|
|
Equivalent volumes |
|
means equivalent volumes are computed with natural gas liquid quantities converted to Mcf on an energy equivalent ratio of one barrel to six Mcf. |
|
|
|
|
|
Exploitation |
|
means ordinarily considered to be a form of development within a known reservoir. |
|
|
|
|
|
Exploratory well |
|
means a well drilled to find a new field or to find a new reservoir in a field previously found to be productive of oil or natural gas in another reservoir. Generally, an exploratory well is any well that is not a development well or a service well. |
|
|
|
|
|
Farmout |
|
is an assignment of an interest in a drilling location and related acreage conditional upon the drilling of a well on that location or the undertaking of other work obligations. |
|
|
|
|
|
Field |
|
means an area consisting of either a single reservoir or multiple reservoirs, all grouped on or related to the same individual geological structural feature and/or stratigraphic condition. |
|
|
|
|
|
Full cost pool |
|
means the full cost pool consists of all costs associated with property acquisition, exploration, and development activities for a company using the full cost method of accounting. Additionally, any internal costs that can be directly identified with |
|
|
|
acquisition, exploration, and development activities are included. Any costs related to production, general and administrative expense, or similar activities are not included. |
|
|
|
|
|
Gross acres or gross wells |
|
means the total acres or wells, as the case may be, in which a working interest is owned. |
|
|
|
|
|
Henry Hub |
|
means the natural gas pipeline located in Erath, Louisiana that serves as the official delivery location for futures contracts on the NYMEX. |
|
|
|
|
|
Lease operating expenses |
|
means the expenses of lifting natural gas or oil from a producing formation to the surface, constituting part of the current operating expenses of a working interest, and also including labor, superintendence, supplies, repairs, short-lived assets, maintenance, allocated overhead costs, and other expenses incidental to production, but not including lease acquisition or drilling or completion expenses. |
|
|
|
|
|
Liquids |
|
describes oil, condensate, and natural gas liquids. |
|
|
|
|
|
MBbls |
|
means one thousand barrels of crude oil or other liquid hydrocarbons. |
|
|
|
|
|
Mcf |
|
means one thousand cubic feet of natural gas. |
|
|
|
|
|
Mcfe |
|
means one thousand cubic feet equivalent determined using the ratio of six Mcf of natural gas to one bbl of crude oil, condensate, or natural gas liquids. |
|
|
|
|
|
MMBtu |
|
means one million British Thermal Units, a common energy measurement. |
|
|
|
|
|
MMcf |
|
means one million cubic feet of natural gas. |
|
|
|
|
|
MMcfe |
|
means one million cubic feet equivalent determined using the ratio of six Mcf of natural gas to one bbl of crude oil, condensate, or natural gas liquids. |
|
|
|
|
|
NGL |
|
means natural gas liquids. |
|
|
|
|
|
Net acres or net wells |
|
is the sum of the fractional working interest owned in gross acres or gross wells expressed in whole numbers and fractions of whole numbers. |
|
|
|
|
|
NYMEX |
|
means New York Mercantile Exchange. |
|
|
|
|
|
Productive wells |
|
means producing wells and wells that are capable of production, and wells that are shut-in. |
|
|
|
|
|
Proved Developed Reserves |
|
means estimated proved reserves that can be expected to be recovered through existing wells with existing equipment and operating methods. |
|
|
|
|
|
Proved Reserves |
|
means quantities of natural gas and oil, which, by analysis of geoscience and engineering data, can be estimated with reasonable certainty to be economically producible—from a given date forward, from known reservoirs, and under existing economic conditions, operating methods, and government regulations—prior to the time at which contracts providing the right to operate expire, unless evidence indicates that renewal is reasonably certain, regardless of whether deterministic or probabilistic methods are used for the estimation. Existing economic conditions include prices that are the average price during the twelve-month period prior to the ending date of the period covered by the report, determined as an unweighted arithmetic average of the first-day-of-the-month price for each month within such period, unless prices are defined by contractual arrangements, excluding escalations based upon future conditions. |
|
Proved Undeveloped Reserves |
|
means estimated proved reserves that are expected to be recovered from new wells on undrilled acreage or from existing wells where a relatively major expenditure is required for recovery to occur. |
|
|
|
|
|
PV-10 |
|
means the estimated future gross revenue to be generated from the production of proved reserves, net of estimated production and future development costs, using prices and costs in effect at the determination date, without giving effect to non-property related expenses such as general and administrative expenses, debt service and future income tax expense or to depreciation, depletion and amortization, discounted using an annual discount rate of 10%. |
|
|
|
|
|
Reservoir |
|
means a porous and permeable underground formation containing a natural accumulation of producible natural gas and/or oil that is confined by impermeable rock or water barriers and is individual and separate from other reservoirs. |
|
|
|
|
|
Royalty |
|
means an interest in an natural gas or oil lease that gives the owner of the interest the right to receive a portion of the production from the leased acreage (or of the proceeds of the sale thereof), but generally does not require the owner to pay any portion of the costs of drilling or operating the wells on the leased acreage. Royalties may be either landowner’s royalties, which are reserved by the owner of the leased acreage at the time the lease is granted, or overriding royalties, which are usually reserved by an owner of the leasehold in connection with a transfer to a subsequent owner. |
|
|
|
|
|
Standardized measure or present value of estimated future net revenues |
|
means an estimate of the present value of the estimated future net revenues from proved natural gas or oil reserves at a date indicated after deducting estimated production and ad valorem taxes, future capital costs, and operating expenses, but before deducting any estimates of U.S. federal income taxes. The estimated future net revenues are discounted at an annual rate of 10%, in accordance with the SEC’s practice, to determine their “present value.” The present value is shown to indicate the effect of time on the value of the revenue stream and should not be construed as being the fair market value of the properties. Estimates of future net revenues are made using natural gas prices and operating costs at the estimation date and held constant for the life of the reserves. |
|
|
|
|
|
Tcfe |
|
means one trillion cubic feet equivalent, determined using the ratio of six Mcf of natural gas to one bbl of crude oil, condensate, or natural gas liquids. |
|
|
|
|
|
Undeveloped Acreage |
|
means acreage on which wells have not been drilled or completed to a point that would permit the production of economic quantities of oil or natural gas, regardless of whether such acreage contains proved reserves. |
|
|
|
|
|
Working interest |
|
means an operating interest which gives the owner the right to drill, produce, and conduct operating activities on the property, and to receive a share of production. |
Corporate History and Structure
Carbon Natural Gas Company (a Delaware corporation reincorporated from Indiana in August 2007 and formerly known as St. Lawrence Seaway Corporation “SLSC”), owns and operates natural gas and crude oil interests in the Appalachian and Illinois Basins of the United States. It produces and sells natural gas, natural gas condensate and natural gas liquids, as well as crude oil. Carbon’s acreage is held and its exploration and production activities are conducted indirectly through majority-owned subsidiaries.
· Nytis Exploration (USA) Inc. (“Nytis USA”) was organized as a Delaware corporation in 2004. Nytis now is owned 100% by Carbon (see the information on Nytis USA’s reverse acquisition of SLSC below).
· Soon after formation, Nytis USA identified natural gas and oil interests located in Clearfield County, Pennsylvania, and organized (along with a minority owner) a subsidiary limited liability company, Nytis Exploration of Pennsylvania LLC, a Pennsylvania limited liability company (“Nytis PA”), which acquired those interests. Nytis PA is owned 85% by Nytis.
· Thereafter, Nytis USA identified natural gas and oil interests (owned by Addington Exploration, LLC (“Addington”)) located primarily in Illinois, Indiana, Kentucky, Ohio, Tennessee and West Virginia. To acquire the Addington assets, Nytis USA formed (along with a different unaffiliated person) Nytis LLC. Nytis LLC is owned 98.1% by Nytis USA. Nytis LLC continued acquiring interests complementary to the Addington assets, including the 2006 acquisition of Pennsylvania properties from DCPA, LLC (an affiliate of Delta Petroleum Corporation). In the spring of 2010, Nytis PA and Nytis LLC sold all of the Pennsylvania assets and received total proceeds of approximately $30.3 million ($21 million to Nytis LLC and $9.3 million to Nytis PA). In this transaction, Nytis PA sold all of its assets, and this subsidiary is being dissolved and its business wound up.
Now, substantially all the natural gas and oil interests are owned by Nytis LLC, which continues to acquire and exploit its properties. As of June 30, 2011, Nytis LLC owns interests in approximately 826 gross (480 net) productive natural gas and oil wells on approximately 321,000 (248,000 net) undeveloped acres in the Appalachian and Illinois Basins.
· On January 31, 2011, Nytis USA entered into an Agreement and Plan of Merger (the “Merger Agreement”) with SLSC, which was closed on February 14, 2011. At that date, SLSC acquired all of the issued and outstanding shares of Nytis USA from the Nytis USA stockholders, and thereby became the indirect owner of all of Nytis USA’s equity interests in Nytis LLC and Nytis PA, in exchange for the issuance by SLSC to the Nytis USA stockholders of 47,000,003 restricted shares of SLSC common stock (which then constituted 98.9% of SLSC’s issued and outstanding common stock), and Nytis USA became a wholly-owned subsidiary of SLSC, and Nytis LLC and Nytis PA became majority-owned indirect subsidiaries of SLSC (the “Merger”). The transactions contemplated by the Merger Agreement were intended to be a “tax-free” reorganization under Sections 351 and/or 368 of the Internal Revenue Code of 1986.
In connection with the closing of the Merger, the officers and directors of Nytis USA became the officers and directors of SLSC.
Prior to the Merger closing, SLSC was a “shell company” (as defined in Rule 12b-2 under the Securities Exchange Act of 1934 (the “Exchange Act”)), with no operations and nominal cash assets. As a result of the Merger, SLSC exited shell company status as of February 17, 2011, when it filed a Form 8-K with complete “Form 10 Information” as required by Item 2.01(f) of Form 8-K. On May 2, 2011, SLSC’s name was changed to Carbon Natural Gas Company.
Carbon now is a holding company which conducts substantially all its natural gas and oil operations through Nytis LLC.
Business Strategy and Strengths
Our strategy is to build value through consistent growth in reserves and production through drilling on existing properties, and acquiring more properties. We emphasize internally generated growth of land positions in low-risk, repeatable, unconventional resource plays, and invest significantly in technical staff, acreage and technology to build drilling inventory and establish value through drilling, and geological and engineering support.
Principal strategy components:
· Concentrate on unconventional resources in core operating areas. Our current focus on the Appalachian and Illinois Basins allows the Company to capitalize on its regional expertise to optimize drilling and completion techniques and production. Numerous objective reservoirs permit us to allocate capital among opportunities based on risked well economics, with a view to balancing the portfolio and achieve consistent and profitable growth in production and reserves.
All of our proved reserves and resources are classified as unconventional, including fractured shale natural gas plays, tight gas sands, and coalbed methane. Our technical team has significant experience in drilling vertical, horizontal and directional wells, as well as fracture stimulation of unconventional formations. We utilize the latest geologic, drilling and completion technologies to increase the predictability and repeatability of finding and recovering hydrocarbons in these unconventional plays.
Production increased from 1,000 Mcfe/d average for the year ended December 31, 2005, to 2,800 Mcfe/d for the year ended December 31, 2010, and to 6,700 Mcfe/d at June 30, 2011. Estimated proved reserves increased from 15.6 Bcfe at December 31, 2004 to 55.5 Bcfe at December 31, 2010, to 83.1 Bcfe at June 30, 2011. The large increases in production and reserves during 2011 are primarily attributed to the June 29, 2011 acquisition of assets from The Interstate Natural Gas Company (described further below).
· Proven executive management team with track record of value creation. The Company’s acreage positions provide multiple resource play opportunities. Our management and technical personnel have extensive experience operating in the Appalachian and Illinois Basins, and have successfully built and sold unconventional resource companies in the past.
· Low-risk development drilling in established resource plays, and flexibility in deployment of exploration and infrastructure capital. At June 30, 2011, the Company had a multi-year drilling inventory of approximately 3,000 potential drilling locations on acreage then held, and had drilled 93 wells from January 2005 through June 30, 2011 with an approximate 98% success rate. Approximately 5% of the drilling locations are included in our estimated proved reserve base at June 30, 2011. The concentrated leasehold position has been delineated largely through drilling done by us, as well as with other industry players.
This property profile is always subject to change as we acquire and dispose of various parcels. For examples, in 2010, in addition to selling all our interests (for approximately $30.3 million in gross proceeds) in Pennsylvania assets to a third party, we also sold some undeveloped acreage in West Virginia, bought an interest in 19 wells in Kentucky and an additional interest for 39 productive wells in Indiana, and bought a 50% interest in a company that owns and operates a gas gathering system in the Illinois Basin (this latter transaction added to infrastructure for the Company’s coalbed methane play in the Illinois Basin). Also, in 2009, we were paid a total of $2.7 million for two separate farmout agreements, by which we reduced capital exposure to dry hole risk, and retain a significant working interest plus overriding royalty interest upside. See Note 4 to the
audited consolidated financial statements included in this prospectus, and Management’s Discussion and Analysis of Financial Condition and Results of Operations.
· Low cost operation. Our geographic and operating focus provides low finding and development and lease operating costs.
· Maintain financial flexibility and conservative financial position. We typically use cash flow from operations and our bank credit facility with Bank of Oklahoma to fund acquisition and development drilling. In 2010, we repaid $23.5 million of borrowings under our bank credit facility with proceeds from the 2010 disposition of the Pennsylvania assets.
At June 29, 2011, as a result of the increase in proved reserves attributable to the assets acquired from The Interstate Natural Gas Company, the capacity was increased from $10 million to $20 million, and the maximum line for credit available under hedging arrangements was increased from $2.7 million to $5 million. At July 30, 2011, $10.2 million of the credit line was available. The maturity of all loans from the credit facility was extended from May 31, 2012 to May 31, 2014.
· Control over operating decisions and capital program. At December 31, 2010, we had an average working interest of 64% in our productive wells and operated 72% of our production. These numbers changed to 72% and 90% at June 30, 2011 respectively, as a result of buying assets from The Interstate Natural Gas Company. The high percentage of operated wells allows us to effectively control operating costs, timing of development activities, application of technological enhancements, marketing of production, and to better manage our capital budget. Additionally, our status as operator permits discretionary timing for much of our capital expenditures. This allows a significant degree of flexibility to adjust size and timing of development in response to changing market conditions.
· Manage commodity price exposure through an active hedging program. We maintain an active hedging program designed to mitigate volatility in commodity prices and regional basis differentials. As of June 30, 2011, we have outstanding hedges of 120,000 MMbtu for 2011 at an average price of $5.03 per MMbtu and 160,000 MMbtu for 2012 at an average price of $5.11 per MMbtu. Substantially all of the hedges are at regional sales points in our operating regions, which mitigates the risk of basis differential to the Henry Hub index.
· Manage midstream assets and secure firm takeaway capacity. We own natural gas gathering and compression facilities in the Illinois Basin, and also in the Appalachian Basin as a result of buying assets from The Interstate Natural Gas Company. We believe access to gathering and processing infrastructure allows us to decrease dependence on third parties, and better manage the timing of our development and the pricing to the markets to which we sell our production. In addition, we believe that to the extent that we were at risk related to pipeline capacity constraints, we have secured sufficient long-term firm takeaway capacity on major pipelines to accommodate our existing and expected production.
Planned Expenditures for Oil and Gas Exploration and Development
We expect to spend the amounts set forth below for natural gas and oil expenditures for the year ending December 31, 2011, including expenditures for exploration and development activities on the properties acquired from The Interstate Gas Company and Alerion Driling I, LLC. These expenditures are expected to be funded primarily from cash on hand from the Private Placement, plus positive cash flow from operations and/or loans from the credit facility. Actual expenditures and allocations are subject to change depending on prior results, available capital and other factors.
|
|
|
Expected Range |
|
|
| |
|
Area |
|
of Expenditures |
|
Application |
| |
|
|
|
|
|
|
| |
|
Appalachian Basin |
|
$ |
3.6 million |
|
6 (6.0 net) Horizontal Oil Sandstone Wells |
|
|
|
|
|
|
|
| |
|
Illinois Basin |
|
$ |
1.8 million |
|
4 (2.0 net) Horizontal CBM Wells |
|
|
|
|
$ |
0.1 million |
|
10 (0.9 net) Vertical CBM Wells |
|
|
|
|
$ |
0.6 million |
|
Land and Pipeline Infrastructure |
|
|
|
|
|
|
|
| |
|
Total |
|
$ |
6.1 million |
|
|
|
Financial information about segments
The Company operates in one industry segment. See Note 1 to the audited consolidated financial statements.
Limit on Operational Areas
The certificate of incorporation of Nytis USA, limits its direct and indirect activities related to the exploration, development, production, marketing and sale of oil, gas, coalbed methane and other hydrocarbons to the United States (both onshore and offshore). As a result, Nytis USA and its subsidiaries are precluded from oil and natural gas activities outside the United States.
Operational Areas
Our oil and gas properties are located primarily in located in eastern Illinois, western Indiana, eastern Kentucky, northeastern Tennessee, and western West Virginia. The map below shows where the Company’s natural gas and oil properties as of June 30, 2011 are located.
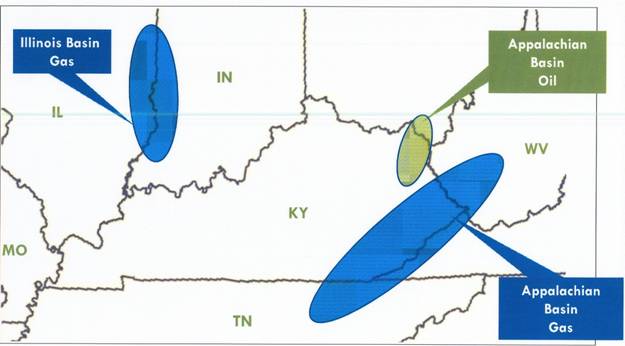
Appalachian Basin
As of June 30, 2011, Nytis LLC owns working interests in 620 gross wells (451 net) and royalty interests in an additional 149 wells located in Kentucky, Ohio and West Virginia, and have leasehold positions in approximately 34,000 net developed acres and approximately 160,000 net undeveloped acres. As of December 31, 2010, net sales were approximately 2,200 Mcfe per day, and approximately 6,100 Mcfe per day at June 30, 2011, reflecting the increases from the assets purchased from The Interstate Natural Gas Company. See “Acquisition and Divestiture Activities” below. Objective formations are the Berea Sandstone (for oil), and the Chattanooga Shale, Devonian Shale, Lower Huron Shale and other natural gas objective zones.
As a result of buying assets from The Interstate Natural Gas Company, the number of producing wells and the acreage position increased significantly as reflected in the immediately preceding paragraph: At June 28, 2011 (the date prior to the acquisition of assets from The Interstate Gas Natural Company), in the Appalachian Basin, Nytis LLC owned working interests in 190 gross (144 net) wells, royalty interests in an additional 149 wells, and leasehold positions in approximately 12,000 net developed acres and approximately 160,000 net undeveloped acres, and at that date, net sales were approximately 2,500 Mcfe/d per day.
Illinois Basin
As of June 30, 2011, Nytis LLC owns working interests in 57 gross (29 net) coalbed methane wells in the Illinois Basin and has a leasehold position in approximately 4,000 net developed acres and approximately 88,000 net undeveloped acres. We are presently engaged in geological and engineering evaluation of unconventional natural gas reservoirs in the basin and have established sustained natural gas production and sales from various formations at an average depth of 700 feet. As of December 31, 2010, net natural gas sales were approximately 800 Mcf per day. At June 30, 2011, sales were approximately 600 Mcf per day.
Acquisition and Divestiture Activities
Acquisitions
We pursue acquisitions that meet our criteria for investment returns and are consistent with our low-risk development focus. Acquisitions in and around our existing core areas enable us to leverage our cost control abilities, technical expertise, and existing land and infrastructure positions. In general, our acquisition program has focused on acquisitions of properties that have development drilling opportunities and undeveloped acreage. For detailed information on other acquisition transactions through December 31, 2010, see Note 4 to the audited consolidated financial statements. For information on such transactions through March 31, 2011, see Note 3 to the unaudited consolidated financial statements. See also, “Recent Developments” below.
Divestitures
In February and March of 2010, Nytis LLC and Nytis PA sold all of their assets located in Pennsylvania for a purchase price of $30.3 million ($21 million to Nytis LLC and $9.3 million to Nytis PA). The assets sold comprised all of the assets of Nytis PA and as a result, this subsidiary is in the process of being dissolved and its business wound up. In addition, the assets sold comprised all of the assets of Nytis LLC located in Pennsylvania, including approximately 160 wells with net monthly production of approximately 28.3 MMcf. For detailed information on other divestiture transactions, see Note 4 to the audited consolidated financial statements.
Reserves
The following table summarizes our internally estimated quantities of proved reserves as of June 30, 2011, December 31, 2010, and December 31, 2009, and the pre-tax PV-10.
Pre-tax PV-10 value, which is not a financial measure accepted under GAAP, is shown because it is a widely used industry standard.
Estimated Proved Reserves
Natural Gas Equivalents (MMcfe)
|
|
|
June 30, |
|
December 31, |
| |||||
|
|
|
2011 |
|
2010 |
|
2009 |
| |||
|
|
|
|
|
|
|
|
| |||
|
Proved developed producing |
|
44,904 |
|
16,810 |
|
20,076 |
| |||
|
Proved developed non-producing |
|
713 |
|
1,105 |
|
1,798 |
| |||
|
Proved undeveloped |
|
37,455 |
|
37,620 |
|
20,537 |
| |||
|
Total estimated proved reserves |
|
83,072 |
|
55,535 |
|
42,411 |
| |||
|
Percent developed |
|
54.9 |
% |
32.3 |
% |
51.6 |
% | |||
|
PV- 10 (thousands) |
|
$ |
43,734 |
|
$ |
20,952 |
|
$ |
26,421 |
|
|
Average pricing used (per Mcf) |
|
$ |
4.15 |
|
$ |
4.39 |
|
$ |
4.36 |
|
As of June 30, 2011 we had estimated proved reserves of 83.1 Bcfe. Of that total, 78.7 Bcfe (95%) were in the Appalachian Basin and 4.4 Bcfe (5%) were in the Illinois Basin.
As of June 30, 2011, proved undeveloped reserves (“PUDs”) were estimated to be 37.5 Bcfe, or 45% of estimated proved reserves, compared to 37.6 Bcfe, or 68% of estimated proved reserves as of December 31, 2010.
Independent Reserve Audit
Cawley, Gillespie and Associates, Inc., independent petroleum engineers, has prepared a reserve audit (re-issued April 7, 2011) of our internally generated estimates of the Company’s proved developed producing oil and natural gas reserves as of January 1, 2011. The Company has estimated that our reserves at that date were 42,000 barrels of oil and 16,559 MMcf of natural gas (16,809 MMcfe) with a pre-tax PV-10 value of $19.4 million. However, as is
the case with CG&A’s audit of our internal estimates of ING’s reserves, it should be noted that the Company’s estimates may vary by 10% up or down. Our estimate is further subject to the uncertainty inherent in any reserves and value estimates. For more information, see “Preparation of Reserves Estimates” below.
Preparation of Reserve Estimates
Our internal reserve estimates as of June 30, 2011 and December 31, 2010 and 2009 presented herein were made in accordance with the SEC’s “Modernization of Oil and Gas Reporting” rule, which was effective for fiscal years ending on or after December 31, 2009. The new SEC rule included updated definitions of proved natural gas reserves, proved undeveloped natural gas reserves, natural gas producing activities and other terms used in estimating proved natural gas reserves. Proved natural gas reserves for all periods presented were calculated based on the prices for natural gas during the twelve month period before the reporting date, determined as unweighted arithmetic averages of the first-day-of-the-month prices for each month within such period, rather than the year-end spot prices, which had been used in years prior to 2009. Undrilled locations can be classified as having proved undeveloped reserves if a development plan has been adopted indicating that they are scheduled to be drilled within five years, unless the specific circumstances justify a longer time. The new SEC rules broadened the types of technologies that a company may use to establish reserve estimates and also broadened the definition of natural gas producing activities to include the extraction of non-traditional resources, including natural gas extracted from shales as well as bitumen extracted from oil sands. See Notes 1 and 2 to the audited consolidated financial statements included in this prospectus for additional information regarding our estimated proved reserves.
Uncertainties are inherent in estimating quantities of proved reserves, including many factors beyond our control. Reserve engineering is a subjective process of estimating subsurface accumulations of natural gas and oil that cannot be measured in an exact manner, and the accuracy of any reserve estimate is a function of the quality of available data and its interpretation. As a result, estimates by different engineers often vary, sometimes significantly. In addition, physical factors such as the results of drilling, testing, and production subsequent to the date of an estimate, as well as economic factors such as changes in product prices or development and production expenses, may require revision of such estimates. Accordingly, quantities of natural gas and oil ultimately recovered will vary from reserve estimates. See “Risk Factors,” for a description of some of the risks and uncertainties associated with our business and reserves.
The reserve estimates included in this prospectus were prepared by Nytis LLC’s internal staff of engineers with significant consultation with internal geologists. The reserve estimates are based on production performance, data acquired remotely or in wells, and are guided by petrophysical, geologic, geophysical, and reservoir engineering models. Access to the database housing reserves information is restricted to select individuals from our engineering department. Moreover, new reserve estimates and significant changes to existing reserves are reviewed and approved by various levels of management, depending on their magnitude.
Richard Finucane is Chief Engineer for Nytis LLC. In that capacity he oversees engineering, production, drilling and completion activities in Nytis’ operations, including property evaluation, acquisitions and divestitures. Mr. Finucane has worked as an oil and natural gas engineer since 1978. His initial experience was with Texaco Inc. From 1982-1997 Mr. Finucane was employed by Ashland Exploration Company where his responsibilities included production optimization, facilities engineering, drill site selection, reservoir engineering and property evaluation. Mr. Finucane holds a B.S. in Civil Engineering from the University of Tennessee (highest honors) and is admitted as an expert in oil and natural gas matters in civil and regulatory proceedings in Virginia, West Virginia, and Kentucky.
CG&A’s report is an audit of our internal estimating process and results, limited to an audit of our proved developed producing reserves estimates, and it does not address our internal estimates of proved developed non-producing or proved undeveloped reserves. CG&A’s independent reports are filed as exhibits to this prospectus.
Competition
We encounter competition in all aspects of our business, including acquisition of properties and oil and natural gas leases, marketing oil and natural gas, obtaining services and labor, and securing drilling rigs and other equipment and materials necessary for drilling and completing wells. Our ability to increase reserves in the future will depend on our ability to generate successful prospects on our existing properties, execute on major development drilling
programs, and acquire additional leases and prospects for future development and exploration. A large number of the companies that we compete with have substantially larger staffs and greater financial and operational resources than we have. Because of the nature of our natural gas assets and management’s experience in exploiting our reserves and acquiring properties, management believes that we effectively compete in our markets. See— Risk Factor entitled “Competition in the natural gas and oil industry is intense, making it more difficult for us to acquire properties, market natural gas and oil and secure trained personnel.”
Regulation
Our operations are subject to various U.S. federal, state, and local laws and regulations. These laws and regulations may be changed in response to economic or political conditions. Matters subject to current governmental regulation and/or pending legislative or regulatory changes include the discharge or other release into the environment of wastes and other substances in connection with drilling and production activities (including fracture stimulation operations), bonds or other financial responsibility requirements to cover drilling risks and well plugging and abandonment, reclamation or restoration costs, reports concerning our operations, the spacing of wells, unitization and pooling of properties, taxation, and the use of derivative hedging instruments. Failure to comply with the laws and regulations in effect from time to time may result in the assessment of administrative, civil, and criminal penalties, the imposition of remedial obligations, and the issuance of injunctions that could delay, limit, or prohibit certain of our operations. In the past, regulatory agencies have imposed price controls and limitations on production. In order to conserve supplies of oil and gas, oil and gas conservation commissions and other agencies may restrict the rates of flow of wells below actual production capacity, generally prohibit the venting or flaring of natural gas, and impose certain requirements regarding the ratability or fair apportionment of production from fields and individual wells. Further, a significant spill from one of our facilities could have a material adverse effect on our results of operations, competitive position, or financial condition. The laws in the U.S., including state laws, regulate, among other things, the production, handling, storage, transportation, and disposal of natural gas and oil, by-products from each, and other substances and materials produced or used in connection with our operations. We cannot predict the ultimate cost of compliance with these requirements or their effect on our operations.
In August 2005, Congress enacted the Energy Policy Act of 2005 (“EPAct 2005”). Among other matters, EPAct 2005 amends the Natural Gas Act (“NGA”) to make it unlawful for “any entity,” including otherwise non-jurisdictional producers such as Carbon, to use any deceptive or manipulative device or contrivance in connection with the purchase or sale of natural gas or the purchase or sale of transportation services subject to regulation by the Federal Energy Regulatory Commission (“FERC”), in contravention of rules prescribed by the FERC. EPAct 2005 also gives the FERC authority to impose civil penalties for violations of the NGA up to $1,000,000 per day per violation. The new anti-manipulation rule does not apply to activities that relate only to intrastate or other non-jurisdictional sales or gathering, but does apply to activities of otherwise non-jurisdictional entities to the extent the activities are conducted “in connection with” natural gas sales, purchases or transportation subject to FERC jurisdiction. It therefore reflects a significant expansion of the FERC’s enforcement authority. We do not anticipate we will be affected any differently than other producers of natural gas in respect of EPAct2005.
In December 2007, the FERC issued rules requiring that any market participant, including a producer such as Carbon, that engages in physical sales for resale or purchases for resale of natural gas that equal or exceed 2.2 million MMBtus during a calendar year must annually report such sales or purchases to the FERC, beginning on May 1, 2009. These rules are intended to increase the transparency of the wholesale natural gas markets and to assist the FERC in monitoring such markets and in detecting market manipulation. On September 18, 2008 the FERC issued its order on rehearing, which largely approved the existing rules, except the FERC exempted from the reporting requirement certain types of purchases and sales, including purchases and sales of unprocessed natural gas and bundled sales of natural gas made pursuant to state regulated retail tariffs. Also, the FERC clarified that other end use purchases and sales are not exempt from the reporting requirements. The monitoring and reporting required by the new rules will likely increase our administrative costs. Carbon does not anticipate it will be affected any differently than other producers of natural gas.
Additional proposals and proceedings that might affect the natural gas industry are regularly considered by Congress, the states, the FERC, and the courts. For instance, legislation has been introduced in the U.S. Congress to amend the federal Safe Drinking Water Act to subject hydraulic fracturing operations—an important process used in the completion of our natural gas wells—to regulation under the Safe Drinking Water Act. If adopted, this
legislation could establish an additional level of regulation, and impose additional costs, on our operations. We cannot predict when or whether any such proposal, or any additional new legislative or regulatory proposal, may become effective. No material portion of our business is subject to renegotiation of profits or termination of contracts or subcontracts at the election of the federal government.
Environmental
As an operator of natural gas and oil properties in the U.S., we are subject to stringent national, state, provincial, and local laws and regulations relating to environmental protection as well as controlling the manner in which various substances, including wastes generated in connection with exploration, production, and transportation operations, are released into the environment. Compliance with these laws and regulations can affect the location or size of wells and facilities, prohibit or limit the extent to which exploration and development may be allowed, and require proper closure of wells and restoration of properties when production ceases. Failure to comply with these laws and regulations may result in the assessment of administrative, civil, or criminal penalties, imposition of remedial obligations, incurrence of capital or increased operating costs to comply with governmental standards, and even injunctions that limit or prohibit exploration and production activities or that constrain the disposal of substances generated by oil field operations.
We currently operate or lease, and have in the past operated or leased, a number of properties that for many years have been used for the exploration and production of natural gas and oil. Although we have utilized operating and disposal practices that were standard in the industry at the time, hydrocarbons or other wastes may have been disposed of or released on or under the properties operated or leased by us or on or under other locations where such wastes have been taken for disposal. In addition, many of these properties have been operated by third parties whose treatment and disposal or release of hydrocarbons or other wastes was not under our control. These properties and the wastes disposed thereon may be subject to laws and regulations imposing joint and several liability and strict liability without regard to fault or the legality of the original conduct that could require us to remove previously disposed wastes or remediate property contamination, or to perform well or pit closure or other actions of a remedial nature to prevent future contamination.
In 2009, the U.S. House of Representatives passed a bill to control and reduce the emission of domestic greenhouse gases through the grant of emission allowances which would gradually be decreased over time. Although similar bills were considered in the U.S. Senate, such legislation lacked bipartisan support in the current Congress. Despite the lack of federal legislation, nearly half of the states, either individually or through multi-state initiatives, have already begun implementing legal measures to reduce greenhouse gas emissions. Also, the U.S. Supreme Court held in Massachusetts et al. v. EPA (2007) that carbon dioxide may be regulated as an “air pollutant” under the federal Clean Air Act, which could result in future regulation of greenhouse gas emissions from stationary and non-stationary sources, even if Congress does not adopt new legislation specifically addressing such emissions. In December 2009, the U.S. Environmental Protection Agency (“EPA”) published its findings that emissions of greenhouse gases present an endangerment to public health and the environment because such emissions, according to the EPA, are contributing to warming of the earth’s atmosphere and other climate changes. These findings allow the EPA to implement regulations that would restrict greenhouse gas emissions under existing provisions of the Clean Air Act. Accordingly, the EPA has adopted regulations that require a reduction of greenhouse gas emissions from motor vehicles and has proposed additional regulations to further restrict such emissions. The EPA has also finalized regulations that require certain U.S. facilities, including certain petroleum and natural gas facilities, to report their greenhouse gas emissions beginning on January 1, 2011. The adoption and implementation of these regulations impacts our business, and any such future laws and regulations could result in increased compliance costs or additional operating restrictions, and could have an adverse effect on demand for the natural gas that we produce.
We believe that it is reasonably likely that the trend in environmental legislation and regulation will continue toward stricter standards. While we believe that we are in substantial compliance with applicable environmental laws and regulations in effect at the present time and that continued compliance with existing requirements will not have a material adverse impact on us, we cannot give any assurance that we will not be adversely affected in the future. We have established internal guidelines to be followed in order to comply with environmental laws and regulations in the U.S. Although we maintain pollution insurance against the costs of cleanup operations, public liability, and
physical damage, there is no assurance that such insurance will be adequate to cover all such costs or that such insurance will continue to be available in the future.
Employees
As of June 30, 2011, our workforce (including those employed by our subsidiary Nytis LLC) consisted of approximately 29 employees all of which are full-time employees. None of the members of our workforce are represented by a union or covered by a collective bargaining agreement. We believe we have a good relationship with the members of our workforce.
Legal Proceedings
The Company is subject to legal claims and proceedings in the ordinary course of its oil and natural gas exploration and development business. Management believes that none of the current pending proceedings would have a material adverse effect on the Company, should the controversies be resolved against the Company. Notwithstanding management’s belief that there are no claims that could have a material effect on the financial condition or results of the Company’s operations, the Company’s indirect subsidiary, Nytis LLC, is involved in the following matters:
In July 2010, Nytis LLC received correspondence from the Pennsylvania Department of Revenue requesting additional information relating to whether the correct realty transfer tax was paid at the time of the closing of Nytis LLC’s acquisition of properties in Pennsylvania in 2006 from DCPA, LLC (an affiliate of Delta Petroleum Corporation).Nytis LLC has submitted the requested information to the Pennsylvania Department of Revenue and is awaiting its response.
In November 2010, Nytis LLC’s was served with a summons and complaint brought by ICG Knott County, LLC and filed in the Knott County, Kentucky. The suit is in the nature of a quiet title action and concerns ICG’s claims that it is the party to which Nytis LLC should be making certain payments under several leases. Also in November 2010, ICG Natural Resources, LLC filed suit against Nytis LLC in Floyd County, Kentucky concerning payments allegedly due under a certain coalbed methane lease. Nytis LLC has engaged counsel to assist it in defending against these claims.
In August 2011, Nytis LLC was served with a summons and complaint brought by RLF Chinook Properties, LLC, Charles K. and Kimberly L. Butts, Chinook Project, LLC and Chinook Enterprises, LLC (collectively, “Chinook”) and filed in the Vigo Superior Court in Vigo County, Indiana. The suit is in the nature of a quiet title action and Chinook seeks to invalidate certain coal seam gas leases currently held by Nytis LLC. Addington Exploration, LLC (the party from which Nytis LLC obtained the leases at issue) was named as a co-defendant in the complaint. Nytis LLC intends to defend itself against these claims with the assistance of Indiana counsel.
Drilling Activities
The following table summarizes the number of wells drilled during the six months ended June 30, 2011 and for the years ended December 31, 2010 and 2009. Gross wells reflect the sum of all wells in which we own an interest. Net wells reflect the sum of our working interests in gross wells. As of June 30, 2011, we had one well in progress.
|
|
|
Six Months Ended |
|
|
| ||||||||
|
|
|
June 30, |
|
Year Ended December 31, |
| ||||||||
|
|
|
2011 |
|
2010 |
|
2009 |
| ||||||
|
|
|
Gross |
|
Net |
|
Gross |
|
Net |
|
Gross |
|
Net |
|
|
|
|
|
|
|
|
|
|
|
|
|
|
|
|
|
Development wells: |
|
|
|
|
|
|
|
|
|
|
|
|
|
|
Productive |
|
1.0 |
|
1.0 |
|
12.0 |
|
4.7 |
|
11.0 |
|
5.2 |
|
|
Dry |
|
— |
|
— |
|
— |
|
— |
|
1.0 |
|
0.5 |
|
|
Total development wells |
|
1.0 |
|
1.0 |
|
12.0 |
|
4.7 |
|
12.0 |
|
5.7 |
|
|
Exploratory wells: |
|
|
|
|
|
|
|
|
|
|
|
|
|
|
Productive |
|
— |
|
— |
|
— |
|
— |
|
— |
|
— |
|
|
Dry |
|
— |
|
— |
|
— |
|
— |
|
— |
|
— |
|
|
Total exploratory wells |
|
— |
|
— |
|
— |
|
— |
|
— |
|
— |
|
A non-productive well is a well found to be incapable of producing either natural gas or oil in sufficient quantities to justify completion as a natural gas or oil well; also known as a dry well or dry hole.
Natural Gas and Oil Wells and Acreage
Productive Wells
Productive wells consist of producing wells and wells capable of production, including shut-in wells. A well bore with multiple completions is counted as only one well. The following table summarizes our productive wells as of June 30, 2011 and December 31, 2010.
|
|
|
June 30, 2011 |
|
December 31, 2010 |
| ||||
|
|
|
Gross |
|
Net |
|
Gross |
|
Net |
|
|
|
|
|
|
|
|
|
|
|
|
|
Gas |
|
796 |
|
451 |
|
419 |
|
162 |
|
|
Oil |
|
30 |
|
29 |
|
14 |
|
14 |
|
|
Total |
|
826 |
|
480 |
|
433 |
|
176 |
|
Acreage
The following tables summarizes developed and undeveloped acreage in which we owned a working interest or held an exploration license as of June 30, 2011 and December 31, 2010. A majority of our developed acreage is subject to mortgage liens securing our bank credit facilities. Acreage related to royalty, overriding royalty, and other similar interests is excluded from this summary, as well as acreage related to any options held by us to acquire additional leasehold interests.
December 31, 2010
|
|
|
Developed |
|
Undeveloped |
|
Total |
| ||||||
|
|
|
Acres |
|
Acres |
|
Acres |
| ||||||
|
|
|
Gross |
|
Net |
|
Gross |
|
Net |
|
Gross |
|
Net |
|
|
Indiana |
|
11,244 |
|
1,026 |
|
95,360 |
|
63,133 |
|
106,604 |
|
64,159 |
|
|
Illinois |
|
6,894 |
|
3,447 |
|
70,557 |
|
38,951 |
|
77,451 |
|
42,398 |
|
|
Kentucky |
|
9,494 |
|
4,722 |
|
65,752 |
|
50,982 |
|
75,246 |
|
55,704 |
|
|
Ohio |
|
558 |
|
558 |
|
6,555 |
|
6,555 |
|
7,113 |
|
7,113 |
|
|
Tennessee |
|
— |
|
— |
|
100,000 |
|
95,000 |
|
100,000 |
|
95,000 |
|
|
West Virginia |
|
8,770 |
|
6,156 |
|
10,997 |
|
5,713 |
|
19,767 |
|
11,869 |
|
|
Total |
|
36,960 |
|
15,909 |
|
349,221 |
|
260,334 |
|
386,181 |
|
276,243 |
|
June 30, 2011
|
|
|
Developed |
|
Undeveloped |
|
Total |
| ||||||
|
|
|
Acres |
|
Acres |
|
Acres |
| ||||||
|
|
|
Gross |
|
Net |
|
Gross |
|
Net |
|
Gross |
|
Net |
|
|
Indiana |
|
240 |
|
63 |
|
59,655 |
|
51,093 |
|
59,895 |
|
51,156 |
|
|
Illinois |
|
6,894 |
|
3,447 |
|
66,037 |
|
36,693 |
|
72,931 |
|
40,140 |
|
|
Kentucky |
|
29,436 |
|
25,541 |
|
78,168 |
|
53,005 |
|
107,604 |
|
78,546 |
|
|
Ohio |
|
558 |
|
558 |
|
6,555 |
|
6,555 |
|
7,113 |
|
7,113 |
|
|
Tennessee |
|
— |
|
— |
|
100,000 |
|
95,000 |
|
100,000 |
|
95,000 |
|
|
West Virginia |
|
11,301 |
|
7,787 |
|
10,997 |
|
5,713 |
|
22,298 |
|
13,500 |
|
|
Total |
|
48,429 |
|
37,396 |
|
321,412 |
|
248,059 |
|
369,841 |
|
285,455 |
|
Undeveloped Acreage Expirations
The following tables set forth the number of gross and net undeveloped acres by state as of June 30, 2011 and December 31, 2010, the leases for which are scheduled to expire from the date of the table through 2013 unless production is established within the spacing unit covering the acreage prior to the expiration date or the Company extends the terms of a lease by paying delay rentals to the lessor.
December 31, 2010
|
|
|
2011 |
|
2012 |
|
2013 |
| ||||||
|
|
|
Gross |
|
Net |
|
Gross |
|
Net |
|
Gross |
|
Net |
|
|
|
|
|
|
|
|
|
|
|
|
|
|
|
|
|
Indiana |
|
20,993 |
|
11,603 |
|
1,505 |
|
753 |
|
— |
|
— |
|
|
|
|
|
|
|
|
|
|
|
|
|
|
|
|
|
Illinois |
|
13,091 |
|
6,545 |
|
656 |
|
328 |
|
— |
|
— |
|
|
|
|
|
|
|
|
|
|
|
|
|
|
|
|
|
Kentucky |
|
75 |
|
75 |
|
4,528 |
|
4,262 |
|
259 |
|
259 |
|
|
|
|
|
|
|
|
|
|
|
|
|
|
|
|
|
Ohio |
|
— |
|
— |
|
51 |
|
51 |
|
22 |
|
22 |
|
|
|
|
|
|
|
|
|
|
|
|
|
|
|
|
|
Tennessee |
|
— |
|
— |
|
— |
|
— |
|
— |
|
— |
|
|
West Virginia |
|
— |
|
— |
|
— |
|
— |
|
— |
|
— |
|
|
|
|
|
|
|
|
|
|
|
|
|
|
|
|
|
Total |
|
34,159 |
|
18,223 |
|
6,740 |
|
5,394 |
|
281 |
|
281 |
|
June 30, 2011
|
|
|
2011 |
|
2012 |
|
2013 |
| ||||||
|
|
|
Gross |
|
Net |
|
Gross |
|
Net |
|
Gross |
|
Net |
|
|
|
|
|
|
|
|
|
|
|
|
|
|
|
|
|
Indiana |
|
3,703 |
|
2,286 |
|
1,505 |
|
753 |
|
— |
|
— |
|
|
|
|
|
|
|
|
|
|
|
|
|
|
|
|
|
Illinois |
|
9,907 |
|
4,953 |
|
656 |
|
328 |
|
— |
|
— |
|
|
|
|
|
|
|
|
|
|
|
|
|
|
|
|
|
Kentucky |
|
— |
|
— |
|
4,408 |
|
4,142 |
|
259 |
|
259 |
|
|
|
|
|
|
|
|
|
|
|
|
|
|
|
|
|
Ohio |
|
— |
|
— |
|
51 |
|
51 |
|
22 |
|
22 |
|
|
|
|
|
|
|
|
|
|
|
|
|
|
|
|
|
Tennessee |
|
— |
|
— |
|
— |
|
— |
|
— |
|
— |
|
|
West Virginia |
|
— |
|
— |
|
— |
|
— |
|
— |
|
— |
|
|
|
|
|
|
|
|
|
|
|
|
|
|
|
|
|
Total |
|
13,610 |
|
7,239 |
|
6,620 |
|
5,274 |
|
281 |
|
281 |
|
Production, Average Sales Prices, and Production Costs
The following table reflects production, average sales price, and production cost information for the three months ended March 31, 2011, and the years ended December 31, 2010 and 2009.
|
|
|
Three Months Ended |
|
|
|
|
| ||||||
|
|
|
March 31, |
|
Year Ended December 31, |
| ||||||||
|
|
|
2011 |
|
2010 |
|
2010 |
|
2009 |
| ||||
|
|
|
|
|
|
|
|
|
|
| ||||
|
Production data: |
|
|
|
|
|
|
|
|
| ||||
|
|
|
|
|
|
|
|
|
|
| ||||
|
Natural gas (MMcf) |
|
264 |
|
271 |
|
1,000 |
|
1,336 |
| ||||
|
|
|
|
|
|
|
|
|
|
| ||||
|
Oil and condensate (Bbl) |
|
1,109 |
|
99 |
|
1,827 |
|
870 |
| ||||
|
|
|
|
|
|
|
|
|
|
| ||||
|
Combined (MMcfe) |
|
270 |
|
272 |
|
1,011 |
|
1,341 |
| ||||
|
|
|
|
|
|
|
|
|
|
| ||||
|
Gas and oil production revenue (in thousands) |
|
$ |
1,254 |
|
$ |
1,562 |
|
$ |
4,880 |
|
$ |
5,676 |
|
|
Commodity hedge gain/(loss) (in thousands) |
|
$ |
62 |
|
$ |
475 |
|
$ |
692 |
|
$ |
227 |
|
|
Prices: |
|
|
|
|
|
|
|
|
| ||||
|
Average sales price before effects of hedging (per Mcfe) |
|
$ |
4.64 |
|
$ |
5.75 |
|
$ |
4.83 |
|
$ |
4.23 |
|
|
Average realized sales price after effects of hedges (per Mcfe) |
|
$ |
4.87 |
|
$ |
7.50 |
|
$ |
5.51 |
|
$ |
4.40 |
|
|
Average costs per Mcfe: |
|
|
|
|
|
|
|
|
| ||||
|
Lease operating costs |
|
$ |
0.90 |
|
$ |
0.95 |
|
$ |
1.04 |
|
$ |
0.85 |
|
|
Transportation costs |
|
$ |
0.57 |
|
$ |
0.15 |
|
$ |
0.44 |
|
$ |
0.29 |
|
|
Production and property taxes |
|
$ |
0.40 |
|
$ |
0.36 |
|
$ |
0.43 |
|
$ |
0.42 |
|
Marketing and Delivery Commitments
Our natural gas production is generally sold on a month-to-month basis in the spot market, priced in reference to published indices. We believe that the loss of one or more of our natural gas purchasers would not have a material adverse effect on our ability to sell our production, because any individual purchaser could be readily replaced by another purchaser, absent a broad market disruption. We had no material delivery commitments as of June 30 2011.
As part of our purchase of assets in June 2011 from The Interstate Gas Company, Nytis LLC assumed certain long-term firm transportation contracts, which impose financial obligations on the Company through the term of the contracts. These contracts vary in length, and except for one contract that runs through 2036, the remaining contracts expire on or before December 31, 2017.
MARKET FOR COMMON EQUITY AND RELATED STOCKHOLDER MATTERS
We have not paid any cash dividends on our common stock to date. The payment of dividends in the future will be contingent upon our revenues and earnings, if any, capital requirements and general financial condition, and will be within the discretion of our then-existing Board of Directors. We currently intend to retain our future earnings to support operations and to finance expansion and, therefore, our Board of Directors does not anticipate paying any cash dividends to holders of our common stock in the foreseeable future.
The Company’s ability to pay distributions is currently limited by:
· The terms of our credit facility with the Bank of Oklahoma prohibit us from paying dividends on our common stock while amounts are owed to the Bank of Oklahoma; and
· The Delaware General Corporation Law also provides that a Delaware corporation may pay dividends either: 1) out of the corporation’s surplus (as defined by Delaware law); or 2) if there is no surplus, out of the corporation’s net profit for the fiscal year in which the dividend is declared or the preceding fiscal year. Any determination in the future to pay dividends will depend on the Company’s financial condition, capital requirements, results of operations, contractual limitations, legal restrictions and any other factors the Board of Directors deem relevant.
Our common stock is quoted on the OTC Bulletin Board (“OTCBB”) under the symbol CRBO. However, the limited and sporadic quotations of our stock may not constitute an established trading market for our stock. The
table below sets forth the high and low bid prices per share of our common stock as quoted on the OTCBB for the periods indicated. Prior to May 11, 2011, the common stock traded under the symbol STLS. All OTCBB quotations included herein reflect inter-dealer prices, without retail mark-up, mark-down or commission and may not necessarily represent actual transactions. Prior to the Merger, there was limited or no trading activity in SLSC’s common stock and there has continued to be a lack of trading activity in our common stock. There can be no assurance that an active market will develop for our common stock in the future.
|
Year Ended |
|
Quarter |
|
High |
|
Low |
| ||
|
|
|
|
|
|
|
|
| ||
|
2011 |
|
First |
|
$ |
1.01 |
|
$ |
0.70 |
|
|
|
|
|
|
|
|
|
| ||
|
|
|
Second |
|
$ |
1.20 |
|
$ |
0.40 |
|
|
|
|
|
|
|
|
|
| ||
|
2010 |
|
First |
|
$ |
1.02 |
|
$ |
0.66 |
|
|
|
|
|
|
|
|
|
| ||
|
|
|
Second |
|
$ |
1.02 |
|
$ |
1.02 |
|
|
|
|
|
|
|
|
|
| ||
|
|
|
Third |
|
$ |
1.02 |
|
$ |
0.68 |
|
|
|
|
|
|
|
|
|
| ||
|
|
|
Fourth |
|
$ |
1.01 |
|
$ |
0.70 |
|
|
|
|
|
|
|
|
|
| ||
|
2009 |
|
First |
|
$ |
1.05 |
|
$ |
0.75 |
|
|
|
|
|
|
|
|
|
| ||
|
|
|
Second |
|
$ |
0.82 |
|
$ |
0.65 |
|
|
|
|
|
|
|
|
|
| ||
|
|
|
Third |
|
$ |
1.05 |
|
$ |
0.60 |
|
|
|
|
|
|
|
|
|
| ||
|
|
|
Fourth |
|
$ |
1.02 |
|
$ |
0.65 |
|
As of August 8, 2011, the closing bid price for our common stock on the OTCBB was $0.80 per share.
Holders
As of August 10, 2011, there were approximately 1,164 holders of record of our common stock.
Securities Authorized for Issuance Under Compensation Plans
Our Board of Directors has adopted the 2011 Stock Incentive Plan (the “Plan”) and has recommended its approval and ratification to our stockholders at the next annual meeting of stockholders. Such annual meeting has not yet occurred and the Plan remains subject to such stockholder approval. No awards have yet been made under the Plan.
Upon closing the Merger the Company assumed options to acquire 342,460 shares of common stock. At the time of the Merger such options became exercisable to acquire Company common stock and the terms of the options were amended to reflect the exchange ratio used to effect the Merger. The following is provided with respect to compensation plans (including individual compensation arrangements) under which equity securities are authorized for issuance as of June 30, 2011:
Equity Compensation Plan Information
|
|
|
|
|
|
|
Number of Securities |
| |
|
|
|
|
|
|
|
Remaining Available |
| |
|
|
|
Number of Securities |
|
|
|
for Future Issuance |
| |
|
|
|
to be Issued Upon |
|
Weighted-Average |
|
Under Equity |
| |
|
|
|
Exercise of |
|
Exercise Price of |
|
Compensation Plans |
| |
|
|
|
Outstanding Options, |
|
Outstanding Options, |
|
(Excluding Securities |
| |
|
Plan Category |
|
Warrants, and Rights |
|
Warrants, and Rights |
|
Reflected in Column (a)) |
| |
|
and Description |
|
(a) |
|
(b) |
|
(c) |
| |
|
|
|
|
|
|
|
|
| |
|
Equity Compensation Plans Approved by Security Holders |
|
— |
|
— |
|
— |
| |
|
|
|
|
|
|
|
|
| |
|
Equity Compensation Plans Not Approved by Security Holders |
|
342,459 |
(1) |
$ |
0.6386 |
|
— |
|
|
|
|
|
|
|
|
|
| |
|
Total |
|
342,459 |
|
$ |
0.6386 |
|
|
|
(1) Consists of options granted prior to the Merger by Nytis USA to persons who are affiliates and former affiliates of Nytis USA (three of which are now officers and directors of the Company). All of these options were assumed by the Company at the time of the Merger.
MANAGEMENT’S DISCUSSION AND ANALYSIS OF FINANCIAL CONDITION AND RESULTS OF OPERATIONS
The following discussion includes forward-looking statements about our business, financial condition and results of operations, including discussions about management’s expectations for our business. These statements represent projections, beliefs and expectations based on current circumstances and conditions and in light of recent events and trends, and you should not construe these statements either as assurances of performance or as promises of a given course of action. Instead, various known and unknown factors are likely to cause our actual performance and management’s actions to vary, and the results of these variances may be both material and adverse. A description of material factors known to us that may cause our results to vary, or may cause management to deviate from its current plans and expectations, is set forth under “Risk Factors.” See “Cautionary Note Regarding Forward-Looking Statements.” The following discussion should also be read in conjunction with our audited and unaudited consolidated financial statements, including the notes thereto appearing elsewhere in this prospectus.
Carbon is an independent natural gas and oil company engaged in the acquisition, exploration, development and production of natural gas and oil properties located in the Appalachian and the Illinois Basin of the United States. We focus on unconventional reservoirs, including fractured shale gas plays, tight gas sands and coalbed methane. Our corporate headquarters are in Denver, Colorado and Catlettsburg, Kentucky.
Prior to the Merger, our management team led Nytis USA and has worked together for many years and has a successful track record of reserve and production growth as well as significant expertise in unconventional resource plays. Our strategy is to leverage our team’s experience developing natural gas and oil resource plays to profitably grow our reserves and production, primarily through internally generated projects on our existing acreage and acquisitions within our core geographic areas. As of June 30, 2011, substantially all of our proved reserves were natural gas, 54% were proved developed and 90% of our production was operated by us. From December 31, 2004 through December 31, 2010, we grew our estimated proved reserves from 15.6 Bcfe to 55.6 Bcfe, and at June 30, 2011 our estimated proved reserves were 83.1 Bcfe. In addition, we grew our average daily production from 1,000
Mcfe/d for the year ended December 31, 2005 to 2,800 Mcfe/d for the year ended December 31, 2010 and at June 30, 2011 our daily production was approximately 6,700 Mcfe/d. The large increase in production and reserves during 2011 are primarily attributable to our purchase of assets in June 2011 from The Interstate Gas Company.
We have assembled a diversified portfolio of long-lived properties that are characterized by what we believe to be low geologic risk and a large inventory of repeatable drilling opportunities. Our drilling opportunities are focused in the Appalachian and Illinois Basins. From January 2005 through June 30, 2011, we have drilled 93 wells with a success rate of approximately 98%. Our drilling inventory consists of approximately 3,000 potential locations, all of which are resource-style opportunities and approximately 5% of which are included in our estimated proved reserve base as of June 30, 2011. For information on the possible limitations on our ability to drill our potential locations, see Risk Factor - “Our identified drilling locations are scheduled out over many years, making them susceptible to uncertainties that could materially alter the occurrence or timing of their drilling. In addition, we may not be able to raise the substantial amount of capital that would be necessary to drill a substantial portion of our potential drilling locations.”
Recent developments
Merger
On January 31, 2011, Nytis USA entered into the Merger Agreement with SLSC, which was closed on February 14, 2011. At that date, SLSC acquired all of the issued and outstanding shares of Nytis USA from the Nytis USA stockholders, and thereby became the indirect owner of all of Nytis USA’s equity interests in Nytis LLC and Nytis PA, in exchange for the issuance by SLSC to the Nytis USA stockholders of 47,000,003 restricted shares of SLSC common stock (which then constituted 98.9% of SLSC’s issued and outstanding common stock), and Nytis USA became a wholly-owned subsidiary of SLSC, and Nytis LLC and Nytis PA became majority-owned indirect subsidiaries of SLSC.
In connection with the closing of the Merger, the officers and directors of Nytis USA became the officers and directors of SLSC. On May 2, 2011, SLSC’s name was changed to Carbon Natural Gas Company.
Purchase of Certain Assets of The Interstate Natural Gas Company, LLC and Alerion Drilling I, LLC
The Interstate Natural Gas Company
On June 29, 2011, we held the final closing of the February 14, 2011 ING APA, as amended, between Nytis LLC as buyer and ING and certain related parties, as sellers to purchase certain natural gas properties, natural gas gathering and compression facilities and other assets related thereto, located in eastern Kentucky and four counties in West Virginia.
The ING Assets are comprised of (i) some but not all of its leases and interests in oil and natural gas leases, and wells and wellbores thereon and related natural gas production equipment (ii) ING’s partnership interests in various general partnerships wherein ING is the managing general partner (at closing, Nytis LLC succeeded ING as managing general partner of these general partnerships, and owns ING’s partnership interests therein); (iii) ING’s partnership interests in other general partnerships in which it owns partnership interests but is not the managing general partner; (iv) ING’s interests in various farm-ins and similar agreements; (v) natural gas gathering and compression facilities; and (vi) various other contracts, vehicles and equipment of ING related to the assets purchased, and easements and rights-of-way relating to or used in connection with the ownership and operation of the assets acquired.
The partnership interests included in the ING Assets (described in (ii) and (iii) above) include interests in approximately 162 of the 430 producing wells acquired. In all of the partnerships, Nytis LLC succeeded ING as a full substitute partner; for those partnerships where ING was the managing general partner, Nytis LLC succeeded ING as managing general partner as well.
ING gathered its natural gas production through a series of mostly 2-4 inch gathering lines to numerous meter stations. At these meter stations the gas is delivered directly into interstate transmission lines or into other gatherers
or into one of several systems owned by local production companies for redelivery into interstate transmission. Nytis LLC has assumed certain obligations to transport gas from wells owned by ING (or its affiliates) that Nytis LLC did not acquire, as well as obligations under other contracts and agreements that Nytis LLC acquired on the ING Closing Date. Nytis LLC did not buy all of ING’s assets, or ING itself or its business generally.
On April 22 and June 29, 2011, Nytis LLC effected an initial (the “ING Initial Closing”) and subsequent close (the “ING Final Closing”). The ING Initial Closing was in accordance with the April 14, 2011 amendment to the ING APA (the “ING APA Amendment”). Under the ING APA Amendment, the parties agreed:
(i) To permit ING to use a portion of the Deposit (the “Property Tax Draw”) to pay property taxes due and owing on the natural gas properties being sold by ING to Nytis LLC pursuant to the APA. The amount of the Property Tax Draw was credited to the ING Total Purchase Price at the ING Final Closing.
(ii) To provide for two closings. The first closing was to be held on or before April 22, 2011 (extendable by either Nytis LLC or ING for a maximum of seven days), was for the purchase of approximately 45 natural gas wells (the “ING Initial Assets”), for not more than $1,519,932.
The second closing (the “Final Closing”) was to be held on or before May 23, 2011 (which date was extendable by either party but not beyond May 31, 2011) at which time Nytis LLC was to purchase the ING Assets (other than the ING Initial Assets) in accordance with the terms of the amended APA.
On April 22, 2011, Nytis LLC bought the ING Initial Assets at the Initial Closing, with a cash payment of $1,488,703, provided by a loan from Nytis LLC’s lending facility with Bank of Oklahoma.
On May 31, 2011 and again on June 14, 2011, Nytis LLC and ING agreed to further extensions of the Final Closing date, ultimately to a date no later than June 30, 2011.
Nytis LLC paid $450,000 as a Deposit into an escrow account when the original APA was signed. There remains $200,000 in the escrow account to cover possible indemnity claims that Nytis LLC may bring within one year of the ING Final Closing. The Effective Date of the acquisition under the APA was January 1, 2011. The original purchase price of $29.6 million under the APA was reduced pursuant to adjustments:
(i) up for all actual operating or capital expenditures or prepaid expenses attributable to the assets, (including if paid by ING at the ING Closing Date) paid by or on behalf of ING in connection with the assets and attributable to the period between the effective date and the ING Closing Date. These expenses included royalties, rentals and other charges; ad valorem and other taxes based on or measured by ownership of the assets, third-party expenses under joint operating agreements, and similar items;
(ii) down for environmental and/or title defects related to the assets; money received by ING from the sale of production of natural gas and liquids after the Effective Date; costs and expenses relating to the assets attributable to the time before the Effective date but not paid by ING; unpaid ad valorem and similar taxes which become due and payable or accrue prior to the effective date; the $450,000 escrow deposit; distributions by the general partnerships or other entities allocated to the interests acquired, which are attributable to production or sale of oil or natural gas that occurred after the Effective Date; and similar items;
(iii) down further for the $1,488,703 paid at the Initial Closing; and
(iv) down further pursuant to the ING APA Amendment for the exclusion of certain ING assets from the transaction.
At the Initial and Final Closings, we paid a total of approximately $24.2 million cash for the ING Assets: $1.5 million at the Initial Closing (funded through a loan from our credit facility), and $22.7 million at the Final Closing (from the Private Placement). Because completion of the financing through the Private Placement took longer than anticipated, in addition to the amount paid at the Final Closing, Nytis LLC paid ING $500,000 in return for a promissory note which was cancelled at the Final Close and the amount due under the note was credited against the
amount due ING at the Final Close and a total of $765,000 as additional purchase price adjustments and consideration for extending the date of the Final Closing to June 29, 2011.
Alerion Drilling I, LLC
Prior to the Final Closing, a portion of the ING Assets acquired by Nytis LLC from ING were held in the Alerion Partnership. ING’s interest in the Alerion Partnership was fifty percent (50%) and the remaining interest of the Alerion Partnership was owned by Alerion Drilling. Immediately prior to the Final Closing, ING and Alerion Drilling distributed all the assets of the Alerion Partnership to ING and Alerion Drilling, including the portion thereof (the “Alerion Partnership Assets”) that Nytis LLC purchased from ING under the ING APA.
On June 6, 2011, Nytis LLC entered into an Asset Purchase Agreement with Alerion Drilling (the “Alerion APA”) to acquire Alerion Drilling’s fifty percent (50%) interest in the Alerion Partnership Assets. On July 27, 2011, Nytis LLC closed the acquisition of Alerion’s interest in the Alerion Partnership Assets under the Alerion APA and, as a consequence acquired the remaining interest in the Alerion Partnership Assets that it had acquired from ING at the Final Closing. Nytis LLC’s acquisition of the Alerion Partnership Assets was also effective as of January 1, 2011. The purchase price paid by Nytis LLC for Alerion Drilling’s share of such assets was approximately $1.2 million, and adjusted:
(i) up, for all actual operating or capital expenditures or prepaid expenses attributable to the assets, (including if paid by Alerion Drilling at closing) paid by or on behalf of Alerion Drilling attributable to the period between January 1, 2011 and closing, including royalties, rentals and other charges; ad valorem and other taxes based on or measured by ownership of the assets, third-party expenses under joint operating agreements, and similar items; and
(ii) down for among others items: money received by Alerion Drilling from the sale of production of natural gas and liquids after January 1, 2011; costs and expenses relating to the assets attributable to the time before January 1, 2011 but not paid by Alerion Drilling; unpaid ad valorem and similar taxes which become due and payable or accrue prior to January 1, 2011; and distributions by the Alerion Partnership to Alerion Drilling attributable to production or sale of oil or natural gas that occurred after January 1, 2011.
Based on information provided by ING and its consultants and representatives, the assets acquired under the ING APA and the Aleriod APA comprise working and royalty interests in some 430 producing wells (substantially all of which were operated by ING and are now operated by Nytis LLC), and daily net production is estimated to be approximately 3,680 Mcf of gas and 10 barrels of liquids, or an equivalent daily production of 3,740 Mcfe. See “Preparation of Reserve Estimates” below for a description of our method of determining reserves. We negotiated the original $29.6 million purchase price based upon our preliminary understanding of reserves and their value going forward, relative to current and anticipated natural gas prices. See “Natural Gas Reserve Estimates”
CG&A, independent petroleum engineers, has prepared a reserve audit (reissued April 7, 2011) of the Company’s internal evaluation of the oil and natural gas assets to be purchased. The Company had estimated that the proved developed producing reserves were 45,000 barrels of oil and 29,225 MMcf of natural gas, with a present value of future net revenues before income taxes discounted at 10% (“Pre-tax PV-10”) of approximately $36.1 million. Our estimate of proved developed producing reserves were stated by CG&A to be, in the aggregate, reasonable within the established audit tolerance guidelines of plus or minus 10%.
The Company’s revised estimate is further subject to the uncertainty inherent in any reserves and value estimates. See “Risk Factors”.
The Private Placement
The Private Placement closed on June 29, 2010 with the sale of 44,444,444 common stock shares at a price of $0.45 per share and 100 shares of our Series A Convertible Preferred Stock at a price of $100,000 per share. There were 24 investors, including Yorktown Energy Partners IX, L.P. Twenty-three of the investors are selling securityholders under this prospectus. Yorktown Energy Partners IX, L.P. is not a selling securityholder under this prospectus. Because we had only 100,000,000 common shares authorized, with not enough shares to cover the additional
common shares needed to close the Private Placement at the pricing negotiated by the principal institutional investors, we issued preferred shares to Yorktown Energy Partners IX, L.P. which would automatically convert to common shares when the increase in authorized common shares (to 200,000,000 shares) was implemented under Delaware law. On July 18, 2011, the increase was so implemented, and we issued 22,222,222 common shares to Yorktown Energy Partners IX, L.P. Upon such conversion, Carbon had issued a total of 66,666,666 shares of common stock at $0.45 per share, for $30 million in gross proceeds.
Net proceeds from the Private Placement were principally used for our majority owned subsidiary, Nytis LLC, to complete the acquisitions from ING and Alerion described above. The remainder of the net proceeds will be used to fund future acquisitions and for general working capital purposes.
Of the 23 investors who are selling securityholders under this prospectus, four institutional investors negotiated assertively at arms-length with Carbon for hard deadlines on filing this prospectus with the SEC, and for cash liquidated damages to be paid for missing the deadlines and for other events deemed adverse to investors.
In conjunction with closing the Private Placement the company entered into the Registration Rights Agreement that imposes various obligations on the Company to register the resale of the shares of Company common stock issued in the Private Placement. The Registration Rights Agreement is further described under the heading “Description of Capital Stock” in this prospectus.
Change of Fiscal Year
On February 10, 2011, the board of directors of SLSC, unanimously approved amendments to amended and restated bylaws. The amendments became effective immediately upon their adoption by the board. Article XVI, Section 16.2 was amended to read as follows: “The fiscal year of the corporation shall end on December 31, unless otherwise fixed by resolution of the Board of Directors.” Previously SLSC’s fiscal year ended on March 31 of each year.
Revenue Sources
Our production revenues are entirely from the continental United States and for the year ended December 31, 2010 are comprised of 99% natural gas and 1% oil and liquids, and for the three months ended March 31, 2011 approximately 98% of our revenues were derived from the sale of natural gas. Gas prices reached historically high levels in recent years and reached over $13.00 per MMBtu in July 2008. Since then, natural gas prices have declined sharply to below $3.00 per MMBtu in September of 2009 and below $4.00 per MMBtu for portions of 2010 and 2011. Natural gas and oil prices are inherently volatile and are influenced by many factors outside of our control. To achieve more predictable cash flows and to reduce our exposure to downward price fluctuations, we use derivative instruments to hedge future sales prices on a portion of our production. We currently use fixed price swaps in which we receive a fixed price for future production in exchange for a payment of the variable market price received at the time future production is sold. At each period end we estimate the fair value of these swaps and recognize any unrealized gain or loss. We have not elected hedge accounting and, accordingly, the unrealized gains and losses on open positions are reflected currently in earnings. We expect continued volatility in the fair value of these swaps.
Principal Components of Our Cost Structure
· Lease operating and gathering, compression and transportation expenses. These are daily costs incurred to bring natural gas and oil out of the ground and to the market, together with the daily costs incurred to maintain our producing properties. Such costs also include maintenance, repairs and workover expenses related to our natural gas properties.
· Production taxes. Production taxes consist of severance and ad valorem taxes and are paid on natural gas and oil produced based on a percentage of market prices (not hedged prices) or at fixed rates established by federal, state or local taxing authorities.
· Depreciation, depletion, amortization and impairment. The Company uses the full cost method of accounting for oil and gas properties. All costs incidental to the acquisition, exploration and development of oil and gas properties, including costs of undeveloped leasehold, dry holes and leasehold equipment are capitalized. The Company historically has performed a ceiling test quarterly. The full cost ceiling test is a limitation on capitalized cost prescribed by the SEC. The ceiling test is not a fair value based measurement, rather it is a standardized mathematical calculation that compares the net capitalized costs of the Company’s full cost pool to estimated discounted cash flows. Should the net capitalized cost exceed the sum of the estimated discounted cash flows, a ceiling test write-down would be recognized to the extent of the excess.
As of December 31, 2009 the Company performs its ceiling tests based on average first-of-the-month prices during the twelve-month period prior to the reporting date pursuant to the SEC’s new “Modernization of Oil and Gas Reporting” rule. The Company’s oil and gas properties exceeded the ceiling limitation by $16.1 million for the year ended December 31, 2009, and by $7.3 million for the three months ended March 31, 2011. Based on the prior rules utilizing spot prices at the end of the year, the Company would not have exceeded its ceiling limitation. The Company did not have any ceiling test write downs for the year ended December 31, 2010.
Depletion is calculated using the capitalized costs in the full cost pool, including estimated asset retirement costs and the estimated future expenditures to be incurred in developing proved reserves, net of estimated salvage values and depleted based on a unit-of-production method.
· General and administrative expense. These costs include overhead, including payroll and benefits for our corporate staff, costs of maintaining our headquarters, costs of managing our production and development operations, franchise taxes, audit, tax, legal and other professional fees and legal compliance.
· Interest expense. We finance a portion of our working capital requirements and acquisitions with borrowings under our bank credit facilities. As a result, we incur interest expense that is affected by both fluctuations in interest rates and our financing decisions. We will likely continue to incur interest expense as we continue to grow.
· Income tax expense. Each of the Company’s subsidiaries file separate federal and state income tax returns; therefore, our provision for income taxes consists of the sum of our income tax provisions for each of the operating entities. We are subject to state and federal income taxes but historically have not been in a tax paying position for regular federal income taxes, primarily due to the current deductibility of intangible drilling costs (“IDC”). However, in 2010, due to the sale of our Pennsylvania assets we were subject to federal and state income taxes. We do pay some state income or franchise taxes where our IDC deductions do not exceed our taxable income or where state income or franchise taxes are determined on another basis. Collectively, our operating entities have generated net operating loss carryforwards which expire starting in 2025 through 2029. For the year ended December 31, 2009, we recognized the full value of these net operating losses on our balance sheets because our management team believed that it was more likely than not that we would have realized a future benefit equal to the full amount of the loss carryforward in 2010, subject to Alternative Minimum Tax limitation due to the disposition of the Company’s Pennsylvania assets in 2010. The amount of deferred tax assets considered realizable, however, could change in the near term as we generate taxable income or estimates of future taxable income are reduced.
Significant Acquisitions and Dispositions
In the second half of 2009, we initiated a divesture program targeted at selling certain non-core gas properties with the primary intent to use the proceeds from the divestures to reduce outstanding debt. During 2010, we completed our divestiture program with the sale of our Pennsylvania assets and used the proceeds to significantly reduce the outstanding amounts under our bank credit facilities. The following table presents a summary of our significant acquisitions and dispositions for the period ended June 30, 2011 and the years ended December 31, 2010 and 2009.
|
Primary Locations of |
|
Date Acquired |
|
Purchase Price |
| |
|
|
|
|
|
(in millions) |
| |
|
|
|
|
|
|
| |
|
Appalachian Basin (KY/WV) |
|
June 2011 |
|
$ |
25.9 |
|
|
Illinois Basin (IL/IN) |
|
December 2010 |
|
$ |
0.5 |
|
|
Illinois Basin (IL) |
|
September 2010 |
|
$ |
0.6 |
|
|
Appalachian Basin (KY) |
|
June 2010 |
|
$ |
1.3 |
|
|
Primary Locations of |
|
Date Disposed |
|
Sales Price |
| |
|
|
|
|
|
(in millions) |
| |
|
|
|
|
|
|
| |
|
Appalachian Basin (WV) |
|
September 2010 |
|
$ |
0.7 |
|
|
Appalachian Basin (PA) |
|
March-April 2010 |
|
$ |
30.3 |
|
|
Appalachian Basin (WV) |
|
July 2009 |
|
$ |
2.5 |
|
Our acquisitions in 2010 and through June 30, 2011 were financed with a combination of borrowings under our credit facilities, cash flow from operations, and funds we received through the sale of our common and preferred stock (later converted to common stock) in the Private Placement that closed on June 29, 2011.
Results of Operations
Three Months Ended March 31, 2011 Compared to Three Months Ended March 31, 2010.
The following discussion and analysis relates to items that have affected our results of operations for the three months ended March 31, 2011 and 2010. The following table sets forth, for the periods presented, selected historical statements of operations data. The information contained in the table below should be read in conjunction with the Company’s Consolidated Financial Statements for the period ending March 31, 2011 and Notes thereto.
|
|
|
Three Months Ended |
|
|
|
|
| |||||
|
|
|
March 31, |
|
Increase / |
|
Percent |
| |||||
|
|
|
2011 |
|
2010 |
|
(Decrease) |
|
Change |
| |||
|
Revenue: |
|
|
|
|
|
|
|
|
| |||
|
Oil and natural gas sales |
|
$ |
1,253,637 |
|
$ |
1,562,096 |
|
(308,459 |
) |
-20 |
% | |
|
Commodity derivative gain |
|
61,400 |
|
474,610 |
|
(413,210 |
) |
-87 |
% | |||
|
Other income |
|
97,858 |
|
49,826 |
|
48,032 |
|
96 |
% | |||
|
Total revenues |
|
$ |
1,412,895 |
|
$ |
2,086,532 |
|
(673,637 |
) |
-32 |
% | |
|
|
|
|
|
|
|
|
|
|
| |||
|
Expenses: |
|
|
|
|
|
|
|
|
| |||
|
Lease operating expenses |
|
242,868 |
|
257,809 |
|
(14,941 |
) |
-6 |
% | |||
|
Transportation costs |
|
155,392 |
|
42,026 |
|
113,366 |
|
270 |
% | |||
|
Production and property taxes |
|
107,477 |
|
97,554 |
|
9,923 |
|
10 |
% | |||
|
General and administrative |
|
1,443,976 |
|
1,092,519 |
|
351,457 |
|
32 |
% | |||
|
Depreciation, depletion and amortization |
|
375,522 |
|
432,003 |
|
(56,481 |
) |
-13 |
% | |||
|
Accretion of asset retirement obligations |
|
5,700 |
|
4,342 |
|
1,358 |
|
31 |
% | |||
|
Impairment of oil and gas properties |
|
7,317,221 |
|
— |
|
7,317,221 |
|
|
* | |||
|
Total expenses |
|
$ |
9,648,156 |
|
$ |
1,926,253 |
|
7,721,903 |
|
401 |
% | |
|
|
|
|
|
|
|
|
|
|
| |||
|
Operating (loss) income |
|
$ |
(8,235,261 |
) |
$ |
160,279 |
|
(8,395,540 |
) |
-5238 |
% | |
|
|
|
|
|
|
|
|
|
|
| |||
|
Other income and expenses: |
|
|
|
|
|
|
|
|
| |||
|
Interest income |
|
$ |
15 |
|
$ |
9,405 |
|
(9,390 |
) |
-100 |
% | |
|
Interest expense |
|
(78,032 |
) |
(231,124 |
) |
153,092 |
|
-66 |
% | |||
|
Loss on disposition of fixed asset |
|
(12,564 |
) |
— |
|
(12,564 |
) |
|
* | |||
|
Equity investment income |
|
(14,910 |
) |
— |
|
(14,910 |
) |
|
* | |||
|
Gain on sale of properties |
|
— |
|
9,876,510 |
|
(9,876,510 |
) |
|
* | |||
|
Total other income and expenses |
|
$ |
(105,491 |
) |
$ |
9,654,791 |
|
(9,760,282 |
) |
-101 |
% | |
|
|
|
|
|
|
|
|
|
|
| |||
|
Production data: |
|
|
|
|
|
|
|
|
| |||
|
Natural gas (MMcf) |
|
263,609 |
|
270,920 |
|
(7,311 |
) |
-3 |
% | |||
|
Oil and liquids (Bbl) |
|
1,109 |
|
99 |
|
1,010 |
|
1020 |
% | |||
|
Combined (MMcfe) |
|
270,263 |
|
271,514 |
|
(1,251 |
) |
0 |
% | |||
|
|
|
|
|
|
|
|
|
|
| |||
|
Average prices before effects of hedges: |
|
|
|
|
|
|
|
|
| |||
|
Natural gas (per Mcf) |
|
$ |
4.42 |
|
$ |
5.76 |
|
$ |
-1.34 |
|
-23 |
% |
|
Oil and liquids (per Bbl) |
|
$ |
80.51 |
|
$ |
29.48 |
|
$ |
51.03 |
|
173 |
% |
|
Combined (per Mcfe) |
|
$ |
4.64 |
|
$ |
5.75 |
|
$ |
-1.11 |
|
-19 |
% |
|
|
|
|
|
|
|
|
|
|
| |||
|
Average prices after effects of hedges**: |
|
|
|
|
|
|
|
|
| |||
|
Natural gas (per Mcf) |
|
$ |
4.65 |
|
$ |
7.51 |
|
$ |
-2.86 |
|
-38 |
% |
|
Oil and liquids (per Bbl) |
|
$ |
80.51 |
|
$ |
29.48 |
|
$ |
51.03 |
|
173 |
% |
|
Combined (per Mcfe) |
|
$ |
4.87 |
|
$ |
7.50 |
|
$ |
-2.63 |
|
-35 |
% |
|
|
|
|
|
|
|
|
|
|
| |||
|
Average costs (per Mcfe): |
|
|
|
|
|
|
|
|
| |||
|
Lease operating expenses |
|
$ |
0.90 |
|
$ |
0.95 |
|
$ |
-0.05 |
|
-5 |
% |
|
Transportation costs |
|
$ |
0.57 |
|
$ |
0.15 |
|
$ |
0.42 |
|
280 |
% |
|
Production and property taxes |
|
$ |
0.40 |
|
$ |
0.36 |
|
$ |
0.04 |
|
11 |
% |
|
Depreciation, depletion and amortization |
|
$ |
1.39 |
|
$ |
1.59 |
|
$ |
-0.20 |
|
-13 |
% |
|
* |
Not meaningful or applicable |
|
** |
Includes realized and unrealized commodity derivative gains |
Oil and natural gas sales- Revenues from sales of natural gas and oil and liquids decreased to $1.3 million for the three months ended March 31, 2011 from $1.6 million for the three months ended March 31, 2010, a decrease of 20%. This was primarily due to a 19% decrease in the average price per Mcfe and a decline in natural gas production attributed to the disposition of the Company’s Pennsylvania producing properties in the first quarter of 2010. Approximately 10% of the Company’s natural gas production and revenues for the first quarter of 2010 were generated from the Company’s Pennsylvania producing properties.
Commodity derivative gains- To achieve more predictable cash flows and to reduce our exposure to downward price fluctuations, we enter into derivative contracts using fixed or variable swap contracts when our management believes that favorable future sales prices for our natural gas production can be secured. Because we do not designate these derivatives as cash flow hedges, they do not receive hedge accounting treatment and all mark-to-markets gains or losses, as well as realized gains or losses on the derivative instruments, are currently recognized in our results of operations. The unrealized gains and losses represent the changes in the fair value of these swap agreements as the future strip prices fluctuate for the fixed price we will receive from future production. For the three months ended March 31, 2011 we had hedging gains of approximately $61,000 compared to hedging gains of approximately $475,000 for the three months ended March 31, 2010.
Lease operating expenses- Lease operating expenses decreased approximately 6% for the three months ended March 31, 2011 compared to the three months ended March 31, 2010 primarily due to the disposition of the Company’s Pennsylvania assets in the first quarter of 2010. On a per Mcfe basis, lease operating expenses decreased from $0.95 per Mcfe for the three months ended March 31, 2010 to $0.90 per Mcfe for the three months ended March 31, 2011.
Transportation costs- Transportation costs increased from approximately $42,000 for the three months ended March 31, 2010 to approximately $155,000 for the three months ended March 31, 2011 due to transportation price increases and transportation costs for new production from the Company’s Illinois properties. On a per Mcfe basis, these expenses increased from $.15 per Mcfe for the three months ended March 31, 2010 to $.57 per Mcfe for the three months ended March 31, 2011.
Production and property taxes- Production and property taxes increased from approximately $98,000 for the three months ended March 31, 2010 to approximately $107,000 for the three months ended March 31, 2011 primarily due to new natural gas production in the Illinois Basin and new oil production in the Appalachian Basin for the three months ended March 31, 2011. On a per Mcfe basis, these expenses increased from $.36 per Mcfe for the three months ended March 31, 2010 to $.40 per Mcfe for the three months ended March 31, 2011 due to an increase in taxable production revenues. The disposition of the Company’s Pennsylvania assets reduced production volumes and revenues, but did not decrease production and property taxes as revenues from these properties did not have a production or property tax burden. Although production volumes and related revenues are lower in the three months ended March 31, 2011 compared to the three months ended March 31, 2010, the per unit production and property taxes increased as the disposition of production that was not burdened with production and property taxes was partially replaced with production revenues that are burdened with production and property taxes.
Depreciation, depletion and amortization (DD&A)- DD&A decreased from approximately $432,000 for the three months ended March 31, 2010 to approximately $376,000 for the three months ended March 31, 2011 primarily due to the disposition of the Company’s Pennsylvania assets in March 2010 which lowered the Company’s full cost pool resulting in a lower depletion rate per Mcfe. On a per Mcfe basis, these expenses decreased from $1.59 per Mcfe for the three months ended March 31, 2010 to $1.39 per Mcfe for the three months ended March 31, 2011 primarily due to the reasons listed above.
Impairment of oil and gas properties- As of March 31, 2011, the Company’s full cost pool exceeded the ceiling limitation based on oil prices of $73.14 per barrel and natural gas prices of $4.09 per Mcf, by approximately $7.3 million. Therefore, the Company recognized an impairment expense of approximately $7.3 million for the three months ended March 31, 2011. A further decline in oil and natural gas prices could result in a further impairment of the Company’s oil and gas properties in subsequent periods. However, the potential acquisition of the ING producing natural gas properties may reduce the impact of a further decline of oil and natural gas prices on the ceiling limitation of the Company’s full cost pool.
General and administrative expenses- General and administrative expenses increased from $1.1 million for the three months ended March 31, 2010 to $1.4 million for the three months ended March 31, 2011 primarily due to costs totaling approximately $320,000 associated with merger with SLSC and with the pending acquisition of certain natural gas properties, natural gas gathering and compression facilities and other assets, all located in eastern Kentucky and four counties in West Virginia, from ING. Pursuant to the merger, Nytis USA was authorized, as manager of Nytis LLC, to offer to redeem all unvested, forfeitable restricted membership interests pursuant to the
Nytis LLC restricted membership interest plan. All of the restricted membership interests were redeemed in February 2011 for $300,000 which also contributed to the increase in general and administrative expenses in the first quarter of 2011 as compared with the first quarter of 2010.
Interest expense- Interest expense decreased from approximately $231,000 for the three months ended March 31, 2010 to approximately $78,000 for the three months ended March 31, 2011 primarily due to using a portion of the proceeds from the disposition of the Company’s Pennsylvania assets in the first quarter of 2010 to pay down approximately $23.5 million of debt on the Company’s credit facility.
Gain on sale of oil and gas properties- In March 2010, the Company sold all of its interests in the Pennsylvania assets owned by Nytis LLC and Nytis Pennsylvania to a third party for approximately $30.2 million, net of normal adjustments and transaction fees, with an effective date of February 1, 2010. Proceeds from the sale were used to reduce outstanding borrowings due under the Company’s credit facility and to reduce amounts due Nytis Exploration Company. Because the sale of these assets significantly altered the relationship between capitalized costs and proved reserves, the Company recorded a gain in the first quarter of 2010.
Year Ended December 31, 2010 Compared to Year Ended December 31, 2009.
The following discussion and analysis relates to items that have affected our results of operations for the year ended December 31, 2010 and 2009. The following table sets forth, for the periods presented, selected historical statements of operations data. The information contained in the table below should be read in conjunction with the audited consolidated financial statements contained in this prospectus.
|
|
|
Twelve Months Ended |
|
|
|
|
| |||||
|
|
|
December 31, |
|
Increase / |
|
Percent |
| |||||
|
(in thousands) |
|
2010 |
|
2009 |
|
(Decrease) |
|
Change |
| |||
|
Revenue: |
|
|
|
|
|
|
|
|
| |||
|
Oil and natural gas sales |
|
$ |
4,880 |
|
$ |
5,676 |
|
$ |
(796 |
) |
-14.0 |
% |
|
Commodity derivative gain |
|
692 |
|
227 |
|
465 |
|
204.8 |
% | |||
|
Other income |
|
360 |
|
335 |
|
25 |
|
7.5 |
% | |||
|
Total revenues |
|
$ |
5,932 |
|
$ |
6,238 |
|
$ |
(306 |
) |
-4.9 |
% |
|
|
|
|
|
|
|
|
|
|
| |||
|
Expenses: |
|
|
|
|
|
|
|
|
| |||
|
Lease operating expenses |
|
$ |
1,053 |
|
$ |
1,135 |
|
$ |
(82 |
) |
-7.2 |
% |
|
Transportation costs |
|
444 |
|
393 |
|
51 |
|
13.0 |
% | |||
|
Production and property taxes |
|
430 |
|
564 |
|
(134 |
) |
-23.8 |
% | |||
|
General and administrative |
|
3,095 |
|
2,672 |
|
423 |
|
15.8 |
% | |||
|
Depreciation, depletion and amortization |
|
1,540 |
|
2,625 |
|
(1,085 |
) |
-41.3 |
% | |||
|
Accretion of asset retirement obligations |
|
18 |
|
43 |
|
(25 |
) |
-60.5 |
% | |||
|
Impairment of oil and gas properties |
|
— |
|
16,077 |
|
(16,077 |
) |
-100.0 |
% | |||
|
Total expenses |
|
$ |
6,580 |
|
$ |
23,509 |
|
$ |
(16,929 |
) |
-72.0 |
% |
|
|
|
|
|
|
|
|
|
|
| |||
|
Operating loss |
|
$ |
648 |
|
$ |
17,271 |
|
$ |
(16,623 |
) |
-96.0 |
% |
|
|
|
|
|
|
|
|
|
|
| |||
|
Other income and expenses: |
|
|
|
|
|
|
|
|
| |||
|
Interest income |
|
39 |
|
38 |
|
1 |
|
2.6 |
% | |||
|
Interest expense |
|
(352 |
) |
(1,167 |
) |
815 |
|
-69.8 |
% | |||
|
Equity investment income |
|
23 |
|
— |
|
23 |
|
100.0 |
% | |||
|
Gain on sale of properties |
|
10,104 |
|
— |
|
10,104 |
|
|
* | |||
|
Total other income and expenses |
|
$ |
9,814 |
|
$ |
(1,129 |
) |
$ |
10,943 |
|
|
* |
|
|
|
|
|
|
|
|
|
|
| |||
|
Production data: |
|
|
|
|
|
|
|
|
| |||
|
Natural gas (MMcf) |
|
1,000 |
|
1,336 |
|
(336 |
) |
-25.1 |
% | |||
|
Oil and liquids (Bbl) |
|
1,827 |
|
870 |
|
957 |
|
110.0 |
% | |||
|
Combined (MMcfe) |
|
1,011 |
|
1,341 |
|
(330 |
) |
-24.6 |
% | |||
|
|
|
|
|
|
|
|
|
|
| |||
|
Average prices before effects of hedges: |
|
|
|
|
|
|
|
|
| |||
|
Natural gas (per Mcf) |
|
$ |
4.77 |
|
$ |
4.23 |
|
$ |
0.54 |
|
12.8 |
% |
|
Oil and liquids (per Bbl) |
|
$ |
58.65 |
|
$ |
32.16 |
|
$ |
26.49 |
|
82.4 |
% |
|
Combined (per Mcfe) |
|
$ |
4.83 |
|
$ |
4.23 |
|
$ |
0.60 |
|
14.2 |
% |
|
|
|
|
|
|
|
|
|
|
| |||
|
Average prices after effects of hedges**: |
|
|
|
|
|
|
|
|
| |||
|
Natural gas (per Mcf) |
|
$ |
5.47 |
|
$ |
4.40 |
|
$ |
1.07 |
|
24.3 |
% |
|
Oil and liquids (per Bbl) |
|
$ |
58.65 |
|
$ |
32.16 |
|
$ |
26.49 |
|
82.4 |
% |
|
Combined (per Mcfe) |
|
$ |
5.51 |
|
$ |
4.40 |
|
$ |
1.11 |
|
25.2 |
% |
|
|
|
|
|
|
|
|
|
|
| |||
|
Average costs (per Mcfe): |
|
|
|
|
|
|
|
|
| |||
|
Lease operating expenses |
|
$ |
1.04 |
|
$ |
0.85 |
|
$ |
0.19 |
|
22.4 |
% |
|
Transportation costs |
|
$ |
0.44 |
|
$ |
0.29 |
|
$ |
0.15 |
|
51.7 |
% |
|
Production and property taxes |
|
$ |
0.43 |
|
$ |
0.42 |
|
$ |
0.01 |
|
2.4 |
% |
|
Depreciation, depletion and amortization |
|
$ |
1.52 |
|
$ |
1.96 |
|
$ |
(0.44 |
) |
-22.4 |
% |
|
* |
Not meaningful or applicable |
|
** |
Includes realized and unrealized commodity derivative gains |
Discussion of the components of the changes in our results for the year ended December 31, 2010 compared to December 31, 2009. We have completed a significant number of acquisition and divestiture transactions of gas properties in 2010 which affect the comparability of the results for the time periods presented below. Details of our acquisition and divesture transactions are included in “Management’s Discussion and Analysis of Financial Condition and Results of Operations-Significant Acquisitions and Dispositions” and in Note 4 to the audited consolidated financial statements.
Oil and natural gas sales- Revenues from sales of natural gas and oil and liquids decreased to $4.9 million for the year ended December 31, 2010 from $5.7 million for the year ended December 31, 2009, a decrease of 14%. This was primarily due to a decline in natural gas production attributed to the disposition of the Company’s Pennsylvania producing properties in March 2010. The production decline was partially offset by a 14% increase in the average price per Mcfe and an increase in oil and liquids production.
Commodity derivative gains- To achieve more predictable cash flows and to reduce our exposure to downward price fluctuations, we enter into derivative contracts using fixed or variable swap contracts when our management believes that favorable future sales prices for our natural gas production can be secured. Because we do not designate these derivatives as cash flow hedges, they do not receive hedge accounting treatment and all mark-to-markets gains or losses, as well as realized gains or losses on the derivative instruments, are currently recognized in our results of operations. The unrealized gains and losses represent the changes in the fair value of these swap agreements as the future strip prices fluctuate for the fixed price we will receive from future production. For the year ended December 31, 2010 we had hedging gains of approximately $692,000 compared to hedging gains of approximately $227,000 for the year ended December 31, 2009.
Lease operating expenses- Lease operating expenses decreased approximately 7% for the year ended December 31, 2010 compared with the year ended 2009 primarily due to the disposition of the Company’s Pennsylvania assets in March 2010. On a per Mcfe basis, lease operating expenses increased from $0.85 per Mcfe for the year ended December 31, 2009 to $1.04 for the year ended December 31, 2010 primarily due to start up operations in the Illinois Basin in 2010.
Transportation costs- Transportation costs increased from approximately $393,000 for the year ended December 31, 2009 to approximately $444,000 for the year ended December 31, 2010 due to transportation price increases. The reduction of transportation costs associated with the disposition of the Company’s Pennsylvania assets in March 2010 was partially offset by the increase in transportation costs incurred on new production from the Company’s Illinois properties. On a per Mcfe basis, these expenses increased from $.29 per Mcfe for the year ended December 31, 2009 to $.44 per Mcfe for the year ended December 31, 2010.
Production and property taxes- Production and property taxes decreased from approximately $564,000 for the year ended December 31, 2009 to approximately $430,000 for the year ended December 31, 2010 primarily due to the decrease in natural gas sales for year ended December 31, 2010 compared to 2009 and a decrease in ad valorem taxes on the Company’s West Virginia assets for the year ended December 31, 2010 compared to 2009 due to a reassessment of the Company’s ad valorem tax liability as of December 31, 2009. On a per Mcfe basis, these expenses increased from $.42 per Mcfe for the year ended December 31, 2009 to $.43 per Mcfe for the year ended December 31, 2010 due to lower production volumes in 2010 compared to 2009 relative to the decrease in production and property tax expense.
Depreciation, depletion and amortization (DD&A)- DD&A decreased from $2.6 million for the year ended December 31, 2009 to $1.5 million for the year ended December 31, 2010 primarily due to the disposition of the Company’s Pennsylvania assets in March 2010 and a ceiling test write-down taken by the Company in the fourth quarter of 2009 which lowered the Company’s full cost pool resulting in a lower depletion rate per Mcfe. On a per Mcfe basis, these expenses decreased from $1.96 per Mcfe for the year ended December 31, 2009 to $1.52 per Mcfe for the year ended December 31, 2010 primarily due to the reasons listed above.
General and administrative expenses- General and administrative expenses increased from $2.7 million for the year ended December 31, 2009 to $3.1 million for the year ended December 31, 2010 primarily due to increased administrative service charges from Nytis Exploration Company due to services performed in the disposition of the Company’s Pennsylvania assets in March 2010 and staff bonuses paid to Nytis LLC employees for the sale of the Company’s Pennsylvania assets in March 2010.
Interest expense- Interest expense decreased from approximately $1.2 million for the year ended December 31, 2009 to approximately $352,000 for the year ended December 31, 2010 primarily due to the disposition of the Company’s Pennsylvania assets in March 2010 and using certain of the proceeds to pay down approximately $23.5 million of debt on the Company’s credit facility.
Liquidity and Capital Resources
Our exploration, development, and acquisition activities require us to make significant operating and capital expenditures. Historically, we have used cash flow from operations and our bank credit facilities as our primary sources of liquidity, and, as market conditions have permitted, we have engaged in asset monetization transactions, such as the divestiture of our Pennsylvania assets.
Changes in the market prices for natural gas directly impact our level of cash flow generated from operations. Natural gas made up approximately 99% of our hydrocarbon production in 2010, and for the three months ended March 31, 2011, natural gas made up approximately 98% of our hydrocarbon production; and, as a result, our operations and cash flow are more sensitive to fluctuations in the market price for natural gas than to fluctuations in the market price for oil and liquids. We employ a commodity hedging strategy as an attempt to moderate the effects of wide fluctuations in commodity prices on our cash flow. As of June 30, 2011, we have outstanding hedges of 120,000 MMbtu for 2011 at an average price of $5.03 per MMbtu and 160,000 MMbtu for 2012 at an average price of $5.11 per MMbtu. This level of hedging will provide a measure of certainty of the cash flow that we will receive for a portion of our production in 2011 and 2012. However, future hedging activities may result in reduced income or even financial losses to us. See “Risk Factors—Our future use of hedging arrangements could result in financial losses or reduce income,” for further details of the risks associated with our hedging activities. In the future, we may determine to increase or decrease our hedging positions. As of June 30, 2011, our derivative counterparty was party to our credit facility, or its affiliates. For further information concerning our derivative contracts. See “Quantitative and Qualitative Disclosures About Market Risk—Commodity Price Risk,” below.
The other primary source of liquidity is our U.S. credit facility (described below), which had an aggregate borrowing base of $20.0 million as of June 30, 2011. These facilities are used to fund daily operations and to fund acquisitions and refinance debt, as needed and if available. The credit facilities are secured by a portion of our assets and mature in May 2014. See—“Bank Credit Facilities” below for further details.
Our ability to access the debt and equity capital markets on economical terms is affected by general economic conditions, the domestic and global financial markets, our operational and financial performance, the value of our equity securities, prevailing commodity prices, and other macroeconomic factors outside of our control.
We believe that our current cash and cash equivalents, cash flows provided by operating activities, and the approximately $10.2 million of funds available under our credit facility as of June 30, 2011 will be sufficient to fund our normal recurring operating needs, anticipated capital expenditures (other than the potential acquisition of additional natural gas and oil properties), and our contractual obligations. However, if our revenue and cash flow decrease in the future as a result of a deterioration in domestic and global economic conditions or a significant decline in commodity prices, we may elect to reduce our planned capital expenditures. We believe that this financial flexibility to adjust our spending levels will provide us with sufficient liquidity to meet our financial obligations should economic conditions deteriorate. See “Risk Factors,” for a discussion of the risks and uncertainties that affect our business and financial and operating results.
Bank Credit Facility
Nytis LLC has a bank credit facility which consists of a $50.0 million credit facility (the “Credit Facility”) with Bank of Oklahoma. The Credit Facility will mature in May 2014 and is guaranteed by Nytis USA. Our availability under the Credit Facility is governed by a borrowing base (the “Borrowing Base”), which at June 30, 2011 was $20.0 million. The determination of the Borrowing Base is made by the lenders in their sole discretion, on a semi-annual basis, taking into consideration the estimated value of our natural gas properties in accordance with the lenders’ customary practices for natural gas loans. The available borrowing amount under the Credit Facility could increase or decrease based on such redetermination. The next redetermination of the Borrowing Base is expected to occur in November 2011. In addition to the semi-annual redeterminations, Nytis LLC and the lenders each have discretion at any time, but not more often than once during a calendar year, to have the Borrowing Base redetermined.
A lowering of the Borrowing Base could require us to repay indebtedness in excess of the Borrowing Base in order to cover the deficiency.
The facility has variable interest rates based upon the ratio of outstanding debt to the borrowing base. Interest rates are based on either an Alternative Base Rate or LIBOR. The portion of the loan based on an “Alternate Base Rate” is determined by the rate per annum equal to 1.5% plus the greatest of the following: (a) the Federal Funds Rate for such day plus one-half of one percentage point, (b) the Prime Rate for such day or (c) LIBOR for a one-month LIBOR Interest Period plus one percentage point. The portion based on LIBOR is determined by the rate per annum
equal to LIBOR plus between 2.5% and LIBOR plus 3.25% for each LIBOR tranche.For all debt outstanding regardless if the loan is based on an Alternative Base Rate or LIBOR, there is a minimum floor of 4.5% per annum.
The Credit Facility includes terms that place limitations on certain types of activities, including restrictions or requirements with respect to additional debt, liens, asset sales, hedging activities, investments, dividends, mergers, and acquisitions, and requires satisfaction of a current ratio (the ratio of current assets to current liabilities) of 1.0 to 1.0 and a maximum Funded Debt Ratio (the ratio of the outstanding balance of all interest bearing indebtedness to the sum of EBITDAX (net income plus interest expense, income taxes, depreciation, depletion, amortization, exploration and impairment expenses and other non-cash charges)) of 4.25 to 1.0, for the most recently completed four consecutive fiscal quarters as of the end of any fiscal quarter. If we were to fail to perform our obligations under these covenants or other covenants and obligations, it could cause an event of default and the Credit Facility could be terminated and amounts outstanding could be declared immediately due and payable by the lenders, subject to notice and, in certain cases, cure periods. Such events of default include non-payment, breach of warranty, non-performance of financial covenants, default on other indebtedness, certain adverse judgments, change of control, and a failure of the liens securing the Credit Facility. In addition, bankruptcy and insolvency events with respect to Nytis or certain of its subsidiaries will result in an automatic acceleration of the indebtedness under the Credit Facility.
Under the Credit Facility, we are required to mortgage and grant a security interest in 80% of the present value of our proved natural gas properties. Under certain circumstances, we could be obligated to pledge additional assets as collateral.
Of the $50.0 million total nominal amount under the Credit Facility, Bank of Oklahoma held 100% of the total commitments.
As of June 30, 2011 there was $9.8 million in borrowings under the Credit Facility.
In addition, the credit facility includes a hedging component that provides a line of credit under commodity swap, exchange, collar, cap and fixed price agreements and agreements designated to protect the Company against changes in interest and currency exchange rates. The maximum amount of credit on this line is $5.0 million.
Historical Cash Flow
For the Three Months Ended March 31, 2011 and March 31, 2010
Net cash provided by (used in) operating activities, net cash provided by (used in) investing activities, and net cash provided by (used in) financing activities for the three months ended March 31, 2011 and 2010 were as follows:
|
|
|
Three Months Ended |
| ||||
|
|
|
March 31, |
| ||||
|
(in thousands) |
|
2011 |
|
2010 |
| ||
|
|
|
|
|
|
| ||
|
Net cash provided by (used in) operating activities |
|
$ |
(2,645 |
) |
$ |
(2,855 |
) |
|
Net cash provided by (used in) investing activities |
|
$ |
(692 |
) |
$ |
27,287 |
|
|
Net cash provided by (used in) financing activities |
|
$ |
2,871 |
|
$ |
(23,543 |
) |
Net cash provided by or used in operating activities is primarily affected by production volumes and commodity prices, net of the effects of settlements of our derivative contracts, and changes in working capital. The increase in operating cash flows of $210,000 for the three months ended March 31, 2011 as compared to the three months ended March 31, 2010 was primarily due to a reduction in amounts due related parties, offset in part, by increases in working capital other than working capital attributed to related parties.
Net cash provided by (used in) investing activities is primarily comprised of the acquisition, exploration, and development of natural gas properties net of dispositions of natural gas properties. The decrease in investing cash flows of $28.0 million for the three months ended March 31,
2011 as compared to the three months ended March 31, 2010 was primarily due to the proceeds received by the disposition of the Company’s Pennsylvania assets in the first quarter of 2010.
The increase in financing cash flows of $26.4 million for the three months ended March 31, 2011 as compared to the three months ended March 31, 2010 was primarily due to the net repayments of bank borrowings of $23.5 million from proceeds received by the disposition of the Company’s Pennsylvania assets in the first quarter of 2010.
Fiscal 2009 and 2010
Net cash provided by (used in) operating activities, net cash provided by (used in) investing activities, and net cash provided by (used in) financing activities for the years ended December 31, 2010 and 2009 were as follows:
|
|
|
Year Ended December 31, |
| ||||
|
(in thousands) |
|
2010 |
|
2009 |
| ||
|
|
|
|
|
|
| ||
|
Net cash provided by (used in) operating activities |
|
$ |
(2,680 |
) |
$ |
2,155 |
|
|
Net cash provided by (used in) investing activities |
|
$ |
25,567 |
|
$ |
(1,183 |
) |
|
Net cash provided by (used in) financing activities |
|
$ |
(22,251 |
) |
$ |
(1,459 |
) |
Net cash provided by operating activities is primarily affected by production volumes and commodity prices, net of the effects of settlements of our derivative contracts, and changes in working capital. The decrease in operating cash flows operating activities of $4.8 million for the year ended December 31, 2010 as compared to the year ended December 31, 2009 was primarily due to a reduction of $2.4 million in amounts due related parties for the year ended December 31, 2010 compared to an increase in amounts due related parties of approximately $1.0 million for the year ended December 31, 2009.
Net cash provided by (used in) investing activities is primarily comprised of the acquisition, exploration, and development of natural gas properties net of dispositions of natural gas properties. The increase in investing cash flows $26.8 million for the year ended December 31, 2010 as compared to the year ended December 30, 2009 was primarily due to the proceeds received by the disposition of the Company’s Pennsylvania assets in 2010.
The decrease in financing cash flows of $20.8 million for year ended December 31, 2010 as compared to the year ended December 31, 2009 was primarily due to the net repayments of bank borrowings of $20.9 million in 2010.
Capital Expenditures
For the Three Months Ended March 31, 2011 and March 31, 2010
Capital expenditures for the three months ended March 31, 2011 and 2010 are summarized in the following table:
|
|
|
Three Months Ended |
| ||||
|
(in thousands) |
|
2011 |
|
2010 |
| ||
|
|
|
|
|
|
| ||
|
Acquisition of oil and gas properties: |
|
|
|
|
| ||
|
Unevaluated properties |
|
$ |
158 |
|
$ |
25 |
|
|
Drilling and development |
|
287 |
|
250 |
| ||
|
Pipeline and gathering |
|
14 |
|
15 |
| ||
|
Other |
|
71 |
|
— |
| ||
|
Total capital expenditures |
|
$ |
530 |
|
$ |
290 |
|
Due to the significant downturn in the overall economy and its impact on the price for natural gas, we chose to reduce our capital expenditures and drilling activity for the three months ended March 31, 2011 and 2010 by keeping our exploration and development capital spending near our cash flows. Primary factors impacting the level
of our capital expenditures include natural gas prices, the volatility in these prices, the cost and availability of oil field services, general economic and market conditions, and weather disruptions.
Fiscal 2010 and 2009
Capital expenditures for the years ended December 31, 2010 and 2009 are summarized in the following table:
|
|
|
Year Ended December 31, |
| ||||
|
(in thousands) |
|
2010 |
|
2009 |
| ||
|
|
|
|
|
|
| ||
|
Acquisition of oil and gas properties |
|
|
|
|
| ||
|
Unevaluated properties |
|
$ |
81 |
|
$ |
29 |
|
|
Oil and gas properties |
|
1,806 |
|
— |
| ||
|
Drilling and development |
|
2,825 |
|
3,105 |
| ||
|
Pipeline and gathering (1) |
|
— |
|
465 |
| ||
|
Other |
|
98 |
|
75 |
| ||
|
Total capital expenditures |
|
$ |
4,810 |
|
$ |
3,674 |
|
Note:
(1) Includes an investment in a gathering system which is accounted for using the equity method of accounting.
Due to the significant downturn in the overall economy in late 2008 and its impact on the price for natural gas, we chose to reduce our capital expenditures and drilling activity in 2010 and 2009 by keeping our exploration and development capital spending near our cash flows. As a result of increased liquidity in 2010 from our divestiture program, higher commodity prices, and focusing our development on areas with expected high growth potential, we increased our acquisition activity in 2010 compared to 2009. Primary factors impacting the level of our capital expenditures include natural gas prices, the volatility in these prices, the cost and availability of oil field services, general economic and market conditions, and weather disruptions.
Capital expenditures reflected in the tables above differ from the amounts shown in the statements of cash flows in the consolidated financial statements because amounts reflected in the table include changes in accounts payable from the previous reporting period for capital expenditures, while the amounts in the statements of cash flow in the consolidated financial statements are presented on a cash basis.
Off-balance Sheet Arrangements
From time-to-time, we enter into off-balance sheet arrangements and transactions that can give rise to off-balance sheet obligations. As of June 30, 2011, the off-balance sheet arrangements and transactions that we have entered into include (i) operating lease agreements and (ii) contractual obligations for which the ultimate settlement amounts are not fixed and determinable, such as natural gas transportation commitments and derivative contracts that are sensitive to future changes in commodity prices or interest rates. We do not believe that any of these arrangements are reasonably likely to materially affect our liquidity or availability of, or requirements for, capital resources.
Critical Accounting Policies, Estimates, Judgments, and Assumptions
Full Cost Method of Accounting
The accounting for our business is subject to special accounting rules that are unique to the natural gas and oil industry. There are two allowable methods of accounting for natural gas and oil business activities: the full cost method and the successful efforts method. The differences between the two methods can lead to significant variances in the amounts reported in financial statements. We have elected to follow the full cost method, which is described below.
Under the full cost method, separate cost centers are maintained for each country in which we incur costs. All costs incurred in the acquisition, exploration, and development of properties (including costs of surrendered and abandoned leaseholds, delay lease rentals, dry holes, and overhead related to exploration and development activities)
are capitalized. The fair value of estimated future costs of site restoration, dismantlement, and abandonment activities is capitalized, and a corresponding asset retirement obligation liability is recorded.
Capitalized costs applicable to each full cost center are depleted using the units of production method based on conversion to common units of measure using one barrel of oil as an equivalent to six thousand cubic feet of natural gas. Changes in estimates of reserves or future development costs are accounted for prospectively in the depletion calculations. Based on this accounting policy, our June 30, 2011 and December 31, 2010 and 2009 reserves estimates were used for our respective period depletion calculations. These reserves estimates were calculated in accordance with the SEC’s “Modernization of Oil and Natural Gas Reporting” rule, which was first effective for 2009 year-end reporting. See “Business—Reserves” and Notes 1 and 2 to the audited consolidated financial statements included in this prospectus for a more complete discussion of the rule and our estimated proved reserves as of June 30, 2011 and December 31, 2010 and 2009.
Companies that use the full cost method of accounting for natural gas and oil exploration and development activities are required to perform a ceiling test for each cost center. The full cost ceiling test is a limitation on capitalized costs prescribed by SEC Regulation S-X Rule 4-10. The ceiling test is not a fair value based measurement. Rather, it is a standardized mathematical calculation. The test determines a limit, or ceiling, on the book value of natural gas properties. That limit is basically the after tax present value of the future net cash flows from proved natural gas reserves. This ceiling is compared to the net book value of the natural gas and oil properties reduced by any related net deferred income tax liability. If the net book value reduced by the related deferred income taxes exceeds the ceiling, an impairment or non-cash write-down is required. Our December 31, 2009 ceiling test calculation, which included a ceiling based on natural gas and oil reserves calculated using twelve-month average prices pursuant to the SEC’s “Modernization of Oil and Natural Gas Reporting” rule which was effective for the first time as of December 31, 2009, resulted in the Company’s natural gas and oil properties exceeding the ceiling limitation by approximately $16.1 million, and accordingly the Company took a non-cash charge to income for approximately $16.1 million for the year ended December 31, 2009. The Company did not have any ceiling test write downs for the year ended December 31, 2010. For the three months ended March 31, 2011, the Company recorded an impairment expense of approximately $7.3 million. No impairment expense was recorded during the three months ended March 31, 2010.
In countries or areas where the existence of proved reserves has not yet been determined, leasehold costs, seismic costs, and other costs incurred during the exploration phase remain capitalized as unproved property costs until proved reserves have been established or until exploration activities cease. Investments in unproved properties are not depleted pending the determination of the existence of proved reserves. If exploration activities result in the establishment of proved reserves, amounts are reclassified as proved properties and become subject to depreciation, depletion, and amortization, and the application of the ceiling limitation. Unproved properties are assessed periodically to ascertain whether impairment has occurred. Unproved properties whose costs are individually significant area ssessed individually by considering the primary lease terms of the properties, the holding period of the properties, and geographic and geologic data obtained relating to the properties. Where it is not practicable to individually assess properties whose costs are not individually significant, such properties are grouped for purposes of assessing impairment. The amount of impairment assessed is added to the costs to be amortized in the appropriate full cost pool.
Under the alternative successful efforts method of accounting, surrendered, abandoned, and impaired leases, delay lease rentals, exploratory dry holes, and overhead costs are expensed as incurred. Capitalized costs are depleted on a property-by-property basis. Impairments are also assessed on a property-by-property basis and are charged to expense when assessed.
The full cost method is used to account for our natural gas and oil exploration and development activities, because we believe it appropriately reports the costs of our exploration programs as part of an overall investment in discovering and developing proved reserves.
Natural Gas Reserve Estimates
Our estimates of proved reserves are based on the quantities of natural gas and oil that geological and engineering data demonstrate, with reasonable certainty, to be recoverable in future years from known reservoirs under existing
economic and operating conditions. The accuracy of any reserve estimate is a function of the quality of available data, engineering and geological interpretation, and judgment. For example, we must estimate the amount and timing of future operating costs, production and property taxes, development costs, and workover costs, all of which may in fact vary considerably from actual results. In addition, as prices and cost levels change from year to year, the estimate of proved reserves also changes. Any significant variance in these assumptions could materially affect the estimated quantity and value of our reserves. Despite the inherent uncertainty in these engineering estimates, our reserves are used throughout our financial statements. For example, since we use the units-of-production method to amortize our natural gas and oil properties, the quantity of reserves could significantly impact our DD&A expense. Our natural gas and oil properties are also subject to a “ceiling test” limitation based in part on the quantity of our proved reserves.
Reference should be made to “Reserves” under “Description of Business,” and “Reserve estimates depend on many assumptions that may turn out to be inaccurate. Any material inaccuracies in these reserve estimates or underlying assumptions will materially affect the quantities and present value of our reserves,” under “Risk Factors”.
Accounting for Derivative Instruments
We recognize all derivative instruments as either assets or liabilities at fair value. Under the provisions of authoritative derivative accounting guidance, we may or may not elect to designate a derivative instrument as a hedge against changes in the fair value of an asset or a liability (a “fair value hedge”) or against exposure to variability in expected future cash flows (a “cash flow hedge”). The accounting treatment for the changes in fair value of a derivative instrument is dependent upon whether or not a derivative instrument is a cash flow hedge or a fair value hedge, and upon whether or not the derivative is designated as a hedge. Changes in fair value of a derivative designated as a cash flow hedge are recognized, to the extent the hedge is effective, in other comprehensive income until the hedged item is recognized in earnings. Changes in the fair value of a derivative instrument designated as a fair value hedge, to the extent the hedge is effective, have no effect on the statement of operations, because changes in fair value of the derivative offsets changes in the fair value of the hedged item. Where hedge accounting is not elected or if a derivative instrument does not qualify as either a fair value hedge or a cash flow hedge, changes in fair value are recognized in earnings. We have elected not to use hedge accounting and as a result, all changes in the fair values of our derivative instruments are recognized in natural gas and oil sales in our Consolidated Statements of Operations.
As of June 30, 2011, the fair value of the natural gas derivative agreements was a current asset of approximately $112,000, and at December 31, 2010, the fair value of the natural gas derivative agreements was a current asset of approximately $171,000. The fair value measurement of the commodity derivative assets and liabilities are measured based upon our valuation model that considers various inputs including (a) quoted forward prices for commodities, (b) time value, (c) notional quantities, (d) current market and contractual prices for the underlying instruments; and (e) the counterparty’s credit risk. The unobservable inputs related to the volatility of the oil and gas commodity market are very significant in these calculations. Continued volatility in these markets could have a significant impact on the fair value of our derivative contracts. See Note 3 to the audited consolidated financial statements included in this prospectus for further discussion. The values we report in our financial statements change as these estimates are revised to reflect changes in market conditions or other factors, many of which are beyond our control.
Due to the volatility of natural gas prices, the estimated fair values of our commodity derivative instruments are subject to large fluctuations from period to period and we expect the volatility to continue. Actual gains or losses recognized related to our commodity derivative instruments will likely differ from those estimated at December 31, 2010 and June 30, 2011 and will depend exclusively on the price of the commodities on the specified settlement dates provided by the derivative contracts.
Valuation of Deferred Tax Assets
We use the asset and liability method of accounting for income taxes. Under this method, income tax assets and liabilities are determined based on differences between the financial statement carrying values of assets and liabilities and their respective income tax bases (temporary differences). Income tax assets and liabilities are measured using the tax rates expected to be in effect when the temporary differences are likely to reverse. The effect
on income tax assets and liabilities of a change in tax rates is included in earnings in the period in which the change is enacted. The book value of income tax assets is limited to the amount of the tax benefit that is more likely than not to be realized in the future.
In assessing the need for a valuation allowance on our deferred tax assets, management considers whether it is more likely than not that some portion or all of the deferred tax assets will be realized. The ultimate realization of deferred tax assets is dependent upon whether future book income is sufficient to reverse existing temporary differences that give rise to deferred tax assets, as well as whether future taxable income is sufficient to utilize net operating loss and credit carryforwards. Assessing the need for, or the sufficiency of, a valuation allowance requires the evaluation of all available evidence, both negative and positive. Negative evidence considered by management primarily included a recent history of book losses which were driven entirely from ceiling test write-downs, which are not fair value based measurements. Positive evidence considered by management included forecasted book income over a reasonable period of time and the utilization of substantially all of our net operating loss (“NOL”) carryforwards in 2010 due primarily to a substantial tax gain associated with the disposition of the Company’s Pennsylvania assets. Based upon the evaluation of what management determined to be relevant evidence, we recorded a $4.8 million deferred tax benefit for the year ended December 31, 2009 that was utilized in 2010. See Note 7 to the audited consolidated financial statements included in this report.
The primary evidence utilized to determine that it is more likely than not that our deferred tax assets will be realized is management’s expectation of future book income over the next several years, as well as the significant tax gain recognized in connection with the sale of our Pennsylvania assets during 2010, which allowed us to realize the majority of our deferred tax assets that were attributable to NOL carryforwards. With a majority of our NOL carryforwards substantially used, our deferred tax asset position is now almost exclusively driven by the accelerated reduction in the book value of our natural gas assets relative to our tax basis due to the use of the full cost method of accounting for natural gas and oil properties and the difference between the book and tax values of our Pennsylvania assets that were sold in 2010.
Asset Retirement Obligations
We have obligations to remove tangible equipment and restore locations at the end of the natural gas production operations. Estimating the future restoration and removal costs, or asset retirement obligations, is difficult and requires management to make estimates and judgments, because most of the obligations are many years in the future, and contracts and regulations often have vague descriptions of what constitutes removal. Asset removal technologies and costs are constantly changing, as are regulatory, political, environmental, safety, and public relations considerations.
Inherent in the calculation of the present value of our asset retirement obligations (“ARO”) are numerous assumptions and judgments, including the ultimate settlement amounts, inflation factors, credit adjusted discount rates, timing of settlement, and changes in the legal, regulatory, environmental, and political environments. To the extent future revisions to these assumptions impact the present value of the existing ARO liability, a corresponding adjustment is made to the natural gas property balance. Increases in the discounted ARO liability resulting from the passage of time are reflected as accretion expense in the Consolidated Statements of Operations.
Impact of Recently Issued Accounting Pronouncements.
In January 2010, the Financial Accounting Standards Board (“FASB”) issued Accounting Standards Update 2010-06, Improving Disclosures about Fair Value Measurements, which amends Accounting Standards Codification 820, Fair Value Measurements and Disclosures. The intent of this update is to improve disclosure requirement related to fair value measurements and disclosures. New disclosures are required regarding transfers in and out of Levels 1 and 2 and activity within Level 3 fair value measurements, as well as clarification of existing disclosures regarding the level of disaggregation and disclosures about fair value measurement inputs and valuation techniques. With the exception of disclosures regarding purchases, sales, issuances and settlements in the roll forward of activity in Level 3 fair value measurements, the new disclosures and clarifications of existing disclosures were effective as of January 1, 2010, and all new disclosure requirements have been incorporated. The disclosures regarding the roll forward of activity in Level 3 fair value measurements are effective for the Company beginning January 1, 2011. The adoption of these disclosure requirements did not have a material impact on the Company’s financial statements.
Our amended and restated certificate of incorporation provides that the number of directors shall be not less than one nor more than 12 as fixed from time to time by or pursuant to our bylaws. Our amended and restated bylaws provide that our board of directors has the authority to set the size of the board of directors from between three and 11 directors and, pursuant thereto, immediately prior to the consummation of the Merger, SLSC’s board of directors expanded the size of the board of directors to five members. Pursuant to the terms of our amended and restated bylaws, each of our directors will hold office until the next annual meeting of stockholders and until his or her successor is duly elected and qualified or until his earlier resignation, removal or death.
In connection with the closing of the Merger all persons serving as officers and directors of the Company resigned as officers and/or directors of the Company and effective as of the Merger closing date, the following individuals became directors of the Company: (i) Bryan H. Lawrence, (ii) Peter A. Leidel, (iii) Paul G. McDermott, (iv) David H. Kennedy and (v) Patrick R. McDonald. Also effective as of the Merger closing, Patrick R. McDonald became Chairman of the Board, Chief Executive Officer and President, and Kevin D. Struzeski became our Chief Financial Officer, Treasurer and Secretary. These individuals held prior to the Merger, and currently hold, the same positions with Nytis USA, our wholly-owned subsidiary. Our officers are elected annually by our Board of Directors and serve at the discretion of our Board of Directors.
The following table sets forth information concerning our executive officers and directors, including their ages and their position(s) with us.
|
Name |
|
Age |
|
Position |
|
|
|
|
|
|
|
Patrick R. McDonald |
|
54 |
|
Chairman of the Board, Director, President and Chief Executive Officer |
|
|
|
|
|
|
|
Kevin D. Struzeski |
|
52 |
|
Chief Financial Officer, Treasurer and Secretary |
|
|
|
|
|
|
|
Bryan H. Lawrence |
|
69 |
|
Director |
|
|
|
|
|
|
|
Peter A. Leidel |
|
55 |
|
Director |
|
|
|
|
|
|
|
David H. Kennedy |
|
62 |
|
Director |
|
|
|
|
|
|
|
Paul G. McDermott |
|
57 |
|
Director |
|
|
|
|
|
|
|
Mark D. Pierce |
|
58 |
|
Senior Vice President of Nytis LLC |
Executive Officer/Director
Patrick R. McDonald. Mr. McDonald was appointed as the Company’s Chief Executive Officer, President and as a Director and Chairman of the Board of Directors on February 14, 2011 and has been Chief Executive Officer, President and Director of Nytis USA since 2004. From 1998 to 2003, Mr. McDonald was Chief Executive Officer, President and Director of Carbon Energy Corporation, a publicly traded, AMEX listed oil and gas exploration and production company which in 2003 merged with Evergreen Resources, Inc. From 1987 to 1997 Mr. McDonald was Chief Executive Officer, President and Director of Interenergy Corporation, a natural gas gathering, processing and marketing company which in December 1997 merged with Kinder Morgan, Inc. Mr. McDonald was previously an exploration geologist with Texaco International Exploration Company where he was responsible for oil and gas exploration efforts in the Middle East and Far East. Mr. McDonald serves as a member of the board of directors of Forest Oil Corporation (NYSE:FST) and certain non—public companies involved primarily in the energy industry. Mr. McDonald is a member of the board of trustees of the Buffalo Bill Historical Center, Cody, Wyoming and of the Trudeau Institute, Saranac Lake, New York. Mr. McDonald is a Certified Petroleum Geologist and is a member of the American Association of Petroleum Geologists and the Canadian Society of Petroleum Geologists.
Our board of directors believes that Mr. McDonald, as our Chief Executive Officer and President and as a co-founder of Nytis USA, should serve as a director because of his unique understanding of the opportunities and challenges that we face and his in-depth knowledge about the natural gas and oil business, and our long-term growth strategies.
Other Directors
The following information pertains to our non-employee directors, their principal occupations and other public company directorships for at least the last five years and information regarding their specific experiences, qualifications, attributes and skills.
Bryan H. Lawrence. Mr. Lawrence has been a Director of the Company since February 14, 2011 and of Nytis USA since 2005. Mr. Lawrence is a founder and member of Yorktown Partners LLC which was established in September 1990. Yorktown Partners LLC is the manager of private equity partnerships that invest in the energy industry. Mr. Lawrence had been employed at Dillon, Read & Co. Inc. since 1966, serving as a Managing Director until the merger of Dillon Read with SBC Warburg in September 1997. Mr. Lawrence also serves as a Director of Crosstex Energy, Inc. (NASDAQ-XTEX), Hallador Petroleum Company (OTC-HPCO.OB), Star Gas Partners, L.P. (NYSE:SGU), Approach Resources, Inc. (NASDAQ: AREX) Winstar Resources Ltd. (TSE-WIX), Compass Petroleum Ltd. (CDNX:CPO.V) and certain non-public companies in the energy industry in which the Yorktown partnerships hold equity interests. Mr. Lawrence served as a director of Carbon Energy Corporation and Interenergy Corporation.
Our board of directors believes that Mr. Lawrence should serve as a director because of his experience on the board of directors of other public companies, which our board of directors believes will be beneficial to us as we move forward as a public company, as well as Mr. Lawrence’s relevant business experience in the energy industry and his extensive financial expertise, which he has acquired through his years of experience in the investment banking industry.
Peter A. Leidel. Mr. Leidel has been a Director of the Company since February 14, 2011 and of Nytis USA since 2005. Mr. Leidel is a founder and member of Yorktown Partners LLC which was established in September 1990. Yorktown Partners LLC is the manager of private equity partnerships that invest in the energy industry. Previously, he was a partner of Dillon, Read & Co. Inc. He was previously employed in corporate treasury positions at Mobil Corporation and worked for KPMG Peat Marwick and the U.S. Patent and Trademark Office. Mr. Leidel is a director of certain non-public companies in the energy industry in which the Yorktown partnerships hold equity interests. Mr. Leidel served as a director of Carbon Energy Corporation and Interenergy Corporation.
Our board of directors believes that Mr. Leidel should serve as a director because of his significant knowledge of our industry, his prior experience with our business and his financial expertise, which will be important as our board of directors exercises its oversight responsibility regarding the quality and integrity of our accounting and financial reporting processes and the auditing of our financial statements.
David H. Kennedy. Mr. Kennedy has been a Director of the Company since February 14, 2011 and of Nytis USA since 2005. From March 1981 through December 1998, Mr. Kennedy was a managing director of First Reserve Corporation. Since January 1999, Mr. Kennedy has acted as a consultant to and investor in the energy industry. He serves as Executive Advisor to Cadent Energy Partners and is a director of Logan International Inc. Mr. Kennedy served as a director of Carbon Energy Corporation prior to its merger with Evergreen Resources, Inc.
Our board of directors believes that Mr. Kennedy should serve as a director because of his prior experience in the natural gas and oil industry generally and with our business specifically.
Paul G. McDermott. Mr. McDermott has been a Director of the Company since February 14, 2011 and of Nytis USA since 2005. Since 2003 Mr. McDermott has been a managing partner of Cadent Energy Partners, LLC, a private equity firm specializing in the energy industry. He has been involved in the energy business since 1979, primarily as an investor of private equity capital on behalf of institutional investors. His experience extends through many sectors of the industry including oil and gas exploration and production, oil field services, natural gas
transmission, petroleum products distribution and electric power generation and related service companies. He is currently a director of, Argos Utility Services, Probe Holdings, Torqued Up Energy Services, NuCore Energy and Logan International Inc.
Our board of directors believes that Mr. McDermott should serve as a director because of his extensive experience in the oil and gas industry and his prior service on numerous other boards of directors and his financial acumen.
Other Executive Officers
Kevin D. Struzeski. Mr. Struseski was appointed as the Company’s Chief Financial Officer, Treasurer and Secretary on February 14, 2011 and has been the CFO, Treasurer and Secretary of Nytis USA since 2005. From 2003 to 2004, Mr. Struzeski was a director of treasury of Evergreen Resources, Inc., and from 1998 to 2003, he was Chief Financial Officer, Secretary and Treasurer of Carbon Energy Corporation. Mr. Struzeski was also Chief Financial Officer, Secretary and Treasurer of Carbon Energy Canada Corporation. Mr. Struzeski served as Accounting Manager for Media One Group from 1997 to 1998 and prior to that was employed as Controller for Interenergy Corporation from 1995 to 1997. Mr. Struzeski is a Certified Public Accountant.
Mark D. Pierce. Mark Pierce is the general manager and Senior Vice President for Nytis LLC. From 2005 until 2009 he was Operations Manager for Nytis LLC. Mr. Pierce has 30 years of oil and gas experience. He began his career at Texaco, Inc. and worked 20 years with Ashland Exploration, Inc. At Ashland Exploration, Inc., he spent 12 years in the production/reservoir engineering area and then moved into the executive level with oversight at various times of marketing, finance, business development, external affairs, operations and land. His experience includes domestic and international. Mr. Pierce has a B.S. in Civil Engineering from Rose-Hulman Institute of Technology and has successfully completed Indiana University’s Executive Development Program and Harvard University’s Graduate School of Business Advanced Management Program. He is a registered Petroleum Engineer in Kentucky, West Virginia and Ohio.
Terms of Office
Our board of directors consists of five directors, each of whom is elected annually at the annual meeting of our stockholders. Each director will continue to serve as a director until such director’s successor is duly elected and qualified or until his earlier resignation, removal or death.
Family Relationships
There are no family relationships between or among any of the current directors or executive officers.
Summary Compensation Table
The following table sets forth information relating to compensation awarded to, earned by or paid to our Chairman, President and Chief Executive Officer and our Chief Financial Officer, Treasurer and Secretary by Nytis USA, and the highest paid employee of Nytis LLC, a subsidiary of Nytis USA, whose total compensation exceeded $100,000 during the fiscal year ended December 31, 2010, for all services rendered in all capacities during the years ended December 31, 2010 and 2009, respectively.
|
Name and |
|
Year |
|
Salary |
|
Bonus |
|
Stock |
|
Option |
|
Non-Equity |
|
Nonqualified |
|
All Other |
|
Total |
|
|
Patrick R. McDonald |
|
2010 |
|
205,774 |
|
90,450 |
|
|
|
— |
|
— |
|
— |
|
66,008 |
|
362,232 |
|
|
|
|
|
|
|
|
|
|
|
|
|
|
|
|
|
|
|
|
|
|
|
Kevin D. Struzeski |
|
2010 |
|
116,631 |
|
52,700 |
|
|
|
— |
|
— |
|
— |
|
37,198 |
|
206,529 |
|
|
|
|
|
|
|
|
|
|
|
|
|
|
|
|
|
|
|
|
|
|
|
Mark D. Pierce |
|
2010 |
|
169,804 |
|
99,360 |
|
|
|
— |
|
— |
|
— |
|
18,421 |
|
287,585 |
|
(1) During the years set forth in the table, Mr. McDonald and Mr. Struzeski were employees of Nytis Exploration Company and provided service to Nytis USA pursuant to an agreement between Nytis Exploration Company and Nytis USA. Under this agreement, Nytis USA funded, by way of full reimbursement to Nytis Exploration Company, the cash compensation paid to Mr. McDonald and Mr. Struzeski for services provided to Nytis USA. Accordingly, the amounts set forth in the “salary,” “bonus” and “all other compensation” columns in the table reflect only the amounts of such compensation allocated and paid to Mr. McDonald and Mr. Struzeski, by Nytis USA. For the years ended December 31, 2010 and 2009, Nytis USA’s portion of Mr. McDonald’s compensation was approximately 67% and 66% of his total compensation, respectively; Nytis USA’s portion of Mr. Struzeski’s compensation during such years was approximately 62% and 61% of his total compensation, respectively. These percentages reflect the amount of time these persons spent in service to Nytis USA. Although, during 2010 and 2009, Nytis Exploration Company and Nytis USA had substantially the same stockholders, and Messrs. McDonald and Struzeski were officers of both companies, these companies do not compete for business; as provided in their respective Certificates of Incorporation, Nytis Exploration Company may not operate in the United States, and Nytis USA operates exclusively in the United States.
Prior to the closing of the Merger, all of the persons providing services to Nytis USA were employees of Nytis Exploration Company. Effective as of July 1, 2011, all of these persons, including Mr. McDonald and Mr. Struzeski, became employees of Carbon. However, the Company will allow these persons, including Mr. McDonald and Mr. Struzeski, to continue to provide services to Nytis Exploration Company; the Company will be paid a flat fee of $15,000 per month for the costs associated with such persons’ service to Nytis Exploration Company.
(2) In 2009, (a) Mr. McDonald and Mr. Struzeski were each awarded 75 shares of Nytis USA restricted stock (which each exchanged for 122,307 shares of the Company’s common stock pursuant to the Merger Agreement) and (b) Mr. Pierce was awarded 25 shares of Nytis USA restricted stock (which he exchanged for 40,769 shares of the Company’s common stock pursuant to the Merger Agreement). The final measurement of compensation cost will be based on the number of shares that ultimately vest using the market price of the shares at the date of vesting. For the years ended December 31, 2010 and 2009, Nytis USA estimated that none of these shares of restricted stock would vest.
(3) All Other Compensation in 2010 was comprised of (i) unused vacation, (ii) contributions made by Nytis USA to its 401(k) plan, (iii) premiums paid on life insurance policy on such employee’s life, and (iv) other taxable fringe benefits.
Narrative Disclosure to Summary Compensation Table
To date, the Board of Directors has been charged with reviewing and approving the terms and structure of the compensation of the Company’s executive officers. The Company has not yet retained an independent compensation consultant to assist the Company to review and analyze the structure and terms of the Company’s executive officers.
The Company considers various factors when evaluating and determining the compensation terms and structure of its executive officers, including the following:
|
1. |
The executive’s leadership and operational performance and potential to enhance long-term value to the Company’s stockholders; |
|
|
|
|
2. |
The Company’s financial resources, results of operations, and financial projections; |
|
|
|
|
3. |
Performance compared to the financial, operational and strategic goals established for the Company; |
|
|
|
|
4. |
The nature, scope and level of the executive’s responsibilities; |
|
|
|
|
5. |
Competitive market compensation paid by other companies for similar positions, experience and performance levels; and |
|
|
|
|
6. |
The executive’s current salary, the appropriate balance between incentives for long-term and short-term performance. |
Company management is responsible for reviewing the base salary, annual bonus and long-term compensation levels for other Company employees, and the Company expects this practice to continue going forward. The entire Board of Directors remains responsible for significant changes to, or adoption, of new employee benefit plans.
The Company believes that the compensation environment for qualified professionals in the industry in which we operate is highly competitive. In order to compete in this environment, the compensation of our executive officers is primarily comprised of the following four components:
|
· |
Base salary; |
|
· |
Restricted stock awards; |
|
· |
Discretionary cash bonuses; and |
|
· |
Other employment benefits. |
Base Salary. Base salary, paid in cash, is the first element of compensation to our officers. In determining base salaries for our key executive officers, the Company aims to set base salaries at a level we believe enables us to hire and retain individuals in a competitive environment and to reward individual performance and contribution to our overall business goals. The Board of Directors believes that base salary should be relatively stable over time, providing the executive a dependable, minimum level of compensation, which is approximately equivalent to compensation that may be paid by competitors for persons of similar abilities. The Board of Directors believes that base salaries for our executive officers are appropriate for persons serving as executive officers of public companies similar in size and complexity similar to the Company.
Stock Incentive Plan Benefits. Each of the Company’s executive officers is eligible to be granted awards under the Company’s equity compensation plans. The Company believes that equity based compensation helps align management and executives’ interests with the interests of our stockholders. Our equity incentives are also intended to reward the attainment of long-term corporate objectives by our executives. We also believe that grants of equity-based compensation are necessary to enable us to be competitive from a total remuneration standpoint. At the present time, we have one equity incentive plan for our management and employees, the 2011 Stock Incentive Plan, although as of June 30, 2011 no awards have been made pursuant to this plan. We have no set formula for granting awards to our executives or employees. In determining whether to grant awards and the amount of any awards, we
take into consideration discretionary factors such as the individual’s current and expected future performance, level of responsibilities, retention considerations, and the total compensation package. None of our executive officers (nor any other persons) has yet received an award under the Company’s 2011 Stock Incentive Plan nor has such plan been presented to the Company’s stockholders for their approval.
Discretionary Annual Bonus. Discretionary cash bonuses are another prong of our compensation plan. The Board of Directors believes that it is appropriate that executive officers and other employees have the potential to receive a portion of their annual cash compensation as a cash bonus to encourage performance to achieve key corporate objectives and to be competitive from a total remuneration standpoint.
We have no set formula for determining or awarding discretionary cash bonuses to our other executives or employees. In determining whether to award bonuses and the amount of any bonuses, we have taken and expect to continue to take into consideration discretionary factors such as the individual’s current and expected future performance, level of responsibilities, retention considerations, and the total compensation package, as well as the Company’s overall performance including cash flow, significant acquisitions or divestitures and other operational factors.
The employment agreements we have entered into with certain of our executive officers provide that each is eligible to receive a discretionary cash bonus. Such bonuses are to be considered and determined by the Board of Directors.
Other Compensation/Benefits. Another element of the overall compensation is through providing our executive officers are various employment benefits, such as the payment of health and life insurance premiums on behalf of the executive officers. Our executive officers are also eligible to participate in our 401(k) plan on the same basis as other employees and the Company historically has made matching contributions to the 401(k) plan, including for the benefit of our executive officers.
Employment Contracts and Termination of Employment and Change-in-Control Arrangements
As of June 30, 2011, both Mr. McDonald and Mr. Struzeski were parties to an employment agreement with Nytis Exploration Company. Although neither the Company nor any of its subsidiaries are a party to these agreements, if there is a change of control event (as defined in the agreements) at Nytis USA, Messrs. McDonald and Struzeski may be entitled to certain payments.
The agreement with Patrick R. McDonald allows for the termination of Mr. McDonald’s employment upon 90 days written notice (the date of expiration of such notice to be the “Termination Date”). In the event of the termination of Mr. McDonald’s employment, Mr. McDonald is to receive (a) on the Termination Date, a lump sum of money equal to 150% of Mr. McDonald’s “Compensation,” defined as the arithmetic average of Mr. McDonald’s annual base salary, bonus and other cash compensation for each of the three years prior to the Termination and (b) for a period of 24 months from the Termination Date, his medical, dental, disability and life insurance coverage at the same levels of coverage as in effect immediately prior to the Termination Date.
In the event of a change in control of the Company supported by Mr. McDonald, he is to receive 200% of the Compensation (as defined above). In the event of a change in control not supported by Mr. McDonald, he is entitled to receive 300% of the Compensation (as defined above).
The agreement with Kevin D. Struzeski allows for the termination of Mr. Struzeski’s employment upon 90 days written notice (the date of expiration of such notice to be the “Termination Date”). In the event of the termination of Mr. Struzeski’s employment, Mr. Struzeski is to receive on the Termination Date: (a) a lump sum of money equal to 100% of Mr. Struzeski’s then base salary, less required statutory deductions; and (b) a lump sum equal to the cost to provide benefits for a period of 12 months from the Termination Date at the same levels of coverage as in effect immediately prior to the Termination Date.
In the event of a change in control of the Company, Mr. Struzeski is entitled to receive a sum of money equal to: (a) 200% of his base salary, bonus and other cash compensation and incentive compensation; and (b) 100% of the annual cost to the Company of the benefits provided to Mr. Struzeski.
Mark D. Pierce is employed as the Senior Vice President of Nytis LLC pursuant to an employment agreement dated May 9, 2005. Pursuant to such employment agreement Mr. Pierce may be terminated by Nytis LLC upon 90 days written notice (the date of expiration of such notice, the “Termination Date”). In the event of the termination of Mr. Pierce’s employment, Mr. Pierce is to receive on the Termination Date: (a) a lump sum of money equal to 100% of Mr. Pierce’s then base salary, less required statutory deductions; and (b) a lump sum equal to the cost to provide benefits for a period of 12 months from the Termination Date at the same levels of coverage as in effect immediately prior to the Termination Date.
Pursuant to the employment agreements with Messrs. McDonald, Struzeski and Pierce such officers are entitled to certain payments upon termination of employment. Other than these arrangements, we currently do not have any compensatory plans or arrangements that provide for any payments or benefits upon the resignation, retirement or any other termination of any of our executive officers, as the result of a change in control, or from a change in any executive officer’s responsibilities following a change in control.
Risk/Reward Issues
The Board of Directors does not believe that the current structure of the Company’s compensation policies promotes unnecessary or inappropriate short-term or long-term risks. The cash compensation paid to the Company’s executive officers consists of fixed salaries and possible performance bonuses. These performance bonuses (if any) will be granted in hindsight by the Board of Directors based on operational and financial performance.
In the future, the Board may base the vesting of stock options and perhaps cash bonuses on specific performance criteria that will be determined in advance based on the Company’s prior year performance as reflected in its financial statements included within its annual report on Form 10-K.
Grants of Plan-Based Awards in Fiscal 2010
There were no option or other equity grants in 2010 (or through June 30, 2011).
Outstanding Equity Awards at December 31, 2010
The following table reflects the outstanding equity awards as of December 31, 2010. Each of the following awards were made by Nytis USA prior to the Merger and were assumed as a result of the Merger; the number of shares and the option exercise price, have been adjusted in line with the exchange ratio of Nytis USA shares for Company shares in the Merger. There have been no equity awards for the six months ended June 30, 2011.
OPTION AWARDS
|
Award Recipient |
|
Option |
|
# Vested |
|
Exercise |
|
Date |
|
Expiration |
| |
|
|
|
|
|
|
|
|
|
|
|
|
| |
|
Kevin Struzeski (Officer) |
|
163,076 |
|
163,076 |
|
$ |
0.61 |
|
3/16/2006 |
|
1/1/2016 |
|
|
|
|
|
|
|
|
|
|
|
|
|
| |
|
David H. Kennedy |
|
40,769 |
|
40,769 |
|
$ |
0.61 |
|
5/20/2005 |
|
5/20/2015 |
|
|
(Director) |
|
32,615 |
|
32,615 |
|
$ |
0.71 |
|
1/1/2008 |
|
1/1/2018 |
|
|
|
|
|
|
|
|
|
|
|
|
|
| |
|
Harry A. Trueblood, Jr. |
|
40,769 |
|
40,769 |
|
$ |
0.61 |
|
5/20/2005 |
|
5/20/2015 |
|
|
(Former Director of Nytis USA) |
|
32,615 |
|
32,615 |
|
$ |
0.71 |
|
1/1/2008 |
|
1/1/2018 |
|
|
|
|
|
|
|
|
|
|
|
|
|
| |
|
Paul G. McDermott |
|
32,615 |
|
32,615 |
|
$ |
0.71 |
|
1/1/2008 |
|
1/1/2018 |
|
|
(Director) |
|
342,459 |
|
342,459 |
|
|
|
|
|
|
| |
Option Exercises and Stock Vested in Fiscal 2010
There were no option exercises or stock vested in 2010 or through June 30, 2011.
Compensation of Directors
Directors who are not employees of the Company or of its affiliates are currently paid $2,500 per quarter. Directors who are employed by the Company or its affiliates are not compensated additionally for their directorships. The only non-employee director who receives compensation in accordance with this arrangement is David Kennedy. Mr. Kennedy received total director fees of $10,000 during the year ended December 31, 2010 and has received $2,500 per quarter through June 30, 2011.
SECURITY OWNERSHIP OF CERTAIN BENEFICIAL OWNERS AND MANAGEMENT
As of July 31, 2011 the Company had has 114,185,405 shares of common stock outstanding. The following sets forth certain information about the number of common shares owned by (i) each person (including any group) known to us that beneficially owns five percent or more of the common shares (the only class of the Company’s voting securities), (ii) each of our directors and named executive officers, and (iii) all named executive officers and directors as a group. Unless otherwise indicated, the stockholders possess sole voting and investment power with respect to the shares shown. The business address for each of the Company’s officers and directors is 1700 Broadway, Suite 2020, Denver, Colorado 80290.
|
Name and Address of Beneficial Owner |
|
Amount of Beneficial |
|
Percent of Class(2) |
|
|
|
|
|
|
|
|
|
5% Stockholders |
|
|
|
|
|
|
|
|
|
|
|
|
|
Yorktown Energy Partners V, L.P. |
|
17,938,309 |
|
15.7 |
% |
|
|
|
|
|
|
|
|
Yorktown Energy Partners VI, L.P., 410 Park Avenue, |
|
17,938,309 |
|
15.7 |
% |
|
|
|
|
|
|
|
|
Yorktown Energy Partners IX, L.P., 410 Park Avenue, |
|
22,222,222 |
|
19.5 |
% |
|
|
|
|
|
|
|
|
Paul J. Isaac (3) |
|
13,066,667 |
|
11.4 |
% |
|
|
|
|
|
|
|
|
Austin Marxe and David M. Greenhouse (4) |
|
10,888,889 |
|
9.5 |
% |
|
|
|
|
|
|
|
|
RBCP Energy Fund Investments, LP |
|
8,153,777 |
|
7.1 |
% |
|
|
|
|
|
|
|
|
Wynnefield Capital (5) |
|
6,444,445 |
|
5.6 |
% |
|
Name of |
|
Amount of |
|
Percentage(2) |
|
Options and |
|
Total |
|
Percent of |
|
|
|
|
|
|
|
|
|
|
|
|
|
|
|
Executive Officers and Directors |
|
|
|
|
|
|
|
|
|
|
|
|
|
|
|
|
|
|
|
|
|
|
|
|
|
Bryan H. Lawrence, |
|
58,098,840 |
|
50.9 |
% |
— |
|
58,098,840 |
|
50.9 |
% |
|
|
|
|
|
|
|
|
|
|
|
|
|
|
Peter A. Leidel, |
|
58,098,840 |
|
50.9 |
% |
— |
|
58,098,840 |
|
50.9 |
% |
|
|
|
|
|
|
|
|
|
|
|
|
|
|
Paul G. McDermott, |
|
8,153,777 |
|
7.1 |
% |
32,616 |
|
8,186,393 |
|
7.2 |
% |
|
|
|
|
|
|
|
|
|
|
|
|
|
|
David H. Kennedy, |
|
163,076 |
|
* |
|
73,384 |
|
236,460 |
|
* |
|
|
|
|
|
|
|
|
|
|
|
|
|
|
|
Patrick R. McDonald, |
|
1,991,153 |
|
1.7 |
% |
2,446,133 |
|
4,437,286 |
|
3.8 |
% |
|
|
|
|
|
|
|
|
|
|
|
|
|
|
Kevin D. Struzeski, |
|
407,689 |
|
* |
|
163,076 |
|
570,765 |
|
* |
|
|
|
|
|
|
|
|
|
|
|
|
|
|
|
Mark D. Pierce, |
|
40,769 |
|
* |
|
— |
|
40,769 |
|
* |
|
|
|
|
|
|
|
|
|
|
|
|
|
|
|
All directors and executive officers as a group (seven persons) (10) |
|
68,855,304 |
|
60.3 |
% |
2,715,209 |
|
71,570,513. |
|
61.2 |
% |
* less than 1%
(1) Under Rule 13d-3, a beneficial owner of a security includes any person who, directly or indirectly, through any contract, arrangement, understanding, relationship, or otherwise has or shares: (i) voting power, which includes the power to vote, or to direct the voting of shares; and (ii) investment power, which includes the power to dispose or direct the disposition of shares. Certain shares may be deemed to be beneficially owned by more than one person (if, for example, persons share the power to vote or the power to dispose of the shares). In addition, shares are deemed to be beneficially owned by a person if the person has the right to acquire the shares (for example, upon exercise of an option) within 60 days of the date as of which the information is provided. In computing the percentage ownership of any person, the amount of shares outstanding is deemed to include the amount of shares beneficially owned by such person (and only such person) by reason of these acquisition rights.
(2) Percentages are rounded to the nearest one-tenth of one percent. The percentage is based on 114,185,405 shares of common stock outstanding as of July 31, 2011.
(3) Includes (i) 8,888,889 common stock shares owned by Arbiter Partners QP, L.P., (ii) 2,222,222 common stock shares owned by Isaac Brothers, LLC and (iii) 1,955,556 common stock shares owned by 75 Prospect Partners, LLC, over which Mr. Isaac has voting and investment power.
(4) Consists of (i) 7,555,556 common stock shares owned by Special Situations Fund III QP, L.P. (“SSFQP”), (ii) 2,222,222 common stock shares owned by Special Situations Cayman Fund, L.P. (“SSF Cayman”) and (iii) 1,111,111 common stock shares owned by Special Situations Private Equity Fund, L.P. (“SSFPE”). MGP Advisers Limited Partnership (“MGP”) is the general partner of SSFQP. AWM Investment Company, Inc. (“AWM”) is the general partner of MGP, the general partner of and investment adviser to SSF Cayman and the investment adviser to SSFPE. Austin W. Marxe and David M. Greenhouse are the principal owners of MGP and AWM. Through their control of MGP and AWM, Messrs. Marxe and Greenhouse share voting and investment control over the portfolio securities of each of the funds listed above.
(5) Includes (i) 2,887,111 common stock shares owned by Wynnefield Partners Small Cap Value, LP I, (ii) 1,997,778 common stock shares owned by Wynnefield Partners Small Cap Value, LP and (iii) 1,559,556 common stock shares owned by Wynnefield Small Cap Value Offshore Fund, Ltd., over which Wynnefield Capital has voting and investment power.
(6) Includes (i) 17,938,309 common stock shares owned by Yorktown Energy Partners V, LP, (ii) 17,938,309 common stock shares owned by Yorktown Energy Partners VI, LP and (iii) 22,222,222 common stock shares owned by Yorktown Energy Partners IX, LP over which Mr. Lawrence and Mr. Leidel have voting and investment power.
(7) Includes (i) 17,938,309 common stock shares owned by Yorktown Energy Partners V, LP, (ii) 17,938,309 common stock shares owned by Yorktown Energy Partners VI, LP and (iii) 22,222,222 common stock shares owned by Yorktown Energy Partners IX, LP over which Mr. Lawrence and Mr. Leidel have voting and investment power.
(8) Includes 8,153,777 shares owned by RBCP Energy Fund Investments, LP, over which Mr. McDermott has voting and investment power.
(9) Includes (i) 482,704 shares owned by McDonald Energy, LLC over which Mr. McDonald has voting and investment power, and (ii) stock purchase warrants held by McDonald Energy, LLC exercisable for 2,446,133 shares of common stock.
(10) The shares over which both Mr. Lawrence and Mr. Leidel have voting and investment power are the same shares and the percentage of total shares has not been aggregated for purposes of these calculations.
Equity Compensation Plans
Our Board of Directors has adopted the 2011 Stock Incentive Plan (the “Plan”) and has recommended its approval and ratification to our stockholders at the next annual meeting of stockholders. Such annual meeting has not yet occurred and the Plan remains subject to such stockholder approval. No awards of common stock shares have yet been made under the Plan. Information regarding options outstanding as June 30, 2011 is set forth under the heading “Market for Common Equity and Related Stockholder Matters - Securities Authorized for Issuance Under Equity Compensation Plans” above.
CERTAIN RELATIONSHIPS AND RELATED TRANSACTIONS
Certain Relationships
Nytis Exploration Company is an independent oil and gas company that engages in the exploration, development, production, marketing and sale of oil, gas, coalbed methane and other hydrocarbons in locations outside of the United States. Nytis USA and Nytis Exploration Company are related in that the same individuals serve as directors of both corporations and, prior to the closing of the Private Placement, a majority of the outstanding stock of each corporation was owned by the same stockholders. However, Nytis Exploration Company is not currently a direct or indirect subsidiary of the Company. Through June 30, 2011 the Company engaged Nytis Exploration Company to assist in the management, direction and supervision of the operations and business functions of the Company. A
service agreement between the Company and Nytis Exploration Company provided for certain restrictions on Nytis Exploration Company’s authority to perform acts in connection with the business of the Company and established provisions for the compensation of Nytis Exploration Company in performing these duties. Under this arrangement from time to time, Nytis Exploration Company provided personnel (including Mr. McDonald and Mr. Struzeski) and funding for the operations of Nytis USA, Nytis PA and Nytis LLC, creating a liability owed by Nytis USA, Nytis PA and/or Nytis LLC to Nytis Exploration Company. As a result of providing personnel and such funding, the aggregate balance of the liability owed to Nytis Exploration Company as of June 30, 2011 was approximately $1.8 million. As of July 1, 2011, Nytis Exploration Company personnel providing services to the Company (including Mr. McDonald and Mr. Struzeski) became Company employees. However, the Company will allow these persons, including Mr. McDonald and Mr. Struzeski, to continue to provide services to Nytis Exploration Company; and the Company will be paid a flat fee of $15,000 per month for the costs associated with such persons’ service to Nytis Exploration Company.
Related Transactions
The following sets forth information regarding transactions between the Company (and its subsidiaries) and its officers, directors and significant stockholders since January 1, 2010.
Employment Agreements
See the Executive Compensation section of this Information Statement for a discussion of the employment agreement with Mr. Pierce and Nytis LLC and between Messrs. McDonald and Struzeski and Nytis Exploration Company.
Private Placement of Securities
On June 29, 2011, the Company entered into a common stock purchase agreement with various institutional investors and other accredited investors for the private placement of 44,444,444 shares of the Company’s common stock at a price of $0.45 per share, and a preferred stock purchase agreement with Yorktown Energy Partners IX, L.P. (“Yorktown IX”), an institutional investor and affiliate of (i) Yorktown Energy Partners V, LP and (ii) Yorktown Energy Partners VI, LP (collectively with Yorktown IX, the “Yorktown Entities”), as well as of (iii) two of our Directors, Bryan Lawrence and Peter Leidel, for the private placement of 100 shares of the Company’s Series A Convertible Preferred Stock at a price of $100,000 per share (aggregate purchase price by Yorktown IX was $10,000,000).
The shares of Series A Convertible Preferred Stock issued in the Private Placement automatically converted into 22,222,222 shares of common stock on July 18, 2011, the effective date of an amendment to the Company’s Amended and Restated Certificate of Incorporation to increase the number of common stock shares the Company is authorized to issue. Upon such conversion, Carbon issued 66,666,666 shares of common stock at $0.45 per share, for $30 million in gross proceeds.
As a result of Yorktown IX’s purchase of such shares of Series A Convertible Preferred Stock, the Yorktown Entities collectively control a majority of our voting capital stock.
The purchase price of the shares of common stock issued in the private placement of securities described above, and thus by extension, the price at which the Series A Convertible Preferred Stock converted into shares of our common stock, was determined by a special pricing committee of our Board (the “Pricing Committee”). No member of the Pricing Committee purchased any shares of common stock or Series A Convertible Preferred Stock in connection with the private placement.
Director Independence
The Company’s Board consists of Messrs. Kennedy, Lawrence, Leidel, McDermott, and McDonald. The Company utilizes the definition of “independent” as it is set forth in Rule 5605(a)(2) of the Nasdaq Listing Rules. Further, the Board considers all relevant facts and circumstances in its determination of independence of all members of the
board (including any relationships). Based on the foregoing criteria, only Mr. McDonald is not considered to be an independent director.
CHANGES IN AND DISAGREEMENTS WITH ACCOUNTANTS ON ACCOUNTING AND FINANCIAL DISCLOSURE
On March 10, 2011, we dismissed Braver P.C., our previous auditors due to the Merger. On March 10, 2011, our board of directors engaged Ehrhardt Keefe Steiner & Hottman PC as the Company’s independent registered public accounting firm. The decision to engage Ehrhardt Keefe Steiner & Hottman PC was approved by our board of directors on March 9, 2010.
The dismissal of Braver P.C., was the result of the Merger transaction and our belief that it was appropriate for Ehrhardt Keefe Steiner & Hottman PC to serve as the Company’s auditors on a post-Merger transaction basis. Braver P.C. provided a report on the Company’s (then SLSC’s) financial statements for its fiscal years ended March 31, 2009 and, 2008 and neither report contain an adverse opinion or disclaimer of opinion, nor was it modified as to uncertainty, audit scope, or accounting principles.
During the Company’s two most recent fiscal years and subsequently through the date of dismissal, there were no disagreements with Braver P.C. on any matter of accounting principles, practices, financial statement disclosure, or auditing scope or procedure which if not resolved to s Braver P.C. satisfaction would have caused to Braver P.C. make reference to the subject matter of the disagreement in connection with its principal accounting report on the financial statements for the Company’s fiscal years ended March 31, 2009 and 2008, or any subsequent report.
WHERE YOU CAN FIND MORE INFORMATION
We have filed with the SEC a registration statement on Form S-1, including exhibits and schedules, under the Securities Act with respect to the common stock to be sold in this offering. This prospectus, which constitutes a part of the registration statement, does not contain all of the information set forth in the registration statement or the exhibits and schedules that are part of the registration statement. For further information about us and our common stock, you may refer to the registration statement.
You may read, without charge, and copy, at prescribed rates, all or any portion of the registration statement or any reports, statements or other information in the files at the public reference room at the SEC’s principal office at 100 F Street NE, Washington, D.C., 20549. You may request copies of these documents, for a copying fee, by writing to the SEC. You may call the SEC at 1-800-SEC-0330 for further information on the operation of its public reference room. Our filings, including the registration statement, will also be available to you on the Internet website maintained by the SEC at http://www.sec.gov.
We are subject to the information and reporting requirements of the Securities Exchange Act and will file annual, quarterly and current reports, proxy statements and other information with the SEC. You can request copies of these documents, for a copying fee, by writing to the SEC. These reports, proxy statements and other information will also be available on the Internet website of the SEC referred to above. We intend to furnish our stockholders with annual reports containing financial statements audited by our independent auditors.
Consolidated Financial Statements of
NYTIS EXPLORATION (USA) INC.
December 31, 2010 and 2009
NYTIS EXPLORATION (USA) INC.
TABLE OF CONTENTS
|
F-3 | |
|
|
|
|
Consolidated Financial Statements |
|
|
|
|
|
F-4 | |
|
|
|
|
F-5 | |
|
|
|
|
F-6 | |
|
|
|
|
F-7 | |
|
|
|
|
F-8 |
REPORT OF INDEPENDENT REGISTERED PUBLIC ACCOUNTING FIRM
The Board of Directors and Stockholders of
Nytis Exploration (USA) Inc. and Subsidiaries
We have audited the accompanying consolidated balance sheets of Nytis Exploration (USA) Inc. and subsidiaries as of December 31, 2010 and 2009 and the related consolidated statements of operations, stockholders’ equity, and cash flows for the years then ended. These consolidated financial statements are the responsibility of the Company’s management. Our responsibility is to express an opinion on these consolidated financial statements based on our audits.
We conducted our audits in accordance with the standards of the Public Company Accounting Oversight Board (United States). Those standards require that we plan and perform the audit to obtain reasonable assurance about whether the financial statements are free of material misstatement. The Company is not required to have, nor were we engaged to perform, an audit of its internal control over financial reporting. Our audit included consideration of internal control over financial reporting as a basis for designing audit procedures that are appropriate in the circumstances, but not for the purpose of expressing an opinion on the effectiveness of the Company’s internal control over financial reporting. Accordingly, we express no such opinion. An audit includes examining, on a test basis, evidence supporting the amounts and disclosures in the financial statements. An audit also includes assessing the accounting principles used and significant estimates made by management, as well as evaluating the overall financial statement presentation. We believe that our audits provide a reasonable basis for our opinion.
In our opinion, the consolidated financial statements referred to above present fairly, in all material respects, the financial position of Nytis Exploration (USA) Inc. and subsidiaries as of December 31, 2010 and 2009 and the results of their operations and their cash flows for the years then ended in conformity with accounting principles generally accepted in the United States of America.
Ehrhardt Keefe Steiner & Hottman PC
Denver, Colorado
March 25, 2011
NYTIS EXPLORATION (USA) INC.
|
|
|
December 31, |
|
December 31, |
| ||
|
ASSETS |
|
|
|
|
| ||
|
|
|
|
|
|
| ||
|
Current assets: |
|
|
|
|
| ||
|
Cash and cash equivalents |
|
$ |
845,054 |
|
$ |
208,295 |
|
|
Accounts receivable: |
|
|
|
|
| ||
|
Revenue |
|
752,845 |
|
1,213,942 |
| ||
|
Joint interest billings and other |
|
258,340 |
|
15,736 |
| ||
|
Prepaid expenses, deposits and other current assets |
|
84,941 |
|
87,756 |
| ||
|
Deferred offering costs |
|
169,283 |
|
— |
| ||
|
Derivative assets |
|
170,840 |
|
— |
| ||
|
Total current assets |
|
2,281,303 |
|
1,525,729 |
| ||
|
|
|
|
|
|
| ||
|
Oil and gas properties, at cost, net (based on the full cost method of accounting for oil and gas properties) (note 5) |
|
23,578,264 |
|
41,872,571 |
| ||
|
Other property and equipment, net |
|
80,703 |
|
128,187 |
| ||
|
|
|
23,658,967 |
|
42,000,758 |
| ||
|
|
|
|
|
|
| ||
|
Equity method investment |
|
582,745 |
|
— |
| ||
|
Other long-term assets |
|
463,110 |
|
261,014 |
| ||
|
Deferred tax asset |
|
— |
|
4,784,000 |
| ||
|
|
|
|
|
|
| ||
|
Total assets |
|
$ |
26,986,125 |
|
$ |
48,571,501 |
|
|
|
|
|
|
|
| ||
|
LIABILITIES AND STOCKHOLDERS’ EQUITY |
|
|
|
|
| ||
|
|
|
|
|
|
| ||
|
Current liabilities: |
|
|
|
|
| ||
|
Accounts payable and accrued liabilities |
|
$ |
1,632,193 |
|
$ |
1,906,230 |
|
|
Derivative liabilities |
|
— |
|
123,670 |
| ||
|
Total current liabilities |
|
1,632,193 |
|
2,029,900 |
| ||
|
|
|
|
|
|
| ||
|
Non-current liabilities: |
|
|
|
|
| ||
|
Due to related parties (note 14) |
|
3,073,036 |
|
5,504,213 |
| ||
|
Asset retirement obligations (note 1) |
|
351,954 |
|
749,470 |
| ||
|
Notes payable (note 7) |
|
3,116,383 |
|
24,047,233 |
| ||
|
Total non-current liabilities |
|
6,541,373 |
|
30,300,916 |
| ||
|
|
|
|
|
|
| ||
|
Commitments and contingencies (notes 11 and 12) |
|
|
|
|
| ||
|
|
|
|
|
|
| ||
|
Stockholders’ equity: |
|
|
|
|
| ||
|
Preferred stock, $0.01 par value; authorized 1,000 shares, no shares issued |
|
— |
|
— |
| ||
|
Common stock, $0.01 par value; authorized 100,000 shares, 29,375 shares issued and 28,921 and 29,375 shares outstanding at December 31, 2010 and 2009, respectively |
|
282 |
|
282 |
| ||
|
Additional paid-in capital |
|
28,179,398 |
|
28,179,398 |
| ||
|
Non-controlling interests |
|
637,612 |
|
847,181 |
| ||
|
Share purchase promissory note (note 9) |
|
— |
|
(655,298 |
) | ||
|
Treasury stock, at cost (note 9) |
|
(693,820 |
) |
— |
| ||
|
Accumulated deficit |
|
(9,310,913 |
) |
(12,130,878 |
) | ||
|
Total stockholders’ equity |
|
18,812,559 |
|
16,240,685 |
| ||
|
|
|
|
|
|
| ||
|
Total liabilities and stockholders’ equity |
|
$ |
26,986,125 |
|
$ |
48,571,501 |
|
See accompanying notes to consolidated financial statements.
NYTIS EXPLORATION (USA) INC.
Consolidated Statements of Operations
|
|
|
Year Ended |
|
Year Ended |
| ||
|
|
|
|
|
|
| ||
|
Revenue: |
|
|
|
|
| ||
|
Oil and gas |
|
$ |
4,879,718 |
|
$ |
5,676,271 |
|
|
Commodity derivative gain |
|
691,660 |
|
226,476 |
| ||
|
Other income |
|
360,236 |
|
334,878 |
| ||
|
Total revenue |
|
5,931,614 |
|
6,237,625 |
| ||
|
|
|
|
|
|
| ||
|
Expenses: |
|
|
|
|
| ||
|
Lease operating expenses |
|
1,053,387 |
|
1,134,936 |
| ||
|
Transportation costs |
|
444,033 |
|
393,409 |
| ||
|
Production and property taxes |
|
430,433 |
|
563,502 |
| ||
|
General and administrative |
|
3,094,410 |
|
2,672,215 |
| ||
|
Depreciation, depletion and amortization |
|
1,540,175 |
|
2,625,086 |
| ||
|
Accretion of asset retirement obligations |
|
17,367 |
|
43,315 |
| ||
|
Impairment of oil and gas properties |
|
— |
|
16,076,515 |
| ||
|
Total expenses |
|
6,579,805 |
|
23,508,978 |
| ||
|
|
|
|
|
|
| ||
|
Operating loss |
|
(648,191 |
) |
(17,271,353 |
) | ||
|
|
|
|
|
|
| ||
|
Other income and (expense): |
|
|
|
|
| ||
|
Interest income |
|
38,710 |
|
37,959 |
| ||
|
Interest expense |
|
(352,138 |
) |
(1,167,247 |
) | ||
|
Equity investment income |
|
22,745 |
|
— |
| ||
|
Gain on sale of oil and gas properties |
|
10,103,932 |
|
— |
| ||
|
Total other income and (expense) |
|
9,813,249 |
|
(1,129,288 |
) | ||
|
|
|
|
|
|
| ||
|
Income (loss) before income taxes |
|
9,165,058 |
|
(18,400,641 |
) | ||
|
|
|
|
|
|
| ||
|
Income taxes: |
|
|
|
|
| ||
|
Provision for income taxes (benefit) |
|
5,404,000 |
|
(4,784,000 |
) | ||
|
|
|
|
|
|
| ||
|
Net income (loss) before non-controlling interests |
|
3,761,058 |
|
(13,616,641 |
) | ||
|
|
|
|
|
|
| ||
|
Net income attributable to non-controlling interests |
|
(941,093 |
) |
— |
| ||
|
|
|
|
|
|
| ||
|
Net income (loss) attributable to controlling interest |
|
$ |
2,819,965 |
|
$ |
(13,616,641 |
) |
See accompanying notes to consolidated financial statements.
NYTIS EXPLORATION (USA) INC.
Consolidated Statements of Stockholders’ Equity
|
|
|
|
|
|
|
|
|
|
|
Share |
|
|
|
|
|
(Accumulated |
|
|
| |||||||
|
|
|
|
|
|
|
Additional |
|
Non- |
|
Purchase |
|
|
|
|
|
Deficit) / |
|
Total |
| |||||||
|
|
|
Common Stock |
|
Paid-in |
|
Controlling |
|
Promissory |
|
Treasury Stock |
|
Retained |
|
Stockholders’ |
| |||||||||||
|
|
|
Shares |
|
Amount |
|
Capital |
|
Interests |
|
Note |
|
Shares |
|
Amount |
|
Earnings |
|
Equity |
| |||||||
|
|
|
|
|
|
|
|
|
|
|
|
|
|
|
|
|
|
|
|
| |||||||
|
Balances, December 31, 2008 |
|
29,375 |
|
$ |
282 |
|
$ |
28,179,398 |
|
$ |
826,406 |
|
$ |
(618,236 |
) |
— |
|
$ |
— |
|
$ |
1,485,763 |
|
$ |
29,873,613 |
|
|
|
|
|
|
|
|
|
|
|
|
|
|
|
|
|
|
|
|
|
| |||||||
|
Interest on promissory note |
|
— |
|
— |
|
— |
|
— |
|
(37,062 |
) |
— |
|
— |
|
— |
|
(37,062 |
) | |||||||
|
Contributions |
|
— |
|
— |
|
— |
|
20,775 |
|
— |
|
— |
|
— |
|
— |
|
20,775 |
| |||||||
|
Restricted stock issued |
|
175 |
|
— |
|
— |
|
— |
|
— |
|
— |
|
— |
|
— |
|
— |
| |||||||
|
Restricted stock forfeited |
|
(175 |
) |
— |
|
— |
|
— |
|
— |
|
— |
|
— |
|
— |
|
— |
| |||||||
|
Net loss |
|
— |
|
— |
|
— |
|
— |
|
— |
|
— |
|
— |
|
(13,616,641 |
) |
(13,616,641 |
) | |||||||
|
|
|
|
|
|
|
|
|
|
|
|
|
|
|
|
|
|
|
|
| |||||||
|
Balances, December 31, 2009 |
|
29,375 |
|
282 |
|
28,179,398 |
|
847,181 |
|
(655,298 |
) |
— |
|
— |
|
(12,130,878 |
) |
16,240,685 |
| |||||||
|
|
|
|
|
|
|
|
|
|
|
|
|
|
|
|
|
|
|
|
| |||||||
|
Interest on promissory note |
|
— |
|
— |
|
— |
|
— |
|
(38,522 |
) |
— |
|
— |
|
— |
|
(38,522 |
) | |||||||
|
Non-controlling interests: |
|
|
|
|
|
|
|
|
|
|
|
|
|
|
|
|
|
|
| |||||||
|
Contributions |
|
— |
|
— |
|
— |
|
4,236 |
|
— |
|
— |
|
— |
|
— |
|
4,236 |
| |||||||
|
Distribution |
|
— |
|
— |
|
— |
|
(1,154,898 |
) |
— |
|
— |
|
— |
|
— |
|
(1,154,898 |
) | |||||||
|
Shares surrendered in settlement of promissory note |
|
— |
|
— |
|
— |
|
— |
|
693,820 |
|
(454 |
) |
(693,820 |
) |
— |
|
— |
| |||||||
|
Net income |
|
— |
|
— |
|
— |
|
941,093 |
|
— |
|
— |
|
— |
|
2,819,965 |
|
3,761,058 |
| |||||||
|
|
|
|
|
|
|
|
|
|
|
|
|
|
|
|
|
|
|
|
| |||||||
|
Balances, December 31, 2010 |
|
29,375 |
|
$ |
282 |
|
$ |
28,179,398 |
|
$ |
637,612 |
|
$ |
— |
|
(454 |
) |
$ |
(693,820 |
) |
$ |
(9,310,913 |
) |
$ |
18,812,559 |
|
See accompanying notes to consolidated financial statements.
NYTIS EXPLORATION (USA) INC.
Consolidated Statements of Cash Flows
|
|
|
Year Ended |
|
Year Ended |
| ||
|
|
|
|
|
|
| ||
|
Cash flows from operating activities: |
|
|
|
|
| ||
|
Net income (loss) |
|
$ |
3,761,058 |
|
$ |
(13,616,641 |
) |
|
Items not involving cash: |
|
|
|
|
| ||
|
Depreciation, depletion and amortization |
|
1,540,175 |
|
2,625,086 |
| ||
|
Accretion of asset retirement obligations |
|
17,367 |
|
43,315 |
| ||
|
Gain on sale of oil and gas properties |
|
(10,103,932 |
) |
— |
| ||
|
Impairment of oil and gas properties |
|
— |
|
16,076,515 |
| ||
|
Deferred tax benefit |
|
4,784,000 |
|
(4,784,000 |
) | ||
|
Unrealized derivative (gain) loss |
|
(294,510 |
) |
242,007 |
| ||
|
Equity investment income |
|
(22,745 |
) |
— |
| ||
|
Net change in: |
|
|
|
|
| ||
|
Accounts receivable |
|
179,971 |
|
331,618 |
| ||
|
Prepaid expenses, deposits and other current assets |
|
2,815 |
|
46,208 |
| ||
|
Accounts payable and accrued liabilities |
|
(112,574 |
) |
223,787 |
| ||
|
Due to related parties |
|
(2,431,177 |
) |
967,413 |
| ||
|
Net cash (used in) provided by operating activities |
|
(2,679,552 |
) |
2,155,308 |
| ||
|
|
|
|
|
|
| ||
|
Cash flows from investing activities: |
|
|
|
|
| ||
|
Acquisition and development of properties and equipment |
|
(4,874,122 |
) |
(3,841,157 |
) | ||
|
Proceeds from disposition of assets |
|
31,203,324 |
|
2,769,438 |
| ||
|
Equity method investment |
|
(560,000 |
) |
— |
| ||
|
Other long-term assets |
|
(202,096 |
) |
(111,427 |
) | ||
|
Net cash provided by (used in) investing activities |
|
25,567,106 |
|
(1,183,146 |
) | ||
|
|
|
|
|
|
| ||
|
Cash flows from financing activities: |
|
|
|
|
| ||
|
Issue of non-controlling interests in subsidiary |
|
4,236 |
|
20,775 |
| ||
|
Deferred offering costs |
|
(169,283 |
) |
— |
| ||
|
Proceeds from notes payable |
|
2,622,258 |
|
520,000 |
| ||
|
Payments on notes payable |
|
(23,553,108 |
) |
(2,000,000 |
) | ||
|
Distribution to non-controlling interests |
|
(1,154,898 |
) |
— |
| ||
|
Net cash used in financing activities |
|
(22,250,795 |
) |
(1,459,225 |
) | ||
|
|
|
|
|
|
| ||
|
Net increase (decrease) in cash and cash equivalents |
|
636,759 |
|
(487,063 |
) | ||
|
|
|
|
|
|
| ||
|
Cash and cash equivalents, beginning of period |
|
208,295 |
|
695,358 |
| ||
|
|
|
|
|
|
| ||
|
Cash and cash equivalents, end of period |
|
$ |
845,054 |
|
$ |
208,295 |
|
See accompanying notes to consolidated financial statements.
NYTIS EXPLORATION (USA) INC.
Notes to Consolidated Financial Statements
For the years ended December 31, 2010 and 2009.
Note 1 — Nature of Operations and Significant Accounting Policies
Nytis Exploration (USA) Inc. (Nytis or the Company) is an independent oil and gas company engaged in the exploration, development and production of natural gas in the United States. The Company’s business is comprised of the assets and properties of Nytis Exploration Company LLC (Nytis LLC) and Nytis Exploration of Pennsylvania LLC (Nytis Pennsylvania) which conduct the Company’s operations in the Appalachian and Illinois Basins. Collectively Nytis, Nytis LLC and Nytis Pennsylvania are referred to as the Company.
Accounting policies used by the Company reflect industry practices and conform to accounting principles generally accepted in the United States of America. The more significant of such accounting policies are briefly discussed below.
Principles of Consolidation
The consolidated financial statements include the accounts of Nytis and its consolidated subsidiaries. As of December 31, 2010, the Company owns 85% of Nytis Pennsylvania and approximately 98% of Nytis LLC. Pursuant to the operating agreement and after the Company received a certain return on its investment in Nytis Pennsylvania, the Company’s interest in Nytis Pennsylvania was reduced from 90% to 85% effective March 2010. All significant intercompany accounts and transactions have been eliminated.
Reclassifications
As of December 31, 2010, due to the long-term nature of the utilization of the prepaid drilling costs, the Company reclassified these prepaid assets as of December 31, 2009 from current assets to long-term assets. The Company evaluated the quantitative and qualitative aspects of the adjustment and determined the reclassification was not material. There was no impact on the Company’s results of operations and a nominal change in cash flows from operating activities with a corresponding change in cash flows from investing activities for the year ended December 31, 2009.
As of December 31, 2010, the Company elected to reflect its derivative gains and losses on a separate line in its Consolidated Statements of Operations. Prior to 2010, such gains and losses were included with oil and gas revenues. For comparative purposes, the Company reclassified its 2009 derivative gains from oil and gas revenues to a separate line. As a result of this reclassification, there was no impact on the Company’s results of operations or cash flow statements for the year ended December 31, 2009.
Cash and Cash Equivalents
Cash and cash equivalents in excess of daily requirements have been generally invested in money market accounts, certificates of deposits and other cash equivalents with maturities of three months or less. Such investments are deemed to be cash equivalents for purposes of the consolidated financial statements. The carrying amount of cash equivalents approximates fair value because of the short maturity and high credit quality of these investments.
Accounts Receivable
Revenue producing activities are conducted primarily in Illinois, Kentucky, Ohio, Pennsylvania and West Virginia. The Company grants credit to all qualified customers, which potentially subjects the Company to credit risk resulting from, among other factors, adverse changes in the industries in which the Company operates and the financial condition of its customers. The Company continuously monitors collections and payments from its customers and maintains an allowance for doubtful accounts based upon its historical experience and any specific customer collection issues that it has identified. At December 31, 2010 and 2009, the Company had not identified any collection issues and as a consequence no allowance for doubtful accounts was provided for on those dates. During 2010 and 2009, the Company’s primary purchaser of its natural gas accounted for 47% and 45%, respectively of the Company’s natural gas revenues and represented approximately 45% of the Company’s natural gas accounts receivable at December 31, 2010. There are a number of purchasers in the areas that the Company sells its production and accordingly, management does not believe that changing its primary purchaser, as the Company elected to do in 2010, or a loss of any other single purchaser would materially impact the Company’s business.
NYTIS EXPLORATION (USA) INC.
Notes to Consolidated Financial Statements
For the years ended December 31, 2010 and 2009.
Note 1 — Nature of Operations and Significant Accounting Policies (continued)
Accounting for Oil and Gas Operations
The Company uses the full cost method of accounting for oil and gas properties. Accordingly, all costs incidental to the acquisition, exploration and development of oil and gas properties, including costs of undeveloped leasehold, dry holes and leasehold equipments, are capitalized. Overhead costs incurred that are directly identified with acquisition, exploration and development activities undertaken by the Company for its own account, and which are not related to production, general corporate overhead or similar activities, are also capitalized.
Unproved properties are excluded from amortized capitalized costs until it is determined whether or not proved reserves can be assigned to such properties. Nytis assesses its unproved properties for impairment at least annually. Significant unproved properties are assessed individually. During 2010, approximately $846,000 of expiring acreage was reclassified into proved property. This acreage represents leases that will expire during 2011 and will not be renewed. During 2009, approximately $620,000 of expiring acreage was reclassified into proved property. This acreage represents leases that expired during 2010 and were not renewed. These costs were included in the ceiling test and depletion calculations.
The Company performs a ceiling test annually. Under the full cost method of accounting, capitalized oil and gas property costs less accumulated depletion and deferred income taxes may not exceed an amount equal to the present value, discounted at 10%, of estimated future net revenues from proved oil and gas reserves less the future cash outflows associated with the asset retirement obligations that have been accrued in the balance sheet, plus the cost, or estimated fair value if lower, of unproved properties and the costs of any properties not being amortized, if any, net of income taxes (“ceiling limitation”). Should the full cost pool exceed this ceiling limitation, impairment is recognized. The present value of estimated future net revenues is computed by applying the average, first-day-of-the-month oil and gas price during the 12-month period ended December 31, 2010 to estimated future production of proved oil and gas reserves as of period-end, less estimated future expenditures to be incurred in developing and producing the proved reserves assuming the continuation of existing economic conditions.
The December 31, 2009 ceiling test was based on average first-day-of-the-month prices during the twelve-month period prior to December 31, 2009 pursuant to the Securities and Exchange Commission’s (SEC) new “Modernization of Oil and Gas Reporting” rule (see Note 2). As a result of applying the new pricing rules and the five year limitation rule for proved undeveloped reserves, the Company recognized a ceiling test impairment expense of $16.1 million as of December 31, 2009. Based on the prior rules utilizing spot prices at the end of the year, the Company would have not exceeded its ceiling limitation. No ceiling test impairment expense related to the Company’s oil and gas properties was recorded during 2010.
Capitalized costs are depleted by an equivalent unit-of-production method, converting gas to oil at the ratio of six thousand cubic feet of natural gas to one barrel of oil. Depletion is calculated using the capitalized costs, including estimated asset retirement costs, plus the estimated future expenditures (based on current costs) to be incurred in developing proved reserves, net of estimated salvage values.
No gain or loss is recognized upon disposal of oil and gas properties unless such disposal significantly alters the relationship between capitalized costs and proved reserves. All costs related to production activities, including work-over costs incurred solely to maintain or increase levels of production from an existing completion interval, are charged to expense as incurred. During 2010, the Company recognized a gain on the disposition of its Pennsylvania oil and gas properties as the disposition significantly altered the relationship between capitalized costs and proved reserves. See Note 4.
Other Property and Equipment
Other property and equipment are recorded at cost upon acquisition. Depreciation of other property and equipment over their estimated useful lives is provided for using the straight-line method over three to seven years.
NYTIS EXPLORATION (USA) INC.
Notes to Consolidated Financial Statements
For the years ended December 31, 2010 and 2009.
Note 1 — Nature of Operations and Significant Accounting Policies (continued)
Long-Lived Assets
The Company reviews its long-lived assets other than oil and gas properties for impairment whenever events or changes in circumstances indicate that the carrying amount of the asset may not be recovered. The Company looks primarily to the estimated undiscounted future cash flows in its assessment of whether or not long-lived assets have been impaired.
Equity Method Investments
Investee companies that are not consolidated, but over which the Company exercises significant influence, are accounted for under the equity method of accounting. Under the equity method of accounting, an Investee company’s accounts are not reflected within the Company’s Consolidated Balance Sheets and Statements of Operations; however, the Company’s share of the earnings or losses, net of intercompany earnings or losses, of the Investee company is reflected in earnings.
Proportional Consolidation
The Company accounts for its 17.5% ownership interest in Sullivan Energy Ventures LLC (Sullivan), using the proportionate consolidation method of accounting. Therefore, the Company’s proportionate share of Sullivan’s assets, liabilities, revenues and expenses are reflected in the corresponding line items within the balance sheets and statements of operations. The Company includes its proportionate share of reserves from the Sullivan assets in its reserves presented in Note 17 and for purposes of calculating its depletion and ceiling test limitation.
Asset Retirement Obligations
The Company’s asset retirement obligations (ARO) relate to future costs associated with the plugging and abandonment of oil and gas wells, removal of equipment and facilities from leased acreage and returning such land to its original condition. The fair value of a liability for an ARO is recorded in the period in which it is incurred and the cost of such liability is recorded as an increase in the carrying amount of the related long-lived asset by the same amount. The liability is accreted each period and the capitalized cost is depleted on a units-of-production basis as part of the full cost pool. Revisions to estimated AROs result in adjustments to the related capitalized asset and corresponding liability.
The estimated ARO liability is based on estimated economic lives, estimates as to the cost to plug and abandon the wells in the future, and federal and state regulatory requirements. The liability is discounted using a credit-adjusted risk-free rate estimated at the time the liability is incurred or increased as a result of a reassessment of expected cash flows and assumptions inherent in the estimation of the liability. Upward revisions to the liability could occur due to changes in estimated abandonment costs or well economic lives, or if federal or state regulators enact new requirements regarding the abandonment of wells. AROs are valued utilizing Level 3 fair value measurement inputs.
The following table is a reconciliation of the ARO for the years ended December 31, 2010 and 2009.
|
|
|
Year Ended |
|
Year Ended |
| ||
|
|
|
|
|
|
| ||
|
Balance at beginning of year |
|
$ |
749,470 |
|
$ |
669,963 |
|
|
Accretion expense |
|
17,367 |
|
43,315 |
| ||
|
Additions during period |
|
97,597 |
|
36,192 |
| ||
|
Property dispositions |
|
(512,480 |
) |
— |
| ||
|
|
|
|
|
|
| ||
|
Balance at end of year |
|
$ |
351,954 |
|
$ |
749,470 |
|
NYTIS EXPLORATION (USA) INC.
Notes to Consolidated Financial Statements
For the years ended December 31, 2010 and 2009.
Note 1 — Nature of Operations and Significant Accounting Policies (continued)
Financial Instruments
The Company’s financial instruments include cash and cash equivalents, accounts receivables, trade payables and accrued liabilities. The carrying value of cash and cash equivalents, accounts receivables, payables and accrued liabilities are considered to be representative of their fair value, due to the short maturity of these instruments. The Company’s derivative instruments are recorded at fair value, as discussed below and in Note 3. The carrying amount of the Company’s credit facility approximated fair value since borrowings bear interest at variable rates.
Gas Derivative Instruments
The Company enters into commodity derivative contracts to manage its exposure to natural gas price volatility with an objective to achieve more predictable cash flows. Commodity derivative contracts may take the form of futures contracts, swaps or options. The Company has elected not to designate its derivatives as cash flow hedges. All derivatives are initially and subsequently measured at estimated fair value and recorded as assets or liabilities on the consolidated balance sheets and the changes in fair value are recognized as gains or losses in revenues in the consolidated statements of operations.
Income Taxes
Nytis accounts for income taxes using the asset and liability method, whereby deferred tax assets and liabilities are recognized for the future tax consequences attributable to differences between the financial statement carrying amounts of assets and liabilities and their respective tax bases, as well as the future tax consequences attributable to the future utilization of existing tax net operating losses and other types of carryforwards. Deferred tax assets and liabilities are measured using enacted tax rates expected to apply to taxable income in the years in which those temporary differences and carryforwards are expected to be recovered or settled. The effect on deferred tax assets and liabilities of a change in tax rates is recognized in income in the period that includes the enactment date.
Stock-Based Compensation
Compensation cost is measured at the grant date based on the fair value of the awards and is recognized on a straight-line basis over the requisite service period (usually the vesting period).
Revenue Recognition
The Company accounts for natural gas sales using the entitlements method. The Company accounts for oil sales when title to the product is transferred. Under the entitlements method, revenue is recorded based upon the Company’s share of volumes sold, regardless of whether the Company has taken its proportionate share of volumes produced. The Company records a receivable or payable to the extent it receives less or more than its proportionate share of the related revenue. Gas imbalances at December 31, 2010 and 2009 were not significant.
Use of Estimates in the Preparation of Financial Statements
The preparation of financial statements in conformity with accounting principles generally accepted in the United States requires management to make estimates and assumptions that affect the reported amounts of assets, liabilities and expenses and disclosure of contingent assets and liabilities. Significant items subject to such estimates and assumptions include the carrying value of oil and gas properties, the estimate of proved oil and gas reserve volumes and the related depletion and present value of estimated future net cash flows and the ceiling test applied to capitalized oil and gas properties, determining the amounts recorded for deferred income taxes, stock-based compensation, fair value of derivative instruments and asset retirement obligations. Actual results could differ from those estimates and assumptions used.
NYTIS EXPLORATION (USA) INC.
Notes to Consolidated Financial Statements
For the years ended December 31, 2010 and 2009.
Note 1 — Nature of Operations and Significant Accounting Policies (continued)
Impact of Recently Issued Accounting Standards
Effective January 1, 2010, the Company adopted new authoritative guidance for fair value measurements and disclosures requiring additional disclosures related to transfers in and out of Levels 1 and 2 fair value measurements, inputs and valuation techniques used to value Level 2 and 3 measurements and fair value disclosures for each class of asset and liability for Levels 1, 2, and 3. The adoption had no impact on the Company’s consolidated financial position, results of operations or cash flows. Effective January 1, 2011, the Company will adopt the new guidance requiring that purchases, sales, issuances, and settlements in the rollforward activity in Level 3 measurements be disclosed. Refer to Note 3 for further details regarding the Company’s assets and liabilities measured at fair value.
Note 2 — Change in Method of Determining Oil and Gas Reserves
In December 2008, the SEC revised its requirements for oil and gas reserves estimation and disclosures and related definitions to align them with current practices and changes in technology. In January 2010, the Financial Accounting Standards Board (FASB) aligned the current oil and gas reserve estimation and disclosure requirements with those of the SEC. As discussed earlier, the Company follows the full cost method of accounting for which the SEC provides guidance. Among other things, the SEC and FASB amendments replace the single-day, year-end pricing assumption with a twelve-month average pricing assumption, revise certain definitions and allow the use of certain technologies to establish reserves.
As of December 31, 2009, the Company changed its method of determining the quantities of oil and gas reserves which impacted the amount recorded for depreciation, depletion and amortization and the ceiling test calculation for oil and gas properties. Under the new rules, the Company prepared its oil and gas reserve estimates as of December 31, 2009 using average, first-day-of-the-month prices during the twelve month period ending December 31, 2009. In prior years, the Company used year-end spot prices. For 2009, the Company calculated depletion for the year using year-end reserves, and as a result, the new rules impacted the amount of depletion recorded for oil and gas properties and the ceiling test calculation for the year ended December 31, 2009. In addition, under the new guidance, subsequent price increases cannot be considered in the ceiling test calculation. Another significant provision of the new rules is a general requirement that, subject to limited exceptions, proved undeveloped reserves may only be booked if they relate to wells scheduled to be drilled within five years of the date of booking.
The adoption of the new rules was considered a change in accounting principle inseparable from a change in accounting estimate and due to the change in methodology for pricing utilized to prepare oil and gas reserves and the five year limitation rule for proved undeveloped reserves, had a significant impact on the ceiling test for the Company for the year ended December 31, 2009. Under the new rules, the Company’s oil and gas properties exceeded the ceiling limitation by approximately $16.1 million. Under the old rules, the Company would not have exceeded its ceiling limitations. In addition, the Company’s depletion rate, calculated under the new rules, increased by approximately 56% compared to the depletion rate calculated using the previous guidelines. Accordingly, the impact of the adoption of the new rules resulted in a reduction of net income of $16.2 million for the year ended December 31, 2009.
Note 3 — Fair Value Measurements
Authoritative guidance defines fair value as the price that would be received to sell an asset or paid to transfer a liability (an exit price) in an orderly transaction between market participants at the measurement date. The guidance establishes a hierarchy for inputs used in measuring fair value that maximizes the use of observable inputs and minimizes the use of unobservable inputs by requiring that the most observable inputs be used when available. Observable inputs are inputs that market participants would use in pricing the asset or liability developed based on market data obtained from sources independent of the Company. Unobservable inputs are inputs that reflect the Company’s assumptions of what market participants would use in pricing the asset or liability developed based on the best information available in the circumstances. The hierarchy is broken down into three levels based on the reliability of the inputs as follows:
NYTIS EXPLORATION (USA) INC.
Notes to Consolidated Financial Statements
For the years ended December 31, 2010 and 2009.
Note 3 — Fair Value Measurements (continued)
Level 1: Quoted prices are available in active markets for identical assets or liabilities;
Level 2: Quoted prices in active markets for similar assets or liabilities that are observable for the asset or liability; or
Level 3: Unobservable pricing inputs that are generally less observable from objective sources, such as discounted cash flow models or valuations.
Financial assets and liabilities are classified based on the lowest level of input that is significant to the fair value measurement. The Company’s policy is to recognize transfers in/and or out of fair value hierarchy as of the end of the reporting period for which the event or change in circumstances caused the transfer. The Company has consistently applied the valuation techniques discussed below for all periods presented.
The following table presents the Company’s financial assets and liabilities that were accounted for at fair value on a recurring basis as of December 31, 2010 and 2009 by level within the fair value hierarchy:
|
|
|
Fair Value Measurements Using |
| ||||||||||
|
|
|
Level 1 |
|
Level 2 |
|
Level 3 |
|
Total |
| ||||
|
December 31, 2010 |
|
|
|
|
|
|
|
|
| ||||
|
Assets: |
|
|
|
|
|
|
|
|
| ||||
|
Commodity derivatives |
|
$ |
— |
|
$ |
170,840 |
|
$ |
— |
|
$ |
170,840 |
|
|
|
|
|
|
|
|
|
|
|
| ||||
|
December 31, 2009 |
|
|
|
|
|
|
|
|
| ||||
|
Liabilities: |
|
|
|
|
|
|
|
|
| ||||
|
Commodity derivatives |
|
$ |
— |
|
$ |
123,670 |
|
$ |
— |
|
$ |
123,670 |
|
As of December 31, 2010, the Company’s commodity derivative financial instruments are comprised of two natural gas swap agreements. As of December 31, 2009, the Company’s commodity derivative financial instruments were comprised of four natural gas swap agreements that expired in 2010. The fair values of the swap agreements are determined under the income valuation technique using a discounted cash flows model. The valuation models require a variety of inputs, including contractual terms, published forward prices, volatilities for options, and discount rates, as appropriate. The Company’s estimates of fair value of derivatives include consideration of the counterparty’s credit worthiness, the Company’s credit worthiness and the time value of money. The consideration of these factors results in an estimated exit-price for each derivative asset or liability under a market place participant’s view. All of the significant inputs are observable, either directly or indirectly; therefore, the Company’s derivative instruments are included within the Level 2 fair value hierarchy. The counterparty in all of the Company’s commodity derivative financial instruments is the lender in the Company’s bank credit facility.
Assets Measured and Recorded at Fair Value on a Non-recurring Basis
The Company uses the income valuation technique to estimate the fair value of asset retirement obligations using the amounts and timing of expected future dismantlement costs, credit-adjusted risk-free rate and time value of money. Accordingly, the fair value is based on unobservable pricing inputs and therefore, is included within the Level 3 fair value hierarchy. During the years ended December 31, 2010 and 2009, the Company recorded asset retirement obligations of approximately $98,000 and $36,000, respectively. See Note 1 for additional information.
NYTIS EXPLORATION (USA) INC.
Notes to Consolidated Financial Statements
For the years ended December 31, 2010 and 2009.
Note 3 — Fair Value Measurements (continued)
The acquisition discussed in Note 4 for $1.3 million qualifies as a business combination and, as such, the Company estimated the fair value of each property as of the acquisition date (the date on which the Company obtained control of the properties). The fair value is the price that would be received to sell an asset or paid to transfer a liability in an orderly transaction between market participants at the measurement date. Fair value measurements also utilize assumptions of market participants. The Company used a discounted cash flow model and made market assumptions as to future commodity prices, projections of estimated quantities of oil and natural gas reserves, expectations for timing and amount of future development and operating costs, projections of future rates of production, expected recovery rates and risk adjusted discount rates. These assumptions represent Level 3 inputs.
Note 4 — Dispositions and Acquisitions
In March 2010, the Company sold all of its interests in the Pennsylvania assets owned by Nytis LLC and Nytis Pennsylvania to a third party for $30.2 million, net of normal adjustments and transaction fees, with an effective date of February 1, 2010. Proceeds from this sale were used to reduce outstanding borrowings due under the Company’s credit facility (see Note 7) and accounts payable due Nytis Exploration Company (NEC) (see Note 14), to pay resultant taxes due to the sale of these assets and distribute funds to members of Nytis Pennsylvania. Because the sale of these assets significantly altered the relationship between capitalized costs and proved reserves, the Company recorded a gain of approximately $10.1 million.
In September 2010, the Company sold all of its interest in undeveloped acreage located in Webster County, West Virginia for approximately $770,000.
During 2010, the Company purchased a 17.5% interest in Sullivan Energy Ventures, LLC (Sullivan) for approximately $415,000. As of December 31, 2010, Sullivan’s investment consists of a 50% interest in Sunrise Energy, LLC (Sunrise). Sunrise’s assets are comprised principally of a gathering system which moves production from the Company’s producing gas wells in a specific area to a major delivery point to be transported to market, unevaluated properties and producing wells. The Company includes its proportionate share of Sunrise’s net assets in its oil and gas properties in the consolidated balance sheet. All intercompany transactions are eliminated.
In June 2010, the Company acquired an interest in 19 producing wells located Boyd and Greenup Counties, Kentucky for a cash purchase price of approximately $1.3 million which qualifies as a business combination. The following table summarizes the consideration paid to the sellers and the amounts of the assets acquired and liabilities assumed in the $1.3 million acquisition.
|
|
|
(in thousands) |
| |
|
Consideration paid to sellers: |
|
|
| |
|
Cash consideration |
|
$ |
1,300 |
|
|
|
|
|
| |
|
Recognized amounts of identifiable assets acquired and liabilities assumed: |
|
|
| |
|
Proved developed and undeveloped properties |
|
$ |
1,362 |
|
|
Asset retirement obligations |
|
(62 |
) | |
|
Total identifiable net assets |
|
$ |
1,300 |
|
During 2009, the Company received approximately $2.7 million relating to two separate farmout agreements with terms of 5 and 10 years, respectively. Under the terms of the agreements, the co-parties earn an interest in specific undeveloped acreage in Kentucky and West Virginia by completing a defined drilling program. The Company may participate up to a maximum of 50% working interest in the drilling of any well and retains an overriding royalty ranging between 2% and 5%. If the drilling commitments are not completed by the co-parties, the unearned acreage is retained by the Company. The proceeds from these farmout agreements were recorded as a reduction of the Company’s investment in its oil and gas properties.
NYTIS EXPLORATION (USA) INC.
Notes to Consolidated Financial Statements
For the years ended December 31, 2010 and 2009.
Note 5 — Property and Equipment
Net property and equipment at December 31, 2010 and 2009 consists of the following:
|
|
|
Year Ended |
|
Year Ended |
| ||
|
|
|
|
|
|
| ||
|
Oil and gas properties: |
|
|
|
|
| ||
|
Proved oil and gas properties |
|
$ |
43,535,107 |
|
$ |
60,795,447 |
|
|
Unproved properties not subject to depletion |
|
2,163,899 |
|
5,135,018 |
| ||
|
Accumulated depreciation, depletion, amortization and impairment |
|
(22,120,742 |
) |
(24,057,894 |
) | ||
|
Net oil and gas properties |
|
23,578,264 |
|
41,872,571 |
| ||
|
|
|
|
|
|
| ||
|
Furniture and fixtures, computer hardware and software, and other equipment |
|
488,194 |
|
519,039 |
| ||
|
Accumulated depreciation and amortization |
|
(407,491 |
) |
(390,852 |
) | ||
|
Net other property and equipment |
|
80,703 |
|
128,187 |
| ||
|
|
|
|
|
|
| ||
|
Total net property and equipment |
|
$ |
23,658,967 |
|
$ |
42,000,758 |
|
At December 31, 2010 and 2009, the Company had approximately $2.2 million and $5.1 million, respectively, of unproved oil and gas properties not subject to depletion. The costs not subject to depletion relate to unproved properties that are excluded from amortized capital costs until it is determined whether or not proved reserves can be assigned to such properties. The excluded properties are assessed for impairment at least annually. Subject to industry conditions, evaluation of most of these properties and the inclusion of their costs in amortized capital costs is expected to be completed within five years.
During the years ended December 31, 2010 and 2009, overhead applicable to acquisition, development and exploration activities in the amounts of approximately $436,000 and $670,000, respectively, was capitalized to oil and gas properties.
Depreciation, depletion, amortization and impairment expense related to oil and gas properties for the years ended December 31, 2010 and 2009 was approximately $1.5 million and $18.6 million, respectively. Depreciation and amortization expense related to furniture and fixtures, computer hardware and software and other equipment for the years ended December 31, 2010 and 2009 was approximately $50,000 and $85,000, respectively.
Note 6 — Equity Method Investment
During 2010, the Company invested $560,000 for a 50% interest in Crawford County Gas Gathering Company, LLC (CCGGC). CCGGC owns and operates pipelines and related gathering and treating facilities that it acquired in 2010. The Company’s gas production located in Illinois is gathered and transported on CCGGC’s gathering facilities. The Company’s investment in CCGGC is accounted for under the equity method of accounting, and its share of the income or loss is recognized. During 2010, the Company recorded approximately $23,000 of equity method income related to this investment.
Note 7 — Bank Credit Facility
On May 31, 2010, the Company amended its credit facility with the Bank of Oklahoma. The credit facility matures in May 2012. No repayments of principal are required until maturity, except to the extent that outstanding balances exceed the borrowing base then in effect; however, the Company has the right both to repay principal at any time and to reborrow. Subject to the agreement of the Company and the lender, the size of the credit facility may be increased up to $50.0 million. As of December 31, 2010, the borrowing base was $8.0 million. The borrowing base is redetermined semi-annually, and the available borrowing amount could be increased or decreased as a result of such redeterminations. Under certain
NYTIS EXPLORATION (USA) INC.
Notes to Consolidated Financial Statements
For the years ended December 31, 2010 and 2009.
Note 7 — Bank Credit Facility (continued)
circumstances the lender may request an interim redetermination. The facility has variable interest rates based upon the ratio of outstanding debt to the borrowing base. Interest rates are based on either an Alternative Base Rate or LIBOR. The portion of the loan based on an “Alternate Base Rate” is determined by the rate per annum equal to the greatest of the following: (a) the Federal Funds Rate for such day plus one-half of one percentage point, (b) the Prime Rate for such day or (c) LIBOR for a one-month LIBOR Interest Period plus 2.5%; plus 1.5%. The portion based on LIBOR is determined by the rate per annum equal to LIBOR plus between 2.5% and 3.25% for each LIBOR tranche.
For all debt outstanding regardless of whether the loan is based on the Alternative Base Rate or LIBOR, there is a minimum floor of 4.5% per annum. In addition, the credit facility includes a hedging component that provides a line of credit under commodity swap, exchange, collar, cap and fixed price agreements and agreements designated to protect the Company against changes in interest and currency exchange rates. The maximum amount of credit on this line is $2.7 million. The credit facility is collateralized by substantially all of the Company’s oil and gas assets. The credit facility includes terms that place limitations on certain types of activities and the payment of dividends, and requires satisfaction of a minimum current ratio (the ratio of current assets to current liabilities) of 1.0 to 1.0 and a maximum Funded Debt Ratio (the ratio of the outstanding balance of all interest bearing indebtedness to the sum of EBITDAX (net income plus interest expense, income taxes, depreciation, depletion, amortization, exploration and impairment expenses and other non-cash charges) for the most recently completed four consecutive fiscal quarters) of 3.5 to 1.0 as of the end of any fiscal quarter.
As of December 31, 2010 and 2009, outstanding balances on the credit facility were approximately $3.1 million and $24.0 million, respectively. The Company’s effective borrowing rate at December 31, 2010 and 2009 was 4.8% and 4.5%, respectively. The Company is in compliance with all covenants associated with the credit agreement as of December 31, 2010. As of December 31, 2010, there were no outstanding borrowings under the hedging component of the line of credit.
Note 8 — Income Taxes
The provision for income taxes for the years ended December 31, 2010 and 2009 consists of the following:
|
|
|
Year Ended |
|
Year Ended |
| ||
|
|
|
|
|
|
| ||
|
Current income tax expense |
|
$ |
620,000 |
|
$ |
— |
|
|
Deferred income tax (benefit) expense |
|
2,699,000 |
|
(7,113,000 |
) | ||
|
Change in valuation allowance |
|
2,085,000 |
|
2,329,000 |
| ||
|
|
|
|
|
|
| ||
|
Total income tax expense (benefit) |
|
$ |
5,404,000 |
|
$ |
(4,784,000 |
) |
NYTIS EXPLORATION (USA) INC.
Notes to Consolidated Financial Statements
For the years ended December 31, 2010 and 2009.
Note 8 — Income Taxes (continued)
The effective income tax rate for the years ended December 31, 2010 and 2009 differed from the statutory U.S. federal income tax rate as follows:
|
|
|
Year Ended |
|
Year Ended |
|
|
|
|
|
|
|
|
|
Federal income tax rate |
|
35.0 |
% |
(35.0 |
)% |
|
State income taxes, net of federal benefit |
|
6.7 |
|
(5.0 |
) |
|
Other |
|
(.8 |
) |
(.5 |
) |
|
Increase in valuation allowance and other |
|
18.1 |
|
14.1 |
|
|
|
|
|
|
|
|
|
Total income tax (benefit) |
|
59.0 |
% |
(26.4 |
)% |
The tax effects of temporary differences that gave rise to significant portions of the deferred tax assets and liabilities at December 31, 2010 and 2009 are presented below:
|
|
|
December 31, |
|
December 31, |
| ||
|
|
|
|
|
|
| ||
|
Deferred tax assets |
|
|
|
|
| ||
|
Net operating loss carryforwards |
|
$ |
1,627,000 |
|
$ |
5,589,000 |
|
|
Depletion carryforwards |
|
1,200,000 |
|
741,000 |
| ||
|
Accrual and other |
|
62,000 |
|
170,000 |
| ||
|
Asset retirement obligations |
|
146,000 |
|
300,000 |
| ||
|
Property, plant and equipment |
|
1,400,000 |
|
313,000 |
| ||
|
Total deferred tax assets |
|
4,435,000 |
|
7,113,000 |
| ||
|
|
|
|
|
|
| ||
|
Deferred tax liability |
|
|
|
|
| ||
|
Derivatives |
|
(21,000 |
) |
— |
| ||
|
|
|
|
|
|
| ||
|
Less valuation allowance |
|
(4,414,000 |
) |
(2,329,000 |
) | ||
|
|
|
|
|
|
| ||
|
Net deferred tax asset |
|
$ |
— |
|
$ |
4,784,000 |
|
The Company has net operating losses (NOL) of approximately $3.7 million available to reduce future years’ federal taxable income. The federal net operating losses expire in 2029. The Company has NOL of approximately $7.4 million available to reduce future years’ state taxable income. These state NOL will expire in the future based upon each jurisdiction’s specific law surrounding NOL carryforwards. Tax returns are subject to audit by various taxation authorities. The results of any audits will be accounted for in the period in which they are determined.
NYTIS EXPLORATION (USA) INC.
Notes to Consolidated Financial Statements
For the years ended December 31, 2010 and 2009.
Note 8 — Income Taxes (continued)
The Company believes that the tax positions taken in the Company’s tax returns satisfy the more-likely-than-not threshold for benefit recognition. Furthermore, the Company believes it has appropriately addressed material book-tax differences. Nytis is confident that the amounts claimed (or expected to be claimed) in the tax returns reflect the largest amount of such benefits that are greater than fifty percent likely of being realized upon ultimate settlement. Accordingly, no liabilities have been recorded by the Company. Any potential adjustments for uncertain tax positions would be a reclassification between the deferred tax asset related to the Company’s NOL and another deferred tax asset. No penalty or interest would be recorded as the Company has not been in a taxable income position prior to 2010.
Note 9 — Stockholders’ Equity
Authorized and Issued Capital Stock
The authorized capital stock of Nytis is 101,000 shares, consisting of 100,000 shares of common stock with a par value of $0.01 per share and 1,000 shares of preferred stock with a par value of $0.01 per share. On May 19, 2005, the Company issued 28,175 shares of common stock for proceeds, including the receipt of a share purchase promissory note, totaling approximately $28.1 million net of share issuance costs of approximately $89,000. Subsequent to that date and through the year ending December 31, 2008, the Company issued 1,200 shares of restricted stock. During the year ended December 31, 2009, the Company issued 175 shares of restricted stock and 175 shares of restricted stock were forfeited. During 2010, in a cashless transaction, 454 shares of stock valued at approximately $694,000 were surrendered to pay a promissory note receivable and held as treasury shares resulting in 28,921 shares of common stock outstanding (net of treasury shares) at December 31, 2010.
Stock Option Plan
Under the Company’s stock option plan, the aggregate number of options which may be issued to directors, employees and consultants shall not exceed 300. Any shares to be issued upon exercise of the options would be from newly issued shares. The option price for incentive stock options granted under the plan shall not be less than 100% of the fair value of the shares subject to the option. The option price for nonqualified stock options granted under the plan shall not be less than 85% of the fair market value. The following table summarizes certain information with respect to the Company’s stock option activity for the years ended December 31, 2010 and 2009. There were no option activities for the year ended December 31, 2010.
|
|
|
Number of |
|
Weighted |
|
Weighted |
| |
|
|
|
|
|
|
|
|
| |
|
Outstanding — January 1, 2009 |
|
255 |
|
$ |
|
|
7.46 |
|
|
Forfeited |
|
(45 |
) |
1,067 |
|
|
| |
|
|
|
|
|
|
|
|
| |
|
Outstanding — December 31, 2009 |
|
210 |
|
1,043 |
|
6.43 |
| |
|
|
|
|
|
|
|
|
| |
|
Outstanding — December 31, 2010 |
|
210 |
|
1,043 |
|
5.43 |
| |
|
|
|
|
|
|
|
|
| |
|
Exercisable — December 31, 2010 |
|
210 |
|
$ |
1,043 |
|
5.43 |
|
Each option has ten year duration from the date of each individual grant.
For the years ended December 31, 2010 and 2009, there was no compensation costs related to non-vested options.
NYTIS EXPLORATION (USA) INC.
Notes to Consolidated Financial Statements
For the years ended December 31, 2010 and 2009.
Note 9 — Stockholders’ Equity (continued)
Warrants
Prior to January 1, 2006, the Company granted 1,500 warrants to an officer of the Company. Any shares to be issued upon exercise of the warrants would be from newly issued shares. Utilizing the minimum valuation method under the Black-Scholes option price model, the Company determined that the fair value of the warrants at the date of grant was nil. Each warrant enables the holder to purchase one share of common stock of the Company, at an initial exercise price of $1,000 per share of common stock until expiry on June 1, 2015. The initial warrant exercise price of $1,000 per share of common stock is to increase annually at 6% starting June 1, 2006 and the exercise price for each of the warrants at December 31, 2010 and 2009 was $1,386 and $1,307, respectively. Of the 1,500 warrants outstanding at December 31, 2010 and 2009, all are currently exercisable. There were no warrants granted in 2009 and 2010.
Restricted Stock Plan
Under the Company’s restricted stock plan, participants may be granted stock without cost to the participant. The aggregate number of shares of restricted stock which may be granted under the plan shall not exceed 1,200. Shares of restricted stock vest upon achieving certain performance targets, which are based on the fair value of the consideration received from the sale or other disposition of shares of the Company’s common stock as a result of a change of control. The Company cannot reasonably estimate the grant date fair value of these units due to the complexity of the terms of the vesting. The shares of restricted stock are held in escrow and upon vesting are released to the participants.
There were 1,200 shares of restricted stock outstanding at December 31, 2010 and 2009. There was no activity with respect to the Company’s restricted stock plan during 2010. For the year ended December 31, 2009, 175 shares of restricted stock were granted and forfeited.
The Company continues to account for grants made in 2005 using variable plan accounting. The Company accounts for grants made after 2005 at their intrinsic value, remeasured at each reporting date through the date of vesting. The final measurement will be the intrinsic value of the instrument at the vesting date. The accounting for grants issued subsequent to 2005 is the same because the final measurement of compensation cost will be based on the number of shares of restricted stock that ultimately vest using the market price at the date of vesting (i.e. a date performance criterion is met). At December 31, 2010 and 2009, the Company estimated that none of the shares of restricted stock issued would vest and accordingly, no compensation cost has been recorded.
Share Promissory Note
On May 19, 2005, the Company received a promissory note totaling approximately $500,000 due from a corporation controlled by an officer of the Company in exchange for the issuance of 500 shares of common stock issued to the corporation. The promissory note bears interest at a rate of 6% per annum compounded annually and is secured under a stock pledge agreement by 500 shares of common stock of the Company and by a personal guarantee by the officer. The promissory note, including accrued interest, is payable on the earlier of (i) June 1, 2012 or (ii) the date upon which the Company or any successor to the Company registers any class of its securities under Section 12 of the Securities Exchange Act of 1934 (the 1934 Act), is required to file periodic reports under Section 15(d) of the 1934 Act, or files a registration statement under the Securities Act of 1933, as amended.
On December 31, 2010, the corporation controlled by an officer of the Company surrendered 454 shares of the Company’s common stock in full settlement of the promissory note totaling approximately $694,000 including accrued interest. At December 31, 2009, the promissory note including accrued interest totaled approximately $655,000.
NYTIS EXPLORATION (USA) INC.
Notes to Consolidated Financial Statements
For the years ended December 31, 2010 and 2009.
Note 9 — Stockholders’ Equity (continued)
Restricted Membership Plan
On March 16, 2006, a restricted membership interest plan (the Plan) was approved for Nytis LLC. The objective of the Plan is to provide key employees equity ownership in Nytis LLC. The Plan provides for vesting and forfeiture provisions based on (i) the Company achieving a target internal rate of return upon certain changes in control with regard to the Company, Nytis LLC, or substantially all of the assets of the Company and (ii) the employee’s continued employment. In 2008 the Plan was amended so that the interests available for grant under the Plan would not exceed five percent of the membership interest in Nytis LLC. The following table summarizes certain information with respect to the Plan for the years ended December 31, 2010 and 2009.
|
|
|
Percentage Outstanding |
|
|
|
|
|
|
|
Outstanding at January 1, 2009 |
|
4.75 |
% |
|
Granted |
|
.30 |
|
|
Forfeited |
|
(.15 |
) |
|
|
|
|
|
|
Outstanding at December 31, 2009 |
|
4.90 |
|
|
Forfeited |
|
(.40 |
) |
|
|
|
|
|
|
Outstanding at December 31, 2010 |
|
4.50 |
% |
This plan is similar to the restricted stock plan discussed earlier. The Company accounts for grants under the restricted membership plan at their intrinsic value, remeasured at each reporting date. The final measure of compensation cost is based on the membership interests that ultimately vest and the market price at the date the performance criteria are met. At December 31, 2010 and 2009, the Company estimated that none of the membership interests issued would vest and accordingly, no compensation cost has been recorded.
Note 10 — Accounts Payable and Accrued Liabilities
Accounts payable and accrued liabilities at December 31, 2010 and 2009 consist of the following:
|
|
|
December 31, |
|
December 31, |
| ||
|
|
|
|
|
|
| ||
|
Accounts payable |
|
$ |
341,899 |
|
$ |
224,597 |
|
|
Oil and gas revenue payable to oil and gas property owners |
|
325,544 |
|
554,188 |
| ||
|
Production taxes payable |
|
35,044 |
|
16,278 |
| ||
|
Accrued drilling costs |
|
112,661 |
|
171,016 |
| ||
|
Accrued lease operating costs |
|
98,324 |
|
252,667 |
| ||
|
Accrued ad valorem taxes |
|
305,224 |
|
342,099 |
| ||
|
Accrued general and administrative expenses |
|
168,761 |
|
207,019 |
| ||
|
Accrued other |
|
244,736 |
|
138,366 |
| ||
|
|
|
|
|
|
| ||
|
Total accounts payable and accrued liabilities |
|
$ |
1,632,193 |
|
$ |
1,906,230 |
|
NYTIS EXPLORATION (USA) INC.
Notes to Consolidated Financial Statements
For the years ended December 31, 2010 and 2009.
Note 11 — Physical Delivery Contracts and Gas Derivatives
The Company has historically used commodity-based derivative contracts to manage exposures to commodity price on certain of its gas production. The Company does not hold or issue derivative financial instruments for speculative or trading purposes. Nytis also enters into gas physical delivery contracts to effectively provide gas price hedges. Because these contracts are not expected to be net cash settled, they are considered to be normal sales contracts and not derivatives. Therefore, these contracts are not recorded at fair value in the consolidated financial statements.
The Company has fixed price contracts requiring physical deliveries for approximately 90 Mcf per day for an average sales price of $5.26 per Mcf, which are on a month to month basis.
At December 31, 2010, other than the above mentioned contracts, the Company’s other gas sales contracts approximate index prices.
The Company’s swap agreements as of December 31, 2010 are summarized in the table below:
|
Agreement |
|
Remaining |
|
|
|
Fixed Price |
|
Floating Price |
|
|
Type |
|
Term |
|
Quantity |
|
Counterparty Payer |
|
Nytis Payer |
|
|
Swap |
|
1/11 – 5/11 |
|
10,000 MMBtu/month |
|
$6.03/ MMBtu |
|
(a) |
|
|
Swap |
|
1/11 - 4/12 |
|
10,000 MMBtu/month |
|
$5.25/ MMBtu |
|
(a) |
|
(a) NYMEX Henry Hub Natural Gas futures contract for the respective delivery month.
For its swap instruments, the Company receives a fixed price for the hedged commodity and pays a floating price to the counterparty. The fixed-price payment and the floating-price payment are netted, resulting in a net amount due to or from the counterparty.
The following table summarizes the fair value of the derivatives recorded in the consolidated balance sheets. These derivative instruments are not designated as cash flow hedging instruments for accounting purposes:
|
|
|
December 31, |
|
December 31, |
| ||
|
Natural gas derivative contracts: |
|
|
|
|
| ||
|
Current assets |
|
$ |
171,000 |
|
$ |
— |
|
|
Current liabilities |
|
$ |
— |
|
$ |
124,000 |
|
The table below summarizes the realized and unrealized gains and losses related to the Company’s derivative instruments for the years ended December 31, 2010 and 2009. These realized and unrealized gains and losses are recorded and included in commodity derivative gain in the accompanying consolidated statements of operations.
|
|
|
December 31, |
|
December 31, |
| ||
|
Commodity derivative contracts: |
|
|
|
|
| ||
|
Realized gains |
|
$ |
397,000 |
|
$ |
469,000 |
|
|
Unrealized gains (losses) |
|
295,000 |
|
(242,000 |
) | ||
|
|
|
|
|
|
| ||
|
Total realized and unrealized gains, net |
|
$ |
692,000 |
|
$ |
227,000 |
|
NYTIS EXPLORATION (USA) INC.
Notes to Consolidated Financial Statements
For the years ended December 31, 2010 and 2009.
Note 11 — Physical Delivery Contracts and Gas Derivatives (continued)
Realized gains are included in cash flows from operating activities in the Company’s consolidated statements of cash flows.
The counterparty in all of the Company’s derivative instruments is the lender in the Company’s bank credit facility; accordingly, the Company is not required to post collateral since the bank is secured by the Company’s oil and gas assets.
Due to the volatility of natural gas prices, the estimated fair values of the Company’s derivatives are subject to large fluctuations from period to period.
Note 12 — Commitments
The Company has entered into employment agreements with certain executives and officers of the Company. The initial term of the agreements generally range from one to two years and provide for renewal provisions in one year increments thereafter. The agreements provide for, among other items, severance and continuation of benefit payments upon termination of employment or certain change of control events.
Note 13 — Retirement Savings Plan
The Company outsources certain payroll and human resource functions to an administrative company. In conjunction with this arrangement, the Company has a 401(k) plan available to eligible employees. The plan provides for 6% matching which vests immediately.
Note 14 — Related Party Transactions
NEC is an independent oil and gas company whose nature of its business is the exploration, development, production, marketing and sale of oil, gas, coalbed methane and other hydrocarbons in locations other than the United States. NEC has substantially the same shareholders as the Company. The Company has engaged NEC to assist in the management, direction and supervision of the operations and business functions of the Company. A service agreement between the Company and NEC provides for certain restrictions on NEC’s authority to perform acts in connection with the business of the Company and establishes provisions for the compensation of NEC in performing these duties. General and administrative expenses charged by NEC to the Company for the years ended December 31, 2010 and 2009 were approximately $1.2 million and $964,000, respectively. At December 31, 2010 and 2009, the Company owed NEC approximately $3.1 million and $5.5 million, respectively. This payable consists primarily of charges incurred under the service agreement and advances made for capital expenditures and other miscellaneous general and administrative expenses. As discussed in Note 4, proceeds from the sale of certain oil and gas assets were used to pay down the related party payable.
NYTIS EXPLORATION (USA) INC.
Notes to Consolidated Financial Statements
For the years ended December 31, 2010 and 2009.
Note 15 — Supplemental Cash Flow Disclosure
Supplemental cash flow disclosures for the years ended December 31, 2010 and 2009 are presented below:
|
|
|
Year Ended |
|
Year Ended |
| ||
|
|
|
|
|
|
| ||
|
Cash paid for interest payments |
|
$ |
330,000 |
|
$ |
1,167,000 |
|
|
Income taxes paid |
|
$ |
620,000 |
|
$ |
— |
|
|
|
|
|
|
|
| ||
|
Non-cash transactions: |
|
|
|
|
| ||
|
(Decrease) increase in net asset retirement obligations |
|
$ |
(415,000 |
) |
$ |
36,000 |
|
|
Decrease in accounts payable and accrued liabilities included in oil and gas properties |
|
$ |
(162,000 |
) |
$ |
(166,000 |
) |
|
Increase in interest receivable on promissory note |
|
$ |
39,000 |
|
$ |
37,000 |
|
|
Settlement of promissory note and surrender of shares |
|
$ |
694,000 |
|
$ |
— |
|
|
Income attributed to non-controlling interests |
|
$ |
941,000 |
|
$ |
— |
|
Note 16 — Subsequent Events
In January 2011, the Company entered into an Agreement and Plan of Merger (Merger Agreement) between the Company, St. Lawrence Seaway Corporation, a Delaware corporation with offices in Norwalk, Connecticut and its subsidiary, St. Lawrence Merger Sub, Inc. (Merger Co), a Delaware corporation. As a result, Merger Co was merged with and into the Company and the Company is the surviving subsidiary of St. Lawrence Seaway Corporation. The Merger was an all stock-for-stock transaction. In February 2011, the Merger Agreement was closed.
In connection with the Company becoming a public company pursuant to the Merger Agreement, in January 2011, the Company modified certain of its equity plans. These changes included (a) fixing the exercise price of its warrants at $1,386 per share, (b) amending a provision under the Company’s restricted stock plan so that forfeiture of restricted shares would occur only if prior to a change in control, a grantee of restricted shares ceases for any reason to be employed by, or serve as a director of the Company or a subsidiary of the Company and (c) that the implementation of the Merger Agreement would not result in a change in control for purposes of the restricted stock plan or Nytis LLC’s restricted membership interest plan. In addition, the Company was authorized, as Manager of Nytis LLC, to offer to redeem all unvested, forfeitable restricted membership interests pursuant to the Nytis LLC restricted membership interest plan. All of the restricted membership interests were redeemed in February 2011.
Also in February 2011, the Company entered into an Asset Purchase Agreement (APA) with The Interstate Gas Company, LLC ( a private limited liability company) and certain related parties to purchase, for $29.6 million (subject to adjustment at closing) certain oil and natural gas properties and other assets related thereto, located in eastern Kentucky and four counties in West Virginia. Subject to results of the Company’s due diligence, the APA is scheduled to close in April 2011. The APA may be terminated by either party for specific reasons including if the closing does not occur on or before April 30, 2011, if the total purchase price adjustments exceed $3 million, or if either party has violated or breached any of its material agreements, representations or warranties. If the APA is terminated due to the Company not fulfilling specific obligations under the APA, the Company will forfeit its deposit of $450,000 paid at the date of executing the APA. The purchase price of this acquisition is expected to be financed with funds obtained from our lending facility and by additional equity invested by our principal stockholders. However, as of the date of these audited consolidated financial statements, the Company does not have commitments in place for such debt or additional equity nor has it completed its due diligence of the underlying properties of the APA.
In the first quarter of 2011, the Company reduced its payable to NEC by approximately $2.1 million, net of additions.
NYTIS EXPLORATION (USA) INC.
Notes to Consolidated Financial Statements
For the years ended December 31, 2010 and 2009.
Note 17 — Supplemental Financial Data — Oil and Gas Producing Activities (unaudited)
Estimated Proved Oil and Gas Reserves
On about April 4, 2011, the Company determined that incorrect pricing had been used in the original estimates of its proved oil and gas reserves. These changes caused an approximate $1.6 million reduction in the standardized measure of discounted future net cash flows compared to the previous estimate provided by the Company. The following disclosure is reflective of the amended estimates of the Company’s proved oil and gas reserves.
The reserve estimates as of December 31, 2010 and 2009 presented herein were made in accordance with oil and gas reserve estimation and disclosure authoritative accounting guidance issued by the FASB effective for reporting periods ending on or after December 31, 2009. This guidance was issued to align the accounting oil and gas reserve estimation and disclosure requirements with the requirements in the SEC’s final rule, “Modernization of Oil and Gas Reporting,” which was also effective for fiscal years ending on or after December 31, 2009.
The new guidance includes updated definitions of proved oil and gas reserves, proved undeveloped oil and gas reserves, oil and gas producing activities and other terms used in estimating proved oil and gas reserves. Proved oil and gas reserves as of December 31, 2010 and 2009 were calculated based on the prices for oil and gas during the twelve month period before the reporting date, determined as an un-weighted arithmetic average of the first-day-of-the month price for each month within such period, rather than the year-end spot prices, which had been used in years prior to 2009. This average price is also used in calculating the aggregate amount and changes in future cash inflows related to the standardized measure of discounted future cash flows. Undrilled locations can be classified as having proved undeveloped reserves only if a development plan has been adopted indicating that they are scheduled to be drilled within five years, unless the specific circumstances justify a longer time. The new guidance broadened the types of technologies that a company may use to establish reserve estimates and also broadened the definition of oil and gas producing activities to include the extraction of non-traditional resources, including bitumen extracted from oil sands as well as oil and gas extracted from shales. Prior period data presented throughout this footnote is not required to be, nor has it been, updated based on the new guidance.
The Company’s estimates of its net proved, net proved developed, and net proved undeveloped oil and gas reserves and changes in its net proved oil and gas reserves for 2010 and 2009 are presented in the table below. Proved oil and gas reserves are those quantities of oil and gas, which, by analysis of geosciences and engineering data, can be estimated with reasonable certainty to be economically producible from a given date forward, from known reservoirs, and under existing economic conditions, operating methods, and government regulation before the time at which contracts providing the right to operate expire, unless evidence indicates that renewal is reasonably certain. Existing economic conditions include the average prices for oil and gas during the twelve month period before the reporting date of December 31, 2010 and 2009 and the year-end spot prices for oil and gas for 2008, unless prices are defined by contractual arrangements, excluding escalations based upon future conditions. Prices do not include the effects of commodity derivatives. Existing economic conditions include year-end cost estimates for all years presented. The reserve information presented below is based on estimates of net proved reserves as of December 31, 2010 and 2009 that were prepared by internal petroleum engineers in accordance with guidelines established by the SEC. The Company does not believe that provisions of the new rules, other than pricing and the five year limitation rule, significantly impacted the reserve estimates in 2009. The Company does not believe that it is practicable to estimate the effect of applying the new rules on the following tables for reserve quantities or standardized measure of discounted cash flows for the year ended December 31, 2009.
Proved developed oil and gas reserves are proved reserves that can be expected to be recovered (i) through existing wells with existing equipment and operating methods or in which the cost of the required equipment is relatively minor compared with the cost of a new well or (ii) through installed extraction equipment and infrastructure operational at the time of the reserves estimate if the extraction is by means not involving a well.
Proved undeveloped oil and gas reserves are proved reserves that are expected to be recovered from new wells on undrilled acreage, or from existing wells where a relatively major expenditure is required for recompletion.
NYTIS EXPLORATION (USA) INC.
Notes to Consolidated Financial Statements
For the years ended December 31, 2010 and 2009.
Note 17 — Supplemental Financial Data — Oil and Gas Producing Activities (unaudited) (continued)
The Company’s oil and gas properties produce principally natural gas with nominal oil or natural gas liquids.
|
|
|
2010 |
|
2009 |
| ||||
|
|
|
Oil |
|
Natural Gas |
|
Total |
|
Natural Gas |
|
|
|
|
MBbls |
|
MMcf |
|
MMcfe |
|
MMcf |
|
|
|
|
|
|
|
|
|
|
|
|
|
Proved reserves, beginning of year |
|
— |
|
42,411 |
|
42,411 |
|
71,406 |
|
|
Revisions of previous estimates |
|
— |
|
1,034 |
|
1,034 |
|
(35,628 |
) |
|
Extensions and discoveries |
|
— |
|
23,943 |
|
23,943 |
|
7,974 |
|
|
Production |
|
— |
|
(1,011 |
) |
(1,011 |
) |
(1,341 |
) |
|
Purchases of reserves in-place |
|
146 |
|
343 |
|
1,219 |
|
— |
|
|
Sales of reserves in-place |
|
— |
|
(12,060 |
) |
(12,060 |
) |
— |
|
|
Proved reserves, end of year |
|
146 |
|
54,660 |
|
55,536 |
|
42,411 |
|
|
|
|
|
|
|
|
|
|
|
|
|
Proved developed reserves at: |
|
|
|
|
|
|
|
|
|
|
End of Year |
|
72 |
|
17,482 |
|
17,914 |
|
20,076 |
|
|
Proved undeveloped reserves at: |
|
|
|
|
|
|
|
|
|
|
End of Year |
|
74 |
|
37,178 |
|
37,622 |
|
22,335 |
|
Aggregate Capitalized Costs
The aggregate capitalized costs relating to oil and gas producing activities at the end of each of the years indicated were as follows:
|
|
|
2010 |
|
2009 |
| ||
|
|
|
(In thousands) |
| ||||
|
Oil and gas properties |
|
|
|
|
| ||
|
Proved oil and gas properties |
|
$ |
43,535 |
|
$ |
60,795 |
|
|
Unproved properties not subject to depletion |
|
2,164 |
|
5,135 |
| ||
|
Accumulated depreciation, depletion, amortization and impairment |
|
(22,121 |
) |
(24,058 |
) | ||
|
Net oil and gas properties |
|
$ |
23,578 |
|
$ |
41,872 |
|
Costs Incurred in Oil and Gas Property Acquisition, Exploration, and Development Activities
The following costs were incurred in oil and gas property acquisition, exploration, and development activities during the years ended December 31, 2010 and 2009:
|
|
|
2010 |
|
2009 |
| ||
|
|
|
(In thousands) |
| ||||
|
Property acquisition costs: |
|
|
|
|
| ||
|
Unevaluated properties |
|
$ |
81 |
|
$ |
29 |
|
|
Proved and unproved properties and gathering facilities |
|
1,806 |
|
— |
| ||
|
Development costs |
|
2,825 |
|
3,106 |
| ||
|
Gathering facilities |
|
— |
|
465 |
| ||
|
Asset retirement obligation |
|
98 |
|
36 |
| ||
|
Total costs incurred |
|
$ |
4,810 |
|
$ |
3,636 |
|
NYTIS EXPLORATION (USA) INC.
Notes to Consolidated Financial Statements
For the years ended December 31, 2010 and 2009.
Note 17 — Supplemental Financial Data — Oil and Gas Producing Activities (unaudited) (continued)
The Company’s investment in unproved properties as of December 31, 2010, by the year in which such costs were incurred is set forth in the table below:
|
|
|
2010 |
|
2009 |
|
2008 and Prior |
| |||
|
|
|
(In thousands) |
| |||||||
|
|
|
|
|
|
|
|
| |||
|
Acquisition costs |
|
$ |
81 |
|
$ |
29 |
|
$ |
2,054 |
|
Results of Operations from Oil and Gas Producing Activities
Results of operations from oil and gas producing activities for the years ended December 31, 2010 and 2009 are presented below:
|
|
|
2010 |
|
2009 |
| |||
|
|
|
(In thousands) |
| |||||
|
|
|
|
|
|
| |||
|
Oil and gas sales, including commodity derivative gains |
|
$ |
5,571 |
|
$ |
5,903 |
| |
|
Expenses: |
|
|
|
|
| |||
|
Production expenses |
|
1,928 |
|
2,092 |
| |||
|
Depletion expense |
|
1,490 |
|
2,540 |
| |||
|
Ceiling test write-down of oil and gas properties |
|
— |
|
16,077 |
| |||
|
Accretion of asset retirement obligations |
|
17 |
|
43 |
| |||
|
Total expenses |
|
3,435 |
|
20,752 |
| |||
|
Results of operations from oil and gas producing activities |
|
$ |
2,136 |
|
$ |
(14,849 |
) | |
|
|
|
|
|
|
| |||
|
Depletion rate per Mcfe |
|
$ |
1.47 |
|
$ |
1.89 |
| |
Standardized Measure of Discounted Future Net Cash Flows
Future oil and gas sales are calculated applying the prices used in estimating the Company’s proved oil and gas reserves to the year-end quantities of those reserves. Future price changes were considered only to the extent provided by contractual arrangements in existence at each year-end. Future production and development costs, which included costs related to plugging of wells, removal of facilities and equipment, and site restoration, are calculated by estimating the expenditures to be incurred in producing and developing the proved oil and gas reserves at the end of each year, based on year-end costs and assuming continuation of existing economic conditions. Future income tax expenses are computed by applying the appropriate year-end statutory tax rates to the estimated future pretax net cash flows relating to proved oil and gas reserves, less the tax basis of the properties involved. The future income tax expenses give effect to tax deductions, credits, and allowances relating to the proved oil and gas reserves. All cash flow amounts, including income taxes, are discounted at 10%.
NYTIS EXPLORATION (USA) INC.
Notes to Consolidated Financial Statements
For the years ended December 31, 2010 and 2009.
Note 17 — Supplemental Financial Data — Oil and Gas Producing Activities (unaudited) (continued)
Changes in the demand for oil and natural gas, inflation, and other factors make such estimates inherently imprecise and subject to substantial revision. This table should not be construed to be an estimate of the current market value of the Company’s proved reserves. Management does not rely upon the information that follows in making investment decisions.
|
|
|
December 31, |
| ||||
|
|
|
2010 |
|
2009 |
| ||
|
|
|
(In thousands) |
| ||||
|
|
|
|
|
|
|
|
|
|
Future cash inflows |
|
$ |
253,998 |
|
$ |
179,273 |
|
|
Future production costs |
|
(59,264 |
) |
(47,387 |
) | ||
|
Future development costs |
|
(60,632 |
) |
(28,675 |
) | ||
|
Future income taxes |
|
(41,138 |
) |
(14,282 |
) | ||
|
Future net cash flows |
|
92,964 |
|
88,929 |
| ||
|
10% annual discount |
|
(72,012 |
) |
(62,508 |
) | ||
|
Standardized measure of discounted future net cash flows |
|
$ |
20,952 |
|
$ |
26,421 |
|
Changes in the Standardized Measure of Discounted Future Net Cash Flows Relating to Proved Oil and Gas Reserves
An analysis of the changes in the standardized measure of discounted future net cash flows during each of the last two years is as follows:
|
|
|
December 31, |
| ||||
|
|
|
2010 |
|
2009 |
| ||
|
|
|
(In thousands) |
| ||||
|
|
|
|
|
|
| ||
|
Standardized measure of discounted future net cash flows, beginning of year |
|
$ |
26,421 |
|
$ |
51,201 |
|
|
Sales of oil and gas, net of production costs and taxes |
|
(2,951 |
) |
(3,584 |
) | ||
|
Price revisions |
|
2,270 |
|
(28,243 |
) | ||
|
Extensions, discoveries and improved recovery, less related costs |
|
(1,915 |
) |
1,926 |
| ||
|
Changes in estimated future development costs |
|
1,214 |
|
32,710 |
| ||
|
Development costs incurred during the period |
|
753 |
|
2,481 |
| ||
|
Quantity revisions |
|
903 |
|
(21,773 |
) | ||
|
Accretion of discount |
|
2,642 |
|
5,642 |
| ||
|
Net changes in future income taxes |
|
— |
|
(5,251 |
) | ||
|
Purchases of reserves-in-place |
|
2,178 |
|
— |
| ||
|
Sales of reserves-in-place |
|
(8,834 |
) |
— |
| ||
|
Changes in production rates (timing) and other |
|
(1,729 |
) |
(8,688 |
) | ||
|
Standardized measure of discounted future net cash flows, end of year |
|
$ |
20,952 |
|
$ |
26,421 |
|
Index to Unaudited Financial Statements
Carbon Natural Gas Company Consolidated Financial Statements March 31, 2011
CARBON NATURAL GAS COMPANY
|
|
|
March 31, |
|
December 31, |
| ||
|
|
|
(Unaudited) |
|
|
| ||
|
ASSETS |
|
|
|
|
| ||
|
|
|
|
|
|
| ||
|
Current assets: |
|
|
|
|
| ||
|
Cash and cash equivalents |
|
$ |
379,789 |
|
$ |
845,054 |
|
|
Accounts receivable: |
|
|
|
|
| ||
|
Revenue |
|
956,754 |
|
752,845 |
| ||
|
Joint interest billings and other |
|
262,690 |
|
258,340 |
| ||
|
Prepaid expense, deposits and other current assets |
|
520,511 |
|
84,941 |
| ||
|
Deferred offering costs |
|
245,127 |
|
169,283 |
| ||
|
Derivative assets |
|
125,580 |
|
170,840 |
| ||
|
Total current assets |
|
2,490,451 |
|
2,281,303 |
| ||
|
|
|
|
|
|
| ||
|
Oil and gas properties, at cost, net (based on the full cost method of accounting for oil and gas properties) (note 5) |
|
16,353,487 |
|
23,578,264 |
| ||
|
Other property and equipment, net |
|
130,271 |
|
80,703 |
| ||
|
|
|
16,483,758 |
|
23,658,967 |
| ||
|
|
|
|
|
|
| ||
|
Equity method investment |
|
567,835 |
|
582,745 |
| ||
|
Other long-term assets |
|
437,281 |
|
463,110 |
| ||
|
|
|
|
|
|
| ||
|
Total assets |
|
$ |
19,979,325 |
|
$ |
26,986,125 |
|
|
|
|
|
|
|
| ||
|
LIABILITIES AND STOCKHOLDERS’ EQUITY |
|
|
|
|
| ||
|
|
|
|
|
|
| ||
|
Current liabilities: |
|
|
|
|
| ||
|
Accounts payable and accrued liabilities |
|
$ |
1,379,577 |
|
$ |
1,632,193 |
|
|
|
|
1,379,577 |
|
1,632,193 |
| ||
|
Non-current liabilities: |
|
|
|
|
| ||
|
Due to related parties (note 11) |
|
1,722,391 |
|
3,073,036 |
| ||
|
Asset retirement obligation (note 2) |
|
357,654 |
|
351,954 |
| ||
|
Notes payable (note 6) |
|
6,216,383 |
|
3,116,383 |
| ||
|
Total non-current liabilities |
|
8,296,428 |
|
6,541,373 |
| ||
|
|
|
|
|
|
| ||
|
Stockholders’ equity: |
|
|
|
|
| ||
|
Preferred stock, $0.01 par value; authorized 1,000,000 shares, no shares issued |
|
— |
|
— |
| ||
|
Common stock, $0.01 par value; authorized 48,500,000 shares, 47,518,739 and 47,903,442 shares issued and 47,518,739 and 47,163,079 shares outstanding at March 31, 2011 and December 31, 2010, respectively |
|
475,187 |
|
479,034 |
| ||
|
Class A Common stock, $0.01 par value; authorized 510,000 shares, no shares issued |
|
— |
|
— |
| ||
|
Additional paid-in capital |
|
26,842,186 |
|
27,700,646 |
| ||
|
Non-controlling interests |
|
637,612 |
|
637,612 |
| ||
|
Treasury stock, at cost |
|
— |
|
(693,820 |
) | ||
|
Accumulated deficit |
|
(17,651,665 |
) |
(9,310,913 |
) | ||
|
Total stockholders’ equity |
|
10,303,320 |
|
18,812,559 |
| ||
|
|
|
|
|
|
| ||
|
Total liabilities and stockholders’ equity |
|
$ |
19,979,325 |
|
$ |
26,986,125 |
|
See accompanying notes to consolidated financial statements.
CARBON NATURAL GAS COMPANY
Consolidated Statements of Operations
(Unaudited)
|
|
|
Three Months Ended |
| ||||
|
|
|
March 31, |
| ||||
|
|
|
2011 |
|
2010 |
| ||
|
Revenue: |
|
|
|
|
| ||
|
Oil and gas |
|
$ |
1,253,637 |
|
$ |
1,562,096 |
|
|
Commodity derivative gain |
|
61,400 |
|
474,610 |
| ||
|
Other income |
|
97,858 |
|
49,826 |
| ||
|
Total revenue |
|
1,412,895 |
|
2,086,532 |
| ||
|
|
|
|
|
|
| ||
|
Expenses: |
|
|
|
|
| ||
|
Lease operating expenses |
|
242,868 |
|
257,809 |
| ||
|
Transportation costs |
|
155,392 |
|
42,026 |
| ||
|
Production and property taxes |
|
107,477 |
|
97,554 |
| ||
|
General and administrative |
|
1,443,976 |
|
1,092,519 |
| ||
|
Depreciation, depletion and amortization |
|
375,522 |
|
432,003 |
| ||
|
Accretion of asset retirement obligations |
|
5,700 |
|
4,342 |
| ||
|
Impairment of oil and gas properties |
|
7,317,221 |
|
— |
| ||
|
Total expenses |
|
9,648,156 |
|
1,926,253 |
| ||
|
|
|
|
|
|
| ||
|
Operating (loss) income |
|
(8,235,261 |
) |
160,279 |
| ||
|
|
|
|
|
|
| ||
|
Other income and (expense): |
|
|
|
|
| ||
|
Interest income |
|
15 |
|
9,405 |
| ||
|
Interest expense |
|
(78,032 |
) |
(231,124 |
) | ||
|
Loss on disposition of fixed asset |
|
(12,564 |
) |
— |
| ||
|
Equity investment income |
|
(14,910 |
) |
— |
| ||
|
Gain on sale of oil and gas properties |
|
— |
|
9,876,510 |
| ||
|
Total other income and (expense) |
|
(105,491 |
) |
9,654,791 |
| ||
|
|
|
|
|
|
| ||
|
(Loss) income before income taxes |
|
(8,340,752 |
) |
9,815,070 |
| ||
|
|
|
|
|
|
| ||
|
Provision for income taxes |
|
— |
|
4,784,000 |
| ||
|
|
|
|
|
|
| ||
|
Net (loss) income before non-controlling interests |
|
(8,340,752 |
) |
5,031,070 |
| ||
|
|
|
|
|
|
| ||
|
Net income attributable to non-controlling interests |
|
— |
|
(767,061 |
) | ||
|
|
|
|
|
|
| ||
|
Net (loss) income attributable to controlling interest |
|
$ |
(8,340,752 |
) |
$ |
4,264,009 |
|
|
|
|
|
|
|
| ||
|
Net (loss) income per common share: |
|
|
|
|
| ||
|
Basic |
|
$ |
(0.18 |
) |
$ |
0.09 |
|
|
Diluted |
|
$ |
(0.18 |
) |
$ |
0.09 |
|
|
Weighted average common shares outstanding: |
|
|
|
|
| ||
|
Basic |
|
45,311,519 |
|
45,946,530 |
| ||
|
Diluted |
|
45,311,519 |
|
48,133,259 |
| ||
See accompanying notes to consolidated financial statements.
CARBON NATURAL GAS COMPANY
Consolidated Statements of Stockholders’ Equity
(Unaudited)
|
|
|
|
|
|
|
|
|
|
|
|
|
|
|
(Accumulated |
|
|
| ||||||
|
|
|
|
|
|
|
Additional |
|
Non- |
|
|
|
|
|
Deficit) / |
|
Total |
| ||||||
|
|
|
Common Stock |
|
Paid-in |
|
Controlling |
|
Treasury Stock |
|
Retained |
|
Stockholders’ |
| ||||||||||
|
|
|
Shares |
|
Amount |
|
Capital |
|
Interests |
|
Shares |
|
Amount |
|
Earnings |
|
Equity |
| ||||||
|
|
|
|
|
|
|
|
|
|
|
|
|
|
|
|
|
|
| ||||||
|
Balances, December 31, 2010 |
|
47,903,442 |
|
$ |
479,034 |
|
$ |
27,700,646 |
|
$ |
637,612 |
|
(740,363 |
) |
$ |
(693,820 |
) |
$ |
(9,310,913 |
) |
$ |
18,812,559 |
|
|
|
|
|
|
|
|
|
|
|
|
|
|
|
|
|
|
|
| ||||||
|
Purchase treasury stock |
|
— |
|
— |
|
— |
|
— |
|
(163,076 |
) |
(152,823 |
) |
— |
|
(152,823 |
) | ||||||
|
Retire treasury stock |
|
(903,439 |
) |
(9,034 |
) |
(837,609 |
) |
|
|
903,439 |
|
846,643 |
|
— |
|
— |
| ||||||
|
Reverse merger with St. Lawrence Seaway Corp. |
|
518,736 |
|
5,187 |
|
(20,851 |
) |
|
|
— |
|
— |
|
— |
|
(15,664 |
) | ||||||
|
Net loss |
|
— |
|
— |
|
— |
|
— |
|
— |
|
— |
|
(8,340,752 |
) |
(8,340,752 |
) | ||||||
|
|
|
|
|
|
|
|
|
|
|
|
|
|
|
|
|
|
| ||||||
|
Balances, March 31, 2011 |
|
47,518,739 |
|
$ |
475,187 |
|
$ |
26,842,186 |
|
$ |
637,612 |
|
— |
|
$ |
— |
|
$ |
(17,651,665 |
) |
$ |
10,303,320 |
|
See accompanying notes to consolidated financial statements.
CARBON NATURAL GAS COMPANY
Consolidated Statements of Cash Flows
(Unaudited)
|
|
|
Three Months Ended |
| ||||
|
|
|
March 31, |
| ||||
|
|
|
2011 |
|
2010 |
| ||
|
|
|
|
|
|
| ||
|
Cash flows from operating activities: |
|
|
|
|
| ||
|
Net (loss) income |
|
$ |
(8,340,752 |
) |
$ |
5,031,070 |
|
|
Items not involving cash: |
|
|
|
|
| ||
|
Depreciation, depletion and amortization |
|
375,522 |
|
432,003 |
| ||
|
Accretion of asset retirement obligations |
|
5,700 |
|
4,342 |
| ||
|
Loss on disposition of fixed asset |
|
12,564 |
|
— |
| ||
|
Impairment of oil and gas properties |
|
7,317,221 |
|
— |
| ||
|
Gain on sale of oil and gas properties |
|
— |
|
(9,876,510 |
) | ||
|
Unrealized derivative loss (gain) |
|
45,260 |
|
(513,770 |
) | ||
|
Deferred taxes |
|
— |
|
4,784,000 |
| ||
|
Equity investment income |
|
14,910 |
|
— |
| ||
|
Net change in: |
|
|
|
|
| ||
|
Accounts receivable |
|
(208,259 |
) |
217,001 |
| ||
|
Prepaid expenses, deposits and other current assets |
|
(435,570 |
) |
61,785 |
| ||
|
Accounts payable and accrued liabilities |
|
(80,934 |
) |
(84,086 |
) | ||
|
Due to related parties |
|
(1,350,645 |
) |
(2,910,368 |
) | ||
|
Net cash (used in) provided by operating activities |
|
(2,644,983 |
) |
(2,854,533 |
) | ||
|
|
|
|
|
|
| ||
|
Cash flows from investing activities: |
|
|
|
|
| ||
|
Acquisition and development of properties and equipment |
|
(717,444 |
) |
(711,444 |
) | ||
|
Proceeds from disposition of assets |
|
— |
|
27,998,317 |
| ||
|
Other long-term assets |
|
25,829 |
|
65 |
| ||
|
Net cash (used in) provided by investing activities |
|
(691,615 |
) |
27,286,938 |
| ||
|
|
|
|
|
|
| ||
|
Cash flows from financing activities: |
|
|
|
|
| ||
|
Issue of non-controlling interests in subsidiary |
|
— |
|
4,236 |
| ||
|
Deferred offering costs |
|
(75,844 |
) |
— |
| ||
|
Treasury share purchase |
|
(152,823 |
) |
— |
| ||
|
Proceeds from notes payable |
|
3,100,000 |
|
— |
| ||
|
Payments on notes payable |
|
— |
|
(23,547,227 |
) | ||
|
Net cash provided by (used in) financing activities |
|
2,871,333 |
|
(23,542,991 |
) | ||
|
|
|
|
|
|
| ||
|
Net (decrease) increase in cash and cash equivalents |
|
(465,265 |
) |
889,414 |
| ||
|
|
|
|
|
|
| ||
|
Cash and cash equivalents, beginning of period |
|
845,054 |
|
208,295 |
| ||
|
|
|
|
|
|
| ||
|
Cash and cash equivalents, end of period |
|
$ |
379,789 |
|
$ |
1,097,709 |
|
See accompanying notes to consolidated financial statements.
CARBON NATURAL GAS COMPANY
Notes to Consolidated Financial Statements
(Unaudited)
March 31, 2011
Note 1 — Organization
St. Lawrence Seaway Corporation (“SLSC”) is an independent oil and gas company engaged in the exploration, development and production of natural gas in the United States. The Company was formed as the result of a merger with Nytis Exploration (USA) Inc. (“Nytis USA”) in February 2011 (see Note 3). The Company’s business is comprised of the assets and properties of Nytis USA and its subsidiaries Nytis Exploration Company LLC (“Nytis LLC”) and Nytis Exploration of Pennsylvania LLC (“Nytis Pennsylvania”) which conduct the Company’s operations in the Appalachian and Illinois Basins. Subsequent to the merger, the Company believed that the continued use of the name St. Lawrence Seaway might result in market confusion regarding the Company’s current planned operation and business objectives. The Company believed the name “Carbon Natural Gas Company” (“Carbon”) was more descriptive of the business operations in which the Company engages. This action was implemented by filing an Amended and Restated Certificate of Incorporation with the State of Delaware which become effective May 2, 2011. Collectively, SLSC, Carbon, Nytis USA, Nytis LLC and Nytis Pennsylvania are referred to as the Company.
Note 2 — Summary of Significant Accounting Policies
Basis of Presentation
The accompanying unaudited consolidated financial statements of the Company have been prepared in accordance with accounting principles generally accepted in the United States (“GAAP”) for interim financial information. Accordingly, they do not include all of the information and footnotes required by GAAP for complete financial statements. In the opinion of management, the accompanying unaudited consolidated financial statements include all adjustments (consisting of normal and recurring accruals) considered necessary to present fairly the Company’s financial position as of March 31, 2011, the Company’s results of operations and cash flows for the three months ended March 31, 2011 and 2010. Operating results for the three months ended March 31, 2011 are not necessarily indicative of the results that may be expected for the full year because of the impact of fluctuations in prices received for natural gas and oil, natural production declines, the uncertainty of exploration and development drilling results and other factors. For a more complete understanding of the Company’s operations, financial position and accounting policies, the unaudited financial statements and the notes thereto should be read in conjunction with the Company’s audited consolidated financial statements for the year ended December 31, 2010 filed on Form 8-K/A with the Securities and Exchange Commission (“SEC”).
In the course of preparing the unaudited financial statements, management makes various assumptions, judgments and estimates to determine the reported amount of assets, liabilities, revenue and expenses and in the disclosures of commitments and contingencies. Changes in these assumptions, judgments and estimates will occur as a result of the passage of time and the occurrence of future events and accordingly, actual results could differ from amounts initially established.
Principles of Consolidation
The consolidated financial statements include the accounts of Carbon, Nytis USA and its consolidated subsidiaries. The Company owns 100% of Nytis USA. Nytis USA owns 85% of Nytis Pennsylvania and approximately 98% of Nytis LLC. All significant intercompany accounts and transactions have been eliminated.
Accounting for Oil and Gas Operations
The Company uses the full cost method of accounting for oil and gas properties. Accordingly, all costs incidental to the acquisition, exploration and development of oil and gas properties, including costs of undeveloped leasehold, dry holes and leasehold equipment, are capitalized. Overhead costs incurred that are directly identified with acquisition, exploration and development activities undertaken by the Company for its own account, and which are not related to production, general corporate overhead or similar activities, are also capitalized.
CARBON NATURAL GAS COMPANY
Notes to Consolidated Financial Statements
(Unaudited)
March 31, 2011
Note 2 — Summary of Significant Accounting Policies (continued)
Unproved properties are excluded from amortized capitalized costs until it is determined whether or not proved reserves can be assigned to such properties. The Company assesses its unproved properties for impairment at least annually. Significant unproved properties are assessed individually.
Capitalized costs are depleted by an equivalent unit-of-production method, converting gas to oil at the ratio of six thousand cubic feet of natural gas to one barrel of oil. Depletion is calculated using the capitalized costs, including estimated asset retirement costs, plus the estimated future expenditures (based on current costs) to be incurred in developing proved reserves, net of estimated salvage values.
No gain or loss is recognized upon disposal of oil and gas properties unless such disposal significantly alters the relationship between capitalized costs and proved reserves. All costs related to production activities, including work-over costs incurred solely to maintain or increase levels of production from an existing completion interval, are charged to expense as incurred.
The Company performs a ceiling test quarterly. The full cost ceiling test is a limitation on capitalized costs prescribed by SEC Regulation S-X Rule 4-10. The ceiling test is not a fair value based measurement. Rather, it is a standardized mathematical calculation. The ceiling test provides that capitalized costs less related accumulated depletion and deferred income taxes may not exceed the sum of (1) the present value of future net revenue from estimated production of proved oil and gas reserves using current prices, excluding the future cash outflows associated with settling asset retirement obligations that have been accrued on the balance sheet, at a discount factor of 10%; plus (2) the cost of properties not being amortized, if any; plus (3) the lower of cost or estimated fair value of unproved properties included in the costs being amortized, if any; less (4) income tax effects related to differences in the book and tax basis of oil and gas properties. Should the net capitalized costs exceed the sum of the components noted above, a ceiling test write-down would be recognized to the extent of the excess capitalized costs.
As of March 31, 2011, the Company’s full cost pool exceeded the ceiling limitation, based on oil prices of $73.14 per barrel and gas prices of $4.09 per Mcf, by approximately $7.3 million. Therefore, an impairment expense of approximately $7.3 million was recorded during the three months ended March 31, 2011. No impairment expense was recorded during the three months ended March 31, 2010.
Asset Retirement Obligations
The Company’s asset retirement obligations (“ARO”) relate to future costs associated with the plugging and abandonment of oil and gas wells, removal of equipment and facilities from leased acreage and returning such land to its original condition. The fair value of a liability for an ARO is recorded in the period in which it is incurred and the cost of such liability is recorded as an increase in the carrying amount of the related long-lived asset by the same amount. The liability is accreted each period and the capitalized cost is depleted on a units-of-production basis as part of the full cost pool. Revisions to estimated AROs result in adjustments to the related capitalized asset and corresponding liability.
The estimated ARO liability is based on estimated economic lives, estimates as to the cost to abandon the wells in the future, and federal and state regulatory requirements. The liability is discounted using a credit-adjusted risk-free rate estimated at the time the liability is incurred or increased as a result of a reassessment of expected cash flows and assumptions inherent in the estimation of the liability. Upward revisions to the liability could occur due to changes in estimated abandonment costs or well economic lives, or if federal or state regulators enact new requirements regarding the abandonment of wells. AROs are valued utilizing Level 3 fair value measurement inputs.
CARBON NATURAL GAS COMPANY
Notes to Consolidated Financial Statements
(Unaudited)
March 31, 2011
Note 2 — Summary of Significant Accounting Policies (continued)
The following table is a reconciliation of the ARO for the three months ended March 31, 2011 and 2010:
|
|
|
Three Months Ended March 31, |
| ||||
|
|
|
2011 |
|
2010 |
| ||
|
Balance at beginning of period |
|
$ |
351,954 |
|
$ |
749,470 |
|
|
Liabilities transferred due to property disposition |
|
— |
|
(512,480 |
) | ||
|
Accretion expense |
|
5,700 |
|
4,342 |
| ||
|
Additions during period |
|
— |
|
4,042 |
| ||
|
|
|
|
|
|
| ||
|
Balance at end of period |
|
$ |
357,654 |
|
$ |
245,374 |
|
Equity Method Investments
Investments in non-consolidated affiliates are accounted for under the equity method and generally include all entities in which the Company does not have significant influence, not more than 50 percent voting control, and is not considered the primary beneficiary. All transactions, if any, with equity method investees have been eliminated in the accompanying consolidated financial statements. The Company’s investment, that was acquired in the fourth quarter of 2010 and is accounted for on the equity method of accounting, consists of a 50% interest in a joint venture which owns a gas gathering facility. A loss of approximately $15,000 from the joint venture was recognized for the three months ended March 31, 2011 in the Company’s consolidated statements of operations.
Earnings Per Common Share
Basic earnings (loss) per common share is computed by dividing the net income (loss) attributable to common shareholders for the period by the weighted average number of common shares outstanding during the period. The shares of restricted common stock granted to certain officers and employees of the Company are included in the computation of basic net income (loss) per share only after the shares become fully vested. Diluted earnings per common share includes both the vested and unvested shares of restricted stock and the potential dilution that could occur upon exercise of the options and warrants to acquire common stock computed using the treasury stock method, which assumes that the increase in the number of shares is reduced by the number of shares which could have been repurchased by the Company with the proceeds from the exercise of the options and warrants (which were assumed to have been made at the average market price of the common shares during the reporting period). As a result of the reverse merger with SLSC on February 14, 2011 (see Note 3), the number of common shares outstanding from the beginning of the periods presented in the accompanying consolidated financial statements to the merger date were computed on the basis of the weighted-average number of common shares of Nytis USA outstanding during the respective periods multiplied by the exchange ratio established in the merger agreement, which was approximately 1,631 common shares of SLSC for each common share of Nytis USA. The weighted average number of shares used in the earnings per share calculations were based on historical weighted-average number of common shares outstanding multiplied by the exchange ratio. The number of common shares outstanding from the merger date to March 31, 2011 is the actual number of common shares of SLSC outstanding during that period.
At March 31, 2011, the Company had common stock equivalents of 2,035,896 which are excluded from the calculation of diluted loss per share as the effect would be anti-dilutive.
Note 3 — Reverse Merger
On February 14, 2011, pursuant to an Agreement and Plan of Merger (“Merger Agreement”) by and among SLSC, St. Lawrence Merger Sub, Inc. (“Merger Co”) and Nytis USA, Merger Co merged with and into Nytis USA with Nytis USA remaining as the surviving subsidiary of SLSC. Per the terms of the Merger Agreement, in exchange for all the outstanding common shares of Nytis USA, SLSC issued 47,000,003 shares of common stock of SLSC
CARBON NATURAL GAS COMPANY
Notes to Consolidated Financial Statements
(Unaudited)
March 31, 2011
Note 3 — Reverse Merger (continued)
(restricted under SEC Rule 144) which represented an exchange ratio of approximately 1,631 shares of SLSC for each share of Nytis USA.
For accounting purposes, the business combination was considered a “reverse merger” in which Nytis USA was considered the accounting acquirer. The combination was recorded as a recapitalization under which SLSC issued shares in exchange for the net assets of Nytis USA. The assets of Nytis USA were recorded at their respective book value and were not adjusted to their estimated fair value. No goodwill or other intangible assets were recorded in the transaction.
All share amounts, including those for which any securities are exercisable or convertible, have been adjusted to reflect the conversion ratio used in the merger. In addition, stockholders’ equity and earnings per share have been retroactively restated to reflect the number of shares of SLSC common stock received by Nytis USA stockholders in the merger. Also, as a result of the completion of the merger, SLSC amended its bylaws to change the fiscal year of the Company from March 31 to December 31.
Note 4 — Fair Value Measurements
Authoritative guidance defines fair value as the price that would be received to sell an asset or paid to transfer a liability (an exit price) in an orderly transaction between market participants at the measurement date. The guidance establishes a hierarchy for inputs used in measuring fair value that maximizes the use of observable inputs and minimizes the use of unobservable inputs by requiring that the most observable inputs be used when available. Observable inputs are inputs that market participants would use in pricing the asset or liability developed based on market data obtained from sources independent of the Company. Unobservable inputs are inputs that reflect the Company’s assumptions of what market participants would use in pricing the asset or liability developed based on the best information available in the circumstances. The hierarchy is broken down into three levels based on the reliability of the inputs as follows:
|
|
Level 1: |
Quoted prices are available in active markets for identical assets or liabilities; |
|
|
|
|
|
|
Level 2: |
Quoted prices in active markets for similar assets or liabilities that are observable for the asset or liability; or |
|
|
|
|
|
|
Level 3: |
Unobservable pricing inputs that are generally less observable from objective sources, such as discounted cash flow models or valuations. |
Financial assets and liabilities are classified based on the lowest level of input that is significant to the fair value measurement. The Company’s policy is to recognize transfers in/and or out of fair value hierarchy as of the end of the reporting period for which the event or change in circumstances caused the transfer. The Company has consistently applied the valuation techniques discussed below for all periods presented.
CARBON NATURAL GAS COMPANY
Notes to Consolidated Financial Statements
(Unaudited)
March 31, 2011
Note 4 — Fair Value Measurements (continued)
The following table presents the Company’s financial assets and liabilities that were accounted for at fair value on a recurring basis as of March 31, 2011 and December 31, 2010 by level within the fair value hierarchy:
|
|
|
Fair Value Measurements Using |
| ||||||||||
|
|
|
Level 1 |
|
Level 2 |
|
Level 3 |
|
Total |
| ||||
|
March 31, 2011 |
|
|
|
|
|
|
|
|
| ||||
|
Assets: |
|
|
|
|
|
|
|
|
| ||||
|
Commodity derivatives |
|
$ |
— |
|
$ |
125,580 |
|
$ |
— |
|
$ |
125,580 |
|
|
|
|
|
|
|
|
|
|
|
| ||||
|
December 31, 2010 |
|
|
|
|
|
|
|
|
| ||||
|
Assets: |
|
|
|
|
|
|
|
|
| ||||
|
Commodity derivatives |
|
$ |
— |
|
$ |
170,840 |
|
$ |
— |
|
$ |
170,840 |
|
As of March 31, 2011, the Company’s commodity derivative financial instruments are comprised of four natural gas swap agreements. The fair values of the swap agreements are determined under the income valuation technique using a discounted cash flow model. The valuation model requires a variety of inputs, including contractual terms, published forward prices, volatilities for options, and discount rates, as appropriate. The Company’s estimates of fair value of derivatives include consideration of the counterparty’s credit worthiness, the Company’s credit worthiness and the time value of money. The consideration of these factors result in an estimated exit-price for each derivative asset or liability under a market place participant’s view. All of the significant inputs are observable, either directly or indirectly; therefore, the Company’s derivative instruments are included within the Level 2 fair value hierarchy. The counterparty in all of the Company’s commodity derivative financial instruments is the lender in the Company’s bank credit facility.
Assets Measured and Recorded at Fair Value on a Non-recurring Basis
The Company uses the income valuation technique to estimate the fair value of asset retirement obligations using the amounts and timing of expected future dismantlement costs, credit-adjusted risk-free rates and time value of money. Accordingly, the fair value is based on unobservable pricing inputs and therefore, is included within the Level 3 fair value hierarchy. During the three months ended March 31, 2011 and 2010, the Company recorded asset retirement obligations for additions of approximately nil and $4,000, respectively. See Note 2 for additional information.
CARBON NATURAL GAS COMPANY
Notes to Consolidated Financial Statements
(Unaudited)
March 31, 2011
Note 5 — Property and Equipment
Net property and equipment as of March 31, 2011 and December 31, 2010 consists of the following:
|
|
|
As of |
|
As of |
| ||
|
|
|
|
|
|
| ||
|
Oil and gas properties |
|
|
|
|
| ||
|
Proved oil and gas properties |
|
$ |
43,885,554 |
|
$ |
43,535,107 |
|
|
Unproved properties not subject to depletion |
|
2,272,214 |
|
2,163,899 |
| ||
|
Accumulated depreciation, depletion, amortization and impairment |
|
(29,804,281 |
) |
(22,120,742 |
) | ||
|
Net oil and gas properties |
|
16,353,487 |
|
23,578,264 |
| ||
|
|
|
|
|
|
| ||
|
Furniture and fixtures, computer hardware and software, and other equipment |
|
528,120 |
|
488,194 |
| ||
|
Accumulated depreciation and amortization |
|
(397,849 |
) |
(407,491 |
) | ||
|
Net other property and equipment |
|
130,271 |
|
80,703 |
| ||
|
|
|
|
|
|
| ||
|
Total net property and equipment |
|
$ |
16,483,758 |
|
$ |
23,658,967 |
|
As of March 31, 2011 and December 31, 2010, the Company had approximately $2.3 million and $2.2 million, respectively, of unproved oil and gas properties not subject to depletion. The costs not subject to depletion relate to unproved properties that are excluded from amortized capital costs until it is determined whether or not proved reserves can be assigned to such properties. The excluded properties are assessed for impairment at least annually. Subject to industry conditions, evaluation of most of these properties and the inclusion of their costs in amortized capital costs is expected to be completed within five years.
The Company capitalized overhead applicable to acquisition, development and exploration activities of approximately $99,000 and $115,000 for the three months ended March 31, 2011 and 2010, respectively.
Note 6 — Bank Credit Facility
On May 31, 2010, the Company amended its credit facility with the Bank of Oklahoma. The credit facility matures in May 2012. No repayments of principal are required until maturity, except to the extent that outstanding balances exceed the borrowing base then in effect; however, the Company has the right both to repay principal at any time and to reborrow. Subject to the agreement of the Company and the lender, the size of the credit facility may be increased up to $50 million. As of March 31, 2011, the borrowing base was $8.0 million. The borrowing base is redetermined semi-annually, and the available borrowing amount could be increased or decreased as a result of such redeterminations. Under certain circumstances the lender may request an interim redetermination. The facility has variable interest rates based upon the ratio of outstanding debt to the borrowing base. Interest rates are based on either an Alternative Base Rate or LIBOR. The portion of the loan based on an “Alternate Base Rate” is determined by the rate per annum equal to the greatest of the following: (a) the Federal Funds Rate for such day plus one-half of one percentage point, (b) the Prime Rate for such day or (c) LIBOR for a one-month LIBOR Interest Period plus one percentage point; plus 1.5%. The portion based on LIBOR is determined by the rate per annum equal to LIBOR plus between 2.5% and LIBOR plus 3.25% for each LIBOR tranche. For all debt outstanding regardless of if the loan is based on the Alternative Base Rate or LIBOR, there is a minimum floor of 4.5% per annum. In addition, the credit facility includes a hedging component that provides a line of credit under commodity swap, exchange, collar, cap and fixed price agreements and agreements designated to protect the Company against changes in interest and currency exchange rates. The maximum amount of credit on this line is $2.7 million.
CARBON NATURAL GAS COMPANY
Notes to Consolidated Financial Statements
(Unaudited)
March 31, 2011
Note 6 — Bank Credit Facility (continued)
At March 31, 2011, there were approximately $6.2 million in outstanding borrowings under the credit facility. The Company’s effective borrowing rate at March 31, 2011 was 4.5%. The credit facility is collateralized by substantially all of the Company’s oil and gas assets. The credit facility includes terms that place limitations on certain types of activities and the payment of dividends, and requires satisfaction of a current ratio (the ratio of current assets to current liabilities) of 1.0 to 1.0 and a maximum Funded Debt Ratio (the ratio of the outstanding balance of all interest bearing indebtedness to the sum of EBITDAX (net income plus interest expense, income taxes, depreciation, depletion, amortization, exploration and impairment expenses and other non-cash charges) for the most recently completed four consecutive fiscal quarters) of 3.5 to 1.0 as of the end of any fiscal quarter. The Company is in compliance with all covenants associated with the credit agreement as of March 31, 2011.
Note 7 — Income Taxes
We recognize deferred income tax assets and liabilities for the estimated future tax consequences attributable to temporary differences between the financial statement carrying amounts of existing assets and liabilities and their respective tax bases. We have net operating loss carryforwards available in certain jurisdictions to reduce future taxable income. Future tax benefits for net operating loss carryforwards are recognized to the extent that realization of these benefits is considered more likely than not. To the extent that available evidence raises doubt about the realization of a deferred income tax asset, a valuation allowance is established.
At March 31, 2011, the Company has established a full valuation allowance against the balance of net deferred tax assets.
Note 8 — Stockholders’ Equity
Authorized and Issued Capital Stock
As of March 31, 2011, the authorized capital stock of Carbon was 50,010,000 shares, consisting of 48,500,000 shares of common stock with a par value of $0.01 per share, 1,000,000 shares of preferred stock with a par value of $0.01 per share and 510,000 shares of Class A Common Stock.
During the three month period ended March 31, 2011, no stock options or warrants were granted or forfeited. No stock was issued or forfeited under the Company’s restricted stock plan for the three month period ended March 31, 2011.
Pursuant to the merger (see Note 3), all options, warrants and restricted stock have been adjusted to reflect the conversion ratio used in the merger. Accordingly, as of March 31, 2011, the Company has 342,459 options outstanding and exercisable, and 2,696,133 warrants (including 250,000 warrants granted by SLSC prior to the merger) and 1,956,912 shares of common stock outstanding that are subject to restricted stock agreements.
Also pursuant to the merger, Nytis USA was authorized, as manager of Nytis LLC, to offer to redeem all unvested, forfeitable restricted membership interests pursuant to the Nytis LLC restricted membership interest plan. All of the restricted membership interests were redeemed in February 2011 for $300,000 and recorded as a general and administrative expense in the first quarter of 2011.
CARBON NATURAL GAS COMPANY
Notes to Consolidated Financial Statements
(Unaudited)
March 31, 2011
Note 9 — Accounts Payable and Accrued Liabilities
Accounts payable and accrued liabilities at March 31, 2011 and December 31, 2010 consist of the following:
|
|
|
March 31, |
|
December 31, |
| ||
|
|
|
|
|
|
| ||
|
Accounts payable |
|
$ |
12,203 |
|
$ |
341,899 |
|
|
Oil and gas revenue payable to oil and gas property owners |
|
315,938 |
|
325,544 |
| ||
|
Production taxes payable |
|
45,042 |
|
35,044 |
| ||
|
Accrued drilling costs |
|
7,842 |
|
112,661 |
| ||
|
Accrued lease operating costs |
|
192,964 |
|
98,324 |
| ||
|
Accrued ad valorem taxes |
|
343,566 |
|
305,224 |
| ||
|
Accrued bonus and payroll costs |
|
126,418 |
|
168,761 |
| ||
|
Other accrued liabilities |
|
335,604 |
|
244,736 |
| ||
|
|
|
|
|
|
| ||
|
Total accounts payable and accrued liabilities |
|
$ |
1,379,577 |
|
$ |
1,632,193 |
|
Note 10 — Physical Delivery Contracts and Gas Derivatives
The Company has historically used commodity-based derivative contracts to manage exposures to commodity price on certain of its gas production. The Company does not hold or issue derivative financial instruments for speculative or trading purposes. Nytis LLC also enters into gas physical delivery contracts to effectively provide gas price hedges. Because these contracts are not expected to be net cash settled, they are considered to be normal sales contracts and not derivatives. Therefore, these contracts are not recorded at fair value in the consolidated financial statements.
The Company has fixed price contracts requiring physical deliveries for approximately 90 Mcf per day for an average sales price of $5.26 per Mcf, which are on a month-to-month basis.
At March 31, 2011, other than the above mentioned contracts, the Company’s other gas sales contracts approximate index prices.
The Company’s swap agreements as of March 31, 2011 are summarized in the table below:
|
|
|
|
|
|
|
|
|
Floating Price |
|
Agreement |
|
Remaining |
|
|
|
Fixed Price |
|
Nytis USA |
|
Type |
|
Term |
|
Quantity |
|
Counterparty Payer |
|
Payer |
|
Swap |
|
4/11 - 5/11 |
|
10,000 MMBtu/month |
|
$6.03/ MMBtu |
|
(a) |
|
Swap |
|
4/11 - 4/12 |
|
10,000 MMBtu/month |
|
$5.25/ MMBtu |
|
(a) |
|
Swap |
|
4/11 - 12/11 |
|
10,000 MMBtu/month |
|
$4.80/ MMBtu |
|
(a) |
|
Swap |
|
1/12 - 12/12 |
|
10,000 MMBtu/month |
|
$5.07/ MMBtu |
|
(a) |
(a) NYMEX Henry Hub Natural Gas futures contract for the respective delivery month.
For its swap instruments, the Company receives a fixed price for the hedged commodity and pays a floating price to the counterparty. The fixed-price payment and the floating-price payment are netted, resulting in a net amount due to or from the counterparty.
CARBON NATURAL GAS COMPANY
Notes to Consolidated Financial Statements
(Unaudited)
March 31, 2011
Note 10 — Physical Delivery Contracts and Gas Derivatives (continued)
The following table summarizes the fair value of the derivatives recorded in the consolidated balance sheets. These derivative instruments are not designated as cash flow hedging instruments for accounting purposes:
|
|
|
March 31, |
|
December 31, |
| ||
|
Natural gas derivative contracts: |
|
|
|
|
| ||
|
Current assets |
|
$ |
126,000 |
|
$ |
171,000 |
|
|
Current liabilities |
|
$ |
— |
|
$ |
— |
|
The table below summarizes the realized and unrealized gains and losses related to the Company’s derivative instruments for the three months ended March 31, 2011 and 2010. These realized and unrealized gains and losses are recorded and included in commodity derivative gain in the accompanying consolidated statements of operations.
|
|
|
Three Months Ended March 31, |
| ||||
|
|
|
2011 |
|
2010 |
| ||
|
Commodity derivative contracts: |
|
|
|
|
| ||
|
Realized gains (losses) |
|
$ |
107,000 |
|
$ |
(39,000 |
) |
|
Unrealized (losses) gains |
|
(45,000 |
) |
514,000 |
| ||
|
|
|
|
|
|
| ||
|
Total realized and unrealized gains, net |
|
$ |
62,000 |
|
$ |
475,000 |
|
Realized gains are included in cash flows from operating activities in the Company’s consolidated statements of cash flows.
The counterparty in all of the Company’s derivative instruments is the lender in the Company’s bank credit facility; accordingly, the Company is not required to post collateral since the bank is secured by the Company’s oil and gas assets.
Due to the volatility of natural gas prices, the estimated fair values of the Company’s derivatives are subject to large fluctuations from period to period.
Note 11 — Related Party Transactions
Nytis Exploration Company (“NEC”) is an independent oil and gas company whose nature of its business is the exploration, development, production, marketing and sale of oil, gas, coalbed methane and other hydrocarbons in locations other than the United States. NEC has substantially the same shareholders as the Company. The Company has engaged NEC to assist in the management, direction and supervision of the operations and business functions of the Company. A service agreement between the Company and NEC provides for certain restrictions on NEC’s authority to perform acts in connection with the business of the Company and establishes provisions for the compensation of NEC in performing these duties. General and administrative expenses charged by NEC to the Company were approximately $371,000 and $277,000 for the three months ended March 31, 2011 and 2010, respectively. As of March 31, 2011, the Company owed NEC approximately $1.7 million. This payable consists primarily of charges incurred under the service agreement and advances made for capital expenditures and other miscellaneous general and administrative expenses.
CARBON NATURAL GAS COMPANY
Notes to Consolidated Financial Statements
(Unaudited)
March 31, 2011
Note 12 — Supplemental Cash Flow Disclosure
Supplemental cash flow disclosures for the three months ended March 31, 2011 and 2010 are presented below:
|
|
|
Three Months Ended March 31, |
| ||||
|
|
|
2011 |
|
2010 |
| ||
|
|
|
|
|
|
| ||
|
Cash paid during the period for: |
|
|
|
|
| ||
|
Interest payments |
|
$ |
80,000 |
|
$ |
231,000 |
|
|
|
|
|
|
|
| ||
|
Non-cash transactions: |
|
|
|
|
| ||
|
Increase in net asset retirement obligations due to additions |
|
$ |
— |
|
$ |
4,000 |
|
|
Decrease in net asset retirement obligations due to sale of properties |
|
$ |
— |
|
$ |
(512,480 |
) |
|
Decrease in accounts payable and accrued liabilities included in oil and gas properties |
|
$ |
(187,000 |
) |
$ |
(421,000 |
) |
|
Increase in interest receivable on promissory note |
|
$ |
— |
|
$ |
9,000 |
|
Note 13 — Subsequent Events
Name Change and Increase In Authorized Shares
As of March 31, 2011, the Company’s legal name was St. Lawrence Seaway Corporation. The Company believed that the continued use of the name St. Lawrence Seaway Corporation might result in market confusion regarding the Company’s current planned operations and business objectives. The Company believed the name “Carbon Natural Gas Company” was more descriptive of the business operations in which the Company engaged. In addition, based on discussions with financial and legal advisors, the Company believed that it needed to increase the number of its authorized common stock from 48,500,000 shares to 100,000,000 shares to afford the Company greater flexibility to effect future acquisitions and implement other operations as warranted.
Amendment to Asset Purchase Agreement
On February 14, 2011, Nytis LLC entered into an Asset Purchase Agreement (the “APA”) to purchase from The Interstate Natural Gas Company, LLC (a private limited liability company) and certain related parties (collectively referred to as “ING”), for $29.6 million (subject to adjustment at closing) certain natural gas properties, natural gas gathering and compression facilities and other assets related thereto, all located in eastern Kentucky and four counties in West Virginia. A deposit of $450,000 paid by the Company at the date of executing the APA is included in current assets as a deposit in the accompanying consolidated balance sheet.
On April 14, 2011, Nytis LLC and ING amended the APA to accomplish the following:
(i) To permit ING to use a portion of the Deposit (“Property Tax Draw”) to pay property taxes due and owing on the natural gas properties being sold by ING to Nytis LLC pursuant to the APA. In connection with such use of the Deposit, ING granted to Nytis LLC a production payment on certain natural gas wells to secure ING’s obligation to repay the Property Tax Draw, plus interest at the rate of 4.5% per annum, in the event that the APA is terminated and the terms of Section 16.1 thereof provide that the Deposit is to be returned to Nytis LLC. The amount of the Property Tax Draw will be credited to the purchase price due at the Final Closing (described below).
(ii) To provide for two closings. The first closing (“Initial Closing”), was to be held on or before April 22, 2011 and concerned the purchase and sale of approximately 45 natural gas wells (“Initial Assets”), the purchase price for which was not to exceed approximately $1.5 million. The date of the Initial Closing was extendable beyond April 22, 2011 by either Nytis LLC or ING for a maximum of seven days.
CARBON NATURAL GAS COMPANY
Notes to Consolidated Financial Statements
(Unaudited)
March 31, 2011
Note 13 — Subsequent Events (continued)
Amendment to Asset Purchase Agreement (continued)
The second closing (“Final Closing”) is to be held on or before May 23, 2011 (which date may be extended by either Nytis LLC or ING, but not beyond May 31, 2011) at which time Nytis LLC will purchase and ING will sell the acquired assets (other than the Initial Assets) in accordance with the terms of the amended APA.
On April 22, 2011, Nytis LLC bought the Initial Assets at the Initial Closing, by the payment of approximately $1.5 million in cash. Funds for the purchase of the Initial Assets were provided by a draw from its lending facility with Bank of Oklahoma, the available capacity for which existed prior to the borrowing base increase described below.
Funding for the Final Closing is expected to be financed with funds obtained from the Credit Facility with Bank of Oklahoma and by additional equity invested by the Company’s principal shareholders. However, as of May 13, 2011, the Company does not have commitments in place for such debt or additional equity.
Amendment to the Credit Facility
On April 22, 2011, Nytis LLC amended its credit facility with Bank of Oklahoma. The amended terms of the credit facility provides for, among other items, an increase in the borrowing base from $8.0 million to $10.0 million and a increase in the Funded Debt Ratio from 3.5 to 1 to 4.25 to 1 (see Note 6).
PART II
INFORMATION NOT REQUIRED IN PROSPECTUS
Other Expenses of Issuance and Distribution
Set forth below is an estimate of the approximate amount of fees and expenses payable by the registrant in connection with the issuance and distribution of the shares. The registrant will pay all of these expenses. All expenses other than the SEC registration fee are estimated.
|
|
|
Approximate |
| |
|
SEC Registration Fee |
|
$ |
4,902 |
|
|
Accounting Fees and Expenses |
|
10,000 |
| |
|
Legal Fees and Expenses |
|
25,000 |
| |
|
Miscellaneous |
|
5,000 |
| |
|
|
|
|
| |
|
Total |
|
$ |
44,902 |
|
Indemnification of Directors and Officers
We have the authority under the Delaware General Corporation Law to indemnify our directors and officers to the extent provided for in such statute. Set forth below is a discussion of Delaware law regarding indemnification that we believe discloses the material aspects of such law on this subject. The Delaware law provides, in part, that a corporation may indemnify a director or officer or other person who was, is or is threatened to be made a named defendant or respondent in a proceeding because such person is or was a director, officer, employee or agent of the corporation, if it is determined that such person:
· conducted himself or herself in good faith;
· reasonably believed, in the case of conduct in his or her official capacity as a director or officer of the corporation, that his or her conduct was in the corporation’s best interest and, in all other cases, that his or her conduct was at least not opposed to the corporation’s best interests; and
· in the case of any criminal proceeding, had no reasonable cause to believe that his or her conduct was unlawful.
A corporation may indemnify a person under the Delaware law against judgments, penalties, including excise and similar taxes, fines, settlement, and unreasonable expenses actually incurred by the person in connection with the proceeding. If the person is found liable to the corporation or is found liable on the basis that personal benefit was improperly received by the person, the indemnification is limited to reasonable expenses actually incurred by the person in connection with the proceeding, and shall not be made in respect of any proceeding in which the person shall have been found liable for willful or intentional misconduct in the performance of his duty to the corporation. The corporation may also pay or reimburse expenses incurred by a person in connection with his or her appearance as a witness or other participation in a proceeding at a time when the person is not a named defendant or respondent in the proceeding.
Our amended and restated certificate of incorporation provides that none of our directors shall be personally liable to us or our stockholders for monetary damages for breach of a fiduciary duty as a director, except for: (a) a breach of the directors’ duty of loyalty to us or our stockholders; (b) an act or omission not in good faith that constitutes a breach of duty of the director to us or an act or omission that involves intentional misconduct or a knowing violation of the law; (c) for violations of Section 174 of the Delaware General Corporation Law; or (d) a transaction from which the director received an improper benefit, whether or not the benefit resulted from an action taken within the scope of the director’s office. Limitations on liability provided for in our Certificate of Incorporation do not restrict the availability of non-monetary remedies and do not affect a director’s responsibility under any other law, such as the federal securities laws or state or federal environmental laws.
We believe that these provisions will assist us in attracting and retaining qualified individuals to serve as executive officers and directors. The inclusion of these provisions in our Certificate of Incorporation may have the effect of reducing a likelihood of derivative litigation against our directors and may discourage or deter stockholders or management from bringing a lawsuit against directors for breach of their duty of care, even though such an action, if successful, might otherwise have benefitted us or our stockholders.
Our Bylaws provide that we will indemnify our directors to the fullest extent provided by the Delaware General Corporation Law and we may, if and to the extent authorized by our Board, so indemnify our officers and other persons whom we have the power to indemnify against liability, reasonable expense or other matters.
Insofar as indemnification for liabilities arising under the Securities Act may be permitted to directors, officers and controlling persons of us pursuant to the foregoing provisions, or otherwise, we have been advised that in the opinion of the Securities and Exchange Commission such indemnification is against public policy as expressed in the Securities Act and is, therefore, unenforceable. In the event that a claim for indemnification against such liabilities (other than the payment by us of expenses incurred or paid by a director, officer or controlling person of the Company in the successful defense of any action, suit or proceeding) is asserted by such director, officer or controlling person in connection with the securities being registered, we will, unless in the opinion of our counsel the matter has been settled by controlling precedent, submit to a court of appropriate jurisdiction the question whether such indemnification by the Company is against public policy as expressed in the Securities Act and will be governed by the final adjudication of such issue.
RECENT SALES OF UNREGISTERED SECURITIES
1. As of the closing of the Merger, the Company issued 47,000,003 restricted shares of common stock to the former stockholders of Nytis USA. The Company relied on the exemptions under Sections 4(5) and 4(2) of the 1933 Act, based upon the accredited status of each such stockholder and their access to complete information concerning the Company at that date, necessary for them to make an informed investment decision.
2. On June 29, 2011, we entered into a common stock purchase agreement (i.e. the “Private Placement Purchase Agreement”) with various institutional investors and other accredited investors for the private placement of 44,444,444 shares of the Company’s common stock at a price of $0.45 per share, and a preferred stock purchase agreement (the “Preferred Purchase Agreement”) with Yorktown Energy Partners IX, L.P., an institutional investor and affiliate of the Company’s current majority stockholders, for the private placement of 100 shares of the Company’s Series A Convertible Preferred Stock at a price of $100,000 per share.
The shares of Series A Convertible Preferred Stock issued in the Private Placement automatically converted to 22,222,222 shares of common stock (in accordance with Section 3(9) of the 1933 Act) upon the effectiveness of an amendment to the Company’s Amended and Restated Certificate of Incorporation to increase the number of common stock shares the Company is authorized to issue. This occurred on July 18, 2011. After such conversion, the Private Placement resulted in the issuance of 66,666,666 shares of common stock at $0.45 per share, for $30 million in gross proceeds.
The $30 million in gross proceeds from the offering was before the deduction of fees payable to the placement agents, representing five percent of gross proceeds ($1.5 million), plus reimbursement of certain expenses and legal fees they incurred, as well as other fees and expenses incurred by the Company in connection with the Private Placement.
Net proceeds from the Private Placement have been principally used (approximately $22.7 million) for Carbon’s majority owned subsidiary, Nytis LLC, to complete the acquisition of certain gas and oil assets from The Interstate Natural Gas Company, LLC and certain related parties, which acquisition also closed on June 29, 2011. The remainder of the net proceeds have been or will be used to partially pay down our credit facility, fund future acquisitions and for general working capital purposes.
Carbon believes that it has a reasonable basis to believe that each of the 24 purchasers in the Private Placement are accredited investors as that term is defined in the SEC’s Regulation D, adopted under the 1933 Act. Accordingly,
Carbon relied on the exemption from registration of the offer and sale of the shares under Section 4(2) of the 1933 Act, and rule 506 of Regulation D promulgated thereunder.
EXHIBITS AND FINANCIAL STATEMENT SCHEDULES
The Exhibits filed herewith are set forth on the Index to Exhibits filed as a part of this Registration Statement beginning on page II-6 hereof.
UNDERTAKINGS
The undersigned registrant hereby undertakes:
To file, during any period in which offers or sales are being made, a post-effective amendment to this registration statement:
(i) to include any prospectus required by Section 10(a)(3) of the Securities Act of 1933, as amended;
(ii) to reflect in the prospectus any facts or events arising after the effective date of the registration statement (or the most recent post-effective amendment thereof) which, individually or in the aggregate, represent a fundamental change in the information set forth in the registration statement. Notwithstanding the foregoing, any increase or decrease in volume of securities offered (if the total dollar value of securities offered would not exceed that which was registered) and any deviation from the low or high end of the estimated maximum offering range may be reflected in the form of prospectus filed with the Commission pursuant to Rule 424(b) if, in the aggregate, the changes in volume and price represent no more than a 20 percent change in the maximum aggregate offering price set forth in the “Calculation of Registration Fee” table in the effective registration statement; and
(iii) To include any material information with respect to the plan of distribution not previously disclosed in the registration statement or any material change to such information in the registration statement.
That, for the purpose of determining any liability under the Securities Act of 1933, as amended, each such post-effective amendment shall be deemed to be a new registration statement relating to the securities offered therein, and the offering of such securities at that time shall be deemed to be the initial bona fide offering thereof.
To remove from registration by means of a post-effective amendment any of the securities being registered which remain unsold at the termination of the offering.
Insofar as indemnification for liabilities arising under the Securities Act of 1933, as amended, may be permitted to directors, officers and controlling persons of the Registrant pursuant to the foregoing provisions, or otherwise, the Registrant has been advised that in the opinion of the SEC such indemnification is against public policy as expressed in the Securities Act of 1933, as amended, and is, therefore, unenforceable. In the event that a claim for indemnification against such liabilities (other than the payment by the Registrant of expenses incurred or paid by a director, officer or controlling person of the Registrant in the successful defense of any action, suit or proceeding) is asserted by such director, officer or controlling person in connection with the securities being registered, the Registrant will, unless in the opinion of its counsel the matter has been settled by controlling precedent, submit to a court of appropriate jurisdiction the question whether such indemnification by it is against public policy as expressed in the Securities Act of 1933, as amended, and will be governed by the final adjudication of such issue.
For determining liability of the undersigned registrant under the Securities Act to any purchaser:
i. That each prospectus filed by the undersigned pursuant to Rule 424(b)(3) shall be part of the registration statement as of the date the filed prospectus was deemed part of and included in the registration statement; and
ii. Each prospectus required to be filed pursuant to Rule 424(b)(2), (b)(5), or (b)(7) as part of a registration statement in reliance on Rule 430B relating to an offering made pursuant to Rule 415(a)(1)(i), (vii), or (x) for the purpose of providing the information required by section 10(a) of the Securities Act shall be deemed to be part of and included in the registration statement as of the earlier of the date such form of prospectus is first used after effectiveness or the date of the first contract of sale of securities in the offering described in the prospectus. As provided in Rule 430B, for liability purposes of the issuer and any person that is at that date an underwriter, such date shall be deemed to be a new effective date of the registration statement relating to the securities in the registration statement to which that prospectus relates, and the offering of such securities at that time shall be deemed to be the initial bona fide offering thereof. Provided, however, that no statement made in a registration statement or prospectus that is part of the registration statement or made in a document incorporated or deemed incorporated by reference into the registration statement or prospectus that is part of the registration statement will, as to a purchaser with a time of contract of sale prior to such effective date, supersede or modify any statement that was made in the registration statement or prospectus that was part of the registration statement or made in any such document immediately prior to such effective date.
iii. Each prospectus filed pursuant to Rule 424(b) as part of a registration statement relating to an offering, other than registration statements relying on Rule 430B or other than prospectuses filed in reliance on Rule 430A, shall be deemed to be part of and included in the registration statement as of the date it is first used after effectiveness. Provided, however, that no statement made in a registration statement or prospectus that is part of the registration statement or made in a document incorporated or deemed incorporated by reference into the registration statement or prospectus that is part of the registration statement will, as to a purchaser with a time of contract of sale prior to such first use, supersede or modify any statement that was made in the registration statement or prospectus that was part of the registration statement or made in any such document immediately prior to such date of first use.
Pursuant to the requirements of the Securities Act of 1933, as amended, the registrant has duly caused this Registration Statement to be signed on its behalf by the undersigned, thereunto duly authorized, in the City of Denver, State of Colorado, on August 12, 2011.
|
|
Carbon Natural Gas Company | |
|
|
|
|
|
|
By: |
/s/ PATRICK R. MCDONALD |
|
|
|
Patrick R. McDonald |
|
|
|
Chief Executive Officer and President |
POWER OF ATTORNEY
Each person whose signature appears below hereby constitutes and appoints each of Patrick R. McDonald and Kevin D. Struzeski his true and lawful attorney-in-fact and agent, acting alone, with full power and substitution and resubstitution, to sign on his behalf, individually and in each capacity stated below, all amendments and post-effective amendments to this Registration Statement on Form S-1 (including any registration statement filed pursuant to Rule 462(b), (c) or (d) under the Securities Act of 1933, and all amendments thereto) and to file the same, with all exhibits thereto and any other documents in connection therewith, with the Securities and Exchange Commission under the Securities Act of 1933, granting unto said attorneys-in-fact and agents full power and authority to do and perform each and every act and thing requisite and necessary to be done in and about the premises, as fully and to all intents and purposes as each might or could do in person, hereby ratifying and confirming each act that said attorneys-in-fact and agents may lawfully do or cause to be done by virtue thereof.
Pursuant to the requirements of the Securities Act of 1933, as amended, this Registration Statement has been signed by the following persons in the capacities and on the dates indicated.
|
Name |
|
Title |
|
Date |
|
|
|
|
|
|
|
/s/ PATRICK R. MCDONALD |
|
Director, Chief Executive Officer, President and |
|
August 12, 2011 |
|
Patrick R. McDonald |
|
Chairman of the Board (Principal Executive Officer) |
|
|
|
|
|
|
|
|
|
/s/ KEVIN D. STRUZESKI |
|
Chief Financial Officer, Treasurer and Secretary |
|
August 12, 2011 |
|
Kevin D. Struzeski |
|
(Principal Financial Officer and Principal Accounting Officer) |
|
|
|
|
|
|
|
|
|
/s/ DAVID H. KENNEDY |
|
Director |
|
August 12, 2011 |
|
David H. Kennedy |
|
|
|
|
|
|
|
|
|
|
|
/s/ PETER A. LEIDEL |
|
Director |
|
August 12, 2011 |
|
Peter A. Leidel |
|
|
|
|
|
Exhibits: |
|
|
|
Exhibit No. |
|
Description |
|
|
|
|
|
2.1 |
|
Agreement and Plan of Merger dated January 31, 2011 by and among the Company, St. Lawrence Merger Sub, Inc. and Nytis Exploration (USA), Inc., incorporated by reference to exhibit 2.1 to Form 8-K for St. Lawrence Seaway Corporation filed February 1, 2011. |
|
3(i)(a) |
|
Amended and Restated Certificate of Incorporation of Carbon Natural Gas Company, incorporated by reference to exhibit 3(i) to Form 8-K for Carbon Natural Gas Company filed on May 5, 2011. |
|
3(i)(b) |
|
Amended and Restated Certificate of Designation with respect to Series A Convertible Preferred Stock or Carbon Natural Gas Company, incorporated by reference to exhibit 3(i) to Form 8-K for Carbon Natural Gas Company filed July 6, 2011. |
|
3(i)(c) |
|
Certificate of Amendment to Certificate of Incorporation of Carbon Natural Gas Company, incorporated by reference to exhibit 3(i) to Form 8-K for Carbon Natural Gas Company filed on July 19, 2011. |
|
3(ii) |
|
Amended and Restated Bylaws of St. Lawrence Seaway Corporation, incorporated by reference to exhibit 3(i) to Form 8-K/A for St. Lawrence Seaway Corporation filed on March 31, 2011. |
|
5.1* |
|
Opinion of Welborn Sullivan Meck & Tooley, P.C. |
|
10.1 |
|
Asset Purchase Agreement, by and between The Interstate Natural Gas Company, LLC and Nytis Exploration Company LLC, dated February 14, 2011, incorporated by reference to exhibit 10.1 to Form 8-K for St. Lawrence Seaway Corporation filed on February 17, 2011. |
|
10.2 |
|
Amended and Restated Credit Agreement, by and between Nytis Exploration Company LLC and Bank of Oklahoma, National Association, dated May 31, 2010, incorporated by reference to exhibit 10.2 to Form 8-K/A for St. Lawrence Seaway Corporation filed on March 31, 2011. |
|
10.2(a) |
|
Guaranty from Nytis USA to Bank of Oklahoma, National Association, dated June 21, 2005, incorporated by reference from exhibit 10.2(a) to Form 8-K/A for St. Lawrence Seaway Corporation filed on March 31, 2010. |
|
10.2(b) |
|
Consent of Guarantor and Amendment of Guaranty from Nytis USA to Bank of Oklahoma, National Association, dated May 31, 2010, incorporated by reference to exhibit 10.2(b) to Form 8-K/A for St. Lawrence Seaway Corporation filed on March 31, 2011. |
|
10.3* |
|
Second Amendment of Amended and Restated Credit Agreement, Limited Waiver and Borrowing Base Redetermination, by and between Nytis Exploration company LLC and Bank of Oklahoma, National Association, dated June 10, 2011. |
|
10.4* |
|
Guaranty from the Company to Bank of Oklahoma, National Association, dated June 10, 2011. |
|
10.5* |
|
Administrative Services Agreement by and among the Company, Nytis Exploration Company and Nytis Exploration Company LLC, dated June 29, 2011. |
|
10.6 |
|
Form of Common Stock Purchase Agreement dated June 29, 2011, incorporated by reference to exhibit 10.1 to Form 8-K for Carbon Natural Gas Company filed on July 6, 2011. |
|
10.7 |
|
Form of Preferred Stock Purchase Agreement dated June 29, 2011, incorporated by reference to exhibit 10.2 to Form 8-K for Carbon Natural Gas Company filed on July 6, 2011. |
|
10.8 |
|
Form of Registration Rights Agreement dated June 29, 2011, incorporated by reference to exhibit 10.3 to Form 8-K for Carbon Natural Gas Company filed on July 6, 2011. |
|
16.1 |
|
Letter from Braver P.C., incorporated by reference from exhibit 16.1 to Form 8-K for St. Lawrence Seaway Corporation filed on March 14, 2011. |
|
21.1* |
|
Subsidiaries of the Company. |
|
23.1* |
|
Consent of Ehrhardt Keefe Steiner & Hottman, P.C. |
|
23.2* |
|
Consent of Cawley, Gillespie and Associates, Inc. (Nytis Exploration Company, LLC). |
|
23.3* |
|
Consent of Cawley, Gillespie and Associates, Inc. (Interstate Natural Gas Company). |
|
23.4* |
|
Consent of Welborn Sullivan Meck & Tooley, P.C. (included in Exhibit 5.1). |
|
99.1* |
|
Cawley, Gillespie and Associates, Inc. April 7, 2011 Reserve Audit — Interstate Natural Gas Company |
|
99.2* |
|
Cawley, Gillespie and Associates, Inc. April 7, 2011 Reserve Audit - Nytis |
* Filed herewith