Attached files
Table of Contents
Index to Financial Statements
As filed with the Securities and Exchange Commission on August 12, 2011
Registration No. 333-—
UNITED STATES SECURITIES AND EXCHANGE COMMISSION
Washington, D.C. 20549
Form S-1
REGISTRATION STATEMENT
UNDER
THE SECURITIES ACT OF 1933
Matador Resources Company
(Exact name of registrant as specified in its charter)
| Texas | 1311 | 27-4662601 | ||
| (State or other jurisdiction of incorporation or organization) |
(Primary Standard Industrial Classification Code Number) |
(I.R.S. Employer Identification No.) |
One Lincoln Centre
5400 LBJ Freeway, Suite 1500
Dallas, Texas 75240
(972) 371-5200
(Address, including zip code, and telephone number, including area code, of registrant’s principal executive offices)
Joseph Wm. Foran
Chairman, President and Chief Executive Officer
Matador Resources Company
5400 LBJ Freeway, Suite 1500
Dallas, Texas 75240
(972) 371-5200
(Name, address, including zip code, and telephone number, including area code, of agent for service)
Copies to:
| Janice V. Sharry W. Bruce Newsome Haynes and Boone, LLP 2323 Victory Avenue, Suite 700 Dallas, Texas 75219 (214) 651-5000 |
Daryl B. Robertson Douglas M. Berman Hunton & Williams LLP 1445 Ross Avenue, Suite 3700 Dallas, Texas 75202 (214) 979-3000 |
Approximate date of commencement of proposed sale to the public: As soon as practicable after the effective date of this registration statement.
If any of the securities being registered on this Form are to be offered on a delayed or continuous basis pursuant to Rule 415 under the Securities Act of 1933 check the following box: ¨
If this Form is filed to register additional securities for an offering pursuant to Rule 462(b) under the Securities Act, please check the following box and list the Securities Act registration statement number of the earlier effective registration statement for the same offering. ¨
If this Form is a post-effective amendment filed pursuant to Rule 462(c) under the Securities Act, check the following box and list the Securities Act registration statement number of the earlier effective registration statement for the same offering. ¨
If this Form is a post-effective amendment filed pursuant to Rule 462(d) under the Securities Act, check the following box and list the Securities Act registration statement number of the earlier effective registration statement for the same offering. ¨
Indicate by check mark whether the registrant is a large accelerated filer, an accelerated filer, a non-accelerated filer, or a smaller reporting company. See the definitions of “large accelerated filer,” “accelerated filer” and “smaller reporting company” in Rule 12b-2 of the Exchange Act. (Check one):
| Large accelerated filer ¨ | Accelerated filer ¨ | Non-accelerated filer x | Smaller reporting company ¨ | |||
| (Do not check if a smaller reporting company) |
CALCULATION OF REGISTRATION FEE
|
| ||||||||
| Title of Each Class of Securities to Be Registered |
Amount to be Registered(1) |
Proposed Maximum Offering Price Per Share |
Proposed Maximum Aggregate Offering Price(2) |
Amount of Registration Fee | ||||
| Common Stock, par value $0.01 per share |
— | — | $150,000,000 | $17,415 | ||||
|
| ||||||||
|
| ||||||||
| (1) | Includes — shares of common stock which may be issued on exercise of a 30-day option granted to the underwriters to cover over-allotments, if any. |
| (2) | Estimated solely for the purpose of calculating the registration fee pursuant to Rule 457(a) under the Securities Act of 1933, as amended. |
The registrant hereby amends this registration statement on such date or dates as may be necessary to delay its effective date until the registrant shall file a further amendment which specifically states that this registration statement shall thereafter become effective in accordance with Section 8(a) of the Securities Act of 1933 or until the registration statement shall become effective on such date as the Commission acting pursuant to said Section 8(a), may determine.
Table of Contents
Index to Financial Statements
The information in this prospectus is not complete and may be changed. We may not sell these securities until the registration statement filed with the Securities and Exchange Commission is effective. This prospectus is not an offer to sell these securities and we are not soliciting offers to buy these securities in any state where the offer or sale is not permitted.
(Subject to completion, dated August 12, 2011)
PROSPECTUS Issued —, 2011
• Shares

Matador Resources Company
Common Stock
Matador Resources Company is offering — shares of its common stock. This is our initial public offering, and no public market currently exists for our shares. We anticipate that the initial public offering price of our common stock will be between $— and $— per share.
We intend to apply to list our common stock on the New York Stock Exchange under the symbol “MTDR.”
Investing in our common stock involves risks. See “Risk Factors” beginning on page 20.
PRICE $— PER SHARE
| Underwriting | ||||||||||||||||||||||||
| Price to | Discounts and | Proceeds to | ||||||||||||||||||||||
| Public | Commissions | Company | ||||||||||||||||||||||
| Per Share |
$ | — | $ | — | $ | — | ||||||||||||||||||
| Total |
$ | — | $ | — | $ | — | ||||||||||||||||||
We have granted the underwriters the right to purchase up to an additional — shares of common stock to cover over-allotments.
The Securities and Exchange Commission and state securities regulators have not approved or disapproved of these securities, or determined if this prospectus is truthful or complete. Any representation to the contrary is a criminal offense.
The underwriters expect to deliver the shares of common stock to purchasers on —, 2011.
| RBC CAPITAL MARKETS |
CITIGROUP |
—, 2011
Table of Contents
Index to Financial Statements
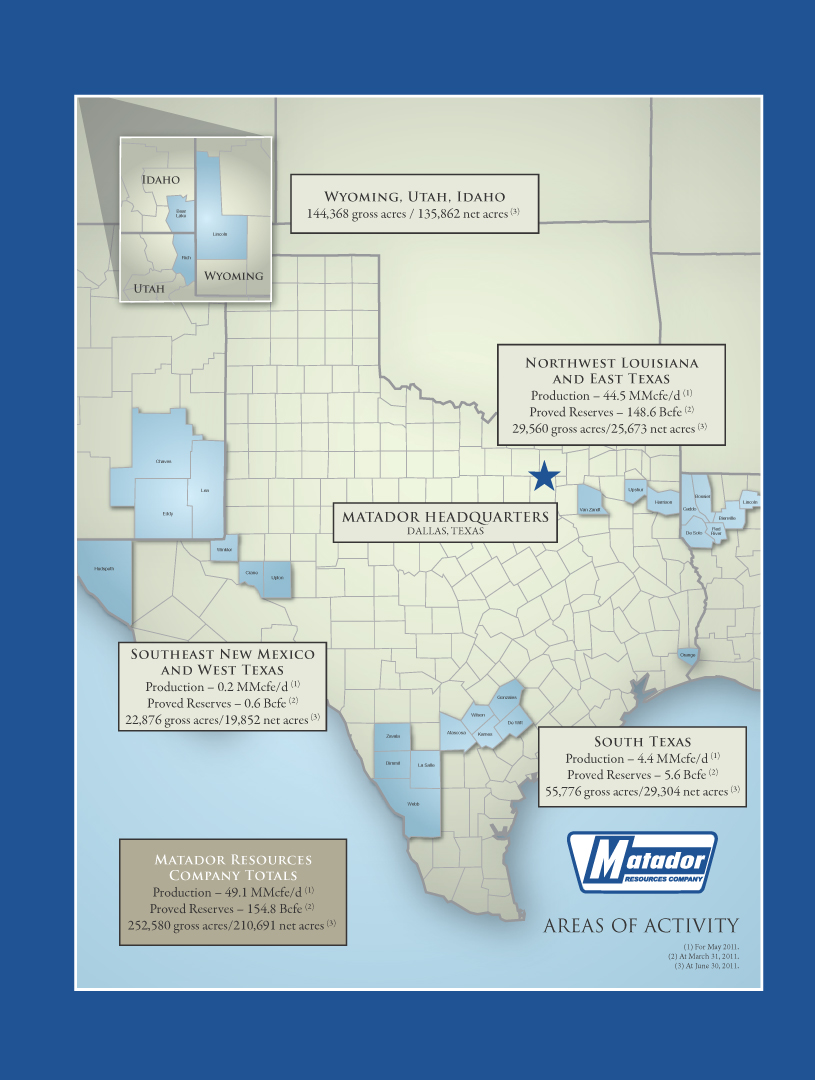
Table of Contents
Index to Financial Statements
| 1 | ||||
| 20 | ||||
| 47 | ||||
| 49 | ||||
| 50 | ||||
| 51 | ||||
| 52 | ||||
| 53 | ||||
| Management’s Discussion and Analysis of Financial Condition and Results of Operations |
55 | |||
| 85 | ||||
| 122 | ||||
| 135 | ||||
| 156 | ||||
| 160 | ||||
| Security Ownership of Management and Certain Beneficial Holders |
162 | |||
| 164 | ||||
| 168 | ||||
| Material U.S. Federal Income and Estate Tax Considerations to Non-U.S. Holders |
170 | |||
| 174 | ||||
| 180 | ||||
| 180 | ||||
| 180 | ||||
| F-1 | ||||
| A-1 |
You should rely only on the information contained in this prospectus and any free writing prospectus prepared by or on behalf of us or to which we have referred you. We have not authorized anyone to provide you with information different from that contained in this prospectus and any free writing prospectus. We are offering to sell shares of common stock, and seeking offers to buy shares of common stock, only in jurisdictions where offers and sales are permitted. The information in this prospectus is accurate only as of the date of this prospectus, regardless of the time of delivery of this prospectus or any sale of the common stock.
Until —, 2011, all dealers that buy, sell or trade our common stock, whether or not participating in this offering, may be required to deliver a prospectus. This requirement is in addition to the dealers’ obligation to deliver a prospectus when acting as underwriters and with respect to their unsold allotments or subscriptions.
Industry and Market Data
The market data and certain other statistical information used throughout this prospectus are based on independent industry publications, government publications or other published independent sources. Although we believe these third party sources are reliable and that the information is accurate and complete, we have not independently verified the information. Some data is also based on our good faith estimates.
i
Table of Contents
Index to Financial Statements
This summary provides a brief overview of information contained elsewhere in this prospectus. You should read the entire prospectus carefully before making an investment decision, including the information presented under the headings “Risk Factors,” “Cautionary Note Regarding Forward-Looking Statements” and “Management’s Discussion and Analysis of Financial Condition and Results of Operations” and the historical consolidated financial statements and related notes thereto included elsewhere in this prospectus. Unless otherwise indicated, information presented in this prospectus assumes that the underwriters’ option to purchase additional common shares is not exercised. We have provided definitions for certain oil and natural gas terms used in this prospectus in the “Glossary of Oil and Natural Gas Terms” beginning on page A-1 of this prospectus.
In this prospectus, unless the context otherwise requires, the terms “we,” “us,” “our,” and the “company” refer to Matador Resources Company and its subsidiaries before the completion of our corporate reorganization and Matador Holdco, Inc. and its subsidiaries after the completion of our corporate reorganization. In addition, in this prospectus, unless the context otherwise requires, the term “common stock” refers to shares of our common stock after the conversion of our Class B common stock into Class A common stock upon the consummation of this offering, as the Class A common stock will be the only class of common stock authorized after this offering, and the term “Class A common stock” refers to shares of our Class A common stock prior to the automatic conversion of our Class B common stock into Class A common stock upon the consummation of this offering. See “Description of Capital Stock.”
Matador Resources Company
Overview
Matador Resources Company is an independent energy company engaged in the exploration, development, production and acquisition of oil and natural gas resources in the United States, with a particular emphasis on oil and natural gas shale plays and other unconventional resource plays. Our current operations are located primarily in the Eagle Ford shale play in south Texas and the Haynesville shale play in northwest Louisiana and east Texas. These plays are a key part of our growth strategy and we believe these plays currently represent two of the most active and economically viable unconventional resource plays in North America. We expect the majority of our near-term capital expenditures will focus on increasing our production and reserves from these plays as we seek to capitalize on the relative economics of each play. In addition to these primary operating areas, we have acreage positions in southeast New Mexico and west Texas and in southwest Wyoming and adjacent areas in Utah and Idaho where we continue to identify new oil and natural gas prospects.
We were founded in July 2003 by Joseph Wm. Foran, Chairman, President and CEO, and Scott E. King, Co-Founder and Vice President, Geophysics and New Ventures, with an initial equity investment of approximately $6.0 million. Shortly thereafter, investors contributed approximately $46.5 million to provide a total initial capitalization of approximately $52.5 million. Most of this initial capital was provided by the same institutional and individual investors who helped capitalize Mr. Foran’s previous company, Matador Petroleum Corporation.
Mr. Foran began his career as an oil and natural gas independent in 1983 when he founded Foran Oil Company with $270,000 in contributed capital from 17 friends and family members. Foran Oil Company
1
Table of Contents
Index to Financial Statements
was later contributed to Matador Petroleum Corporation upon its formation by Mr. Foran in 1988. Mr. Foran served as Chairman and Chief Executive Officer of that company from its inception until it was sold in June 2003 to Tom Brown, Inc. in an all cash transaction for an enterprise value of approximately $388.5 million.
With an average of more than 25 years of oil and natural gas industry experience, our management team has extensive expertise in exploring for and developing hydrocarbons in multiple U.S. basins. Members of our management team have participated in the assimilation of numerous lease positions and in the drilling and completion of hundreds of vertical and horizontal wells in unconventional resource plays.
Since our first well in 2004, we have drilled or participated in drilling 194 wells through June 30, 2011, including 64 Haynesville and six Eagle Ford wells. From December 31, 2008 through March 31, 2011, we grew our estimated proved reserves from 20.0 Bcfe to 154.8 Bcfe. At March 31, 2011, 36% of our estimated proved reserves were proved developed reserves and 97% of our estimated proved reserves were natural gas. Also, we grew our average daily production by approximately 162% from 9.0 MMcfe per day for the year ended December 31, 2008 to 23.6 MMcfe per day for the year ended December 31, 2010. In addition, as a result of production from several new wells that were recently completed, our daily production for May 2011 averaged approximately 49.1 MMcfe per day. We have achieved this growth while lowering operating costs (consisting of lease operating expenses and production taxes and marketing expenses) from $1.91 per Mcfe for the year ended December 31, 2008, to $0.84 per Mcfe for the year ended December 31, 2010, or a decrease of approximately 55%.
The following table presents certain summary data for each of our operating areas at June 30, 2011 unless otherwise indicated:
| Producing Wells |
Total Identified Drilling Locations(1) |
Estimated Net Proved Reserves |
Avg.
Daily Production (MMcfe)(2) |
|||||||||||||||||||||||||||||
| Net Acreage | Gross | Net | Gross | Net | Bcfe(3) | % Developed | ||||||||||||||||||||||||||
| South Texas: |
||||||||||||||||||||||||||||||||
| Eagle Ford |
29,304 | 4.0 | 2.4 | 192.0 | 156.5 | 5.6 | 54.3 | 4.4 | ||||||||||||||||||||||||
| Austin Chalk |
14,729 | – | – | 16.0 | 16.0 | – | – | – | ||||||||||||||||||||||||
|
|
|
|
|
|
|
|
|
|
|
|
|
|
|
|
|
|||||||||||||||||
| Area Total(4) |
29,304 | 4.0 | 2.4 | 208.0 | 172.5 | 5.6 | 54.3 | 4.4 | ||||||||||||||||||||||||
|
|
|
|
|
|
|
|
|
|
|
|
|
|
|
|
|
|||||||||||||||||
| NW Louisiana/E Texas: |
||||||||||||||||||||||||||||||||
| Haynesville |
14,624 | 64.0 | 10.3 | 557.0 | 106.2 | 131.9 | 27.1 | 36.8 | ||||||||||||||||||||||||
| Cotton Valley(5) |
23,208 | 108.0 | 71.7 | 60.0 | 36.0 | 16.7 | 100.0 | 7.7 | ||||||||||||||||||||||||
|
|
|
|
|
|
|
|
|
|
|
|
|
|
|
|
|
|||||||||||||||||
| Area Total(6) |
25,673 | 172.0 | 82.0 | 617.0 | 142.2 | 148.6 | 35.3 | 44.5 | ||||||||||||||||||||||||
|
|
|
|
|
|
|
|
|
|
|
|
|
|
|
|
|
|||||||||||||||||
| SW Wyoming, NE Utah, SE Idaho |
135,862 | – | – | – | – | – | – | – | ||||||||||||||||||||||||
| SE New Mexico, West Texas |
19,852 | 13.0 | 5.7 | – | – | 0.6 | 100.0 | 0.2 | ||||||||||||||||||||||||
|
|
|
|
|
|
|
|
|
|
|
|
|
|
|
|
|
|||||||||||||||||
| Total |
210,691 | 189.0 | 90.1 | 825.0 | 314.7 | 154.8 | 36.2 | 49.1 | ||||||||||||||||||||||||
|
|
|
|
|
|
|
|
|
|
|
|
|
|
|
|
|
|||||||||||||||||
| (1) | These locations have been identified for potential future drilling and are not currently producing. In addition, the total net identified drilling locations is calculated by multiplying the gross identified drilling locations in an operating area by our working interest participation in such locations. |
| (2) | For May 2011. |
| (3) | At March 31, 2011. These estimates were prepared by our engineering staff and audited by independent reservoir engineers, Netherland, Sewell & Associates, Inc. |
| (4) | Some of the same leases cover the net acres shown for the Eagle Ford formation and the Austin Chalk formation, a shallower formation than the Eagle Ford. Therefore, the sum of the net acreage for both formations is not equal to the total net acreage for south Texas. Includes acreage that we are producing from or that we believe to be prospective for these formations. |
| (5) | Includes shallower zones and also includes one well producing from the Frio formation in Orange County, Texas. Also includes two wells producing from the San Miguel formation in Zavala County, Texas. |
| (6) | Some of the same leases cover the net acres shown for the Haynesville formation and the Cotton Valley formation, a shallower formation than the Haynesville. Therefore, the sum of the net acreage for both formations is not equal to the total net acreage for northwest Louisiana/east Texas. Includes acreage that we are producing from or that we believe to be prospective for these formations. |
2
Table of Contents
Index to Financial Statements
At June 30, 2011, our properties included approximately 56,000 gross acres and 29,000 net acres in the Eagle Ford shale play in Atascosa, DeWitt, Dimmit, Karnes, LaSalle, Gonzales, Webb, Wilson and Zavala Counties in south Texas. We believe that almost 85% of our Eagle Ford acreage is prospective predominantly for oil or significant liquids production. In addition, portions of the acreage are also prospective for other targets, such as the Austin Chalk, Olmos and Buda, from which we expect to produce predominantly oil and liquids. Approximately 80% of our Eagle Ford acreage is either held by production or not burdened by lease expirations before 2013. We have begun to explore and develop our Eagle Ford position and from November 2010 through August 2011, we completed our first four operated wells in this area (see “— Recent Developments”). We have identified 192 gross locations for potential future drilling in our Eagle Ford acreage.
In addition, at June 30, 2011, we had approximately 23,000 gross acres and 15,000 net acres in the Haynesville shale play in northwest Louisiana and east Texas, including almost 5,500 net acres in what we believe is the core area of the play. Almost 90% of our Haynesville acreage is held by production from the Haynesville or other formations and we believe much of it is also prospective for the Cotton Valley, Hosston (Travis Peak) and other shallower targets. In addition, we believe approximately 1,700 of these net acres are prospective for the Middle Bossier shale play. Our Haynesville acreage is approximately 10% developed and we have identified 557 gross locations for potential future drilling in our Haynesville acreage.
We also have a large unevaluated acreage position in southwest Wyoming and adjacent areas in Utah and Idaho where we began drilling our initial well in February 2011 to test the Meade Peak natural gas shale. We reached a depth of 8,200 feet, approximately 300 feet above the top of the Meade Peak shale, before having operations suspended for several months due to wildlife restrictions. We expect to resume operations on this initial test well in September 2011. In addition, we have leasehold interests in the Delaware and Midland Basins in southeast New Mexico and west Texas where we are developing new oil and natural gas prospects.
We are active both as an operator and as a co-working interest owner with larger industry participants including affiliates of Chesapeake Energy Corporation, EOG Resources, Inc., Royal Dutch Shell plc and others. Of the 194 gross wells we have drilled or participated in drilling, we drilled approximately 49% of these wells as the operator. At July 31, 2011, we were the operator for approximately 82% of our Eagle Ford and 71% of our Haynesville acreage, including approximately 23% of our acreage in what we believe is the core area of the Haynesville play. A large portion of our acreage in that core area is operated by a subsidiary of Chesapeake Energy Corporation. We also operate all of our acreage in southwest Wyoming and the adjacent areas of Utah and Idaho, as well as the vast majority of our acreage in southeast New Mexico and west Texas.
Our net proceeds from this offering, after discharging in full the $25.0 million term loan and repaying $10.0 million of the outstanding borrowings under our revolving Credit Agreement, when taken together with our cash flows and future potential borrowings under our Credit Agreement, will be used to fund the remainder of our 2011 and our entire 2012 exploration and development program and for potential acquisitions of interests and acreage. See “Use of Proceeds.”
3
Table of Contents
Index to Financial Statements
The following table presents our 2011 and 2012 anticipated capital expenditure budgets of approximately $148.9 million and $230.8 million, respectively. From January 1, 2011 through July 31, 2011, we spent approximately $84.2 million in capital expenditures (or 57% of our 2011 capital expenditures budget). Approximately 70% and 23% of these expenditures were spent in the development of our acreage in the Eagle Ford shale play and the core area of the Haynesville shale play, respectively. From August 1, 2011 through December 31, 2011, we anticipate that our capital expenditures will be approximately $64.7 million. While we have budgeted $148.9 million for 2011 and $230.8 million for 2012, the aggregate amount of capital we will expend may fluctuate materially based on market conditions and the outcome of our drilling results during the remainder of 2011 and in 2012. Since approximately 90% of our Haynesville acreage was held by production and approximately 80% of our Eagle Ford acreage was either held by production or not burdened by lease expirations before 2013 at June 30, 2011, we have the financial flexibility to allocate our capital when we believe it is economical and justified.
| 2011-2012 Anticipated Drilling | Anticipated Capital Expenditure Budgets | |||||||||||||||
| Gross Wells(1) | Net Wells(1) | 2011 (in millions)(2) | 2012 (in millions)(2) | |||||||||||||
| South Texas: |
||||||||||||||||
| Eagle Ford |
27.0 | 26.3 | $ | 58.2 | $ | 168.8 | ||||||||||
| Austin Chalk |
2.0 | 2.0 | – | 8.0 | ||||||||||||
|
|
|
|
|
|
|
|
|
|||||||||
| Area Total |
29.0 | 28.3 | 58.2 | 176.8 | ||||||||||||
|
|
|
|
|
|
|
|
|
|||||||||
| NW Louisiana/E Texas: |
||||||||||||||||
| Haynesville |
70.0 | 7.4 | 42.5 | 27.5 | ||||||||||||
| Cotton Valley |
1.0 | 1.0 | 5.1 | – | ||||||||||||
|
|
|
|
|
|
|
|
|
|||||||||
| Area Total |
71.0 | 8.4 | 47.6 | 27.5 | ||||||||||||
|
|
|
|
|
|
|
|
|
|||||||||
| SW Wyoming, NE Utah, SE Idaho |
2.0 | 0.8 | 1.5 | (3) | 1.5 | (3) | ||||||||||
| SE New Mexico, West Texas |
– | – | – | – | ||||||||||||
| Other |
N/A | N/A | 41.6 | (4) | 25.0 | (5) | ||||||||||
|
|
|
|
|
|
|
|
|
|||||||||
| Total |
102.0 | 37.5 | $ | 148.9 | $ | 230.8 | ||||||||||
|
|
|
|
|
|
|
|
|
|||||||||
| (1) | Includes wells we currently expect to drill and complete as operator, plus those wells in which we currently plan to participate in the remainder of 2011 and in 2012. Also includes wells we have drilled to date in 2011. |
| (2) | Our capital expenditure budgets are based on our net working interests in the properties. Also includes 2011 costs for wells drilled in 2010 and completed in early 2011 and costs for wells drilled to date in 2011. |
| (3) | We have a carried interest for $4.2 million of the cost of drilling the initial test well on this prospect and a carried interest for $5.0 million if a second test well is drilled on this prospect. We began drilling the initial test well, the Crawford Federal #1, in Lincoln County, Wyoming in February 2011. We reached a depth of 8,200 feet, approximately 300 feet above the top of the Meade Peak shale, before having operations suspended for several months due to wildlife restrictions. We expect to resume operations on this initial test well in September 2011. |
| (4) | Includes primarily leasehold costs, but also 2-D and 3-D seismic and other miscellaneous capital expenses such as recompletion expenses. A majority of these expenses are allocated to our acreage in the Eagle Ford and Haynesville shale plays. Also includes $32.6 million and $2.7 million incurred for leasehold acquisitions in the Eagle Ford and Haynesville shale plays, respectively, at July 31, 2011. |
| (5) | Includes $20.0 million to acquire additional leasehold interests primarily prospective for oil and liquids production in southeast New Mexico and west Texas. |
4
Table of Contents
Index to Financial Statements
Recent Developments
In August 2011, we completed our fourth operated Eagle Ford horizontal well, the Lewton #1H in DeWitt County, Texas. We are preparing to flow test this well following a 17-stage hydraulic fracture treatment. We are the operator of this well and paid 100% of the costs to drill and complete the well. We will receive 85% of the revenues attributable to the working interest in the well until we have recovered all of our acquisition, drilling and completion costs, after which time, our partner will receive 50% of the revenues attributable to the working interest in the well and we and our partner will each maintain a 50% working interest in the well.
Between March and July 2011, we acquired leasehold interests in approximately 6,300 gross and 4,800 net acres in DeWitt, Karnes, Wilson and Gonzales Counties, Texas in the Eagle Ford shale play from Orca ICI Development, JV. We believe that all of this acreage is in an oil and liquids prone area of the Eagle Ford play. We believe that the acreage in Wilson and Gonzales Counties and a portion of DeWitt County will be prospective for oil and liquids from the Austin Chalk formation in addition to the Eagle Ford. We paid approximately $31.5 million to acquire this acreage. We currently own a 50% working interest in the acreage (approximately 2,800 gross and 1,400 net acres) in DeWitt County and are the operator. We currently own a 100% working interest in the acreage (approximately 3,500 gross and 3,400 net acres) in Karnes, Wilson and Gonzales Counties and are the operator.
On May 19, 2011, the borrowing base under our credit agreement was increased to $80.0 million. On May 19, 2011, primarily to fund our acquisition of the new Eagle Ford acreage from Orca ICI Development, JV, we borrowed an additional $10.0 million under our credit agreement (bringing our total to $60.0 million) and borrowed an additional $25.0 million as a term loan. Out of the net proceeds we receive from this offering, we intend to repay the term loan in full and reduce borrowings under our credit agreement by approximately $10.0 million, leaving $50.0 million of long-term indebtedness outstanding after this offering.
In March 2011, first sales of natural gas began from our Williams 17 H#1 well, located in what we believe to be the core area of the Haynesville shale play in northwest Louisiana. We began producing this well at a constrained rate of about 10.0 MMcf of natural gas per day that we believe optimizes overall well economics, even though we believe that this well was initially capable of delivering 20.0 to 25.0 MMcf of natural gas per day. During June 2011, this well produced at an average daily rate of 8.4 MMcf of natural gas per day and had produced approximately 0.9 Bcf of natural gas at June 30, 2011. We are the operator and have a 100% working interest and a favorable 87.5% net revenue interest in this well.
In February 2011, we completed our third operated Eagle Ford horizontal well, the Affleck #1H, in eastern Dimmit County, Texas. This well tested at approximately 415 Bbls of oil and 5.4 MMcf of natural gas per day during an initial flow test. This well has been shut-in while we negotiate a pipeline right-of-way and prepare to lay a gas sales line to the well, which we anticipate will be completed in September 2011. We are the operator and have a 100% working interest in this well.
In January 2011, we completed a private placement offering of 1,922,199 shares of our Class A common stock at $11.00 per share for an aggregate amount of $21,144,189.
In January 2011, we completed our second operated Eagle Ford horizontal well, the Martin Ranch #1H, in northeastern LaSalle County, Texas. First sales of oil and natural gas from this well began in late
5
Table of Contents
Index to Financial Statements
March at approximately 700 Bbls of oil and 350 Mcf of natural gas per day. At June 30, 2011, the well was producing approximately 500 Bbls of oil and 700 Mcf of natural gas per day, and through June 30, 2011, had produced a total of approximately 58,000 Bbls of oil and 50 MMcf of natural gas. We are the operator and have a 100% working interest in this well.
In January 2011, first sales of oil and natural gas began from our first operated Eagle Ford horizontal well, the JCM Jr. Minerals #1H, in southern LaSalle County, at approximately 3.4 MMcf of natural gas and 135 Bbls of condensate per day. At June 30, 2011, the well was producing approximately 1.0 MMcf of natural gas and 25 Bbls of condensate per day, and through June 30, 2011, had produced a total of approximately 300 MMcf of natural gas and 8,700 Bbls of condensate. We are the operator and have a 100% working interest in this well.
In January 2011, we completed our first horizontal Cotton Valley well, the Tigner Walker H#1-Alt., in DeSoto Parish, Louisiana. First sales of natural gas from this well began in late January at approximately 4.6 MMcf of natural gas per day. At June 30, 2011, the well was producing approximately 3.0 MMcf of natural gas per day and through June 30, 2011, had produced a total of approximately 600 MMcf of natural gas. We have been producing this well at a constrained natural gas rate. We are the operator and have a 100% working interest in this well subject to a reversionary interest at payout.
On December 31, 2010, first sales of natural gas began from our L.A. Wildlife H#1 Alt. horizontal well, located in what we believe to be the core area of the Haynesville shale play in northwest Louisiana. We began producing this well at a constrained rate of about 10.0 MMcf of natural gas per day that we believe optimizes overall well economics, even though we believe that this well was initially capable of delivering 20.0 to 25.0 MMcf of natural gas per day. At June 30, 2011, the well was producing approximately 10.6 MMcf of natural gas per day, and through June 30, 2011, had produced a total of approximately 1.7 Bcf of natural gas. We are the operator and have a 95% working interest in this well.
Business Strategies
Our goal is to increase shareholder value by building reserves, production and cash flows at an attractive return on invested capital. We plan to achieve our goal by executing the following strategies:
| • | Focus Exploration and Development Activity on Our Eagle Ford and Haynesville Shale Assets. |
We have established core acreage positions in the Eagle Ford and Haynesville shale plays, which we believe are two of the most active and economically viable shale plays in North America. While we intend to allocate a portion of our 2011 and 2012 capital expenditure budgets to financing exploration, development and acquisition of additional interests in the Haynesville shale play, we currently intend to dedicate approximately 63% of our 2011 and approximately 74% of our 2012 capital expenditure budgets to the exploration, development and acquisition of additional interests in the Eagle Ford shale play. Since approximately 90% of our Haynesville acreage was held by production and approximately 80% of our Eagle Ford acreage was either held by production or not burdened by lease expirations before 2013 at June 30, 2011, we have the flexibility to develop our acreage in a disciplined manner in order to maximize the resource recovery from these assets. We believe the economics for development in these two areas are attractive at current commodity prices.
6
Table of Contents
Index to Financial Statements
| • | Identify, Evaluate and Exploit Oil Plays to Create a More Balanced Portfolio. |
Although most of our proved reserves are currently classified as natural gas, we have been evaluating various oil plays to find and execute upon opportunities that would fit well with our exploration and operating strategies. We believe our interests in the Eagle Ford shale play will enable us to create a more balanced commodity portfolio through the development of locations that are prospective for oil and liquids. At July 31, 2011, we had spent approximately $58.9 million on oil and liquids exploration and acreage acquisition activities in 2011 and expect to spend approximately $35.4 million on oil and liquids exploration and acreage acquisition activities during the remainder of 2011. We believe oil and liquids opportunities represent a substantial portion of our anticipated 2011 and 2012 drilling capital expenditure budgets. We expect to continue to create and acquire additional prospects and opportunities for the exploration and production of oil and liquids.
| • | Pursue Opportunistic Acquisitions. |
We believe our management team’s familiarity with our key operating areas and its contacts with the operators and mineral owners in those regions enable us to identify high return opportunities at attractive prices. We actively pursue opportunities to acquire unproved and unevaluated acreage, drilling prospects and low-cost producing properties within our core areas of operations where we have operational control and can enhance value and performance. We view these acquisitions as an important component of our business strategy and intend to selectively make acquisitions on attractive terms that complement our growth and help us achieve economies of scale.
| • | Maintain Our Low Cost Structure and Financial Discipline. |
As an operator, we seek to manage aggressively our costs by leveraging advanced technologies and integrating the knowledge, judgment and experience of our management and technical teams. We believe our team demonstrates financial discipline that is reflected in the improvements it has achieved on reducing unit costs and is achieved by our approach to evaluating and analyzing prospects and prior drilling and completion results before allocating capital. When we are not the operator, we proactively engage with the operators in an effort to ensure similar financial discipline and cost-focused operations and results. Additionally, we conduct our own internal geological and engineering studies on these prospects and provide input on the drilling, completion and operation of many of these non-operated wells pursuant to our agreements and relationships with the operators. Through these methods and practices, we believe we are well-positioned to control the expenses and timing of development and exploitation of our properties.
| • | Maintain Proactive and Ongoing Relationships with Other Industry Participants. |
We believe maintaining proactive and ongoing relationships with other industry operators and vendors enhances our understanding of the shale plays and allows us to leverage their expertise without having to commit substantial capital. We currently participate in various drilling activities with larger industry participants, including affiliates of Chesapeake Energy Corporation, EOG Resources, Inc., Royal Dutch Shell plc and others. We are also active participants in three industry shale consortia: the North American Gas Shale, Haynesville and Bossier Shale and Eagle Ford Shale consortia organized by Core Laboratories, LP. As active members in various professional societies, our staff and board members also regularly interact on a professional basis with other industry participants.
7
Table of Contents
Index to Financial Statements
Competitive Strengths
We believe our prior success is, and our future performance will be, directly related to the following combination of strengths that will enable us to implement our strategies:
| • | High Quality Asset Base in Attractive Areas. |
We have key acreage positions in active areas of the Eagle Ford and Haynesville shale plays. We believe our assets in these plays are characterized by low geological risk and similar repeatable drilling opportunities that we expect will result in a predictable production growth profile. The commodity mix of our production and reserves is expected to become more balanced as a result of our planned activities on our Eagle Ford and Austin Chalk acreage, which is located in oil and liquids prone areas of the plays. In addition to the Haynesville shale, our east Texas and north Louisiana assets have multiple, recognized geologic horizons, including the Middle Bossier shale, Cotton Valley and Hosston (Travis Peak) formations. We also believe there is additional resource potential in our oil and natural gas prospects in southeast New Mexico and west Texas, along with our natural gas prospects in southwest Wyoming and adjacent areas in Utah and Idaho.
| • | Large, Multi-year, Development Drilling Inventory. |
Within our northwest Louisiana/east Texas and south Texas regions, we have identified 825 gross and 315 net drilling locations, including 192 gross and 157 net locations in the Eagle Ford shale play and 557 gross and 106 net locations in the Haynesville shale play. Approximately 15% of our Haynesville and 1% of our Eagle Ford gross locations have been included in our estimated proved reserves at March 31, 2011. We have identified 27 gross and 26 net locations in the Eagle Ford shale play and 70 gross and seven net locations in the Haynesville shale play that we expect to drill in 2011 and 2012, the completion of which would represent approximately 14% and 13% of our identified gross drilling locations in these two areas, respectively. Additionally, we expect to identify and develop additional locations across our broad exploration portfolio as we evaluate our Cotton Valley, Austin Chalk, Meade Peak and Delaware and Midland Basin assets. We believe our multi-year, identified drilling inventory and exploration portfolio provide visible near-term growth in our production and reserves, and highlight the long-term resource potential across our asset base.
| • | Financial Flexibility to Fund Expansion. |
Historically, we have maintained financial flexibility by obtaining capital through shareholder investments and our operational cash flows while maintaining low levels of indebtedness, which has allowed us to take advantage of acquisition opportunities as they arise. Upon the completion of this offering and the repayment of our $25.0 million term loan in full and $10.0 million of our outstanding borrowings under our revolving credit agreement, we expect to have at least $— million in cash, cash equivalents and certificates of deposit and at least $30.0 million available for borrowings under our credit agreement. Excluding any possible acquisitions, we expect to maintain our current financial flexibility by funding our remaining 2011 and entire 2012 capital expenditure budgets through the net proceeds from this offering, together with our operational cash flows and future potential borrowings under our credit agreement. Our availability of capital as described above will also allow us to maintain our competitiveness in seeking to acquire additional oil and natural gas properties as opportunities arise. A strong balance sheet and interest savings should also reduce unit costs and increase profitability. In addition, since a large portion of our Eagle Ford and Haynesville acreage was held by production at June 30, 2011, we have the financial flexibility to allocate our capital when we believe it is economical and justified.
8
Table of Contents
Index to Financial Statements
| • | Experienced and Incentivized Management, Technical Team and Board. |
Our management and technical teams possess extensive oil and natural gas expertise with an average of over 25 years of relevant industry experience from companies such as Matador Petroleum Corporation, S. A. Holditch & Associates, Inc., Schlumberger Limited, Conoco and ARCO, and we believe they have a demonstrated record of growth and financial discipline over many years. The management team has experience in drilling and completing hundreds of vertical and horizontal wells in unconventional resource plays, including the Cotton Valley, Bossier, Wilcox/Vicksburg, Austin Chalk, Haynesville and Eagle Ford plays. Our management team’s experience is complemented by a strong technical team with deep knowledge of advanced geophysical, drilling and completion technologies whose members are active in their professional societies. Additionally, we have a group of board members and special advisors with considerable experience and expertise in the oil and natural gas industry and in managing other successful enterprises who provide insight and perspective regarding our business and the evaluation, exploration, engineering and development of our prospects. In addition to its considerable experience, our management team currently owns and will continue to own a significant direct ownership interest in us immediately following the completion of this offering. We believe our management team’s direct ownership interest, as well as its ability to increase its holdings over time through our long-term incentive plan, aligns management’s interests with those of our shareholders.
| • | Extensive Geologic, Engineering and Operational Experience in Unconventional Reservoir Plays. |
The individuals on our technical team are highly experienced in analyzing unconventional reservoir plays and in horizontal drilling, completion and production operations in a number of geographic areas. Our geologists have extensive experience in analyzing unconventional reservoir plays throughout the United States, including our principal areas of interest, by using the latest imaging technology, such as 2-D and 3-D seismic interpretation, and petrophysical analysis. In addition, our technical team has been directly involved in over 26 different horizontal well drilling and/or operations programs in both onshore and offshore formations located in the United States and abroad. Our team’s diverse and broad horizontal drilling experience includes most, if not all, techniques used in modern day drilling. Additionally, our team has in-depth experience with various horizontal completion techniques and their applications in multiple unconventional plays. We intend to leverage our team’s geological expertise and horizontal drilling and completion experience to develop and exploit our large, multi-year development drilling inventory.
| • | Multi-Disciplined Approach to New Opportunities. |
Our process for evaluating and developing new oil and natural gas prospects is a result of what we believe is an organizational philosophy that is dedicated to a systematic, multi-disciplinary approach to new opportunities with an emphasis on incorporating petroleum systems, geosciences, technology and finance into the decision-making process. We recognize the importance of consulting multiple individuals in our organization across all disciplines and all levels of responsibility prior to making exploration, acquisition or development decisions and the formulation of key criteria for successful exploration and development projects in any given play to enhance our decision-making. We also conduct a “post-mortem” review of our major decisions to determine what we did right and where we need to improve. At times, this approach results in a decision to accelerate our development program or expand our positions in certain areas. Other times, this approach results in a decision to mitigate risk associated with our exploration and
9
Table of Contents
Index to Financial Statements
development programs by sharing operational risks and costs with other industry participants or exiting an area altogether. We believe this multi-disciplined approach underpins our track record of value creation and represents the best way to deliver consistent, year-over-year results to our shareholders.
Certain Risk Factors
An investment in our common stock involves risks that include the speculative nature of oil and natural gas exploration and production, competition, volatile oil and natural gas prices and other material factors. In particular, the following considerations may offset our competitive strengths or have a negative effect on both our business strategy as well as on activities on our properties, which could cause a decrease in the price of our common stock and result in a loss of all or a portion of your investment:
| • | Our success is dependent on the prices of oil and natural gas. The substantial volatility in these prices may adversely affect our financial condition and our ability to meet our capital expenditure requirements and financial obligations; |
| • | Low natural gas prices in the future could adversely impact us as our current production and reserves consist primarily of natural gas and many of our exploration prospects and development opportunities focus on natural gas; |
| • | Low oil prices in the future could adversely impact us as most of our near-term exploration opportunities in the Eagle Ford shale play focus on oil and liquids; |
| • | Drilling for and producing oil and natural gas are high-risk activities with many uncertainties that could adversely affect our business, financial condition, results of operations and cash flows; |
| • | Our oil and natural gas reserves are estimated and may not reflect our actual reserves, and significant inaccuracies in these reserve estimates or underlying assumptions will materially affect the quantities and present value of our reserves; |
| • | Our exploration, development and exploitation projects require substantial capital expenditures, and we may be unable to obtain needed capital on satisfactory terms, which could adversely affect our future growth; |
| • | The mechanical risks of drilling and completion activities as well as the unavailability or high cost of drilling rigs, completion equipment and services, supplies and personnel, including hydraulic fracturing equipment and personnel, could adversely affect our ability to establish and execute exploration and development plans within budget and on a timely basis, which could have a material adverse effect on our financial condition, results of operations and cash flows; |
| • | Because our reserves and production are concentrated in a small number of properties, production problems and markets related to any property could have a material impact on our business; |
| • | Drilling locations that we decide to drill may not yield oil or natural gas in commercially viable quantities; |
| • | We have limited control over activities on properties we do not operate; |
| • | Approximately 65% of our total proved reserves at March 31, 2011 consisted of undeveloped and developed non-producing reserves, and those reserves may not ultimately be developed or produced; |
10
Table of Contents
Index to Financial Statements
| • | Our success depends, to a large extent, on our ability to retain our key personnel, including our Chairman of the Board, Chief Executive Officer and President, the members of our board of directors and our special board advisors, and the loss of any key personnel, board member or special board advisors could disrupt our business operations; and |
| • | If one or more material weaknesses persist or if we fail to establish and maintain effective internal control over financial reporting, our ability to accurately report our financial results could be adversely affected. |
For a discussion of these risks and other considerations that could negatively affect us, including risks related to this offering and our common stock, see “Risk Factors” beginning on page 20 and “Cautionary Note Regarding Forward-Looking Statements.”
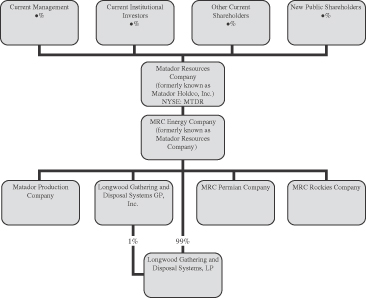
Organizational Structure
Matador Resources Company was formed as a Texas corporation in July 2003. Pursuant to the terms of the corporate reorganization that was completed on August 9, 2011, former Matador Resources Company, now known as MRC Energy Company, became a wholly owned subsidiary of current Matador Resources Company, formerly known as Matador Holdco, Inc. In connection with the reorganization, former Matador Resources Company changed its corporate name to MRC Energy Company, and Matador Holdco, Inc. changed its corporate name to Matador Resources Company.
The following diagram indicates our ownership structure and organizational structure after giving effect to our corporate reorganization and this offering. The shareholder ownership information set forth below is based on our reasonable judgment and reflects an approximation of the beneficial ownership of our common stock after consummation of this offering based on the number of shares beneficially owned by our current shareholders at —, 2011.
11
Table of Contents
Index to Financial Statements
Corporate Information
We are headquartered in Dallas, Texas. Our executive offices and mailing address are at One Lincoln Centre, 5400 LBJ Freeway, Suite 1500, Dallas, Texas 75240. Our telephone number is (972) 371-5200. We expect to have an operational website that meets Securities and Exchange Commission, or SEC, and New York Stock Exchange, or NYSE, requirements concurrently with, or prior to, the completion of this offering. Information on our website or any other website is not and will not be incorporated by reference herein and does not and will not constitute a part of this prospectus.
12
Table of Contents
Index to Financial Statements
The Offering
| Issuer |
Matador Resources Company | |
| Common stock offered by us |
— shares (— shares if the underwriters’ over-allotment is exercised in full) | |
| Common stock outstanding after offering |
— shares (— shares if the underwriters’ over-allotment is exercised in full)
The number of shares to be outstanding after this offering is based on — shares of our common stock outstanding at —, 2011 and excludes — additional shares that are authorized for future issuance under our equity incentive plans, of which — shares may be issued pursuant to outstanding stock options. | |
| Over-allotment option |
We have granted the underwriters a 30-day option to purchase up to an aggregate of — additional shares of our common stock to cover any over-allotments. | |
| Use of proceeds |
We estimate that our net proceeds from this offering will be approximately $— million after deducting the underwriting discounts and commissions and estimated offering expenses.
We intend to use approximately $25.0 million of the net proceeds from this offering to repay in full our outstanding term loan. In addition, we intend to use approximately $10.0 million from this offering to repay a portion of the outstanding indebtedness under our revolving credit agreement, approximately $60.0 million of which was outstanding on June 30, 2011. The remaining net proceeds will be used to fund a portion of our 2011 and a portion of our anticipated 2012 capital expenditure budgets and for other general corporate purposes. See “Use of Proceeds.” | |
| Dividend policy |
We do not anticipate paying any cash dividends on our common stock. | |
| Risk factors |
You should carefully read and consider the information beginning on page 20 of this prospectus set forth under the heading “Risk Factors” and all other information set forth in this prospectus before deciding to invest in our common stock. | |
| New York Stock Exchange Symbol
|
MTDR
| |
13
Table of Contents
Index to Financial Statements
Summary Financial, Reserves and Operating Data
You should read the following summary financial, reserves and operating data in conjunction with “Selected Historical Consolidated and Other Financial Data,” “Management’s Discussion and Analysis of Financial Condition and Results of Operations,” “Business” and our audited and unaudited historical consolidated financial statements and related notes thereto included elsewhere in this prospectus. The financial information included in this prospectus may not be indicative of our future results of operations, financial position and cash flows.
Financial Data
The following tables set forth summary historical consolidated financial information for the company and its subsidiaries. The historical consolidated financial information is derived from the audited consolidated financial statements for the company and its subsidiaries at and for the years ended December 31, 2010, 2009 and 2008 and the unaudited condensed consolidated financial statements for the company and its subsidiaries at and for the three months ended March 31, 2011 and 2010. The balance sheet data has also been adjusted to reflect (i) the $20.0 million of additional borrowings under our revolving credit agreement and our borrowings of $25.0 million under the term loan which occurred during the second quarter of 2011, (ii) the $30.5 million spent since March 31, 2011 to acquire leasehold interests in the Eagle Ford shale play from Orca ICI Development, JV ($1.0 million of the total cost of this acquisition was paid in March 2011) and (iii) the estimated net proceeds from this offering. The audited consolidated financial statements for the company and its subsidiaries at and for the years ended December 31, 2010, 2009 and 2008 and the unaudited condensed consolidated financial statements for the company and its subsidiaries at and for the three months ended March 31, 2011 and 2010 are contained elsewhere in this prospectus. Our consolidated financial statements for the years ended December 31, 2010, 2009 and 2008 were audited by Grant Thornton LLP.
| Year Ended December 31, | Three Months
Ended March 31, |
|||||||||||||||||||
| 2010 | 2009 | 2008 | 2011 | 2010 | ||||||||||||||||
| (Unaudited) | (Unaudited) | |||||||||||||||||||
| (In thousands, except per share data) | ||||||||||||||||||||
| Statement of operations data: |
||||||||||||||||||||
| Revenues: |
||||||||||||||||||||
| Oil and natural gas revenues |
$ | 34,042 | $ | 19,039 | $ | 30,645 | $ | 13,699 | $ | 9,190 | ||||||||||
| Realized gain (loss) on derivatives |
5,299 | 7,625 | (1,326 | ) | 1,850 | 302 | ||||||||||||||
| Unrealized gain (loss) on derivatives |
3,139 | (2,375 | ) | 3,592 | (1,668 | ) | 6,093 | |||||||||||||
|
|
|
|
|
|
|
|
|
|
|
|||||||||||
| Total revenues |
42,480 | 24,289 | 32,911 | 13,880 | 15,585 | |||||||||||||||
| Expenses: |
||||||||||||||||||||
| Production taxes and marketing |
1,982 | 1,077 | 1,639 | 1,300 | 267 | |||||||||||||||
| Lease operating |
5,284 | 4,725 | 4,667 | 1,605 | 1,332 | |||||||||||||||
| Depletion, depreciation and amortization |
15,596 | 10,743 | 12,127 | 7,111 | 3,362 | |||||||||||||||
| Accretion of asset retirement obligations |
155 | 137 | 92 | 39 | 38 | |||||||||||||||
| Full-cost ceiling impairment |
– | 25,244 | 22,195 | 35,673 | – | |||||||||||||||
| General and administrative |
9,702 | 7,115 | 8,252 | 2,619 | 2,032 | |||||||||||||||
|
|
|
|
|
|
|
|
|
|
|
|||||||||||
| Total expenses |
32,719 | 49,041 | 48,972 | 48,347 | 7,031 | |||||||||||||||
| Operating income (loss) |
9,761 | (24,752 | ) | (16,061 | ) | (34,467 | ) | 8,554 | ||||||||||||
| Other: |
||||||||||||||||||||
| Other (expense) income |
137 | 402 | 139,962 | (1) | (35 | ) | 96 | |||||||||||||
|
|
|
|
|
|
|
|
|
|
|
|||||||||||
| Income (loss) before income taxes |
9,898 | (24,350 | ) | 123,901 | (34,502 | ) | 8,650 | |||||||||||||
| Net income (loss) |
$ | 6,377 | $ | (14,425 | ) | $ | 103,878 | $ | (27,596 | ) | $ | 5,676 | ||||||||
14
Table of Contents
Index to Financial Statements
| Year Ended December 31, | Three Months
Ended March 31, |
|||||||||||||||||||
| 2010 | 2009 | 2008 | 2011 | 2010 | ||||||||||||||||
| (Unaudited) | (Unaudited) | |||||||||||||||||||
| (In thousands, except per share data) | ||||||||||||||||||||
| Earnings (loss) per share (basic) (2) |
||||||||||||||||||||
| Class A |
$ | 0.15 | $ | (0.37 | ) | $ | 2.50 | $ | (0.65 | ) | $ | 0.14 | ||||||||
| Class B(2) |
$ | 0.42 | $ | (0.10 | ) | $ | 2.77 | $ | (0.58 | ) | $ | 0.21 | ||||||||
| Weighted average common shares outstanding (basic) |
41,037 | 40,123 | 41,385 | 42,655 | 41,414 | |||||||||||||||
| Class A |
40,007 | 39,093 | 40,355 | 41,625 | 40,384 | |||||||||||||||
| Class B(2) |
1,031 | 1,031 | 1,031 | 1,031 | 1,031 | |||||||||||||||
| (1) | Increase in other income was primarily due to gain on unproved and unevaluated property dispositions in 2008. |
| (2) | At July 31, 2011, we had 1,030,700 shares of Class B common stock issued and outstanding. All shares of Class B common stock will automatically convert on a one-for-one basis into shares of Class A common stock upon the consummation of this offering pursuant to the terms of our certificate of formation. If the Class B common stock were converted at the applicable date, the earnings per share would not be materially different than the Class A earnings per share. |
| At December 31, | At March 31, | |||||||||||||||||||||||||||
| 2010 | 2009 | 2008 | 2011 | 2010 | ||||||||||||||||||||||||
| Actual | As Adjusted(1) |
As Further Adjusted(2) |
||||||||||||||||||||||||||
| (In thousands) | (Unaudited) | (Unaudited) | (Unaudited) | (Unaudited) | ||||||||||||||||||||||||
| Balance sheet data: |
||||||||||||||||||||||||||||
| Cash and cash equivalents |
$ | 21,060 | $ | 104,230 | $ | 150,768 | $ | 14,461 | $ | 28,961 | $ | 130,961 | $ | 91,619 | ||||||||||||||
| Certificates of deposit |
2,349 | 15,675 | 20,782 | 2,079 | 2,079 | 2,079 | 14,674 | |||||||||||||||||||||
| Net property and equipment |
303,880 | 142,078 | 125,261 | 301,098 | 331,598 | 331,598 | 160,057 | |||||||||||||||||||||
| Total assets |
346,382 | 277,400 | 314,539 | 336,197 | 381,197 | 483,197 | 285,788 | |||||||||||||||||||||
| Current liabilities |
30,097 | 8,868 | 35,475 | 37,444 | 62,444 | 37,444 | 9,964 | |||||||||||||||||||||
| Long term liabilities |
34,408 | 4,210 | 2,059 | 43,943 | 63,943 | 53,943 | 5,610 | |||||||||||||||||||||
| Total shareholders’ equity |
$ | 281,877 | $ | 264,321 | $ | 277,005 | $ | 254,809 | $ | 254,809 | $ | 391,809 | $ | 270,214 | ||||||||||||||
| (1) | As adjusted for (i) the $20.0 million of additional borrowings under our revolving credit agreement and our borrowings of $25.0 million under the term loan which occurred during the second quarter of 2011, and (ii) the $30.5 million spent since March 31, 2011 to acquire leasehold interests in the Eagle Ford shale play from Orca ICI Development, JV. $1.0 million of the total cost of this acquisition was paid in March 2011. |
| (2) | As further adjusted to give effect to this offering (assuming aggregate gross proceeds of $150.0 million) and the application of the estimated net proceeds to repay our $25.0 million term loan in full and repay approximately $10.0 million under our revolving credit agreement, with the balance being added to cash and cash equivalents to fund a portion of our 2011 and a portion of our anticipated 2012 capital expenditure budgets and for other general corporate purposes. |
| Year Ended December 31, | Three Months
Ended March 31, |
|||||||||||||||||||
| 2010 | 2009 | 2008 | 2011 | 2010 | ||||||||||||||||
| (In thousands) | (Unaudited) | (Unaudited) | ||||||||||||||||||
| Other financial data: |
||||||||||||||||||||
| Net cash provided by operating activities |
$ | 27,273 | $ | 1,791 | $ | 25,851 | $ | 12,732 | $ | 9,101 | ||||||||||
| Net cash (used in) provided by investing activities |
(147,334 | ) | (49,415 | ) | 115,481 | (35,024 | ) | (21,743 | ) | |||||||||||
| Oil and natural gas properties capital expenditures |
(159,050 | ) | (54,244 | ) | (104,119 | ) | (34,114 | ) | (22,208 | ) | ||||||||||
| Expenditures for other property and equipment |
(1,610 | ) | (307 | ) | (3,012 | ) | (1,180 | ) | (536 | ) | ||||||||||
| Net cash provided by financing activities |
36,891 | 1,086 | 419 | 15,693 | 31 | |||||||||||||||
| Adjusted EBITDA(1) |
$ | 23,635 | $ | 15,184 | $ | 18,411 | $ | 10,148 | $ | 6,142 | ||||||||||
| (1) | Adjusted EBITDA is a non-GAAP financial measure. For a definition of Adjusted EBITDA and a reconciliation of Adjusted EBITDA to our net income and net cash provided by operating activities, see “— Non-GAAP Financial Measures” below. |
15
Table of Contents
Index to Financial Statements
Non-GAAP Financial Measures
We define Adjusted EBITDA as earnings before interest expense, income taxes, depletion, depreciation and amortization, property impairments, unrealized derivative gains and losses, non-recurring income and expenses and non-cash stock-based compensation expense, including stock option and grant expense and restricted stock grants. Adjusted EBITDA is not a measure of net income or cash flows as determined by GAAP. Adjusted EBITDA is a supplemental non-GAAP financial measure that is used by management and external users of our consolidated financial statements, such as industry analysts, investors, lenders and rating agencies. “GAAP” means Generally Accepted Accounting Principles.
Management believes Adjusted EBITDA is necessary because it allows us to evaluate our operating performance and compare the results of operations from period to period without regard to our financing methods or capital structure. We exclude the items listed above from net income (loss) in calculating Adjusted EBITDA because these amounts can vary substantially from company to company within our industry depending upon accounting methods and book values of assets, capital structures and the method by which the assets were acquired.
16
Table of Contents
Index to Financial Statements
Adjusted EBITDA should not be considered an alternative to, or more meaningful than, net income or cash flows from operating activities as determined in accordance with GAAP or as an indicator of our operating performance or liquidity. Certain items excluded from Adjusted EBITDA are significant components of understanding and assessing a company’s financial performance, such as a company’s cost of capital and tax structure. Our Adjusted EBITDA may not be comparable to similarly titled measures of another company because all companies may not calculate Adjusted EBITDA in the same manner. The following table presents our calculation of Adjusted EBITDA and reconciliation of Adjusted EBITDA to the GAAP financial measures of net income (loss) and net cash provided by operating activities, respectively.
| Year Ended December 31, | Three
Months Ended March 31, |
|||||||||||||||||||
| 2010 | 2009 | 2008 | 2011 | 2010 | ||||||||||||||||
| (In thousands) | ||||||||||||||||||||
| Unaudited Adjusted EBITDA reconciliation to Net Income (Loss): |
||||||||||||||||||||
| Net income (loss) |
$ | 6,377 | $ | (14,425 | ) | $ | 103,878 | $ | (27,596 | ) | $ | 5,676 | ||||||||
| Interest expense |
3 | – | – | 106 | – | |||||||||||||||
| Total income tax provision (benefit) |
3,521 | (9,925 | ) | 20,023 | (6,906 | ) | 2,975 | |||||||||||||
| Depletion, depreciation and amortization |
15,596 | 10,743 | 12,127 | 7,111 | 3,362 | |||||||||||||||
| Accretion of asset retirement obligations |
155 | 137 | 92 | 39 | 38 | |||||||||||||||
| Full-cost ceiling impairment |
– | 25,244 | 22,195 | 35,673 | – | |||||||||||||||
| Unrealized (gain) loss on derivatives |
(3,139 | ) | 2,375 | (3,592 | ) | 1,668 | (6,093 | ) | ||||||||||||
| Stock option and grant expense |
824 | 622 | 605 | 42 | 180 | |||||||||||||||
| Restricted stock grants |
74 | 34 | 60 | 11 | 6 | |||||||||||||||
| Net (gain)/loss on asset sales and inventory impairment |
224 | 379 | (136,977 | ) | – | – | ||||||||||||||
|
|
|
|
|
|
|
|
|
|
|
|||||||||||
| Adjusted EBITDA |
$ | 23,635 | $ | 15,184 | $ | 18,411 | $ | 10,148 | $ | 6,142 | ||||||||||
|
|
|
|
|
|
|
|
|
|
|
|||||||||||
| Year Ended December 31, | Three
Months Ended March 31, |
|||||||||||||||||||
| 2010 | 2009 | 2008 | 2011 | 2010 | ||||||||||||||||
| (In thousands) | ||||||||||||||||||||
| Unaudited Adjusted EBITDA reconciliation to Net Cash Provided by Operating Activities: |
||||||||||||||||||||
| Net cash provided by operating activities |
$ | 27,273 | $ | 1,791 | $ | 25,851 | $ | 12,732 | $ | 9,101 | ||||||||||
| Net change in operating assets and liabilities |
(2,230 | ) | 15,717 | (17,888 | ) | (2,690 | ) | (2,959 | ) | |||||||||||
| Interest expense |
3 | – | – | 106 | – | |||||||||||||||
| Current income tax (benefit) provision |
(1,411 | ) | (2,324 | ) | 10,448 | – | – | |||||||||||||
|
|
|
|
|
|
|
|
|
|
|
|||||||||||
| Adjusted EBITDA |
$ | 23,635 | $ | 15,184 | $ | 18,411 | $ | 10,148 | $ | 6,142 | ||||||||||
|
|
|
|
|
|
|
|
|
|
|
|||||||||||
17
Table of Contents
Index to Financial Statements
Reserves Data
The following table presents summary data with respect to our estimated net proved oil and natural gas reserves at the dates indicated. The reserves estimates at December 31, 2008 presented in the table below are based on evaluations prepared by our engineering staff, which have been audited by LaRoche Petroleum Consultants, Ltd., independent reservoir engineers. The reserves estimates at December 31, 2010 and 2009 and at March 31, 2011 are based on evaluations prepared by our engineering staff, which have been audited by Netherland, Sewell & Associates, Inc., independent reservoir engineers. These reserves estimates were prepared in accordance with the Securities and Exchange Commission’s rules regarding oil and natural gas reserves reporting that were in effect at the time of the preparation of the reserves report. Our total estimated proved reserves are estimated using a conversion ratio of one Bbl per six Mcf.
| At December 31, | At March 31, | |||||||||||||||
| 2010 | 2009 | 2008 | 2011 | |||||||||||||
| Estimated proved reserves:(1) (2) |
||||||||||||||||
| Natural gas (Bcf) |
127.4 | 63.9 | 19.2 | 150.1 | ||||||||||||
| Oil (MBbls) |
152 | 103 | 131 | 780 | ||||||||||||
| Total (Bcfe) |
128.3 | 64.5 | 20.0 | 154.8 | ||||||||||||
| Developed proved reserves (Bcfe) |
44.1 | 26.0 | 20.0 | 56.1 | ||||||||||||
| Percent developed |
34.3 | % | 40.3 | % | 100.0 | % | 36.2 | % | ||||||||
| Undeveloped proved reserves (Bcfe) |
84.3 | 38.6 | – | 98.7 | ||||||||||||
| PV-10 (in thousands)(3) |
$ | 119,869 | $ | 70,359 | $ | 44,069 | $ | 140,639 | ||||||||
| Standardized Measure (in thousands)(4) |
$ | 111,077 | $ | 65,061 | $ | 43,254 | $ | 131,521 | ||||||||
| (1) | Numbers in table may not total due to rounding. |
| (2) | Our estimated proved reserves, PV-10 and Standardized Measure were determined using index prices for oil and natural gas, without giving effect to derivative transactions, and were held constant throughout the life of the properties. The index prices were $41.00 per Bbl for oil and $5.710 per MMBtu for natural gas at December 31, 2008. The unweighted arithmetic averages of the first-day-of-the-month prices for the 12 months ended December 31, 2009 were $57.65 per Bbl for oil and $3.866 per MMBtu for natural gas, for the 12 months ended December 31, 2010 were $75.96 per Bbl for oil and $4.376 per MMBtu for natural gas, and for the 12-month period from April 2010 to March 2011 were $80.04 per Bbl for oil and $4.102 per MMBtu for natural gas. These prices were adjusted by lease for quality, energy content, regional price differentials, transportation fees, marketing deductions and other factors affecting the price received at the wellhead. |
| (3) | PV-10 is a non-GAAP financial measure and generally differs from Standardized Measure, the most directly comparable GAAP financial measure, because it does not include the effects of income taxes on future net revenues. PV-10 is not an estimate of the fair market value of our properties. We and others in the industry use PV-10 as a measure to compare the relative size and value of proved reserves held by companies and of the potential return on investment related to the companies’ properties without regard to the specific tax characteristics of such entities. Our PV-10 at December 31, 2008, 2009 and 2010 and at March 31, 2011 may be reconciled to our Standardized Measure of discounted future net cash flows at such dates by reducing our PV-10 by the discounted future income taxes associated with such reserves. The discounted future income taxes, in thousands, at December 31, 2008, 2009 and 2010 and at March 31, 2011 were $815, $5,298, $8,792 and $9,118, respectively. |
| (4) | Standardized Measure represents the present value of estimated future net cash flows from proved reserves, less estimated future development, production, plugging and abandonment costs and income tax expenses, discounted at 10% per annum to reflect the timing of future cash flows. Standardized Measure is not an estimate of the fair market value of our properties. |
18
Table of Contents
Index to Financial Statements
Unaudited Operating Data
The following table sets forth summary unaudited production results for the company and its subsidiaries for the years ended December 31, 2010, 2009 and 2008 and for the three month periods ended March 31, 2011 and 2010.
| Year Ended December 31, | Three Months Ended March 31, |
|||||||||||||||||||
| 2010 | 2009 | 2008 | 2011 | 2010 | ||||||||||||||||
| Production: |
||||||||||||||||||||
| Natural gas (Bcf) |
8.4 | 4.8 | 3.1 | 3.3 | 1.8 | |||||||||||||||
| Oil (MBbls) |
33 | 30 | 37 | 19 | 8 | |||||||||||||||
| Total natural gas equivalents (Bcfe)(1) |
8.6 | 5.0 | 3.3 | 3.4 | 1.8 | |||||||||||||||
| Average net daily production (MMcfe) |
23.6 | 13.7 | 9.0 | 37.8 | 20.5 | |||||||||||||||
| Average sales price (per Mcfe): |
||||||||||||||||||||
| Average sales price (including effects of hedging) |
$ | 4.58 | $ | 5.33 | $ | 8.86 | $ | 4.57 | $ | 5.14 | ||||||||||
| Average sales price (before effects of hedging) |
$ | 3.96 | $ | 3.81 | $ | 9.27 | $ | 4.03 | $ | 4.98 | ||||||||||
| Operating expenses (per Mcfe): |
||||||||||||||||||||
| Production taxes and marketing |
$ | 0.23 | $ | 0.22 | $ | 0.50 | $ | 0.38 | $ | 0.14 | ||||||||||
| Lease operating |
$ | 0.61 | $ | 0.94 | $ | 1.41 | $ | 0.47 | $ | 0.72 | ||||||||||
| Depletion, depreciation and amortization |
$ | 1.81 | $ | 2.15 | $ | 3.67 | $ | 2.09 | $ | 1.82 | ||||||||||
| General and administrative |
$ | 1.13 | $ | 1.42 | $ | 2.50 | $ | 0.77 | $ | 1.10 | ||||||||||
| (1) | Estimated using a conversion ratio of one Bbl per six Mcf. |
19
Table of Contents
Index to Financial Statements
You should carefully consider the risks described below before making an investment decision. Our business, financial condition or results of operations could be materially adversely affected by any of these risks. The trading price of our common stock could decline due to any of these risks, and you may lose all or part of your investment.
Risks Related to the Oil and Natural Gas Industry and Our Business
Our Success Is Dependent on the Prices of Oil and Natural Gas. The Substantial Volatility in These Prices May Adversely Affect Our Financial Condition and Our Ability to Meet Our Capital Expenditure Requirements and Financial Obligations.
The prices we receive for our oil and natural gas heavily influences our revenue, profitability, access to capital and future rate of growth. Oil and natural gas are commodities and, therefore, their prices are subject to wide fluctuations in response to relatively minor changes in supply and demand. Historically, the markets for oil and natural gas have been volatile. These markets will likely continue to be volatile in the future. The prices we receive for our production, and the levels of our production, depend on numerous factors. These factors include the following:
| • | the domestic and foreign supply of oil and natural gas; |
| • | the domestic and foreign demand for oil and natural gas; |
| • | the prices and availability of competitors’ supplies of oil and natural gas; |
| • | the actions of the Organization of Petroleum Exporting Countries, or OPEC, and state-controlled oil companies relating to oil price and production controls; |
| • | the price and quantity of foreign imports; |
| • | the impact of U.S. dollar exchange rates on oil and natural gas prices; |
| • | domestic and foreign governmental regulations and taxes; |
| • | speculative trading of oil and natural gas futures contracts; |
| • | the availability, proximity and capacity of gathering and transportation systems for natural gas; |
| • | the availability of refining capacity; |
| • | the prices and availability of alternative fuel sources; |
| • | weather conditions and natural disasters; |
| • | political conditions in or affecting oil and natural gas producing regions, including the Middle East and South America; |
| • | the continued threat of terrorism and the impact of military action and civil unrest; |
| • | public pressure on, and legislative and regulatory interest within, federal, state and local governments to stop, significantly limit or regulate hydraulic fracturing activities; |
| • | the level of global oil and natural gas inventories and exploration and production activity; |
| • | the impact of energy conservation efforts; |
| • | technological advances affecting energy consumption; and |
| • | overall worldwide economic conditions. |
20
Table of Contents
Index to Financial Statements
Prices for oil and natural gas will affect the amount of cash flow available to us for capital expenditures and our ability to borrow and raise additional capital. Our ability to initiate, maintain or increase our borrowing capacity and to obtain additional capital on attractive terms is also substantially dependent upon oil and natural gas prices. Declines in oil and natural gas prices would not only reduce our revenue, but could reduce the amount of oil and natural gas that we can produce economically and, as a result, could have a material adverse effect on our financial condition, results of operations and reserves. In addition, because we expect to produce more natural gas than oil in the immediate future, we will face more risk associated with fluctuations in the price of natural gas than oil. Since one of our current business strategies is to focus on increasing our oil and liquids production, we will face increased risk in the future associated with fluctuations in the price of oil.
Low Natural Gas Prices in the Future Could Adversely Impact Us as Our Current Production and Reserves Consist Primarily of Natural Gas and Many of Our Exploration Prospects and Development Opportunities Focus on Natural Gas.
Approximately 98% of our production during the year ended December 31, 2010, 95% of our production during the five month period ended May 31, 2011 and 97% of our proved reserves at March 31, 2011 are attributable to natural gas. In addition, three of our largest prospects, our Haynesville shale and Cotton Valley properties and our Meade Peak shale, currently produce or are expected to produce predominantly natural gas. As a result they are sensitive to fluctuations in natural gas prices. Natural gas prices historically have been volatile and are likely to continue to be volatile in the future, especially given current geopolitical conditions. Should natural gas prices remain at current levels for an extended period of time, our future natural gas revenues, as well as the economic viability of our natural gas prospect inventory, will be adversely impacted. We may also elect to delay some of our exploration and development plans for these prospects until natural gas prices improve. If there are further declines in natural gas prices, we may be unable to develop these properties further or to conduct exploration activities on these prospects at all.
Low Oil Prices in the Future Could Adversely Impact Us as Most of Our Near-term Exploration Opportunities in the Eagle Ford Shale Play Focus on Oil and Liquids.
We currently intend to dedicate 63% of our 2011 and 74% of our 2012 capital expenditure budgets to the exploration of the Eagle Ford shale. We believe that almost 85% of our Eagle Ford acreage is prospective predominantly for oil and liquids production, and we have identified 192 gross locations for potential future drilling in our Eagle Ford acreage. Since a significant portion of our near-term exploration strategy focuses on oil and liquids in the Eagle Ford shale play, low oil prices in the future would adversely impact our results of operations, financial condition and cash flows. Oil prices historically have been volatile and are likely to continue to be volatile in the future, especially given current geopolitical conditions. Should oil prices decrease from current levels and remain there for an extended period of time, our future oil revenues, as well as the economic viability of our oil prospect inventory, would be adversely impacted. In that case we might also elect to delay some of our exploration and development plans for these prospects until oil prices improve. If there were further declines in oil prices, we might be unable to develop these properties further or to conduct exploration activities on these prospects at all.
Drilling for and Producing Oil and Natural Gas Are High-Risk Activities with Many Uncertainties That Could Adversely Affect Our Business, Financial Condition, Results of Operations and Cash Flows.
Drilling activities involve the risk that no commercially productive oil or natural gas reservoirs will be found or produced. We may drill or participate in new wells that are not productive. We may drill wells that
21
Table of Contents
Index to Financial Statements
are productive, but that do not produce sufficient net revenues to return a profit after drilling, operating and other costs. Whether a well is productive and profitable depends on a number of factors, including the following:
| • | general economic and industry conditions, including the prices received for oil and natural gas; |
| • | shortages of, or delays in, obtaining equipment, including hydraulic fracturing equipment, and qualified personnel; |
| • | mechanical problems encountered in drilling wells or in production activities; |
| • | loss of or damage to oilfield development and service tools; |
| • | problems with title to the underlying properties; |
| • | increases in severance taxes; |
| • | adverse weather conditions that delay drilling activities or cause producing wells to be shut down; |
| • | domestic and foreign governmental regulations; |
| • | localized supply and demand fundamentals; |
| • | proximity to and capacity of transportation facilities; |
| • | price and availability of competitors’ supplies of oil and natural gas; |
| • | technological advances affecting energy consumption; and |
| • | the price and availability of alternative fuels. |
If we do not drill productive and profitable wells in the future, our financial condition and results of operations will be materially and adversely affected.
In addition to the substantial risk that we may not drill productive and profitable wells, numerous hazards are inherent in oil and natural gas exploration, development, production and gathering, including:
| • | unusual or unexpected geologic formations; |
| • | natural disasters; |
| • | unanticipated pressures; |
| • | mechanical failures; |
| • | loss of drilling fluid circulation; |
| • | blowouts where oil or natural gas flows uncontrolled at a wellhead; |
| • | cratering or collapse of the formation; |
| • | pipe or cement failures or casing collapses; |
| • | fires or explosions; |
| • | releases of hazardous substances or other waste materials that cause environmental damage; and |
| • | environmental accidents such as uncontrollable flows of oil, natural gas or well fluids into the environment, including groundwater contamination. |
22
Table of Contents
Index to Financial Statements
We could suffer substantial losses from these hazards due to injury and loss of life, severe damage to and destruction of property and equipment, pollution and other environmental damage and suspension of operations. We do not fully insure against all risks associated with our business, either because this insurance is not available or because we believe the cost is prohibitive. The occurrence of an event that is not covered, or not fully covered, by insurance could decrease cash flow and net revenues and negatively affect our financial condition if we incur cleanup costs or must settle claims related to these hazards.
Because Our Reserves and Production Are Concentrated in a Small Number of Properties, Production Problems and Markets Related to Any Property Could Have a Material Impact on Our Business.
Almost all of our current oil and natural gas production and our proved reserves are attributable to producing properties in north Louisiana and east Texas, and we expect that most of our operations in the near future will be primarily in south Texas. As a result, we may be disproportionately exposed to the impact of delays or interruptions of production from these wells caused by transportation capacity constraints, curtailment of production, availability of equipment, facilities, personnel or services, significant governmental regulation, natural disasters, adverse weather conditions, plant closures for scheduled maintenance or interruption of transportation of oil or natural gas produced from the wells in these areas. Due to the concentrated nature of our portfolio of properties, a number of our properties could experience any of the same conditions at the same time, resulting in a relatively greater impact on our results of operations than they might have on other companies that have a more diversified portfolio of properties. Such delays or interruptions could have a material adverse effect on our financial condition, results of operations and cash flows. If future production declines in wells in these areas are greater than we have estimated, the results of our operations and financial condition will be adversely affected. If the actual reserves associated with our fields are less than our estimated reserves, our results of operations and financial condition will be adversely affected.
Unless We Replace Our Oil and Natural Gas Reserves, Our Reserves and Production Will Decline, Which Would Adversely Affect Our Business, Financial Condition, Results of Operations and Cash Flows.
The rate of production from oil and natural gas properties declines as reserves are depleted. We must continue to grow our reserves and cash flow by successfully drilling for oil and natural gas production on properties owned by us or by other persons or entities and/or by the acquisition of producing properties. We may have to drill even during periods of low oil and natural gas prices when it is difficult to raise the capital necessary to finance activities. Our future oil and natural gas reserves and production and, therefore, our cash flow and income, are highly dependent on our success in efficiently developing and exploiting our current reserves and economically finding or acquiring additional reserves. We may not be successful in drilling for oil and natural gas production. In the future, we may have difficulty expanding our current production through acquisitions and/or by additional drilling for oil and natural gas production. If we are unable to replace our current and future production, our reserves will decrease, and our business, financial condition, results of operations and cash flows would be adversely affected.
Our Oil and Natural Gas Reserves Are Estimated and May Not Reflect Our Actual Reserves, and Significant Inaccuracies in These Reserves Estimates or Underlying Assumptions Will Materially Affect the Quantities and Present Value of Our Reserves.
The process of estimating accumulations of oil and natural gas is complex and is not exact, due to numerous inherent uncertainties. The process relies on interpretations of available geological, geophysical, engineering and production data. The extent, quality and reliability of this technical data can vary. The
23
Table of Contents
Index to Financial Statements
process also requires certain economic assumptions, such as oil and natural gas prices, drilling and operating expenses, capital expenditures, taxes and availability of funds. The accuracy of a reserves estimate is a function of:
| • | the quality and quantity of available data; |
| • | the interpretation of that data; |
| • | the judgment of the persons preparing the estimate; and |
| • | the accuracy of the assumptions. |
The accuracy of any estimates of proved reserves generally increases with the length of the production history. Due to the limited production history of many of our properties, the estimates of future production associated with these properties may be subject to greater variance to actual production than would be the case with properties having a longer production history. As our wells produce over time and more data is available, the estimated proved reserves will be redetermined on at least an annual basis and may be adjusted based on that data.
Actual future production, oil and natural gas prices, revenues, taxes, development expenditures, operating expenses and quantities of recoverable oil and natural gas most likely will vary from our estimates. Any significant variance could materially affect the quantities and present value of our reserves. In addition, we may adjust estimates of proved reserves to reflect production history, results of exploration and development, prevailing oil and natural gas prices and other factors. Our reserves may also be susceptible to drainage by operators on adjacent properties.
The Calculated Present Value of Future Net Revenues from Our Proven Reserves Will Not Necessarily Be the Same as the Current Market Value of Our Estimated Oil and Natural Gas Reserves.
It should not be assumed that the present value of future net cash flows included in this prospectus is the current market value of our estimated proved oil and natural gas reserves. We generally base the estimated discounted future net cash flows from proved reserves on current costs held constant over time without escalation and on commodity prices using an unweighted arithmetic average of first-day-of-the-month index prices, appropriately adjusted, for the 12-month period immediately preceding the date of the estimate. Actual future prices and costs may be materially higher or lower than the prices and costs used for these estimates and will be affected by factors such as:
| • | actual prices we receive for oil and natural gas; |
| • | actual cost and timing of development and production expenditures; |
| • | the amount and timing of actual production; and |
| • | changes in governmental regulations or taxation. |
In addition, the 10% discount factor that is required to be used to calculate discounted future net revenues for reporting purposes under GAAP is not necessarily the most appropriate discount factor based on the cost of capital in effect from time to time and risks associated with our business and the oil and natural gas industry in general.
The timing of both our production and our incurrence of expenses in connection with the development and production of oil and natural gas properties will affect the timing and amount of actual future net revenues from proved reserves, and thus their actual present value.
24
Table of Contents
Index to Financial Statements
Approximately 65% of Our Total Proved Reserves at March 31, 2011 Consisted of Undeveloped and Developed Non-Producing Reserves, and Those Reserves May Not Ultimately Be Developed or Produced.
At March 31, 2011, approximately 64% of our total proved reserves were undeveloped and approximately 1% were developed non-producing. While we plan to develop and produce all of our proved reserves, these reserves may not ultimately be developed or produced. Furthermore, not all of our undeveloped or developed non-producing reserves may be ultimately produced at the time periods we have projected, at the costs we have budgeted or at all. Delays in the development of our reserves or increases in costs to drill and develop such reserves will reduce the present value of our estimated proved undeveloped reserves and future net revenues estimated for such reserves and may result in some projects becoming uneconomic. In addition, delays in the development of reserves or declines in oil and/or natural gas prices in the future could cause us to have to reclassify our proved reserves as unproved reserves.
Our Exploration, Development and Exploitation Projects Require Substantial Capital Expenditures, and We May Be Unable to Obtain Needed Capital on Satisfactory Terms, Which Could Adversely Affect Our Future Growth.
Our exploration and development activities are capital intensive. We make and expect to continue to make substantial capital expenditures in our business for the development, exploitation, production and acquisition of oil and natural gas reserves. Future events, such as terrorist attacks, a war or combat peace-keeping mission, a financial market disruption, a general economic recession, an oil and natural gas industry recession or large company bankruptcies, could adversely affect the availability and cost of capital for our business. Accounting scandals, public company bankruptcies, overstated reserves estimates by major public oil companies and disruptions in the financial and capital markets have caused financial institutions, credit rating agencies and the public to more closely review the financial statements, capital structures and earnings of public companies, including energy companies. Such events have constrained the capital available to the energy industry in the past, and such events or similar events could adversely affect our access to funding for our operations in the future. The rate of our future growth is dependent, at least in part, on our ability to access capital at rates and on terms we determine to be attractive. If our ability to access capital on attractive terms becomes significantly constrained, our financial condition and future results of operations could be adversely affected.
If our revenues decrease as a result of lower product prices, operating difficulties, declines in reserves or for any other reason, we may have limited ability to obtain the capital necessary to sustain our operations at current levels or to further develop and exploit our current properties, or for exploration activities. In order to fund our capital expenditures, we may need to seek additional financing. Our current revolving credit agreement contains covenants restricting our ability to incur additional indebtedness. In addition, if our borrowing base is redetermined resulting in a lower borrowing base under our revolving credit agreement, we may be unable to obtain financing that is currently available under our revolving credit agreement.
A significant improvement in product prices could result in an increase in our capital expenditures. While we believe the net proceeds from this offering, together with our cash flows and future potential borrowings under our revolving credit agreement, will be adequate to fund our anticipated capital expenditures and any acquisitions for the remainder of 2011 and all of 2012, funding for future acquisitions or our future capital expenditure requirements may require us to alter or increase our capitalization substantially through the issuance of debt or additional equity securities, the sale of production payments or the sale of non-strategic assets. The issuance or incurrence of debt may require that a portion of our cash
25
Table of Contents
Index to Financial Statements
flows provided by operating activities be used for the payment of principal and interest on our debt, thereby reducing our ability to use cash flows to fund working capital, capital expenditures and acquisitions. The issuance of additional equity securities could have a dilutive effect on the value of our common stock.
Our cash flows from operations and access to capital are subject to a number of variables, including:
| • | our estimated proved oil and natural gas reserves; |
| • | the amount of oil and natural gas we produce from existing wells; |
| • | the prices at which we sell our production; |
| • | the costs of developing and producing our oil and natural gas production; |
| • | our ability to acquire, locate and produce new reserves; |
| • | the ability and willingness of banks to lend to us; and |
| • | our ability to access the equity and debt capital markets. |
Drilling Wells Is Speculative, Often Involving Significant Costs that May Be More than Our Estimates, and May Not Result in any Discoveries or Additions to Our Future Production or Reserves. Any Material Inaccuracies in Drilling Costs, Estimates or Underlying Assumptions Will Materially Affect Our Business.
Exploring for and developing hydrocarbon reserves involves a high degree of operational and financial risk, which precludes definitive statements as to the time required and costs involved in reaching certain objectives. The budgeted costs of planning, drilling, completing and operating wells are often exceeded and can increase significantly when drilling costs rise due to a tightening in the supply of various types of oilfield equipment and related services or unanticipated geologic conditions. Before a well is spud, we may incur significant geological and geophysical (seismic) costs, which are incurred whether a well eventually produces commercial quantities of hydrocarbons, or is drilled at all. Exploratory wells bear a much greater risk of loss than development wells. Furthermore, if our actual drilling and development costs are significantly more than our estimated costs, we may not be able to continue our operations as proposed and could be forced to modify our drilling plans accordingly.
Exploration Is a High-Risk Activity, and the 2-D and 3-D Seismic Data and Other Advanced Technologies We Use Cannot Eliminate Exploration Risk, Which Could Limit Our Ability to Replace and Grow Our Reserves and Materially and Adversely Affect Our Future Cash Flows and Results of Operations.
Our future success will depend in large part on the success of our exploratory drilling program. Exploration activities involve numerous risks, including the risk that no commercially productive oil or natural gas reservoirs will be discovered. In addition, we often are uncertain as to the future costs or timing of drilling, completing and producing wells. Furthermore, our drilling operations may be curtailed, delayed or canceled as a result of the additional exploration time and expense associated with a variety of factors, including:
| • | unexpected adverse drilling conditions; |
| • | pressures or irregularities in formations; |
| • | equipment failures or accidents; |
| • | mechanical difficulties; |
| • | adverse weather conditions; |
26
Table of Contents
Index to Financial Statements
| • | limitations in the market for oil and natural gas; |
| • | title problems; |
| • | compliance with governmental requirements; and |
| • | shortages or delays in the availability of drilling rigs and other oilfield services and equipment, including hydraulic fracturing equipment, as well as shortages of qualified personnel to provide these services. |
We intend to employ visualization and 2-D and 3-D seismic images to assist us in exploration and development activities where applicable. These techniques only assist geoscientists in identifying subsurface structures and hydrocarbon indicators and do not allow the interpreter to know conclusively if hydrocarbons are present or economically producible. We could incur losses by drilling unproductive wells based on these activities. Poor results from our exploration activities could limit our ability to replace and grow reserves and materially and adversely affect our future cash flows and results of operations.
We Currently Own Only a Limited Amount of Seismic and Other Geological Data and May Have Difficulty Obtaining Additional Data at a Reasonable Cost, Which Could Adversely Affect Our Future Cash Flows and Results of Operations.
We currently own only a limited amount of seismic and other geological data to assist us in exploration and development activities. We intend to obtain access to additional data in our areas of interest through licensing arrangements with companies that own or have access to that data or by paying to obtain that data directly. Seismic and geological data can be expensive to license or obtain. We may not be able to license or obtain such data at an acceptable cost.
The Mechanical Risks of Drilling and Completion Activities as well as the Unavailability or High Cost of Drilling Rigs, Completion Equipment and Services, Supplies and Personnel, Including Hydraulic Fracturing Equipment and Personnel, Could Adversely Affect Our Ability to Establish and Execute Exploration and Development Plans within Budget and on a Timely Basis, Which Could Have a Material Adverse Effect on Our Financial Condition, Results of Operations and Cash Flows.
The mechanical risks of drilling and completion activities could adversely affect our ability to execute exploration and development plans within budget and on a timely basis. Shortages or the high cost of drilling rigs, completion equipment and services, supplies or personnel could delay or adversely affect our operations. When drilling activity in the United States increases, associated costs typically also increase, including those costs related to drilling rigs, equipment, supplies and personnel and the services and products of other vendors to the industry. These costs may increase, and necessary equipment and services may become unavailable to us at economical prices. Should this increase in costs occur, we may delay drilling activities, which may limit our ability to establish and replace reserves, or we may incur these higher costs, which may negatively affect our financial condition, results of operations and cash flows.
In addition, the demand for hydraulic fracturing services currently exceeds the availability of fracturing equipment and crews across the industry and in our operating areas in particular. The accelerated wear and tear of hydraulic fracturing equipment due to its deployment in unconventional oil and natural gas fields characterized by longer lateral lengths and larger numbers of fracturing stages has further amplified this equipment and crew shortage. If demand for fracturing services continues to increase or the supply of fracturing equipment and crews decreases, then higher costs could result and could adversely affect our business and results of operations.
27
Table of Contents
Index to Financial Statements
Drilling Locations That We Decide to Drill May Not Yield Oil or Natural Gas in Commercially Viable Quantities.
We describe some of our drilling locations and our plans to explore those drilling locations in this prospectus. Our drilling locations are in various stages of evaluation, ranging from a location which is ready to drill to a location that will require substantial additional interpretation before it can be drilled. There is no way to predict in advance of drilling and testing whether any particular location will yield oil or natural gas in sufficient quantities to recover drilling or completion costs or to be economically viable. The use of technologies and the study of producing fields in the same area will not enable us to know conclusively prior to drilling whether oil or natural gas will be present or, if present, whether oil or natural gas will be present in sufficient quantities to be economically viable. Even if sufficient amounts of oil or natural gas exist, we may damage the potentially productive hydrocarbon-bearing formation or experience mechanical difficulties while drilling or completing the well, resulting in a reduction in production from the well or abandonment of the well. If we drill additional wells that we identify as dry holes in our current and future drilling locations, our drilling success rate may decline and materially harm our business. The analogies we draw from available data from other wells, more fully explored locations or producing fields may not be applicable to our drilling locations. The cost of drilling, completing and operating any well is often uncertain, and new wells may not be productive.
Our Identified Drilling Locations Are Scheduled Out over Several Years, Making Them Susceptible to Uncertainties That Could Materially Alter the Occurrence or Timing of Their Drilling.
Our management team has identified and scheduled drilling locations in our operating areas over a multi-year period. Our ability to drill and develop these locations depends on a number of factors, including the availability of equipment and capital, approval by regulators, seasonal conditions, oil and natural gas prices, assessment of risks, costs and drilling results. The final determination on whether to drill any of these locations will be dependent upon the factors described elsewhere in this prospectus as well as, to some degree, the results of our drilling activities with respect to our established drilling locations. Because of these uncertainties, we do not know if the drilling locations we have identified will be drilled within our expected timeframe or at all or if we will be able to economically produce hydrocarbons from these or any other potential drilling locations. Our actual drilling activities may be materially different from our current expectations, which could adversely affect our financial condition, results of operations and cash flows.
We Have Limited Control over Activities on Properties We Do Not Operate.
We are not the operator on many of our properties. As a result, our ability to exercise influence over the operations of these properties or their associated costs is limited. Our dependence on the operators and other working interest owners of these projects and our limited ability to influence operations and associated costs or control the risks could materially and adversely affect the realization of our targeted returns on capital in drilling or acquisition activities. The success and timing of our drilling and development activities on properties operated by others therefore depends upon a number of factors, including:
| • | timing and amount of capital expenditures; |
| • | the operator’s expertise and financial resources; |
| • | the rate of production of reserves, if any; |
| • | approval of other participants in drilling wells; and |
| • | selection of technology. |
28
Table of Contents
Index to Financial Statements
In areas where we do not have the right to propose the drilling of wells, we may have limited influence on when, how and at what pace our properties in those areas are developed. Further, the operators of those properties may experience financial problems in the future or may sell their rights to another operator not of our choosing, both of which could limit our ability to develop and monetize the underlying natural gas reserves.
A Component of Our Growth May Come through Acquisitions, and Our Failure to Identify or Complete Future Acquisitions Successfully Could Reduce Our Earnings and Hamper Our Growth.
We may be unable to identify properties for acquisition or to make acquisitions on terms that we consider economically acceptable. There is intense competition for acquisition opportunities in our industry. Competition for acquisitions may increase the cost of, or cause us to refrain from, completing acquisitions. The completion and pursuit of acquisitions may be dependent upon, among other things, our ability to obtain debt and equity financing and, in some cases, regulatory approvals. Our ability to grow through acquisitions will require us to continue to invest in operations, financial and management information systems and to attract, retain, motivate and effectively manage our employees. The inability to manage the integration of acquisitions effectively could reduce our focus on subsequent acquisitions and current operations, and could negatively impact our results of operations and growth potential. Our financial position, results of operations and cash flows may fluctuate significantly from period to period, reflecting the completion of significant acquisitions during particular periods. If we are not successful in identifying or acquiring any material property interests, our earnings could be reduced and our growth could be restricted.
We may engage in bidding and negotiating to complete successful acquisitions. We may be required to alter or increase substantially our capitalization to finance these acquisitions through the use of cash on hand, the issuance of debt or equity securities, the sale of production payments, the sale of non-strategic assets, the borrowing of funds or otherwise. Our current revolving credit agreement includes covenants limiting our ability to incur additional debt. If we were to proceed with one or more acquisitions with stock, our shareholders would suffer dilution of their interests. While we intend to concentrate on acquiring producing properties with exploration and development potential located in areas of operation with which our staff is familiar, we may decide to acquire properties that are substantially different in operating or geologic characteristics or geographic locations from areas with which our staff is familiar, which may impact our productivity in such areas.
We May Purchase Oil and Natural Gas Properties with Liabilities or Risks We Did Not Know About or That We Did Not Assess Correctly, and, as a Result, We Could Be Subject to Liabilities That Could Adversely Affect Our Results of Operations.
Before acquiring oil and natural gas properties, we estimate the reserves, future oil and natural gas prices, operating costs, potential environmental liabilities and other factors relating to the properties. However, our review involves many assumptions and estimates, and their accuracy is inherently uncertain. As a result, we may not discover all existing or potential problems associated with the properties we buy. We may not become sufficiently familiar with the properties to assess fully their deficiencies and capabilities. We do not generally perform inspections on every well or property, and we may not be able to observe mechanical and environmental problems even when we conduct an inspection. The seller may not be willing or financially able to give us contractual protection against any identified problems, and we may decide to assume environmental and other liabilities in connection with properties we acquire. If we acquire properties with risks or liabilities we did not know about or that we did not assess correctly, our financial condition, results of operations and cash flows could be adversely affected as we settle claims and incur cleanup costs related to these liabilities.
29
Table of Contents
Index to Financial Statements
Strategic Relationships upon Which We May Rely Are Subject to Change, Which May Diminish Our Ability to Conduct Our Operations.
Our ability to explore, develop and produce oil and natural gas resources successfully and acquire oil and natural gas interests and acreage depends on our developing and maintaining close working relationships with industry participants and on our ability to select and evaluate suitable acquisition opportunities in a highly competitive environment. These realities are subject to change and may impair our ability to grow.
To develop our business, we will endeavor to use the business relationships of our management, board and special board advisors to enter into strategic relationships, which may take the form of contractual arrangements with other oil and natural gas companies, including those that supply equipment and other resources that we expect to use in our business. We may not be able to establish these strategic relationships, or if established, we may not be able to maintain them. In addition, the dynamics of our relationships with strategic partners may require us to incur expenses or undertake activities we would not otherwise be inclined to incur in order to fulfill our obligations to these partners or maintain our relationships. If our strategic relationships are not established or maintained, our business prospects may be limited, which could diminish our ability to conduct our operations.
Our Operations Are Subject to Operational Hazards and Unforeseen Interruptions for Which We May Not Be Adequately Insured.
There are a variety of operating risks inherent in our wells, gathering systems, pipelines and other facilities, such as leaks, explosions, mechanical problems and natural disasters, all of which could cause substantial financial losses. In addition, there is an inherent risk of incurring significant environmental costs and liabilities in the performance of our operations, some of which may be material, due to our handling of petroleum hydrocarbons and wastes, our emissions to air and water, the underground injection or other disposal of our wastes, the use of hydraulic fracturing fluids and historical industry operations and waste disposal practices. Any of these or other similar occurrences could result in the disruption of our operations, substantial repair costs, personal injury or loss of human life, significant damage to property, environmental pollution, impairment of our operations and substantial revenue losses. The location of our wells, gathering systems, pipelines and other facilities near populated areas, including residential areas, commercial business centers and industrial sites, could significantly increase the level of damages resulting from these risks.
Insurance against all operational risks is not available to us. We are not fully insured against all risks, including development and completion risks that are generally not recoverable from third parties or insurance. In addition, pollution and environmental risks generally are not fully insurable. Additionally, we may elect not to obtain insurance if we believe that the cost of available insurance is excessive relative to the perceived risks presented. Losses could, therefore, occur for uninsurable or uninsured risks or in amounts in excess of existing insurance coverage. Moreover, insurance may not be available in the future at commercially reasonable costs and on commercially reasonable terms. Changes in the insurance markets due to various factors may make it more difficult for us to obtain certain types of coverage in the future. Additionally, we anticipate further tightening of the insurance markets in the aftermath of the Macondo well incident in the Gulf of Mexico in April 2010. As a result, we may not be able to obtain the levels or types of insurance we would otherwise have obtained prior to these market changes, and we cannot be sure the insurance coverage we do obtain will cover certain hazards or all potential losses, and will not contain large deductibles. Losses and liabilities from uninsured and underinsured events and delay in the payment of insurance proceeds could have a material adverse effect on our business, financial condition, results of operations and cash flows.
30
Table of Contents
Index to Financial Statements
Weather Conditions Could Materially Impair Our Business.
Our operations in south Texas may be adversely affected by hurricanes and tropical storms, resulting in delays in exploration and drilling. Adverse weather can also directly impede our operations. Repercussions of severe weather conditions may include:
| • | curtailment of operations; |
| • | weather-related damage to facilities and equipment, resulting in suspension of operations; |
| • | inability to receive equipment, personnel and products to job sites in a timely manner; |
| • | increase in the price of insurance; and |
| • | loss of productivity. |
These constraints could also delay our operations, reduce our revenues and materially increase our operating and capital costs.
The Marketability of Our Production Is Dependent upon Oil and Natural Gas Gathering and Transportation Facilities Owned and Operated by Third Parties, and the Unavailability of Satisfactory Oil and Natural Gas Transportation Arrangements Would Have a Material Adverse Effect on Our Revenue.
The unavailability of satisfactory oil and natural gas transportation arrangements may hinder our access to oil and natural gas markets or delay production from our wells. The availability of a ready market for our oil and natural gas production depends on a number of factors, including the demand for, and supply of, oil and natural gas and the proximity of reserves to pipelines and terminal facilities. Our ability to market our production depends in substantial part on the availability and capacity of gathering systems, pipelines and processing facilities owned and operated by third parties. Our failure to obtain these services on acceptable terms could materially harm our business. We may be required to shut-in wells for lack of a market or because of inadequacy or unavailability of natural gas pipeline or gathering system capacity. If that were to occur, we would be unable to realize revenue from those wells until production arrangements were made to deliver our production to market. Furthermore, if we were required to shut-in wells we might also be obligated to pay shut-in royalties to certain mineral interest owners in order to maintain our leases.
The disruption of third party facilities due to maintenance and/or weather could negatively impact our ability to market and deliver our products. The third parties control when or if such facilities are restored and what prices will be charged. We generally do not purchase firm transportation on third party facilities, and, therefore, our production transportation can be interrupted by those having firm arrangements. Federal and state regulation of oil and natural gas production and transportation, tax and energy policies, changes in supply and demand, pipeline pressures, damage to or destruction of pipelines and general economic conditions could adversely affect our ability to produce, gather and transport oil and natural gas.
Hedging Transactions, or the Lack Thereof, May Limit Our Potential Gains and Could Result in Financial Losses.
To manage our exposure to price risk, we, from time to time, enter into hedging arrangements, using primarily put and call options in the form of costless collars with respect to a portion of our future production. The goal of these hedges is to lock in a range of prices so as to mitigate price volatility and increase the predictability of cash flows. These transactions limit our potential gains if oil and natural gas prices rise above the maximum price established by the options and may offer protection if prices fall below the minimum price established by the options only to the extent of the volumes then hedged.
31
Table of Contents
Index to Financial Statements
In addition, hedging transactions may expose us to the risk of financial loss in certain other circumstances, including instances in which:
| • | our production is less than expected; or |
| • | the counterparties to our put and call option contracts fail to perform under the contracts. |
Disruptions in the financial markets could lead to sudden changes in a counterparty’s liquidity, which could impair its ability to perform under the terms of the contracts. We are unable to predict sudden changes in a counterparty’s creditworthiness or ability to perform under contracts with us. Even if we do accurately predict sudden changes, our ability to mitigate that risk may be limited depending upon market conditions.
Furthermore, there may be times when we have not hedged our production when, in retrospect, it would have been advisable to do so. Decisions as to whether and what production volumes to hedge are difficult and depend on market conditions and our forecast of future production and product prices, and we may not always employ the optimal hedging strategy. We may employ hedging strategies in the future that differ from those that we have used in the past, and neither the continued application of our current strategies nor our use of different hedging strategies may be successful. Our existing natural gas hedges will expire at various times during 2011, 2012 and 2013. We currently have no hedging agreements in place for any of our oil and liquids production.
An Increase in the Differential between the NYMEX or other Benchmark Prices of Oil and Natural Gas and the Wellhead Price We Receive for Our Production Could Adversely Affect Our Business, Financial Condition, Results of Operations and Cash Flows.
The prices that we receive for our oil and natural gas production sometimes reflect a discount to the relevant benchmark prices, such as NYMEX, that are used for calculating hedge positions. The difference between the benchmark price and the prices we receive is called a differential. Increases in the differential between the benchmark prices for oil and natural gas and the wellhead price we receive could adversely affect our business, financial condition, results of operations and cash flows. We do not have, and may not have in the future, any derivative contracts covering the amount of the basis differentials we experience in respect of our production. As such, we will be exposed to any increase in such differentials.
We Are Subject to Government Regulation and Liability, including Complex Environmental Laws, New Taxes and Changes to Tax Laws, All of Which Could Require Significant Expenditures.
The exploration, development, production and sale of oil and natural gas in the United States are subject to many federal, state and local laws, rules and regulations, including complex environmental laws and regulations. Matters subject to regulation include discharge permits, drilling bonds, reports concerning operations, the spacing of wells, unitization and pooling of properties, taxation or environmental matters and health and safety criteria addressing worker protection. Under these laws and regulations, we may be required to make large expenditures that could materially adversely affect our financial condition, results of operations and cash flows. These expenditures could include payments for:
| • | personal injuries; |
| • | property damage; |
| • | containment and clean up of oil and other spills; |
| • | the management and disposal of hazardous materials; |
32
Table of Contents
Index to Financial Statements
| • | remediation and clean-up costs; and |
| • | other environmental damages. |
We do not believe that full insurance coverage for all potential damages is available at a reasonable cost. Failure to comply with these laws and regulations also may result in the suspension or termination of our operations and subject us to administrative, civil and criminal penalties and/or the imposition of investigatory or other remedial obligations. Laws, rules and regulations protecting the environment have changed frequently and the changes often include increasingly stringent requirements. These laws, rules and regulations may impose liability on us for environmental damage and disposal of hazardous materials even if we were not negligent or at fault. We may also be found to be liable for the conduct of others or for acts that complied with applicable laws, rules or regulations at the time we performed those acts. These laws, rules and regulations are interpreted and enforced by numerous federal and state agencies. In addition, private parties, including the owners of properties upon which our wells are drilled or the owners of properties adjacent to or in close proximity to those properties, may also pursue legal actions against us based on alleged non-compliance with certain of these laws, rules and regulations.
The federal, state and local governments in the areas in which we operate impose taxes on the oil and natural gas products we sell and, for many of our wells, sales and use taxes on significant portions of our drilling and operating costs. In the past, there has been a significant amount of discussion by legislators and presidential administrations concerning a variety of energy tax proposals. Many states have raised state taxes on energy sources, and additional increases may occur. Changes to tax laws that are applicable to us could adversely affect our business and our financial results.
Certain Federal Income Tax Deductions Currently Available with Respect to Oil and Natural Gas Exploration and Production Activities May Be Eliminated as a Result of Future Legislation.
Periodically, legislation is introduced to eliminate certain key U.S. federal income tax preferences currently available to oil and natural gas exploration and production companies. Such changes include, but are not limited to, (i) the repeal of the percentage depletion allowance for oil and natural gas properties, (ii) the elimination of current deductions for intangible drilling and development costs, (iii) the elimination of the deduction for United States production activities and (iv) the increase in the amortization period for geophysical costs paid or incurred in connection with the exploration for, or development of, oil or natural gas within the United States. These changes were included in the White House budget proposals, released on February 26, 2009, February 1, 2010 and February 14, 2011 and may be raised again in the future. In 2009 and 2010, legislation which would have implemented the proposed changes was introduced but not enacted. It is unclear whether any such changes will actually be enacted or, if enacted, how soon any such changes could become effective. The passage of any legislation as a result of the budget proposals or any other similar change in U.S. federal income tax law could affect certain tax deductions that are currently available with respect to oil and natural gas exploration and production activities and could negatively impact our financial condition, results of operations and cash flows.
We May Be Required to Write Down the Carrying Value of Our Proved Properties Under Accounting Rules and these Write-Downs Could Adversely Affect Our Financial Condition.
There is a risk that we will be required to write down the carrying value of our oil and natural gas properties when oil and natural gas prices are low. In addition, non-cash write-downs may occur if we have:
| • | downward adjustments to our estimated proved reserves; |
33
Table of Contents
Index to Financial Statements
| • | increases in our estimates of development costs; or |
| • | deterioration in our exploration results. |
We periodically review the carrying value of our oil and natural gas properties under full-cost accounting rules. Under these rules, the net capitalized costs of oil and natural gas properties less related deferred income taxes may not exceed a ceiling limit that is based on the present value, based on constant prices and costs projected forward from a single point in time, of estimated future after-tax net cash flows from proved reserves, discounted at 10%. If the net capitalized costs of our oil and natural gas properties less related deferred income taxes exceed the ceiling limit, we must charge the amount of this excess to operations in the period in which the excess occurs. We may not reverse write-downs even if prices increase in subsequent periods. A write-down does not affect net cash flows from operating activities, but it does reduce the book value of our net tangible assets, retained earnings and shareholders’ equity and could lower the value of our common stock.
We May Incur Losses or Costs as a Result of Title Deficiencies in the Properties in Which We Invest.
If an examination of the title history of a property that we have purchased reveals an oil and natural gas lease has been purchased in error from a person who is not the owner of the mineral interest desired, our interest would be worthless. In such an instance, the amount paid for such oil and natural gas lease as well as any royalties paid pursuant to the terms of the lease prior to the discovery of the title defect would be lost.
It is our practice, in acquiring oil and natural gas leases, or undivided interests in oil and natural gas leases, not to undergo the expense of retaining lawyers to examine the title to the mineral interest to be placed under lease or already placed under lease. Rather, we will rely upon the judgment of oil and natural gas lease brokers and/or landmen who perform the field work in examining records in the appropriate governmental office before attempting to acquire a lease on a specific mineral interest.
Prior to the drilling of an oil and natural gas well, however, it is the normal practice in the oil and natural gas industry for the person or company acting as the operator of the well to obtain a preliminary title review of the spacing unit within which the proposed oil and natural gas well is to be drilled to ensure there are no obvious deficiencies in title to the well. Frequently, as a result of such examinations, certain curative work must be done to correct deficiencies in the marketability of the title, and such curative work entails expense. Our failure to cure any title defects may adversely impact our ability in the future to increase production and reserves. There is no assurance that we will not suffer a monetary loss from title defects or title failure. Additionally, unproved and unevaluated acreage has greater risk of title defects than developed acreage. If there are any title defects or defects in assignment of leasehold rights in properties in which we hold an interest, we will suffer a financial loss which could adversely affect our financial condition, results of operations and cash flows.
The Derivatives Legislation Adopted by Congress Could Have an Adverse Impact on Our Ability to Hedge Risks Associated with Our Business.
We regularly enter into commodity hedges which would compensate us in the event that commodity prices decrease. Those hedges are intended to partially offset a decrease in revenue from a drop in commodity prices and decrease our exposure generally to commodity price volatility. On July 21, 2010, President Obama signed into law the Dodd-Frank Wall Street Reform and Consumer Protection Act, or the Dodd-Frank Act, which is intended to modernize and protect the integrity of the U.S. financial system. The
34
Table of Contents
Index to Financial Statements
Dodd-Frank Act, among other things, sets forth the new framework for regulating certain derivative products including the commodity hedges of the type used by us, but many aspects of this law are subject to further rulemaking and will take effect over several years. As a result, it is difficult to anticipate the overall impact of the Dodd-Frank Act on our ability or willingness to continue entering into and maintaining such commodity hedges and the terms thereof. Based upon the limited assessments we are able to make with respect to the Dodd-Frank Act, there is the possibility that the Dodd-Frank Act could have a substantial and adverse impact on our ability to enter into and maintain these commodity hedges. In particular, the Dodd-Frank Act could result in the implementation of position limits and additional regulatory requirements on our derivative arrangements, which could include new margin, reporting and clearing requirements. In addition, this legislation could have a substantial impact on our counterparties and may increase the cost of our derivative arrangements in the future.
The imposition of these types of requirements or limitations could have an adverse effect on our ability to hedge risks associated with our business or on the cost of our hedging activity. If these types of commodity hedges become unavailable or uneconomic, our commodity price risk could increase, which would increase the volatility of revenues from sales of commodities and may decrease the amount of credit that lenders are willing to extend to us. It should be further noted that the use of derivative arrangements can play an important role in our acquisition strategies; therefore, any limitations or changes in our use of derivative arrangements could also affect our future ability to conduct acquisitions.
Federal and State Legislation and Regulatory Initiatives Relating to Hydraulic Fracturing Could Result in Increased Costs and Additional Operating Restrictions or Delays.
Congress is currently considering legislation to amend the federal Safe Drinking Water Act to remove the exemption from restrictions on underground injection of fluids near drinking water sources granted to hydraulic fracturing operations and require reporting and disclosure of chemicals used by oil and natural gas companies in the hydraulic fracturing process, including, for example, the Fracturing Responsibility and Awareness of Chemicals Act. Hydraulic fracturing involves the injection of water, sand or other propping agents and chemicals under pressure into rock formations to stimulate natural gas production. We routinely use hydraulic fracturing to produce commercial quantities of oil, liquids and natural gas from shale formations such as the Haynesville and the Eagle Ford, where we focus our operations. Sponsors of bills pending before the Senate and House of Representatives have asserted that chemicals used in the fracturing process could adversely affect drinking water supplies. These bills, if adopted, could increase the possibility of litigation and establish an additional level of regulation at the federal level that could lead to operational delays or increased operating costs and could, and in all likelihood would, result in additional regulatory burdens, making it more difficult to perform hydraulic fracturing operations and increasing our costs of compliance. Moreover, the U.S. Environmental Protection Agency, or EPA, announced on March 18, 2010 that it allocated $1.9 million in 2010 and has requested funding in fiscal year 2011 for conducting a comprehensive research study on the potential adverse impacts that hydraulic fracturing may have on human health and the environment. Consequently, even if these bills are not adopted soon or at all, the performance of the hydraulic fracturing study by the EPA could spur further action at a later date towards federal legislation and regulation of hydraulic fracturing or similar production operations.
In addition, a number of states are considering or have implemented more stringent regulatory requirements applicable to fracturing, which could include a moratorium on drilling and effectively prohibit further production of natural gas through the use of hydraulic fracturing or similar operations. Texas has adopted legislation that requires the disclosure of information regarding the substances used in the hydraulic fracturing process to the Railroad Commission of Texas and the public. This legislation and any implementing regulation could increase our costs of compliance and doing business.
35
Table of Contents
Index to Financial Statements
The adoption of new laws or regulations imposing reporting obligations on, or otherwise limiting, the hydraulic fracturing process could make it more difficult to complete oil and natural gas wells in shale formations. In addition, if hydraulic fracturing becomes regulated at the federal level as a result of federal legislation or regulatory initiatives by the EPA, fracturing activities could become subject to additional permitting requirements, and also to attendant permitting delays and potential increases in cost, which could adversely affect our business and results of operations.
Legislation or Regulations Restricting Emissions of “Greenhouse Gases” Could Result in Increased Operating Costs and Reduced Demand for the Natural Gas, Natural Gas Liquids and Oil We Produce While the Physical Effects of Climate Change Could Disrupt Our Production and Cause Us to Incur Significant Costs in Preparing for or Responding to those Effects.
On December 15, 2009, the EPA published its final findings that emissions of carbon dioxide, methane and other “greenhouse gases” present an endangerment to public health and welfare because emissions of such gases are, according to the EPA, contributing to the warming of the earth’s atmosphere and other climatic changes. These findings allow the EPA to adopt and implement regulations that would restrict emissions of greenhouse gases under existing provisions of the federal Clean Air Act. Accordingly, the EPA has adopted regulations that would require a reduction in emissions of greenhouse gases from motor vehicles and could trigger permit review for greenhouse gas emissions from certain stationary sources. In addition, on October 30, 2009, the EPA published a final rule requiring the reporting of greenhouse gas emissions from specified large greenhouse gas emission sources in the United States beginning in 2011 for emissions occurring in 2010. On November 30, 2010, the EPA released a final rule that expands its rule on reporting of greenhouse gas emissions to include owners and operators of petroleum and natural gas systems. Monitoring of those newly covered emissions commenced on January 1, 2011, with the first annual reports due to the EPA on March 31, 2012. The adoption and implementation of any regulations imposing reporting obligations on, or limiting emissions of greenhouse gases from, our equipment and operations could require us to incur costs to reduce emissions of greenhouse gases associated with our operations. There were attempts at comprehensive legislation establishing a cap and trade program, but that legislation appears unlikely to pass. Further, various states have adopted legislation that seeks to control or reduce emissions of greenhouse gases from a wide range of sources. Any such legislation could adversely affect demand for the natural gas, oil and liquids that we produce. Finally, it should be noted that some scientists have concluded that increasing concentrations of greenhouse gases in the Earth’s atmosphere may produce climate changes that have significant physical effects, such as increased frequency and severity of storms, floods and other climatic events; if any such effects were to occur, they could have an adverse effect on our operations and cause us to incur significant costs in preparing for or responding to those effects.
A Change in the Jurisdictional Characterization of Some of Our Assets by FERC or a Change in Policy by It May Result in Increased Regulation of Our Assets, Which May Cause Our Revenues to Decline and Operating Expenses to Increase.
Section 1(b) of the Natural Gas Act of 1938, or NGA, exempts natural gas gathering facilities from regulation by the Federal Energy Regulatory Commission, or FERC, as a natural gas company under the NGA. We believe that the natural gas pipelines in our gathering systems meet the traditional tests FERC has used to establish a pipeline’s status as a gatherer not subject to regulation as a natural gas company. However, the distinction between FERC-regulated transmission services and federally unregulated gathering services is the subject of on-going litigation, so the classification and regulation of our gathering facilities are subject to change based on future determinations by FERC, the courts or Congress. A change in the jurisdictional characterization by FERC or Congress or a change in policy by either of them may result in increased regulation of our assets, which may cause our revenues to decline and operating expenses to increase.
36
Table of Contents
Index to Financial Statements
Should We Fail to Comply with All Applicable FERC-Administered Statutes, Rules, Regulations and Orders, We Could Be Subject to Substantial Penalties and Fines.
Under the Domenici-Barton Energy Policy Act of 2005, FERC has civil penalty authority under the NGA to impose penalties for current violations of up to $1.0 million per day for each violation and disgorgement of profits associated with any violation. While our systems have not been regulated by FERC as a natural gas company subject to the provisions of the NGA, FERC has adopted regulations that may subject certain of our otherwise non-FERC/NGA jurisdictional facilities to FERC annual reporting and daily scheduled flow and capacity posting requirements. Additional laws, rules and regulations pertaining to those and other matters may be considered or adopted by FERC or Congress from time to time. Failure to comply with those laws, rules and regulations in the future could subject us to civil penalty liability.
Competition in the Oil and Natural Gas Industry is Intense, Making It More Difficult for Us to Acquire Properties, Market Natural Gas and Secure Trained Personnel.
Our ability to acquire additional prospects and to find and develop reserves in the future will depend on our ability to evaluate and select suitable properties and to consummate transactions in a highly competitive environment for acquiring properties, marketing oil and natural gas and securing trained personnel. Also, there is substantial competition for capital available for investment in the oil and natural gas industry. Many of our competitors possess and employ financial, technical and personnel resources substantially greater than ours. Those companies may be able to pay more for productive oil and natural gas properties and exploratory prospects and to evaluate, bid for and purchase a greater number of properties and prospects than our financial or personnel resources permit. In addition, other companies may be able to offer better compensation packages to attract and retain qualified personnel than we are able to offer. The cost to attract and retain qualified personnel has increased in recent years due to competition and may increase substantially in the future. We may not be able to compete successfully in the future in acquiring prospective reserves, developing reserves, marketing hydrocarbons, attracting and retaining quality personnel and raising additional capital, which could have a material adverse effect on our business.
Certain of Our Unproved and Unevaluated Acreage Is Subject to Leases that Will Expire Over the Next Several Years Unless Production Is Established on Units Containing the Acreage.
At June 30, 2011, we had leasehold interests in approximately 137,000 net acres across all of our areas of interest that are not currently held by production and are subject to leases with primary or renewed terms that expire over the next several years. Unless we establish production in paying quantities on units containing these leases during their terms or we renew such leases, these leases will expire. If our leases expire, we will lose our right to develop the related properties. The cost to renew such leases may increase significantly, and we may not be able to renew such leases on commercially reasonable terms or at all. In addition, on certain portions of our acreage, third party leases may have been taken and could become immediately effective if our leases expire. As such, our actual drilling activities may materially differ from our current expectations, which could adversely affect our business, financial condition, results of operations and cash flows.
We May Have Difficulty Managing Growth in Our Business, Which Could Have a Material Adverse Effect on Our Business, Financial Condition, Results of Operations and Cash Flows and Our Ability to Execute Our Business Plan in a Timely Fashion.
Because of our small size, growth in accordance with our business plans, if achieved, will place a significant strain on our financial, technical, operational and management resources. As we expand our activities, including our planned increase in oil exploration, development and production, and increase the
37
Table of Contents
Index to Financial Statements
number of projects we are evaluating or in which we participate, there will be additional demands on our financial, technical and management resources. The failure to continue to upgrade our technical, administrative, operating and financial control systems or the occurrence of unexpected expansion difficulties, including the inability to recruit and retain experienced managers, geoscientists, petroleum engineers and landmen could have a material adverse effect on our business, financial condition, results of operations and cash flows and our ability to execute our business plan in a timely fashion.
Financial Difficulties Encountered by Our Oil and Natural Gas Purchasers, Third Party Operators or Other Third Parties Could Decrease Our Cash Flow from Operations and Adversely Affect the Exploration and Development of Our Prospects and Assets.
We derive essentially all of our revenues from the sale of our oil and natural gas to unaffiliated third party purchasers, independent marketing companies and mid-stream companies. Any delays in payments from our purchasers caused by financial problems encountered by them will have an immediate negative effect on our results of operations and cash flows.
Liquidity and cash flow problems encountered by the co-owners of our non-operated properties or the third party operators of our non-operated properties may prevent or delay the drilling of a well or the development of a project. Our working interest co-owners may be unwilling or unable to pay their share of the costs of projects as they become due. In the case of a farmout party, we would have to find a new farmout party or obtain alternative funding in order to complete the exploration and development of the prospects subject to the farmout agreement. In the case of a working interest owner, we could be required to pay the working interest owner’s share of the project costs. We cannot assure you that we would be able to obtain the capital necessary to fund either of these contingencies or that we would be able to find a new farmout party.
We May Incur Indebtedness Which Could Reduce Our Financial Flexibility, Increase Interest Expense and Adversely Impact Our Operations and Our Unit Costs.
Upon the completion of this offering and the application of the net proceeds, we expect to have approximately $50.0 million of long-term debt outstanding and available borrowings of approximately $30.0 million. Our current maximum borrowing capacity is the borrowing base, which at June 30, 2011 was $80.0 million, under our revolving credit agreement. Our borrowing base is determined semi-annually by our lenders based primarily on estimates of our proved oil and natural gas reserves. In addition to our revolving credit agreement, in May 2011, we borrowed $25.0 million in a term loan pursuant to the credit agreement. The term loan is due and payable on December 31, 2011, and there is no penalty for prepayment. At June 30, 2011, the term loan and the revolving loan bore interest at approximate annual rates of 5.3% and 2.1%, respectively. Once we discharge the term loan in full with a portion of the net proceeds from this offering, we will not be able to borrow any further amounts under the term loan. In the future, we may incur additional indebtedness, which may be significant, in order to make acquisitions or to develop our properties. Interest rates on such future indebtedness may be higher than current levels, causing our financing costs to increase accordingly.
Our level of indebtedness could affect our operations in several ways, including the following:
| • | a significant portion of our cash flows could be used to service our indebtedness; |
| • | a high level of debt would increase our vulnerability to general adverse economic and industry conditions; |
38
Table of Contents
Index to Financial Statements
| • | the covenants contained in the agreements governing our outstanding indebtedness will limit our ability to borrow additional funds, dispose of assets, pay dividends and make certain investments; |
| • | a high level of debt may place us at a competitive disadvantage compared to our competitors that are less leveraged and, therefore, may be able to take advantage of opportunities that our indebtedness would prevent us from pursuing; |
| • | our debt covenants may also affect our flexibility in planning for, and reacting to, changes in the economy and in our industry; and |
| • | a high level of debt may impair our ability to obtain additional financing in the future for working capital, capital expenditures, acquisitions and general corporate or other purposes. |
A high level of indebtedness increases the risk that we may default on our debt obligations. Our ability to meet our debt obligations and to reduce our level of indebtedness depends on our future performance. General economic conditions, oil and natural gas prices and financial, business and other factors affect our operations and our future performance. We may not be able to generate sufficient cash flows to pay the principal or interest on our debt, and future working capital, borrowings or equity financing may not be available to pay or refinance such debt. Factors that will affect our ability to raise cash through an offering of our capital stock or a refinancing of our debt include financial market conditions, the value of our assets and our performance at the time we need capital.
In addition, the borrowing base under our revolving credit agreement is subject to periodic redeterminations. We could be forced to repay a portion of our bank borrowings due to redeterminations of our borrowing base. If we are forced to do so, we may not have sufficient funds to make such repayments. If we do not have sufficient funds and are otherwise unable to negotiate renewals of our borrowings or arrange new financing, we may have to sell significant assets or have a portion of our assets foreclosed upon which could have a material adverse effect on our business and financial results.
Our Success Depends, to a Large Extent, on Our Ability to Retain Our Key Personnel, Including Our Chairman of the Board, Chief Executive Officer and President, the Members of Our Board of Directors and Our Special Board Advisors, and the Loss of Any Key Personnel, Board Member or Special Board Advisors Could Disrupt Our Business Operations.
Investors in our common stock must rely upon the ability, expertise, judgment and discretion of our management and the success of our technical team in identifying, evaluating and developing prospects and reserves. Our performance and success are dependent to a large extent on the efforts and continued employment of our management and technical personnel, including our Chairman, President and Chief Executive Officer, Joseph Wm. Foran. We do not believe that they could be quickly replaced with personnel of equal experience and capabilities, and their successors may not be as effective. While we have entered into employment agreements with Mr. Foran and other key personnel, such employment agreements do not ensure that these individuals remain in our employment. If Mr. Foran or any of these other key personnel resign or become unable to continue in their present roles and if they are not adequately replaced, our business operations could be adversely affected. With the exception of Mr. Foran, we do not maintain, nor do we plan to obtain, any insurance against the loss of any of these individuals.
We have an active board of directors that meets several times through the year and is intimately involved in our business and the determination of our operational strategies. Members of our board of directors work closely with management to identify potential prospects, acquisitions and areas for further development. Many of our directors have been involved with us since our inception and have a deep
39
Table of Contents
Index to Financial Statements
understanding of our operations and culture. If any of our directors resign or become unable to continue in their present role, it may be difficult to find replacements with the same knowledge and experience and as a result, our operations may be adversely affected.
In addition, our board consults regularly with our special advisors regarding our business and the evaluation, exploration, engineering and development of our prospects. Due to the knowledge and experience of our special advisors, they play a key role in our multi-disciplined approach to making decisions regarding prospects, acquisitions and development. If any of our special advisors resign or become unable to continue in their present role, our operations may be adversely affected.
Our Competitors May Use Superior Technology and Data Resources that We May Be Unable to Afford or That Would Require a Costly Investment by Us in Order to Compete with Them More Effectively.
Our industry is subject to rapid and significant advancements in technology, including the introduction of new products and services using new technologies and databases. As our competitors use or develop new technologies, we may be placed at a competitive disadvantage, and competitive pressures may force us to implement new technologies at a substantial cost. In addition, many of our competitors will have greater financial, technical and personnel resources that allow them to enjoy technological advantages and may in the future allow them to implement new technologies before we can. We cannot be certain that we will be able to implement technologies on a timely basis or at a cost that is acceptable to us. One or more of the technologies that we will use or that we may implement in the future may become obsolete, and we may be adversely affected.
Our Management Team Will Own Approximately —% of Our Common Stock after the Consummation of this Offering, Which Could Give Them Influence in Corporate Transactions and Other Matters, and the Interests of Our Management Could Differ From Yours.
Our directors and officers will beneficially own approximately —% of our outstanding shares of common stock following this offering based on — shares of common stock to be sold in this offering. These shareholders will be positioned to influence or control to some degree the outcome of matters requiring a shareholder vote, including the election of directors, the adoption of any amendment to our certificate of formation or bylaws and the approval of mergers and other significant corporate transactions. Their influence or control of the company may have the effect of delaying or preventing a change of control of the company and may adversely affect the voting and other rights of other shareholders. In addition, due to their ownership interest in our common stock, they may be able to remain entrenched in their positions.
Risks Relating to this Offering and Our Common Stock
The Market Price and Trading Volume of Our Common Stock May Be Volatile Following this Offering.
The market price of our common stock could vary significantly as a result of a number of factors. In addition, the trading volume of our common stock may fluctuate and cause significant price variations to occur. In the event of a drop in the market price of our common stock, you could lose a substantial part or all of your investment in our common stock. Factors that could affect our stock price or result in fluctuations in the market price or trading volume of our common stock include:
| • | our actual or anticipated operating and financial performance and drilling locations, including reserves estimates; |
| • | quarterly variations in the rate of growth of our financial indicators, such as net income per share, net income and cash flows, or those of companies that are perceived to be similar to us; |
40
Table of Contents
Index to Financial Statements
| • | changes in revenue, cash flows or earnings estimates or publication of reports by equity research analysts; |
| • | speculation in the press or investment community; |
| • | public reaction to our press releases, announcements and filings with the Securities and Exchange Commission, or SEC; |
| • | sales of our common stock by us or other shareholders, or the perception that such sales may occur; |
| • | general financial market conditions and oil and gas industry market conditions, including fluctuations in commodity prices; |
| • | the realization of any of the risk factors presented in this prospectus; |
| • | the recruitment or departure of key personnel; |
| • | commencement of or involvement in litigation; |
| • | the prices of oil and natural gas; |
| • | the success of our exploration and development operations, and the marketing of any oil and natural gas we produce; |
| • | changes in market valuations of companies similar to ours; and |
| • | domestic and international economic, legal and regulatory factors unrelated to our performance. |
The stock markets in general have experienced extreme volatility that has often been unrelated to the operating performance of particular companies. These broad market fluctuations may adversely affect the trading price of our common stock.
There Is Currently No Public Market for Our Common Stock, and an Active Liquid Trading Market for Our Common Stock May Not Develop Following this Offering.
Prior to this offering, there has been no public market for our common stock. We intend to file a listing application with the New York Stock Exchange, or NYSE, for our common stock in connection with this offering, which is subject to official notice of issuance. Liquid and active trading markets usually result in less price volatility and more efficiency in carrying out investors’ purchase and sale orders. Our common stock may have limited trading volume, and many investors may not be interested in owning our common stock because of the inability to acquire or sell a substantial block of our common stock at one time. Such illiquidity could have an adverse effect on the market price of our common stock. In addition, a shareholder may not be able to borrow funds using our common stock as collateral because lenders may be unwilling to accept the pledge of securities having such a limited market. We cannot assure you that an active trading market for our common stock will develop or, if one develops, be sustained.
The Initial Public Offering Price of Our Common Stock May Not Be Indicative of the Market Price of Our Common Stock after this Offering.
The initial public offering price may not necessarily bear any relationship to our book value or the fair market value of our assets. The initial public offering price will be negotiated between us and representatives of the underwriters, based on numerous factors which we discuss in the “Underwriters” section of this prospectus, and may not be indicative of the market price of our common stock after this offering. Consequently, you may not be able to sell shares of our common stock at prices equal to or greater than the price paid by you in this offering.
41
Table of Contents
Index to Financial Statements
Purchasers of Common Stock in this Offering will Experience Immediate and Substantial Dilution of $— Per Share.
Based on an assumed initial public offering price of $— per share, purchasers of our common stock in this offering will experience an immediate and substantial dilution of $— per share in the pro forma as adjusted net tangible book value per share of common stock from the initial public offering price, and our pro forma as adjusted net tangible book value at December 31, 2010 after giving effect to this offering would be $— per share. See “Dilution” for a complete description of the calculation of net tangible book value.
While We Currently Intend to Use the Net Proceeds from this Offering as Set Forth Under “Use of Proceeds” in this Prospectus, Our Budgets May Change Throughout 2011 and 2012 Depending on Oil and Natural Gas Prices, the Outcome of Our Drilling and Exploration Programs and Proposed Acquisitions.
While we intend to use the net proceeds from this offering and from any exercise of the underwriters’ over-allotment option to discharge our $25.0 million term loan in full, repay $10.0 million of our outstanding borrowings under our revolving credit agreement, fund the remaining portion of our 2011 and a portion of our anticipated 2012 capital expenditure budgets and for other general corporate purposes, following this offering, we may determine to revise the remainder of our 2011 and 2012 capital expenditure budgets based on the then current oil and natural gas prices and the outcome of our drilling and exploration programs. In addition, we may spend some or all of the net proceeds from this offering to consummate acquisitions of interests and acreage if we are presented with attractive acquisition opportunities. Management has broad discretion in applying the net proceeds of this offering. Our shareholders may not agree with the manner in which our management chooses to allocate and spend the net proceeds of this offering. The failure of management to apply these funds effectively will have a material adverse effect on our business, financial condition, results of operations and cash flows. Pending their use, we may invest our net proceeds from this offering in a manner that does not produce income or that loses value.
Because We Are a Relatively Small Company, the Requirements of Being a Public Company, Including Compliance with the Reporting Requirements of the Securities Exchange Act of 1934, as Amended, and the Requirements of the Sarbanes-Oxley Act, may Strain Our Resources, Increase Our Costs and Distract Management; and We May Be Unable to Comply with these Requirements in a Timely or Cost-Effective Manner.
As a public company with listed equity securities, we will need to comply with new laws, regulations and requirements, certain corporate governance provisions of the Sarbanes-Oxley Act of 2002, or Sarbanes-Oxley Act, related regulations of the SEC and the requirements of the NYSE, with which we are not required to comply as a private company. Complying with these statutes, regulations and requirements will occupy a significant amount of time of our board of directors and management and will significantly increase our costs and expenses, which we cannot estimate accurately at this time. We will need to:
| • | institute a more comprehensive compliance function; |
| • | establish and maintain a system of internal controls over financial reporting in compliance with the requirements of Section 404 of the Sarbanes-Oxley Act and the related rules and regulations of the SEC and the Public Company Accounting Oversight Board; |
| • | comply with rules promulgated by the NYSE; |
| • | prepare and distribute periodic public reports in compliance with our obligations under the federal securities laws; |
42
Table of Contents
Index to Financial Statements
| • | establish new internal policies, such as those relating to disclosure controls and procedures and insider trading; |
| • | involve and retain to a greater degree outside counsel and accountants in the above activities; |
| • | establish an internal audit function; and |
| • | establish an investor relations function. |
In addition, we also expect that being a public company subject to these rules and regulations may require us to accept less director and officer liability insurance coverage than we desire or to incur substantial costs to obtain coverage. These factors could also make it more difficult for us to attract and retain qualified members of our board of directors, particularly to serve on our audit committee, and qualified executive officers.
If One or More Material Weaknesses Persist or if We Fail to Establish and Maintain Effective Internal Control over Financial Reporting, Our Ability to Accurately Report Our Financial Results Could be Adversely Affected.
Prior to the completion of this offering, we have been a private company and have maintained internal controls and procedures in accordance with being a private company. We have maintained limited accounting personnel to perform our accounting processes and limited supervisory resources with which to address our internal control over financial reporting. In connection with our audit for the year ended December 31, 2010, our independent registered public accountants identified and communicated material weaknesses related to accounting for deferred income taxes, impairment of oil and natural gas properties, assessment of unproved and unevaluated properties and the administration of our stock plan. A material weakness is a control deficiency, or a combination of control deficiencies, in internal control over financial reporting, such that there is a reasonable possibility that a material misstatement of our annual and interim financial statements will not be prevented or detected on a timely basis.
We have begun the process of evaluating our internal control over financial reporting and will continue to work with our auditors to put into place new accounting process and control procedures to address the issues set forth above. However, we will not complete this process until well after this offering is completed. We cannot predict the outcome of this process at this time.
We are not currently required to comply with the SEC’s rules implementing Section 404 of the Sarbanes-Oxley Act, and are therefore not required to make a formal assessment of the effectiveness of our internal control over financial reporting for that purpose. Upon becoming a public company, we will be required to comply with the SEC’s rules implementing Section 302 of the Sarbanes-Oxley Act, which will require our management to certify financial and other information in our quarterly and annual reports and to provide an annual management report on the effectiveness of our internal control over financial reporting. We will not be required to make our first assessment of our internal control over financial reporting until the year following the year that our first annual report is filed or required to be filed with the SEC. To comply with the requirements of being a public company, we will need to upgrade our systems, including information technology, implement additional financial and management controls, reporting systems and procedures and hire additional accounting and financial reporting staff.
Further, our independent registered public accountants are not yet required to formally attest to the effectiveness of our internal control over financial reporting until the year following the year that our first annual report is required to be filed with the SEC. Once they are required to do so, our independent
43
Table of Contents
Index to Financial Statements
registered public accountants may issue a report that is adverse in the event it is not satisfied with the level at which our controls are documented, designed, operated or reviewed. Our remediation efforts may not enable us to remedy or avoid material weaknesses in the future.
Our efforts to develop and maintain our internal controls may not be successful, and we may be unable to maintain effective controls over our financial processes and reporting in the future and comply with the certification and reporting obligations under Sections 302 and 404 of the Sarbanes-Oxley Act. Further, our remediation efforts may not enable us to remedy or avoid material weaknesses in the future. Any failure to remediate deficiencies and to develop or maintain effective controls, or any difficulties encountered in our implementation or improvement of our internal control over financial reporting could result in material misstatements that are not prevented or detected on a timely basis, which could potentially subject us to sanction or investigation by the SEC, the NYSE or other regulatory authorities. Ineffective internal controls could also cause investors to lose confidence in our reported financial information.
We Do Not Presently Intend to Pay Any Cash Dividends on or Repurchase Any Shares of Our Common Stock.
We do not presently intend to pay any cash dividends on our common stock. Any payment of future dividends will be at the discretion of the board of directors and will depend on, among other things, our earnings, financial condition, capital requirements, level of indebtedness, statutory and contractual restrictions applying to the payment of dividends and other considerations that our board of directors deems relevant. Cash dividend payments in the future may only be made out of legally available funds and, if we experience substantial losses, such funds may not be available. In addition, prohibition on the payment of dividends and the repurchase of shares of our common stock are imposed under our revolving credit agreement. While these prohibitions exist, we are prohibited from the payment of dividends and the repurchase of shares of our common stock without a waiver from our lenders. Accordingly, you may have to sell some or all of your common stock in order to generate cash flow from your investment and there is no guarantee that the price of our common stock that will prevail in the market after this offering will ever exceed the price that you pay.
Future Sales of Shares of Our Common Stock by Existing Shareholders and Future Offerings of Our Common Stock by Us Could Depress the Price of Our Common Stock.
The market price of our common stock could decline as a result of sales of a large number of shares of our common stock in the market after this offering, and the perception that these sales could occur may also depress the market price of our common stock. Based on — shares outstanding at —, 2011, upon completion of this offering, we will have outstanding approximately — shares of common stock, and in addition to the shares sold in this offering, — shares of common stock will be immediately freely tradable, without restriction, in the public market. The underwriters expect that — of our shares, including all shares held by our officers and directors, will be subject to lock-up agreements that prohibit the disposition of those shares during the 180-day period beginning on the date of the final prospectus related to this offering, except with the prior written consent of RBC Capital Markets, LLC and subject to certain exceptions. We expect to contact our shareholders to discuss and obtain these agreements following the initial filing of this prospectus. After the expiration of the 180-day restricted period, all of these shares may be sold in the public market in the United States, subject to prior registration in the United States, if required, or reliance upon an exemption from U.S. registration, including, in the case of shares held by affiliates or control persons, compliance with the volume restrictions of Rule 144.
44
Table of Contents
Index to Financial Statements
If our existing shareholders sell, or indicate an intent to sell, substantial amounts of our common stock in the public market after any contractual lockup and other legal restrictions on resale discussed in this prospectus lapse, the trading price of our common stock could decline significantly and could decline below the initial public offering price. Sales of our common stock may make it more difficult for us to sell equity securities in the future at a time and at a price that we deem appropriate. These sales also could cause our stock price to fall and make it more difficult for you to sell shares of our common stock.
As soon as practicable after this offering, we intend to file a registration statement with the SEC on Form S-8 providing for the registration of — shares of our common stock issuable or reserved for issuance under our 2003 Stock and Incentive Plan and our 2011 Long-Term Incentive Plan. Subject to the satisfaction of vesting conditions, the expiration of lockup agreements and certain restrictions on sales by affiliates, shares registered under a registration statement on Form S-8 will be available for resale immediately in the public market without restriction.
We may also sell additional shares of common stock or securities convertible into common stock in subsequent offerings. We cannot predict the size of future issuances of our common stock or convertible securities or the effect, if any, that future issuances and sales of shares of our common stock or convertible securities will have on the market price of our common stock. Sales of substantial amounts of our common stock or convertible securities (including shares issued in connection with an acquisition), or the perception that such sales could occur, may adversely affect prevailing market prices of our common stock.
Provisions of Our Certificate of Formation, Bylaws and Texas Law May Have Anti-Takeover Effects that Could Prevent a Change in Control Even if It Might Be Beneficial to Our Shareholders.
Provisions of our certificate of formation and bylaws may discourage, delay or prevent a merger or acquisition that our shareholders may consider favorable. These provisions include:
| • | authorization for our board of directors to issue preferred stock without shareholder approval; |
| • | a classified board of directors so that not all members of our board of directors are elected at one time; |
| • | the prohibition of cumulative voting in the election of directors; and |
| • | a limitation on the ability of shareholders to call special meetings to those owning at least 10% of our outstanding shares of common stock. |
Provisions of Texas law also may discourage, delay or prevent someone from acquiring or merging with us, which may cause the market price of our common stock to decline. Under Texas law, a shareholder who beneficially owns more than 20% of our voting stock, or any “affiliated shareholder,” cannot acquire us for a period of three years from the date this person became an affiliated shareholder, unless various conditions are met, such as approval of the transaction by our board of directors before this person became an affiliated shareholder or approval of the holders of at least two-thirds of our outstanding voting shares not beneficially owned by the affiliated shareholder. See “Description of Capital Stock — Business Combinations Under Texas Law.”
45
Table of Contents
Index to Financial Statements
Our Board of Directors can Authorize the Issuance of Preferred Stock, which Could Diminish the Rights of Holders of Our Common Stock, and Make a Change of Control of the Company More Difficult Even if it might Benefit Our Shareholders.
Our board of directors is authorized to issue shares of preferred stock in one or more series and to fix the voting powers, preferences and other rights and limitations of the preferred stock. Accordingly, we may issue shares of preferred stock with a preference over our common stock with respect to dividends or distributions on liquidation or dissolution, or that may otherwise adversely affect the voting or other rights of the holders of common stock. Issuances of preferred stock, depending upon the rights, preferences and designations of the preferred stock, may have the effect of delaying, deterring or preventing a change of control of the company, even if that change of control might benefit our shareholders.
46
Table of Contents
Index to Financial Statements
CAUTIONARY NOTE REGARDING FORWARD-LOOKING STATEMENTS
This prospectus contains forward-looking statements that are subject to a number of risks and uncertainties, many of which are beyond our control. All statements, other than statements of historical fact included in this prospectus, regarding our strategy, future operations, financial position, estimated revenues and losses, projected costs and cash flows, prospects, plans and objectives of management are forward-looking statements. When used in this prospectus, the words “could,” “believe,” “anticipate,” “intend,” “estimate,” “expect,” “may,” “will,” “should,” “continue,” “predict,” “potential,” “project” and similar expressions are intended to identify forward-looking statements, although not all forward-looking statements contain such identifying words.
Forward-looking statements may include statements about our:
| • | business strategy; |
| • | reserves; |
| • | technology; |
| • | cash flows and liquidity; |
| • | financial strategy, budget, projections and operating results; |
| • | oil and natural gas realized prices; |
| • | timing and amount of future production of oil and natural gas; |
| • | availability of drilling and production equipment; |
| • | availability of oil field labor; |
| • | the amount, nature and timing of capital expenditures, including future exploration and development costs; |
| • | availability and terms of capital; |
| • | drilling of wells; |
| • | competition and government regulations; |
| • | marketing of oil and natural gas; |
| • | exploitation projects or property acquisitions; |
| • | costs of exploiting and developing our properties and conducting other operations; |
| • | general economic conditions; |
| • | competition in the oil and natural gas industry; |
| • | effectiveness of our risk management and hedging activities; |
| • | environmental liabilities; |
| • | counterparty credit risk; |
| • | governmental regulation and taxation of the oil and natural gas industry; |
| • | developments in oil-producing and natural gas-producing countries; |
| • | uncertainty regarding our future operating results; |
| • | estimated future reserves and present value thereof; and |
| • | plans, objectives, expectations and intentions contained in this prospectus that are not historical. |
47
Table of Contents
Index to Financial Statements
All forward-looking statements speak only at the date of this prospectus. You should not place undue reliance on these forward-looking statements. Although we believe that our plans, intentions and expectations reflected in or suggested by the forward-looking statements we make in this prospectus are reasonable, we can give no assurance that these plans, intentions or expectations will be achieved. We disclose important factors that could cause our actual results to differ materially from our expectations under “Risk Factors” and “Management’s Discussion and Analysis of Financial Condition and Results of Operations” and elsewhere in this prospectus. These cautionary statements qualify all forward-looking statements attributable to us or persons acting on our behalf. We do not undertake any obligation to update or revise publicly any forward-looking statements.
48
Table of Contents
Index to Financial Statements
We will receive net proceeds of approximately $ — million from the sale of the common stock offered by us, assuming an initial public offering price of $ — per share (the midpoint of the price range set forth on the cover page of this prospectus) and after deducting estimated expenses of approximately $ — million and estimated underwriting discounts and commissions of approximately $ — million. If the underwriters’ over-allotment option is exercised in full, we estimate that our net proceeds will be approximately $ — million.
Initially, we intend to use the net proceeds from this offering to repay in full the $25.0 million term loan that is due and payable on December 31, 2011 and to repay approximately $10.0 million of the outstanding indebtedness under our revolving credit agreement, approximately $60.0 million of which was outstanding on June 30, 2011. Following the application of the net proceeds of this offering, we will have approximately $50.0 million of long-term indebtedness outstanding and $30.0 million available for potential future borrowings.
We intend to use the remaining proceeds from this offering, together with our cash flows and future potential borrowings under our revolving credit agreement, to fund the remainder of our anticipated 2011 and our entire 2012 capital expenditure requirements and for other general corporate purposes, which may include additional drilling and development expenditures or acquisitions of interests and acreage. From January 1, 2011 through July 31, 2011, we spent approximately $84.2 million in capital expenditures (or 57% of our 2011 capital expenditures budget). From August 1, 2011 through December 31, 2011, we anticipate that our capital expenditures will be approximately $64.7 million.
The $25.0 million term loan matures on December 31, 2011 and bears interest at a rate of 5% plus a Eurodollar-based rate per annum, which equated to approximately 5.3% at June 30, 2011. For more information regarding our term loan, see “Management’s Discussion and Analysis of Financial Condition and Results of Operations — Credit Agreement.”
Our revolving credit agreement matures in March 2013 and our borrowings bear interest at a variable rate of 1.875% plus a Eurodollar-based rate per annum, which equated to approximately 2.1% at June 30, 2011. Our outstanding borrowings under our revolving credit agreement were incurred from December 2010 through May 2011 to finance acquisitions of acreage and ongoing drilling and completion operations. For more information regarding our revolving credit agreement, see “Management’s Discussion and Analysis of Financial Condition and Results of Operations — Credit Agreement.”
If the underwriters’ over-allotment option is exercised in full, any additional net proceeds will be added to our working capital and used for general corporate purposes.
An increase or decrease in the initial public offering price of $1.00 per share of common stock would cause the net proceeds that we will receive from this offering, after deducting estimated expenses and underwriting discounts and commissions, to increase or decrease by approximately $ — million.
While we expect to use the proceeds from this offering in the manner set forth above, the ultimate uses of our capital may differ depending on market conditions and the outcome of our drilling results. Until the actual use of our net proceeds from this offering as described above, we intend to invest such net proceeds in U.S. treasury bonds or investment grade instruments.
49
Table of Contents
Index to Financial Statements
We do not anticipate declaring or paying any cash dividends to holders of our common stock in the foreseeable future. We currently intend to retain future earnings to finance the expansion of our business. Our future dividend policy is within the discretion of our board of directors and will depend upon various factors, including our results of operations, financial condition, capital requirements and investment opportunities. In addition, a prohibition on the payment of dividends on our common stock is imposed under our revolving credit agreement.
50
Table of Contents
Index to Financial Statements
The following table sets forth our capitalization at March 31, 2011. Our capitalization is presented:
| • | on an actual basis; |
| • | on an as adjusted basis to give effect to $20.0 million of additional borrowings under our revolving credit agreement, our new $25.0 million term loan due on December 31, 2011 and our May 2011 acquisition of acreage in the Eagle Ford shale play for $30.5 million ($1.0 million of the total cost of this acquisition was paid in March 2011); and |
| • | on an as further adjusted basis to give effect to this offering (assuming aggregate gross proceeds of $150.0 million), the application of the estimated net proceeds to repay our $25.0 million term loan in full and repay approximately $10.0 million under our revolving credit agreement, with the balance being added to cash and cash equivalents, and the conversion of our Class B common stock. |
You should read the following table in conjunction with “Use of Proceeds,” “Selected Historical Consolidated and Other Financial Data,” “Management’s Discussion and Analysis of Financial Condition and Results of Operations” and our historical consolidated financial statements and related notes thereto appearing elsewhere in this prospectus.
| At March 31, 2011 | ||||||||||||
| Actual | As Adjusted | As Further Adjusted |
||||||||||
| (In thousands except for shares) | ||||||||||||
| Cash and cash equivalents |
$ | 14,461 | $ | 28,961 | $ | 130,961 | ||||||
| Certificates of deposit |
2,079 | 2,079 | 2,079 | |||||||||
| Debt: |
||||||||||||
| Short-term debt(1) |
– | 25,000 | – | |||||||||
| Long-term debt(2) |
40,000 | 60,000 | 50,000 | |||||||||
| Shareholders’ equity: |
||||||||||||
| Class A common stock, $0.01 par value, 80,000,000 shares authorized; 42,826,842 shares issued and 41,647,667 shares outstanding, actual; 42,826,842 shares issued and 41,647,667 shares outstanding, as adjusted; • shares issued and • shares outstanding, as further adjusted |
428 | 428 | — | |||||||||
| Class B common stock, $0.01 par value, 2,000,000 shares authorized; 1,030,700 shares issued and outstanding |
10 | 10 | – | |||||||||
| Additional paid-in capital |
263,937 | 263,937 | — | |||||||||
| Retained earnings |
1,198 | 1,198 | 1,198 | |||||||||
| Treasury stock, at cost, 1,179,175 shares |
(10,765 | ) | (10,765 | ) | — | |||||||
|
|
|
|
|
|
|
|||||||
| Total shareholders’ equity |
$ | 254,809 | $ | 254,809 | $ | — | ||||||
|
|
|
|
|
|
|
|||||||
| Total capitalization |
$ | 294,809 | $ | 339,809 | $ | — | ||||||
|
|
|
|
|
|
|
|||||||
| (1) | In May 2011, we borrowed $25.0 million in a term loan pursuant to the credit agreement. The term loan is due and payable on December 31, 2011 and there is no penalty for prepayment. For more information regarding our term loan, see “Management’s Discussion and Analysis of Financial Condition and Results of Operations — Credit Agreement.” |
| (2) | In March 2008, we entered into a credit agreement to establish a secured revolving line of credit for a term of five years, which we amended and restated in May 2011. At June 30, 2011, the borrowing base was $80.0 million, and we had $60.0 million in borrowings outstanding under the agreement and $375,000 in outstanding letters of credit issued pursuant to the credit agreement. Approximately $19.6 million remained available for additional borrowings. For more information regarding our revolving credit agreement, see “Management’s Discussion and Analysis of Financial Condition and Results of Operations — Credit Agreement.” |
51
Table of Contents
Index to Financial Statements
Purchasers of the common stock in this offering will experience immediate and substantial dilution in the net tangible book value per share of the common stock for accounting purposes. Our net tangible book value at March 31, 2011 was approximately $255 million, or $5.97 per share of common stock. Pro forma net tangible book value per share is determined by dividing our pro forma tangible net worth (tangible assets less total liabilities) by the total number of outstanding shares of common stock that will be outstanding immediately prior to the closing of this offering.
After giving effect to the sale of the shares in this offering and further assuming the receipt of the estimated net proceeds (after deducting estimated discounts and expenses of this offering), our adjusted pro forma net tangible book value at March 31, 2011 would have been approximately $— million, or $— per share. This represents an immediate increase in the net tangible book value of $— per share to our existing shareholders and an immediate dilution (i.e., the difference between the offering price and the adjusted pro forma net tangible book value after this offering) to new investors purchasing shares in this offering of $— per share. The following table illustrates the per share dilution to new investors purchasing shares in this offering:
| Assumed initial public offering price per share |
$— | |||||
| Pro forma net tangible book value per share at March 31, 2011 |
|
— |
| |||
| Increase per share attributable to new investors in this offering |
— | |||||
| As adjusted pro forma net tangible book value per share after giving effect to this offering |
— | |||||
| Dilution in pro forma net tangible book value per share to new investors in this offering |
$— |
The following table summarizes, on an as adjusted basis at March 31, 2011, the total number of shares of common stock owned by existing shareholders (assuming the conversion of our Class B common stock as described under “Description of Capital Stock”) and to be owned by new investors, the total consideration paid, and the average price per share paid by our existing shareholders and to be paid by new investors in this offering at $—, the midpoint of the range of the initial public offering prices set forth on the cover page of this prospectus, calculated before deduction of estimated underwriting discounts and commissions:
| Shares Acquired | Total Consideration | Average Price per Share | ||||||||||||||||
| Number | Percent | Amount | Percent | |||||||||||||||
| Existing shareholders |
42,678,367 | — | — | — | — | |||||||||||||
| New investors |
— | — | — | — | — | |||||||||||||
|
|
|
|
|
|
|
|
|
|||||||||||
| Total |
— | 100 | % | — | 100 | % | — | |||||||||||
|
|
|
|
|
|
|
|
|
|||||||||||
Apart from the information set forth in the tables above, assuming the underwriters’ over-allotment is exercised in full, sales by us in this offering will reduce the percentage of shares held by existing shareholders to —% and will increase the number of shares held by new investors to —, or —% on an as adjusted pro forma basis at March 31, 2011.
52
Table of Contents
Index to Financial Statements
SELECTED HISTORICAL CONSOLIDATED AND OTHER FINANCIAL DATA
You should read the following selected financial data in conjunction with “Corporate Reorganization,” “Management’s Discussion and Analysis of Financial Condition and Results of Operations” and our historical consolidated financial statements and related notes thereto included elsewhere in this prospectus. The financial information included in this prospectus may not be indicative of our future results of operations, financial position and cash flows.
The following selected financial information is summarized from our results of operations for the five-year period ended December 31, 2010 and selected consolidated balance sheet data at December 31, 2010, 2009, 2008, 2007 and 2006 and our results of operations for the three months ended March 31, 2011 and 2010 and the consolidated balance sheet data at March 31, 2011 and 2010 and should be read in conjunction with the consolidated financial statements at the years ended December 31, 2010, 2009 and 2008 and the three month periods ended March 31, 2011 and 2010, and the notes thereto included herewith.
| Year Ended December 31, | Three Months Ended March 31, |
|||||||||||||||||||||||||||
| 2010 | 2009 | 2008 | 2007 | 2006 | 2011 | 2010 | ||||||||||||||||||||||
| (Unaudited) | (Unaudited) | |||||||||||||||||||||||||||
| (In thousands) | ||||||||||||||||||||||||||||
| Statement of operations data: |
||||||||||||||||||||||||||||
| Revenues: |
||||||||||||||||||||||||||||
| Oil and natural gas revenues |
$ | 34,042 | $ | 19,039 | $ | 30,645 | $ | 13,988 | $ | 14,678 | $ | 13,699 | $ | 9,190 | ||||||||||||||
| Realized gain (loss) on derivatives |
5,299 | 7,625 | (1,326 | ) | 213 | – | 1,850 | 302 | ||||||||||||||||||||
| Unrealized gain (loss) on derivatives |
3,139 | (2,375 | ) | 3,592 | (211 | ) | – | (1,668 | ) | 6,093 | ||||||||||||||||||
|
|
|
|
|
|
|
|
|
|
|
|
|
|
|
|||||||||||||||
| Total revenues |
42,480 | 24,289 | 32,911 | 13,990 | 14,678 | 13,880 | 15,585 | |||||||||||||||||||||
| Expenses: |
||||||||||||||||||||||||||||
| Production taxes and marketing |
1,982 | 1,077 | 1,639 | 779 | 896 | 1,300 | 267 | |||||||||||||||||||||
| Lease operating |
5,284 | 4,725 | 4,667 | 3,099 | 3,075 | 1,605 | 1,332 | |||||||||||||||||||||
| Depletion, depreciation and amortization |
15,596 | 10,743 | 12,127 | 7,889 | 10,950 | 7,111 | 3,362 | |||||||||||||||||||||
| Accretion of asset retirement obligations |
155 | 137 | 92 | 70 | 55 | 39 | 38 | |||||||||||||||||||||
| Full-cost ceiling impairment |
– | 25,244 | 22,195 | – | 56,504 | 35,673 | – | |||||||||||||||||||||
| General and administrative |
9,702 | 7,115 | 8,252 | 5,189 | 5,407 | 2,619 | 2,032 | |||||||||||||||||||||
|
|
|
|
|
|
|
|
|
|
|
|
|
|
|
|||||||||||||||
| Total expenses |
32,719 | 49,041 | 48,972 | 17,026 | 76,887 | 48,347 | 7,031 | |||||||||||||||||||||
| Operating income (loss) |
9,761 | (24,752 | ) | (16,061 | ) | (3,036 | ) | (62,209 | ) | (34,467 | ) | 8,554 | ||||||||||||||||
| Other income (expense): |
||||||||||||||||||||||||||||
| Net gain (loss) on asset sales and inventory impairment |
(224 | ) | (379 | ) | 136,977 | – | – | – | – | |||||||||||||||||||
| Interest and other income |
364 | 781 | 2,984 | 2,736 | 2,063 | 71 | 96 | |||||||||||||||||||||
| Interest expense |
(3 | ) | – | – | – | – | (106 | ) | – | |||||||||||||||||||
|
|
|
|
|
|
|
|
|
|
|
|
|
|
|
|||||||||||||||
| Total other income (expense) |
137 | 402 | 139,962 | 2,736 | 2,063 | (35 | ) | 96 | ||||||||||||||||||||
|
|
|
|
|
|
|
|
|
|
|
|
|
|
|
|||||||||||||||
| Net income (loss) |
$ | 6,377 | $ | (14,425 | ) | $ | 103,878 | $ | (300 | ) | $ | (60,146 | ) | $ | (27,596 | ) | $ | 5,676 | ||||||||||
|
|
|
|
|
|
|
|
|
|
|
|
|
|
|
|||||||||||||||
53
Table of Contents
Index to Financial Statements
| At December 31, | At March 31, | |||||||||||||||||||||||||||||||||||
| 2010 | 2009 | 2008 | 2007 | 2006 | 2011 | 2010 | ||||||||||||||||||||||||||||||
| Actual | As Adjusted(1) |
As
Further Adjusted(2) |
||||||||||||||||||||||||||||||||||
| (Unaudited) | (Unaudited) | (Unaudited) | (Unaudited) | |||||||||||||||||||||||||||||||||
| (In thousands) | ||||||||||||||||||||||||||||||||||||
| Balance sheet data: |
||||||||||||||||||||||||||||||||||||
| Cash and cash equivalents |
$ | 21,060 | $ | 104,230 | $ | 150,768 | $ | 9,017 | $ | 43,183 | $ | 14,461 | $ | 28,961 | $ | 130,961 | $ | 91,619 | ||||||||||||||||||
| Certificates of deposit |
2,349 | 15,675 | 20,782 | – | – | 2,079 | 2,079 | 2,079 | 14,674 | |||||||||||||||||||||||||||
| Short-term investments |
– | – | – | 57,925 | – | – | – | – | – | |||||||||||||||||||||||||||
| Net property and equipment |
303,880 | 142,078 | 125,261 | 105,814 | 63,062 | 301,098 | 331,598 | 331,598 | 160,057 | |||||||||||||||||||||||||||
| Total assets |
346,382 | 277,400 | 314,539 | 179,152 | 112,628 | 336,197 | 381,197 | 483,197 | 285,788 | |||||||||||||||||||||||||||
| Current liabilities |
30,097 | 8,868 | 35,475 | 5,541 | 5,878 | 37,444 | 62,444 | 37,444 | 9,964 | |||||||||||||||||||||||||||
| Long term liabilities |
34,408 | 4,210 | 2,059 | 1,568 | 878 | 43,943 | 63,943 | 53,943 | 5,610 | |||||||||||||||||||||||||||
| Total shareholders’ equity |
$ | 281,877 | $ | 264,321 | $ | 277,005 | $ | 172,043 | $ | 105,872 | $ | 254,809 | $ | 254,809 | $ | 391,809 | $ | 270,214 | ||||||||||||||||||
| Year Ended December 31, | Three Months Ended March 31, |
|||||||||||||||||||||||||||
| 2010 | 2009 | 2008 | 2007 | 2006 | 2011 | 2010 | ||||||||||||||||||||||
| (Unaudited) | (Unaudited) | |||||||||||||||||||||||||||
| (In thousands) | ||||||||||||||||||||||||||||
| Other financial data: |
||||||||||||||||||||||||||||
| Net cash provided by operating activities |
$ | 27,273 | $ | 1,791 | $ | 25,851 | $ | 7,881 | $ | 1,570 | $ | 12,732 | $ | 9,101 | ||||||||||||||
| Net cash (used in) provided by investing activities |
(147,334 | ) | (49,415 | ) | 115,481 | (108,296 | ) | (49,501 | ) | (35,024 | ) | (21,743 | ) | |||||||||||||||
| Oil and natural gas properties capital expenditures |
(159,050 | ) | (54,244 | ) | (104,119 | ) | (50,310 | ) | (51,932 | ) | (34,114 | ) | (22,208 | ) | ||||||||||||||
| Expenditures for other property and equipment |
(1,610 | ) | (307 | ) | (3,012 | ) | (1,300 | ) | (3,127 | ) | (1,180 | ) | (536 | ) | ||||||||||||||
| Net cash provided by financing activities |
36,891 | 1,086 | 419 | 66,250 | 73,876 | 15,693 | 31 | |||||||||||||||||||||
| Adjusted EBITDA(3) |
$ | 23,635 | $ | 15,184 | $ | 18,411 | $ | 8,091 | $ | 7,582 | $ | 10,148 | $ | 6,142 | ||||||||||||||
| (1) | As adjusted for (i) the $20.0 million of additional borrowings under our revolving credit agreement and our borrowings of $25.0 million under the term loan which occurred during the second quarter of 2011, and (ii) the $30.5 million spent since March 31, 2011 to acquire leasehold interests in the Eagle Ford shale play from Orca ICI Development, JV. $1.0 million of the total cost of this acquisition was paid in March 2011. |
| (2) | As further adjusted to give effect to this offering (assuming aggregate gross proceeds of $150.0 million) and the application of the estimated net proceeds to repay our $25.0 million term loan in full and repay approximately $10.0 million under our revolving credit agreement, with the balance being added to cash and cash equivalents to fund a portion of our 2011 and a portion of our anticipated 2012 capital expenditure budgets and for other general corporate purposes. |
| (3) | Adjusted EBITDA is a non-GAAP financial measure. For a definition of Adjusted EBITDA and a reconciliation of Adjusted EBITDA to our net income (loss) and net cash provided by operating activities, see “Summary Financial, Reserves and Operating Data.” |
54
Table of Contents
Index to Financial Statements
MANAGEMENT’S DISCUSSION AND ANALYSIS OF
FINANCIAL CONDITION AND RESULTS OF OPERATIONS
The following discussion and analysis of our financial condition and results of operations should be read in conjunction with our consolidated financial statements and related notes appearing elsewhere in this prospectus. The following discussion contains “forward-looking statements” that reflect our future plans, estimates, beliefs and expected performance. We caution that assumptions, expectations, projections, intentions or beliefs about future events may, and often do, vary from actual results and the differences can be material. Some of the key factors which could cause actual results to vary from our expectations include changes in oil and natural gas prices, the timing of planned capital expenditures, availability of acquisitions, uncertainties in estimating proved reserves and forecasting production results, operational factors affecting the commencement or maintenance of producing wells, the condition of the capital markets generally, as well as our ability to access them, the proximity to and capacity of transportation facilities, uncertainties regarding environmental regulations or litigation and other legal or regulatory developments affecting our business, as well as those factors discussed below and elsewhere in the prospectus, all of which are difficult to predict. In light of these risks, uncertainties and assumptions, the forward-looking events discussed may not occur. See “Cautionary Note Regarding Forward-Looking Statements.”
Overview
We are an independent energy company engaged in the exploration, development, acquisition and production of oil and natural gas resources in the United States, with a particular emphasis on oil and natural gas shale plays and other unconventional resources. Our current operations are located primarily in the Eagle Ford shale play in south Texas and the Haynesville shale play in northwest Louisiana and east Texas. These plays are a key part of our growth strategy, and we believe these plays represent two of the most active and economically viable unconventional resource plays in North America. We expect the majority of our near-term capital expenditures will focus on increasing our production and reserves from these plays as we seek to capitalize on the relative economics of each play. In addition to these primary operating areas, we have significant acreage positions in southeast New Mexico and west Texas and in southwest Wyoming and adjacent areas in Utah and Idaho where we continue to identify new oil and natural gas prospects.
We were founded in July 2003 by Mr. Joseph Wm. Foran and Mr. Scott E. King, and we drilled our first well in 2004. Since that time, we have drilled or participated in 198 wells through June 30, 2011, including 65 Haynesville and six Eagle Ford wells. At March 31, 2011, based on the reserves report audit by our independent reservoir engineers, we had 154.8 Bcfe of estimated proved reserves with a PV-10 of $140.6 million and a Standardized Measure of $131.5 million. At March 31, 2011, 36% of our estimated proved reserves were proved developed reserves and 97% of our estimated proved reserves were natural gas. We grew our average daily production by 162% from 9.0 MMcfe per day from the year ended December 31, 2008 to 23.6 MMcfe per day for the year ended December 31, 2010. As a result of initial production from several wells that were recently completed and turned to sales, our daily production for the month ended May 31, 2011 was approximately 49.1 MMcfe per day.
Our business success and financial results are dependent on many factors beyond our control, such as economic, political and regulatory developments, as well as competition from other sources of energy. Commodity price volatility, in particular, is a significant risk factor for us. Commodity prices are affected by changes in market supply and demand, which is impacted by overall economic activity, weather, pipeline capacity constraints, inventory storage levels, natural gas price differentials and other factors. Prices for oil and natural gas will affect the cash flows available to us for capital expenditures and our ability to borrow
55
Table of Contents
Index to Financial Statements
and raise additional capital. Declines in oil and natural gas prices would not only reduce our revenues, but could also reduce the amount of oil and natural gas that we can produce economically, and as a result, could have an adverse effect on our financial condition, results of operations, cash flows and reserves. Because we produce more natural gas than oil at the present time and expect to continue to do so in the near term, we will face more risks associated with fluctuations in the price of natural gas. Since one of our current business strategies is to focus on increasing our oil and liquids production, we will face increased risk in the future associated with fluctuations in the price of oil.
In response to the recent commodity price environment, and in particular, the general decline in natural gas prices since July 2008 in contrast with the rebound in oil prices since February 2009, we have sought to balance our exploration and development plans by targeting more oil prone reservoirs, such as the Eagle Ford shale. While most of our historical and current production is natural gas, we believe that our future production profile will reflect a more balanced oil and natural gas commodity mix as a result of our strategic shift to target more oil development than we have historically.
One of the biggest challenges we face in the development of our Eagle Ford and Haynesville shale acreage is associated with service costs, and particularly in the Eagle Ford play, pipeline infrastructure and the shortage of stimulation equipment and service dates necessary to stimulate these wells. Due to the increased activity in these areas, service costs have continued to rise and the availability of completion crews has decreased. We believe that reducing drilling and particularly completion costs will be essential to the successful development and profitability of the Eagle Ford and Haynesville shale plays. See “Risk Factors — The mechanical risks of drilling and completion activities as well as the unavailability or high cost of drilling rigs, completion equipment and services, supplies and personnel, including hydraulic fracturing equipment and personnel, could adversely affect our ability to establish and execute exploration and development plans within budget and on a timely basis, which could have a material adverse effect on our financial condition, results of operations and cash flows.”
We believe that our general and administrative expenses will increase in connection with the completion of this offering as a result of us operating as a public company. This increase will consist primarily of legal and accounting fees and additional expenses associated with compliance with the Sarbanes-Oxley Act and other regulations and increases in our staff compensation and other ongoing general and administrative expenses necessary to maintain and grow a publicly traded exploration and production company. A large part of this increase will be due to the cost of accounting support services, filing annual and quarterly reports with the SEC, investor relations activities, directors’ fees, incremental directors’ and officers’ liability insurance costs and transfer and registrar agent fees. As a result, we believe that our general and administrative expenses for future periods will increase significantly. Our consolidated financial statements following the completion of this offering will reflect the impact of these increased expenses and affect the comparability of our financial statements with periods before the completion of this offering.
Revenues
Our revenues are derived primarily from the sale of oil and natural gas production. Our revenues may vary significantly from period to period as a result of changes in volumes of production sold or changes in oil and natural gas prices.
Realized gain (loss) on derivatives. We use commodity derivative financial instruments to mitigate our exposure to fluctuations in natural gas prices. This revenue item includes the net realized cash gains and losses associated with the settlement of these derivative financial instruments for a given reporting period.
56
Table of Contents
Index to Financial Statements
Unrealized gain (loss) on derivatives. We use commodity derivative financial instruments to mitigate our exposure to fluctuations in natural gas prices. This revenue item recognizes the non-cash change in the fair value of our open derivative contracts between reporting periods.
The following table summarizes our revenues and production data for the periods indicated:
| Year Ended December 31, | Three Months
Ended March 31, |
|||||||||||||||||||
| 2010 | 2009 | 2008 | 2011 | 2010 | ||||||||||||||||
| (Unaudited) | (Unaudited) | |||||||||||||||||||
| Operating Results: |
||||||||||||||||||||
| Revenues (in thousands): |
||||||||||||||||||||
| Oil |
$ | 2,506 | $ | 1,719 | $ | 3,653 | $ | 1,680 | $ | 633 | ||||||||||
| Natural gas |
31,535 | 17,320 | 26,992 | 12,019 | 8,557 | |||||||||||||||
|
|
|
|
|
|
|
|
|
|
|
|||||||||||
| Total oil and natural gas revenues |
34,042 | 19,039 | 30,645 | 13,698 | 9,190 | |||||||||||||||
| Realized gain (loss) on derivatives |
5,299 | 7,625 | (1,326 | ) | 1,849 | 302 | ||||||||||||||
| Unrealized gain (loss) on derivatives |
3,139 | (2,375 | ) | 3,592 | (1,668 | ) | 6,093 | |||||||||||||
|
|
|
|
|
|
|
|
|
|
|
|||||||||||
| Total revenues |
$ | 42,480 | $ | 24,289 | $ | 32,911 | $ | 13,880 | $ | 15,585 | ||||||||||
| Net Production Volumes: |
||||||||||||||||||||
| Oil (MBbls) |
33 | 30 | 37 | 19 | 8 | |||||||||||||||
| Natural gas (Bcf) |
8.4 | 4.8 | 3.1 | 3.3 | 1.8 | |||||||||||||||
| Total natural gas equivalents (Bcfe) |
8.6 | 5.0 | 3.3 | 3.4 | 1.8 | |||||||||||||||
| Average net daily production (MMcfe/d) |
23.6 | 13.7 | 9.0 | 37.8 | 20.5 | |||||||||||||||
| Average Sales Prices: |
||||||||||||||||||||
| Oil (per Bbl) |
$ | 76.39 | $ | 57.72 | $ | 98.59 | $ | 89.11 | $ | 75.29 | ||||||||||
| Natural gas, with realized derivatives (per Mcf) |
$ | 4.38 | $ | 5.17 | $ | 8.32 | $ | 4.22 | $ | 4.93 | ||||||||||
| Natural gas, without realized derivatives (per Mcf) |
$ | 3.75 | $ | 3.59 | $ | 8.75 | $ | 3.65 | $ | 4.76 | ||||||||||
Three Months Ended March 31, 2011 Compared to Three Months Ended March 31, 2010
Oil and natural gas revenues. Our oil and natural gas revenues increased by $4.5 million to $13.7 million, or an increase of about 49%, for the three months ended March 31, 2011, as compared to the three months ended March 31, 2010. We increased our production by 84% to 3.4 Bcfe for the three months ended March 31, 2011 from 1.8 Bcfe for the three months ended March 31, 2010 primarily due to drilling operations in the Haynesville shale, but also reflects production from our first operated well in the Eagle Ford shale. The oil and natural gas revenues of approximately $6.4 million generated by these increased production volumes was partially offset by the $1.9 million decrease in oil and natural gas revenues attributable primarily to the decline in the price we received for our natural gas production during the comparable periods. For the three months ended March 31, 2011, we received an average natural gas price of $3.65 per Mcf as compared to an average natural gas price of $4.76 per Mcf for the three months ended March 31, 2010.
Realized gain (loss) on derivatives. Our realized gain on derivatives increased by approximately $1.5 million to $1.8 million for the three months ended March 31, 2011 from $0.3 million for the three months ended March 31, 2010. The realized gain from our open natural gas costless collar contracts increased primarily as a result of the decline in natural gas prices during the comparable periods. We realized approximately $1.31 per MMBtu hedged on all of our open natural gas costless collar contracts during the three months ended March 31, 2011 as compared to $0.20 per MMBtu hedged on all of our open natural gas costless collar contracts during the three months ended March 31, 2010.
57
Table of Contents
Index to Financial Statements
Unrealized gain (loss) on derivatives. Our unrealized loss on derivatives was $1.7 million for the three months ended March 31, 2011, compared to an unrealized gain of $6.1 million for the three months ended March 31, 2010. During the period from December 31, 2010 to March 31, 2011, the net fair value of our open natural gas costless collar contracts decreased from $4.1 million to $2.4 million, resulting in an unrealized loss on derivatives of $1.7 million for the three months ended March 31, 2011. This decrease in the net fair value of our open natural gas costless collar contracts was due to both an increase in the natural gas prices during the first quarter of 2011 and a decrease in the total number of open contracts at March 31, 2011 as compared to December 31, 2010. During the period from December 31, 2009 to March 31, 2010, the net fair value of our open natural gas costless collar contracts increased from $1.0 million to $7.1 million, resulting in an unrealized gain on derivatives of $6.1 million for the three months ended March 31, 2010.
Year Ended December 31, 2010 as Compared to Year Ended December 31, 2009
Oil and natural gas revenues. Our oil and natural gas revenues increased by $15.0 million to $34.0 million, or an increase of about 79%, for the year ended December 31, 2010 as compared to the year ended December 31, 2009. Approximately $13.7 million of the increase was primarily due to a 72% increase in our production to 8.6 Bcfe during the year ended December 31, 2010 from 5.0 Bcfe during the year ended December 31, 2009, and approximately $1.3 million of the increase was due to increases in the average prices we received for both oil and natural gas over these respective periods. For the year ended December 31, 2010, we received an average natural gas price of $3.75 per Mcf and an average oil price of $76.39 per Bbl as compared to an average natural gas price of $3.59 per Mcf and an average oil price of $57.72 per Bbl for the year ended December 31, 2009. Our increased production during this period was primarily due to drilling operations in the Haynesville shale.
Realized gain (loss) on derivatives. Our realized gain on derivatives decreased by approximately $2.3 million to $5.3 million for the year ended December 31, 2010 from $7.6 million for the year ended December 31, 2009. This decrease was due primarily to a decrease of about $1.50 per MMBtu in the average price floor of our open natural gas costless collar contracts in 2010 as compared with 2009 and despite the fact that we had almost twice the natural gas volumes hedged in 2010 as compared to 2009.
Unrealized gain (loss) on derivatives. Our unrealized gain on derivatives was $3.1 million for the year ended December 31, 2010, compared to an unrealized loss of $2.4 million for the year ended December 31, 2009. During the period from December 31, 2009 to December 31, 2010, the net fair value of our open natural gas costless collar contracts increased from $1.0 million to $4.1 million, resulting in an unrealized gain on derivatives of $3.1 million for the year ended December 31, 2010. This increase in the net fair value of our open natural gas costless collar contracts was due primarily to lower natural gas prices at December 31, 2010 as compared to December 31, 2009. During the period from December 31, 2008 to December 31, 2009, the net fair value of our open natural gas costless collar contracts decreased from $3.4 million to $1.0 million, resulting in an unrealized loss on derivatives of $2.4 million for the year ended December 31, 2009. This decrease in the net fair value of our open natural gas costless collar contracts was due primarily to an approximate $2.00 per MMBtu decrease in the average floor price of our open contracts at December 31, 2009 as compared with December 31, 2008.
Year Ended December 31, 2009 as Compared to Year Ended December 31, 2008
Oil and natural gas revenues. Our oil and natural gas revenues decreased $11.6 million to $19.0 million, or a decrease of about 38%, during the year ended December 31, 2009 as compared to the
58
Table of Contents
Index to Financial Statements
year ended December 31, 2008. Although we increased our production by 51% from 3.3 Bcfe in 2008 to 5.0 Bcfe in 2009, the oil and natural gas revenues of approximately $5.8 million generated by these increased production volumes did not fully offset the $17.4 million decrease in oil and natural gas revenues attributable to a sharp decline in the prices we received for both oil and natural gas in 2009 as compared with 2008. For the year ended December 31, 2009, we received an average natural gas price of $3.59 per Mcf and an average oil price of $57.72 per Bbl as compared to an average natural gas price of $8.75 per Mcf and an average oil price of $98.59 per Bbl for the year ended December 31, 2008. Our increased production during this period was due primarily to drilling operations in the Haynesville shale.
Realized gain (loss) on derivatives. Our realized gain on derivatives increased approximately $8.9 million to $7.6 million during the year ended December 31, 2009 from a loss of $1.3 million during the year ended December 31, 2008. Natural gas futures prices closed above the price ceiling of many of our open natural gas costless collar contracts during the first half of 2008, and, as a result, we were required to pay the counterparty at settlement. Natural gas prices declined sharply beginning in August 2008 and continued to decline throughout much of 2009, and as a result, natural gas prices closed below the price floor of many of our open costless collar contracts during almost all of 2009. As a result, we received cash from the counterparty at settlement and our realized gain on derivatives increased significantly.
Unrealized gain (loss) on derivatives. Our unrealized loss on derivatives was $2.4 million for the year ended December 31, 2009 as compared to an unrealized gain of $3.6 million for the year ended December 31, 2008. During the period from December 31, 2008 to December 31, 2009, the net fair value of our open natural gas costless collar contracts decreased from $3.4 million to $1.0 million, resulting in an unrealized loss on derivatives of $2.4 million for the year ended December 31, 2009. This decrease in the net fair value of our open natural gas costless collar contracts was due primarily to an approximate $2.00 per MMBtu decrease in the average floor price of our open contracts at December 31, 2009 as compared with December 31, 2008. During the period from December 31, 2007 to December 31, 2008, the net fair value of our open natural gas costless collar contracts increased from a liability of $0.2 million to $3.4 million, resulting in an unrealized gain on derivatives of $3.6 million for the year ended December 31, 2008. This increase in the net fair value of our open natural gas costless collar contracts was due to a decrease in natural gas prices and an increase in the volume of natural gas hedged at December 31, 2008 as compared with December 31, 2007.
Expenses
Production taxes and marketing. Production taxes are paid on produced oil and natural gas based on a percentage of revenues from products sold at market prices (not hedged prices) or at fixed rates established by federal, state or local taxing authorities. We attempt to take advantage of all credits and exemptions in our various taxing jurisdictions. In general, the production taxes we pay tend to correlate to the changes in our oil and natural gas revenues. Marketing expenses are fees charged by the purchasers of the oil and natural gas we produce and sell and principally include marketing, compression and transportation fees.
Lease operating expenses. Lease operating expenses are the daily costs incurred to produce oil and natural gas, as well as the daily costs incurred to maintain our producing properties. Such costs also include field personnel costs, utilities, chemical additives, salt water disposal, maintenance, repairs and occasional workover expenses related to our oil and natural gas properties.
59
Table of Contents
Index to Financial Statements
Depletion, depreciation and amortization. Depletion, depreciation and amortization includes the systematic expensing of the capitalized costs incurred in the acquisition, exploration and development of oil and natural gas. We use the full-cost method of accounting and accordingly, we capitalize all costs associated with the acquisition, exploration and development of oil and natural gas properties, including unproved and unevaluated property costs. Internal costs are capitalized only to the extent they are directly related to acquisition, exploration or development activities and do not include any costs related to production, selling or general corporate administrative activities. Capitalized costs of oil and natural gas properties are amortized using the unit-of-production method based upon production and estimates of proved oil and natural gas reserves quantities. Unproved and unevaluated property costs are excluded from the amortization base used to determine depletion, depreciation and amortization.
Accretion of asset retirement obligations. Asset retirement obligations relate to the future costs associated with plugging and abandonment of oil and natural gas wells, removal of equipment and facilities from leased acreage and returning such land to its original condition. We recognize the fair value of an asset retirement obligation in the period it is incurred if a reasonable estimate of fair value can be made. The asset retirement obligation is recorded as a liability at its estimated present value, with an offsetting increase recognized in oil and natural gas properties or support equipment and facilities on the balance sheet. Periodic accretion of the discounted value of the estimated liability is recorded as an expense in our statement of operations.
Full-cost ceiling impairment. When the net capitalized costs of our oil and natural gas properties less related deferred income taxes exceed the estimated present value of after-tax future net cash flows from proved oil and natural gas reserves, discounted at 10%, such excess is charged to operations as a full-cost ceiling impairment in that reporting period.
General and administrative expenses. General and administrative expenses include, but are not limited to, compensation and benefits for our employees, costs of renting and maintaining our headquarters, office service contracts, board of directors fees, franchise taxes, stock-based compensation expense and accounting, legal and other professional fees.
Other Income (Expense)
Net gain (loss) on asset sales and inventory impairment. This other income (expense) item includes the net gain or loss we experience on infrequent asset sales or impairment charges associated with certain equipment held in inventory. This item also includes infrequent sales of oil and natural gas properties that we consider to be extraordinary when considered in relation to the normal course of our business.
Interest and other income. Interest income includes interest earned periodically on the cash and cash equivalents we hold in money market accounts composed of United States Treasury securities offering daily liquidity and the interest earned periodically on our certificates of deposit. Other income includes income we receive for providing salt water disposal and natural gas transportation services to other working interest participants in wells that we operate.
Interest expense. Interest expense includes interest paid to our lenders as a result of borrowings under our revolving credit agreement. We finance a portion of our working capital requirements, capital expenditures and acquisitions with borrowings under the credit agreement, and as a result, we incur interest expense that is affected by both fluctuations in interest rates and our financing decisions. In addition, we include any amortization of deferred financing costs (including origination and amendment fees), commitment fees and annual agency fees as interest expense.
60
Table of Contents
Index to Financial Statements
Total income tax provision (benefit). Total income tax provision (benefit) includes the net current and deferred portions of our estimated income tax liabilities. We file a United States federal income tax return and state tax returns in those states where we conduct oil and natural gas operations. The current portion of our income tax provision (benefit) reflects actual income tax payments made or refunds received by us as a result of filing these income tax returns. The deferred portion of our income tax provision is the result of temporary timing differences between the financial statement carrying values and the tax bases of our assets and liabilities.
The following table summarizes our operating expenses and other income (expense) for the periods indicated:
| Year
Ended December 31, |
Three Months Ended March 31, |
|||||||||||||||||||
| 2010 | 2009 | 2008 | 2011 | 2010 | ||||||||||||||||
| (Unaudited) | (Unaudited) | |||||||||||||||||||
| (In thousands, except expenses per Mcfe) | ||||||||||||||||||||
| Expenses: |
||||||||||||||||||||
| Production taxes and marketing |
$ | 1,982 | $ | 1,077 | $ | 1,639 | $ | 1,300 | $ | 267 | ||||||||||
| Lease operating |
5,284 | 4,725 | 4,667 | 1,605 | 1,332 | |||||||||||||||
| Depletion, depreciation and amortization |
15,596 | 10,743 | 12,127 | 7,111 | 3,362 | |||||||||||||||
| Accretion of asset retirement obligations |
155 | 137 | 91 | 39 | 38 | |||||||||||||||
| Full-cost ceiling impairment |
– | 25,244 | 22,195 | 35,673 | – | |||||||||||||||
| General and administrative |
9,702 | 7,115 | 8,252 | 2,619 | 2,032 | |||||||||||||||
|
|
|
|
|
|
|
|
|
|
|
|||||||||||
| Total expenses |
32,719 | 49,041 | 48,972 | 48,347 | 7,031 | |||||||||||||||
| Operating income (loss) |
9,761 | (24,752 | ) | (16,061 | ) | (34,467 | ) | 8,554 | ||||||||||||
| Other income (expense): |
||||||||||||||||||||
| Net gain (loss) on asset sales and inventory impairment |
(224 | ) | (379 | ) | 136,978 | – | – | |||||||||||||
| Interest and other income |
364 | 781 | 2,984 | 71 | 96 | |||||||||||||||
| Interest expense |
(3 | ) | – | – | (106 | ) | – | |||||||||||||
|
|
|
|
|
|
|
|
|
|
|
|||||||||||
| Total other income (expense) |
137 | 402 | 139,962 | (35 | ) | 96 | ||||||||||||||
| Income (loss) before income taxes |
9,898 | (24,350 | ) | 123,901 | (34,502 | ) | 8,650 | |||||||||||||
| Total income tax provision (benefit) |
3,521 | (9,925 | ) | 20,023 | (6,906 | ) | 2,974 | |||||||||||||
| Net income (loss) |
$ | 6,377 | $ | (14,425 | ) | $ | 103,878 | $ | (27,596 | ) | $ | 5,676 | ||||||||
| Expenses per Mcfe: |
||||||||||||||||||||
| Production taxes and marketing |
$ | 0.23 | $ | 0.22 | $ | 0.50 | $ | 0.38 | $ | 0.14 | ||||||||||
| Lease operating |
$ | 0.61 | $ | 0.94 | $ | 1.41 | $ | 0.47 | $ | 0.72 | ||||||||||
| Depletion, depreciation and amortization |
$ | 1.81 | $ | 2.15 | $ | 3.67 | $ | 2.09 | $ | 1.82 | ||||||||||
| General and administrative |
$ | 1.13 | $ | 1.42 | $ | 2.50 | $ | 0.77 | $ | 1.10 | ||||||||||
Three Months Ended March 31, 2011 Compared to Three Months Ended March 31, 2010
Production taxes and marketing. Our production taxes and marketing expenses increased by $1.0 million to $1.3 million, or an increase of almost four fold for the three months ended March 31, 2011, as compared to the three months ended March 31, 2010. The increase in our production taxes and marketing expenses was due primarily to the increases in both our oil and natural gas production and revenues by 84% and 49%, respectively, during the three months ended March 31, 2011 as compared to the three months ended March 31, 2010. Most of this increase was due to recently completed Haynesville shale wells, several of which were turned to sales or produced their first significant production volumes during the first quarter of 2011. Although we or our outside operating partners have applied for exemptions from initial production taxes on these wells, and although we expect these applications will be approved by the state of Louisiana, these wells had not yet been approved for production tax exemptions at March 31, 2011. Thus, we have paid and/or accrued for the associated production taxes on these wells during the first quarter of 2011, although we expect these production taxes will be refunded to us in future periods. We will adjust our production taxes and marketing expenses accordingly at that time.
61
Table of Contents
Index to Financial Statements
Lease operating expenses. Our lease operating expenses increased by $0.3 million to $1.6 million, or an increase of about 23%, for the three months ended March 31, 2011 as compared to the three months ended March 31, 2010. During these respective periods, however, our oil and natural gas production increased by 84% from 1.8 Bcfe to 3.4 Bcfe. As a result, our lease operating expenses per unit of production decreased by 35% to $0.47 per Mcfe for the three months ended March 31, 2011 as compared to $0.72 per Mcfe for the three months ended March 31, 2010. During the first quarter of 2011, the percentage of our production attributed to the Haynesville shale continued to increase. The unit lease operating costs associated with the Haynesville production are much less than those associated with our Cotton Valley natural gas production, primarily due to the greater salt water disposal costs associated with the Cotton Valley production.
Depletion, depreciation and amortization. Our depletion, depreciation and amortization expenses increased by $3.7 million to $7.1 million, or an increase of about 112%, for the three months ended March 31, 2011 as compared to the three months ended March 31, 2010. The increase in our depletion, depreciation and amortization expenses was due primarily to the increase of 84% in our oil and natural gas production from 1.8 Bcfe to 3.4 Bcfe during the respective time periods. A portion of this increase was also due to a 15% increase in our depletion, depreciation and amortization expenses on a unit-of-production basis from $1.82 per Mcfe for the three months ended March 31, 2010 to $2.09 per Mcfe for the three months ended March 31, 2011. This increase reflects increases in drilling and completion costs for wells drilled to the Haynesville shale during the past year. This increase is also due, in part, to higher finding and development costs on a per Mcfe basis associated with our initial wells drilled and completed in the Eagle Ford shale.
Accretion of asset retirement obligations. Our accretion of asset retirement obligations expenses increased by approximately $1,000 to approximately $39,000, or an increase of about 3%, for the three months ended March 31, 2011 as compared to the three months ended March 31, 2010. The increase in our accretion of asset retirement obligations was due primarily to the addition of new wells through our drilling of operated wells and our participation in the drilling of non-operated wells, although, on the whole, this item is an insignificant component of our overall operating expenses.
Full-cost ceiling impairment. No impairment to the net carrying value of our oil and natural gas properties on the balance sheet resulting from the full-cost ceiling limitation was recorded at March 31, 2010. At March 31, 2011, the net capitalized costs of our oil and natural gas properties less related deferred income taxes exceeded the full-cost ceiling by $23.0 million. As a result, we recorded an impairment charge of $35.7 million to the net capitalized costs of our oil and natural gas properties and a deferred income tax credit of $12.7 million.
General and administrative. Our general and administrative expenses increased by $0.6 million to $2.6 million, or an increase of about 30%, for the three months ended March 31, 2011 as compared to the three months ended March 31, 2010. The increase in our general and administrative expenses is due primarily to increased compensation expenses and increased accounting and legal expenses for the three months ended March 31, 2011 as compared to the three months ended March 31, 2010. As a result of our increased oil and natural gas production, however, our general and administrative expenses decreased by 30% on a unit-of-production basis to $0.77 per Mcfe for the three months ended March 31, 2011 as compared to $1.10 per Mcfe for the three months ended March 31, 2010.
Net gain (loss) on asset sales and inventory impairment. We did not incur gains or losses on asset sales and inventory impairment during the three months ended March 31, 2011 or during the three months ended March 31, 2010.
62
Table of Contents
Index to Financial Statements
Interest expense. At March 31, 2011, we had borrowed $40.0 million under our revolving credit agreement to finance a portion of our working capital requirements and capital expenditures. At March 31, 2011, the interest rate on the outstanding borrowings was approximately 1.8%. We had no borrowings under the credit agreement at March 31, 2010, and as a result, we incurred no interest expense for the three months ended March 31, 2010.
Interest and other income. Our interest and other income decreased by approximately $25,000 to approximately $71,000, or a decrease of about 26%, for the three months ended March 31, 2011 as compared to the three months ended March 31, 2010. The decrease in our interest and other income was due primarily to a significant decrease in the average balances of our cash and cash equivalents and certificates of deposit on which we receive interest income between the two periods. Our cash and cash equivalents and certificates of deposit decreased to $16.5 million at March 31, 2011 from $106.3 million at March 31, 2010, as we used cash to acquire additional leasehold acreage in the Eagle Ford shale play in south Texas and in the core area of the Haynesville shale play in northwest Louisiana and to fund our operated and non-operated drilling and completion activities in both areas.
Total income tax provision (benefit). We recorded a total income tax benefit of approximately $6.9 million for the three months ended March 31, 2011 as compared to a total income tax provision of approximately $3.0 million recorded for the three months ended March 31, 2010. The total income tax benefit or provision for both periods reflect only deferred income taxes. At March 31, 2011, the net capitalized costs of our oil and natural gas properties less related deferred income taxes exceeded the full-cost ceiling by $23.0 million. As a result, we recorded an impairment charge of $35.7 million to the net capitalized costs of our oil and natural gas properties and a deferred income tax credit of $12.7 million. This deferred income tax credit exceeded our deferred tax liabilities at March 31, 2011, and as a result, we reduced our net deferred tax liabilities by $6.9 million and established a net valuation allowance in the amount of approximately $5.3 million due to uncertainties regarding the future realization of our deferred tax assets. We will continue to assess the valuation allowance on a periodic basis and to the extent we determine that the allowance is no longer required, the tax benefit of the remaining deferred tax assets will be recognized in the future. For the three months ended March 31, 2010, the deferred income tax provision was consistent with our income before income taxes, which included approximately $6.1 million in unrealized hedging gains. We had a net loss for the three months ended March 31, 2011 and our effective tax rate for the three months ended March 31, 2010 was 34.38%.
Year Ended December 31, 2010 Compared to Year Ended December 31, 2009
Production taxes and marketing. Our production taxes and marketing expenses increased by $0.9 million to $2.0 million, or an increase of about 84%, for the year ended December 31, 2010 as compared to the year ended December 31, 2009. The increase in our production taxes and marketing expenses was due primarily to the increase in our oil and natural gas revenues from $19.0 million to $34.0 million, or an increase of about 79%, during the respective time periods. On a unit-of-production basis, our production taxes and marketing expenses remained relatively constant year-over-year, increasing to $0.23 per Mcfe for the year ended December 31, 2010 from $0.22 per Mcfe for the year ended December 31, 2009.
Lease operating expenses. Our lease operating expenses increased by $0.6 million to $5.3 million, or an increase of about 12%, for the year ended December 31, 2010 as compared to the year ended December 31, 2009. During these respective periods, however, our oil and natural gas production increased 72% to 8.6 Bcfe from 5.0 Bcfe. As a result, our lease operating expenses per unit of production decreased
63
Table of Contents
Index to Financial Statements
by 35% to $0.61 per Mcfe for the year ended December 31, 2010 as compared to $0.94 per Mcfe for the year ended December 31, 2009. In 2010, the percentage of our production attributed to the Haynesville shale continued to increase. The unit lease operating costs associated with the Haynesville production are much less than those associated with our Cotton Valley natural gas production, primarily due to the greater salt water disposal costs associated with the Cotton Valley production.
Depletion, depreciation and amortization. Our depletion, depreciation and amortization expenses increased by $4.9 million to $15.6 million, or an increase of about 45%, for the year ended December 31, 2010 as compared to the year ended December 31, 2009. The increase in our depletion, depreciation and amortization expenses was due primarily to the increase in our natural gas production to 8.6 Bcfe from 5.0 Bcfe during the respective time periods. The finding and development costs associated with our Haynesville shale reserves have been less than finding and development costs associated with our reserves producing from the Cotton Valley and other formations. As a result, our depletion, depreciation and amortization expenses on a unit-of-production basis have continued to decrease as our Haynesville production has increased; these expenses decreased to $1.81 per Mcfe during the year ended December 31, 2010 from $2.15 per Mcfe during the year ended December 31, 2009.
Accretion of asset retirement obligations. Our accretion of asset retirement obligations expenses increased by approximately $18,000 to approximately $155,000, or an increase of about 13%, for the year ended December 31, 2010 as compared to the year ended December 31, 2009. The increase in our accretion of asset retirement obligations was due primarily to the addition of new wells through our drilling of operated wells and our participation in the drilling of non-operated wells.
Full-cost ceiling impairment. No impairment to the net carrying value of our oil and natural gas properties on the balance sheet resulting from the full-cost ceiling limitation was recorded at December 31, 2010. At December 31, 2009, the net capitalized costs of our oil and natural gas properties less related deferred income taxes exceeded the full-cost ceiling by $16.3 million. As a result, we recorded an impairment charge of $25.2 million to the net capitalized costs of our oil and natural gas properties and a deferred income tax credit of $8.9 million. A corresponding charge of $25.2 million was also recorded to the consolidated statement of operations for the year ended December 31, 2009.
General and administrative. Our general and administrative expenses increased by $2.6 million to $9.7 million, or an increase of about 36%, for the year ended December 31, 2010 as compared to the year ended December 31, 2009. Approximately $1.0 million of this increase was due to legal and other due diligence fees resulting from an unsuccessful effort to acquire oil and natural gas producing properties and associated acreage. The remainder of the increase was due primarily to increased compensation expenses resulting from both increased salaries and retention and performance bonuses paid to certain employees during the year ended December 31, 2010. As a result of our increased oil and natural gas production, however, our general and administrative expenses decreased by 20% on a unit-of-production basis to $1.13 per Mcfe for the year ended December 31, 2010 as compared to $1.42 per Mcfe for the year ended December 31, 2009.
Net gain (loss) on asset sales and inventory impairment. During the year ended December 31, 2010, we wrote off the Boise South Pipeline asset in Orange County, Texas and recognized a net loss of $173,690. We also recognized an impairment of $50,000 to some of our equipment held in inventory following a determination that the market value of the equipment, consisting primarily of drilling rig parts, was less than the cost. During the year ended December 31, 2009, we recognized impairments to these drilling rig parts and tubular goods held in inventory and sold rod parts held in inventory, recognizing a net loss of $0.4 million.
64
Table of Contents
Index to Financial Statements
Interest expense. In December 2010, we borrowed $25.0 million under our revolving credit agreement to finance a portion of our working capital requirements and capital expenditures. At December 31, 2010, the interest rate on the outstanding borrowings was approximately 1.6%. We had no borrowings under the credit agreement in 2009, and as a result, we incurred no interest expense for the year ended December 31, 2009.
Interest and other income. Our interest and other income decreased by approximately $0.4 million to approximately $0.4 million, or a decrease of about 53%, for the year ended December 31, 2010 as compared to the year ended December 31, 2009. The decrease in our interest and other income was due primarily to a decrease in the average balances of our cash and cash equivalents and certificates of deposit on which we receive interest income during the year ended December 31, 2010 as compared to the year ended December 31, 2009. Our cash and cash equivalents and certificates of deposit decreased to $23.4 million at December 31, 2010 from $119.9 million at December 31, 2009, as we used cash during this period primarily to acquire additional leasehold acreage in the Eagle Ford shale play in south Texas and in the core area of the Haynesville shale play in northwest Louisiana and to fund our operated and non-operated drilling and completion activities in both areas.
Total income tax provision (benefit). We recorded a total income tax provision of approximately $3.5 million for the year ended December 31, 2010 as compared to a total income tax benefit of approximately $9.9 million recorded for the year ended December 31, 2009. For the year ended December 31, 2010, we recorded a current income tax benefit of approximately $1.4 million, which was attributable to a refund of U.S federal income taxes received by us, and we also recorded a deferred income tax provision of $4.9 million consistent with the increase in our income before income taxes for that year. For the year ended December 31, 2009, we recorded a current income tax benefit of approximately $2.3 million, primarily attributable to a net refund of U.S. federal income taxes and a refund of income taxes from the state of Louisiana. We also recorded a deferred income tax benefit of approximately $7.6 million, primarily attributable to the full-cost ceiling impairment recorded in 2009. Our effective tax rate for the year ended December 31, 2010 was 35.57% and we had a net loss for the year ended December 31, 2009.
Year Ended December 31, 2009 Compared to Year Ended December 31, 2008
Production taxes and marketing. Our production taxes and marketing expenses decreased approximately $0.6 million to $1.1 million, or a decrease of about 34%, during the year ended December 31, 2009 as compared to the year ended December 31, 2008. The decrease in our production taxes and marketing expenses was due primarily to a decrease of about 38% in our oil and natural gas revenues to $19.0 million for the year ended December 31, 2009 from $30.6 million for the year ended December 31, 2008. Because our production increased 51% from 3.3 Bcfe to 5.0 Bcfe during these respective periods, our production taxes and marketing expenses on a unit-of-production basis decreased to $0.22 per Mcfe during the year ended December 31, 2009 from $0.50 per Mcfe for the year ended December 31, 2008.
Lease operating expenses. Our lease operating expenses increased approximately $58,000 to $4.7 million, or an increase of about 1%, during the year ended December 31, 2009 as compared to the year ended December 31, 2008. During these respective periods, however, our production increased 51%, from 3.3 Bcfe to 5.0 Bcfe. We began producing natural gas from the Haynesville shale in June 2009 and additional Haynesville wells began producing with corresponding sales during the latter part of 2009. Despite this production growth in 2009, our lease operating expenses increased only slightly due to the fact that the unit lease operating costs associated with the Haynesville production were much less than those associated with the Cotton Valley production, which made up the majority of our production during 2008.
65
Table of Contents
Index to Financial Statements
This is primarily due to the greater salt water disposal costs associated with the Cotton Valley production. As a result, our unit lease operating costs decreased to $0.94 per Mcfe during the year ended December 31, 2009 from $1.41 per Mcfe during the year ended December 31, 2008, or a decrease of about 33%.
Depletion, depreciation and amortization. Our depletion, depreciation and amortization expenses decreased $1.4 million to $10.7 million, or a decrease of about 11%, during the year ended December 31, 2009 as compared to the year ended December 31, 2008. Our depletion, depreciation and amortization expenses decreased despite the fact that our production grew 51% from 3.3 Bcfe to 5.0 Bcfe during these respective periods. This decrease was due to the fact that the finding and development costs associated with our Haynesville shale production have been less than the finding and development costs associated with our production from the Cotton Valley and other formations. As a result, our depletion, depreciation and amortization expenses on a unit-of-production basis decreased to $2.15 per Mcfe for the year ended December 31, 2009 from $3.67 per Mcfe for the year ended December 31, 2008.
Accretion of asset retirement obligations. Our accretion of asset retirement obligations expenses increased approximately $46,000 to $137,000, or an increase of about 51%, during the year ended December 31, 2009 as compared to the year ended December 31, 2008. The increase in our accretion of asset retirement obligations was due primarily to the addition of new wells through our drilling of operated wells and our participation in the drilling of non-operated wells.
Full-cost ceiling impairment. At December 31, 2009, the net capitalized costs of our oil and natural gas properties less related deferred income taxes exceeded the full-cost ceiling by $16.3 million. As a result, we recorded an impairment charge of $25.2 million to the net capitalized costs of our oil and natural gas properties and a deferred income tax credit of $8.9 million. A corresponding charge of $25.2 million was also recorded to the consolidated statement of operations for the year ended December 31, 2009. At December 31, 2008, the net capitalized costs of our oil and natural gas properties less related deferred income taxes exceeded the full-cost ceiling by $14.3 million. As a result, we recorded an impairment charge of $22.2 million to the net capitalized costs of our oil and natural gas properties and a deferred income tax credit of $7.9 million. A corresponding charge of $22.2 million was also recorded in the consolidated statement of operations for the year ended December 31, 2008.
General and administrative. Our general and administrative expenses decreased by $1.1 million to $7.1 million, or a decrease of about 14%, for the year ended December 31, 2009 as compared to the year ended December 31, 2008. The decrease in our general and administrative expenses was due primarily to a decrease in compensation expenses between the respective periods. In July 2008, we paid a special cash performance bonus of approximately $1.7 million to eligible employees in recognition of the significant increase in the value of our assets resulting from the sale of a portion of our Haynesville shale exploration and development rights in northwest Louisiana. We did not make any such extraordinary cash bonus payments to our employees during the year ended December 31, 2009; however, the decrease in bonus compensation in 2009 as compared to 2008 was offset to some degree by additional compensation expense associated with the hiring of new staff and the general increase in the costs to conduct our business during the year ended December 31, 2009. As a result of our increased oil and natural gas production, however, our general and administrative expenses decreased by 43% on a unit-of-production basis to $1.42 per Mcfe for the year ended December 31, 2009 as compared to $2.50 per Mcfe for the year ended December 31, 2008.
Net gain (loss) on asset sales and inventory impairment. Our net gain (loss) on asset sales and inventory impairment decreased by $137.4 million to a net loss of approximately $0.4 million for the year ended December 31, 2009 as compared to a net gain of $137.0 million for the year ended December 31,
66
Table of Contents
Index to Financial Statements
2008. During the year ended December 31, 2009, we recognized impairments to drilling rig parts and tubular goods held in inventory and sold rod parts held in inventory, recognizing a net loss of $0.4 million. During the year ended December 31, 2008, we sold a portion of our Haynesville shale exploration and development rights in northwest Louisiana to a subsidiary of Chesapeake Energy Corporation and recognized a gain of $137.0 million on the sale. We also recognized a loss of about $44,000 on the sale of tubular goods held in inventory during 2008.
Interest expense. We had no borrowings under our credit agreement in 2009 or 2008. As a result, we had no interest expense for the years ended December 31, 2009 and 2008.
Interest and other income. Our interest and other income expenses decreased by $2.2 million to $0.8 million, or a decrease of about 74%, for the year ended December 31, 2009 as compared to the year ended December 31, 2008. The decrease in our interest and other income expenses was due primarily to a decrease in the average balances of our cash and cash equivalents and certificates of deposit on which we receive interest income during the respective periods. Our cash and cash equivalents and certificates of deposit decreased to $119.9 million at December 31, 2009 from $171.6 million at December 31, 2008, as we used cash during this period primarily to acquire additional leasehold acreage in the core area of the Haynesville shale play in northwest Louisiana and to fund our operated and non-operated drilling and completion activities.
Total income tax provision (benefit). We recorded a total income tax benefit of approximately $9.9 million for the year ended December 31, 2009 as compared to a total income tax provision of approximately $20.0 million for the year ended December 31, 2008. For the year ended December 31, 2009, we recorded a current income tax benefit of approximately $2.3 million, primarily attributable to a net refund of U.S. federal income taxes and a refund of income taxes from the state of Louisiana. We also recorded a deferred income tax benefit of approximately $7.6 million, primarily attributable to the full-cost ceiling impairment recorded in 2009. For the year ended December 31, 2008, we recorded a current income tax provision of approximately $10.4 million which reflects the payment of $9.4 million in U.S. federal alternative minimum tax and approximately $1.0 million in income tax to the state of Louisiana. The alternative minimum tax payment resulted from exhausting our alternative minimum tax net operating loss due to the gain realized from the sale of certain of our Haynesville shale assets. See “Business — Other Significant Prior Events.” We also recorded a deferred income tax provision of approximately $9.6 million, reflecting both the large increase in our income before income taxes for the year, partially offset by the deferred income tax benefit attributable to the full-cost ceiling impairment recorded in 2008, and by the reversal of a previously established valuation allowance of approximately $24.7 million. We had a net loss for the year ended December 31, 2009 and our effective tax rate for the year ended December 31, 2008 was 16.16%.
Liquidity and Capital Resources
Our primary sources of liquidity to date have been capital contributions from private investors, our cash flows from operations and the proceeds from a significant sale of a portion of our assets in 2008. See “Business — Other Significant Prior Events.” Our primary use of capital has been for the acquisition, exploration and development of oil and natural gas properties. We continually evaluate potential capital sources, including equity and debt financings, in order to meet our planned capital expenditures and liquidity requirements. Our future success in growing proved reserves and production will be highly dependent on our ability to access outside sources of capital. At July 31, 2011, we had a cash balance of $8.0 million.
67
Table of Contents
Index to Financial Statements
In March 2008, we entered into a credit agreement which was amended and restated in May 2011. Our credit agreement had a borrowing base of $80.0 million at June 30, 2011. At June 30, 2011, we had $60.0 million in borrowings outstanding and $375,000 in outstanding letters of credit issued pursuant to the credit agreement. Approximately $19.6 million remained available for additional borrowings. Any borrowings under the credit agreement are secured by mortgages on a significant portion of our oil and natural gas producing properties and by the equity interests of all our subsidiaries. At June 30, 2011, our outstanding borrowings bore interest at the rate of 2.1%. For more information regarding our revolving credit agreement, see “— Credit Agreement.”
In addition to our revolving borrowings under the credit agreement, in May 2011, we borrowed $25 million in a term loan pursuant to the credit agreement. The term loan is due and payable on December 31, 2011 and there is no penalty for prepayment. The term loan bears interest at an annual rate of 5% plus a Eurodollar-based rate, which equated to approximately 5.3% at June 30, 2011. For more information regarding our term loan, see “— Credit Agreement.”
We actively review acquisition opportunities on an ongoing basis. While we believe the net proceeds from this offering, together with our cash flows and future potential borrowings under our revolving credit agreement, will be adequate to fund our capital expenditure requirements and any acquisitions of interests and acreage for 2011 and 2012, funding for future acquisitions of interests and acreage or our future capital expenditure requirements may require additional sources of financing, which may not be available. See “Use of Proceeds.”
Our cash flows for the years ended December 31, 2010, 2009 and 2008 and the three months ended March 31, 2011 and 2010, are presented below:
| Year
Ended December 31, |
Three Months
Ended March 31, |
|||||||||||||||||||
| 2010 | 2009 | 2008 | 2011 | 2010 | ||||||||||||||||
| (In thousands) | (Unaudited) | (Unaudited) | ||||||||||||||||||
| Net cash provided by operating activities |
$ | 27,273 | $ | 1,791 | $ | 25,851 | $ | 12,732 | $ | 9,101 | ||||||||||
| Net cash provided by (used in) investing activities |
(147,334 | ) | (49,415 | ) | 115,481 | (35,024 | ) | (21,743 | ) | |||||||||||
| Net cash provided by financing activities |
36,891 | 1,086 | 419 | 15,693 | 31 | |||||||||||||||
|
|
|
|
|
|
|
|
|
|
|
|||||||||||
| Net change in cash and cash equivalents |
$ | (83,170 | ) | $ | (46,538 | ) | $ | 141,751 | $ | (6,599 | ) | $ | (12,611 | ) | ||||||
Cash Flows Provided by Operating Activities
Net cash provided by operating activities increased by $3.6 million to $12.7 million for the three months ended March 31, 2011 as compared to net cash provided by operating activities of $9.1 million for the three months ended March 31, 2010. The increase in cash flows provided by operating activities reflects primarily an increase in our oil and natural gas production to 3.4 Bcfe from 1.8 Bcfe for the three months ended March 31, 2011 as compared to the three months ended March 31, 2010. The increase in cash flows was not proportionate with the increase in production due primarily to the decline in the price we received for our natural gas production in the comparable periods. Our accounts payable and accrued liabilities were approximately $35.8 million at March 31, 2011 as a result of operated horizontal wells that we were drilling and/or completing in the Haynesville and Eagle Ford shale plays during the first three months of 2011.
Net cash provided by operating activities increased by $25.5 million to $27.3 million for the year ended December 31, 2010 as compared to net cash provided by operating activities of $1.8 million for the year ended December 31, 2009. The increase in cash flows provided by operations reflects an increase in our production to 8.6 Bcfe from 5.0 Bcfe and an increase in the average prices we received for oil and natural gas production for the year ended December 31, 2010 as compared to the year ended December 31,
68
Table of Contents
Index to Financial Statements
2009. Our accounts payable and accrued liabilities were approximately $26.8 million at December 31, 2010 as a result of operated horizontal wells that we were drilling and/or completing in the Haynesville and Eagle Ford shale plays and in the Cotton Valley formation during the fourth quarter of 2010. Our accounts payable and accrued liabilities were $7.3 million at December 31, 2009 as we were drilling and completing only one operated horizontal Haynesville shale well at that time.
Net cash provided by operating activities decreased by $24.1 million to $1.8 million for the year ended December 31, 2009 from $25.9 million for the year ended December 31, 2008. Although our production increased to 5.0 Bcfe for the year ended December 31, 2009 from 3.3 Bcfe for the year ended December 31, 2008, the average prices we received for oil and natural gas declined sharply between the respective periods. Our accounts payable and accrued liabilities were approximately $7.3 million at December 31, 2009 as we were drilling and/or completing only one operated horizontal Haynesville shale well at that time. Our accounts payable and accrued liabilities were approximately $25.2 million at December 31, 2008 as we were drilling and/or completing both operated vertical Cotton Valley wells and our first operated horizontal wells in the Haynesville shale play at that time.
Our operating cash flows are sensitive to a number of variables, including changes in our production and volatility of oil and natural gas prices between reporting periods. Regional and worldwide economic activity, weather, infrastructure capacity to reach markets and other variable factors significantly impact the prices of oil and natural gas. These factors are beyond our control and are difficult to predict. For additional information on the impact of changing prices on our financial position, see “— Quantitative and Qualitative Disclosures About Market Risk” below. See also “Risk Factors — Our success is dependent on the prices of oil and natural gas. The substantial volatility in these prices may adversely affect our financial condition and our ability to meet our capital expenditure requirements and financial obligations.”
Cash Flows Provided by (used in) Investing Activities
Net cash used in investing activities increased by $13.3 million to $35.0 million for the three months ended March 31, 2011 from $21.7 million for the three months ended March 31, 2010. This increase in net cash used in investing activities reflects primarily an increase of $11.9 million in our oil and natural gas properties capital expenditures for the three months ended March 31, 2011 as compared to the three months ended March 31, 2010. The increased oil and natural gas properties capital expenditures for the three months ended March 31, 2011 are primarily due to increased exploration and development expenditures associated with our operated and non-operated drilling and completion activities in the Eagle Ford and Haynesville plays, as compared to the three months ended March 31, 2010.
Net cash used in investing activities increased by $97.9 million to $147.3 million for the year ended December 31, 2010 from $49.4 million for the year ended December 31, 2009. This increase in net cash used in investing activities reflects primarily an increase of $104.1 million in our oil and natural gas properties capital expenditures for the year ended December 31, 2010 as compared to the year ended December 31, 2009. The increased oil and natural gas properties capital expenditures for the year ended December 31, 2010 are due to the acquisition of leasehold acreage in the Eagle Ford shale play and the acquisition of additional leasehold acreage in the Haynesville shale play, as well as exploration and development expenditures associated with our operated and non-operated drilling and completion activities in both plays, as compared to the year ended December 31, 2009.
Net cash used in investing activities was $49.4 million for the year ended December 31, 2009 as compared to net cash provided by investing activities of $115.5 million for the year ended December 31,
69
Table of Contents
Index to Financial Statements
2008. This decrease of $164.9 million in net cash provided by investing activities between the respective periods reflects primarily the proceeds received from the sale of a portion of our Haynesville rights in northwest Louisiana to a subsidiary of Chesapeake Energy Corporation in 2008. In addition, our oil and natural gas properties capital expenditures decreased by $49.9 million between the two periods owing to a decrease in our operated drilling activity and related capital expenditures in 2009.
Expenditures for the acquisition, exploration and development of oil and natural gas properties are the primary use of our capital resources. We anticipate investing $379.7 million in capital for acquisition, exploration and development activities in 2011 and 2012 as follows:
| Amount (in millions) |
||||
| Exploration and development drilling and associated infrastructure |
$ | 313.1 | ||
| Leasehold acquisition |
65.3 | |||
| Other capital expenditures, 2-D and 3-D seismic data and recompletions of existing wells |
1.3 | |||
|
|
|
|||
| Total |
$ | 379.7 | ||
|
|
|
|||
For further information regarding our anticipated capital expenditure budgets in 2011 and 2012, see “Business—Overview.”
From January 1, 2011 through July 31, 2011, we spent approximately $84.2 million in capital expenditures (or 57% of our 2011 capital expenditures budget). From August 1, 2011 through December 31, 2011, we anticipate that our capital expenditures will be approximately $64.7 million.
Our 2011 and 2012 capital expenditures may be adjusted as business conditions warrant. The amount, timing and allocation of capital expenditures is largely discretionary and within our control. If oil and natural gas prices decline or costs increase significantly, we could defer a significant portion of our anticipated capital expenditures until later periods to conserve cash or to focus on those projects that we believe have the highest expected returns and potential to generate near-term cash flows. We routinely monitor and adjust our capital expenditures in response to changes in prices, availability of financing, drilling, completion and acquisition costs, industry conditions, the timing of regulatory approvals, the availability of rigs, success or lack of success in our exploration and development activities, contractual obligations and other factors both within and outside our control.
Cash Flows Provided by Financing Activities
Net cash provided by financing activities was $15.7 million for the three months ended March 31, 2011 as compared to net cash provided by financing activities of $0.3 million for the three months ended March 31, 2010. This is due primarily to additional borrowings under our revolving credit agreement of $15.0 million to fund our working capital requirements during the three months ended March 31, 2011. In addition, in January 2011, we sold 53,772 shares of our Class A common stock in a private placement and received net proceeds of approximately $0.6 million.
Net cash provided by financing activities was $36.9 million for the year ended December 31, 2010 as compared to net cash provided by financing activities of $1.1 million for the year ended December 31, 2009. For the year ended December 31, 2010, the most significant financing activities occurred in the fourth quarter of 2010. During that time, we sold approximately 1.9 million shares of our Class A common stock in a private placement and received net proceeds of approximately $21.0 million, and we borrowed $25.0 million under our revolving credit agreement. In addition, in April 2010, we repurchased 1,000,000 shares
70
Table of Contents
Index to Financial Statements
of Class A common stock from five shareholders, all advised by Wellington Management Company, for a total of $9.0 million. We also received proceeds of approximately $2.0 million from the periodic exercise of stock options for the year ended December 31, 2010. For the year ended December 31, 2009, the most significant financing activities occurred in April 2009 when we repurchased approximately 5.4 million shares of Class A common stock from Gandhara Capital, one of our largest shareholders at the time, for a total of $27.1 million and in May through September 2009 when we sold approximately 5.0 million shares of Class A common stock in a private placement and received net proceeds of approximately $28.0 million. We also received proceeds of approximately $1.3 million from the periodic exercise of stock options for the year ended December 31, 2009.
Net cash provided by financing activities was $1.1 million for the year ended December 31, 2009 as compared to $0.4 million for the year ended December 31, 2008. For the year ended December 31, 2009, the most significant financing activities occurred in April 2009 when we repurchased approximately 5.4 million shares of Class A common stock from Gandhara Capital, one of our largest shareholders at the time, at $5.00 per share for a total of $27.1 million and in May through September 2009 when we sold approximately 5.0 million shares of Class A common stock in a private placement and received net proceeds of approximately $28.0 million. We also received proceeds of approximately $1.3 million from the periodic exercise of stock options for the year ended December 31, 2009. For the year ended December 31, 2008, the most significant financing activities were the periodic exercise of stock options for which we received aggregate net proceeds of approximately $1.0 million.
Credit Agreement
In March 2008, we entered into a senior secured revolving credit agreement with Comerica Bank, N.A. to establish a secured revolving credit facility for a term of five years, and in May 2011 we entered into an amended and restated credit agreement with Comerica Bank, N.A. Any borrowings under the credit agreement are secured by mortgages on a significant portion of our oil and natural gas producing properties and by the equity interests of all our subsidiaries. In addition, all obligations under the credit agreement are guaranteed by our subsidiaries. The credit agreement matures in March 2013. As a result of the corporate reorganization, MRC Energy Company is the borrower under the credit agreement. Matador Resources Company has guaranteed MRC Energy Company’s obligations under the credit agreement and pledged its stock in MRC Energy Company as collateral.
The amount of the borrowings under the agreement is limited to the lesser of $150.0 million or the borrowing base, which is determined semi-annually on May 1 and November 1 by the lenders based primarily on estimates of our proved oil and natural gas reserves, but also on external factors, such as the bank’s lending policies and the bank’s estimates of future oil and natural gas prices, over which we have no control. At July 31, 2011, the borrowing base was $80.0 million. Both we and the bank may each request an unscheduled redetermination of the borrowing base one time during any 12-month period. In the event of a borrowing base increase, we pay a fee to the bank equal to 0.25% of the amount of the increase. If the borrowing base were to be less than the outstanding borrowings under the credit agreement at any time, we would be required to provide additional collateral satisfactory in nature and value to the bank to increase the borrowing base to an amount sufficient to cover such excess or to repay the deficit in equal installments over a period of six months.
If we borrow funds as a base rate loan, such borrowings will bear interest at a rate equal to the higher of (i) the weighted average of rates used in overnight federal funds transactions with members of the Federal Reserve System plus 1.0% or (ii) the prime rate for Comerica Bank then in effect. If we borrow
71
Table of Contents
Index to Financial Statements
funds as a Eurodollar loan, such borrowings will bear interest at a rate equal to (i) the quotient obtained by dividing (A) the interest rate appearing on Page BBAM of the Bloomberg Financial Markets Information Service by (B) a percentage equal to 1.00 minus the maximum rate during such interest calculation period at which Comerica Bank is required to maintain reserves on Euro-currency Liabilities (as defined in Regulation D of the Board of Governors of the Federal Reserve System), plus (ii) an amount from 1.25% to 1.875% of such outstanding loan depending on the level of borrowings under the agreement. The interest period for Eurodollar borrowings may be one, two, three, six or twelve months as designated by us. An unused facility fee of 0.25% to 0.375%, depending on the unused portion of the borrowing base, is paid quarterly in arrears.
Key financial covenants under the credit agreement require us to maintain (1) a minimum current ratio, which is defined as consolidated total current assets plus the unused availability under the credit agreement divided by consolidated total current liabilities, of 1.0 or greater, and (2) a debt to EBITDA ratio, which is defined as total debt outstanding divided by a rolling four quarter EBITDA calculation, of 4.0 to 1.0 or less.
Our revolving credit agreement contains various covenants that limit our ability to take certain actions, including, but not limited to, the following:
| • | incur indebtedness; |
| • | enter into commodity hedging agreements; |
| • | declare or pay dividends, distributions or redemptions; |
| • | merge or consolidate; and |
| • | engage in certain asset dispositions, including a sale of all or substantially all of our assets. |
If an event of default exists under the credit agreement, the lenders will be able to accelerate the maturity of the credit agreement and exercise other rights and remedies. Events of default include, but are not limited to, the following events:
| • | failure to pay any principal or interest on the notes or any reimbursement obligation under any letter of credit when due or any fees or other amount within certain grace periods; |
| • | failure to perform or otherwise comply with the covenants and obligations in the credit agreement or other loan documents, subject, in certain instances, to certain grace periods; |
| • | bankruptcy or insolvency events involving us or our subsidiaries; and |
| • | a change of control, as defined in the credit agreement. |
We had no borrowings under the credit agreement at December 31, 2009 and 2008. In December 2010, the credit agreement was amended to increase the borrowing base to $55.0 million. At December 31, 2010, we had $25.0 million of outstanding borrowings and $50,000 in letters of credit issued pursuant to the credit agreement. At December 31, 2010, all borrowings under the credit agreement were Eurodollar loans, and the interest rate on the outstanding borrowings was approximately 1.6%. We had an additional $325,000 in letters of credit secured by certificates of deposit at Comerica Bank, N.A. at December 31, 2010.
We believe that we were in compliance with the terms of our credit agreement and with all our bank covenants at December 31, 2010, 2009 and 2008. We obtained a written extension from Comerica Bank, N.A. until July 15, 2011 to comply with a covenant under the credit agreement requiring submission of audited financial statements within 120 days of the prior year end and the submission of quarterly financial
72
Table of Contents
Index to Financial Statements
statements within 45 days of the prior quarter end. We submitted both sets of financial statements to Comerica Bank, N.A. prior to this deadline.
At June 30, 2011, the borrowing base available for revolving borrowings was $80.0 million, and we had $60.0 million in borrowings outstanding under the credit agreement, an additional $375,000 in outstanding letters of credit issued pursuant to the credit agreement and approximately $19.6 million available for additional borrowings. At June 30, 2011, our outstanding revolving borrowings bore interest at the rate of approximately 2.1%. The outstanding revolving borrowings under our credit agreement mature in March 2013.
In addition to our revolving borrowings, in May 2011, we also borrowed $25.0 million in a term loan pursuant to the credit agreement to help finance the acquisition of the Eagle Ford shale acreage from Orca ICI Development, JV in Karnes, DeWitt, Wilson and Gonzales Counties, Texas. The term loan is due and payable on December 31, 2011 and there is no penalty for prepayment. The term loan bears interest at an annual rate of 5% plus a Eurodollar-based rate, which equated to approximately 5.3% at June 30, 2011, and while any principal and interest under the term loan is outstanding, the revolving borrowings under the credit agreement bear interest at the maximum annual rate of 1.875% plus a Eurodollar-based rate which equated to approximately 2.1% at June 30, 2011. We intend to repay the term loan in full with the net proceeds from this offering. We also intend to use a portion of the net proceeds from this offering to repay $10.0 million of our outstanding revolving borrowings.
Obligations and Commitments
We had the following material contractual obligations and commitments at June 30, 2011 except as indicated:
| Payments Due by Period | ||||||||||||||||||||
| Total | Less Than 1 Year |
1 -3 Years | 3 -5 Years | More Than 5 Years |
||||||||||||||||
| (in thousands) | ||||||||||||||||||||
| Contractual Obligations: |
||||||||||||||||||||
| Revolving credit borrowings and term loan, including letters of credit(1) |
$ | 85,375 | $ | 25,375 | $ | 60,000 | $ | – | $ | – | ||||||||||
| Office lease |
6,243 | – | 1,150 | 1,178 | 3,915 | |||||||||||||||
| Non-operated drilling commitments(2) |
4,000 | 4,000 | – | – | – | |||||||||||||||
| Drilling rig contracts(3) |
5,500 | 5,500 | – | – | – | |||||||||||||||
| Geological and geophysical contracts(4) |
404 | 404 | – | – | – | |||||||||||||||
| Employee bonuses |
1,240 | – | 1,240 | – | – | |||||||||||||||
| Asset retirement obligations(5) |
3,809 | 335 | 442 | 822 | 2,210 | |||||||||||||||
|
|
|
|
|
|
|
|
|
|
|
|||||||||||
| Total contractual cash obligations |
$ | 106,571 | $ | 35,614 | $ | 62,832 | $ | 2,000 | $ | 6,125 | ||||||||||
|
|
|
|
|
|
|
|
|
|
|
|||||||||||
| (1) | At June 30, 2011, we had $60.0 million in revolving borrowings outstanding under our credit agreement, an additional $375,000 in outstanding letters of credit issued pursuant to the credit agreement and $25.0 million outstanding under the term loan. The term loan matures on December 31, 2011, and our borrowings under our revolving credit agreement mature in March 2013. These amounts do not include estimated interest on the obligations, because our revolving borrowings have short-term interest periods, and we are unable to determine what our borrowing costs may be in future periods. |
| (2) | At June 30, 2011, we had outstanding commitments to participate in the drilling and completion of 46 gross and 1.3 net non-operated wells in the Haynesville shale play. Our working interest in these wells varies from 0.2% to 18.7%, and most of these wells were in progress at June 30, 2011. If all these wells are drilled and completed, we estimate that we will have a minimum remaining commitment for our participation in these wells of approximately $4.0 million at June 30, 2011, which we expect to incur within the next 12 months. |
| (3) | At July 31, 2011, we had entered into two drilling rig contracts to explore and develop our Eagle Ford acreage in south Texas. We anticipate that the first rig will begin drilling operations on our acreage in August 2011, with the second rig beginning drilling operations on our acreage in October 2011. Both contracts are for a term of six months. Should we elect to terminate both contracts prior to |
73
Table of Contents
Index to Financial Statements
| initiating drilling operations, and if the drilling contractor were unable to secure work for both rigs prior to the end of their respective contract terms, we would incur an aggregate termination obligation of approximately $5.5 million. |
| (4) | Includes fees pending for two 3-D seismic acquisition projects across our Eagle Ford acreage in south Texas and for core analysis to be provided by a division of Core Laboratories, LP. |
| (5) | Asset retirement obligations at March 31, 2011. |
Critical accounting policies and estimates
We have outlined below certain accounting policies that are of particular importance to the presentation of our financial condition and results of operations and require the application of significant judgment or estimates by our management.
Basis of Presentation
The consolidated financial statements include the accounts of Matador Resources Company and its four wholly owned subsidiaries, Matador Production Company, Longwood Gathering and Disposal Systems GP, Inc., MRC Permian Company and MRC Rockies Company, as well as the accounts of Longwood Gathering and Disposal Systems, LP (our consolidated financial statements for the years ended December 31, 2010, 2009 and 2008 reflect our organizational structure prior to the consummation of the holding company merger; see “Corporate Reorganization”). Our consolidated financial statements have been prepared in accordance with GAAP. Our operations are conducted in one segment, generally referred to as the exploration and production industry. All significant intercompany balances and transactions have been eliminated in consolidation.
Use of Estimates
The discussion and analysis of our financial condition and results of operations are based upon our consolidated financial statements. The preparation of our financial statements requires us to make estimates and assumptions that affect the amounts reported in the financial statements and accompanying notes. These estimates and assumptions may also affect disclosure of contingent assets and liabilities at the date of the financial statements and the reported amounts of revenues and expenses during the reporting period. We evaluate our estimates and assumptions on a regular basis. We base our estimates on historical experience and various assumptions that are believed to be reasonable under the circumstances, the results of which form the basis for making judgments about the carrying values of assets and liabilities that are not readily apparent from other sources. While we believe our estimates are reasonable, changes in facts and assumptions or the discovery of new information may result in revised estimates. Actual results could differ from these estimates and assumptions used in preparation of our consolidated financial statements.
Our consolidated financial statements are based on a number of significant estimates. These include estimates of oil and natural gas revenues, accrued assets and liabilities, stock-based compensation, valuation of derivative financial instruments and oil and natural gas reserves. The estimates of oil and natural gas reserves quantities and future net cash flows are the basis for the calculations of depletion and impairment of oil and natural gas properties, as well as estimates of asset retirement obligations and certain tax accruals. Our oil and natural gas reserves estimates, which are inherently imprecise and based upon many factors beyond our control, are prepared by our engineering staff in accordance with guidelines established by the SEC and then audited for their reasonableness and conformance with SEC guidelines and generally accepted petroleum engineering and evaluation principles by independent petroleum engineers, except for certain interim periods as noted.
74
Table of Contents
Index to Financial Statements
Accounts Receivable
We sell our oil and natural gas production to various purchasers. Due to the nature of the markets for oil and natural gas, we do not believe that the loss of any one purchaser would significantly impact operations. In addition, we may participate with industry partners in the drilling, completion and operation of oil and natural gas wells. Substantially all of our accounts receivable are due from either purchasers of oil and natural gas or participants in oil and natural gas wells for which we serve as the operator. Accounts receivable are due within 30 to 45 days of the production or billing date and are stated at amounts due from purchasers and industry partners.
We review our need for an allowance for doubtful accounts on a periodic basis, and determine the allowance, if any, by considering the length of time past due, previous loss history, future net revenues of the debtor’s ownership interest in oil and natural gas properties we operate and the debtor’s ability to pay its obligations, among other things. We have no allowance for doubtful accounts related to our accounts receivable for any reporting period presented.
Property and Equipment
We use the full-cost method of accounting for our investments in oil and natural gas properties. Using this method of accounting, all costs associated with the acquisition, exploration and development of oil and natural gas properties and reserves, including unproved and unevaluated property costs, are capitalized as incurred. Internal costs are capitalized only to the extent they are directly related to acquisition, exploration or development activities and do not include any costs related to production, selling or general corporate administrative activities. Exploration and development costs include dry-well costs, geological and geophysical costs, direct overhead related to exploration and development activities and other costs incurred for the purpose of finding oil and natural gas reserves.
If the net capitalized costs of evaluated oil and natural gas properties less related deferred income taxes exceed the estimated present value of after-tax future net cash flows from proved oil and natural gas reserves, discounted at 10%, such excess is charged to operations as a full-cost ceiling impairment. A discount factor of 10% is used for purposes of computing the full-cost ceiling in accordance with SEC guidelines. The present value at 10% discount of future after-tax net cash flows is not intended to represent the replacement cost or fair market value of our oil and natural gas properties.
The estimated present value of after-tax future net cash flows from proved oil and natural gas reserves is highly dependent on the commodity prices used in these estimates. These estimates are determined in accordance with guidelines established by the SEC for estimating and reporting oil and natural gas reserves. Under these guidelines, oil and natural gas reserves are estimated using then-current operating and economic conditions, with no provision for price and cost escalations in future periods except by contractual arrangements. In 2009, the SEC provided new guidelines for estimating and reporting oil and natural gas reserves. Under these new guidelines, the commodity prices used to estimate oil and natural gas reserves were changed from last-day-of-the-year prices to an unweighted, arithmetic average of first-day-of-the-month prices for the previous 12-month period.
Capitalized costs of oil and natural gas properties are amortized using the unit-of-production method based upon production and estimates of proved reserves quantities. Unproved and unevaluated property costs are excluded from the amortization base used to determine depletion. Unproved and unevaluated properties are assessed for impairment on a periodic basis or more often if deemed necessary based upon changes in operating or economic conditions. This assessment includes consideration of the following
75
Table of Contents
Index to Financial Statements
factors, among others: the assignment of proved reserves, geological and geophysical evaluations, intent to drill, remaining lease term and drilling activity and results. Upon impairment, the costs of the unproved and unevaluated properties are immediately included in the amortization base. Exploratory dry holes are included in the amortization base immediately upon the determination that the well is not productive.
Sales of oil and natural gas properties are accounted for as adjustments to net capitalized costs with no gain or loss recognized, unless such adjustments would significantly alter the relationship between net capitalized costs and proved reserves of oil and natural gas. All costs related to production activities and maintenance and repairs are expensed as incurred. Significant workovers that increase the properties’ reserves are capitalized.
Other property and equipment are stated at cost. Computer equipment, furniture, software and other equipment are depreciated over their useful life (five to seven years) using the straight-line method. Support equipment and facilities include the pipelines and salt water disposal systems owned by Longwood Gathering and Disposal Systems, LP and are depreciated over a 30-year useful life using the straight-line, mid-month convention method. Leasehold improvements are depreciated over the lesser of their useful life or the term of the lease.
Asset Retirement Obligations
We recognize the fair value of an asset retirement obligation in the period in which it is incurred if a reasonable estimate of fair value can be made. The asset retirement obligation is recorded as a liability at its estimated present value, with an offsetting increase recognized in oil and natural gas properties or support equipment and facilities on the balance sheet. Periodic accretion of the discounted value of the estimated liability is recorded as an expense in the consolidated statement of operations. In general, our future asset retirement obligations relate to future costs associated with plugging and abandonment of our oil and natural gas wells, removal of equipment and facilities from leased acreage and returning such land to its original condition. The amounts recognized are based on numerous estimates and assumptions, including future retirement costs, future recoverable quantities of oil and natural gas, future inflation rates and the credit-adjusted risk-free interest rate. Revisions to the liability can occur due to changes in our estimate or if federal or state regulators enact new plugging and abandonment requirements. At the time of actual plugging and abandonment of our oil and natural gas wells, we include any gain or loss associated with the operation in the amortization base to the extent that the actual costs are different from the estimated liability.
Derivative Financial Instruments
From time to time, we use derivative financial instruments to hedge our exposure to commodity price risk associated with natural gas prices. These instruments consist of put and call options in the form of costless collars. Our derivative financial instruments are recorded on the balance sheet as either an asset or a liability measured at fair value. We have elected not to apply hedge accounting for our existing derivative financial instruments, and as a result, we recognize the change in derivative fair value between reporting periods currently in our consolidated statement of operations. The fair value of our derivative financial instruments is determined based on our counterparty’s valuation model which we verify for its reasonableness with an independent third party valuation using observable, market-corroborated inputs. Realized gains and realized losses from the settlement of derivative financial instruments and unrealized gains and unrealized losses from valuation changes in the remaining unsettled derivative financial instruments are reported under “Revenues” in our consolidated statement of operations.
76
Table of Contents
Index to Financial Statements
Revenue Recognition
We follow the sales method of accounting for our oil and natural gas revenue, whereby we recognize revenue, net of royalties, on all oil or natural gas sold to purchasers regardless of whether the sales are proportionate to our ownership in the property. Under this method, revenue is recognized at the time the oil and natural gas are produced and sold, and we accrue for revenue earned but not yet received.
Stock-based Compensation
In 2003, our board of directors and shareholders approved the Matador Resources Company 2003 Stock and Incentive Plan, or the 2003 Plan. See “Compensation of Named Executive Officers — Stock Options.” The persons eligible to receive awards under the 2003 Plan include our employees, directors, officers, consultants or advisors. The 2003 Plan is administered by our board of directors, which determines the number of options or restricted shares to be granted, the effective dates and terms of the grants, the option or restricted share price and the vesting period. In the absence of an established market for shares of our common stock as a private company, the board of directors determines the fair market value of our common stock for purposes of awards under the 2003 Plan. We typically use newly issued shares to satisfy option exercises or restricted share grants.
Prior to the completion of this offering, we anticipate adopting the 2011 Long-Term Incentive Plan to be approved by shareholders. This plan will permit the granting of long-term equity and cash incentive awards to our Named Executive Officers, key employees, consultants and non-employee directors. See “Compensation of Named Executive Officers — Long-Term Incentive Plan.”
Non-qualified stock option expense is recognized in our consolidated statement of operations on the date of the grant. Incentive stock options vest over four years, and the associated compensation expense is recognized on a straight-line basis over the vesting period. Prior to November 22, 2010, all of our outstanding stock options were classified as equity instruments, with all stock-based compensation expense measured on the date of grant and recognized over the vesting period, if any. On November 22, 2010, we changed our method of accounting for outstanding stock options, reclassifying all outstanding stock options from equity to liability instruments. This change was made as a result of purchasing shares from certain of our employees to assist them in the exercise of outstanding options of our Class A common stock. As a result, at December 31, 2010, we measured and recognized the fair value of the liability associated with our outstanding stock options using an estimated fair value of our Class A common stock. On occasion, the board of directors grants restricted shares to eligible participants under the 2003 Plan. The fair value of these restricted stock awards are recognized based upon the fair value of our stock as determined by the board of directors on the date of the grant. Depending on the terms of the restricted share grant, the fair value of the award may be recognized on the date of grant in our consolidated statement of operations, or in the case of a restricted share award that vests over time, the fair value of the award is measured on the date of grant and recognized on a straight-line basis over the vesting period.
Income Taxes
We file a United States federal income tax return and several state tax returns, a number of which remain open for examination. The tax years open for examination for the federal tax return are 2007, 2008, 2009 and 2010. The tax years open for examination by the state of Texas are 2008, 2009 and 2010. The tax years open for examination by the state of Louisiana are 2007, 2008, 2009 and 2010. At August 12, 2011, our 2007, 2008 and 2009 income and franchise tax returns were under examination by the state of Louisiana. The tax years open for examination by the state of New Mexico are 2008, 2009 and 2010.
77
Table of Contents
Index to Financial Statements
We account for income taxes using the asset and liability approach for financial accounting and reporting. We evaluate the probability of realizing the future benefits of our deferred tax assets and provide a valuation allowance for the portion of any deferred tax assets where the likelihood of realizing an income tax benefit in the future does not meet the more likely than not criteria for recognition.
We account for uncertainty in income taxes by recognizing the financial statement benefit of a tax position only after determining that the relevant tax authority would more likely than not sustain the position following an audit. For tax positions meeting the more likely than not threshold, the amount recognized in the financial statements is the benefit that has a greater than 50 percent likelihood of being realized upon ultimate settlement with the relevant tax authority.
We have evaluated all tax positions for which the statute of limitations remained open, and we believe that the material positions taken would more likely than not be sustained by examination. When necessary, we would include interest assessed by taxing authorities in “Interest expense” and penalties related to income taxes in “Other expense” on our consolidated statement of operations. At December 31, 2010, 2009 and 2008, we did not record any interest or penalties related to income tax.
Oil and Natural Gas Reserves Quantities and Standardized Measure of Future Net Revenue
Our engineers and technical staff prepare our estimates of oil and natural gas reserves and associated future net revenues. While the SEC has recently adopted rules which allow us to disclose proved, probable and possible reserves, we have elected to present only proved reserves in this prospectus. The SEC’s revised rules define proved reserves as the quantities of oil and natural gas, which, by analysis of geoscience and engineering data, can be estimated with reasonable certainty to be economically producible — from a given date forward, from known reservoirs, and under existing economic conditions, operating methods and government regulations — prior to the time at which contracts providing the right to operate expire, unless evidence indicates that renewal is reasonably certain, regardless of whether deterministic or probabilistic methods are used for the estimation. The project to extract the hydrocarbons must have commenced or the operator must be reasonably certain that it will commence the project within a reasonable time. Our engineers and technical staff must make many subjective assumptions based on their professional judgment in developing reserves estimates. Reserves estimates are updated at least annually and consider recent production levels and other technical information about each well. Estimating oil and natural gas reserves is complex and is not exact because of the numerous uncertainties inherent in the process. The process relies on interpretations of available geological, geophysical, petrophysical, engineering and production data. The extent, quality and reliability of both the data and the associated interpretations can vary. The process also requires certain economic assumptions, including, but not limited to, oil and natural gas prices, revenues, development expenditures, operating expenses, capital expenditures and taxes. Actual future production, oil and natural gas prices, revenues, taxes, development expenditures, operating expenses and quantities of recoverable oil and natural gas will most likely vary from our estimates. Accordingly, reserves estimates are generally different from the quantities of oil and natural gas that are ultimately recovered. Any significant variance could materially and adversely affect our future reserves estimates, financial position, results of operations and cash flows. We cannot predict the amounts or timing of future reserves revisions. If such revisions are significant, they could significantly affect future amortization of capitalized costs and result in impairment of assets that may be material.
Recent Accounting Pronouncements
Subsequent Events. We incorporate the accounting and disclosure requirements for subsequent events in our financial statements. In accordance with GAAP, new terminology was introduced recently which
78
Table of Contents
Index to Financial Statements
defines the date through which management must evaluate subsequent events and lists the circumstances under which an entity must recognize and disclose events or transactions occurring after the balance sheet date. We adopted this guidance at December 31, 2009.
Oil and Natural Gas Reserves Reporting Requirements. In January 2009, the SEC issued The Modernization of Oil and Gas Reporting, Final Rule. In January 2010, the Financial Accounting Standards Board, or FASB, amended Topic 932, Extractive Activities — Oil and Gas to align with this rule. The changes are designed to modernize and update the oil and natural gas disclosure requirements to align them with current practices and changes in technology. The new rules made a number of important changes including the following: (i) expanded the definition of oil and natural gas producing activities to include the extraction of saleable hydrocarbons from oil sands, shale, coalbeds or other nonrenewable natural resources, (ii) amended the required price for estimating economic quantities for year-end reserves reporting to be the unweighted, arithmetic average of the first-day-of-the-month price for each month within the previous 12-month period, rather than the year-end price and (iii) permitted proved reserves to be claimed beyond those development spacing areas that are immediately adjacent to developed spacing areas if it can be established with reasonable certainty that these reserves are economically producible. At December 31, 2009, we adopted the provisions of this new rule, and we have applied this new guidance for the reserves estimates shown for December 31, 2010 and 2009 and March 31, 2011 included herein.
Derivative Financial Instruments. At December 31, 2008, we adopted new guidance to provide qualitative disclosures about our objectives and strategies for using derivative financial instruments and to provide a tabular presentation of quantitative information for derivatives designated as hedges, hedged items and other derivatives. This new guidance was effective for annual financial periods beginning after November 15, 2008. As its only requirement is to enhance disclosures, the new guidance had no material impact on our consolidated financial statements.
Fair Value. In May 2011, the FASB issued Accounting Standards Update, or ASU, 2011-04, Amendments to Achieve Common Fair Value Measurement and Disclosure Requirements in U.S. GAAP and IFRS, or ASU 2011-04. ASU 2011-04 amends Accounting Standards Codification, or ASC, 820, Fair Value Measurements, or ASC 820, providing a consistent definition and measurement of fair value, as well as similar disclosure requirements between GAAP and International Financial Reporting Standards. ASU 2011-04 changes certain fair value measurement principles, clarifies the application of existing fair value measurements and expands the ASC 820 disclosure requirements, particularly for Level 3 fair value measurements. The adoption of ASU 2011-04 is not expected to have a material impact on our consolidated financial statements, but may require certain additional disclosures. The amendments in ASU 2011-04 are to be applied prospectively. For public entities, the amendments are effective during interim and annual periods beginning after December 15, 2011.
In January 2010, the FASB issued authoritative guidance to update certain disclosure requirements and added two new disclosure requirements related to fair value measurements. The guidance requires a gross presentation of activities within the Level 3 roll forward and adds a new requirement to disclose details of significant transfers in and out of Level 1 and 2 measurements and the reasons for the transfers. The new disclosures are required for all companies that are required to provide disclosures about recurring and non-recurring fair value measurements, and are effective the first interim or annual reporting period beginning after December 15, 2009, except for the gross presentation of the Level 3 roll forward information, which is required for annual reporting periods beginning after December 15, 2010 and for interim reporting periods within those years. We adopted the first portion of this guidance beginning January 1, 2010. We do not expect the adoption of this new guidance to have a significant impact on our financial position, results of operations or cash flows.
79
Table of Contents
Index to Financial Statements
In September 2006, the FASB issued authoritative guidance for using fair value to measure assets and liabilities. This guidance applies whenever other standards require or permit assets or liabilities to be measured at fair value, but it does not expand the use of fair value in any new circumstances. In February 2009, the FASB delayed the effective date by one year for non-financial assets and liabilities. We adopted this guidance effective January 1, 2008, but delayed guidance relating to non-financial assets and liabilities until January 1, 2009. The adoption of this guidance did not have a significant impact on our financial position, results of operations or cash flows.
In February 2007, the FASB issued authoritative guidance permitting entities to choose to measure certain financial instruments and other items at fair value. The objective is to improve financial reporting by providing entities with the opportunity to mitigate volatility in reported earnings caused by measuring related assets and liabilities differently without having to apply complex hedge accounting provisions. Unrealized gains and losses on any items for which the fair value measurement option is elected are to be reported in the consolidated statement of operations. We adopted this guidance at January 1, 2008. We elected not to measure any eligible items using the fair value option in accordance with this guidance, and therefore, it did not have an impact on our financial position, results of operations or cash flows.
Uncertainty in Income Taxes. At January 1, 2008, we adopted the accounting guidance related to accounting for uncertainty in income taxes which provides for the financial statement benefit of a tax position as being recognized only after determining that the relevant tax authority would more likely than not sustain the position following an audit. For tax positions meeting the more-likely-than-not threshold, the amount recognized in the financial statements is the benefit that has a greater than 50 percent likelihood of being realized upon ultimate settlement with the relevant tax authority. Following adoption, we evaluated all tax positions for which the statute of limitations remained open, and management believes that the material positions taken would more likely than not be sustained by examination. We do not expect any change in unrecognized tax benefits in the next 12 months.
Internal Controls and Procedures
Prior to the completion of this offering, we have been a private company and have maintained internal controls and procedures in accordance with being a private company. We have maintained limited accounting personnel to perform our accounting processes and limited other supervisory resources with which to address our internal control over financial reporting. In connection with our audit for the year ended December 31, 2010, our independent registered public accountants identified and communicated material weaknesses related to accounting for deferred income taxes, impairment of oil and natural gas properties, assessment of unproved and unevaluated properties and the administration of our stock plan. A material weakness is a control deficiency, or a combination of control deficiencies, in internal control over financial reporting, such that there is reasonable possibility that a material misstatement of our annual or interim financial statements will not be prevented or detected on a timely basis.
We have begun the process of evaluating our internal control over financial reporting and will continue to work with our auditors to put into place new accounting process and control procedures to address the issues set forth above. However, we will not complete this process until well after this offering is completed. We cannot predict the outcome of this process at this time.
We are not currently required to comply with the SEC’s rules implementing Section 404 of the Sarbanes-Oxley Act, and are therefore not required to make a formal assessment of the effectiveness of our internal control over financial reporting for that purpose. Upon becoming a public company, we will be required to comply with the SEC’s rules implementing Section 302 of the Sarbanes-Oxley Act, which will
80
Table of Contents
Index to Financial Statements
require our management to certify financial and other information in our quarterly and annual reports and to provide an annual management report on the effectiveness of our internal control over financial reporting. We will not be required to make our first assessment of our internal control over financial reporting until the year following the year that our first annual report is filed or required to be filed with the SEC. To comply with the requirements of being a public company, we will need to upgrade our systems, including information technology, implement additional financial and management controls, reporting systems and procedures and hire additional accounting and financial reporting staff.
Further, our independent registered public accountants are not yet required to formally attest to the effectiveness of our internal control over financial reporting until the year following the year that our first annual report is required to be filed with the SEC. Once it is required to do so, our independent registered public accounting firm may issue a report that is adverse in the event it is not satisfied with the level at which our controls are documented, designed, operated or reviewed. Our remediation efforts may not enable us to remedy or avoid material weaknesses in the future.
Quantitative and Qualitative Disclosures About Market Risk
We are exposed to a variety of market risks including commodity price risk, interest rate risk and counterparty and customer risk. We address these risks through a program of risk management including the use of derivative financial instruments.
Commodity price exposure. We are exposed to market risk as the prices of oil and natural gas fluctuate as a result of changes in supply and demand and other factors. To partially reduce price risk caused by these market fluctuations, we have entered into derivative financial instruments in the past and expect to enter into derivative financial instruments in the future to cover a significant portion of our future production.
We use costless (or zero-cost) collars to manage risks related to changes in natural gas prices. At December 31, 2010, 2009 and 2008 and at March 31, 2011, we used costless collar options to reduce the volatility of natural gas prices on a significant portion of our future expected natural gas production.
We record all derivative financial instruments at fair value. The fair value of our derivative financial instruments is determined based on our counterparty’s valuation model which we verified for its reasonableness annually with an independent third party valuation using observable, market-corroborated inputs. Comerica Bank is the single counterparty for all of our derivative instruments. We have made no adjustments to the fair value amounts recognized on the balance sheet for these derivative instruments to account for the credit standing of Comerica Bank.
The following is a summary of our open costless collar contracts at June 30, 2011:
| Commodity |
Calculation Period |
Notional Quantity | Price Floor | Price Ceiling |
Fair Value of Asset |
|||||||||||||||
| (MMBtu/month) | ($/MMBtu) | ($/MMBtu) | (thousands) | |||||||||||||||||
| Natural Gas |
01/01/2010 — 12/31/2011 | 50,000 | 5.25 | 8.10 | $ | 255 | ||||||||||||||
| Natural Gas |
01/01/2010 — 12/31/2011 | 50,000 | 5.50 | 7.65 | 323 | |||||||||||||||
| Natural Gas |
01/01/2010 — 12/31/2011 | 50,000 | 5.00 | 8.65 | 191 | |||||||||||||||
| Natural Gas |
01/01/2010 — 12/31/2011 | 50,000 | 5.50 | 7.70 | 323 | |||||||||||||||
| Natural Gas |
01/01/2011 — 12/31/2011 | 90,000 | 5.50 | 7.85 | 581 | |||||||||||||||
| Natural Gas |
07/01/2011 — 12/31/2012 | 300,000 | 4.50 | 5.60 | 677 | |||||||||||||||
| Natural Gas |
07/01/2011 — 07/31/2013 | 150,000 | 4.50 | 5.75 | 316 | |||||||||||||||
| Natural Gas |
01/01/2012 — 12/31/2012 | 150,000 | 4.25 | 6.17 | 142 | |||||||||||||||
|
|
|
|||||||||||||||||||
| Total |
$ | 2,808 | ||||||||||||||||||
|
|
|
|||||||||||||||||||
81
Table of Contents
Index to Financial Statements
All of our existing natural gas derivative contracts will expire at varying times during 2011, 2012 and 2013. We currently have no derivative contracts in place for any of our oil and liquids production.
Effect of Recent Derivatives Legislation
On July 21, 2010, President Obama signed into law the Dodd-Frank Wall Street Reform and Consumer Protection Act, or the Dodd-Frank Act, which is intended to modernize and protect the integrity of the U.S. financial system. The Dodd-Frank Act, among other things, sets forth the new framework for regulating certain derivative products including the commodity hedges of the type used by us, but many aspects of this law are subject to further rulemaking and will take effect over several years. As a result, it is difficult to anticipate the overall impact of the Dodd-Frank Act on our ability or willingness to continue entering into and maintaining such commodity hedges and the terms thereof. Based upon the limited assessments we are able to make with respect to the Dodd-Frank Act, there is the possibility that the Dodd-Frank Act could have a substantial and adverse impact on our ability to enter into and maintain these commodity hedges. In particular, the Dodd-Frank Act could result in the implementation of position limits and additional regulatory requirements on our derivative arrangements, which could include new margin, reporting and clearing requirements. In addition, this legislation could have a substantial impact on our counterparties and may increase the cost of our derivative arrangements in the future. See “Risk Factors — The derivatives legislation adopted by Congress could have an adverse impact on our ability to hedge risks associated with our business.”
Interest rate risk. We do not use interest rate derivatives to alter interest rate exposure in an attempt to reduce interest rate expense on existing debt since we borrowed under our existing credit agreement for the first time in December 2010 and have $60.0 million in debt outstanding at June 30, 2011 at an interest rate of 1.875% plus a Eurodollar-based rate, which equated to approximately 2.1% at June 30, 2011. In addition to our revolving borrowings, in May 2011, we borrowed $25.0 million in a term loan pursuant to the credit agreement. The term loan bears interest at an annual rate of 5% plus a Eurodollar-based rate, which equated to approximately 5.3% at June 30, 2011. If we incur any indebtedness in the future and at higher interest rates, we may use interest rate derivatives. Interest rate derivatives would be used solely to modify interest rate exposure and not to modify the overall leverage of the debt portfolio.
Counterparty and customer credit risk. Joint interest receivables arise from billing entities which own partial interest in the wells we operate. These entities participate in our wells primarily based on their ownership in leases on which we wish to drill. We have limited ability to control participation in our wells. We are also subject to credit risk due to concentration of our oil and natural gas receivables with several significant customers. The inability or failure of our significant customers to meet their obligations to us or their insolvency or liquidation may adversely affect our financial position, results of operations and cash flows. In addition, our oil and natural gas derivative arrangements expose us to credit risk in the event of nonperformance by counterparties.
While we do not require our customers to post collateral and we do not have a formal process in place to evaluate and assess the credit standing of our significant customers for oil and natural gas receivables and the counterparties on our derivative instruments, we do evaluate the credit standing of such counterparties as we deem appropriate under the circumstances. This evaluation may include reviewing a counterparty’s credit rating, latest financial information and, in the case of a customer with which we have receivables, its historical payment record, the financial ability of the customer’s parent company to make payment if the customer cannot and undertaking the due diligence necessary to determine credit terms and credit limits. The counterparty on our derivative instruments currently in place is Comerica Bank, N.A. and we are likely to enter into any future derivative instruments with Comerica Bank, N.A.
82
Table of Contents
Index to Financial Statements
Impact of Inflation. Inflation in the United States has been relatively low in recent years and did not have a material impact on our results of operations for the years ended December 31, 2010, 2009 and 2008. Although the impact of inflation has been generally insignificant in recent years, it is still a factor in the United States economy and we tend to specifically experience inflationary pressure on the cost of oilfield services and equipment with increases in oil and natural gas prices and with increases in drilling activity in our areas of operations, including the Eagle Ford shale and Haynesville shale plays. See “— Overview.” See also “Risk Factors — The mechanical risks of drilling and completion activities as well as the unavailability or high cost of drilling rigs, completion equipment and services, supplies and personnel, including hydraulic fracturing equipment and personnel, could adversely affect our ability to establish and execute exploration and development plans within budget and on a timely basis, which could have a material adverse effect on our financial condition, results of operations and cash flows.”
Off-Balance Sheet Arrangements
At December 31, 2010 and March 31, 2011, we did not have any off-balance sheet arrangements.
Changes in Accountants
Grant Thornton LLP, or Grant Thornton, performed audits of our consolidated financial statements for the fiscal years ended December 31, 2008 and 2009. Grant Thornton’s reports did not contain an adverse opinion or disclaimer of opinion and were not qualified or modified as to uncertainty, audit scope or accounting principles.
On or about June 1, 2010, following the completion of Grant Thornton’s audit of our financial statements for the year ended December 31, 2009, our Audit Committee determined not to renew Grant Thornton’s engagement as our independent accountant. On October 28, 2010, our board of directors unanimously approved the appointment of Ernst & Young, LLP, or Ernst & Young, as our independent accountant commencing with work to be performed in relation to our nine month period ended September 30, 2010. We had no occasion in 2008 and 2009 and any subsequent interim period prior to October 28, 2010 upon which we consulted with Ernst & Young on any matters.
During the fiscal years ended December 31, 2008 and 2009, and the subsequent interim period through June 1, 2010, there were (i) no disagreements with Grant Thornton on any matter of accounting principles or practices, financial statement disclosure or auditing scope or procedure, which disagreement(s), if not resolved to Grant Thornton’s satisfaction, would have caused Grant Thornton to make reference to the subject matter of the disagreement(s) in connection with its reports for such years, and (ii) no reportable events within the meaning set forth in Item 304(a)(1)(v) of Regulation S-K.
Prior to the completion of Ernst & Young’s audit of our financial statements for the nine month period ended September 30, 2010, on or about February 28, 2011, we mutually agreed with Ernst & Young to terminate our relationship. The decision to discontinue the audit services of Ernst & Young was mutual and was approved by our Board of Directors and Audit Committee effective at February 28, 2011. From October 28, 2010 through February 28, 2011, there were (i) no disagreements with Ernst & Young on any matter of accounting principles or practices, financial statement disclosure or auditing scope or procedure, which disagreement(s), if not resolved to Ernst & Young’s satisfaction, would have caused Ernst & Young to make reference to the subject matter of the disagreement(s) in connection with its report for the nine-month period ended September 30, 2010, and (ii) no reportable events within the meaning set forth in Item 304(a)(1)(v) of Regulation S-K.
83
Table of Contents
Index to Financial Statements
Effective at February 28, 2011, our Audit Committee unanimously approved the reappointment of Grant Thornton as our independent accountant to audit our financial statements for the year ended December 31, 2010. Prior to our reengagement of Grant Thornton, we had discussions with Grant Thornton regarding its previously issued audit reports relating to deferred taxes and the accounting treatment of our stock options for 2008 and 2009. We also discussed with Grant Thornton how these matters would be impacted and treated in connection with its audit of our financial statements for the year ended December 31, 2010. We had no occasion between June 1, 2010 and February 28, 2011 upon which we consulted with Grant Thornton on any other matters.
Both Grant Thornton and Ernst & Young have been provided with a copy of this disclosure and have furnished to us a letter addressed to the Securities and Exchange Commission stating that they agree with the statements about such firms contained herein.
84
Table of Contents
Index to Financial Statements
Overview
We are an independent energy company engaged in the exploration, development, production and acquisition of oil and natural gas resources in the United States, with a particular emphasis on oil and natural gas shale plays and other unconventional resource plays. Our current operations are located primarily in the Eagle Ford shale play in south Texas and the Haynesville shale play in northwest Louisiana and east Texas. These plays are a key part of our growth strategy and we believe these plays currently represent two of the most active and economically viable unconventional resource plays in North America. We expect the majority of our near-term capital expenditures will focus on increasing our production and reserves from these plays as we seek to capitalize on the relative economics of each play. In addition to these primary operating areas, we have acreage positions in southeast New Mexico and west Texas and in southwest Wyoming and adjacent areas in Utah and Idaho where we continue to identify new oil and natural gas prospects.
We were founded in July 2003 by Joseph Wm. Foran, Chairman, President and CEO, and Scott E. King, Co-Founder and Vice President, Geophysics and New Ventures, with an initial equity investment of approximately $6.0 million. Shortly thereafter, investors contributed approximately $46.5 million to provide a total initial capitalization of approximately $52.5 million. Most of this initial capital was provided by the same institutional and individual investors who helped capitalize Mr. Foran’s previous company, Matador Petroleum Corporation.
Mr. Foran began his career as an oil and natural gas independent in 1983 when he founded Foran Oil Company with $270,000 in contributed capital from 17 friends and family members. Foran Oil Company was later contributed to Matador Petroleum Corporation upon its formation by Mr. Foran in 1988. Mr. Foran served as Chairman and Chief Executive Officer of that company from its inception until it was sold in June 2003 to Tom Brown, Inc., in an all cash transaction for an enterprise value of approximately $388.5 million.
With an average of more than 25 years of oil and natural gas industry experience, our management team has extensive expertise in exploring for and developing hydrocarbons in multiple U.S. basins. Members of our management team have participated in the assimilation of numerous lease positions and in the drilling and completion of hundreds of vertical and horizontal wells in unconventional resource plays.
Since our first well in 2004, we have drilled or participated in drilling 194 wells through June 30, 2011, including 64 Haynesville and six Eagle Ford wells. From December 31, 2008 through March 31, 2011, we grew our estimated proved reserves from 20.0 Bcfe to 154.8 Bcfe. At March 31, 2011, 36% of our estimated proved reserves were proved developed reserves and 97% of our estimated proved reserves were natural gas. Also, we grew our average daily production by approximately 162% from 9.0 MMcfe per day for the year ended December 31, 2008 to 23.6 MMcfe per day for the year ended December 31, 2010. In addition, as a result of production from several new wells that were recently completed, our daily production for May 2011 averaged approximately 49.1 MMcfe per day. We have achieved this growth while lowering operating costs (consisting of lease operating expenses and production taxes and marketing expenses) from $1.91 per Mcfe for the year ended December 31, 2008, to $0.84 per Mcfe for the year ended December 31, 2010, or a decrease of approximately 55%.
85
Table of Contents
Index to Financial Statements
The following table presents certain summary data for each of our operating areas at June 30, 2011 unless otherwise indicated:
| Producing Wells |
Total Identified Drilling Locations(1) |
Estimated Net Proved Reserves |
Avg.
Daily Production (MMcfe)(2) |
|||||||||||||||||||||||||||||
| Net Acreage | Gross | Net | Gross | Net | Bcfe(3) | % Developed |
||||||||||||||||||||||||||
| South Texas: |
||||||||||||||||||||||||||||||||
| Eagle Ford |
29,304 | 4.0 | 2.4 | 192.0 | 156.5 | 5.6 | 54.3 | 4.4 | ||||||||||||||||||||||||
| Austin Chalk |
14,729 | – | – | 16.0 | 16.0 | – | – | – | ||||||||||||||||||||||||
|
|
|
|
|
|
|
|
|
|
|
|
|
|
|
|
|
|||||||||||||||||
| Area Total(4) |
29,304 | 4.0 | 2.4 | 208.0 | 172.5 | 5.6 | 54.3 | 4.4 | ||||||||||||||||||||||||
|
|
|
|
|
|
|
|
|
|
|
|
|
|
|
|
|
|||||||||||||||||
| NW Louisiana/E Texas: |
||||||||||||||||||||||||||||||||
| Haynesville |
14,624 | 64.0 | 10.3 | 557.0 | 106.2 | 131.9 | 27.1 | 36.8 | ||||||||||||||||||||||||
| Cotton Valley(5) |
23,208 | 108.0 | 71.7 | 60.0 | 36.0 | 16.7 | 100.0 | 7.7 | ||||||||||||||||||||||||
|
|
|
|
|
|
|
|
|
|
|
|
|
|
|
|
|
|||||||||||||||||
| Area Total(6) |
25,673 | 172.0 | 82.0 | 617.0 | 142.2 | 148.6 | 35.3 | 44.5 | ||||||||||||||||||||||||
|
|
|
|
|
|
|
|
|
|
|
|
|
|
|
|
|
|||||||||||||||||
| SW Wyoming, NE |
135,862 | – | – | – | – | – | – | – | ||||||||||||||||||||||||
| SE New Mexico, West Texas |
19,852 | 13.0 | 5.7 | – | – | 0.6 | 100.0 | 0.2 | ||||||||||||||||||||||||
|
|
|
|
|
|
|
|
|
|
|
|
|
|
|
|
|
|||||||||||||||||
| Total |
210,691 | 189.0 | 90.1 | 825.0 | 314.7 | 154.8 | 36.2 | 49.1 | ||||||||||||||||||||||||
|
|
|
|
|
|
|
|
|
|
|
|
|
|
|
|
|
|||||||||||||||||
| (1) | These locations have been identified for potential future drilling and are not currently producing. In addition, the total net identified drilling locations is calculated by multiplying the gross identified drilling locations in an operating area by our working interest participation in such locations. |
| (2) | For May 2011. |
| (3) | At March 31, 2011. These estimates were prepared by our engineering staff and audited by independent reservoir engineers, Netherland, Sewell & Associates, Inc. |
| (4) | Some of the same leases cover the net acres shown for the Eagle Ford formation and the Austin Chalk formation, a shallower formation than the Eagle Ford. Therefore, the sum of the net acreage for both formations is not equal to the total net acreage for south Texas. Includes acreage that we are producing from or that we believe to be prospective for these formations. |
| (5) | Includes shallower zones and also includes one well producing from the Frio formation in Orange County, Texas. Also includes two wells producing from the San Miguel formation in Zavala County, Texas. |
| (6) | Some of the same leases cover the net acres shown for the Haynesville formation and the Cotton Valley formation, a shallower formation than the Haynesville. Therefore, the sum of the net acreage for both formations is not equal to the total net acreage for northwest Louisiana/east Texas. Includes acreage that we are producing from or that we believe to be prospective for these formations. |
At June 30, 2011, our properties included approximately 56,000 gross acres and 29,000 net acres in the Eagle Ford shale play in Atascosa, DeWitt, Dimmit, Karnes, LaSalle, Gonzales, Webb, Wilson and Zavala Counties in south Texas. We believe that almost 85% of our Eagle Ford acreage is prospective predominantly for oil or significant liquids production. In addition, portions of the acreage are also prospective for other targets, such as the Austin Chalk, Olmos and Buda, from which we expect to produce predominantly oil and liquids. Approximately 80% of our Eagle Ford acreage is either held by production or not burdened by lease expirations before 2013. We have begun to explore and develop our Eagle Ford position and from November 2010 through August 2011, we completed our first four operated wells in this area (see “ — Recent Developments”). We have identified 192 gross locations for potential future drilling in our Eagle Ford acreage.
In addition, at June 30, 2011, we had approximately 23,000 gross acres and 15,000 net acres in the Haynesville shale play in northwest Louisiana and east Texas, including almost 5,500 net acres in what we believe is the core area of the play. Almost 90% of our Haynesville acreage is held by production from the Haynesville or other formations and we believe much of it is also prospective for the Cotton Valley,
86
Table of Contents
Index to Financial Statements
Hosston (Travis Peak) and other shallower targets. In addition, we believe approximately 1,700 of these net acres are prospective for the Middle Bossier shale play. Our Haynesville acreage is approximately 10% developed and we have identified 557 gross locations for potential future drilling in our Haynesville acreage.
We also have a large unevaluated acreage position in southwest Wyoming and adjacent areas in Utah and Idaho where we began drilling our initial well in February 2011 to test the Meade Peak natural gas shale. We reached a depth of 8,200 feet, approximately 300 feet above the top of the Meade Peak shale, before having operations suspended for several months due to wildlife restrictions. We expect to resume operations on this initial test well in September 2011. In addition, we have leasehold interests in the Delaware and Midland Basins in southeast New Mexico and west Texas where we are developing new oil and natural gas prospects.
We are active both as an operator and as a co-working interest owner with larger industry participants including affiliates of Chesapeake Energy Corporation, EOG Resources, Inc., Royal Dutch Shell plc and others. Of the 194 gross wells we have drilled or participated in drilling, we drilled approximately 49% of these wells as the operator. At July 31, 2011, we were the operator for approximately 82% of our Eagle Ford and 71% of our Haynesville acreage, including approximately 23% of our acreage in what we believe is the core area of the Haynesville play. A large portion of our acreage in that core area is operated by a subsidiary of Chesapeake Energy Corporation. We also operate all of our acreage in southwest Wyoming and the adjacent areas of Utah and Idaho, as well as the vast majority of our acreage in southeast New Mexico and west Texas.
Our net proceeds from this offering, after discharging in full the $25.0 million term loan and repaying $10.0 million of the outstanding borrowings under our revolving credit agreement, when taken together with our cash flows and future potential borrowings under our credit agreement, will be used to fund the remainder of our 2011 and our entire 2012 exploration and development program and for potential acquisitions of interests and acreage. See “Use of Proceeds.”
The following table presents our 2011 and 2012 anticipated capital expenditure budgets of approximately $148.9 million and $230.8 million, respectively. From January 1, 2011 through July 31, 2011, we spent approximately $84.2 million in capital expenditures (or 57% of our 2011 capital expenditures budget). Approximately 70% and 23% of these expenditures were spent in the development of our acreage in the Eagle Ford shale play and the core area of the Haynesville shale play, respectively. From August 1, 2011 through December 31, 2011, we anticipate that our capital expenditures will be approximately $64.7 million. While we have budgeted $148.9 million for 2011 and $230.8 million for 2012, the aggregate amount of capital we will expend may fluctuate materially based on market conditions and the outcome of our drilling results during the remainder of 2011 and in 2012. Since approximately 90% of our Haynesville acreage was held by production and approximately 80% of our Eagle Ford acreage was either held by production or not burdened by lease expirations before 2013 at June 30, 2011, we have the financial flexibility to allocate our capital when we believe it is economical and justified.
87
Table of Contents
Index to Financial Statements
| 2011-2012 Anticipated Drilling | Anticipated Capital Expenditure Budgets | |||||||||||||||
| Gross Wells(1) | Net Wells(1) | 2011 (in millions)(2) | 2012 (in millions)(2) | |||||||||||||
| South Texas: |
||||||||||||||||
| Eagle Ford |
27.0 | 26.3 | $ | 58.2 | $ | 168.8 | ||||||||||
| Austin Chalk |
2.0 | 2.0 | – | 8.0 | ||||||||||||
|
|
|
|
|
|
|
|
|
|||||||||
| Area Total |
29.0 | 28.3 | 58.2 | 176.8 | ||||||||||||
|
|
|
|
|
|
|
|
|
|||||||||
| NW Louisiana/E Texas: |
||||||||||||||||
| Haynesville |
70.0 | 7.4 | 42.5 | 27.5 | ||||||||||||
| Cotton Valley |
1.0 | 1.0 | 5.1 | – | ||||||||||||
|
|
|
|
|
|
|
|
|
|||||||||
| Area Total |
71.0 | 8.4 | 47.6 | 27.5 | ||||||||||||
|
|
|
|
|
|
|
|
|
|||||||||
| SW Wyoming, NE Utah, SE Idaho |
2.0 | 0.8 | 1.5 | (3) | 1.5 | (3) | ||||||||||
| SE New Mexico, West Texas |
– | – | – | – | ||||||||||||
| Other |
N/A | N/A | 41.6 | (4) | 25.0 | (5) | ||||||||||
|
|
|
|
|
|
|
|
|
|||||||||
| Total |
102.0 | 37.5 | $ | 148.9 | $ | 230.8 | ||||||||||
|
|
|
|
|
|
|
|
|
|||||||||
| (1) | Includes wells we currently expect to drill and complete as operator, plus those wells in which we currently plan to participate in the remainder of 2011 and in 2012. Also includes wells we have drilled to date in 2011. |
| (2) | Our capital expenditure budgets are based on our net working interests in the properties. Also includes 2011 costs for wells drilled in 2010 and completed in early 2011 and costs for wells drilled to date in 2011. |
| (3) | We have a carried interest for $4.2 million of the cost of drilling the initial test well on this prospect and a carried interest for $5.0 million if a second test well is drilled on this prospect. We began drilling the initial test well, the Crawford Federal #1, in Lincoln County, Wyoming in February 2011. We reached a depth of 8,200 feet, approximately 300 feet above the top of the Meade Peak shale, before having operations suspended for several months due to wildlife restrictions. We expect to resume operations on this initial test well in September 2011. |
| (4) | Includes primarily leasehold costs, but also 2-D and 3-D seismic and other miscellaneous capital expenses such as recompletion expenses. A majority of these expenses are allocated to our acreage in the Eagle Ford and Haynesville shale plays. Also includes $32.6 million and $2.7 million incurred for leasehold acquisitions in the Eagle Ford and Haynesville shale plays, respectively, at July 31, 2011. |
| (5) | Includes $20.0 million to acquire additional leasehold interests primarily prospective for oil and liquids production in southeast New Mexico and west Texas. |
Business Strategies
Our goal is to increase shareholder value by building reserves, production and cash flows at an attractive return on invested capital. We plan to achieve our goal by executing the following strategies:
| • | Focus Exploration and Development Activity on Our Eagle Ford and Haynesville Shale Assets. |
We have established core acreage positions in the Eagle Ford and Haynesville shale plays, which we believe are two of the most active and economically viable shale plays in North America. While we intend to allocate a portion of our 2011 and 2012 capital expenditure budgets to financing exploration, development and acquisition of additional interests in the Haynesville shale play, we currently intend to dedicate approximately 63% of our 2011 and approximately 74% of our 2012 capital expenditure budgets to the exploration, development and acquisition of additional interests in the Eagle Ford shale play. Since approximately 90% of our Haynesville acreage was held by production and approximately 80% of our Eagle Ford acreage was either held by production or not burdened by lease expirations before 2013 at June 30, 2011, we have the flexibility to develop our acreage in a disciplined manner in order to maximize the resource recovery from these assets. We believe the economics for development in these two areas are attractive at current commodity prices.
88
Table of Contents
Index to Financial Statements
| • | Identify, Evaluate and Exploit Oil Plays to Create a More Balanced Portfolio. |
Although most of our proved reserves are currently classified as natural gas, we have been evaluating various oil plays to find and execute upon opportunities that would fit well with our exploration and operating strategies. We believe our interests in the Eagle Ford shale play will enable us to create a more balanced commodity portfolio through the development of locations that are prospective for oil and liquids. At July 31, 2011, we had spent approximately $58.9 million on oil and liquids exploration and acreage acquisition activities in 2011 and expect to spend approximately $35.4 million on oil and liquids exploration and acreage acquisition activities during the remainder of 2011. We believe oil and liquids opportunities represent a substantial portion of our anticipated 2011 and 2012 drilling capital expenditure budgets. We expect to continue to create and acquire additional prospects and opportunities for the exploration and production of oil and liquids.
| • | Pursue Opportunistic Acquisitions. |
We believe our management team’s familiarity with our key operating areas and their contacts with the operators and mineral owners in those regions enable us to identify high return opportunities at attractive prices. We actively pursue opportunities to acquire unproved and unevaluated acreage, drilling prospects and low-cost producing properties within our core areas of operations where we have operational control and can enhance value and performance. We view these acquisitions as an important component of our business strategy and intend to selectively make acquisitions on attractive terms that complement our growth and help us achieve economies of scale.
| • | Maintain Our Low Cost Structure and Financial Discipline. |
As an operator, we seek to manage aggressively our costs by leveraging advanced technologies and integrating the knowledge, judgment and experience of our management and technical teams. We believe our team demonstrates financial discipline that is reflected in the improvements it has achieved on reducing unit costs and is achieved by our approach to evaluating and analyzing prospects and prior drilling and completion results before allocating capital. When we are not the operator, we proactively engage with the operators in an effort to ensure similar financial discipline and cost-focused operations and results. Additionally, we conduct our own internal geological and engineering studies on these prospects and provide input on the drilling, completion and operation of many of these non-operated wells pursuant to our agreements and relationships with the operators. Through these methods and practices, we believe we are well-positioned to control the expenses and timing of development and exploitation of our properties.
| • | Maintain Proactive and Ongoing Relationships with Other Industry Participants. |
We believe maintaining proactive and ongoing relationships with other industry operators and vendors enhances our understanding of the shale plays and allows us to leverage their expertise without having to commit substantial capital. We currently participate in various drilling activities with larger industry participants, including affiliates of Chesapeake Energy Corporation, EOG Resources, Inc., Royal Dutch Shell plc and others. We are also active participants in three industry shale consortia: the North American Gas Shale, Haynesville and Bossier Shale and Eagle Ford Shale consortia organized by Core Laboratories, LP. As active members in various professional societies, our staff and board members also regularly interact on a professional basis with other industry participants.
89
Table of Contents
Index to Financial Statements
Competitive Strengths
We believe our prior success is, and our future performance will be, directly related to the following combination of strengths that will enable us to implement our strategies:
| • | High Quality Asset Base in Attractive Areas. |
We have key acreage positions in active areas of the Eagle Ford and Haynesville shale plays. We believe our assets in these plays are characterized by low geological risk and similar repeatable drilling opportunities that we expect will result in a predictable production growth profile. The commodity mix of our production and reserves is expected to become more balanced as a result of our planned activities on our Eagle Ford and Austin Chalk acreage, which is located in oil and liquids prone areas of the plays. In addition to the Haynesville shale, our east Texas and north Louisiana assets have multiple, recognized geologic horizons, including the Middle Bossier shale, Cotton Valley and Hosston (Travis Peak) formations. We also believe there is additional resource potential in our oil and natural gas prospects in southeast New Mexico and west Texas, along with our natural gas prospects in southwest Wyoming and adjacent areas in Utah and Idaho.
| • | Large, Multi-year, Development Drilling Inventory. |
Within our northwest Louisiana/east Texas and south Texas regions, we have identified 825 gross and 315 net drilling locations, including 192 gross and 157 net locations in the Eagle Ford and 557 gross and 106 net locations in the Haynesville shale play. Approximately 15% of our Haynesville and 1% of our Eagle Ford gross locations have been included in our estimated proved reserves at March 31, 2011. We have identified 27 gross and 26 net locations in the Eagle Ford and 70 gross and seven net locations in the Haynesville shale plays that we expect to drill in 2011 and 2012, the completion of which would represent approximately 14% and 13% of our identified gross drilling locations in these two areas, respectively. Additionally, we expect to identify and develop additional locations across our broad exploration portfolio as we evaluate our Cotton Valley, Austin Chalk, Meade Peak and Delaware and Midland Basin assets. We believe our multi-year, identified drilling inventory and exploration portfolio provide visible near-term growth in our production and reserves, and highlight the long-term resource potential across our asset base.
| • | Financial Flexibility to Fund Expansion. |
Historically, we have maintained financial flexibility by obtaining capital through shareholder investments and our operational cash flows while maintaining low levels of indebtedness, which has allowed us to take advantage of acquisition opportunities as they arise. Upon the completion of this offering and the repayment of our $25.0 million term loan in full and $10.0 million of our outstanding borrowings under our revolving credit agreement, we expect to have at least $— million in cash, cash equivalents and certificates of deposit and at least $30.0 million available for borrowings under our credit agreement. Excluding any possible acquisitions, we expect to maintain our current financial flexibility by funding our remaining 2011 and entire 2012 capital expenditure budgets through the net proceeds from this offering, together with our operational cash flows and future potential borrowings under our credit agreement. Our availability of capital as described above will also allow us to maintain our competitiveness in seeking to acquire additional oil and natural gas properties as opportunities arise. A strong balance sheet and interest savings should also reduce unit costs and increase profitability. In addition, since a large portion of our Eagle Ford and Haynesville acreage was held by production at June 30, 2011, we have the financial flexibility to allocate our capital when we believe it is economical and justified.
90
Table of Contents
Index to Financial Statements
| • | Experienced and Incentivized Management, Technical Team and Board. |
Our management and technical teams possess extensive oil and natural gas expertise with an average of over 25 years of relevant industry experience from companies such as Matador Petroleum Corporation, S. A. Holditch & Associates, Inc., Schlumberger Limited, Conoco and ARCO, and we believe they have a demonstrated record of growth and financial discipline over many years. The management team has experience in drilling and completing hundreds of vertical and horizontal wells in unconventional resource plays, including the Cotton Valley, Bossier, Wilcox/Vicksburg, Austin Chalk, Haynesville and Eagle Ford plays. Our management team’s experience is complemented by a strong technical team with deep knowledge of advanced geophysical, drilling and completion technologies who are active members of their professional societies. Additionally, we have a group of board members and special advisors with considerable experience and expertise in the oil and natural gas industry and in managing other successful enterprises who provide insight and perspective regarding our business and the evaluation, exploration, engineering and development of our prospects. In addition to its considerable experience, our management team currently owns and will continue to own a significant direct ownership interest in us immediately following the completion of this offering. We believe our management team’s direct ownership interest, as well as their ability to increase their holdings over time through our long-term incentive plan, aligns management’s interests with those of our shareholders.
| • | Extensive Geologic, Engineering and Operational Experience in Unconventional Reservoir Plays. |
The individuals on our technical team are highly experienced in analyzing unconventional reservoir plays and in horizontal drilling, completion and production operations in a number of geographic areas. Our geologists have extensive experience in analyzing unconventional reservoir plays throughout the United States, including our principal areas of interest, by using the latest imaging technology, such as 2-D and 3-D seismic interpretation, and petrophysical analysis. In addition, our technical team has been directly involved in over 26 different horizontal well drilling and/or operations programs in both onshore and offshore formations located in the United States and abroad. Our team’s diverse and broad horizontal drilling experience includes most, if not all, techniques used in modern day drilling. Additionally, our team has in-depth experience with various horizontal completion techniques and their applications in various unconventional plays. We intend to leverage our team’s geological expertise and horizontal drilling and completion experience to develop and exploit our large, multi-year development drilling inventory.
| • | Multi-Disciplined Approach to New Opportunities. |
Our process for evaluating and developing new oil and natural gas prospects is a result of what we believe is an organizational philosophy that is dedicated to a systematic, multi-disciplinary approach to new opportunities with an emphasis on incorporating petroleum systems, geosciences, technology and finance into the decision-making process. We recognize the importance of consulting multiple individuals in our organization across all disciplines and all levels of responsibility prior to making exploration, acquisition or development decisions and the formulation of key criteria for successful exploration and development projects in any given play to enhance our decision-making. We also conduct a “post-mortem” review of our major decisions to determine what we did right and where we need to improve. At times, this approach results in a decision to accelerate our development program or expand our positions in certain areas. Other times, this approach results in a decision to mitigate risk associated with our exploration and development programs by sharing operational risks and costs with other industry participants or
91
Table of Contents
Index to Financial Statements
exiting an area altogether. We believe this multi-disciplined approach underpins our track record of value creation and represents the best way to deliver consistent, year-over-year results to our shareholders.
Recent Developments
In August 2011, we completed our fourth operated Eagle Ford horizontal well, the Lewton #1H in DeWitt County, Texas. We are preparing to flow test this well following a 17-stage hydraulic fracture treatment. We are the operator of this well and paid 100% of the costs to drill and complete the well. We will have an 85% working interest in the well until we have recovered all of our acquisition, drilling and completion costs, after which time, our partner will receive 50% of the revenues attributable to the working interest in the well and we and our partner will each maintain a 50% working interest in the well.
Between March and July 2011, we acquired leasehold interests in approximately 6,300 gross and 4,800 net acres in DeWitt, Karnes, Wilson and Gonzales Counties, Texas in the Eagle Ford shale play from Orca ICI Development, JV. We believe that all of this acreage is in an oil and liquids prone area of the Eagle Ford play. We believe that the acreage in Wilson and Gonzales Counties and a portion of DeWitt County will be prospective for oil and liquids from the Austin Chalk formation in addition to the Eagle Ford. We paid approximately $31.5 million to acquire this acreage. We currently own a 50% working interest in the acreage (approximately 2,800 gross and 1,400 net acres) in DeWitt County and are the operator. We currently own a 100% working interest in the acreage (approximately 3,500 gross and 3,400 net acres) in Karnes, Wilson and Gonzales Counties and are the operator.
On May 19, 2011, the borrowing base under our credit agreement was increased to $80.0 million. On May 19, 2011, primarily to fund our acquisition of the new Eagle Ford acreage from Orca ICI Development, JV, we borrowed an additional $10.0 million under our credit agreement (bringing our total to $60.0 million), and borrowed an additional $25.0 million as a term loan. Out of the net proceeds we receive from this offering, we intend to repay the term loan in full and reduce borrowings under our credit agreement by approximately $10.0 million, leaving $50.0 million of long-term indebtedness outstanding after this offering.
In March 2011, first sales of natural gas began from our Williams 17 H#1 well, located in what we believe to be the core area of the Haynesville shale play in northwest Louisiana. We began producing this well at a constrained rate of about 10.0 MMcf of natural gas per day that we believe optimizes overall well economics, even though we believe that this well was initially capable of delivering 20.0 to 25.0 MMcf of natural gas per day. During June 2011, this well produced at an average daily rate of 8.4 MMcf of natural gas per day and had produced approximately 0.9 Bcf of natural gas at June 30, 2011. We are the operator and have a 100% working interest and a favorable 87.5% net revenue interest in this well.
In February 2011, we completed our third operated Eagle Ford horizontal well, the Affleck #1H, in eastern Dimmit County, Texas. This well tested at approximately 415 Bbls of oil and 5.4 MMcf of natural gas per day during an initial flow test. This well has been shut-in while we negotiate a pipeline right-of-way and prepare to lay a gas sales line to the well, which we anticipate will be completed in September 2011. We are the operator and have a 100% working interest in this well.
In January 2011, we completed a private placement offering of 1,922,199 shares of our Class A common stock at $11.00 per share for an aggregate amount of $21,144,189.
92
Table of Contents
Index to Financial Statements
In January 2011, we completed our second operated Eagle Ford horizontal well, the Martin Ranch #1H, in northeastern LaSalle County, Texas. First sales of oil and natural gas from this well began in late March at approximately 700 Bbls of oil and 350 Mcf of natural gas per day. At June 30, 2011, the well was producing approximately 500 Bbls of oil and 700 Mcf of natural gas per day, and through June 30, 2011, had produced a total of approximately 58,000 Bbls of oil and 50 MMcf of natural gas. We are the operator and have a 100% working interest in this well.
In January 2011, first sales of oil and natural gas began from our first operated Eagle Ford horizontal well, the JCM Jr. Minerals #1H, in southern LaSalle County, at approximately 3.4 MMcf of natural gas and 135 Bbls of condensate per day. At June 30, 2011, the well was producing approximately 1.0 MMcf of natural gas and 25 Bbls of condensate per day, and through June 30, 2011, had produced a total of approximately 300 MMcf of natural gas and 8,700 Bbls of condensate. We are the operator and have a 100% working interest in this well.
In January 2011, we completed our first horizontal Cotton Valley well, the Tigner Walker H#1-Alt., in DeSoto Parish, Louisiana. First sales of natural gas from this well began in late January at approximately 4.6 MMcf of natural gas per day. At June 30, 2011, the well was producing approximately 3.0 MMcf of natural gas per day and through June 30, 2011, had produced a total of approximately 600 MMcf of natural gas. We have been producing this well at a constrained natural gas rate. We are the operator and have a 100% working interest in this well subject to a reversionary interest at payout.
On December 31, 2010, first sales of natural gas began from our L.A. Wildlife H#1 Alt. horizontal well, located in what we believe to be the core area of the Haynesville shale play in northwest Louisiana. We began producing this well at a constrained rate of about 10.0 MMcf of natural gas per day that we believe optimizes overall well economics, even though we believe that this well was initially capable of delivering 20.0 to 25.0 MMcf of natural gas per day. At June 30, 2011, the well was producing approximately 10.6 MMcf of natural gas per day, and through June 30, 2011, had produced a total of approximately 1.7 Bcf of natural gas. We are the operator and have a 95% working interest in this well.
Other Significant Prior Events
Chesapeake Transaction
In July 2008, we consummated a transaction with a subsidiary of Chesapeake Energy Corporation for the sale of the deep rights underlying the acreage in our Elm Grove/Caspiana properties in southern Caddo Parish, Louisiana. We retained a carried interest in the initial well drilled in each of the sections in which we held leases. The deep rights were below the depth of any producing wells previously drilled by us and represented primarily the rights to explore for and develop the Haynesville shale formation underlying the Cotton Valley formation that was producing from the wells in our Elm Grove/Caspiana properties. The deep rights assigned to Chesapeake also included the Middle Bossier shale formation located between the base of the Cotton Valley formation and the top of the Haynesville shale. At the time of the Chesapeake transaction, we had no production from and no reserves assigned to the Haynesville. We retained all rights to those depths above the base of the Cotton Valley formation, as well as all existing and future production and reserves from those formations. We reserved the right to be reassigned a proportionately reduced 25% working interest in each well drilled to the Haynesville shale by Chesapeake in each regular spacing unit established for the Haynesville which includes any of the rights we previously assigned to Chesapeake. Chesapeake agreed to carry us for all of the drilling and completion costs attributable to our interest in the first well drilled in each Haynesville spacing unit. In addition, we have the right to participate in subsequent wells drilled in each such spacing unit to the Haynesville shale on the basis of a proportionately reduced
93
Table of Contents
Index to Financial Statements
25% non-carried working interest. We also reserved an overriding royalty interest in certain of the deep rights that were sold. At June 30, 2011, Chesapeake had paid all of our costs for drilling and completing 21 gross wells to the Haynesville shale, and we will have a carried interest in three additional gross wells that we expect will be completed before the end of 2011.
Stroud Transaction
In August 2009, we acquired from Stroud Exploration Company, L.L.C. and Stroud Petroleum, Inc. 95% of the deep rights below the base of the Cotton Valley formation underlying approximately 600 acres prospective for the Haynesville shale play to the immediate southwest of our Elm Grove/Caspiana acreage. We also took title to an existing vertical Haynesville well that was holding this acreage by production. We were obligated to reassign this vertical Haynesville well to Stroud following the completion of our first horizontal Haynesville well drilled on this acreage, at which time, Stroud would recomplete this vertical well in the Cotton Valley formation. On December 31, 2010, first sales of natural gas began from our L.A. Wildlife H #1 Alt. well, the first Haynesville horizontal well that we drilled on this acreage. We began producing this well at a constrained rate of about 10.0 MMcf of natural gas per day that we believe optimizes overall well economics, even though we believe that this well was initially capable of delivering 20.0 to 25.0 MMcf of natural gas per day. At June 30, 2011, the well was producing approximately 10.6 MMcf of natural gas per day, and through June 30, 2011 had produced a total of approximately 1.7 Bcf of natural gas. We are the operator and have a 95% working interest in this well. In March 2011, we reassigned the vertical well to Stroud Exploration, reserving our rights below the base of the Cotton Valley formation.
Alliance Capital Participation Agreement
In May 2010, Roxanna Rocky Mountains, LLC and Alliance Capital Real Estate, Inc., an affiliate of AllianceBernstein L.P., entered into a participation agreement with our subsidiary, MRC Rockies Company, or MRC Rockies, regarding our Meade Peak shale prospect in southwest Wyoming and adjacent areas in Utah and Idaho. Under this agreement, Alliance Capital Real Estate agreed to pay up to $4.2 million of the cost to drill and core an initial test well in the Meade Peak shale formation and MRC Rockies agreed to pay up to an additional $630,000 to conclude such operations, if necessary. Each entity has agreed to pay 50% of any costs over $4.83 million. Roxanna Rocky Mountains elected to participate for up to a 10% working interest in the initial test well with the costs for its working interest to be carried by MRC Rockies. The 10% carried working interest participation by Roxanna Rocky Mountains in the initial test well was assigned from MRC Rockies’ 50% working interest in the leases within the 5,760 gross acres around the drill site.
After receipt of the laboratory analysis of the whole core data from the initial test well, Alliance Capital Real Estate has the option to purchase up to a 50% working interest in the balance of all the leases in the prospect owned by MRC Rockies, to elect to drill and complete a second test well in the prospect at an agreed upon location or to elect not to proceed with further exploration of the prospect. If it elects to drill a second test well, it will pay up to $5.0 million of the costs to drill and complete, and to perform a production test on, the well. Each entity will pay 50% of any costs over $5.0 million. After drilling and production testing the second test well, Alliance Capital Real Estate has a second option to purchase up to a 50% working interest in the balance of the leases owned by MRC Rockies in the prospect. If Alliance Capital Real Estate elects to drill a second test well, Roxanna Rocky Mountains will have a similar option to participate for up to a 10% carried working interest in the second test well, which will be assigned from MRC Rockies’ 50% working interest in the leases within the 5,760 gross acres around the second drill site. If Roxanna Rocky Mountains elects not to participate in the second test well, Roxanna Rocky Mountains
94
Table of Contents
Index to Financial Statements
will relinquish all of its rights in the leases within the 5,760 gross acres around the second drill site, other than its reserved 2.5% overriding royalty interest.
Roxanna Rocky Mountains will bear and pay its proportional working interest share of all lease maintenance costs on these two test wells and has the right to participate and pay its proportional working interest share of all costs, on a well-by-well basis, in the drilling of any subsequent well proposed to be drilled on the prospect, except that Roxanna Rocky Mountains will not have the right to participate in the 5,760 acres around any second test well if it relinquishes its working interest in the leases in that area because it elects not to participate.
The parties also agreed to a large area of mutual interest for the prospect over a 10-year period. All operations in the prospect are governed by the terms of a joint operating agreement, with the parties bearing their respective working interest shares of the costs of any subsequent wells drilled on the prospect after the first two test wells. All working interests owned by the parties in the prospect will be subject to a proportionally reduced 2.5% overriding royalty interest owned by Roxanna Rocky Mountains in the leases. We will be the operator of the first two test wells, if both are drilled, and are the operator for the project under the joint operating agreement. We began drilling the initial test well, the Crawford Federal #1 well in Lincoln County, Wyoming, in February 2011. We reached a depth of 8,200 feet, approximately 300 feet above the top of the Meade Peak shale, before having operations suspended for several months due to wildlife restrictions. We expect to resume operations on this initial test well in September 2011.
Acquisition of Bureau of Land Management Leases
In July 2010, we acquired approximately 850 gross and net acres in northwest Louisiana under two separate leases taken from the U.S. Bureau of Land Management that are primarily prospective for both the Haynesville and Middle Bossier shale plays. These leases have a ten-year primary term and a 12.5% lessor’s royalty. As part of the acquisition, we acquired the rights to one complete, approximately 640-acre, section in which we have a 100% working interest and are the operator. In March 2011, first sales of natural gas began from our Williams 17 H#1 well located in this section which we believe is in the core area of the Haynesville shale play. We began producing this well at a constrained rate of about 10.0 MMcf of natural gas per day that we believe optimizes overall well economics, even though we believe this well was initially capable of delivering 20.0 to 25.0 MMcf of natural gas per day. During June 2011, the well produced at an average rate of approximately 8.4 MMcf of natural gas per day and had produced approximately 0.9 Bcf of natural gas at June 30, 2011. We are the operator and have a 100% working interest in this well.
Glasscock Ranch Acquisition
On December 1, 2010, we acquired leasehold interests in approximately 8,900 gross and net acres in southeast Zavala County, Texas in the Eagle Ford shale play. We currently anticipate that this area of the Eagle Ford shale play will be predominantly prospective for oil and liquids. This acreage is also prospective for oil and liquids from other formations including the shallower Austin Chalk formation. We paid approximately $31.5 million to acquire this acreage. We own a 100% working interest in this property and are the operator.
Principal Areas of Interest
Our focus since inception has been the exploration for oil and natural gas in unconventional resource plays with a particular focus over the last few years in the Haynesville shale play and more recently in the
95
Table of Contents
Index to Financial Statements
Eagle Ford shale play. Our exploration efforts have concentrated primarily on known hydrocarbon-producing basins with well-established production histories offering the potential for multiple-zone completions. We have also sought to balance the risk profile of our prospects, as well as to explore for more conventional targets in addition to the unconventional resource plays.
At August 2011, our principal areas of interest consist of (1) the Eagle Ford shale play in south Texas, (2) the Haynesville shale play, including the Middle Bossier shale play, as well as the traditional Cotton Valley and Hosston (Travis Peak) plays in northwest Louisiana and east Texas, (3) the Meade Peak shale play in southwest Wyoming and the adjacent areas of Utah and Idaho and (4) southeast New Mexico and west Texas, including the Delaware and Midland Basins.
South Texas
Eagle Ford Shale and Other Formations
The Eagle Ford shale extends across portions of south Texas from the Mexican border into east Texas forming a band roughly 50 to 100 miles wide and 400 miles long. The Eagle Ford is an organically rich calcareous shale, in places transitioning to an organic, argillaceous lime-mudstone. It lies between the deeper Buda limestone and the shallower Austin Chalk formation. Most, if not all, of the oil found in the Austin Chalk and Buda formations is generally believed to be sourced from the Eagle Ford shale. In the prospective areas for the Eagle Ford, the interval averages 200 feet thick, is found at depths ranging from as shallow as 4,000 feet to as deep as 13,000 feet, and in much of the deeper portions of the play is overpressured. The Eagle Ford has a total organic carbon content of 1% to 7% that is comparable to the Haynesville shale, and is generally porous, with core-measured porosities ranging between 4% and 14%.
Along the entire length of the Eagle Ford trend the structural dip of the formation is consistently down to the south with relatively few, modestly sized structural perturbations. As a result, depth of burial increases consistently southwards along with the thermal maturity of the formation. Where the formation is shallow, it is less thermally mature and therefore more oil prone, and where it is more thermally mature, the Eagle Ford is more natural gas prone. The transition between the two typically includes a mixture of natural gas and oil depending on the degree of thermal maturity.
Most of the current Eagle Ford activity is concentrated in Atascosa, Bee, DeWitt, Dimmit, Frio, Gonzales, Karnes, LaSalle, Lavaca, Live Oak, Maverick, McMullen, Webb, Wilson and Zavala Counties in south Texas. The first horizontal wells drilled specifically for the Eagle Ford shale were drilled in 2008, leading to a discovery in LaSalle County. Since then, the play has expanded significantly across a large portion of south Texas.
Public information indicates that operators are typically drilling 3,500 to 7,000 feet horizontal laterals and applying hydraulic fracture stimulation in multiple stages along the full length of the horizontal laterals to complete the wells and establish production. Although production rates vary across the different areas of the play, initial production rates in the oil areas have been reported as high as 1,000 to 1,500 Bbls of oil per day with varying amounts of associated natural gas. In the natural gas areas of the Eagle Ford play, initial production rates as high as 5.0 to 15.0 MMcfe per day have been reported with varying amounts of associated oil and liquids.
At June 30, 2011, our aggregate leasehold interests consisted of approximately 56,000 gross acres and 29,000 net acres in the Eagle Ford shale play in Atascosa, DeWitt, Dimmit, Karnes, LaSalle, Gonzales, Webb, Wilson and Zavala Counties in south Texas. We believe portions of this acreage are also prospective
96
Table of Contents
Index to Financial Statements
for the Austin Chalk, Buda, Olmos and other formations, from which we expect to produce predominantly oil and liquids. In particular, the Austin Chalk, which is a naturally fractured carbonate ranging in thickness from 200 to 400 feet, has produced from several fields on or nearby portions of our acreage. Our Zavala County acreage, for example, is located within the historic Pearsall (Austin Chalk) field.
We believe that almost 85% of our Eagle Ford acreage is prospective predominantly for oil and liquids. We expect to use a portion of the net proceeds from this offering to explore and develop this acreage and to acquire additional acreage in south Texas as we seek to actively grow the oil and liquids component of our production and reserves. We currently own a 100% working interest in approximately 26,000 gross acres and 23,000 net acres in Dimmit, Gonzales, Karnes, LaSalle, Webb, Wilson and Zavala Counties and a 50% working interest in approximately 2,800 gross and 1,400 net acres in DeWitt County and are the operator of this acreage. We also own an approximate 21% working interest in approximately 27,100 gross acres in Atascosa County operated by EOG Resources, Inc. At June 30, 2011, approximately 80% of our Eagle Ford acreage is either held by production or not burdened by lease expirations before 2013.
At June 30, 2011, we had drilled four Eagle Ford wells on our operated properties — two of these wells were producing, one was completed and awaiting a natural gas pipeline connection and one was drilled and awaiting completion. At that date, we had also participated in two Eagle Ford wells with EOG Resources, Inc. as operator, on the Atascosa County acreage. Our first operated Eagle Ford horizontal well, the JCM Jr. Minerals #1H in southern LaSalle County along the Edwards Reef, was completed in November 2010. First sales of oil and natural gas began from this well in late January 2011, and at June 30, 2011, the well was producing approximately 1.0 MMcf of natural gas and 25 Bbls of condensate per day. Our second operated Eagle Ford horizontal well, the Martin Ranch #1H in northeastern LaSalle County, was completed in January 2011 and tested approximately 1,200 Bbls of oil per day during an initial flow test. First sales of oil and natural gas from this well began in late March at approximately 700 Bbls of oil and 350 Mcf of natural gas per day. At June 30, 2011, the well was producing approximately 500 Bbls of oil and 700 Mcf of natural gas per day. Our third operated Eagle Ford horizontal well, the Affleck #1H, was completed in February 2011 in eastern Dimmit County, Texas, and tested at approximately 415 Bbls of oil and 5.4 MMcf of natural gas per day during an initial flow test. This well has been shut-in while we negotiate a pipeline right-of-way and prepare to lay a gas sales line to the well, which we anticipate will be completed in September 2011. As we are in the initial stages of our Eagle Ford operations, we have only a small amount of production and proved reserves attributable to this acreage.
Between March and July 2011, we acquired leasehold interests in approximately 6,300 gross and 4,800 net acres in DeWitt, Karnes, Wilson and Gonzales Counties, Texas in the Eagle Ford shale play from Orca ICI Development, JV. We paid approximately $31.5 million to acquire this acreage. We currently own a 50% working interest in the acreage (approximately 2,800 gross and 1,400 net acres) in DeWitt County and are the operator. We currently own a 100% working interest in the acreage (approximately 3,500 gross and 3,400 net acres) in Karnes, Wilson and Gonzales Counties and are the operator.
We will pay 100% of the costs to drill and complete the first six wells drilled on the acreage in DeWitt County. We will have an 85% working interest in these six wells until we have recovered all of our acquisition, drilling and completion costs from each well, at which time Orca’s working interest will increase to 50%. When the cumulative production from each of the first six wells reaches 500,000 BOE, on a well-by-well basis, then Orca’s working interest in that well increases to 55%. If the cumulative production from each of the first six wells reaches 750,000 BOE, on a well-by-well basis, then Orca’s working interest in that well will increase to 70%. Both we and Orca will own a 50% working interest in all subsequent wells drilled after the first six wells on the acreage in DeWitt County.
97
Table of Contents
Index to Financial Statements
We will have a 100% working interest in the first five wells drilled on the acreage in Karnes, Wilson and Gonzales Counties. When we have recovered all of our acquisition, drilling and completion costs from each of these five wells, Orca may elect, on a well-by-well basis, to back-in for a 25% working interest in these wells. In addition, Orca retains a one-time election for a short period of time after we complete these first five wells to participate for a 25% working interest in all subsequent wells drilled on this acreage by paying a purchase price equal to 25% of our costs to acquire the acreage in Karnes, Wilson and Gonzales Counties.
In addition to the Eagle Ford potential on our acreage, we believe that approximately 24,000 gross acres and 15,000 net acres in south Texas are prospective primarily for the Austin Chalk, which has historically been targeted by operators in south Texas. We have not yet drilled an Austin Chalk well, and although we believe that other prospective well locations exist on this acreage, we have only included 16 gross and net well locations in our total identified drilling locations at June 30, 2011.
Northwest Louisiana and East Texas
Most of our current production and proved reserves is attributable to our acreage in northwest Louisiana and east Texas. For May 2011 about 75% of our daily production, or 36.8 MMcfe per day, was produced from the Haynesville shale, with another 16%, or 7.7 MMcfe per day, produced from the Cotton Valley and other shallower formations in this area. At March 31, 2011, approximately 85% of our proved reserves, or 131.9 Bcfe, is attributable to the Haynesville shale underlying this acreage with another 11% of our proved reserves, or 16.7 Bcfe, associated with the Cotton Valley and shallower formations. In addition, we are evaluating the Bossier shale play which is generally encountered above the Haynesville shale and below the Cotton Valley formation.
We operate all of our Cotton Valley and shallower production under this acreage, as well as all of our Haynesville production on the acreage outside of what we believe to be the core area of the Haynesville play. Of the approximately 5,500 net acres that we consider to be in the core area of the Haynesville play, we operate about 22% of that acreage.
Haynesville and Middle Bossier Shales
The Haynesville shale is an organically rich, overpressured marine shale found below the Cotton Valley and Bossier formations and above the Smackover formation at depths ranging from 10,500 to 13,500 feet across a broad region throughout northwest Louisiana and east Texas, including principally Bossier, Caddo, DeSoto and Red River Parishes in Louisiana and Harrison, Rusk, Panola and Shelby Counties in Texas. The Haynesville shale has a typical thickness ranging from 100 to 300 feet. Total organic carbon ranges from 0.5% to 5.0%, with core-measured porosities from 3% to 15%. The Haynesville shale produces primarily dry natural gas with almost no associated liquids.
The oil and natural gas industry has focused significant attention on the Haynesville shale play over the last three years, and the play is currently one of the most active and economically viable in the United States. Operators are typically drilling 4,500 to 5,000 feet horizontal laterals and applying hydraulic fracture stimulation in multiple stages along the entire length of the horizontal laterals to complete the wells and establish production. Although production rates vary widely across the play, in the core area of the play, initial production rates of 20.0 to 25.0 MMcf per day of natural gas have been reported by operators.
The Bossier shale is overpressured and is often divided into lower, middle and upper units. The Middle Bossier shale appears to be productive for natural gas under large portions of DeSoto, Red River and Sabine
98
Table of Contents
Index to Financial Statements
Parishes in Louisiana and Shelby and Nacogdoches Counties in Texas, where it shares many similar productive characteristics to the deeper Haynesville shale. Typically, the Middle Bossier shale is found at depths ranging from 500 to 800 feet shallower than the Haynesville shale, has a typical thickness ranging from 150 to 300 feet, has core-measured porosities ranging between 5% and 14%, and total organic carbon values between 0.5% and 4%. Although there is some overlap between the Bossier and Haynesville shale plays, the two plays appear quite distinct and a separate horizontal wellbore is typically needed for each formation.
We have leasehold and mineral interests in approximately 23,000 gross and 15,000 net acres prospective for the Haynesville shale. Portions of our acreage are located in Caddo, DeSoto, Bossier and Red River Parishes, Louisiana and in Harrison County, Texas. This acreage includes just over 5,500 net acres in what we believe is the core area of the play. Approximately 90% of our Haynesville acreage is held by production and portions of it are also producing from and, we believe, prospective for the Cotton Valley, Hosston (Travis Peak) and other shallower formations. In addition, we believe that approximately 1,700 net acres are prospective for the Middle Bossier play as well. We have not yet drilled a Middle Bossier shale well, and although we believe that prospective well locations exist on this acreage, we have not yet included any Middle Bossier locations in our identified drilling locations at June 30, 2011.
Within the 5,500 net acres that we believe to be in the core area of the Haynesville shale play, we are the operator in two sections where we have working interests of 95% and 100% in all wells to be drilled. In October 2010, as operator, we drilled and completed our L.A. Wildlife H #1 horizontal Haynesville well in the section in which we have a 95% working interest and on December 31, 2010 first sales of natural gas began from this well. At June 30, 2011, the well was producing approximately 10.6 MMcf of natural gas per day, and through June 30, 2011, had produced a total of approximately 1.7 Bcf of natural gas. In March 2011, we completed our operated Williams 17 H #1 horizontal Haynesville well on the second section where we have a 100% working interest. During June 2011, this well produced at an average daily rate of 8.4 MMcf of natural gas per day and had produced approximately 0.9 Bcf of natural gas at June 30, 2011. We began producing both of these wells at a constrained rate of about 10.0 MMcf of natural gas per day that we believe optimizes overall well economics, even though we believe that both were initially capable of delivering 20.0 to 25.0 MMcf of natural gas per day. We have identified 12 gross and approximately 12 net potential additional Haynesville locations that we may drill and operate in the future in these two sections.
The remainder of our acreage in the core area of the Haynesville shale play, about 4,300 net acres, is operated by other companies. As described above in “Business—Other Significant Prior Events—Chesapeake Transaction,” just over half of our non-operated Haynesville acreage in this area of the play results from our transaction with Chesapeake in July 2008. The remainder of our non-operated Haynesville acreage is attributable to leasehold interests that we hold in approximately 75 sections in Caddo, DeSoto, Bossier and Red River Parishes. Our working interests in the Haynesville wells in these sections range from less than 1% to more than 30%. At June 30, 2011, we were participating in 90 non-operated Haynesville wells with Chesapeake and other operators, including producing wells and wells being drilled and completed at that time. During May 2011, our production from these wells averaged approximately 20.0 MMcfe per day.
Cotton Valley, Hosston (Travis Peak) and Other Shallower Formations
Prior to initiating natural gas production from the Haynesville shale in 2009, almost all of our production and reserves in northwest Louisiana and east Texas were attributable to wells producing from the Cotton Valley formation. We own almost all of the shallow rights from the base of the Cotton Valley formation to the surface under our acreage in northwest Louisiana and east Texas.
99
Table of Contents
Index to Financial Statements
All of the shallow rights underlying our acreage in our Elm Grove/Caspiana properties in northwest Louisiana, approximately 10,000 gross and net acres, is held by existing production from the Cotton Valley formation or the Haynesville formation. The Cotton Valley formation was the primary producing zone in the Elm Grove field prior to discovery of the Haynesville formation. The Cotton Valley is a low permeability gas sand that ranges in thickness from 200 to 300 feet and has porosites ranging from 6% to 10%.
In January 2011, we completed our first horizontal Cotton Valley well, the Tigner Walker H #1-Alt. in our Elm Grove/Caspiana properties, in DeSoto Parish and commenced sales of natural gas from this well. Prior to this time, we had only drilled and completed vertical Cotton Valley and Hosston wells on these properties. At June 30, 2011, this well was producing approximately 3.0 MMcf of natural gas per day and through June 30, 2011, had produced a total of approximately 600 MMcf of natural gas. We have been producing this well at a constrained natural gas rate in order to handle the associated water production with both our surface and salt water disposal facilities. We are the operator and have a 100% working interest in this well. We have identified 60 gross and 36 net additional drilling locations for future Cotton Valley horizontal wells in our Elm Grove/Caspiana properties. We do not plan to drill any of these locations during the remainder of 2011 or in 2012. As all of this acreage is held by existing production, we expect to allocate our near-term capital expenditures primarily to exploration and development of our Eagle Ford shale acreage in south Texas and to additional exploration and development of our Haynesville acreage in northwest Louisiana.
We also continue to hold the shallow rights by existing production or by leases that are still in their primary terms in our central and southwest Pine Island, Longwood, Woodlawn and other prospect areas in northwest Louisiana and east Texas. We hold an estimated 11,500 net leasehold and mineral acres by existing production in these areas.
Southwest Wyoming, Northeast Utah and Southeast Idaho — Meade Peak Shale
The Meade Peak shale is an organic-rich source rock that has sourced much of the oil and natural gas in conventional reservoirs in the western Wyoming and eastern Utah area. The Meade Peak shale has an observed shale thickness of 70 to 350 feet, total organic carbon of 3% to 7%, and vitrinite reflectance values ranging from 1.8% to 2.7%. The Meade Peak is encountered at drill depths of 3,000 to 14,000 feet, with the majority of our acreage in the depth range of 3,000 to 10,000 feet. The formation has been penetrated by over 100 wells in the area, most of which have natural gas shows. Seismic and subsurface data show distinct, stacked thrust plates with areas of sediment prospective for natural gas.
Together with our joint venture partner, Roxanna Rocky Mountains, LLC, we have assembled 144,368 gross, or 135,862 net, acres in southwest Wyoming and adjacent areas in Utah and Idaho as part of a natural gas shale exploratory prospect targeting the Meade Peak shale. The majority of this acreage, with lease terms of 5 to 10 years, has been acquired by us within the past four years, and we are the operator of this prospect. We have no production and no proved reserves attributable to this acreage at June 30, 2011.
We believe there have been no previous attempts to drill horizontally or to hydraulically fracture the Meade Peak shale in this area. Our focus to date has been to confirm the structure of the Meade Peak shale, understand its characteristics and evaluate its potential. We have gathered well log data in the area and studied the petrophysical characteristics. In addition, we have purchased 2-D seismic data and have worked with a structural geologist that has experience in the immediate area to better understand the area’s tectonic history.
100
Table of Contents
Index to Financial Statements
As described in “Business — Other Significant Prior Events — Alliance Capital Participation Agreement,” we are the operator of this prospect and have entered into a participation and joint operating agreement with other parties covering the initial exploration efforts and, if successful, the future development of this acreage. We began drilling the initial test well on this prospect, the Crawford Federal #1 well in Lincoln County, Wyoming, in February 2011. We reached a depth of 8,200 feet, approximately 300 feet above the top of the Meade Peak shale, before having operations suspended for several months due to wildlife restrictions. We expect to resume operations on this initial test well in September 2011.
Southeast New Mexico and West Texas — Delaware and Midland Basins
The Delaware and Midland Basins are mature exploration and production provinces with extensive developments in a wide variety of petroleum systems resulting in stacked target horizons in many areas. Historically, the majority of development in these basins has focused on relatively conventional reservoir targets, but we believe the combination of advanced formation evaluation, 3D seismic technology, horizontal drilling and hydraulic fracturing technology is enhancing the development potential of these basins.
One example of such an opportunity appears to be the so-called “Wolf-Bone” play of the Delaware Basin. Together, the Lower Permian age Bone Spring (also called Leonardian) and Wolfcamp formations span several thousand feet of stacked shales, sandstones, limestones and dolomites representing complex and dynamic submarine depositional systems that include several organic rich source rocks. Throughout these intervals, oil and natural gas have been produced primarily from conventional sandstone and carbonate reservoirs even though hydrocarbons are trapped in the tight sands, limestones and dolomites interbedded within organic rich shale. Recently, these hydrocarbon-bearing zones have been recognized by a number of operators as targets for horizontal drilling and multi-stage hydraulic fracturing techniques. As a result, several large industry players are expanding positions and conducting drilling programs throughout Lea and Eddy Counties in southeast New Mexico and Loving, Reeves and Ward Counties in west Texas.
Although the Delaware and Midland Basins have not been a primary focus of our recent operations or exploration efforts, we are currently developing new oil and natural gas prospects in these basins. Most notably, we have identified potential drilling opportunities on our acreage, particularly in southeast New Mexico, near old vertical wells, some of which have produced up to 1,000,000 BOE from the Wolfcamp formation and up to 500,000 BOE from the Bone Spring formation. These wells suggest a hydrocarbon-rich environment in the area of our acreage, and after completing our internal geologic studies, we may determine to drill a Wolfcamp or Bone Spring vertical well or to drill a horizontal well to test these formations on our acreage. At June 30, 2011, we had not included any potential drilling locations on our acreage in our total identified drilling locations, and we had not budgeted any capital expenditures to drill wells in southeast New Mexico or west Texas during the remainder of 2011 and all of 2012. We have budgeted $20.0 million of our anticipated 2012 capital expenditures to acquire additional leasehold interests primarily prospective for oil and liquids production in areas of southeast New Mexico and west Texas where we are developing new prospects. Although we do have existing leasehold interests in this area, we believe approximately 20,000 gross and 17,500 net acres are no longer prospective, and we plan to let them expire without drilling.
101
Table of Contents
Index to Financial Statements
Operating Summary
The following table sets forth certain unaudited production data for the years ended December 31, 2010, 2009 and 2008 and the three months ended March 31, 2011 and 2010:
| Year Ended December 31, | Three Months Ended March 31, |
|||||||||||||||||||
| 2010 | 2009 | 2008 | 2011 | 2010 | ||||||||||||||||
| Unaudited Production Data |
||||||||||||||||||||
| Net Production Volumes: |
||||||||||||||||||||
| Oil (MBbls) |
33 | 30 | 37 | 19 | 8 | |||||||||||||||
| Natural gas (Bcf) |
8.4 | 4.8 | 3.1 | 3.3 | 1.8 | |||||||||||||||
| Total natural gas equivalents (Bcfe)(1) |
8.6 | 5.0 | 3.3 | 3.4 | 1.8 | |||||||||||||||
| Average daily production (MMcfe/d) |
23.6 | 13.7 | 9.0 | 37.8 | 20.5 | |||||||||||||||
| Average Sales Prices: |
||||||||||||||||||||
| Oil (per Bbl) |
$ | 76.39 | $ | 57.72 | $ | 98.59 | $ | 89.11 | $ | 75.29 | ||||||||||
| Natural gas, with realized derivatives (per Mcf) |
$ | 4.38 | $ | 5.17 | $ | 8.32 | $ | 4.22 | $ | 4.93 | ||||||||||
| Natural gas, without realized derivatives (per Mcf) |
$ | 3.75 | $ | 3.59 | $ | 8.75 | $ | 3.65 | $ | 4.76 | ||||||||||
| Operating Expenses (per Mcfe): |
||||||||||||||||||||
| Production taxes and marketing |
$ | 0.23 | $ | 0.22 | $ | 0.50 | $ | 0.38 | $ | 0.14 | ||||||||||
| Lease operating |
$ | 0.61 | $ | 0.94 | $ | 1.41 | $ | 0.47 | $ | 0.72 | ||||||||||
| Depletion, depreciation and amortization |
$ | 1.81 | $ | 2.15 | $ | 3.67 | $ | 2.09 | $ | 1.82 | ||||||||||
| General and administrative |
$ | 1.13 | $ | 1.42 | $ | 2.50 | $ | 0.77 | $ | 1.10 | ||||||||||
| (1) | Estimated using a conversion ratio of one Bbl per six Mcf. |
The following table sets forth information regarding our average net daily production and total production for the year ended December 31, 2010 from our primary operating areas:
| Average Net Daily Production | Total
Net Production (MMcfe) |
Percentage of Total Net Production |
||||||||||||||||||
| Gas (Mcf/d) |
Oil (Bbls/d) |
Gas Equivalent (Mcfe/d) |
||||||||||||||||||
| South Texas: |
– | – | ||||||||||||||||||
| Eagle Ford |
4 | 19 | 119 | 43 | 0.5 | |||||||||||||||
| Austin Chalk(1) |
– | – | – | – | – | |||||||||||||||
|
|
|
|
|
|
|
|
|
|
|
|||||||||||
| Area Total |
4 | 19 | 119 | 43 | 0.5 | |||||||||||||||
|
|
|
|
|
|
|
|
|
|
|
|||||||||||
| NW Louisiana/E Texas: |
||||||||||||||||||||
| Haynesville |
17,127 | 1 | 17,132 | 6,253 | 72.7 | |||||||||||||||
| Cotton Valley(2) |
5,840 | 40 | 6,074 | 2,218 | 25.8 | |||||||||||||||
|
|
|
|
|
|
|
|
|
|
|
|||||||||||
| Area Total |
22,967 | 41 | 23,206 | 8,471 | 98.5 | |||||||||||||||
|
|
|
|
|
|
|
|
|
|
|
|||||||||||
| SW Wyoming, NE Utah, SE Idaho(1) |
– | – | – | – | – | |||||||||||||||
| SE New Mexico, West Texas |
43 | 31 | 228 | 83 | 1.0 | |||||||||||||||
|
|
|
|
|
|
|
|
|
|
|
|||||||||||
| Total |
23,014 | 91 | 23,553 | 8,597 | 100.0 | |||||||||||||||
|
|
|
|
|
|
|
|
|
|
|
|||||||||||
| (1) | We currently have no production from our acreage in southwest Wyoming and adjacent areas of Utah and Idaho and insignificant production from the Austin Chalk formation in south Texas. |
| (2) | Includes the Cotton Valley and shallower zones and also includes one well producing from the Frio formation in Orange County, Texas. Also includes two wells producing from the San Miguel formation in Zavala County, Texas. |
102
Table of Contents
Index to Financial Statements
The following table sets forth information regarding our average net daily production and total production for the three months ended March 31, 2011 from our primary operating areas:
| Average Net Daily Production | Total
Net Production (MMcfe) |
Percentage of Total Net Production |
||||||||||||||||||
| Gas (Mcf/d) |
Oil (Bbls/d) |
Gas Equivalent (Mcfe/d) |
||||||||||||||||||
| South Texas: |
||||||||||||||||||||
| Eagle Ford |
1,460 | 106 | 2,095 | 191 | 5.6 | |||||||||||||||
| Austin Chalk(1) |
– | – | – | – | – | |||||||||||||||
|
|
|
|
|
|
|
|
|
|
|
|||||||||||
| Area Total |
1,460 | 106 | 2,095 | 191 | 5.6 | |||||||||||||||
|
|
|
|
|
|
|
|
|
|
|
|||||||||||
| NW Louisiana/E Texas: |
||||||||||||||||||||
| Haynesville |
28,448 | 3 | 28,466 | 2,562 | 75.3 | |||||||||||||||
| Cotton Valley(2) |
6,599 | 74 | 7,045 | 631 | 18.6 | |||||||||||||||
|
|
|
|
|
|
|
|
|
|
|
|||||||||||
| Area Total |
35,047 | 77 | 35,511 | 3,193 | 93.9 | |||||||||||||||
|
|
|
|
|
|
|
|
|
|
|
|||||||||||
| SW Wyoming, NE Utah, SE Idaho(1) |
– | – | – | – | – | |||||||||||||||
| SE New Mexico, West Texas |
38 | 26 | 196 | 18 | 0.5 | |||||||||||||||
|
|
|
|
|
|
|
|
|
|
|
|||||||||||
| Total |
36,545 | 209 | 37,802 | 3,402 | 100.0 | |||||||||||||||
|
|
|
|
|
|
|
|
|
|
|
|||||||||||
| (1) | We currently have no production from our acreage in southwest Wyoming and adjacent areas of Utah and Idaho and insignificant production from the Austin Chalk formation in south Texas. |
| (2) | Includes the Cotton Valley and shallower zones and also includes one well producing from the Frio formation in Orange County, Texas. Also includes two wells producing from the San Miguel formation in Zavala County, Texas. |
Our total production of 3.4 Bcfe for the three months ended March 31, 2011, was an increase of 84% over our total production of 1.8 Bcfe for the three months ended March 31, 2010. Most of this increase is primarily attributable to our drilling operations in the Haynesville shale play and also reflects production from our first operated wells in the Eagle Ford shale play. Our total production of 8.6 Bcfe for the year ended December 31, 2010, was an increase of 72% over our total production of 5.0 Bcfe for the year ended December 31, 2009. Most of this increase is primarily attributable to our drilling operations in the Haynesville shale play. Our 2009 total production of 5.0 Bcfe was a 51% increase over our total production of 3.3 Bcfe in 2008. Most of this increase is primarily attributable to our drilling operations in the Haynesville shale play. In addition, as a result of initial production from several wells that were recently completed and turned to sales, our daily production for the month ended May 31, 2011 increased to 49.1 MMcfe per day.
103
Table of Contents
Index to Financial Statements
Producing Wells
The following table sets forth information relating to producing wells at June 30, 2011. Wells are classified as oil or natural gas according to their predominant production stream. We do not have any currently active dual completions. We have an approximate average working interest of 92% in all wells that we operate. For wells where we are not the operator, our working interests range from less than 1% to as much as 44%, and average approximately 11%. In the table below, gross wells are the total number of producing wells in which we own a working interest, and net wells represent the total of our fractional working interests owned in the gross wells.
| Natural Gas Wells | Oil Wells | Total Wells | ||||||||||||||||||||||
| Gross | Net | Gross | Net | Gross | Net | |||||||||||||||||||
| South Texas: |
||||||||||||||||||||||||
| Eagle Ford |
1.0 | 1.0 | 3.0 | 1.4 | 4.0 | 2.4 | ||||||||||||||||||
| Austin Chalk(1) |
– | – | – | – | – | – | ||||||||||||||||||
|
|
|
|
|
|
|
|
|
|
|
|
|
|||||||||||||
| Area Total |
1.0 | 1.0 | 3.0 | 1.4 | 4.0 | 2.4 | ||||||||||||||||||
|
|
|
|
|
|
|
|
|
|
|
|
|
|||||||||||||
| NW Louisiana/E Texas: |
||||||||||||||||||||||||
| Haynesville |
64.0 | 10.3 | – | – | 64.0 | 10.3 | ||||||||||||||||||
| Cotton Valley(2) |
106.0 | 69.7 | 2.0 | 2.0 | 108.0 | 71.7 | ||||||||||||||||||
|
|
|
|
|
|
|
|
|
|
|
|
|
|||||||||||||
| Area Total |
170.0 | 80.0 | 2.0 | 2.0 | 172.0 | 82.0 | ||||||||||||||||||
|
|
|
|
|
|
|
|
|
|
|
|
|
|||||||||||||
| SW Wyoming, NE Utah, SE Idaho(1) |
– | – | – | – | – | – | ||||||||||||||||||
| SE New Mexico, West Texas |
1.0 | 0.6 | 12.0 | 5.1 | 13.0 | 5.7 | ||||||||||||||||||
|
|
|
|
|
|
|
|
|
|
|
|
|
|||||||||||||
| Total |
172.0 | 81.6 | 17.0 | 8.5 | 189.0 | 90.1 | ||||||||||||||||||
|
|
|
|
|
|
|
|
|
|
|
|
|
|||||||||||||
| (1) | We currently have no producing wells on our acreage in southwest Wyoming and adjacent areas of Utah and Idaho and insignificant production from the Austin Chalk formation in south Texas. |
| (2) | Includes shallower zones and also includes one well producing from the Frio formation in Orange County, Texas. Also includes two wells producing from the San Miguel formation in Zavala County, Texas. |
104
Table of Contents
Index to Financial Statements
Estimated Proved Reserves
The following table sets forth our estimated proved oil and natural gas reserves at December 31, 2010, 2009 and 2008 and at March 31, 2011. The reserves estimates at December 31, 2008 presented in the table below were based on evaluations prepared by our engineering staff and have been audited for their reasonableness and conformance with generally accepted petroleum engineering and evaluation principles by LaRoche Petroleum Consultants, Ltd., independent reservoir engineers. The reserves estimates at December 31, 2010 and 2009 and at March 31, 2011 were based on evaluations prepared by our engineering staff and have been audited for their reasonableness and conformance with generally accepted petroleum engineering and evaluation principles by Netherland, Sewell & Associates, Inc., independent reservoir engineers. These reserves estimates were prepared in accordance with the SEC’s rules for oil and natural gas reserves reporting that were in effect at the time of the preparation of the reserves report. The estimated reserves shown are for proved reserves only and do not include any unproved reserves classified as probable or possible reserves that might exist for our properties, nor do they include any consideration that could be attributable to interests in unproved and unevaluated acreage beyond those tracts for which proved reserves have been estimated. Proved oil and natural gas reserves are the estimated quantities of crude oil, natural gas and natural gas liquids which geological and engineering data demonstrate with reasonable certainty to be recoverable in future years from known reservoirs under existing economic and operating conditions. Our total estimated proved reserves are estimated using a conversion ratio of one Bbl per six Mcf.
| At December 31,(1) | At March 31, | |||||||||||||||
| 2010 | 2009 | 2008 | 2011 | |||||||||||||
| Estimated Proved Reserves Data:(2) |
||||||||||||||||
| Estimated proved reserves: |
||||||||||||||||
| Natural gas (Bcf) |
127.4 | 63.9 | 19.2 | 150.1 | ||||||||||||
| Oil (MBbls) |
152 | 103 | 131 | 780 | ||||||||||||
|
|
|
|
|
|
|
|
|
|||||||||
| Total (Bcfe) |
128.3 | 64.5 | 20.0 | 154.8 | ||||||||||||
|
|
|
|
|
|
|
|
|
|||||||||
| Estimated proved developed reserves: |
||||||||||||||||
| Natural gas (Bcf) |
43.1 | 25.4 | 19.2 | 53.7 | ||||||||||||
| Oil (MBbls) |
152 | 103 | 131 | 403 | ||||||||||||
|
|
|
|
|
|
|
|
|
|||||||||
| Total (Bcfe) |
44.1 | 26.0 | 20.0 | 56.1 | ||||||||||||
|
|
|
|
|
|
|
|
|
|||||||||
| Percent developed |
34.3 | % | 40.3 | % | 100.0 | % | 36.2 | % | ||||||||
| Estimated proved undeveloped reserves: |
||||||||||||||||
| Natural gas (Bcf) |
84.3 | 38.6 | – | 96.5 | ||||||||||||
| Oil (MBbls) |
– | – | – | 377 | ||||||||||||
|
|
|
|
|
|
|
|
|
|||||||||
| Total (Bcfe) |
84.3 | 38.6 | – | 98.7 | ||||||||||||
|
|
|
|
|
|
|
|
|
|||||||||
| PV-10(3) (in thousands) |
$ | 119,869 | $ | 70,359 | $ | 44,069 | $ | 140,639 | ||||||||
| Standardized Measure(4) (in thousands) |
$ | 111,077 | $ | 65,061 | $ | 43,254 | $ | 131,521 | ||||||||
| (1) | Numbers in table may not total due to rounding. |
| (2) | Our estimated proved reserves, PV-10 and Standardized Measure were determined using index prices for oil and natural gas, without giving effect to derivative transactions, and were held constant throughout the life of the properties. The index prices were $41.00 per Bbl for oil and $5.710 per MMBtu for natural gas at December 31, 2008. The unweighted arithmetic averages of the first-day-of-the-month prices for the 12 months ended December 31, 2009 were $57.65 per Bbl for oil and $3.866 per MMBtu for natural gas, for the 12 months ended December 31, 2010 were $75.96 per Bbl for oil and $4.376 per MMBtu for natural gas, and for the 12-month period from April 2010 to March 2011 were $80.04 per Bbl for oil and $4.102 per MMBtu for natural gas. These prices were adjusted by lease for quality, energy content, regional price differentials, transportation fees, marketing deductions and other factors affecting the price received at the wellhead. |
| (3) | PV-10 is a non-GAAP financial measure and generally differs from Standardized Measure, the most directly comparable GAAP financial measure, because it does not include the effects of income taxes on future net revenues. PV-10 is not an estimate of the fair market value of our properties. We and others in the industry use PV-10 as a measure to compare the relative size and value of proved reserves held by companies and of the potential return on investment related to the companies’ properties without regard to the specific tax characteristics of such entities. Our PV-10 at December 31, 2008, 2009, and 2010 and at March 31, 2011 may be reconciled to our |
105
Table of Contents
Index to Financial Statements
| Standardized Measure of discounted future net cash flows at such dates by reducing our PV-10 by the discounted future income taxes associated with such reserves. The discounted future income taxes, in thousands, at December 31, 2008, 2009 and 2010 and at March 31, 2011 were $815, $5,298, $8,792 and $9,118 respectively. |
| (4) | Standardized Measure represents the present value of estimated future net cash flows from proved reserves, less estimated future development, production, plugging and abandonment costs and income tax expenses, discounted at 10% per annum to reflect the timing of future cash flows. Standardized Measure is not an estimate of the fair market value of our properties. |
In 2009, the SEC provided new guidelines for estimating and reporting oil and natural gas reserves. Included in these new guidelines were two important changes impacting our reserves estimates and value at December 31, 2009. First, proved undeveloped reserves can be assigned to well locations more than one offset location away from an existing well if supported by geologic continuity and existing technology. Second, under these new guidelines, oil and natural gas reserves at December 31, 2010 and 2009 and at March 31, 2011 were estimated using an unweighted, arithmetic average of the first-day-of-the-month oil and natural gas prices for the periods January through December 2009, January through December 2010, and April 2010 through March 2011, respectively, as further described in footnote two to the table above. Prior to these periods, SEC guidelines for estimating and reporting oil and natural gas reserves required using commodity prices at the date of the reserves estimate, or, in the cases above, at December 31, 2008, as further described in footnote two to the table above.
Our total proved oil and natural gas reserves increased from 128.3 Bcfe at December 31, 2010 to 154.8 Bcfe at March 31, 2011. Most of this increase is attributable to proved reserves added due to our drilling operations in the Haynesville shale play. The increase in proved oil reserves specifically from 152 MBbls at December 31, 2010 to 780 MBbls at March 31, 2011 is attributable to proved oil reserves added due to our drilling operations in the Eagle Ford shale play. Our proved developed reserves increased from 44.1 Bcfe at December 31, 2010 to 56.1 Bcfe at March 31, 2011 due primarily to proved developed reserves added as a result of drilling operations in the Haynesville shale play. The increase in proved developed oil reserves specifically from 152 MBbls at December 31, 2010 to 403 MBbls at March 31, 2011 is attributable to proved developed oil reserves added due to our drilling operations in the Eagle Ford shale play. Our proved undeveloped reserves increased from 84.3 Bcfe at December 31, 2010 to 98.7 Bcfe at March 31, 2011 due primarily to our drilling operations in the Haynesville. The increase in our proved undeveloped oil reserves specifically from zero to 377 MBbls at March 31, 2011 is attributable to our drilling operations in the Eagle Ford shale play. Our proved reserves at March 31, 2011 were made up of about 97% natural gas and 3% oil.
Our total proved oil and natural gas reserves increased from 64.5 Bcfe at December 31, 2009 to 128.3 Bcfe at December 31, 2010. Taking into consideration the 8.6 Bcfe in production for the year ended December 31, 2010, we added approximately 72.4 Bcfe in proved reserves during 2010, which represents a gain of about 112%. Almost all of this increase is attributable to proved reserves added due to drilling operations in the Haynesville shale play. Our proved developed reserves increased from 26.0 Bcfe at December 31, 2009 to 44.1 Bcfe at December 31, 2010 due primarily to proved developed reserves added as a result of drilling operations in the Haynesville shale play. Our proved undeveloped reserves increased from 38.6 Bcfe at December 31, 2009 to 84.3 Bcfe at December 31, 2010 due to drilling operations in the Haynesville shale play. Our proved reserves at December 31, 2010 were made up of about 99% natural gas and 1% oil.
Our total proved oil and natural gas reserves increased from 20.0 Bcfe at December 31, 2008 to 64.5 Bcfe at December 31, 2009. Taking into consideration the 5.0 Bcfe in total production for 2009, we added approximately 49.5 Bcfe in proved reserves during 2009, which represents a gain of about 248%. The results from the Haynesville shale drilling program in our Elm Grove/Caspiana asset in northwest Louisiana during 2009 resulted in a significant increase in our total proved reserves at December 31, 2009. Our proved
106
Table of Contents
Index to Financial Statements
developed reserves increased from 20.0 Bcfe at December 31, 2008 to 26.0 Bcfe at December 31, 2009, which is also attributable to the Haynesville shale drilling program in our Elm Grove/Caspiana asset during 2009. Our proved undeveloped reserves increased from zero at December 31, 2008 to 38.6 Bcfe at December 31, 2009 due entirely to proved undeveloped reserves added as a result of drilling operations in the Haynesville shale play during 2009. Our proved reserves at December 31, 2009 were made up of about 99% natural gas and 1% oil.
The following table sets forth additional summary information by operating area with respect to our estimated proved reserves at March 31, 2011:
| Net Proved Reserves(1) | ||||||||||||||||||||
| Oil | Gas | Gas Equivalent |
PV-10(2) | Standardized Measure(3) |
||||||||||||||||
| (MBbls) | (Bcf) | (Bcfe) | (In millions) | (In millions) | ||||||||||||||||
| South Texas: |
||||||||||||||||||||
| Eagle Ford |
611 | 1.9 | 5.6 | 15.4 | 14.4 | |||||||||||||||
| Austin Chalk(4) |
– | – | – | – | – | |||||||||||||||
|
|
|
|
|
|
|
|
|
|
|
|||||||||||
| Area Total |
611 | 1.9 | 5.6 | 15.4 | 14.4 | |||||||||||||||
|
|
|
|
|
|
|
|
|
|
|
|||||||||||
| NW Louisiana/E Texas: |
||||||||||||||||||||
| Haynesville |
– | 131.9 | 131.9 | 99.4 | 93.0 | |||||||||||||||
| Cotton Valley(5) |
76 | 16.2 | 16.7 | 23.9 | 22.4 | |||||||||||||||
|
|
|
|
|
|
|
|
|
|
|
|||||||||||
| Area Total |
76 | 148.1 | 148.6 | 123.3 | 115.4 | |||||||||||||||
|
|
|
|
|
|
|
|
|
|
|
|||||||||||
| SW Wyoming, NE Utah, SE Idaho(4) |
– | – | – | – | – | |||||||||||||||
| SE New Mexico, West Texas |
93 | 0.1 | 0.6 | 2.0 | 1.9 | |||||||||||||||
|
|
|
|
|
|
|
|
|
|
|
|||||||||||
| Total |
780 | 150.1 | 154.8 | 140.6 | 131.5 | |||||||||||||||
|
|
|
|
|
|
|
|
|
|
|
|||||||||||
| (1) | Numbers in table may not total due to rounding. |
| (2) | PV-10 is a non-GAAP financial measure and generally differs from Standardized Measure, the most directly comparable GAAP financial measure, because it does not include the effects of income taxes on future net revenues. PV-10 is not an estimate of the fair market value of our properties. We and others in the industry use PV-10 as a measure to compare the relative size and value of proved reserves held by companies and of the potential return on investment related to the companies’ properties without regard to the specific tax characteristics of such entities. Our PV-10 at March 31, 2011 may be reconciled to our Standardized Measure of discounted future net cash flows at such dates by reducing our PV-10 by the discounted future income taxes associated with such reserves. The discounted future income taxes at March 31, 2011 were approximately $9.1 million. |
| (3) | Standardized Measure represents the present value of estimated future net cash flows from proved reserves, less estimated future development, production, plugging and abandonment costs and income tax expenses, discounted at 10% per annum to reflect the timing of future cash flows. Standardized Measure is not an estimate of the fair market value of our properties. |
| (4) | At March 31, 2011, we had no proved reserves attributable to the Austin Chalk formation in south Texas or to our acreage in southwest Wyoming and adjacent areas of Utah and Idaho. |
| (5) | Includes Cotton Valley and shallower zones and also includes one well producing from the Frio formation in Orange County, Texas. Also includes two wells producing from the San Miguel formation in Zavala County, Texas. |
Technology Used to Establish Reserves
Under the new SEC rules, proved reserves are those quantities of oil and natural gas, which, by analysis of geoscience and engineering data, can be estimated with reasonable certainty to be economically producible from a given date forward, from known reservoirs, and under existing economic conditions, operating methods and government regulations. The term “reasonable certainty” implies a high degree of confidence that the quantities of oil and/or natural gas actually recovered will equal or exceed the estimate. Reasonable certainty can be established using techniques that have been proven effective by actual production from projects in the same reservoir or an analogous reservoir or by other evidence using reliable
107
Table of Contents
Index to Financial Statements
technology that establishes reasonable certainty. Reliable technology is a grouping of one or more technologies (including computational methods) that have been field tested and have been demonstrated to provide reasonably certain results with consistency and repeatability in the formation being evaluated or in an analogous formation.
In order to establish reasonable certainty with respect to our estimated proved reserves, we used technologies that have been demonstrated to yield results with consistency and repeatability. The technologies and technical data used in the estimation of our proved reserves include, but are not limited to, electric logs, radioactivity logs, core analyses, geologic maps and available downhole and production data, seismic data and well test data. Reserves for proved developed producing wells were estimated using production performance and material balance methods. Certain new producing properties with little production history were forecast using a combination of production performance and analogy to offset production. Non-producing reserve estimates for both developed and undeveloped properties were forecast using either volumetric and/or analogy methods.
Internal Control Over Reserves Estimation Process
We maintain an internal staff of petroleum engineers and geoscience professionals to ensure the integrity, accuracy and timeliness of the data used in our reserves estimation process. Our Reserves Manager is primarily responsible for overseeing the preparation of our reserves estimates and has over 15 years of industry experience. Our Reserves Manager received his Ph.D. degree in Petroleum Engineering from Texas A&M University, is a Licensed Professional Engineer in the State of Texas and received a certificate of completion in a prescribed course of study in Reserves and Evaluation from Texas A&M University in May 2009. Our Reserves Manager reports directly to our Vice President – Reservoir Engineering. Our Vice President – Reservoir Engineering is responsible for reviewing and approving our reserves estimates and has over 30 years of industry experience. Following the preparation of our reserves estimates, for the years ended December 31, 2010 and 2009 and for the three month period ended March 31, 2011, we had our reserves estimates audited for their reasonableness and conformance with generally accepted petroleum engineering and evaluation principles by Netherland, Sewell & Associates, Inc., our independent petroleum engineers. Following the preparation of our reserves estimates, for the year ended December 31, 2008, we had our reserves estimates audited for their reasonableness and conformance with generally accepted petroleum engineering and evaluation principles by LaRoche Petroleum Consultants, Ltd., our independent petroleum engineers at that time. The Engineering Committee of our board of directors reviews the reserves report and our reserves estimation process, and the results of the reserves report and the independent audit of our reserves are reviewed by members of our board of directors, including members of our Audit Committee.
108
Table of Contents
Index to Financial Statements
Acreage Summary
The following table sets forth the approximate acreage in which we held a leasehold, mineral or other interest at June 30, 2011. At that date, only about 10% of our total acreage had been developed, although these percentages are much higher in northwest Louisiana and east Texas.
| Developed Acres | Undeveloped Acres | Total Acres | ||||||||||||||||||||||
| Gross | Net | Gross | Net | Gross | Net | |||||||||||||||||||
| South Texas: |
||||||||||||||||||||||||
| Eagle Ford |
1,439 | 1,165 | 54,337 | 28,139 | 55,776 | 29,304 | ||||||||||||||||||
| Austin Chalk |
– | – | 24,194 | 14,729 | 24,194 | 14,729 | ||||||||||||||||||
|
|
|
|
|
|
|
|
|
|
|
|
|
|||||||||||||
| Area Total(1) |
1,439 | 1,165 | 54,337 | 28,139 | 55,776 | 29,304 | ||||||||||||||||||
|
|
|
|
|
|
|
|
|
|
|
|
|
|||||||||||||
| NW Louisiana/E Texas: |
||||||||||||||||||||||||
| Haynesville |
18,234 | 10,140 | 4,917 | 4,484 | 23,151 | 14,624 | ||||||||||||||||||
| Cotton Valley(2) |
21,039 | 17,866 | 5,567 | 5,342 | 26,606 | 23,208 | ||||||||||||||||||
|
|
|
|
|
|
|
|
|
|
|
|
|
|||||||||||||
| Area Total(3) |
22,554 | 19,191 | 7,006 | 6,482 | 29,560 | 25,673 | ||||||||||||||||||
|
|
|
|
|
|
|
|
|
|
|
|
|
|||||||||||||
| SW Wyoming, NE Utah, SE Idaho |
– | – | 144,368 | 135,862 | 144,368 | 135,862 | ||||||||||||||||||
| SE New Mexico, West Texas |
1,160 | 1,038 | 21,716 | 18,814 | 22,876 | 19,852 | ||||||||||||||||||
|
|
|
|
|
|
|
|
|
|
|
|
|
|||||||||||||
| Total |
25,153 | 21,394 | 227,427 | 189,297 | 252,580 | 210,691 | ||||||||||||||||||
|
|
|
|
|
|
|
|
|
|
|
|
|
|||||||||||||
| (1) | Some of the same leases cover the net acres shown for the Eagle Ford formation and the Austin Chalk formation, a shallower formation than the Eagle Ford. Consequently, the total acreage will not equal the sum of the acreage by operating area. |
| (2) | Includes shallower zones and also includes acreage surrounding one well producing from the Frio formation in Orange County, Texas. Also includes two wells producing from the San Miguel formation in Zavala County, Texas. |
| (3) | Some of the same leases cover the net acres shown for the Haynesville formation and the Cotton Valley formation, a shallower formation than the Haynesville. Consequently, the total acreage will not equal the sum of the acreage by operating area. |
Undeveloped Acreage Expiration
The following table sets forth the number of gross and net undeveloped acres at June 30, 2011 that will expire over the next three years by operating area unless production is established within the spacing units covering the acreage prior to the expiration dates or unless the existing leases are renewed prior to expiration:
| Acres Expiring 2011 |
Acres Expiring 2012 |
Acres Expiring 2013 |
||||||||||||||||||||||
| Gross | Net | Gross | Net | Gross | Net | |||||||||||||||||||
| South Texas: |
||||||||||||||||||||||||
| Eagle Ford |
5,066 | 1,020 | 16,345 | 4,721 | 14,175 | 8,909 | ||||||||||||||||||
| Austin Chalk |
2,174 | 438 | 5,960 | 1,125 | 4,858 | 3,502 | ||||||||||||||||||
|
|
|
|
|
|
|
|
|
|
|
|
|
|||||||||||||
| Area Total(1) |
5,066 | 1,020 | 16,345 | 4,721 | 14,175 | 8,909 | ||||||||||||||||||
|
|
|
|
|
|
|
|
|
|
|
|
|
|||||||||||||
| NW Louisiana/E Texas |
||||||||||||||||||||||||
| Haynesville |
670 | 402 | 856 | 598 | 124 | 124 | ||||||||||||||||||
| Cotton Valley |
670 | 402 | 856 | 598 | 124 | 124 | ||||||||||||||||||
|
|
|
|
|
|
|
|
|
|
|
|
|
|||||||||||||
| Area Total(2) |
670 | 402 | 856 | 598 | 124 | 124 | ||||||||||||||||||
|
|
|
|
|
|
|
|
|
|
|
|
|
|||||||||||||
| SW Wyoming, NE Utah, SE Idaho |
1,280 | 1,280 | 100,056 | 93,760 | 8,461 | 8,301 | ||||||||||||||||||
| SE New Mexico, West Texas |
13,839 | 9,371 | 7,384 | 5,751 | 8,454 | 2,715 | ||||||||||||||||||
|
|
|
|
|
|
|
|
|
|
|
|
|
|||||||||||||
| Total |
20,855 | 12,073 | 124,641 | 104,830 | 31,214 | 20,049 | ||||||||||||||||||
|
|
|
|
|
|
|
|
|
|
|
|
|
|||||||||||||
| (1) | Some of the same leases cover the net acres shown for the Eagle Ford formation and the Austin Chalk formation, a shallower formation than the Eagle Ford. Consequently, the total acreage will not equal the sum of the acreage by operating area. |
| (2) | Some of the same leases cover the net acres shown for the Haynesville formation and the Cotton Valley formation, a shallower formation than the Haynesville. Consequently, the total acreage will not equal the sum of the acreage by operating area. |
109
Table of Contents
Index to Financial Statements
Many of the leases comprising the acreage set forth in the table above will expire at the end of their respective primary terms unless production from the acreage has been established prior to such date, in which event the lease will remain in effect until the cessation of production in commercial quantities. We also have options to extend some of our leases through payment of additional lease bonus payments prior to the expiration of the primary term of the leases. In addition, we may attempt to secure a new lease upon the expiration of certain of our acreage; however, there may be third party leases that become effective immediately if our leases expire at the end of their respective terms and production has not been established prior to such date. Our leases are mainly fee leases with three to five years of primary term. We believe that our lease terms are similar to our competitors’ fee lease terms as they relate to both primary term and royalty interests.
Drilling Results
The following table summarizes our drilling activity for the past three years ended December 31, 2010, 2009 and 2008 and the three months ended March 31, 2011:
| Year Ended December 31, | Three Months Ended March 31, |
|||||||||||||||||||||||||||||||
| 2010 | 2009 | 2008 | 2011 | |||||||||||||||||||||||||||||
| Gross | Net | Gross | Net | Gross | Net | Gross | Net | |||||||||||||||||||||||||
| Development Wells |
||||||||||||||||||||||||||||||||
| Productive |
5 | 1.7 | 3 | 1.3 | 25 | 12.7 | – | – | ||||||||||||||||||||||||
| Dry |
– | – | – | – | – | – | – | – | ||||||||||||||||||||||||
| Exploratory Wells |
||||||||||||||||||||||||||||||||
| Productive |
36 | 3.4 | 15 | 6.0 | 12 | 8.6 | 7 | 4.3 | ||||||||||||||||||||||||
| Dry |
– | – | 2 | 2.0 | 1 | 1.0 | – | – | ||||||||||||||||||||||||
| Total Wells |
||||||||||||||||||||||||||||||||
| Productive |
41 | 5.1 | 18 | 7.3 | 37 | 21.3 | 7 | 4.3 | ||||||||||||||||||||||||
| Dry |
– | – | 2 | 2.0 | 1 | 1.0 | – | – | ||||||||||||||||||||||||
Marketing
Our crude oil is generally sold under short-term, extendable and cancellable agreements with unaffiliated purchasers based on published price bulletins reflecting an established field posting price. As a consequence, the prices we receive for crude oil and liquids move up and down in direct correlation with the oil market as it reacts to supply and demand factors. Transportation costs related to moving crude oil are also deducted from the price received for crude oil.
Our natural gas is sold under both long-term and short-term natural gas purchase agreements. Natural gas produced by us is sold at various delivery points at or near producing wells to both unaffiliated independent marketing companies and unaffiliated mid-stream companies. We receive proceeds from prices that are based on various pipeline indices less any associated fees. When there is an opportunity to do so, the mid-stream companies may, at our request, process our natural gas at a processing facility and extract liquid hydrocarbons from the natural gas. We are then paid for the extracted liquids based on a negotiated percentage of the proceeds that are generated from the mid-stream company’s sale of the liquids, or based on other negotiated pricing arrangements.
110
Table of Contents
Index to Financial Statements
The prices we receive for our oil and natural gas production fluctuate widely. Factors that cause price fluctuation include the level of demand for oil and natural gas, weather conditions, hurricanes in the Gulf Coast region, natural gas storage levels, domestic and foreign governmental regulations, the actions of OPEC, price and availability of alternative fuels, political conditions in oil and natural gas producing regions, the domestic and foreign supply of oil and natural gas, the price of foreign imports and overall economic conditions. Decreases in these commodity prices do adversely affect the carrying value of our proved reserves and our revenues, profitability and cash flows. Short-term disruptions of our oil and natural gas production do occur from time to time due to downstream pipeline system failure, capacity issues and scheduled maintenance, as well as maintenance and repairs involving our own well operations. These situations do curtail our production capabilities and ability to maintain a steady source of revenue for our company. In addition, demand for natural gas has historically been seasonal in nature, with peak demand and typically higher prices during the colder winter months. See “Risk Factors — Our success is dependent on the prices of oil and natural gas. The substantial volatility in these prices may adversely affect our financial condition and our ability to meet our capital expenditure requirements and financial obligations.”
For the year ended December 31, 2008, we had two significant purchasers that each accounted for more than 10% of our total oil and natural gas revenues: Regency Gas Services LP (45%) and J-W Operating Company (24%). For the year ended December 31, 2009, we had three significant purchasers that each accounted for more than 10% of our total oil and natural gas revenues: Chesapeake Operating Inc. (32%), Regency Gas Services LP (25%), and J-W Operating Company (17%). For the year ended December 31, 2010, we had three significant purchasers that each accounted for more than 10% of our total oil and natural gas revenues: Chesapeake Operating Inc. (42%), Regency Gas Services LP (17%) and Petrohawk Energy Corporation (11%). Due to the nature of the markets for oil and natural gas, we do not believe that the loss of any one of these purchasers would have a material adverse impact on our financial condition, results of operations or cash flows for any significant period of time.
While we do not have any commitments to sell a fixed and determinable quantity of oil or natural gas to a particular buyer, we are party to two natural gas transportation agreements at December 31, 2010 and June 30, 2011 that require us to deliver a specified volume of natural gas through pipelines for a fixed period of time. If we fail to meet the volume requirements, we are required to pay an amount to the owners of the pipelines to offset a portion of the expenses they incurred in building the pipelines to our well locations. Neither of these contracts constitutes a material commitment.
Title to Properties
We endeavor to assure that title to our properties is in accordance with standards generally accepted in the oil and natural gas industry. Some of our acreage will be obtained through farmout agreements, term assignments and other contractual arrangements with third parties, the terms of which often will require the drilling of wells or the undertaking of other exploratory or development activities in order to retain our interests in the acreage. Our title to these contractual interests will be contingent upon our satisfactory fulfillment of these obligations. Our properties are also subject to customary royalty interests, liens incident to financing arrangements, operating agreements, taxes and other burdens that we believe will not materially interfere with the use and operation of or affect the value of these properties. We intend to maintain our leasehold interests by making lease rental payments or by producing wells in paying quantities prior to expiration of various time periods to avoid lease termination. Certain of the leases that we have obtained to date have been purchased by and in the name of professional lease brokers as our nominee. See “Risk Factors — We may incur losses or costs as a result of title deficiencies in the properties in which we invest.”
111
Table of Contents
Index to Financial Statements
Competition
The oil and natural gas industry is highly competitive. We compete and will continue to compete with major and independent oil and natural gas companies for exploration opportunities, acreage and property acquisitions. We also compete for drilling rig contracts and other equipment and labor required to drill, operate and develop our properties. Most of our competitors have substantially greater financial resources, staffs, facilities and other resources. In addition, larger competitors may be able to absorb the burden of any changes in federal, state and local laws and regulations more easily than we can, which would adversely affect our competitive position. These competitors may be able to pay more for drilling rigs or exploratory prospects and productive oil and natural gas properties and may be able to define, evaluate, bid for and purchase a greater number of properties and prospects than we can. Our competitors may also be able to afford to purchase and operate their own drilling rigs.
Our ability to drill and explore for oil and natural gas and to acquire properties will depend upon our ability to conduct operations, to evaluate and select suitable properties and to consummate transactions in this highly competitive environment. We have been conducting field operations since 2004 while our competitors have a longer history of operations, and most of them have also demonstrated the ability to operate through industry cycles.
The oil and natural gas industry also competes with other energy-related industries in supplying the energy and fuel requirements of industrial, commercial and individual consumers. See “Risk Factors – Competition in the oil and natural gas industry is intense, making it more difficult for us to acquire properties, market natural gas and secure trained personnel.”
Regulation
Oil and Natural Gas Regulation
Our oil and natural gas exploration, development, production and related operations are subject to extensive federal, state and local laws, rules and regulations. Failure to comply with these laws, rules and regulations can result in substantial penalties. The regulatory burden on the oil and natural gas industry increases our cost of doing business and affects our profitability. Because these rules and regulations are frequently amended or reinterpreted and new rules and regulations are promulgated, we are unable to predict the future cost or impact of complying with the laws, rules and regulations to which we are, or will become, subject. Our competitors in the oil and natural gas industry are generally subject to the same regulatory requirements and restrictions that affect our operations. We cannot predict the impact of future government regulation on our properties or operations.
Texas, New Mexico, Louisiana, Wyoming, Idaho and Utah and many other states require permits for drilling operations, drilling bonds and reports concerning operations and impose other requirements relating to the exploration, development and production of oil and natural gas. Many states also have statutes or regulations addressing conservation of oil and natural gas matters, including provisions for the unitization or pooling of oil and natural gas properties, the establishment of maximum rates of production from wells, the regulation of well spacing, the surface use and restoration of properties upon which wells are drilled, the sourcing and disposal of water used in the drilling and completion process and the plugging and abandonment of these wells. Many states restrict production to the market demand for oil and natural gas. Some states have enacted statutes prescribing ceiling prices for natural gas sold within their boundaries. Additionally, some regulatory agencies have, from time to time, imposed price controls and limitations on production by restricting the rate of flow of oil and natural gas wells below natural production capacity in
112
Table of Contents
Index to Financial Statements
order to conserve supplies of oil and natural gas. Moreover, each state generally imposes a production or severance tax with respect to the production and sale of oil, natural gas and natural gas liquids within its jurisdiction.
Some of our oil and natural gas leases are issued by agencies of the federal government, as well as agencies of the states in which we operate. These leases contain various restrictions on access and development and other requirements that may impede our ability to conduct operations on the acreage represented by these leases.
Our sales of natural gas, as well as the revenues we receive from our sales, are affected by the availability, terms and costs of transportation. The rates, terms and conditions applicable to the interstate transportation of natural gas by pipelines are regulated by the Federal Energy Regulatory Commission, or FERC, under the Natural Gas Act, as well as under Section 311 of the Natural Gas Policy Act. Since 1985, FERC has implemented regulations intended to increase competition within the natural gas industry by making natural gas transportation more accessible to natural gas buyers and sellers on an open-access, non-discriminatory basis. The natural gas industry has historically, however, been heavily regulated and we can give no assurance that the current less stringent regulatory approach of FERC will continue.
In 2005, Congress enacted the Energy Policy Act of 2005. The Energy Policy Act, among other things, amended the Natural Gas Act to prohibit market manipulation by any entity, to direct FERC to facilitate market transparency in the market for sale or transportation of physical natural gas in interstate commerce, and to significantly increase the penalties for violations of the Natural Gas Act, the Natural Gas Policy Act of 1978, or FERC rules, regulations or orders thereunder. FERC has promulgated regulations to implement the Energy Policy Act. Should we violate the anti-market manipulation laws and related regulations, in addition to FERC-imposed penalties, we may also be subject to third party damage claims.
Intrastate natural gas transportation is subject to regulation by state regulatory agencies. The basis for intrastate regulation of natural gas transportation and the degree of regulatory oversight and scrutiny given to intrastate natural gas pipeline rates and services varies from state to state. Because these regulations will apply to all intrastate natural gas shippers within the same state on a comparable basis, we believe that the regulation in any states in which we operate will not affect our operations in any way that is materially different from our competitors that are similarly situated.
The price we receive from the sale of oil and natural gas liquids will be affected by the availability, terms and cost of transportation of the products to market. Under rules adopted by FERC, interstate oil pipelines can change rates based on an inflation index, though other rate mechanisms may be used in specific circumstances. Intrastate oil pipeline transportation rates are subject to regulation by state regulatory commissions, which varies from state to state. We are not able to predict with certainty the effects, if any, of these regulations on our operations.
In 2007, the Energy Independence & Security Act of 2007, or EISA, went into effect. The EISA, among other things, prohibits market manipulation by any person in connection with the purchase or sale of crude oil, gasoline or petroleum distillates at wholesale in contravention of such rules and regulations that the Federal Trade Commission may prescribe, directs the Federal Trade Commission to enforce the regulations and establishes penalties for violations thereunder. We cannot predict any future regulations or their impact.
113
Table of Contents
Index to Financial Statements
U.S. Federal and State Taxation
The federal, state and local governments in the areas in which we operate impose taxes on the oil and natural gas products we sell and, for many of our wells, sales and use taxes on significant portions of our drilling and operating costs. In the past, there has been a significant amount of discussion by legislators and presidential administrations concerning a variety of energy tax proposals. President Obama has recently proposed sweeping changes in federal laws on the income taxation of small oil and natural gas exploration and production companies such as us. President Obama has proposed to eliminate allowing small U.S. oil and natural gas companies to deduct intangible U.S. drilling costs as incurred and percentage depletion. Many states have raised state taxes on energy sources, and additional increases may occur. Changes to tax laws could adversely affect our business and our financial results.
Hydraulic Fracturing Policies and Procedures
We use hydraulic fracturing as a means to maximize the productivity of our oil and natural gas wells in almost every well that we drill and complete. Our engineers responsible for these operations attend specialized hydraulic fracturing training programs taught by industry professionals. Although average drilling and completion costs for each area will vary, as will the cost of each well within a given area, on average approximately 50% of the drilling and completion costs for our horizontal wells are associated with hydraulic fracturing activities. These costs are treated in the same way that all other costs of drilling and completion of our wells are treated and are built into and funded through our normal capital expenditures budget.
The protection of groundwater quality is extremely important to us. We believe that we follow all state and federal regulations and apply industry standard practices for groundwater protection in our operations. These measures are subject to close supervision by state and federal regulators (including the BLM with respect to federal acreage). Our policy and practice is to follow all applicable guidelines and regulations in the areas where we conduct hydraulic fracturing. A surface casing string is set deeper than the deepest usable quality fresh water zones and cemented back to the surface in accordance with the appropriate regulations, potential lease requirements and legal requirements to ensure protection of existing fresh water zones. This surface string of casing is then pressure tested to ensure mechanical integrity of the casing string prior to continuing drilling operations. We follow strict quality control procedures for conducting hydraulic fracturing operations that include a multi-point safety checklist, managing inventories of all materials and chemicals on the well site and ensuring that Material Safety Data Sheets are on location for every well that is hydraulically fractured. We contract with third parties to conduct hydraulic fracturing operations, and we send at least one of our own engineers to the well site to personally supervise each hydraulic fracture treatment. On a real-time basis, we closely monitor pump rates and pressures on existing casing strings to ensure that wellbore integrity is maintained during hydraulic fracturing operations. Our policy regarding monitoring well pressures would require stopping the hydraulic fracturing operations upon any indication that wellbore integrity may have been compromised.
We follow additional regulatory requirements and recommended practices to ensure wellbore integrity and full isolation of any underground aquifers and protection of surface waters. These include the following:
| • | Prior to perforating the production casing and hydraulic fracturing operations, a cement bond log is run to verify cement integrity between the formation to be fractured and shallow formations. Then, the casing is pressure tested to ensure no leaks exist within the casing; |
114
Table of Contents
Index to Financial Statements
| • | Before the fracturing operation commences, all surface equipment is pressure tested, which includes the wellhead and all high pressure lines and connections leading from the pumping equipment to the wellhead. During the pumping phases of the hydraulic fracturing treatment, the service companies we engage must provide specialized equipment to monitor and record surface pressures, pumping rates, volumes and chemical concentrations to ensure the treatment is proceeding as designed and the wellbore integrity is sound. Our engineers at the job site have laptop computers with special software to monitor and collect, for permanent archiving, information from the hydraulic fracturing operations. As part of this process, when fracturing operations are being performed down casing, we also monitor the casing annular pressure to ensure that there is no communication of hydraulic pressure and fracture fluids outside the casing that could communicate with shallow formations. Should any problem be detected at any time during the hydraulic fracturing treatment, the operation would be shut down until the problem is evaluated, reported and remediated; and |
| • | As a means to further protect against the negative impacts of any potential surface release of fluids associated with the hydraulic fracturing operation, special precautions are taken both during and after the operation. During the fracturing operation, all chemicals are mixed into the fracturing fluid as it is being pumped into the well as opposed to being pre-mixed in the “frac pits” or work tanks. While chemical additives are stored on location in independent containment vessels, only fresh water is stored in the frac pits or work tanks. All pumping equipment used during the operation is pressure tested and monitored. When the well is flowed back, after the fracturing operation, all fluids are produced into closed-top storage tanks. All flowback equipment and piping are pressure tested to ensure no leaks are present and the fluids are properly contained. |
Once the final string of casing is set in place, cement is pumped into the casing/wellbore annulus where it hardens and creates a permanent, isolating barrier between the steel casing pipe and surrounding geological formations. This aspect of the well design establishes a pressure seal essentially eliminating any pathway for the fracturing fluid to contact fresh water aquifers during the hydraulic fracturing operation. Furthermore, in the areas in which we conduct hydraulic fracturing, the hydrocarbon bearing formations are separated from any usable quality underground fresh water aquifers by thousands of feet of impermeable rock layers. This natural geological separation serves as a protective barrier, preventing migration of fracturing fluids or hydrocarbons upwards into any fresh water zones.
Although rare, if and when the cement and steel casing used in well construction need to be remediated, we deal with these problems by evaluating the issue, running diagnostic tools including cement bond logs, temperature logs and pressure testing, followed by pumping remedial cement jobs. We repair wellhead leaks by replacing wellhead components, re-installing components to proper specifications and re-testing. In wellbores that utilize downhole packers, pressure integrity issues are rectified by repairing or replacing packers. Casing integrity lost due to corrosion on a producing well is remedied by identifying the specific location of the leak by cased hole logging tools, mechanical isolation and pressure testing or other diagnostic methods, followed by high pressure squeeze cementing and subsequent pressure testing to ensure the leak has been repaired. Throughout the process we believe we abide by applicable regulations.
The vast majority of hydraulic fracturing treatments are made up of water and sand or other kinds of man-made propping agents. We use major hydraulic fracturing service companies who track and report chemical additives that are used in the fracturing operation as required by the appropriate governmental agencies. These service companies fracture stimulate thousands of wells each year for the industry and invest millions of dollars to protect the environment through rigorous safety procedures, and also work to develop more environmentally friendly fracturing fluids. As previously mentioned we also follow strict
115
Table of Contents
Index to Financial Statements
safety procedures and monitor all aspects of the fracturing operation to ensure environmental protection. We do not pump any diesel in the fluid systems of any of our fracture stimulation procedures.
While current fracture stimulation procedures utilize a significant amount of water, we typically recover less than 10% of this fracture stimulation water before produced saltwater becomes a significant portion of the fluids produced. All produced water, including fracture stimulation water, is disposed of in a way that does not impact surface waters. All produced water is disposed of in permitted and regulated disposal facilities.
Environmental Regulation
The exploration, development and production of oil and natural gas, including the operation of saltwater injection and disposal wells, are subject to various federal, state and local environmental laws and regulations. These laws and regulations can increase the costs of planning, designing, installing and operating oil and natural gas wells. Our activities are subject to a variety of environmental laws and regulations, including but not limited to: the Oil Pollution Act of 1990, or OPA 90, the Clean Water Act, or CWA, the Comprehensive Environmental Response, Compensation and Liability Act, or CERCLA, the Resource Conservation and Recovery Act, or RCRA, the Clean Air Act, or CAA, the Safe Drinking Water Act, or SDWA and the Occupational Safety and Health Act, or OSHA, as well as comparable state statutes and regulations. We are also subject to regulations governing the handling, transportation, storage and disposal of wastes generated by our activities and naturally occurring radioactive materials, or NORM, that may result from our oil and natural gas operations. Civil and criminal fines and penalties may be imposed for noncompliance with these environmental laws and regulations. Additionally, these laws and regulations require the acquisition of permits or other governmental authorizations before undertaking some activities, limit or prohibit other activities because of protected wetlands, areas or species and require investigation and cleanup of pollution. We expect to remain in compliance in all material respects with currently applicable environmental laws and regulations and expect that these laws and regulations will not have a material adverse impact on us.
The OPA 90 and its regulations impose requirements on “responsible parties” related to the prevention of crude oil spills and liability for damages resulting from oil spills into or upon navigable waters, adjoining shorelines or in the exclusive economic zone of the United States. A “responsible party” under the OPA 90 may include the owner or operator of an onshore facility. The OPA 90 subjects responsible parties to strict, joint and several financial liability for removal costs and other damages, including natural resource damages, caused by an oil spill that is covered by the statute. It also imposes other requirements on responsible parties, such as the preparation of an oil spill contingency plan. Failure to comply with the OPA 90 may subject a responsible party to civil or criminal enforcement action. We may conduct operations on acreage located near, or that affects, navigable waters subject to the OPA 90. We believe that compliance with applicable requirements under the OPA 90 will not have a material and adverse effect on us.
The CWA imposes restrictions and strict controls regarding the discharge of produced waters and other wastes into navigable waters. These controls have become more stringent over the years, and it is possible that additional restrictions will be imposed in the future. Permits are required to discharge pollutants into state and federal waters and to conduct construction activities in waters and wetlands. Certain state regulations and the general permits issued under the federal National Pollutant Discharge Elimination System program prohibit the discharge of produced water, produced sand, drilling fluids, drill cuttings and certain other substances related to the oil and natural gas industry into certain coastal and offshore waters. Further, the EPA has adopted regulations requiring certain oil and natural gas exploration and production
116
Table of Contents
Index to Financial Statements
facilities to obtain permits for storm water discharges. Costs may be associated with the treatment of wastewater or developing and implementing storm water pollution prevention plans. The CWA and comparable state statutes provide for civil, criminal and administrative penalties for any unauthorized discharges of oil and other pollutants and impose liability for the costs of removal or remediation of contamination resulting from such discharges. In furtherance of the CWA, the EPA promulgated the Spill Prevention, Control, and Countermeasure, or SPCC, regulations, which require certain oil-storing facilities to prepare plans and meet construction and operating standards.
CERCLA, also known as the “Superfund” law, and comparable state statutes impose liability, without regard to fault or the legality of the original conduct, on various classes of persons that are considered to have contributed to the release of a “hazardous substance” into the environment. These persons include the owner or operator of the disposal site where the release occurred and companies that disposed of, or arranged for the disposal of, the hazardous substances found at the site. Persons who are responsible for releases of hazardous substances under CERCLA may be subject to joint and several liability for the costs of cleaning up the hazardous substances and for damages to natural resources. In addition, it is not uncommon for neighboring landowners and other third parties to file claims for personal injury and property damage allegedly caused by hazardous substances released into the environment. Our operations may, and in all likelihood will, involve the use or handling of materials that may be classified as hazardous substances under CERCLA. Furthermore, we may acquire or operate properties that unknown to us have been subjected to, or have caused or contributed to, prior releases of hazardous wastes.
RCRA and comparable state and local statutes govern the management, including treatment, storage and disposal, of both hazardous and nonhazardous solid wastes. We generate hazardous and nonhazardous solid waste in connection with our routine operations. At present, RCRA includes a statutory exemption that allows many wastes associated with crude oil and natural gas exploration and production to be classified as nonhazardous waste. A similar exemption is contained in many of the state counterparts to RCRA. At various times in the past, proposals have been made to amend RCRA to eliminate the exemption applicable to crude oil and natural gas exploration and production wastes. Repeal or modifications of this exemption by administrative, legislative or judicial process, or through changes in applicable state statutes, would increase the volume of hazardous waste we are required to manage and dispose of and would cause us, as well as our competitors, to incur increased operating expenses. Hazardous wastes are subject to more stringent and costly disposal requirements than are nonhazardous wastes.
The CAA, as amended, and comparable state laws restrict the emission of air pollutants from many sources, including oil and natural gas production. These laws and any implementing regulations impose stringent air permit requirements and require us to obtain pre-approval for the construction or modification of certain projects or facilities expected to produce air emissions, or to use specific equipment or technologies to control emissions. On July 28, 2011, the EPA proposed new regulations targeting air emissions from the oil and natural gas industry. The proposed rules, if adopted, would impose new requirements on production and processing and transmission and storage facilities. While we may be required to incur certain capital expenditures in the next few years for air pollution control equipment in connection with maintaining or obtaining operating permits addressing other air emission-related issues, we do not believe that such requirements will affect our operations in any way that is materially different from our competitors.
Changes in environmental laws and regulations occur frequently, and any changes that result in more stringent and costly waste handling, storage, transport, disposal or cleanup requirements could materially adversely affect our operations and financial position, as well as those of the oil and natural gas industry in
117
Table of Contents
Index to Financial Statements
general. For instance, recent scientific studies have suggested that emissions of certain gases, commonly referred to as “greenhouse gases,” and including carbon dioxide and methane, may be contributing to the warming of the Earth’s atmosphere. As a result, there have been attempts to pass comprehensive greenhouse gas legislation. To date, such legislation has not been enacted. Any future federal laws or implementing regulations that may be adopted to address greenhouse gas emissions could, and in all likelihood would, require us to incur increased operating costs adversely affecting our profits and could adversely affect demand for the oil and natural gas we produce depressing the prices we receive for oil and natural gas.
On December 15, 2009, the EPA published its finding that emissions of greenhouse gases presented an endangerment to human health and the environment. These findings by the EPA allow the agency to proceed with the adoption and implementation of regulations that would restrict emissions of greenhouse gases under existing provisions of the CAA. Subsequently, the EPA proposed two sets of regulations requiring a reduction in emissions of greenhouse gases from motor vehicles that could trigger permit review for greenhouse gas emissions from certain stationary sources. In addition, on October 30, 2009, the EPA published a rule requiring the reporting of greenhouse gas emissions from specified large greenhouse gas emission sources in the U.S. beginning in 2011 for emissions occurring in 2010. On November 30, 2010, the EPA released a rule that expands its final rule on greenhouse gas emissions reporting to include owners and operators of onshore and offshore oil and natural gas production, onshore natural gas processing, natural gas storage, natural gas transmission and natural gas distribution facilities. Reporting of greenhouse gas emissions from such onshore production will be required on an annual basis beginning in 2012 for emissions occurring in 2011. The adoption and implementation of any regulations imposing reporting obligations on, or limiting emissions of greenhouse gases from, our equipment and operations could, and in all likelihood will, require us to incur costs to reduce emissions of greenhouse gases associated with our operations adversely affecting our profits or could adversely affect demand for the oil and natural gas we produce depressing the prices we receive for oil and natural gas.
Some states have begun taking actions to control and/or reduce emissions of greenhouse gases, primarily through the planned development of greenhouse gas emission inventories and/or regional greenhouse gas cap and trade programs. Although most of the state-level initiatives have to date focused on significant sources of greenhouse gas emissions, such as coal-fired electric plants, it is possible that less significant sources of emissions could become subject to greenhouse gas emission limitations or emissions allowance purchase requirements in the future. Any one of these climate change regulatory and legislative initiatives could have a material adverse effect on our business, financial condition, results of operations and cash flows
Underground injection is the subsurface placement of fluid through a well, such as the reinjection of brine produced and separated from oil and natural gas production. In our industry, underground injection not only allows us to economically dispose of produced water, but if injected into an oil bearing zone, it can increase the oil production from such zone. The SDWA establishes a regulatory framework for underground injection, the primary objective of which is to ensure the mechanical integrity of the injection apparatus and to prevent migration of fluids from the injection zone into underground sources of drinking water. The disposal of hazardous waste by underground injection is subject to stricter requirements than the disposal of produced water. We currently own and operate five underground injection wells and expect to own other similar wells. Failure to obtain, or abide by, the requirements for the issuance of necessary permits could subject us to civil and/or criminal enforcement actions and penalties.
Our activities involve the use of hydraulic fracturing. For more information on our hydraulic fracturing operations, see “Business — Regulation — Hydraulic fracturing policies and procedures.” Recently, there
118
Table of Contents
Index to Financial Statements
has been increasing regulatory scrutiny of hydraulic fracturing, which is generally exempted from regulation as underground injection on the federal level pursuant to the SDWA. However, the U.S. Senate and House of Representatives are currently considering bills entitled the Fracturing Responsibility and Awareness of Chemicals Act, or the FRAC Act, to amend the SDWA to repeal this exemption. If enacted, the FRAC Act would amend the definition of “underground injection” in the SDWA to encompass hydraulic fracturing activities. If enacted, such a provision could require hydraulic fracturing operations to meet permitting and financial assurance requirements, adhere to certain construction specifications, fulfill monitoring, reporting and recordkeeping obligations, and meet plugging and abandonment requirements. The FRAC Act also proposes to require the reporting and public disclosure of chemicals used in the fracturing process. If the exemption for hydraulic fracturing is removed from the SDWA, or if the FRAC Act or other legislation is enacted at the federal, state or local level, any restrictions on the use of hydraulic fracturing contained in any such legislation could have a significant impact on our financial condition, results of operations and cash flows.
In addition, at the federal level and in some states, there has been a push to place additional regulatory burdens upon hydraulic fracturing activities. Certain bills have been introduced in the Senate and the House of Representatives that, if adopted, could increase the possibility of litigation and establish an additional level of regulation at the federal level that could lead to operational delays or increased operating costs and could, and in all likelihood would, result in additional regulatory burdens, making it more difficult to perform hydraulic fracturing operations and increasing our costs of compliance. At the state level, Wyoming and Texas, for example, have enacted requirements for the disclosure of the composition of the fluids used in hydraulic fracturing. On June 17, 2011, Texas signed into law a mandate for public disclosure of the chemicals that operators use during hydraulic fracturing in Texas. The law goes into effect September 1, 2011. State regulators have until 2013 to complete implementing rules. In addition, at least three local governments in Texas have imposed temporary moratoria on drilling permits within city limits so that local ordinances may be reviewed to assess their adequacy to address hydraulic fracturing activities. Additional burdens upon hydraulic fracturing, such as reporting requirements or permitting requirements for the hydraulic fracturing activity, will result in additional expense and delay in our operations.
Oil and natural gas exploration and production, operations and other activities have been conducted at some of our properties by previous owners and operators. Materials from these operations remain on some of the properties, and, in some instances, require remediation. In addition, we occasionally must agree to indemnify sellers of producing properties from whom we acquire reserves against some of the liability for environmental claims associated with these properties. While we do not believe that costs we incur for compliance with environmental regulations and remediating previously or currently owned or operated properties will be material, we cannot provide any assurances that these costs will not result in material expenditures that adversely affect our profitability.
Additionally, in the course of our routine oil and natural gas operations, surface spills and leaks, including casing leaks, of oil or other materials will occur, and we will incur costs for waste handling and environmental compliance. It is also possible that our oil and natural gas operations may require us to manage NORM. NORM is present in varying concentrations in sub-surface formations, including hydrocarbon reservoirs, and may become concentrated in scale, film and sludge in equipment that comes in contact with crude oil and natural gas production and processing streams. Some states, including Texas, have enacted regulations governing the handling, treatment, storage and disposal of NORM. Moreover, we will be able to control directly the operations of only those wells for which we act as the operator. Despite our lack of control over wells owned by us but operated by others, the failure of the operator to comply with the applicable environmental regulations may, in certain circumstances, be attributable to us.
119
Table of Contents
Index to Financial Statements
We are subject to the requirements of OSHA and comparable state statutes. The OSHA Hazard Communication Standard, the “community right-to-know” regulations under Title III of the federal Superfund Amendments and Reauthorization Act and similar state statutes require us to organize information about hazardous materials used, released or produced in our operations. Certain of this information must be provided to employees, state and local governmental authorities and local citizens. We are also subject to the requirements and reporting set forth in OSHA workplace standards.
We have not in the past been, and do not anticipate in the near future to be, required to expend amounts that are material in relation to our total capital expenditures as a result of environmental laws and regulations, but since these laws and regulations are periodically amended, we are unable to predict the ultimate cost of compliance. We cannot assure you that more stringent laws and regulations protecting the environment will not be adopted or that we will not otherwise incur material expenses in connection with environmental laws and regulations in the future. See “Risk Factors.”
The clear trend in environmental regulation is to place more restrictions and limitations on activities that may affect the environment, and thus, any changes in environmental laws and regulations or re-interpretation of enforcement policies that result in more stringent and costly waste handling, storage, transport, disposal or remediation requirements could have a material adverse effect on our operations and financial position. We may be unable to pass on such increased compliance costs to our customers. Moreover, accidental releases or spills may occur in the course of our operations, and we cannot assure you that we will not incur significant costs and liabilities as a result of such releases or spills, including any third party claims for damage to property, natural resources or persons.
We maintain insurance against some, but not all, potential risks and losses associated with our industry and operations. We do not currently carry business interruption insurance. For some risks, we may not obtain insurance if we believe the cost of available insurance is excessive relative to the risks presented. In addition, pollution and environmental risks generally are not fully insurable. If a significant accident or other event occurs and is not fully covered by insurance, it could materially adversely affect our financial condition, results of operations and cash flows.
Office Lease
Our corporate headquarters are located in 20,869 square feet of office space in One Lincoln Centre, 5400 LBJ Freeway, Suite 1500, Dallas, Texas. Our current lease contemplates that we will increase our rentable square feet to 28,743 square feet in the fall of 2011. We will receive a finish-out allowance from the landlord for the expanded space in an amount of $530,308. The office lease agreement for our current space and our expanded space expires June 30, 2022. Beginning July 1, 2011, through June 30, 2012, we are not required to pay a monthly base rent. From July 1, 2012 through June 30, 2015, our monthly base rent is $47,905. From July 1, 2015 through June 30, 2017, our monthly base rent is $50,300. From July 1, 2017 through June 30, 2019, our monthly base rent is $52,696. From July 1, 2019 through June 30, 2020, our monthly base rent is $55,091. From July 1, 2020 through the expiration date of the lease, our monthly base rent is $57,726. In addition, the lease contains a renewal option in our favor for an additional 60-month period at the then existing market rate as determined in accordance with the lease.
Employees
At August 12, 2011, we had 38 full-time employees. We believe that our relationships with our employees are satisfactory. No employee is covered by a collective bargaining agreement. From time to time, we use the services of independent consultants and contractors to perform various professional
120
Table of Contents
Index to Financial Statements
services, particularly in the areas of geology and geophysics, construction, design, well site surveillance and supervision, permitting and environmental assessment and legal and income tax preparation and accounting services. Independent contractors, at our request, drill all of our wells and usually perform field and on-site production operation services for us, including pumping, maintenance, dispatching, inspection and testing. If significant opportunities for company growth arise and require additional management and professional expertise, we will seek to employ qualified individuals to fill positions where that expertise is necessary to develop those opportunities.
Legal Proceedings
Although we may, from time to time, be involved in litigation and claims arising out of our operations in the normal course of business, we are not currently a party to any material legal proceeding. In addition, we are not aware of any material legal or governmental proceedings against us, or contemplated to be brought against us.
121
Table of Contents
Index to Financial Statements
Officers
The following table sets forth the names, ages and positions of our executive officers at June 30, 2011:
| Name |
Age | Positions Held With Us | ||||
| Joseph Wm. Foran |
59 | Chairman of the Board, Chief Executive Officer and President | ||||
| David E. Lancaster |
54 | Executive Vice President, Chief Operating Officer and Chief Financial Officer | ||||
| Matthew V. Hairford |
50 | Executive Vice President — Operations | ||||
| David F. Nicklin |
62 | Executive Director of Exploration | ||||
| Scott E. King |
52 | Co-Founder, Vice President — Geophysics and New Ventures | ||||
| Bradley M. Robinson |
56 | Vice President — Reservoir Engineering | ||||
The following biographies describe the business experience of our executive officers. Each officer serves at the discretion of our board of directors. There are no family relationships among any of our officers.
Mr. Joseph Wm. Foran. Mr. Foran founded Matador Resources Company in July 2003 and has served as Chairman of the Board, Chief Executive Officer, President and Secretary since July 2003. Mr. Foran began his career as an oil and natural gas independent in 1983 when he and his wife, Nancy, founded Foran Oil Company with $270,000 in contributed capital from 17 of his closest friends and neighbors. Foran Oil Company was later contributed into Matador Petroleum Corporation upon its formation by Mr. Foran in 1988, and Mr. Foran served as Chairman and Chief Executive Officer of that company from inception until the time of its sale to Tom Brown, Inc. in June 2003 for an enterprise value of $388 million in an all-cash transaction. Under Mr. Foran’s guidance, Matador Petroleum realized a 21% average annual rate of return for its shareholders for 15 years. Mr. Foran is originally from Amarillo, Texas, where his family owned a pipeline construction business. From 1980 to 1983, he was Vice President and General Counsel of J. Cleo Thompson and James Cleo Thompson, Jr., Oil Producers. Prior to that time, he was a briefing attorney to Chief Justice Joe R. Greenhill of the Supreme Court of Texas. Mr. Foran graduated with a Bachelor of Science degree in Accounting from the University of Kentucky with highest honors and a law degree from the Southern Methodist University School of Law, where he was a Hatton W. Sumners scholar and the Leading Articles Editor of the Southwestern Law Review. He is currently active as a member of various industry and civic organizations, including his church and various youth activities. In 2002, Mr. Foran was honored as the Ernst & Young “Entrepreneur of the Year” for the Southwest Region. As the founder and Chairman of the Board, Chief Executive Officer and President of Matador Resources Company, Mr. Foran has provided leadership, experience and long relationships with a vast majority of the shareholders.
Mr. David E. Lancaster. Mr. Lancaster joined Matador Resources Company in December 2003 and serves as Executive Vice President, Chief Operating Officer and Chief Financial Officer. Mr. Lancaster has served in several capacities since joining Matador, including Vice President – Business Development, Acquisitions and Finance from December 2003 to May 2005; Vice President and Chief Financial Officer from May 2005 to May 2007; and Executive Vice President and Chief Financial Officer from May 2007 to May 2009. He assumed his current role in May 2009. From August 2000 to December 2003, he was Marketing Manager for Schlumberger Limited’s Data & Consulting Services which provides full-field reservoir characterization, production enhancement, multidisciplinary reservoir and production solutions and field development planning. In this position, he was responsible for global marketing strategies, business models, input to research and development, commercialization of new products and services and marketing communications. From 1999 to 2000, Mr. Lancaster was Business Manager, North and South America, for Schlumberger Holditch-Reservoir Technologies, the petroleum engineering consulting organization formed following Schlumberger’s acquisitions of S. A. Holditch & Associates, Inc. and Intera
122
Table of Contents
Index to Financial Statements
Petroleum Services. In this role, he was responsible for the business operations of 12 consulting offices throughout North and South America. Mr. Lancaster worked with Schlumberger for six years following its acquisition of S. A. Holditch & Associates, Inc. in October 1997. He joined S. A. Holditch & Associates in 1980, and was one of the principals in that well-known petroleum engineering consulting firm. Between 1980 and 1997, Mr. Lancaster held positions ranging from Senior Petroleum Engineer to Senior Vice President — Business Development. In this latter role, he was responsible for marketing and sales, as well as the company’s commercial training business. During most of his tenure at S. A. Holditch & Associates, Inc., Mr. Lancaster was a consulting reservoir engineer with particular emphasis on characterizing and improving production from unconventional natural gas reservoirs. For more than seven years during this time, he was the Project Manager for the Gas Research Institute’s Devonian Shales applied research projects investigating ways to improve reservoir characterization, completion practices and natural gas recovery in low permeability, natural gas shale reservoirs. He was also the lead reservoir engineer for the Secondary Gas Recovery project sponsored by the Gas Research Institute and the U.S. Department of Energy looking at ways to improve recovery from compartmentalized natural gas reservoirs in north and south Texas. Mr. Lancaster began his career as a reservoir engineer for Diamond Shamrock Corporation in 1979. Mr. Lancaster received Bachelor and Master of Science degrees in Petroleum Engineering from Texas A&M University in 1979 and 1988, respectively. He has authored or co-authored more than 50 technical papers and articles, as well as numerous other published reports and industry presentations. He is a member of the Society of Petroleum Engineers, and he served as a charter member and former Vice Chairman of the Texas A&M University Petroleum Engineering Advisory Board. Mr. Lancaster is a Licensed Professional Engineer in the State of Texas.
Mr. Matthew V. Hairford. Mr. Hairford joined Matador Resources Company in July 2004 as its Drilling Manager. He was named Vice President — Drilling in May 2005; Vice President — Operations in May 2006; and in May 2009 assumed the title of Executive Vice President— Operations. He is in charge of our drilling and production operations. He was previously with Samson Resources, an exploration and production company, as Senior Drilling Engineer, having joined Samson in 1999. His responsibilities there included difficult Texas and Louisiana Gulf Coast projects, horizontal drilling projects and a start-up drilling program in Wyoming. The scope of this work ranged from multi-lateral James Lime wells in east Texas to deep wells in south Texas and south Louisiana. Mr. Hairford has drilled many geo-pressured wells in Texas and Louisiana, along with normally pressured wells in southwestern Wyoming and east Texas. Additional responsibilities included a horizontal well program in Roger Mills County, Oklahoma at 15,000 feet vertical depth. Mr. Hairford has experience in air drilling, underbalanced drilling, drilling under mud caps and high temperature and pressure environments. From 1998 until 1999, Mr. Hairford served as Senior Drilling Engineer with Sonat, Inc. in Tyler, Texas, a global company involved with natural gas transmission and marketing, oil and natural gas exploration and production and oil services. There his responsibilities included Pinnacle Reef wells in east Texas and deep horizontal drilling in the Austin Chalk field in central Louisiana. From 1984 to 1998, Mr. Hairford served in various drilling engineering capacities with Conoco, Inc., an integrated energy company. His operational areas included the Appalachian Basin, Illinois Basin, Permian Basin, Texas Panhandle and Val Verde Basin. Mr. Hairford was selected as a member of a three-person team to explore the use of unconventional technologies to identify a potential step change in the drilling sector. Multiple techniques were evaluated and tested, including declassified defense department technologies. Additional Conoco assignments included both field and office drilling positions in Midland and Oklahoma City. Earlier in his career with Conoco, Mr. Hairford was selected to participate in the Conoco Rig Drilling Supervisor Training Program in Houston. This program consisted of two years working a regular rotation as a drilling representative on rigs and as a drilling engineer in various domestic offices. Mr. Hairford began his career in 1984 with Conoco in a field production assignment in Hobbs, New Mexico. Mr. Hairford received his Bachelor of Science degree in Petroleum Engineering Technology from
123
Table of Contents
Index to Financial Statements
Oklahoma State University in 1984. He is an active member of the American Association of Drilling Engineers, the American Petroleum Institute and the Society of Petroleum Engineers. Mr. Hairford has also undertaken additional training through Stanford University’s Executive Education programs.
Mr. David F. Nicklin. Mr. Nicklin joined Matador Resources Company in February 2009 as Executive Director of Exploration, after working with us as a part-time consultant since November 2007. Prior to joining Matador, Mr. Nicklin provided executive level consulting services to a variety of clients from January 2000 onwards through his wholly owned corporation, David F. Nicklin International Consulting Inc. In 2006, Mr. Nicklin co-founded and currently leads a small, private oil and natural gas company, Salt Creek Petroleum LLC. Salt Creek Petroleum owns small, non-operated interests in a variety of onshore oil and natural gas fields in the United States. We have determined that Mr. Nicklin’s involvement with Salt Creek Petroleum does not detract from his performance for our company and does not result in any conflict of interest between Mr. Nicklin and our company due to the fact that Salt Creek Petroleum is not involved in plays and prospects that compete with our interests. In 2000, he founded and led for three years a private oil and natural gas exploration company, Serica Energy, which is now a public company with assets in Indonesia, the United Kingdom, Spain, Ireland and Morocco. Between 1981 and 2000, Mr. Nicklin was an employee of ARCO, an integrated energy company, where he participated in and led several international exploration teams, particularly in the Middle East, southeast Asia and Australasia. In 1991, he became the Chief Geologist for ARCO, a position he held until his retirement in 2000. In this position, Mr. Nicklin was responsible for the quality of the geological effort at ARCO, in particular, ensuring the application of state-of-the-art geological technology, the company’s risk management process, the selection of new ventures and the high-grading of a large geoscience staff. Throughout his career at ARCO, Mr. Nicklin was closely involved with the successful exploration for and development of a number of large oil and natural gas discoveries. Prior to joining ARCO, Mr. Nicklin was a senior development and operations geologist in a variety of positions in the United Kingdom, Angola, Norway and the Middle East. He was a specialist in well-site operations and provided training in operations to entry-level personnel. Mr. Nicklin was born in the United Kingdom and received a Bachelor of Science degree in Geology from the University of Wales in 1971. He is an active member of the American Association of Petroleum Geologists and various other professional groups.
Mr. Scott E. King. Mr. King co-founded Matador Resources Company with Mr. Foran and serves as our Vice President — Geophysics and New Ventures. From July 2003 to February 2009, Mr. King held the position of Vice President — Exploration, and in February 2009, he assumed his current position. He was previously with Matador Petroleum Corporation, joining that company in December 1996 as Chief Geophysicist. Immediately prior to Matador Petroleum’s sale, Mr. King served as its Portfolio Manager and was responsible for recommending which drilling opportunities Matador Petroleum should pursue. Prior to joining Matador Petroleum, Mr. King worked for Enserch Corporation, a diversified energy company with interests in petroleum exploration and production, oilfield services, engineering design and construction, and natural gas transmission and distribution, as Team Leader for the Oklahoma Asset Group. Mr. King began his career in 1983 with Sohio Petroleum, an integrated energy company. The Sohio assets were sold and resold to a number of companies, including BP p.l.c., Tex-Con Oil Co., Pacific Gas and Electric Company, Dalen Resources Oil & Gas Co., and finally Enserch Corporation. During this time, Mr. King worked for and was retained by each of these companies and had success in generating and managing drilling opportunities in the continental United States. Mr. King received a Bachelor of Science degree in Geology with a Minor in Mathematics from Alfred University, Alfred, New York in 1981 and a Master of Science degree in Geophysics from Wright State University, Dayton, Ohio in 1983. Mr. King is active in various professional and civic groups including the American Association of Petroleum Geologists and the Society of Exploration Geophysicists.
124
Table of Contents
Index to Financial Statements
Mr. Bradley M. Robinson. Mr. Robinson joined Matador Resources Company in August 2003 as one of its founders and has served as our Vice President — Reservoir Engineering since that time. Prior to joining Matador, from 1997 to August 2003, Mr. Robinson held the position of Advisor with Schlumberger Limited’s Data & Consulting Services business unit which provides full-field reservoir characterization, production enhancement, multidisciplinary reservoir and production solutions and field development planning where he was responsible for the development and application of new technologies for well completions and stimulation, provided technical expertise for reservoir management and field development projects, taught basic and advanced industry courses in well completions and stimulation and provided internal training in production engineering and stimulation methods. Mr. Robinson worked with Schlumberger for six years following its acquisition of S. A. Holditch & Associates, Inc. in 1997. Mr. Robinson joined Holditch in 1979, and was one of the principals in that well-known petroleum engineering consulting firm. From 1979 to 1982, Mr. Robinson served as Senior Petroleum Engineer and was involved in all aspects of reservoir and production engineering for both conventional and low permeability oil and natural gas fields. From 1982 to 1997, he was Holditch’s Vice President — Production Engineering, where he was responsible for coordination and management of production and completion engineering projects, including development drilling and openhole data acquisition programs, design and supervision of initial well completions and workovers, transient well test design and analysis and hydraulic fracture stimulation design and supervision. His duties also included reserves evaluation and economic analysis of new and existing wells, and his areas of specialization included low permeability natural gas sands, coalbed methane reservoirs, and horizontal wells. For approximately 10 years during this time, he served as assistant project manager for the Gas Research Institute’s Tight Gas Sands and Horizontal Gas Wells applied research projects investigating ways to improve reservoir characterization, completion practices and natural gas recovery in low permeability natural gas reservoirs and horizontal natural gas wells. During his career, he has worked all over the world including the United States, Canada, Venezuela, Colombia, Mexico, Egypt, the North Sea, Russia and Indonesia, among others. Mr. Robinson began his career in 1977 with Marathon Oil Company, serving as an Associate Production Engineer and later as a Reservoir Engineer in Midland. Mr. Robinson received Bachelor and Master of Science degrees in Petroleum Engineering from Texas A&M University in 1977 and 1986, respectively. He has authored or co-authored 18 technical articles appearing in industry and/or technical publications and has made numerous engineering technical presentations. Mr. Robinson is a member of the Society of Petroleum Engineers and is a Licensed Professional Engineer in the State of Texas.
Board of Directors
Our board of directors consists of seven directors. The following biographies describe the business experience of our directors, other than Mr. Foran. There are no family relationships among any of our officers and directors.
Dr. Stephen A. Holditch. Dr. Holditch, age 64, was a shareholder in and advisor to Matador Petroleum Corporation and is an original shareholder in Matador Resources Company. He was first elected to our board of directors in January 2004 and currently serves as Chairman of the board’s Engineering Committee. He is Professor and Head of the Harold Vance Department of Petroleum Engineering at Texas A&M University, having assumed this position in January 2004. Prior to that, he was with Schlumberger Limited, a leading oil field services provider, as a Fellow, one of only a handful of technical experts so recognized with this title in that company. In this position, Dr. Holditch advised top management within Schlumberger Limited on production and reservoir engineering matters. Dr. Holditch joined Schlumberger in 1997, following Schlumberger Limited’s acquisition of S. A. Holditch & Associates, Inc., the consulting company he founded and grew over 20 years into a preeminent engineering firm worldwide in the analysis of low
125
Table of Contents
Index to Financial Statements
permeability natural gas reservoirs and the design of hydraulic fracture treatments. During the latter half of the 1980’s and into the 1990’s, Dr. Holditch expanded the services offered by S. A. Holditch & Associates, building the company from three employees in 1977 to more than 80 employees in 1998. At the time of its sale to Schlumberger in 1997, S. A. Holditch & Associates had become a full-service petroleum engineering consulting company. From 1974 to 1976, Dr. Holditch worked as an independent consulting engineer on reservoir studies, well completions and fracture treatment design for numerous clients in east and south Texas. During that period, he also attended Texas A&M University to earn a PhD degree in Petroleum Engineering and conducted research in reservoir flow behavior in fractured, low permeability natural gas reservoirs. From 1970 to 1974, he was a Production Engineer with Shell Oil Company, an integrated energy company, where his responsibilities included production engineering for numerous oil and natural gas fields, well completions and massive hydraulic fracture treatment designs in several deep, geopressured fields in south Texas. From 1968 to 1969, he worked for Pan American Petroleum Corporation as a field engineer on various projects in east Texas. Dr. Holditch received Bachelor and Master of Science degrees in Petroleum Engineering from Texas A&M University in 1969 and 1970, respectively, and a PhD degree in Petroleum Engineering from Texas A&M University in 1976. Dr. Holditch was President of the Society of Petroleum Engineers, International (SPE) in 2002 and served on the Society’s board of directors from 1998 to 2003. In addition, he served as a Trustee for the American Institute of Mining, Metallurgical, and Petroleum Engineers from 1997 to 1998. He is also on the board of directors of Triangle Petroleum Corporation, an oil and natural gas exploration corporation. He has received numerous awards in recognition of his technical achievements and leadership. In 1995, Dr. Holditch was elected to the National Academy of Engineering, the highest professional honor awarded to an engineer. In 1997, he was elected to the Russian Academy of Natural Sciences, and in 1998, Dr. Holditch was elected to the Petroleum Engineering Academy of Distinguished Graduates at Texas A&M University and was recently named distinguished alumnus of engineering. Dr. Holditch received the SPE Distinguished Service Award for Petroleum Engineering Faculty in 1981 and held the Shell Distinguished Chair in Petroleum Engineering at Texas A&M University from 1983 to 1987. He was awarded the R. L. Adams Professorship in 1995. He teaches graduate level courses in formation evaluation, well stimulation and production engineering, and has actively performed and supervised research at Texas A&M University since 1974 in a wide range of engineering areas. Dr. Holditch is a member of numerous professional societies and serves as a board member and/or trustee for several business affiliations. He has been an SPE Distinguished Lecturer and has co-authored or edited three books and more than 100 technical papers; he has made more than 80 invited technical presentations to petroleum industry audiences. His position as Professor and Head of the Harold Vance Department of Petroleum Engineering at Texas A&M University, his prior positions with Schlumberger and S. A. Holditch & Associates, Inc. and his service on the board of directors of Triangle Petroleum Corporation provide our board of directors with additional perspective on our completion and stimulation operations and other business and engineering matters.
Mr. David M. Laney. Mr. Laney, age 62, is an original shareholder in Matador Resources Company and was an original shareholder in Matador Petroleum Corporation. He is one of the original directors on our board of directors in July 2003 and currently serves as Lead Director and Chairman of the board’s Planning and Compensation Committee. He is an attorney who since March 2007 has practiced law as a solo practitioner. Between 2003 and 2007, he was a partner with the law firm of Jackson Walker LLP in Dallas where he practiced in the area of corporate and financial law. Prior to joining Jackson Walker, Mr. Laney practiced at the law firm of Jenkens & Gilchrist, a Professional Corporation, from 1977 to 2003 and was managing partner of the Jenkens & Gilchrist law firm from 1990 to 2002. During his tenure as Managing Partner, Jenkens & Gilchrist was recognized as one of the fastest growing firms in the country and was named by industry press as among the top 50 firms in the country (from the standpoint of size and financial performance). From a regional law firm of roughly 160 lawyers in two Texas cities in 1990, the
126
Table of Contents
Index to Financial Statements
firm expanded under Mr. Laney’s leadership to over 625 attorneys in nine cities by the end of his tenure in 2002. Mr. Laney has also served in several capacities as an appointee of Texas Governors William Clements and George W. Bush on various state boards continuously from 1989 through 2001. He was Governor Clements’ appointee to the Texas Finance Commission, responsible for regulatory oversight of the state banking and thrift industries as the Texas banking system emerged from the recession and collapse of the 1980’s. He then served as Governor Bush’s Texas Commissioner of Transportation (Chairman of the Texas Department of Transportation) during the period 1995 to 2000. Mr. Laney completed his term with the Texas Department of Transportation (TxDOT) in 2001. As Commissioner of Transportation, his responsibilities were largely those of the chief executive of TxDOT, a 14,000 employee state agency with a $5 billion annual budget. In that position, he initiated and oversaw the planning and successful execution of an extensive number of organizational and operational innovations throughout the organization, and developed and managed TxDOT’s legislative agenda during three regular sessions of the Texas Legislature. In 2002, Mr. Laney was nominated by President George W. Bush to the board of directors of Amtrak and confirmed by the U. S. Senate for a five-year term. In November 2007, he completed his term as Chairman of Amtrak’s board of directors. From 1998 to 2003, Mr. Laney served as a member of the Stanford University Board of Trustees, and for two years as Chairman of its Audit Committee. Mr. Laney has also served in various capacities in connection with numerous civic and educational organizations and projects in the Dallas area. Mr. Laney’s legal experience and leadership positions in governmental departments provide our board of directors with additional perspective on our corporate governance, legal and governmental relations matters and general business matters.
Mr. Gregory E. Mitchell. Mr. Mitchell, age 59, joined our board of directors in June 2011. With 45 years of grocery and petroleum retailing experience, he is currently President and CEO of Toot’n Totum Food Stores, LLC, his family company, which is located in Amarillo, Texas. The company, founded in 1950, consists of 62 convenience store/fueling locations, as well as car wash and car care centers, with an employee base of over 700 team members. His experience within the petroleum industry includes extensive negotiations with various major refiners in the United States. A 1973 graduate of the University of Oklahoma, with a Bachelor of Business Administration degree, Mr. Mitchell was appointed by former Governor William Clements to the Texas Higher Education Coordinating Board, where he served for six years. Additionally, he has served as Chairman of the Amarillo Chamber of Commerce, Chairman of the United Way of Amarillo and Canyon, Chairman of the Don and Sybil Harrington Foundation and President of the Amarillo Area Foundation. Currently, Mr. Mitchell is a director of the Holding Committee for Amarillo National Bank, a director of Cal Farley’s Boys Ranch and a director of Wigel’s Convenience Stores in Knoxville, Tennessee.
Dr. Steven W. Ohnimus. Dr. Ohnimus, age 65, was first elected to our board of directors in January 2004 and currently serves as Chairman of the board’s Operations Committee. He spent his entire professional career from 1971 to 2000 with Unocal Corporation, an integrated energy company. From 1995 to 2000, he was General Manager — Partner Operated Ventures, where he represented Unocal’s non-operated international interests at board meetings, management committees and other high level meetings involving projects in the $200 million range in countries such as Azerbaijan, Bangladesh, China, Congo, Myanmar and Yemen. From 1994 to 1995, Dr. Ohnimus was General Manager of Asset Analysis, where he managed and directed planning, business plan budgeting and scenario plans for the domestic and international business unit with an asset portfolio totaling $5.5 billion. From 1990 to 1994, Dr. Ohnimus was Vice President and General Manager, Unocal Indonesia, located in Balikpapan, operating five offshore fields and one onshore liquid extraction plant and employing 1200 nationals and 50 expatriates. From 1989 to 1990, he served as Regional Operations Manager in Anchorage, Alaska, and from 1988 to 1989, he was District Operations Manager in Houma, Louisiana. From 1981 to 1988, Dr. Ohnimus was in various
127
Table of Contents
Index to Financial Statements
management assignments in Houston and Houma, Louisiana, and from 1971 to 1981 he handled various technical assignments in reservoir, production and drilling in the Gulf Coast area (Houston, Van, Lafayette and Houma). From 1975 to 1979, Dr. Ohnimus was Assistant Professor of Petroleum Engineering at the University of Southwest Louisiana (now University of Southern Louisiana) where he taught a total of eleven undergraduate and graduate night classes. In 1980, he taught drilling seminars at the University of Texas Petroleum Extension Service of the International Association of Drilling Contractors (IADC). Dr. Ohnimus has authored several published papers concerning reservoir recompletion and increased recovery. Dr. Ohnimus received his Bachelor of Science degree in Chemical Engineering from the University of Missouri at Rolla in 1968, a Master of Science degree in Petroleum Engineering from the University of Missouri at Rolla in 1969 and a PhD degree in Petroleum Engineering from the University of Missouri at Rolla in 1971. Dr. Ohnimus served as a director of the American Petroleum Institute in 1978 and 1979, served as Session Chairman for the Society of Petroleum Engineers’ Annual Convention in 1982, was the Evangeline Section Chairman of the Society of Petroleum Engineers in 1978 and 1979 and served as President of the Unocal Credit Union from 1986 to 1988. In 2007, he was elected President of the Unocal Gulf Coast Alumni Club, which reports through the Chevron Retirees Association. He currently still holds that position. In June 2008, Dr. Ohnimus was elected as the vice chairman of the advisory board of Western Standard Energy Corp. (OTCBB:WSEG), an oil and natural gas exploration company. Due to his long oil and natural gas industry career and significant operational and international experience, Dr. Ohnimus provides valuable insight to our board of directors on our drilling and completion operations and management, as well as providing a global technology and operations perspective.
Mr. Michael C. Ryan. Mr. Ryan, age 50, joined our board of directors in February 2009. Prior to joining the board, he served as a Board Advisor to the Financial Committee and frequently participated in board planning and strategy sessions. Since October 2004, Mr. Ryan has been a Partner and member of the Investment Committee at Berens Capital Management LLC, an investment firm based in New York. From February 1998 to June 2004, he worked with Goldman, Sachs & Co., a global investment banking and securities services firm, leading its West Coast international institutional equities business. In this role, he developed and built a team of professionals to advise large institutional clients on their global investment decisions. From 1995 to 1998, Mr. Ryan lived in Oslo, Norway, where he was a Partner at Pareto Securities, a Scandinavian-based securities firm where he led and built the institutional equities business into the United States and United Kingdom. From 1991 to 1994, Mr. Ryan represented multiple eastern European governments in the preparation, negotiation and sale of many of their largest state-owned companies. He began his career with Honeywell, Inc. which invents and manufactures technologies, including in the safety, security and energy areas, in 1983, working in the Systems and Research Center, which focused on advanced weapons development programs. Mr. Ryan received a Master of Business Administration degree from The Wharton School at the University of Pennsylvania and a Bachelor of Science degree from the University of Minnesota. Mr. Ryan’s background and experience in the domestic and international financial world provide our board of directors with additional perspective on accounting and auditing functions, economic trends and our capital sourcing and financing opportunities.
Mrs. Margaret B. Shannon. Mrs. Shannon, age 61, joined our board of directors in June 2011. She served as Vice President and General Counsel of BJ Services Company, an international oilfield services company, from 1994 to 2010, when Baker Hughes Incorporated acquired BJ Services. Prior to 1994, she was a partner with the law firm of Andrews Kurth LLP. Mrs. Shannon is active in community activities serving as the Chair of the Membership Committee of the board of directors of the Harris County Health Alliance, Chair of the Audit Committee of the board of directors of the South Texas College of Law, chair of the Endowment Board of Palmer Memorial Episcopal Church and a member of the board of directors of the Harris County Health and Human Services Foundation. She previously served as the Chair of the Executive Women’s Partnership
128
Table of Contents
Index to Financial Statements
sponsored by the Greater Houston Partnership and was a participant in the American Leadership Forum. Mrs. Shannon received her J.D. cum laude from Southern Methodist University Dedman School of Law in 1976 and her Bachelor of Arts degree from Baylor University in 1971.
Although our bylaws include a mandatory retirement age of 70 for directors, our board of directors is permitted to waive such restriction on an annual basis up to age 75 upon the determination by the board that such waiver is in the best interest of the company.
In addition, our board is divided into three classes of directors, designated Class I, Class II and Class III, with the term of office of each director ending on the date of the third annual meeting following the annual meeting at which such director was elected. The numbers of directors in each class will be as nearly equal as possible at all times. The current Class I directors are Mrs. Shannon and Mr. Ryan, who will hold office until the 2012 annual meeting of shareholders and until the election and qualification of their respective successors or until their earlier death, retirement, resignation or removal. The current Class II directors are Messrs. Mitchell and Ohnimus, who will hold office until the 2013 annual meeting of shareholders and until the election and qualification of their respective successors or until their earlier death, retirement, resignation or removal. The current Class III directors are Messrs. Foran, Holditch and Laney, who will hold office until the 2014 annual meeting of shareholders and until the election and qualification of their respective successors or until their earlier death, retirement, resignation or removal.
Special Board Advisors
In addition to our board of directors, we have three individuals who have significant oil and gas experience or legal, accounting and other business experience who advise our board of directors on various matters. These individuals serve as special advisors to our board of directors and certain of the board’s committees. Their business histories are described below:
Mr. Marlan W. Downey. Mr. Downey worked for Shell Oil Company, an integrated energy company, from 1957 to 1987. In 1977, he moved to Shell Oil’s International Exploration & Production business and became Vice President of Shell, and then President of Shell Oil’s newly-formed international subsidiary, Pecten International. Mr. Downey joined ARCO International in 1990 as Senior Vice President of Exploration, becoming President of ARCO International and then Senior Vice President and Executive Exploration Advisor to ARCO International. Mr. Downey retired from ARCO in 1996. He is a fellow of the American Association for the Advancement of Science. Mr. Downey is a past President of the American Association of Petroleum Geologists (“AAPG”) and is Chief Scientist — Sarkeys Energy Center at Oklahoma University. Mr. Downey is the 2009 recipient of the AAPG’s Sidney Powers Medal, which is the highest honor awarded by the AAPG. He is also active in several international scientific organizations and serves on boards of the Institute for the Study of Earth and Man, and the Reves Institute for International Studies at William and Mary. Mr. Downey received a Bachelor of Arts degree in Chemistry in 1952 at Peru State College in Nebraska. He served in the Army in Korea and the Philippines, then entered graduate school at the University of Nebraska, and received a Bachelor of Science degree in 1956 and a Master of Science degree in Geology in 1957. Mr. Downey previously served on Matador Petroleum Corporation’s board of directors with Mr. Foran. He has served as a special advisor since our inception in July 2003.
Mr. Edward J. Scott, Jr. Mr. Scott is a successful Amarillo, Texas lawyer, civic leader and businessman, managing a varied portfolio of real estate and development-related concerns. Currently, he is the primary developer for two residential developments in Amarillo: Pheasant Run and The Greenways. He serves as primary owner of Document Shredding & Storage which services the entire Panhandle area, Sparky’s Storage Solutions in Amarillo, Texas and is part owner in several car washes in the Lubbock,
129
Table of Contents
Index to Financial Statements
Abilene and Dallas/Fort Worth areas. From 1968 to 1996, Mr. Scott was an attorney with the Amarillo law firm of Gibson, Ochsner & Adkins. From 1965 to 1968, he served as an accountant with Price Waterhouse & Co. Mr. Scott received his Bachelor of Business Administration degree in Accounting from West Texas State University in 1962 and an LLB from The University of Texas School of Law in 1965. Mr. Scott has previously served as a director and chairman of the Amarillo Economic Development Corporation and is currently serving as a board member of the Salvation Army, Amarillo Area Foundation, as well as the Amarillo Club. He is a past President of the Rotary Club of Amarillo, the Amarillo Businessmen’s Club, the Amarillo Club, Big Brothers and Big Sisters and the Amarillo Business Foundation. He is a former chairman of the Amarillo Board of City Development and a former member of the Board of Regents for West Texas State University. Mr. Scott has previously served as an officer and/or board member to many other local civic and/or charitable organizations. He is a member of the Texas Bar Association, the Amarillo Bar Association, the Texas Society of Certified Public Accountants and the Panhandle Chapter of the Texas Society of Certified Public Accountants. Mr. Scott is an original shareholder in both Matador Resources Company and the former Matador Petroleum Corporation. He was an original director on the Matador Resources Company board of directors and served as chairman of the Audit Committee for eight years until his retirement from the board in June 2011.
Mr. W.J. “Jack” Sleeper, Jr. Mr. Sleeper has over 55 years of experience evaluating oil and gas properties. Mr. Sleeper joined DeGolyer and MacNaughton, a petroleum consulting firm, as a Petroleum Engineer in 1965. He performed numerous field studies in North and South America, the North Sea and the Middle East. Mr. Sleeper retired as President and Chief Operating Officer of DeGolyer and MacNaughton on January 1, 1995. He served on DeGolyer and MacNaughton’s board of directors from 1978 until his retirement. Upon his graduation from the University of Oklahoma with a Bachelor of Science degree in Petroleum Engineering (with Distinction) in 1955, he was employed by Shell Oil Company, an integrated energy company, as an Exploitation Engineer. During his 10 years with Shell he spent three years performing research at Shell Development Company in the fields of Reservoir Engineering, Geology and Petrophysics. He held the titles of Project Engineer, Senior Exploitation Engineer and Senior Production Geologist during his tenure with Shell. Mr. Sleeper has served on the Mewborne Petroleum and Geological Board of Advisors at the University of Oklahoma since 1995. He is a Licensed Professional Engineer (retired) in the states of Oklahoma and Texas. Mr. Sleeper previously served on Matador Petroleum Corporation’s board of directors with Mr. Foran. He has served as a special advisor since our inception in July 2003.
Committees of the Board of Directors
Upon the conclusion of this offering, we intend to have an Audit Committee, Nominating, Compensation and Planning Committee, Corporate Governance Committee, Executive Committee, Operations Committee, Engineering Committee and Prospect Committee and may have such other committees as the board of directors shall determine from time to time. Upon conclusion of this offering, the Audit Committee, Nominating, Compensation and Planning Committee and Corporate Governance Committee will have charters which will be on our website at www.matadorresources.com. Each of the standing committees of the board of directors will have the composition and responsibilities described below.
Audit Committee
We will reconstitute our Audit Committee prior to the completion of this offering. We anticipate that the reconstituted Audit Committee will consist of three directors, each of whom will be independent under
130
Table of Contents
Index to Financial Statements
the rules of the NYSE and the SEC. SEC rules also require that a public company disclose whether or not its audit committee has an “audit committee financial expert” as a member. An “audit committee financial expert” is defined as a person who, based on his or her experience, possesses the attributes outlined in such rules. We anticipate that at least one of our independent directors will satisfy the definition of “audit committee financial expert.”
The Audit Committee will assist the board of directors in monitoring:
| • | the integrity of our financial statements and disclosures; |
| • | our compliance with legal and regulatory requirements; |
| • | the qualifications and independence of our independent auditors; |
| • | the performance of our internal audit function and our independent auditor; and |
| • | our internal control system. |
In addition, the Audit Committee will be charged with enforcing our Code of Ethics and Business Conduct for Officers, Directors and Employees. We anticipate adopting an Audit Committee charter prior to the completion of this offering defining the committee’s primary duties in a manner consistent with the rules of the SEC and NYSE, and a copy of such charter will be posted on our website concurrently with, or prior to, the completion of this offering.
Nominating, Compensation and Planning Committee
We will form a Nominating, Compensation and Planning Committee prior to the completion of this offering. We anticipate that the Nominating, Compensation and Planning Committee will consist of three directors, each of whom will be independent under the rules of the NYSE, a “non-employee director” pursuant to Section 16(b) of the Securities Exchange Act of 1934, as amended, or the Exchange Act, and an “outside director” pursuant to Section 162(m) of the Internal Revenue Code of 1986, as amended.
The Nominating, Compensation and Planning Committee will have the following responsibilities:
| • | identify and recommend to the board of directors individuals qualified to be nominated for election to the board of directors; |
| • | recommend to the board of directors the members and chairman of each committee of the board of directors; |
| • | assist the board of directors and the independent members of the board of directors in the discharge of their fiduciary responsibilities relating to the fair and competitive compensation of our executive officers; |
| • | provide overall guidance with respect to the establishment, maintenance and administration of our compensation programs, including stock and benefit plans; |
| • | oversee and advise the board of directors and the independent members of the board of directors on the adoption of policies that govern our compensation programs; and |
| • | recommend to the board of directors the strategy, tactical and performance goals of the company, including those performance and tactical goals that relate to performance based compensation, including but not limited to goals for production, reserves, cash flows and shareholder value. |
131
Table of Contents
Index to Financial Statements
The board of directors anticipates it will adopt a resolution prior to the completion of this offering directing the Nominating, Compensation and Planning Committee to establish a Director Nominating Advisory Committee that will receive and consider possible nominees for election by shareholders to the board of directors. It is contemplated that the Director Nominating Advisory Committee will be comprised of 8 to 12 persons selected by the Nominating, Compensation and Planning Committee, consisting of at least:
| • | two members of the Nominating, Compensation and Planning Committee; |
| • | two former members of or special advisors to the board of directors; |
| • | two shareholders who (i) beneficially own common stock having a market value of at least $1.0 million (such value to be based on the market value of the common stock immediately prior to designation of such shareholder to the Director Nominating Advisory Committee) and (ii) are not already board members or have a representative on our board; and |
| • | two shareholders who (i) have beneficially owned common stock continuously for at least the five years prior to such shareholder’s designation to the Director Nominating Advisory Committee and (ii) are not already board members or have a representative on our board. |
The Director Nominating Advisory Committee will make recommendations on its conclusions to the Nominating, Compensation and Planning Committee for its consideration and review.
Corporate Governance Committee
We will form a Corporate Governance Committee prior to the completion of this offering. We anticipate that the Corporate Governance Committee will consist of three directors, each of whom will be independent under the rules of the NYSE.
The Corporate Governance Committee will periodically review and assess our Code of Ethics and Business Conduct for Officers, Directors and Employees and our corporate governance guidelines and make recommendations for changes thereto to the board of directors, review any other matters related to our corporate governance, unless the authority to conduct such review has been retained by the board of directors or delegated to another committee and oversee the evaluation of the board of directors and management. We anticipate adopting a Corporate Governance Committee charter prior to the completion of this offering defining the committee’s primary duties in a manner consistent with the rules of the SEC and NYSE, and a copy of such charter will be posted on our website concurrently with, or prior to, the completion of this offering.
Executive Committee
We will form an Executive Committee prior to the completion of this offering. We anticipate that the Executive Committee will consist of three directors.
We anticipate that the Executive Committee will be permitted to discharge all the responsibilities of the board of directors in the management of the business and affairs of the company, except where action of the full board of directors is required by statute or by our certificate of formation.
Operations Committee
We have, and anticipate continuing to have upon completion of this offering, an Operations Committee. The Operations Committee provides oversight over the development of our prospects, our drilling and completion operations and our production operations and associated costs. The current members
132
Table of Contents
Index to Financial Statements
of the Operations Committee are Messrs. Ohnimus, Holditch, Foran and Sleeper (ex-officio), and all of them are anticipated to remain members of the committee upon completion of this offering.
Engineering Committee
We have, and anticipate continuing to have upon completion of this offering, an Engineering Committee. The Engineering Committee provides oversight over the amount and classifications of our reserves and the design of our completion techniques and hydraulic fracturing operations and various other reservoir engineering matters. The current members of the Engineering Committee are Messrs. Holditch, Ohnimus, Foran, Downey (ex-officio) and Sleeper (ex-officio), and all of them are anticipated to remain members of the committee upon completion of this offering.
Prospect Committee
We have, and anticipate continuing to have upon completion of this offering, a Prospect Committee. The Prospect Committee provides oversight over the technical analysis, evaluation and selection of our oil and natural gas prospects. The current members of the Prospect Committee are Messrs. Foran, Holditch, Ohnimus, Downey (ex-officio) and Sleeper (ex-officio), and all of them are anticipated to remain members of the committee upon completion of this offering.
Nominating, Compensation and Planning Committee Interlocks and Insider Participation
No member of our Nominating, Compensation and Planning Committee will be one of our employees. None of our executive officers will serve on the board of directors or compensation committee of a company that has an executive officer that serves on our board of directors or Nominating, Compensation and Planning Committee. No member of our board of directors will serve as an executive officer of a company in which one of our executive officers serves as a member of the board of directors or compensation committee of that company.
To the extent any members of our Nominating, Compensation and Planning Committee and affiliates of theirs have participated in transactions with us meeting the requirements of Item 404 of Regulation S-K, a description of those transactions is described in “Certain Relationships and Related Party Transactions.”
Code of Ethics and Business Conduct for Officers, Directors and Employees
Our board of directors will revise our Code of Ethics and Business Conduct for Officers, Directors and Employees, in accordance with applicable U.S. federal securities laws and the corporate governance rules of the NYSE. We anticipate that any waiver of this code may be made only by our officer responsible for monitoring compliance with such code (or Audit Committee if such waiver is requested by an executive officer or a director) and if required by applicable U.S. federal securities laws or the corporate governance rules of the NYSE will be promptly disclosed. A copy of the revised Code of Ethics and Business Conduct for Officers, Directors and Employees will be posted on our website concurrently with, or prior to, the completion of this offering.
Corporate Governance Guidelines
Our board of directors will adopt corporate governance guidelines prior to the completion of this offering in accordance with the corporate governance rules of the NYSE. A copy of the corporate governance guidelines will be posted on our website concurrently with, or prior to, the completion of this offering.
133
Table of Contents
Index to Financial Statements
Director Independence
Prior to the completion of this offering, our board of directors will review the independence of our directors and consider whether any director has a material relationship with us that could compromise his or her ability to exercise independent judgment in carrying out his or her responsibilities. After this review, our board of directors will list in the prospectus those directors who have been determined to be “independent directors” as defined under the rules of the SEC and the NYSE. We anticipate that such independent directors will constitute a majority of our board of directors as required by the rules of the SEC and NYSE.
134
Table of Contents
Index to Financial Statements
COMPENSATION OF NAMED EXECUTIVE OFFICERS
Compensation Discussion and Analysis
In this compensation discussion and analysis, we discuss our compensation objectives, our decisions and the rationale behind those decisions relating to compensation for 2010 for our principal executive officer, our principal financial officer and our other three most highly compensated executive officers. Furthermore, this compensation discussion and analysis discusses our decisions to date regarding compensation for 2011 in anticipation of closing this offering and the rationale behind those decisions. This compensation discussion and analysis provides a general description of our compensation program and specific information about its various components.
Named Executive Officers
Throughout this discussion, the following individuals are referred to as the “Named Executive Officers” and are included in the Summary Compensation Table:
| • | Joseph Wm. Foran, Chairman of the Board, Chief Executive Officer and President; |
| • | David E. Lancaster, Executive Vice President, Chief Operating Officer and Chief Financial Officer; |
| • | Matthew V. Hairford, Executive Vice President — Operations; |
| • | David F. Nicklin, Executive Director of Exploration; and |
| • | Bradley M. Robinson, Vice President — Reservoir Engineering. |
Objectives of Our Compensation Program
Our future success and the ability to create long-term value for our shareholders depends on our ability to attract, retain and motivate highly qualified individuals in the oil and natural gas industry. Additionally, we believe that our success also depends on the continued contributions of our Named Executive Officers. Our executive compensation program is designed to provide a comprehensive compensation program to meet the following objectives:
| • | to be fair to both the executive and the company; |
| • | to attract and retain talented and experienced executives with the skills necessary for us to execute our business plan; |
| • | to provide opportunities to achieve a total compensation level that is competitive with comparable positions at companies with which we compete for executives; |
| • | to align the interests of our executive officers with the interests of our shareholders and with the performance of our company for long-term value creation; |
| • | to provide financial incentives to our executives to achieve our key corporate and individual objectives; |
| • | to provide an appropriate mix of fixed and variable pay components to establish a “pay-for-performance” oriented compensation program; |
| • | to foster a shared commitment among executives by coordinating their corporate and individual goals; |
135
Table of Contents
Index to Financial Statements
| • | to provide compensation that takes into consideration the education, professional experience and knowledge that is specific to each job and the unique qualities the executive provides; and |
| • | to recognize an executive’s commitment and dedication in his job performance and in support of our culture. |
What Our Compensation Program Is Designed to Reward
Our compensation program is designed to reward, in both the short-term and the long-term, performance that contributes to the implementation of our business strategies, maintenance of our culture and values and the achievement of our objectives. In addition, we reward qualities that we believe help achieve our business strategies such as teamwork; individual performance in light of general economic and industry-specific conditions; relationships with shareholders and vendors; the ability to manage and enhance production from our existing assets; the ability to explore new opportunities to increase oil and natural gas production; the ability to identify and acquire additional acreage; the ability to increase year-over-year proved reserves; the ability to control unit production costs; level of job responsibility; industry experience; and general professional growth.
2010
Elements of Our 2010 Compensation Program and Why We Paid Each Element
For 2010, our management compensation program was comprised of the following four elements:
| • | Base Salary. We paid base salary to reward an executive for his assigned responsibilities, experience, leadership and expected future contribution. |
| • | Discretionary Cash Bonus. We included a discretionary cash bonus as part of our management compensation program because we believed this element of compensation (i) helped focus and motivate management to achieve key corporate and individual objectives by rewarding the achievement of these objectives; (ii) helped retain management; (iii) rewarded our successes over the prior year; and (iv) was necessary to be competitive from a total remuneration standpoint. |
| • | Long-Term Equity Incentive Compensation. We used stock options as the primary vehicle for (i) linking our long-term performance and increases in shareholder value to the total compensation for our executive officers and (ii) providing competitive compensation to attract and retain our executive officers. |
| • | Benefits. We offered a variety of health and welfare programs to all eligible employees, including the executive officers other than Mr. Nicklin. The health and welfare programs were intended to protect employees against catastrophic loss and encourage a healthy lifestyle. |
How We Determined Each Element of 2010 Compensation
In 2010, we had a Planning and Compensation Committee which, together with the board of directors, oversaw our compensation program in conjunction with the recommendations made by Mr. Foran and the chairman of the Planning and Compensation Committee. The 2010 base salaries and the 2009 bonuses were set in December 2009. In December 2009, Mr. Foran evaluated the other Named Executive Officers, and, based on his general knowledge of compensation ranges in the oil and natural gas industry, recommended to the chairman of the Planning and Compensation Committee the appropriate base salaries for the upcoming year, other than for Mr. Nicklin. Additionally, Mr. Foran also recommended the bonuses for the Named Executive Officers, other than Mr. Nicklin, to the chairman of the Planning and Compensation Committee
136
Table of Contents
Index to Financial Statements
for 2009. Mr. Foran, however, did not make any recommendations regarding his own compensation. Mr. Foran and the chairman of the Planning and Compensation Committee discussed Mr. Foran’s evaluation of the other Named Executive Officers, other than Mr. Nicklin, and made any appropriate adjustments to the recommended base salaries and bonuses for such other Named Executive Officers. The chairman of the Planning and Compensation Committee and Mr. Foran made their joint recommendations to both the Planning and Compensation Committee and the board of directors. However, Mr. Foran was not present when the chairman of the Planning and Compensation Committee made his recommendations regarding Mr. Foran’s base salary and bonus. After receiving the recommendations from Mr. Foran and the chairman of the Planning and Compensation Committee for the other Named Executive Officers, other than Mr. Nicklin, and from the chairman of the Planning and Compensation Committee for Mr. Foran, the Planning and Compensation Committee and the board of directors unanimously (other than with respect to Mr. Foran as to his compensation) agreed with the recommendations. Currently, the members of the Planning and Compensation Committee are Messrs. Foran, Holditch, Laney and Ryan.
Unlike the base salaries and bonuses, the equity grants to Named Executive Officers are not determined at a precise time or through a specific process. As described below under “– Stock Options,” on February 22, 2010, stock options were granted to the Named Executive Officers based on the evaluation of each Named Executive Officer’s performance and relative contributions to our growth during 2008 and 2009 by Mr. Foran in consultation with the chairman of the Planning and Compensation Committee. The members of the Planning and Compensation Committee and the board of directors unanimously agreed with the recommendations of Mr. Foran and the chairman of the Planning and Compensation Committee.
2010 General
As a private company, we did not use compensation consultants or benchmark against any other companies in determining the compensation of our Named Executive Officers for 2010. In addition, during 2010, in order to conserve cash, we attempted to maintain a modest level of compensation while still providing sufficient compensation to preserve and maintain our executive team. Through the process described above under “Compensation Discussion and Analysis – How We Determined Each Element of 2010 Compensation,” in December 2009, the 2010 base salaries and the 2009 bonuses were determined.
2010 Base Salary
For 2010, in light of the bonuses paid at the end of 2009 and the desire to examine our results for 2010, the base salaries for the Named Executive Officers, other than Mr. Nicklin, were not changed and were maintained as follows:
| Executive Officer |
2010 Base Salary | |||
| Joseph Wm. Foran |
$ | 240,000 | ||
| Chairman of the Board, Chief Executive Officer and President | ||||
| David E. Lancaster |
$ | 240,000 | ||
| Executive Vice President, Chief Operating Officer and Chief Financial Officer | ||||
| Matthew V. Hairford |
$ | 240,000 | ||
| Executive Vice President — Operations |
||||
| Bradley M. Robinson |
$ | 200,000 | ||
| Vice President — Reservoir Engineering |
||||
Although Mr. Nicklin is retained officially as a consultant, he serves as our Executive Director of Exploration and is included and treated as a Named Executive Officer for the purposes of this prospectus. Mr. Nicklin retired in 2000 as the Chief Geologist for ARCO and desires to maintain a measure of
137
Table of Contents
Index to Financial Statements
independence and flexibility in his schedule. Under this consulting arrangement, we are able to obtain the benefit of his experience and expertise that we would otherwise not have. For 2010, Mr. Foran determined that Mr. Nicklin’s base rate should remain at $1,500 per day. As with other Named Executive Officers, Mr. Nicklin’s base rate was not increased in 2010 due to our desire to maintain a modest level of compensation and to examine our results for 2010 prior to any further increases in his base rate being made. His 2010 compensation based on his base rate was $315,000.
2010 Stock Options
As mentioned above under “Compensation Discussion and Analysis — How We Determined Each Element of 2010 Compensation,” in February 2010, since we had not issued any stock options to the Named Executive Officers since February 2008, Mr. Foran recommended to the chairman of the Planning and Compensation Committee that stock options be granted to the Named Executive Officers in order to help maintain their focus on our long-term success. On February 22, 2010, the stock options set forth below were granted to the Named Executive Officers pursuant to the 2003 Stock and Incentive Plan (the “2003 Plan”), other than Mr. Foran, since it has been Mr. Foran’s practice since our founding to refuse to accept any stock options so that our other employees may receive more options:
| Executive Officer |
2010 Stock Options | |
| David E. Lancaster Executive Vice President, Chief Operating Officer and Chief Financial Officer |
Exercisable into 15,000 shares of Class A common stock | |
| Matthew V. Hairford Executive Vice President — Operations |
Exercisable into 10,000 shares of Class A common stock | |
| David F. Nicklin Executive Director of Exploration |
Exercisable into 10,000 shares of Class A common stock | |
| Bradley M. Robinson Vice President — Reservoir Engineering |
Exercisable into 5,000 shares of Class A common stock | |
The number of stock options awarded to each Named Executive Officer was based upon an evaluation of each Named Executive Officer’s performance and relative contributions to our growth over the previous two years, 2008 and 2009, as determined by Mr. Foran in consultation with the chairman of the Planning and Compensation Committee. The members of the Planning and Compensation Committee and the board of directors unanimously agreed with the recommendations of Mr. Foran and the chairman of the Planning and Compensation Committee.
The stock options vest 25% on each of the first four anniversaries of February 22, 2010 if the Named Executive Officer is then still employed by us or is still a consultant for us with regard to Mr. Nicklin. The exercise price of the stock options is $9.00 per share which we determined was the fair market value of our Class A common stock on February 22, 2010. The options expire on the tenth anniversary of their grant date.
2010 Cash Bonuses
In December 2010, Mr. Foran, in consultation with the chairman of the Planning and Compensation Committee, awarded a special performance bonus of $50,000 to Mr. Hairford, in recognition of Mr. Hairford’s effort to negotiate and consummate the acquisition of approximately 8,892 gross and net acres in the Eagle Ford play in Zavala County, Texas. See “Business — Other Significant Prior Events.”
138
Table of Contents
Index to Financial Statements
In addition, in December 2010, Mr. Foran evaluated the other Named Executive Officers, and, based on his knowledge of compensation levels in the oil and natural gas industry, recommended to the chairman of the Planning and Compensation Committee the appropriate 2010 bonuses for the Named Executive Officers, other than himself. The reasons we paid discretionary cash bonuses to our executive officers in 2010 are described above under “Compensation Discussion and Analysis — Elements of Our 2010 Compensation Program and Why We Pay Each Element — Discretionary Cash Bonuses.” Mr. Foran and the chairman of the Planning and Compensation Committee discussed Mr. Foran’s evaluation of the other Named Executive Officers and made any appropriate adjustments to the recommended bonuses. The amounts of the bonuses for each Named Executive Officer were based upon an evaluation of each Named Executive Officer’s performance and contributions to our growth and achievement of our performance objectives in 2010 considered in relation to all elements of the Named Executive Officer’s overall compensation. The chairman of the Planning and Compensation Committee and Mr. Foran made their joint recommendations of the bonus amount to both the Planning and Compensation Committee and the board of directors. However, Mr. Foran was not present when the chairman of the Planning and Compensation Committee made his recommendations regarding Mr. Foran’s bonus. After receiving the recommendations from Mr. Foran and the chairman of the Planning and Compensation Committee for the other Named Executive Officers and from the chairman of the Planning and Compensation Committee for Mr. Foran, the Planning and Compensation Committee and the board of directors unanimously (other than with respect to Mr. Foran on his bonus) agreed with the recommendations.
| Executive Officer |
2010 Bonus | |||
| Joseph Wm. Foran |
$ | 400,000 | ||
| Chairman of the Board, Chief Executive Officer and President | ||||
| David E. Lancaster |
$ | 100,000 | ||
| Executive Vice President, Chief Operating Officer and Chief Financial Officer | ||||
| Matthew V. Hairford |
$ | 150,000 | (1) | |
| Executive Vice President — Operations |
||||
| David F. Nicklin |
$ | 35,000 | ||
| Executive Director of Exploration |
||||
| Bradley M. Robinson |
$ | 50,000 | ||
| Vice President — Reservoir Engineering |
||||
| (1) | Includes the $50,000 special performance bonus described above. |
Benefits
We offer a variety of health and welfare programs to all eligible employees, including the executive officers other than Mr. Nicklin. The health and welfare programs are intended to protect employees against catastrophic loss and encourage a healthy lifestyle. Our health and welfare programs include medical, pharmacy, dental, disability and life insurance. We also have a 401(k) plan for all full time employees, including the executive officers, other than Mr. Nicklin, in which we contribute 3% of the employee’s base salary and have the discretion to match dollar-for-dollar up to an additional 4% of the employee’s elective deferral contributions. We generally do not offer perquisites to our executives, including our Named Executive Officers. However, we guaranteed the repayment of loans to certain of our Named Executive Officers by Comerica Bank. We intend on terminating our guaranties of such loans on or before October 1, 2011 (See “Certain Relationships and Related Party Transactions — Loan Program”).
139
Table of Contents
Index to Financial Statements
2011
Nominating, Compensation and Planning Committee
In consideration of becoming a public company, we anticipate forming a Nominating, Compensation and Planning Committee of our board of directors and adopting a charter for such committee which will provide a new process for approving compensation of the Named Executive Officers. The Nominating, Compensation and Planning Committee will have the authority at our expense to retain and terminate independent third-party compensation consultants and other expert advisors. In addition, we expect that the Nominating, Compensation and Planning Committee will confirm at least annually that our incentive pay does not encourage unnecessary risk taking and review and discuss the relationship between risk management policies and practices, corporate strategy and senior executive compensation.
With regard to all of the Named Executive Officers, we anticipate that the Nominating, Compensation and Planning Committee will recommend to the independent members of our board of directors (the “Independent Directors”):
| • | option guidelines and size of overall grants; |
| • | option grants and other equity and non-equity related awards; and |
| • | modifications or cancellations of existing grants and substitutions of new grants. |
The Independent Directors will be independent pursuant to the listing standards of the NYSE and the rules and regulations promulgated under the Exchange Act and Section 162(m) of the Internal Revenue Code of 1986, as amended (the “Code”).
We anticipate that the Nominating, Compensation and Planning Committee will annually review and make recommendations to the Independent Directors regarding the matters related to Mr. Foran’s compensation. The Nominating, Compensation and Planning Committee will annually review and recommend to the Independent Directors corporate goals and objectives applicable to Mr. Foran’s compensation. The Nominating, Compensation and Planning Committee will also evaluate Mr. Foran’s performance in light of these established goals and objectives at least annually. Based upon these evaluations, the Nominating, Compensation and Planning Committee will make recommendations to the Independent Directors regarding Mr. Foran’s annual compensation, including salary, bonus and equity and non-equity incentive compensation. We anticipate that the Nominating, Compensation and Planning Committee will review and recommend to the Independent Directors with regard to Mr. Foran:
| • | any employment agreement, severance agreement, change in control agreement or provision or separation agreement or amendment thereof; |
| • | any deferred compensation arrangement or retirement plan or benefits; and |
| • | any benefits and perquisites. |
We anticipate that on an annual basis, after consultation with Mr. Foran, the Nominating, Compensation and Planning Committee will review and make recommendations to the Independent Directors on the evaluation process and compensation structure for the other Named Executive Officers. After considering the evaluation and recommendations of Mr. Foran, we anticipate that the Nominating, Compensation and Planning Committee will evaluate the performance of the other Named Executive Officers and make recommendations to the Independent Directors regarding the annual compensation of such Named Executive Officers, including salary, bonus and equity and non-equity incentive compensation.
140
Table of Contents
Index to Financial Statements
After considering the recommendations of Mr. Foran with regard to the other Named Executive Officers, we expect the Nominating, Compensation and Planning Committee to review and recommend to the Independent Directors regarding the other executive officers:
| • | any employment agreement, severance agreement, change in control agreement or provision or separation agreement or amendment thereof; |
| • | any deferred compensation arrangement or retirement plan or benefits; and |
| • | any benefits and perquisites. |
In addition, we anticipate that pursuant to its charter, the Nominating, Compensation and Planning Committee will review and recommend to the Independent Directors any proposals for the adoption, amendment, modification or termination of our incentive compensation, equity based plans and non-equity based plans.
How We Determine Each Element of 2011 Compensation
2011 General
In consideration of becoming a public company and in connection with this offering, the Planning and Compensation Committee has engaged Pay Governance LLC as its independent executive compensation advisory firm to assist with the development and implementation of a new executive compensation program which will become effective upon the completion of this offering.
For purposes of benchmarking executive compensation, Pay Governance LLC developed a list of recommended peer companies in the oil and gas exploration and production sector. These companies were recommended to and approved by the Planning and Compensation Committee based on their annual revenues, market capitalization, enterprise value, total assets and EBITDA (earnings before interest, taxes, depletion, depreciation and amortization). The peer companies are as follows:
| Bill Barrett Corp. | Petroleum Development Corp. | |
| Breitburn Energy Partners, L.P. | Rosetta Resources, Inc. | |
| Clayton Williams Energy Inc. | Stone Energy Corp. | |
| Comstock Resources Inc. | Swift Energy Co. | |
| Contango Oil & Gas Co. | Unit Corporation | |
| Gulfport Energy Company | Venoco, Inc. | |
| Penn Virginia Corp. | W&T Offshore, Inc. |
Mr. Foran was compared against the chief executive officer position of all fourteen peer companies. Mr. Lancaster was compared against the average of the chief financial officer position and the second highest paid position based on annual cash compensation of the fourteen peer companies. Messrs. Hairford, Nicklin and Robinson were compared against the third, fourth and fifth highest paid positions based on annual cash compensation of the peer companies, respectively. However, Gulfport Energy Company did not have a fourth and fifth highest paid position and Contango Oil and Gas Co. and Venoco Inc. did not have a fifth highest paid position.
As an overall compensation philosophy, we have decided to adopt conservative pay levels as an initial strategy of being a public company. As we grow and build value for our shareholders through sustained high performance and shareholder returns, we plan to increase our overall compensation pay levels gradually toward the 50th percentile of our peer group. In developing our public company compensation program, we have adopted a strategy of focusing on the 25th percentile (lowest quartile) as a general target range for benchmarking most of our Named Executive Officer compensation. All elements of direct
141
Table of Contents
Index to Financial Statements
compensation, including base salary, annual incentive compensation and long-term incentive compensation have been targeted for most of our Named Executive Officers to provide pay opportunities in the range of the 25th percentile of our peer companies.
2011 Base Salary
Currently, except for Mr. Robinson, the base salaries for our Named Executive Officers are the same as for 2010; however, upon completion of this offering, the base salaries will be increased as described below. Mr. Robinson’s base salary was increased effective January 1, 2011 to $225,000. Mr. Foran’s base salary upon completion of this offering has been set between the 25th and 50th percentiles of base compensation levels of the peer companies. The base salaries for all other Named Executive Officers upon completion of this offering have been set in the range of the 25th percentile of the peer companies for comparable positions. The base salaries set forth below will take effect upon the completion of this offering.
| Executive Officer |
2011 Base Salary | |||
| Joseph Wm. Foran |
$ | 550,000 | ||
| Chairman of the Board, Chief Executive Officer and President | ||||
| David E. Lancaster |
$ | 340,000 | ||
| Executive Vice President, Chief Operating Officer and Chief Financial Officer | ||||
| Matthew V. Hairford |
$ | 275,000 | ||
| Executive Vice President — Operations |
||||
| David F. Nicklin |
$ | 2,000 | per day(1) | |
| Executive Director of Exploration |
||||
| Bradley M. Robinson |
$ | 225,000 | ||
| Vice President — Reservoir Engineering |
||||
| (1) | $250 of the $2,000 per day will be deferred until the end of the three year independent contractor agreement; provided Mr. Nicklin’s engagement continues until that point. Payments will actually be made to his consulting company. |
2011 Annual Incentive Compensation
Prior to the completion of this offering, we anticipate adopting an Annual Incentive Plan to be approved by shareholders. All awards made pursuant to the Annual Incentive Plan will be cash awards. Such awards will be paid to the Named Executive Officers as soon as practical following completion of the plan year and, in any case, within the first 75 days following the end of the plan year.
Each year, we anticipate that the Nominating, Compensation and Planning Committee will recommend to the Independent Directors and the Independent Directors will set annual performance criteria for the Named Executive Officers based on the possible performance criteria that are set forth in the Annual Incentive Plan. Such criteria may include financial, operational and strategic performance goals for the company, company performance measures and company performance relative to peers. We also anticipate that the Nominating, Compensation and Planning Committee will recommend to the Independent Directors and the Independent Directors will set corresponding performance payment amounts based on the achievement of such performance criteria by each Named Executive Officer.
In addition to the annual performance criteria, in order to give the Nominating, Compensation and Planning Committee and the Independent Directors flexibility, the Nominating, Compensation and Planning Committee may make recommendations to the Independent Directors and the Independent Directors may decide after completion of our fiscal year to decrease the amount of the payments relating to the
142
Table of Contents
Index to Financial Statements
corresponding performance criteria or to grant additional awards to the Named Executive Officers. Any additional awards may be in response to unforeseen circumstances when the performance criteria were set. Any such additional awards may or may not be based on the list of performance criteria set forth in the Annual Incentive Plan and may be made irrespective of whether any payments are made regarding the performance criteria.
For 2011, we plan to utilize performance criteria such as production volumes, oil and natural gas reserves added, EBITDA, finding costs and lease operating expenses as well as environmental compliance measures and safety and accident rates. Prior to the closing of this offering, we anticipate that the Nominating, Compensation and Planning Committee will recommend to the Independent Directors and the Independent Directors will determine the threshold, target and maximum performance measures for the performance criteria set forth above, the weighting of such criteria in comparison to the other performance criteria and the corresponding annual incentive opportunity expressed as a percentage of base salary for each Named Executive Officer for the threshold, target and maximum performance criteria levels. In future years, we may add more quantitative performance criteria to the measurement in order to better measure Named Executive Officer contributions to our performance.
The threshold opportunity will be aligned with the performance goals established for each Named Executive Officer, such that meeting the threshold level of all performance criteria may result in the Named Executive Officer earning his threshold annual incentive opportunity set forth under the performance criteria. The target opportunity will be aligned with the performance goals established for each Named Executive Officer, such that meeting the target level for all of the performance criteria may result in the Named Executive Officer earning his target annual incentive opportunity set forth under the performance criteria. The maximum opportunity will be aligned with the performance goals established for each Named Executive Officer, such that meeting the maximum level of all performance criteria may result in the Named Executive Officer earning his maximum annual incentive opportunity set forth under the performance criteria. The table which follows sets forth the anticipated threshold, target and maximum incentive opportunities for the Named Executive Officers for 2011 based on the performance criteria.
| Participant |
Threshold Annual Incentive Opportunity as % of 2011 Base Salary(1) |
Target Annual Incentive Opportunity as % of 2011 Base Salary(1) |
Maximum Annual Incentive Opportunity as % of 2011 Base Salary(1) |
|||||||||
| Joseph Wm. Foran |
37.5 | % | 75 | % | 150 | % | ||||||
| Chairman of the Board, Chief Executive Officer and President | ||||||||||||
| David E. Lancaster |
32.5 | % | 65 | % | 130 | % | ||||||
| Executive Vice President, Chief Operating Officer and Chief Financial Officer | ||||||||||||
| Matthew V. Hairford |
32.5 | % | 65 | % | 130 | % | ||||||
| Executive Vice President — Operations |
||||||||||||
| David F. Nicklin |
25 | % | 50 | %(2) | 100 | % | ||||||
| Executive Director of Exploration |
||||||||||||
| Bradley M. Robinson |
25 | % | 50 | % | 100 | % | ||||||
| Vice President — Reservoir Engineering |
||||||||||||
| (1) | Based on 2011 base salary upon completion of this offering. |
| (2) | The target annual incentive opportunity, expressed in dollars, assumes that Mr. Nicklin works 210 days per year at the rate of $2,000 per day. Payments will actually be made to his consulting company. |
143
Table of Contents
Index to Financial Statements
Mr. Foran’s target annual incentive opportunity set forth under the performance criteria has been set between the 25th and 50th percentiles of annual incentive compensation levels of the peer companies. The target annual incentive opportunities for all other Named Executive Officers have been set in the range of the 25th percentile of the peer companies for comparable positions.
In early 2012, with regard to each Named Executive Officer, after taking into account the performance criteria and all other information with regard to such Named Executive Officer, the Nominating, Compensation and Planning Committee may recommend to the Independent Directors that any Named Executive Officer be paid an annual award and the Independent Directors will determine the annual award to be paid to such Named Executive Officer, if any. The amount of such annual award may be greater than or less than the payment opportunity based on the performance criteria so long as the annual award does not exceed 200% of the applicable Named Executive Officer’s annual base salary.
Pursuant to the terms of Mr. Nicklin’s independent contractor agreement, if the board of directors determines that he has fulfilled his duties in a reasonably satisfactory manner, his consulting company will be paid a bonus of at least $50,000 for 2011. Any amounts Mr. Nicklin’s consulting company is to be paid for 2011 as a result of the performance criteria will be reduced by the amount of the bonus paid to such consulting company pursuant to the independent contractor agreement. The maximum bonus for 2011, including pursuant to the independent contractor agreement, will be 100% of the 2011 base salary based on Mr. Nicklin working 210 days per year at a rate of $2,000 per day.
Long-Term Incentive Plan
Prior to the completion of this offering, we anticipate adopting the 2011 Long-Term Incentive Plan to be approved by shareholders. This plan will permit the granting of long-term equity and cash incentive awards, including the following:
| • | stock options; |
| • | stock appreciation rights; |
| • | restricted stock (time-lapse and performance-based); |
| • | restricted stock units (both time-lapse and performance-based); |
| • | performance shares; |
| • | performance units; |
| • | stock grants; and |
| • | performance cash awards. |
We anticipate the plan will have • shares of common stock or share equivalents reserved for issuance. The plan will cover grants to the Named Executive Officers, key employees, consultants and non-employee directors.
After receiving recommendations from the Nominating, Compensation and Planning Committee, the plan will be administered by the Independent Directors, who will authorize and approve grants, including the size and terms of such grants such as vesting and the lapsing of restrictions. For 2011, we anticipate that the Named Executive Officers will receive non-qualified stock options, performance shares and time-lapsed restricted shares with each type of grant for each Named Executive Officer having a present value equal to one-third of the value of all long-term incentive compensation awarded during 2011 to such Named Executive Officer. Mr. Nicklin’s grants will be made to his consulting company.
144
Table of Contents
Index to Financial Statements
We anticipate that Mr. Foran’s target long-term incentive opportunity will be set between the 25th and 50th percentiles of long-term incentive compensation levels of the peer companies. We anticipate that the target long-term incentive opportunities for all other Named Executive Officers will be set in the range of the 25th percentile of the peer companies for comparable positions.
The stock options will be granted at 100% of fair market value of our common stock on the date of grant and will vest equally on the first four anniversaries of the grant date if the Named Executive Officer is still employed by us on such dates. We anticipate that the performance shares will be subject to a three-year performance period following the date of grant, and the number of performance shares earned by each participant may range from 0% to 200% of the shares granted subject to performance criteria if the Named Executive Officer is still employed by us at the end of the three-year performance period or an independent contractor with us with regard to Mr. Nicklin. We expect the performance criteria will be our total shareholder return relative to the peer companies set forth above as measured by the increase in share price over the three-year performance period plus the value of dividends (reinvested in an equivalent value of shares at the end of the month if and when any dividends are declared). We believe if our total shareholder return is equal to the 50th percentile of the total shareholder return of the peer companies, then the Named Executive Officer will earn 100% of the shares granted. We believe if our total shareholder return is equal to the 75th percentile of the peer companies, the Named Executive Officer will earn 150% of the performance shares granted. We believe if our total shareholder return is equal to 90% or greater of the peer companies, the Named Executive Officer will receive 200% of the performance shares granted. We believe if our total shareholder return is below the 35th percentile of the peer companies, the Named Executive Officer will not earn any of the performance shares granted. We expect the number of shares earned between the 35th percentile and the 50th percentile, the 50th percentile and the 75th percentile and the 75th percentile and the 90th percentile will be on a straight line interpolation basis. We anticipate the restrictions on the time-lapsed restricted shares will lapse equally on the first three anniversaries of the grant date if the Named Executive Officer is still employed with us on such dates. During the restricted period, the Named Executive Officer will be eligible to receive dividends on and vote the restricted shares.
How Elements of Our Compensation Program Are Related to Each Other
We view the various components of compensation as related but distinct with generally a significant portion of total compensation reflecting “pay for performance.” We do not have any formal or informal policies or guidelines for allocating compensation between long-term and currently paid out compensation or between cash or non-cash compensation.
Accounting and Tax Considerations
Under Section 162(m) of the Code, a limitation is placed on tax deductions of any publicly-held corporation for individual compensation to certain executives of such corporation exceeding $1.0 million in any taxable year, unless the compensation is performance based. Since we have not been a publicly-held company, Section 162(m) has not applied to us, and there is an exception to this deductibility limitation for a specified period of time in the case of companies such as us that become publicly-held.
Termination of Employment Arrangements and Independent Contractor Agreement
Employment Agreements and Independent Contractor Agreement
For 2010 and until August 8, 2011, all of the Named Executive Officers other than Messrs. Foran and Nicklin were parties to employment agreements which provided for “at will” employment with either party
145
Table of Contents
Index to Financial Statements
being required to provide two weeks advanced notice of termination of employment. These employment agreements did not provide for any additional payments upon termination by either party, even after a change in control, other than accrued and unused vacation. For 2010 and until August 8, 2011, Mr. Nicklin was party to an independent contractor agreement which provided for either party being required to provide fifteen days advance notice of termination. This consulting agreement did not provide for any additional payments upon termination by either party, even after a change in control, other than for services performed prior to the date of termination.
As described under “Discussion Regarding Summary Compensation Table and Grants of Plan-Based Awards Table,” in contemplation of this offering, on August 9, 2011, we entered into employment agreements with Messrs. Foran, Lancaster, Hairford and Robinson and an independent contractor agreement with Mr. Nicklin and his consulting company.
Under the employment agreements, if one of the following occurs:
| • | the Named Executive Officer dies; |
| • | the Named Executive Officer is totally disabled; |
| • | we mutually agree to end the employment agreement; |
| • | we dissolve and liquidate; or |
| • | the term of the employment agreement ends, |
we will pay the Named Executive Officer the average of his annual bonus for the prior two years pro-rated based on the number of complete or partial months completed during the year of termination.
Also, under the employment agreements, if one of the following occurs:
| • | the Named Executive Officer is terminated (i) by us for a reason other than (a) as set forth above or (b) for just cause, or (ii) in connection with a “change in control” as described below; or |
| • | the Named Executive Officer terminates his employment for “good reason,” |
if the Named Executive Officer is Mr. Foran, we will pay him twice his base salary and twice the average of his annual bonus for the prior two years; if the Named Executive Officer is Messrs. Lancaster or Hairford, we will pay him 1.5 times his base salary and 1.5 times the average of his annual bonus for the prior two years; and if the Named Executive Officer is Mr. Robinson, we will pay him one year of base salary and the average of his annual bonus for the prior two years.
Finally, under the employment agreements, upon a “change in control” and within 30 days prior to the “change in control” or within 12 months after the “change in control,” if we terminate a Named Executive Officer without just cause or the Named Executive Officer terminates his employment with or without “good reason,” if the Named Executive Officer is Messrs. Foran, Lancaster or Hairford, we will pay him three times his base salary and three times the average of his annual bonus for the prior two years; and if the Named Executive Officer is Mr. Robinson, we will pay him twice his base salary and twice the average of his annual bonus for the prior two years.
“Change in control” is defined under Section 409A of the Code as follows:
| • | A change in ownership of the company occurs on the date that, except in certain situations, results in someone acquiring more than 50% of the total fair market value or voting power of the company’s stock; |
146
Table of Contents
Index to Financial Statements
| • | A change in effective control of the company occurs on one of the following dates: |
| • | The date that a person acquires (or has acquired in a 12 month period) ownership of 30% or more of the company’s total voting power; however, if a person already owns at least 30% of the company’s total voting power, the acquisition of additional control does not constitute a change in control; or |
| • | The date during a 12 month period where a majority of the company’s board of directors is replaced by directors whose appointment or election was not endorsed by a majority of the board of directors; and |
| • | A change in the ownership of a substantial portion of the company’s assets occurs on the date a person acquires (or has acquired in a 12 month period) assets of the company having a total gross market value of at least 40% of the total gross fair market value of all of the company’s assets immediately before such acquisition. |
For purposes of the employment agreements, “good reason” means:
| • | The assignment of duties inconsistent with the title of the Named Executive Officer or his current office or a material diminution of the Named Executive Officer’s current authority, duties or responsibilities; |
| • | A diminution of the Named Executive Officer’s base salary or a material breach of the employment agreement; or |
| • | The relocation of the company’s principal executive offices more than 30 miles from the company’s present principal executive offices or the transfer of the Named Executive Officer to a place other than the company’s principal executive offices; and |
| • | The action causing the “good reason” is not cured within the applicable cure period. |
For purposes of the employment agreements, “just cause” means:
| • | The Named Executive Officer’s continued and material failure to perform the duties of his employment consistent with his position other than due to disability; |
| • | The Named Executive Officer’s failure to perform his material obligations under the employment agreement other than due to disability; |
| • | The Named Executive Officer’s material breach of the company’s written policies concerning discrimination, harassment or securities trading; |
| • | The Named Executive Officer’s refusal or failure to follow lawful directives of the board of directors and any supervisors other than due to disability; |
| • | The Named Executive Officer’s commission of fraud, theft or embezzlement; |
| • | The Named Executive Officer’s conviction or indictment of a felony or other crime involving moral turpitude; or |
| • | The Named Executive Officer’s intentional breach of fiduciary duty; and |
| • | The action causing the “just cause” is not cured within the applicable cure period. |
Under Mr. Nicklin’s independent contractor agreement, if one of the following occurs:
| • | he dies; |
147
Table of Contents
Index to Financial Statements
| • | he is totally disabled; |
| • | we mutually agree to end the independent contractor agreement; |
| • | we dissolve and liquidate; or |
| • | the term of the independent contractor agreement ends, |
we must pay his consulting company (i) the average of the annual bonus paid to the consulting company for the prior two years pro-rated based on the number of complete or partial months completed during the year of termination and (ii) all accrued and vested compensation under our incentive plans. In addition, if Mr. Nicklin dies or is totally disabled during the three year term of the independent contractor agreement, his consulting company will be paid $250 per day that Mr. Nicklin consulted for us during the term of the independent contractor agreement.
Also, under the independent contractor agreement, if one of the following occurs:
| • | the independent contractor agreement is terminated by us for a reason other than as set forth above or in connection with a “change in control” as described below; or |
| • | he terminates the independent contractor agreement for “good reason” (as described in connection with the employment agreements set forth above), |
we must pay an amount equal to $1,000 per full business day for the lesser of (i) the time Mr. Nicklin consulted for us during the prior twelve months of the term of the independent contractor agreement or (ii) the time between August 9, 2011 and the date the independent contractor agreement was terminated plus accrued and vested compensation under our equity plans.
Finally, under the independent contractor agreement, upon a “change in control” (as described in connection with the employment agreements set forth above) and within 30 days prior to the “change in control” or within 12 months after the “change in control,” if we terminate Mr. Nicklin without “just cause” (as described in connection with the employment agreements set forth above) or Mr. Nicklin terminates his independent contractor agreement with or without “good reason,” we will pay an amount equal to two times the aggregate amount paid based on the daily rate during the prior twelve months plus accrued and vested compensation under our equity plans.
Equity Plans
The 2003 Plan provides that all awards automatically vest upon a “change in control.”
See the definition of “change in control” under “— Potential Payments upon Termination or Change in Control.”
The “change in control” provisions in the employment agreements, the independent contractor agreement and the 2003 Plan help prevent management from being distracted by rumored or actual changes in control. The “change in control” provisions provide:
| • | incentives for the Named Executive Officers to remain with us despite the uncertainties of a potential or actual change in control; |
| • | assurance of severance payments for terminated Named Executive Officers; and |
| • | access to equity compensation after a change in control. |
148
Table of Contents
Index to Financial Statements
We believe a single trigger is appropriate for the following reasons:
| • | to be competitive with what we believe to be the standards for payments upon a “change in control”; |
| • | with regard to equity, employees or independent contractors who remain after a “change in control” are treated the same as the general shareholders who could sell or otherwise transfer their equity upon a “change in control”; and |
| • | since we would not exist in our present form after a “change in control,” Named Executive Officers should not have to have their compensation dependent on the new company. |
Stock Ownership Guidelines
We anticipate adopting stock ownership guidelines prior to the completion of this offering for our executive officers. We anticipate that the stock ownership guidelines will include the following executive officers and amounts:
| • | Chairman, President and Chief Executive Officer — shares equal to five times base salary; |
| • | Executive Vice Presidents — shares equal to two and 1/2 times base salary; and |
| • | Vice Presidents and Executive Directors — shares equal to one and 1/2 times base salary. |
We expect each executive officer will have five years from the date of the closing of this offering in which to achieve the stock ownership position. Shares which will count toward the stock ownership guidelines include time-lapse restricted shares that are still restricted and any shares held in trust by the executive officer or his immediate family over which he has direct beneficial ownership interest. Shares which will not count toward the stock ownership guidelines include shares underlying unexercised stock options, unexercised stock appreciation rights and performance-based awards for which the performance requirements have not been satisfied.
Summary Compensation Table
The following table summarizes the total compensation awarded to, earned by or paid to Messrs. Foran, Lancaster, Hairford, Nicklin and Robinson. This table and the accompanying narrative should be read in conjunction with the Compensation Discussion and Analysis, which sets forth the objectives and other information regarding our executive compensation program.
| Name and Principal Position |
Year | Salary ($) |
Bonus ($) |
Option Awards(1) ($) |
All Other Compensation ($) |
Total ($) |
||||||||||||||||||
| Joseph Wm. Foran |
2010 | $ | 240,000 | $ | 400,000 | – | $ | 17,994 | (2) | $ | 657,994 | |||||||||||||
| Chairman of the Board, Chief Executive Officer and President | ||||||||||||||||||||||||
| David E. Lancaster |
2010 | $ | 240,000 | $ | 100,000 | $ | 46,781 | $ | 17,150 | (3) | $ | 403,931 | ||||||||||||
| Executive Vice President, Chief Operating Officer and Chief Financial Officer | ||||||||||||||||||||||||
| Matthew V. Hairford |
2010 | $ | 240,000 | $ | 150,000 | $ | 31,187 | $ | 17,150 | (3) | $ | 438,337 | ||||||||||||
| Executive Vice President — Operations |
||||||||||||||||||||||||
| David F. Nicklin |
2010 | $ | 315,000 | (4) | $ | 35,000 | $ | 32,556 | – | $ | 382,556 | |||||||||||||
| Executive Director of Exploration |
||||||||||||||||||||||||
| Bradley M. Robinson |
2010 | $ | 200,000 | $ | 50,000 | $ | 15,594 | $ | 17,150 | (3) | $ | 282,744 | ||||||||||||
| Vice President — Reservoir Engineering |
||||||||||||||||||||||||
| (1) | Option awards are the grant date fair values computed in accordance with FASB ASC Topic 718. Our policy and assumptions made in the valuation of the stock options are contained in Note 2 and Note 8 of the audited financial statements for the year ended December 31, 2010. |
149
Table of Contents
Index to Financial Statements
| (2) | Consists of $17,150 in 401(k) matching contributions as described in “– Benefits” and $844 in premiums reimbursed to Mr. Foran for a disability policy covering Mr. Foran. |
| (3) | Consists of $17,150 in 401(k) matching contributions as described in “– Benefits.” |
| (4) | Based on the aggregate amount of payments made to Mr. Nicklin as determined by his base rate under his consulting agreement. |
Grants of Plan-Based Awards During 2010
Shown in the table below are the stock option grants to acquire common stock made during 2010 to our Named Executive Officers under the 2003 Plan.
| Name |
Grant Date |
Number of Securities Underlying Options (#)(1) |
Exercise or Base Price of Option Awards ($/Sh) |
Grant Date Fair Value of Option Awards ($)(2) |
||||||||||||
| Joseph Wm. Foran |
– | – | – | – | ||||||||||||
| David E. Lancaster |
2/22/10 | 15,000 | 9.00 | 46,781 | ||||||||||||
| Matthew V. Hairford |
2/22/10 | 10,000 | 9.00 | 31,187 | ||||||||||||
| David F. Nicklin |
2/22/10 | 10,000 | 9.00 | 32,556 | ||||||||||||
| Bradley M. Robinson |
2/22/10 | 5,000 | 9.00 | 15,594 | ||||||||||||
| (1) | The options vest in four equal installments on each of the first, second, third and fourth anniversary of the grant date if the Named Executive Officer is employed by the company at such dates. |
| (2) | Computed in accordance with FASB ASC Topic 718. Our policy and assumptions made in the valuation of the stock options are contained in Note 2 and Note 8 of the audited financial statements for the year ended December 31, 2010. |
Discussion Regarding Summary Compensation Table and Grants of Plan-Based Awards Table
For 2010 and until August 8, 2011, all of our Named Executive Officers, other than Messrs. Foran and Nicklin, were parties to employment agreements with the company that were similar in terms with the exception of certain benefits such as salaries. Under these agreements, the employment was “at will.” Either party could terminate the employee’s employment with or without cause at any time upon the giving of two weeks notice. There were no guaranteed payments of any kind for any of our Named Executive Officers, including Mr. Foran, in the event of a change of control. These agreements required the employee to maintain the confidentiality of our trade secrets, technical data, customer lists, training manuals, financial reports and other confidential information and knowledge regarding our business. The employee was required to deliver any property in his possession or control that is our property upon termination of employment.
For 2010 and until August 8, 2011, Mr. Nicklin was party to a consulting agreement with the company. Under this consulting agreement, Mr. Nicklin’s services were subject to termination upon the giving of 15 days notice by either party. There were no guaranteed payments of any kind to Mr. Nicklin, other than reimbursement for services rendered and associated expenses through the date of termination. This agreement required Mr. Nicklin to maintain the confidentiality of our trade secrets, technical data, customer lists, training manuals, financial reports and other confidential information and knowledge regarding our business. Mr. Nicklin was required to deliver any property in his possession or control that is our property upon termination of his consulting agreement.
On August 9, 2011, we entered into employment agreements with Messrs. Foran, Lancaster, Hairford and Robinson and an independent contractor agreement with Mr. Nicklin.
150
Table of Contents
Index to Financial Statements
Mr. Foran. His employment agreement is for a twenty-four month term and such term automatically extends each month by one additional month unless either the company or Mr. Foran gives written notice that the term will no longer be extended. The base salary is $550,000, and he is eligible to participate in our annual incentive plan and our long-term incentive plan. The base salary becomes effective upon the completion of this offering. See “Compensation Discussion and Analysis — Termination of Employment Arrangements and Independent Contractor Agreement — Employment Agreements and Independent Contractor Agreement” regarding the payments to be made to Mr. Foran upon termination of his employment and/or a “change in control.”
Mr. Lancaster. His employment agreement is for an eighteen month term and such term automatically extends each month by one additional month unless either the company or Mr. Lancaster gives written notice that the term will no longer be extended. The base salary is $340,000, and he is eligible to participate in our annual incentive plan and our long-term incentive plan. The base salary becomes effective upon the completion of this offering. See “Compensation Discussion and Analysis — Termination of Employment Arrangements and Independent Contractor Agreement — Employment Agreements and Independent Contractor Agreement” regarding the payments to be made to Mr. Lancaster upon termination of his employment and/or a “change in control.”
Mr. Hairford. His employment agreement is for an eighteen month term and such term automatically extends each month by one additional month unless either the company or Mr. Hairford gives written notice that the term will no longer be extended. The base salary is $275,000, and he is eligible to participate in our annual incentive plan and our long-term incentive plan. The base salary becomes effective upon the completion of this offering. See “Compensation Discussion and Analysis — Termination of Employment Arrangements and Independent Contractor Agreement — Employment Agreements and Independent Contractor Agreement” regarding the payments to be made to Mr. Hairford upon termination of his employment and/or a “change in control.”
Mr. Robinson. His employment agreement is for a twelve month term and such term automatically extends each month by one additional month unless either the company or Mr. Robinson gives written notice that the term will no longer be extended. The base salary is $225,000, and he is eligible to participate in our annual incentive plan and our long-term incentive plan. See “Compensation Discussion and Analysis — Termination of Employment Arrangements and Independent Contractor Agreement — Employment Agreements and Independent Contractor Agreement” regarding the payments to be made to Mr. Robinson upon termination of his employment and/or a “change in control.”
Mr. Nicklin. His independent contractor agreement is for a thirty-six month term. The daily rate is $1,750 per day that Mr. Nicklin consults for us, and if the independent contractor agreement remains in effect until the end of the thirty-six month term, we will pay an additional $250 per day that Mr. Nicklin consulted for us during the thirty-six months. Mr. Nicklin, through his consulting company, is eligible to participate in our annual incentive plan and our long-term incentive plan. Also, for 2011, if the board of directors determines that Mr. Nicklin has fulfilled his duties in a reasonably satisfactory manner, his consulting company will be paid a bonus of at least $50,000. Any amounts Mr. Nicklin’s consulting company is to be paid for 2011 as a result of the performance criteria under the annual incentive plan will be reduced by the amount of the bonus paid to such consulting company pursuant to the independent contractor agreement. The daily rate becomes effective upon the completion of this offering. See “Compensation Discussion and Analysis — Termination of Employment Arrangements and Independent Contractor Agreement — Employment Agreements and Independent Contractor Agreement” regarding the payments to be made to Mr. Nicklin’s consulting company upon termination of the independent contractor agreement and/or a “change in control.”
151
Table of Contents
Index to Financial Statements
See “Compensation Discussion and Analysis — Termination of Employment Arrangements and Independent Contractor Agreement” regarding the terms of the employment agreement regarding termination of Mr. Foran’s employment and the amounts that are due to be paid to him.
Stock Options. See “Compensation Discussion and Analysis — How We Determined Each Element of 2010 Compensation — Stock Options” regarding the stock options that we granted to the Named Executive Officers in 2010, the vesting requirements and the rationale for such grants.
Bonuses. See “Compensation Discussion and Analysis — How We Determined Each Element of 2010 Compensation — Cash Bonuses” regarding the cash bonuses that we paid to the Named Executive Officers in 2010 and the rationale for such payments.
General. Base salary paid and the amount of cash bonuses paid represented from 84.2% to 97.3% of the Named Executive Officers’ total compensation as represented in the Summary Compensation Table with the percentages being as follows: Mr. Foran — 97.3%; Mr. Lancaster — 84.2%; Mr. Hairford — 89.0%; Mr. Nicklin — 91.5%; and Mr. Robinson — 88.4%.
Outstanding Equity Awards at December 31, 2010
The following table summarizes the total outstanding equity awards at December 31, 2010 for each Named Executive Officer:
| Option Awards | ||||||||||||||||
| Number of Underlying Stock (#) |
Number of Underlying Unexercised Options (#) |
Option Price |
Option Expiration |
|||||||||||||
| Name |
Exercisable | Unexercisable | ($) | Date | ||||||||||||
| Joseph W. Foran |
– | – | – | – | ||||||||||||
| David E. Lancaster |
45,000 | 15,000 | $ | 9.00 | 2/7/12 | |||||||||||
| 37,500 | 37,500 | $ | 10.00 | 2/12/13 | ||||||||||||
| – | 15,000 | $ | 9.00 | 2/21/20 | ||||||||||||
| Matthew V. Hairford |
30,000 | – | $ | 9.00 | 7/2/11 | |||||||||||
| 22,500 | 7,500 | $ | 9.00 | 2/7/12 | ||||||||||||
| 45,000 | 45,000 | $ | 10.00 | 2/12/13 | ||||||||||||
| – | 10,000 | $ | 9.00 | 2/21/20 | ||||||||||||
| David F. Nicklin |
15,000 | – | $ | 10.00 | 2/12/13 | |||||||||||
| – | 10,000 | $ | 9.00 | 2/21/20 | ||||||||||||
| Bradley M. Robinson |
11,250 | 3,750 | $ | 9.00 | 2/7/12 | |||||||||||
| 15,000 | 15,000 | $ | 10.00 | 2/12/13 | ||||||||||||
| – | 5,000 | $ | 9.00 | 2/21/20 | ||||||||||||
The following table provides the vesting dates at December 31, 2010 for unvested stock options:
| Vesting Date |
Joseph Wm. Foran |
David E. Lancaster |
Matthew V. Hairford |
David F. Nicklin |
Bradley M. Robinson |
|||||||||||||||
| 2/8/11 |
– | 15,000 | 7,500 | – | 3,750 | |||||||||||||||
| 2/13/11 |
– | 18,750 | 22,500 | – | 7,500 | |||||||||||||||
| 2/22/11 |
– | 3,750 | 2,500 | 2,500 | 1,250 | |||||||||||||||
| 2/13/12 |
– | 18,750 | 22,500 | – | 7,500 | |||||||||||||||
| 2/22/12 |
– | 3,750 | 2,500 | 2,500 | 1,250 | |||||||||||||||
| 2/22/13 |
– | 3,750 | 2,500 | 2,500 | 1,250 | |||||||||||||||
| 2/22/14 |
– | 3,750 | 2,500 | 2,500 | 1,250 | |||||||||||||||
|
|
|
|
|
|
|
|
|
|||||||||||||
| Total Unvested Stock Options |
– | 67,500 | 62,500 | 10,000 | 23,750 | |||||||||||||||
152
Table of Contents
Index to Financial Statements
Option Exercises and Stock Vested During 2010
The following table summarizes, for the Named Executive Officers in 2010, the number of shares acquired upon exercise of stock options and the value realized, each before payout of any applicable withholding tax:
| Option Awards | ||||||||||||
| Name |
Number of Shares Acquired on Exercise (#) |
Value Realized on Exercise ($)(1) |
Date of Exercise |
|||||||||
| Joseph Wm. Foran |
– | – | – | |||||||||
| David E. Lancaster |
30,000 | 120,000 | 6/23/10 | |||||||||
| 19,296 | 115,776 | 11/15/10 | ||||||||||
| Matthew V. Hairford |
30,000 | 120,000 | 6/23/10 | |||||||||
| 20,000 | 120,000 | 11/15/10 | ||||||||||
| David F. Nicklin |
– | – | – | |||||||||
| Bradley M. Robinson |
24,488 | 146,928 | 11/15/10 | |||||||||
| (1) | Determined based on the difference between the exercise price of the stock options and the fair market value of our Class A common stock on the date of exercise which was $9.00 per share on June 23, 2010 and $11.00 per share on November 15, 2010. |
Potential Payments Upon Termination or Change-in-Control
Under the 2003 Plan, all awards vest upon a change in control. Assuming there was a change in control on December 31, 2010, the Named Executive Officers would have received the following amounts in automatic vesting of stock options based on a fair market value of $11.00 on December 31, 2010: Mr. Foran — $0; Mr. Lancaster — $97,500; Mr. Hairford — $80,000; Mr. Nicklin — $20,000; and Mr. Robinson — $32,500. A “change in control” occurs upon any of the following events:
| • | any person (or group of persons acting in concert), other than the company or an affiliate, becomes the beneficial owner, directly or indirectly, of voting securities representing 30% or more of the voting power of our then outstanding voting securities (with the threshold percentage being increased, not to exceed 50% for the beneficial owners of our voting securities for whom Wellington Management Company, L.P. serves as an investment advisor if those owners are deemed to be a “group” for this purpose); |
| • | our board of directors ceases to consist of a majority of continuing directors; where “continuing director” means a member of the board who was either (i) a member of the board at October 31, 2008 or (ii) nominated, appointed or approved, following nomination by our shareholders, to serve as a director by a majority of the then continuing directors; |
| • | our shareholders approve (i) any consolidation or merger with us or any subsidiary that results in the shareholders immediately prior to the consolidation or merger holding less than a majority ownership interest in the outstanding voting securities of the surviving entity, (ii) any sale, lease, exchange or other transfer of all or substantially all of our assets or (iii) any plan or proposal for our liquidation or dissolution; or |
| • | our shareholders accept a share exchange in which our shareholders immediately before such share exchange do not hold, immediately following such share exchange, the total voting securities of the surviving entity in substantially the same proportion as held before the share exchange. |
Under the employment agreements that were in effect on December 31, 2010 for Messrs. Lancaster, Hairford and Robinson, either party was required to give two weeks advance notice of termination. If
153
Table of Contents
Index to Financial Statements
Messrs. Lancaster, Hairford and Robinson terminated their employment or were terminated on December 31, 2010 and we waived the two weeks advance notice requirement, Mr. Lancaster would have received $9,231 as two weeks pay and $0 for accrued and unused vacation; Mr. Hairford would have received $9,231 as two weeks pay and $0 for accrued and unused vacation; and Mr. Robinson would have received $7,692 as two weeks pay and $0 for accrued and unused vacation. Mr. Nicklin would have received $0 upon termination.
Mr. Foran was not party to an employment agreement at December 31, 2010 and would not have received any additional compensation if he terminated his employment or if we terminated his employment for any reason on December 31, 2010.
2010 Director Compensation
| Name |
Fees Earned or Paid in Cash |
Stock Awards(1)(2) | All Other |
Total | ||||||||||
| $ | $ | $ | $ | |||||||||||
| Stephen A. Holditch |
15,000 | 16,750 | – | 31,750 | ||||||||||
| David M. Laney |
15,000 | 18,000 | – | 33,000 | ||||||||||
| Stephen W. Ohnimus |
15,000 | 19,000 | – | 34,000 | ||||||||||
| Daralyn B. Peifer(3) |
6,250 | 6,750 | – | 13,000 | ||||||||||
| Michael C. Ryan |
15,000 | 21,750 | – | 36,750 | ||||||||||
| Edward R. Scott, Jr.(4) |
15,000 | 24,000 | – | 39,000 | ||||||||||
| (1) | Based on the fair market value of the stock awards on the date of grant. |
| (2) | The following directors own the following number of fully vested options to purchase common stock at December 31, 2010: Stephen A. Holditch (16,500), David M. Laney (10,500), Stephen W. Ohnimus (21,000) and Michael C. Ryan (13,500). |
| (3) | Retired from board of directors on May 27, 2010. |
| (4) | Retired from board of directors on June 6, 2011. |
Currently, each non-employee director is paid $1,250 each month in cash for a total annual stipend of $15,000. In addition, each non-employee director is granted 250 shares of Class A common stock for each day of attendance at each board meeting or committee meeting, other than telephonic meetings. In addition, we reimburse our directors for travel, lodging and related expenses incurred in attending board and committee meetings. Non-employee directors do not receive any other remuneration for their service as directors. Some directors have performed consulting services for the company and have received grants of stock options or shares as remuneration for these services.
In anticipation of this offering, we plan on targeting our non-employee directors’ compensation at the 25th percentile of the peer companies used for benchmarking the non-employee directors’ compensation. We anticipate the new compensation program will be as follows:
| • | Annual cash retainer of $35,000; |
| • | Cash meeting fee of $1,000 per day for each day of board and committee service; |
| • | The chairs of the Audit Committee and Operations Committee will each receive an additional cash retainer of $10,000 annually; and |
| • | Each non-employee director will receive on a quarterly basis restricted stock units (“RSUs”) equal to up to $15,000 in value with the restrictions lapsing in one-third increments on each of the first, second and third anniversaries of the date of grant. Each grant may be adjusted downward (but not upward) in value proportionate to the non-employee director’s attendance at any board or committee meetings called during the quarterly period for which RSUs are due. |
154
Table of Contents
Index to Financial Statements
Each non-employee director may elect to defer his RSUs until the director is no longer on the board due to normal retirement, resignation, death, disability, failure to be re-nominated to the board or failure to be re-elected by shareholders to the board. When the restrictions lapse, each RSU will give the director a share of common stock.
Upon the completion of this offering, we anticipate that the non-employee directors will follow our voluntary stock ownership guidelines for non-employee directors. Within three years of becoming a director, each non-employee director will be expected to own $250,000 of the company’s common stock and continue to hold such shares while serving as a director. All directors presently meet this standard. Shares which will count toward the stock ownership guidelines include time-lapse restricted shares or RSUs that are still restricted and any shares held in trust by the director or his immediate family over which he has direct beneficial ownership interest. Shares which will not count toward the stock ownership guidelines include shares underlying unexercised stock options and unexercised stock appreciation rights.
Special Board Advisor Compensation
Each special board advisor is paid $1,250 each month in cash for a total annual stipend of $15,000. In addition, each special board advisor is granted 250 shares of Class A common stock for each day of attendance at each board meeting or committee meeting, other than telephonic meetings. In addition, we reimburse our special board advisors for travel, lodging and related expenses incurred in attending board and committee meetings. Special board advisors do not receive any other remuneration for their service as special board advisors. Upon the completion of this offering, we anticipate that the compensation of the special board advisors will remain at its current levels, except for Mr. Downey, whose compensation will be identical to that then in effect for the non-employee directors.
155
Table of Contents
Index to Financial Statements
CERTAIN RELATIONSHIPS AND RELATED PARTY TRANSACTIONS
Since January 1, 2008, there has not been, nor is there currently proposed, any transaction or series of similar transactions to which we were or are a party in which the amount involved exceeded or exceeds $120,000 and in which any of our directors, executive officers, holders of more than 5% of any class of our voting securities or any member of the immediate family of any of the foregoing persons, had or will have a direct or indirect material interest, other than compensation arrangements with directors and executive officers, which are described in “Compensation of Named Executive Officers,” and the transactions described or referred to below.
Loan Program
We guaranteed the repayment of loans to certain of our executive officers by Comerica Bank, N.A. The purpose of these loans was to assist our executive officers in buying shares of our common stock pursuant to the exercise of stock options. We guaranteed the repayment of loans and made deposits of funds in certificates of deposit to secure our guaranties for the following executive officers:
| Executive Officer and Date of Loan or Renewal |
Loan Amount | Interest Rate | Interest Paid or Payable in 2010 |
Maturity Date | ||||||||||
| Matthew V. Hairford; December 29, 2009; renewed July 9, 2010 |
$ | 310,000 | 5.25 | % | $ | 12,198 | October 8, 2011 | |||||||
| David E. Lancaster; April 30, 2009; renewed May 30, 2011 |
$ | 470,000 | 5.25 | % | $ | 20,619 | May 29, 2012 | |||||||
| Bradley M. Robinson; December 29, 2008; renewed January 29, 2011 |
$ | 280,000 | 5.25 | % | $ | 14,700 | January 28, 2012 | |||||||
Our board of directors approved the termination of the loan program on April 7, 2011 and we intend on terminating our guaranties and the associated pledge of our certificates of deposit with Comerica Bank, N.A. relating to these loans on or before October 1, 2011.
Repurchase of Our Securities
In November 2010, we repurchased 20,000 shares of Class A common stock from Bradley M. Robinson for a total of $220,000; we repurchased 25,000 shares of Class A common stock from Matthew V. Hairford for a total of $275,000; and we repurchased 30,000 shares of Class A common stock from David E. Lancaster for a total of $330,000.
In April 2010, we repurchased 1,000,000 shares of Class A common stock from five shareholders, all advised by Wellington Management Company, LLP, for a total of $9,000,000. The purchase price for such shares of Class A common stock was determined through negotiations with Wellington Management Company, LLP.
In September 2009, we repurchased 52,500 shares of Class A common stock from Scott E. King for a total of $390,000.
In April 2009, we repurchased from one of our shareholders, Gandhara Master Fund Limited, 5,422,713 shares of Class A common stock for a total of $27,113,565. The purchase price for such shares of Class A common stock was determined through negotiations with Gandhara Master Fund Limited.
156
Table of Contents
Index to Financial Statements
Issuance of Our Securities
In January 2011 we completed a private placement offering of shares of our Class A common stock. See “Business — Recent Developments.” As detailed in the table below, several of our directors and executive officers participated in such offering on the same terms and conditions as the other investors in the offering.
| Director or Executive Officer |
Aggregate Consideration | |||
| Joseph Wm. Foran |
$ | 1,171,500 | (1) | |
| David M. Laney |
$ | 473,000 | (2) | |
| Michael C. Ryan |
$ | 1,100,000 | ||
| Margaret Shannon(3) |
$ | 249,700 | ||
| (1) | Sage Resources, Ltd., which is a limited partnership owned by the Foran family, including Mr. Foran, purchased a portion of the shares for an aggregate consideration of $346,500. |
| (2) | Mr. Laney’s adult children purchased a portion of the shares for an aggregate consideration of $198,000. Mr. Laney has the power to vote his children’s shares pursuant to a revocable power of attorney. In addition, Laney Investments Ltd. purchased a portion of the shares for an aggregate consideration of $275,000. |
| (3) | Mrs. Shannon was not a member of our board of directors at the time of purchase. |
In May 2009 through September 2009, we sold, in a private placement offering, shares of our Class A common stock to our existing shareholders. As detailed in the table below, several of our directors and executive officers participated in such offering on the same terms and conditions as the other investors in the offering.
| Director or Executive Officer |
Aggregate Consideration | |||
| Joseph Wm. Foran |
$ | 2,370,860 | (1) | |
| David E. Lancaster |
$ | 123,750 | (2) | |
| David M. Laney |
$ | 859,550 | (3) | |
| Michael C. Ryan |
$ | 169,038 | ||
| (1) | Sage Resources, Ltd., which is a limited partnership owned by the Foran family, including Mr. Foran, and two of Mr. Foran’s minor children purchased a portion of the shares for an aggregate consideration of $596,000. |
| (2) | Mr. Lancaster’s Individual Retirement Account purchased all of the shares. |
| (3) | Mr. Laney’s adult children purchased a portion of the shares for an aggregate consideration of $146,250. Mr. Laney has the power to vote his children’s shares pursuant to a revocable power of attorney. In addition, Laney Investments Ltd. purchased a portion of the shares for an aggregate consideration of $515,730. |
Corporate Reorganization
In connection with our corporate reorganization, we engaged in certain transactions with certain affiliates and our existing equity holders. Please see “Corporate Reorganization” for a description of these transactions.
Other Transactions
In January 2007, we agreed with one of our shareholders, Roxanna Oil, Inc., to obtain acreage and to market a new natural gas prospect in the Meade Peak shale in southwest Wyoming and adjacent areas in Utah and Idaho. The principals of Roxanna Oil are Marlan W. Downey and his daughter, Julie Downey Garvin. Mr. Downey is an officer, director and shareholder of Roxanna Oil and is a special advisor to our board of directors and one of our shareholders. Ms. Garvin is President of Roxanna Oil and the former Chief Geophysicist for Marathon Oil Corporation. Our subsidiary, MRC Rockies Company, has obtained approximately 146,000 gross and 139,000 net acres in the prospect at a cost of approximately $9.3 million
157
Table of Contents
Index to Financial Statements
at December 31, 2010. Mr. Downey and Ms. Garvin assisted with the marketing of the prospect to industry partners for joint development.
In May 2010, Roxanna Rocky Mountains, LLC (a wholly owned subsidiary of Roxanna Oil) and Alliance Capital Real Estate, Inc. entered into a participation agreement with our subsidiary, MRC Rockies Company, to explore and develop our Meade Peak prospect. For more information concerning the agreement with Alliance Capital Real Estate, please see the discussion under “Business — Other Significant Prior Events — Alliance Capital Participation Agreement.”
On April 15, 2008, Mr. Foran made a partial assignment to us of his rights, title and interest in and to oil and gas leases in lands located in southeast New Mexico, being specifically an undivided 29.222591% working interest in a 40-acre tract (approximately 12 net acres). Prior to this assignment, Mr. Foran had received a proposal from Samson Resources Company (“Samson”) requesting an assignment of this same undeveloped working interest in the subject lands in return for a substantial cash consideration and with Mr. Foran retaining a 12.5% overriding royalty interest proportionately reduced. Mr. Foran offered us the opportunity to acquire this interest on terms more favorable to us than he was offered by Samson. Following review of this opportunity, our technical staff and management (excluding Mr. Foran) recommended pursuing an assignment of these leasehold interests from Mr. Foran. With the full approval of our management and board of directors (excluding Mr. Foran), Mr. Foran assigned to us a 29.222591% working interest in the subject lands for no cash consideration, while retaining a proportionately reduced 12.5% overriding royalty interest as to our assigned working interest and a 4% working interest for his own account. Subsequent to this transaction, one well was drilled and completed as an oil producer by Samson, and both Mr. Foran and we participated in the drilling and completion of this well in accordance with our respective working interests.
Procedures for Approval of Related Person Transactions
Prior to the completion of this offering, our board of directors intends to adopt a written related party transactions policy. We anticipate that a “Related Party Transaction” will be a transaction, arrangement or relationship in which we or any of our subsidiaries was, is or will be a participant, the amount of which involved exceeds $120,000, and in which any related person had, has or will have a direct or indirect material interest. We anticipate that a “Related Person” will mean:
| • | any person who is, or at any time during the applicable period was, one of our executive officers or one of our directors; |
| • | any person who is known by us to be the beneficial owner of more than 5.0% of our common stock; |
| • | any immediate family member of any of the foregoing persons, which means any child, stepchild, parent, stepparent, spouse, sibling, mother-in-law, father-in-law, son-in-law, daughter-in-law, brother-in-law or sister-in-law of a director, executive officer or a beneficial owner of more than 5.0% of our common stock, and any person (other than a tenant or employee) sharing the household of such director, executive officer or beneficial owner of more than 5.0% of our common stock; and |
| • | any firm, corporation or other entity in which any of the foregoing persons is a partner or principal or in a similar position or in which such person has a 10.0% or greater beneficial ownership interest. |
158
Table of Contents
Index to Financial Statements
We anticipate that pursuant to this policy, the Audit Committee will review all material facts of each Related Party Transaction and recommend either approval or rejection of the Related Party Transaction to the full board of directors, subject to certain limited exceptions. In determining whether to recommend approval or rejection of the Related Party Transaction, we anticipate that the Audit Committee shall, after reviewing all material facts of the Related Party Transaction and the Related Person’s relationship, determine whether the Related Party Transaction is fair to the company. After receiving the Audit Committee’s recommendation, the full board of directors will review all material facts of the Related Party Transaction and either approve or reject the Related Party Transaction. In determining whether to approve or reject such Related Party Transaction, we anticipate that the board of directors will, after reviewing all material facts of the Related Party Transaction and the Related Person’s relationship, determine whether the Related Party Transaction is fair to the company. Further, we anticipate that the policy will require that all Related Party Transactions required to be disclosed in our filings with the SEC be so disclosed in accordance with applicable laws, rules and regulations. All of the Related Party Transactions discussed above occurred prior to the adoption of the policy.
159
Table of Contents
Index to Financial Statements
Overview
We were recently incorporated pursuant to the laws of the State of Texas as Matador Holdco, Inc. to become a holding company for Matador Resources Company, a Texas corporation. Matador Resources Company was formed as a Texas corporation in July 2003. Pursuant to the terms of the corporate reorganization that was completed on August 9, 2011 (as described below) former Matador Resources Company, now known as MRC Energy Company, became a wholly owned subsidiary of current Matador Resources Company, formerly known as Matador Holdco, Inc. In connection with the reorganization, former Matador Resources Company changed its corporate name to MRC Energy Company and Matador Holdco, Inc. changed its corporate name to Matador Resources Company.
Merger
The former Matador Resources Company, now known as MRC Energy Company, determined it was in the best interests of the corporation and its shareholders that the company reorganize into a holding company structure pursuant to Section 10.005 of the Texas Business Organizations Code. In accordance with Section 10.005, we created a wholly owned subsidiary, Matador Holdco, Inc., now known as Matador Resources Company, solely for the purposes of creating a holding company structure. Matador Holdco, Inc. created a wholly owned subsidiary, Matador Merger Co., a Texas corporation, solely to be a constituent party to the holding company merger. Pursuant to Section 10.005, Matador Merger Co. merged with Matador Resources Company, now known as MRC Energy Company. Matador Resources Company, now known as MRC Energy Company, was the surviving party of the merger and as a result of the merger, became a wholly owned subsidiary of Matador Holdco, Inc., now known as Matador Resources Company. The former Matador Resources Company changed its name to MRC Energy Company, and the former Matador Holdco, Inc. changed its name to Matador Resources Company.
Because we accomplished the holding company merger in accordance with Section 10.005 of the Texas Business Organizations Code, approval by the shareholders of the former Matador Resources Company, now known as MRC Energy Company, was not required. In addition, as a result of the merger, the shareholders of the former Matador Resources Company, now known as MRC Energy Company, received shares of Matador Holdco, Inc., now known as Matador Resources Company, in exchange for the shares of the former Matador Resources Company, now known as MRC Energy Company, then held by such shareholders, and the shareholders of the former Matador Resources Company had no appraisal rights.
160
Table of Contents
Index to Financial Statements
Immediately prior to the corporate reorganization, the corporate structure of the three aforementioned entities was as follows:
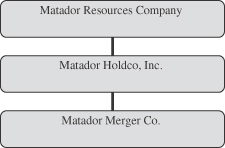
Immediately after the corporate reorganization, the corporate structure of the aforementioned entities is as follows:
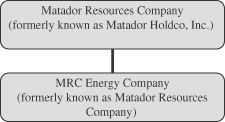
161
Table of Contents
Index to Financial Statements
SECURITY OWNERSHIP OF MANAGEMENT AND
CERTAIN BENEFICIAL HOLDERS
The following table sets forth information with respect to the beneficial ownership of our common stock at July 31, 2011 after giving effect to our corporate reorganization by:
| • | each person who we know owns beneficially approximately 5% or more of our common stock; |
| • | certain institutional investors; |
| • | each of our directors; |
| • | each of our executive officers; and |
| • | all of our executive officers and directors as a group. |
Except as otherwise indicated, the persons or entities listed below have sole voting and investment power with respect to all shares of our common stock beneficially owned by them, except to the extent this power may be shared with a spouse. All information with respect to beneficial ownership has been furnished by the respective directors, officers or 5% or more shareholders, as the case may be. Except as otherwise indicated, the address for each beneficial owner is 5400 LBJ Freeway, Suite 1500, Dallas, Texas 75240.
| Beneficial Owner |
Beneficial
Ownership(1) of Class A Common Stock Prior to this Offering |
Beneficial
Ownership(1) of Class B Common Stock |
||||||||||||||
| Number(2) | Percent
of Class(2) |
Number | Percent
of Class(2) |
|||||||||||||
| Joseph Wm. Foran(3) |
3,628,147 | 8.5 | % | 880,700 | 85.4 | % | ||||||||||
| Wellington Management Company, LLP(4) |
7,355,003 | 17.6 | % | – | – | |||||||||||
| General Mills, Inc. Benefit Finance
Committee(5) |
4,561,110 | 10.9 | % | – | – | |||||||||||
| Stephen A. Holditch(6) |
125,628 | * | – | – | ||||||||||||
| David M. Laney(7) |
653,852 | 1.5 | % | – | – | |||||||||||
| Steven W. Ohnimus(8) |
96,902 | * | – | – | ||||||||||||
| Michael C. Ryan(9) |
249,445 | * | – | – | ||||||||||||
| Margaret B. Shannon |
23,700 | * | – | – | ||||||||||||
| Gregory E. Mitchell(10) |
173,750 | * | – | |||||||||||||
| Scott E. King(11) |
966,750 | 2.3 | % | 150,000 | 14.6 | % | ||||||||||
| Bradley M. Robinson(12) |
239,750 | * | – | – | ||||||||||||
| David E. Lancaster (13) |
354,750 | * | – | – | ||||||||||||
| Matthew V. Hairford(14) |
232,800 | * | – | – | ||||||||||||
| David F. Nicklin(15) |
47,500 | * | – | – | ||||||||||||
| Executive officers and directors as a group(16) |
6,792,974 | 15.8 | % | 1,030,700 | 100.0 | % | ||||||||||
| * | Less than 1.0%. |
| (1) | Under applicable rules promulgated by the SEC pursuant to the Exchange Act, a person is deemed the “beneficial owner” of a security with regard to which the person, directly or indirectly, has or shares (a) the voting power, which includes the power to vote or direct the voting of the security, or (b) the investment power, which includes the power to dispose or direct the disposition of the security, in each case irrespective of the person’s economic interest in the security. Under these SEC rules, a person is deemed to beneficially own securities which the person has the right to acquire within 60 days through (x) the exercise of any option or warrant or (y) the conversion of another security. |
| (2) | Percentages based on a total of 41,715,473 shares of Class A common stock issued and outstanding prior to this offering and 1,030,700 shares of Class B common stock issued and outstanding prior to this offering. All shares of Class B common stock will automatically convert on a one-for-one basis into shares of Class A common stock upon the consummation of this offering pursuant to the terms of our certificate of formation. Therefore, the Class A common stock amounts include the Class B common stock amounts based on the |
162
Table of Contents
Index to Financial Statements
| one-for-one conversion. See “Description of Capital Stock” for details regarding the automatic conversion of the Class B common stock upon the consummation of this offering. |
| (3) | Includes 250,000 shares of Class B common stock and 756,367 shares of Class A common stock held of record by Sage Resources, Ltd., which is a limited partnership owned by the Foran family, including Mr. Foran. Also includes an aggregate of 19,000 shares held of record by two of Mr. Foran’s college age children. Also includes 135,500 shares and 50,000 shares of common stock held of record by The Don Foran Family Trust 2008 and The Foran Family Special Needs Trust, respectively, for which Mr. Foran is the co-trustee and over which Mr. Foran has shared voting and investment power with other members of his family. Also includes 630,700 additional shares of Class A common stock issuable upon the automatic conversion of Mr. Foran’s shares of Class B common stock at the consummation of this offering. |
| (4) | Represents shares held of record by the following entities for which Wellington Management Company, LLP serves as investment advisor and has shared investment and voting power over such shares: Global Natural Resources III (594,200 shares), Placer Creek Investors (Bermuda) LP (211,300 shares), Placer Creek Partners, LP (237,703 shares), Spindrift Partners LP (3,010,600 shares) and Spindrift Investors (Bermuda) LP (3,301,200 shares). Wellington Management Company, LLP, in its capacity as investment advisor, may be deemed to have beneficial ownership of 7,355,003 shares of our common stock. Such shares are owned by numerous investment advisory clients of Wellington Management, none of which is known to have beneficial ownership of five percent or more of any class of our securities. Wellington Management Company, LLP is not the owner of record of such shares and disclaims any pecuniary interest in such shares. |
| (5) | Represents shares held of record by the following entities for which General Mills, Inc. Benefit Finance Committee serves as investment advisor and has sole investment and voting power over such shares: General Mills Group Trust (4,216,110 shares) and Voluntary Employees Beneficiary Assoc. Trust General Mills & Bakery, Confectionary, Tobacco & Grain Millers (345,000 shares). General Mills, Inc. Benefit Finance Committee, in its capacity as a fiduciary for General Mills Group Trust and Voluntary Employees Beneficiary Assoc. Trust General Mills & Bakery, Confectionary, Tobacco & Grain Millers, may be deemed to have beneficial ownership of 4,561,110 shares of our common stock. |
| (6) | Includes 12,750 shares which Dr. Holditch has the right to acquire within 60 days of July 31, 2011 through the exercise of stock options. |
| (7) | Includes 7,500 shares which Mr. Laney has the right to acquire within 60 days of July 31, 2011 through the exercise of stock options. Also includes an aggregate of 242,250 shares held of record by Mr. Laney’s adult children, who gave Mr. Laney voting power of such shares through a revocable power of attorney and 25,000 shares held of record by Laney Investments Ltd. |
| (8) | Includes 14,250 shares which Dr. Ohnimus has the right to acquire within 60 days of July 31, 2011 through the exercise of stock options. |
| (9) | Includes 1,500 shares which Mr. Ryan has the right to acquire within 60 days of July 31, 2011 through the exercise of stock options. |
| (10) | Includes 173,750 shares held of record by JAMAL Enterprises, LP, for which Mr. Mitchell has sole voting and investment power. |
| (11) | Includes 33,750 shares which Mr. King has the right to acquire within 60 days of July 31, 2011 through the exercise of stock options. Also includes 150,000 additional shares of Class A common stock issuable upon the automatic conversion of Mr. King’s shares of Class B common stock at the consummation of this offering. Also includes an aggregate of 48,375 shares held of record by Mr. King’s three minor or college age children. |
| (12) | Includes 38,750 shares which Mr. Robinson has the right to acquire within 60 days of July 31, 2011 through the exercise of stock options and 42,000 shares held of record by his Individual Retirement Account. Mr. Robinson pledged 80,000 shares of common stock to us in connection with the loan program. This pledge is to secure our guaranty to Comerica Bank, N.A. regarding Mr. Robinson’s loan. Our board of directors approved the termination of the loan program on April 7, 2011 and Mr. Robinson intends on terminating the pledge on or before October 1, 2011. |
| (13) | Includes 120,000 shares which Mr. Lancaster has the right to acquire within 60 days of July 31, 2011 through the exercise of stock options and 73,500 shares held of record by his Individual Retirement Account. Mr. Lancaster pledged 120,000 shares of common stock to us in connection with the loan program. This pledge is to secure our guaranty to Comerica Bank, N.A. regarding Mr. Lancaster’s loan. Our board of directors approved the termination of the loan program on April 7, 2011 and Mr. Lancaster intends on terminating the pledge on or before October 1, 2011. |
| (14) | Includes 100,000 shares which Mr. Hairford has the right to acquire within 60 days of July 31, 2011 through the exercise of stock options and 3,000 shares held of record by his Individual Retirement Account. Mr. Hairford pledged 75,000 shares of common stock to us in connection with the loan program. This pledge is to secure our guaranty to Comerica Bank, N.A. regarding Mr. Hairford’s loan. Our board of directors approved the termination of the loan program on April 7, 2011 and Mr. Hairford intends on terminating the pledge on or before October 1, 2011. |
| (15) | Includes 17,500 shares which Mr. Nicklin has the right to acquire within 60 days of July 31, 2011 through the exercise of stock options and 30,000 shares held of record by his Individual Retirement Account. |
| (16) | Includes an aggregate of 346,000 shares which our executive officers and directors as a group have the right to acquire within 60 days of July 31, 2011 through the exercise of stock options. |
163
Table of Contents
Index to Financial Statements
Our authorized capital stock consists of 82,000,000 shares of common stock, par value $0.01 per share, and 2,000,000 shares of preferred stock, par value $0.01 per share. The common stock is split into two classes — 80,000,000 authorized shares of Class A common stock and 2,000,000 authorized shares of Class B common stock. Upon the closing of this offering, all issued and outstanding shares of Class B common stock will be automatically converted, on a one-for-one basis, into shares of Class A common stock, and the separate classes of common stock will be eliminated pursuant to the terms of our certificate of formation. In October 2008, our shareholders approved an increase in the number of authorized Class A common stock from 40,000,000 to 80,000,000 in connection with our 3-for-1 stock split. At July 31, 2011, we had no outstanding shares of preferred stock, 1,030,700 outstanding shares of Class B common stock, 41,715,473 outstanding shares of Class A common stock and 42,746,173 outstanding shares of Class A common stock on an as converted basis. At July 31, 2011, we had three holders of record of Class B common stock and 495 holders of record of our Class A common stock.
Common Stock
Other than the special rights of the Class B common stock described below in this section, the Class A common stock and the Class B common stock are identical in all respects. Upon the closing of this offering, all issued and outstanding shares of Class B common stock will be automatically converted, on a one-for-one basis, into shares of Class A common stock, and the separate classes of common stock will be eliminated pursuant to the terms of our certificate of formation.
In the fourth quarter of 2008, we effected a 3-for-1 forward stock split of the Class A common stock. The forward split was effected through a share dividend of two shares of Class A common stock for each outstanding share of common stock (including Class B common stock) held by our shareholders of record at October 31, 2008.
The holders of the Class B common stock are entitled to be paid cumulative dividends at a per share rate of $0.26-2/3 annually out of funds legally available for the payment of dividends. These dividends accrue and are payable quarterly at the rate of $0.06-2/3 per share of Class B common stock outstanding. Upon the automatic conversion of the outstanding shares of Class B common stock at the closing of this offering, the right to dividends will terminate. Any accrued but unpaid dividends existing at the time of such conversion will be paid to the holders of the Class B common stock upon conversion.
Holders of all of our common stock will be entitled to receive their pro rata shares of dividends in the amounts and at the times declared by our board of directors in its discretion out of funds legally available for the payment of dividends.
Subject to any special voting rights of any series of preferred stock that we may issue in the future, each share of common stock has one vote on all matters voted on by our shareholders, including the election of directors. No share of common stock has any cumulative voting or preemptive rights or is redeemable, assessable or entitled to the benefits of any sinking or repurchase fund. Holders of common stock will share equally in our assets on liquidation after payment or provision for all liabilities and any preferential liquidation rights of any preferred stock then outstanding. All outstanding shares of common stock are fully paid and non-assessable.
164
Table of Contents
Index to Financial Statements
Preferred Stock
At the direction of our board of directors, we may issue shares of preferred stock from time to time. Our board of directors may, without any action by holders of common stock, adopt resolutions to issue preferred stock by establishing the number, rights and preferences of, and designating, one or more series of preferred stock. No series of preferred stock has been designated and established by our board of directors. The rights of any series of preferred stock may include, among others:
| • | general or special voting rights; |
| • | preferential liquidation or preemptive rights; |
| • | preferential cumulative or noncumulative dividend rights; |
| • | redemption or put rights; and |
| • | conversion or exchange rights. |
We may issue shares of, or rights to purchase shares of, preferred stock the terms of which might:
| • | adversely affect voting or other rights evidenced by, or amounts otherwise payable with respect to, the common stock; |
| • | discourage an unsolicited proposal to acquire us; or |
| • | facilitate a particular business combination involving us. |
Any of these actions could discourage a transaction that some or a majority of our shareholders might believe to be in their best interests or in which our shareholders might receive a premium for their stock over our then market price.
Business Combinations under Texas Law
A number of provisions of Texas law, our certificate of formation and bylaws could make more difficult the acquisition of Matador by means of a tender offer, a proxy contest or otherwise and the removal of incumbent officers and directors. These provisions are intended to discourage coercive takeover practices and inadequate takeover bids and to encourage persons seeking to acquire control of Matador to negotiate first with our board of directors.
We are subject to the provisions of Title 2, Chapter 21, Subchapter M of the Texas Business Organizations Code (the “Texas Business Combination Law”). That law provides that a Texas corporation may not engage in specified types of business combinations, including mergers, consolidations and asset sales, with a person, or an affiliate or associate of that person, who is an “affiliated shareholder.” An “affiliated shareholder” is generally defined as the holder of 20% or more of the corporation’s voting shares, for a period of three years from the date that person became an affiliated shareholder. The law’s prohibitions do not apply if:
| • | the business combination or the acquisition of shares by the affiliated shareholder was approved by the board of directors of the corporation before the affiliated shareholder became an affiliated shareholder; or |
| • | the business combination was approved by the affirmative vote of the holders of at least two-thirds of the outstanding voting shares of the corporation not beneficially owned by the affiliated shareholder, at a meeting of shareholders called for that purpose, not less than six months after the affiliated shareholder became an affiliated shareholder. |
165
Table of Contents
Index to Financial Statements
Because we have more than 100 shareholders, we are considered an “issuing public corporation” for purposes of this law. The Texas Business Combination Law does not apply to the following:
| • | the business combination of an issuing public corporation: where the corporation’s original charter or bylaws contain a provision expressly electing not to be governed by the Texas Business Combination Law; or that adopts an amendment to its charter or bylaws, by the affirmative vote of the holders, other than affiliated shareholders, of at least two-thirds of the outstanding voting shares of the corporation, expressly electing not to be governed by the Texas Business Combination Law and so long as the amendment does not take effect for 18 months following the date of the vote and does not apply to a business combination with an affiliated shareholder who became affiliated on or before the effective date of the amendment; |
| • | a business combination of an issuing public corporation with an affiliated shareholder that became an affiliated shareholder inadvertently, if the affiliated shareholder divests itself, as soon as possible, of enough shares to no longer be an affiliated shareholder and would not at any time within the three-year period preceding the announcement of the business combination have been an affiliated shareholder but for the inadvertent acquisition; |
| • | a business combination with an affiliated shareholder who became an affiliated shareholder through a transfer of shares by will or intestacy and continuously was an affiliated shareholder until the announcement date of the business combination; and |
| • | a business combination of a corporation with its wholly owned Texas subsidiary if the subsidiary is not an affiliate or associate of the affiliated shareholder other than by reason of the affiliated shareholder’s beneficial ownership of voting shares of the corporation. |
Neither our certificate of formation nor our bylaws contain any provision expressly providing that we will not be subject to the Texas Business Combination Law. The Texas Business Combination Law may have the effect of inhibiting a non-negotiated merger or other business combination involving our company, even if that event would be beneficial to our shareholders.
Action by Consent
Our bylaws and Texas law provide that any action that can be taken at any special or annual meeting of shareholders may be taken by unanimous written consent of all shareholders entitled to vote.
Certain Charter and Bylaw Provisions
Our certificate of formation and bylaws contain certain provisions that could discourage potential takeover attempts and make it more difficult for our shareholders to change management or receive a premium for their shares. These provisions include:
| • | authorization for our board of directors to issue preferred stock without shareholder approval; |
| • | a classified board of directors so that not all members of our board of directors are elected at one time; |
| • | the prohibition of cumulative voting in the election of directors; and |
| • | a limitation on the ability of shareholders to call special meetings to those owning at least 10% of our outstanding shares of common stock. |
166
Table of Contents
Index to Financial Statements
Limitation of Liability and Indemnification of Officers and Directors
Our certificate of formation provides that our directors are not liable to the company or its shareholders for monetary damages for an act or omission in their capacity as a director. A director may, however, be found liable for:
| • | any breach of the director’s duty of loyalty to the company or its shareholders; |
| • | acts or omissions not in good faith that constitute a breach of the director’s duty to the company; |
| • | acts or omissions that involve intentional misconduct or a knowing violation of law; |
| • | any transaction from which the director receives an improper benefit; or |
| • | acts or omissions for which the liability is expressly provided by an applicable statute. |
Our certificate of formation also provides that we will indemnify our directors, and may indemnify our officers, employees and agents, to the fullest extent permitted by applicable Texas law from any expenses, liabilities or other matters. Insofar as indemnification for liabilities arising under the Securities Act may be permitted for directors, officers and controlling persons of Matador under our certificate of formation, it is the position of the SEC that such indemnification is against public policy as expressed in the Securities Act and is, therefore, unenforceable.
Indemnification Agreements
We have entered into indemnification agreements with each of our officers and directors. Under these agreements, we have agreed to indemnify the director or officer who acts on behalf of Matador and is made or threatened to be made a party to any action or proceeding for expenses, judgments, fines and amounts paid in settlement that are actually and reasonably incurred in connection with the action or proceeding. The indemnity provisions apply whether the action was instituted by a third party or by us. Generally, the principal limitation on our obligation to indemnify the director or officer will be if it is determined by a court of law, not subject to further appeal, that indemnification is prohibited by applicable law or the provisions of the indemnification agreement.
Transfer Agent and Registrar
The transfer agent and registrar for our common stock is Registrar and Transfer Company.
Listing
We intend to apply to list our common stock on the NYSE under the symbol “MTDR.”
167
Table of Contents
Index to Financial Statements
SHARES ELIGIBLE FOR FUTURE SALE
Prior to this offering, there has been no public market for our common stock. Future sales of our common stock in the public market, or the availability of such shares for sale in the public market, could adversely affect market prices prevailing from time to time. As described below, only a limited number of shares will be available for sale shortly after this offering due to contractual and legal restrictions on resale. Nevertheless, sales of a substantial number of shares of our common stock in the public market after such restrictions lapse, or the perception that those sales may occur, could adversely affect the prevailing market price at such time and our ability to raise equity-related capital at a time and price we deem appropriate.
Sales of Restricted Shares
Upon the closing of this offering, we will have outstanding an aggregate of — shares of common stock, and in addition to the shares sold in this offering, — shares of common stock will be freely tradable without restriction or further registration under the Securities Act, unless the shares are held by any of our “affiliates” as such term is defined in Rule 144 of the Securities Act.
All remaining shares of common stock held by existing shareholders will be deemed “restricted securities” as such term is defined under Rule 144. The restricted securities were issued and sold by us in private transactions and are eligible for public sale only if registered under the Securities Act or if they qualify for an exemption from registration under Rule 144 or Rule 701 under the Securities Act, which rules are summarized below.
The underwriters expect that — of our shares, including all shares held by our officers and directors, will be subject to lock-up agreements that prohibit the disposition of those shares during the 180-day period beginning on the date of the final prospectus related to this offering, except with the prior written consent of RBC Capital Markets, LLC and subject to certain exceptions. We expect to contact our shareholders to discuss and obtain these agreements following the initial filing of this prospectus. After the expiration of the 180-day restricted period, these shares may be sold in the public market in the United States, subject to prior registration in the United States, if required, or reliance upon an exemption from U.S. registration, including, in the case of shares held by affiliates or control persons, compliance with the volume restrictions of Rule 144. See “Underwriters” for a description of these lockup provisions.
Rule 144
In general, under Rule 144 as currently in effect, once we have been a reporting company subject to the reporting requirements of Section 13 or 15(d) of the Exchange Act for 90 days, a person (or persons whose shares are aggregated) who is not deemed to have been an affiliate of ours at any time during the three months preceding a sale, and who has beneficially owned restricted securities within the meaning of Rule 144 for at least six months (including any period of consecutive ownership of preceding non-affiliated holders) would be entitled to sell those shares, subject only to the availability of current public information about us. A non-affiliated person who has beneficially owned restricted securities within the meaning of Rule 144 for at least one year would be entitled to sell those shares without regard to the provisions of Rule 144.
Once we have been a reporting company subject to the reporting requirements of Section 13 or 15(d) of the Exchange Act for 90 days, a person (or persons whose shares are aggregated) who is deemed to be an affiliate of ours and who has beneficially owned restricted securities within the meaning of Rule 144 for at
168
Table of Contents
Index to Financial Statements
least six months would be entitled to sell within any three-month period a number of shares that does not exceed the greater of one percent of the then outstanding shares of our common stock or the average weekly trading volume of our common stock reported through the NYSE during the four calendar weeks preceding the filing of notice of the sale. Such sales are also subject to certain manner of sale provisions, notice requirements and the availability of current public information about us.
Rule 701
Employees, directors, officers, consultants or advisors who purchase shares from us in connection with a compensatory stock or option plan or other written compensatory agreement in accordance with Rule 701 before the effective date of the registration statement are entitled to sell such shares 90 days after the effective date of the registration statement in reliance on Rule 144 without having to comply with the holding period requirement of Rule 144 and, in the case of non-affiliates, without having to comply with the public information, volume limitation or notice filing provisions of Rule 144. The SEC has indicated that Rule 701 will apply to typical stock options granted by an issuer before it becomes subject to the reporting requirements of the Exchange Act, along with the shares acquired upon exercise of such options, including exercises after the date of this prospectus.
Stock Issued Under Employee Plans
We intend to file a registration statement on Form S-8 under the Securities Act to register stock issuable under our 2003 Stock and Incentive Plan and our 2011 Long-Term Incentive Plan. This registration statement is expected to be filed following the effective date of the registration statement of which this prospectus is a part and will be effective upon filing. Accordingly, shares registered under such registration statement will be available for sale in the open market following the effective date, unless such shares are subject to vesting restrictions with us, Rule 144 restrictions applicable to our affiliates or the lockup restrictions described above.
169
Table of Contents
Index to Financial Statements
MATERIAL U.S. FEDERAL INCOME AND ESTATE TAX
CONSIDERATIONS TO NON-U.S. HOLDERS
The following is a general discussion of the material U.S. federal income and estate tax consequences of the acquisition, ownership and disposition of our common stock to a non-U.S. holder. Except as specifically provided below (see “— Estate Tax”), for the purpose of this discussion, a non-U.S. holder is any beneficial owner of our common stock that is not for U.S. federal income tax purposes any of the following:
| • | an individual citizen or resident of the United States; |
| • | a corporation (or other entity treated as a corporation for U.S. federal income tax purposes) created or organized in the United States or under the laws of the United States or any state or the District of Columbia; |
| • | a partnership (or other entity treated as a partnership for U.S. federal income tax purposes); |
| • | an estate whose income is subject to U.S. federal income tax regardless of its source; or a trust (x) whose administration is subject to the primary supervision of a U.S. court and which has one or more U.S. persons who have the authority to control all substantial decisions of the trust or (y) that was in existence on August 20, 1996, was treated as a U.S. person at the previous day and has made a valid election to continue to be treated as a U.S. person. |
If a partnership (or an entity treated as a partnership for U.S. federal income tax purposes) holds our common stock, the tax treatment of a partner in the partnership will generally depend on the status of the partner and upon the activities of the partnership. Accordingly, we urge partnerships that hold our common stock and partners in such partnerships to consult their own tax advisors regarding the tax treatment of holding our common stock.
This discussion assumes that a non-U.S. holder will hold our common stock issued pursuant to this offering as a capital asset (generally, property held for investment). This discussion does not address all aspects of U.S. federal income taxation or any aspects of state, local or non-U.S. taxation, nor does it consider any U.S. federal income tax considerations that may be relevant to non-U.S. holders which may be subject to special treatment under U.S. federal income tax laws, including, without limitation, U.S. expatriates, controlled foreign corporations, passive foreign investment companies, insurance companies, tax-exempt or governmental organizations, dealers in securities or currency, banks or other financial institutions and investors that hold our common stock as part of a hedge, straddle or conversion transaction. Furthermore, the following discussion is based on current provisions of the Internal Revenue Code of 1986, as amended, and Treasury Regulations and administrative and judicial interpretations thereof, all as in effect on the date hereof, and all of which are subject to change, possibly with retroactive effect.
We urge each prospective investor to consult a tax advisor regarding the U.S. federal, state, local and non-U.S. income and other tax consequences of acquiring, holding and disposing of shares of our common stock.
Dividends
If we pay dividends on our common stock, those payments will constitute dividends for U.S. tax purposes to the extent paid from our current or accumulated earnings and profits, as determined under U.S. federal income tax principles. To the extent those dividends exceed our current and accumulated
170
Table of Contents
Index to Financial Statements
earnings and profits, the dividends will constitute a return of capital and will first reduce a holder’s adjusted tax basis in its common stock, but not below zero, and then will be treated as gain from the sale of the common stock (see “— Gain on Disposition of Common Stock”).
Any dividend paid out of earnings and profits to a non-U.S. holder of our common stock generally will be subject to U.S. withholding tax either at a rate of 30% of the gross amount of the dividend or such lower rate as may be specified by an applicable tax treaty. To receive the benefit of a reduced treaty rate, a non-U.S. holder generally must provide us with an Internal Revenue Service (“IRS”) Form W-8BEN certifying qualification for the reduced rate.
Dividends received by a non-U.S. holder that are effectively connected with a U.S. trade or business conducted by the non-U.S. holder will be exempt from such withholding tax. To obtain this exemption, the non-U.S. holder must provide us with an IRS Form W-8ECI properly certifying such exemption. Such effectively connected dividends, although not subject to withholding tax, will be subject to U.S. federal income tax on a net income basis at the same graduated U.S. tax rates generally applicable to U.S. persons, net of certain deductions and credits, subject to any applicable tax treaty providing otherwise. In addition to the income tax described above, dividends received by corporate non-U.S. holders that are effectively connected with a U.S. trade or business of the corporate non-U.S. holder may be subject to a branch profits tax at a rate of 30% or such lower rate as may be specified by an applicable tax treaty.
In certain circumstances, amounts received by a non-U.S. holder upon the redemption of our common stock may be treated as a distribution in the nature of a dividend with respect to the common stock, rather than as a payment in exchange for the common stock that results in the recognition of capital gain or loss, as described above. In these circumstances, the redemption payment would be included in gross income as a dividend to the extent that such payment is made out of our earnings and profits (as described above). The determination of whether a redemption of common stock will be treated as a distribution, rather than as a payment in exchange for the common stock, will depend on whether and to what extent the redemption reduces the non-U.S. holder’s ownership in us. The rules applicable to redemptions are complex, and each non-U.S. holder should consult its own tax advisor to determine the consequences of a redemption to it.
Gain on Disposition of Common Stock
A non-U.S. holder generally will not be subject to U.S. federal income tax on any gain realized upon the sale or other disposition of our common stock unless:
| • | the gain is effectively connected with a U.S. trade or business of the non-U.S. holder and, if required by an applicable tax treaty, is attributable to a U.S. permanent establishment maintained by such non-U.S. holder; |
| • | the non-U.S. holder is an individual who is present in the United States for a period or periods aggregating 183 days or more during the calendar year in which the sale or disposition occurs and certain other conditions are met; or |
| • | we are or have been a “U.S. real property holding corporation” for U.S. federal income tax purposes and the non-U.S. holder holds or has held, directly or indirectly, at any time within the shorter of the five-year period preceding the disposition or the non-U.S. holder’s holding period, more than 5% of our common stock. Generally, a corporation is a U.S. real property holding corporation if the fair market value of its U.S. real property interests equals or exceeds 50% of the sum of the fair market value of its worldwide real property interests and its other assets used or held for use in a trade or business. If we are or have been a U.S. real property holding corporation |
171
Table of Contents
Index to Financial Statements
| and our common stock is not regularly traded on an established securities market, then the gain recognized on the sale or other disposition of our common stock by a non-U.S. holder would be subject to U.S. federal income tax regardless of the amount of the non-U.S. holder’s ownership percentage. |
We believe that we are, and will remain for the foreseeable future, a “U.S. real property holding corporation” for U.S. federal income tax purposes.
Unless an applicable tax treaty provides otherwise, gain described in the first and third bullet points above will be subject to U.S. federal income tax on a net income basis at the same graduated U.S. tax rates generally applicable to U.S. persons. A branch profits tax may apply to certain of such gains. In addition gain described in the third bullet point may also be subject to certain withholding rules.
Gain described in the second bullet point above (which may be offset by U.S. source capital losses, provided that the non-U.S. holder has timely filed U.S. federal income tax returns with respect to such losses) generally will be subject to a flat 30% U.S. federal income tax.
Backup Withholding and Information Reporting
Generally, we must report annually to the IRS the amount of dividends paid to each non-U.S. holder, and the amount, if any, of tax withheld with respect to those dividends. A similar report is sent to each non-U.S. holder. These information reporting requirements apply even if withholding was not required. Pursuant to tax treaties or other agreements, the IRS may make its reports available to tax authorities in the recipient’s country of residence.
Payments of dividends to a non-U.S. holder may be subject to backup withholding (currently at a rate of 28%, and scheduled to increase to a rate of 31% on January 1, 2013) unless the non-U.S. holder establishes an exemption, for example, by properly certifying its non-U.S. status on an IRS Form W-8BEN or another appropriate version of IRS Form W-8. Notwithstanding the foregoing, backup withholding also may apply if we have actual knowledge, or reason to know, that the beneficial owner is a U.S. person that is not an exempt recipient.
Payments of the proceeds from sale or other disposition by a non-U.S. holder of our common stock effected outside the United States by or through a foreign office of a broker generally will not be subject to information reporting or backup withholding. However, information reporting will apply to those payments if the broker does not have documentary evidence that the holder is a non-U.S. holder, an exemption is not otherwise established and the broker has certain relationships with the United States.
Payments of the proceeds from a sale or other disposition by a non-U.S. holder of our common stock effected by or through a U.S. office of a broker generally will be subject to information reporting and backup withholding (currently at a rate of 28%, and scheduled to increase to a rate of 31% on January 1, 2013) unless the non-U.S. holder establishes an exemption, for example, by properly certifying its non-U.S. status on an IRS Form W-8BEN or another appropriate version of IRS Form W-8. Notwithstanding the foregoing, information reporting and backup withholding also may apply if the broker has actual knowledge, or reason to know, that the holder is a U.S. person that is not an exempt recipient.
Backup withholding is not an additional tax. Rather, the U.S. income tax liability of persons subject to backup withholding will be reduced by the amount of tax withheld. If withholding results in an overpayment of taxes, a refund may be obtained, provided that the required information is timely furnished to the IRS.
172
Table of Contents
Index to Financial Statements
Estate Tax
Our common stock owned or treated as owned by an individual who is not a citizen or resident of the United States (as specifically defined for U.S. federal estate tax purposes) at the time of death will be includible in the individual’s gross estate for U.S. federal estate tax purposes and may be subject to U.S. federal estate tax unless an applicable estate tax treaty provides otherwise.
Legislation Affecting Common Stock Held Through Foreign Accounts
Recently enacted legislation generally will impose a U.S. federal withholding tax of 30% on dividends and the gross proceeds of a disposition of our common stock paid after December 31, 2012 to a “foreign financial institution” (as specifically defined under these rules) unless such institution enters into an agreement with the U.S. government to withhold on certain payments and to collect and provide to the U.S. tax authorities substantial information regarding U.S. account holders of such institution (which includes certain equity and debt holders of such institution, as well as certain account holders that are foreign entities with U.S. owners). The legislation also will generally impose a U.S. federal withholding tax of 30% on dividends and the gross proceeds of a disposition of our common stock paid after December 31, 2012 to a non-financial foreign entity unless such entity provides the withholding agent with a certification identifying the direct and indirect U.S. owners of the entity. Under certain circumstances, a non-U.S. holder might be eligible for refunds or credits of such taxes. Prospective investors are encouraged to consult with their own tax advisors regarding the possible implications of this legislation on their investment in our common stock.
173
Table of Contents
Index to Financial Statements
Under the terms and subject to the conditions contained in an underwriting agreement dated —, 2011, we have agreed to sell to the underwriters named below, for whom RBC Capital Markets, LLC and Citigroup are acting as representatives, the following respective numbers of shares of common stock:
| Name |
Number of Shares | |
| RBC Capital Markets, LLC |
— | |
| Citigroup |
— | |
|
| ||
| Total |
— | |
|
|
The underwriting agreement provides that the underwriters are obligated, severally and not jointly, to purchase all the shares of common stock offered by us. The underwriting agreement also provides that if an underwriter defaults, the purchase commitments of non-defaulting underwriters may be increased or this offering may be terminated.
We have granted to the underwriters a 30-day option to purchase on a pro rata basis up to — additional shares at the offering price less the underwriting discounts and commissions. The option may be exercised only to cover any over-allotments of common stock.
The underwriters propose to offer the shares of common stock directly to the public at the offering price on the cover page of this prospectus and to selling group members at that price less a selling concession not in excess of $— per share. After this offering, the representatives may change the offering price and concession.
The following table summarizes the compensation we will pay:
| Per Share | Total | |||||||||||||||
| Without Over- Allotment |
With Over- Allotment |
Without Over- Allotment |
With Over- Allotment |
|||||||||||||
| Underwriting discounts and commissions paid by us |
$ | — | $ | — | $ | — | $ | — | ||||||||
The expenses of this offering that are payable by us are estimated to be $—, exclusive of underwriting discounts and commissions, which includes a reimbursement of RBC Capital Markets, LLC, or RBC, for up to $200,000 of its expenses incurred in connection with this offering.
The underwriters have informed us that they do not intend sales to discretionary accounts in excess of 5% of the total number of shares of common stock offered by them.
—% of our shares, including all shares held by our officers and directors, will be subject to lock-up agreements with RBC, on behalf of the underwriters, that prohibit during the period ending 180 days after the date of the final prospectus related to this offering (the “lockup period”):
| • | directly or indirectly, selling, offering, contracting or granting any option to sell or short sell, granting any option, right or warrant to purchase, pledging, transferring, establishing an open “put equivalent position”, lending or otherwise disposing of any shares of our common stock, options, rights or warrants to acquire shares of our common stock, or securities exchangeable or exercisable for or convertible into shares of our common stock owned either of record or beneficially; |
174
Table of Contents
Index to Financial Statements
| • | entering into any swap or other arrangement that transfers, in whole or in part, the economic consequences of the ownership of our common stock; or |
| • | publicly announcing an intention to do any of the foregoing. |
These agreements will also apply to any sale of locked up shares upon exercise of any options to purchase shares of common stock and will be subject to certain exceptions, including:
| • | sales of common stock to the underwriters in this offering; |
| • | the award of options or other purchase rights or shares of our common stock pursuant to our employee benefits plans; |
| • | issuances of shares of common stock or securities convertible into or exercisable or exchangeable for shares of common stock pursuant to the exercise of warrants, options or other convertible or exchangeable securities, including shares of convertible preferred stock, in each case which are outstanding on the date hereof; and |
| • | filing with the SEC a registration statement under the Securities Act on Form S-8 with respect to securities issued pursuant to an employee benefit plan. |
Notwithstanding the foregoing, our officers, directors and shareholders will be permitted to:
| • | abide by any obligations regarding shares of common stock or any security convertible into common stock under any existing pledge, margin account or similar agreement, including, but not limited to, sales and transfers of such securities; |
| • | transfer shares of common stock or any security convertible into common stock as a bona fide gift; |
| • | distribute shares of common stock or any security convertible into common stock to limited partners, general partners, members or shareholders; |
| • | transfer shares of common stock or any security convertible into common stock to family members or a trust established for the benefit of family members; |
| • | transfer shares of common stock or any security convertible into common stock to entities where the party to the lockup is the beneficial owner of all shares of common stock or our other securities held by the entity; |
| • | receive shares of common stock upon the exercise of an option or warrant or in connection with the vesting of restricted stock or restricted stock units; and |
| • | transfer shares of common stock to the company in a transaction exempt from Section 16(b) of the Exchange Act solely in connection with the payment of taxes due in connection with any such exercise or vesting. |
It will be a pre-condition to any such permitted transfer that the transferee executes and delivers to RBC a lock-up agreement in form and substance similar to the transferor’s agreement with RBC.
In addition, if (1) during the last 17 days of the restricted period, we issue an earnings release or material news or a material event relating to us occurs; or (2) prior to the expiration of the restricted period, we announce that we will release earnings results during the 16-day period beginning on the last day of the restricted period, the restrictions described above will continue to apply until the expiration of the 18-day period beginning on the issuance of the earnings release or the occurrence of the material news or material event.
175
Table of Contents
Index to Financial Statements
We have agreed not to file any registration statement with respect to our common stock or other equity securities (other than on Form S-8 as described above), and our directors, officers and other holders of our equity securities will waive all registration rights with respect to this offering.
We have agreed to indemnify the underwriters against liabilities under the Securities Act, or contribute to payments that the underwriters may be required to make in that respect.
We intend to apply to list our common stock on the NYSE under the symbol “MTDR”.
Prior to this offering, there has been no public market for our common stock. The initial public offering price will be determined by negotiations between us and the representatives of the underwriters. Among the factors to be considered in determining the initial public offering price will be our prospects and the prospects of our industry in general, our financial operating information in recent periods, an assessment of our management, the general condition of the securities markets and the recent market prices of, and demand for, publicly traded common stock of generally comparable companies. The estimated initial public offering price range set forth on the cover page of this preliminary prospectus is subject to change as a result of market conditions and other factors.
In the ordinary course of business, certain of the underwriters and their affiliates have provided and may in the future provide financial advisory, investment banking and general financing and banking services for us and our affiliates for customary fees.
In connection with this offering, the underwriters may engage in stabilizing transactions, over-allotment transactions, syndicate covering transactions and penalty bids in accordance with Regulation M under the Exchange Act, including:
| • | stabilizing transactions that permit bids to purchase the underlying security so long as the stabilizing bids do not exceed a specified maximum; |
| • | over-allotment, which involves sales by the underwriters of shares in excess of the number of shares the underwriters are obligated to purchase, which creates a syndicate short position. The short position may be either a covered short position or a naked short position. In a covered short position, the number of shares over-allotted by the underwriters is not greater than the number of shares that they may purchase in the over-allotment option. In a naked short position, the number of shares involved is greater than the number of shares in the over-allotment option. The underwriters may close out any covered short position by exercising their over-allotment option and/or purchasing shares in the open market; |
| • | syndicate covering transactions, which involve purchases of the common stock in the open market after the distribution has been completed in order to cover syndicate short positions. In determining the source of shares to close out the short position, the underwriters will consider, among other things, the price of shares available for purchase in the open market as compared to the price at which they may purchase shares through the over-allotment option. If the underwriters sell more shares than could be covered by the over-allotment option, a naked short position, the position can only be closed out by buying shares in the open market. A naked short position is more likely to be created if the underwriters are concerned that there could be downward pressure on the price of the shares in the open market after pricing that could adversely affect investors who purchase in this offering; and |
176
Table of Contents
Index to Financial Statements
| • | penalty bids, which permit the representatives to reclaim a selling concession from a syndicate member when the common stock originally sold by the syndicate member is purchased in a stabilizing or syndicate covering transaction to cover syndicate short positions. |
These stabilizing transactions, over-allotment transactions, syndicate covering transactions and penalty bids may have the effect of raising or maintaining the market price of our common stock or preventing or retarding a decline in the market price of the common stock. As a result, the price of our common stock may be higher than the price that might otherwise exist in the open market. These transactions may be effected on the NYSE or otherwise and, if commenced, may be discontinued at any time.
A prospectus in electronic format may be made available on the websites maintained by one or more of the underwriters or selling group members, if any, participating in this offering. The representatives may agree to allocate a number of shares to underwriters and selling group members for sale to their online brokerage account holders. Internet distributions will be allocated by the underwriters and selling group members that will make Internet distributions on the same basis as other allocations.
Directed Share Program
At our request, certain of the underwriters have reserved up to 10% of the common stock being offered by this prospectus (excluding any shares to be issued upon exercise of the over-allotment option) for sale at the initial public offering price to our directors, officers, employees, consultants, business associates and related persons associated with us. The sales will be made by RBC Capital Markets, LLC through a directed share program. We do not know if these persons will choose to purchase all or any portion of these reserved shares, but any purchases they do make will reduce the number of shares available to the general public. Any reserved shares which are not so purchased will be offered by the underwriters to the general public on the same basis as the other shares offered by this prospectus. Participants in the directed share program may be subject to a 180-day lockup with respect to any shares sold to them pursuant to that program. This lockup will have similar restrictions and an identical extension provision to the lockup agreements described above. Any shares sold in the directed share program to our directors or executive officers will also be subject to the lockup agreements described above. We have agreed to indemnify — and the underwriters in connection with the directed share program, including for the failure of any participant to pay for its shares.
177
Table of Contents
Index to Financial Statements
Selling Restrictions
European Economic Area
In relation to each member state of the European Economic Area which has implemented the Prospectus Directive (each, a “Relevant Member State”), including each Relevant Member State that has implemented the 2010 PD Amending Directive with regard to persons to whom an offer of securities is addressed and the denomination per unit of the offer of securities (each, an “Early Implementing Member State”), with effect from and including the date on which the Prospectus Directive is implemented in that Relevant Member State (the “Relevant Implementation Date”), no offer of shares will be made to the public in that Relevant Member State (other than offers (the “Permitted Public Offers”) where a prospectus will be published in relation to the shares that has been approved by the competent authority in a Relevant Member State or, where appropriate, approved in another Relevant Member State and notified to the competent authority in that Relevant Member State, all in accordance with the Prospectus Directive), except that with effect from and including that Relevant Implementation Date, offers of shares may be made to the public in that Relevant Member State at any time:
(a) to “qualified investors” as defined in the Prospectus Directive, including:
(i) (in the case of Relevant Member States other than Early Implementing Member States), legal entities which are authorized or regulated to operate in the financial markets or, if not so authorized or regulated, whose corporate purpose is solely to invest in securities, or any legal entity which has two or more of (i) an average of at least 250 employees during the last financial year; (ii) a total balance sheet of more than €43.0 million and (iii) an annual turnover of more than €50.0 million as shown in its last annual or consolidated accounts; or
(ii) (in the case of Early Implementing Member States), persons or entities that are described in points (1) to (4) of Section I of Annex II to Directive 2004/39/EC, and those who are treated on request as professional clients in accordance with Annex II to Directive 2004/39/EC, or recognized as eligible counterparties in accordance with Article 24 of Directive 2004/39/EC unless they have requested that they be treated as non-professional clients;
(b) to fewer than 100 (or, in the case of Early Implementing Member States, 150) natural or legal persons (other than “qualified investors” as defined in the Prospectus Directive), as permitted in the Prospectus Directive, subject to obtaining the prior consent of the representatives for any such offer; or
(c) in any other circumstances falling within Article 3(2) of the Prospectus Directive,
provided that no such offer of shares shall result in a requirement for the publication of a prospectus pursuant to Article 3 of the Prospectus Directive or of a supplement to a prospectus pursuant to Article 16 of the Prospectus Directive.
Each person in a Relevant Member State (other than a Relevant Member State where there is a Permitted Public Offer) who initially acquires any shares or to whom any offer is made will be deemed to have represented, acknowledged and agreed that (A) it is a “qualified investor”, and (B) in the case of any shares acquired by it as a financial intermediary, as that term is used in Article 3(2) of the Prospectus Directive, (x) the shares acquired by it in the offering have not been acquired on behalf of, nor have they been acquired with a view to their offer or resale to, persons in any Relevant Member State other than “qualified investors” as defined in the Prospectus Directive, or in circumstances in which the prior consent of the Subscribers has been given to the offer or resale, or (y) where shares have been acquired by it on behalf of persons in any Relevant Member State other than “qualified investors” as defined in the
178
Table of Contents
Index to Financial Statements
Prospectus Directive, the offer of those shares to it is not treated under the Prospectus Directive as having been made to such persons.
For the purpose of the above provisions, the expression “an offer to the public” in relation to any shares in any Relevant Member State means the communication in any form and by any means of sufficient information on the terms of the offer of any shares to be offered so as to enable an investor to decide to purchase any shares, as the same may be varied in the Relevant Member State by any measure implementing the Prospectus Directive in the Relevant Member State and the expression “Prospectus Directive” means Directive 2003/71 EC (including the 2010 PD Amending Directive, in the case of Early Implementing Member States) and includes any relevant implementing measure in each Relevant Member State and the expression “2010 PD Amending Directive” means Directive 2010/73/EU.
United Kingdom
This prospectus is only being distributed to, and is only directed at, persons in the United Kingdom that are qualified investors within the meaning of Article 2(1)(e) of the Prospectus Directive (“Qualified Investors”) that are also (i) investment professionals falling within Article 19(5) of the Financial Services and Markets Act 2000 (Financial Promotion) Order 2005 (the “Order”) or (ii) high net worth entities, and other persons to whom it may lawfully be communicated, falling within Article 49(2)(a) to (d) of the Order (all such persons together being referred to as “relevant persons”). This prospectus and its contents are confidential and should not be distributed, published or reproduced (in whole or in part) or disclosed by recipients to any other persons in the United Kingdom. Any person in the United Kingdom that is not a relevant persons should not act or rely on this document or any of its contents.
Switzerland
The shares may not be publicly offered in Switzerland and will not be listed on the SIX Swiss Exchange (“SIX”) or on any other stock exchange or regulated trading facility in Switzerland. This document has been prepared without regard to the disclosure standards for issuance prospectuses under art. 652a or art. 1156 of the Swiss Code of Obligations or the disclosure standards for listing prospectuses under art. 27 ff. of the SIX Listing Rules or the listing rules of any other stock exchange or regulated trading facility in Switzerland. Neither this document nor any other offering or marketing material relating to the shares or the offering may be publicly distributed or otherwise made publicly available in Switzerland.
Neither this document nor any other offering or marketing material relating to the offering, the Company, the shares have been or will be filed with or approved by any Swiss regulatory authority. In particular, this document will not be filed with, and the offer of shares will not be supervised by, the Swiss Financial Market Supervisory Authority FINMA, and the offer of shares has not been and will not be authorized under the Swiss Federal Act on Collective Investment Schemes (“CISA”). The investor protection afforded to acquirers of interests in collective investment schemes under the CISA does not extend to acquirers of shares.
179
Table of Contents
Index to Financial Statements
The validity of our common stock offered by this prospectus will be passed upon for Matador Resources Company by Haynes and Boone, LLP, Dallas, Texas. Certain legal matters in connection with this offering will be passed upon for the underwriters by Hunton & Williams LLP, Dallas, Texas.
The audited consolidated financial statements of Matador Resources Company and its subsidiaries for the years ended December 31, 2010 and 2009, and for each of the three years in the period ended December 31, 2010, included in this prospectus and elsewhere in the registration statement have been so included in reliance upon the report of Grant Thornton LLP, independent registered public accountants, upon the authority of said firm as experts in giving said report.
The estimates of proved reserves and future net revenue of Matador Resources Company at December 31, 2010 and 2009 and at March 31, 2011, have been audited by Netherland, Sewell & Associates, Inc., independent petroleum engineers, and such audit reports are included as exhibits to this prospectus. The estimates of proved reserves and future net revenue of Matador Resources Company at December 31, 2008, have been audited by LaRoche Petroleum Consultants, Ltd., independent petroleum engineers, and such audit reports are included as exhibits to this prospectus.
WHERE YOU CAN FIND MORE INFORMATION
We have filed with the SEC a registration statement on Form S-1 (including the exhibits, schedules and amendments thereto) under the Securities Act, with respect to the shares of our common stock offered hereby. This prospectus does not contain all of the information set forth in the registration statement and the exhibits and schedules thereto. For further information with respect to us and the common stock offered hereby, we refer you to the registration statement and the exhibits and schedules filed therewith. Statements contained in this prospectus as to the contents of any contract, agreement or any other document are summaries of the material terms of that contract, agreement or other document. With respect to each of these contracts, agreements or other documents filed as an exhibit to the registration statement, reference is made to the exhibits for a more complete description of the matter involved. A copy of the registration statement, and the exhibits and schedules thereto, may be inspected without charge at the public reference facilities maintained by the SEC at 100 F Street NE, Washington, D.C. 20549. Copies of these materials may be obtained, upon payment of a duplicating fee, from the Public Reference Section of the SEC at 100 F Street NE, Washington, D.C. 20549. Please call the SEC at 1-800-SEC-0330 for further information on the operation of the public reference facility. The SEC maintains a website that contains reports, proxy and information statements and other information regarding registrants that file electronically with the SEC. The address of the SEC’s website is http://www.sec.gov.
After we have completed this offering, we will file annual, quarterly and current reports, proxy statements and other information with the SEC. We expect to have an operational website concurrently with the completion of this offering and we expect to make our periodic reports and other information filed with or furnished to the SEC available, free of charge, through our website, as soon as reasonably practicable after those reports and other information are electronically filed with or furnished to the SEC. Information on our website or any other website is not incorporated by reference into this prospectus and does not
180
Table of Contents
Index to Financial Statements
constitute a part of this prospectus. You may read and copy any reports, statements or other information on file at the public reference rooms. You can also request copies of these documents, for a copying fee, by writing to the SEC, or you can review these documents on the SEC’s website, as described above. In addition, we will provide electronic or paper copies of our filings free of charge upon request.
181
Table of Contents
Index to Financial Statements
Matador Resources Company and Subsidiaries
CONSOLIDATED FINANCIAL STATEMENTS
December 31, 2010, 2009 and 2008
F-1
Table of Contents
Index to Financial Statements
Report of Independent Registered Public Accounting Firm
Board of Directors
Matador Resources Company
We have audited the accompanying consolidated balance sheets of Matador Resources Company (a Texas corporation) and subsidiaries (collectively, the “Company”) as of December 31, 2010 and 2009, and the related consolidated statements of operations, shareholders’ equity, and cash flows for each of the three years in the period ended December 31, 2010. These financial statements are the responsibility of the Company’s management. Our responsibility is to express an opinion on these financial statements based on our audits.
We conducted our audits in accordance with the standards of the Public Company Accounting Oversight Board (United States). Those standards require that we plan and perform the audit to obtain reasonable assurance about whether the financial statements are free of material misstatement. The Company is not required to have, nor were we engaged to perform, an audit of its internal control over financial reporting. Our audit included consideration of internal control over financial reporting as a basis for designing audit procedures that are appropriate in the circumstances, but not for the purpose of expressing an opinion on the effectiveness of the Company’s internal control over financial reporting. Accordingly, we express no such opinion. An audit also includes examining, on a test basis, evidence supporting the amounts and disclosures in the financial statements, assessing the accounting principles used and significant estimates made by management, as well as evaluating the overall financial statement presentation. We believe that our audits provide a reasonable basis for our opinion.
In our opinion, the consolidated financial statements referred to above present fairly, in all material respects, the financial position of Matador Resources Company and subsidiaries as of December 31, 2010 and 2009, and the results of their operations and their cash flows for each of the three years in the period ended December 31, 2010, in conformity with accounting principles generally accepted in the United States of America.
As discussed in Note B to the financial statements, the Company adopted new oil and gas reserves estimation and disclosure requirements as of December 31, 2009.
/s/ GRANT THORNTON LLP
Dallas, Texas
August 12, 2011
F-2
Table of Contents
Index to Financial Statements
Matador Resources Company and Subsidiaries
CONSOLIDATED BALANCE SHEETS
| December 31, | ||||||||
| 2010 | 2009 | |||||||
| ASSETS |
||||||||
| Current assets |
||||||||
| Cash and cash equivalents |
$ | 21,059,519 | $ | 104,229,709 | ||||
| Certificates of deposit |
2,349,313 | 15,675,346 | ||||||
| Accounts receivable |
||||||||
| Oil and natural gas revenues |
6,514,122 | 5,750,957 | ||||||
| Joint interest billings |
2,042,999 | 2,234,330 | ||||||
| Other |
3,091,372 | 3,277,535 | ||||||
| Derivative instruments |
4,144,411 | 1,005,685 | ||||||
| Lease and well equipment inventory |
1,423,197 | 1,818,514 | ||||||
| Prepaid expenses |
1,876,358 | 1,329,559 | ||||||
|
|
|
|
|
|||||
| Total current assets |
42,501,291 | 135,321,635 | ||||||
| Property and equipment, at cost |
||||||||
| Oil and natural gas properties, full-cost method |
||||||||
| Evaluated |
255,408,993 | 192,249,326 | ||||||
| Unproved and unevaluated |
172,451,449 | 59,814,546 | ||||||
| Other property and equipment |
14,035,010 | 12,474,215 | ||||||
| Less accumulated depletion, depreciation and amortization |
(138,014,986 | ) | (122,459,957 | ) | ||||
|
|
|
|
|
|||||
| Net property and equipment |
303,880,466 | 142,078,130 | ||||||
|
|
|
|
|
|||||
| Total assets |
$ | 346,381,757 | $ | 277,399,765 | ||||
|
|
|
|
|
|||||
| LIABILITIES AND SHAREHOLDERS’ EQUITY |
||||||||
| Current liabilities |
||||||||
| Accounts payable |
$ | 12,166,938 | $ | 2,049,361 | ||||
| Accrued liabilities |
14,658,546 | 5,206,444 | ||||||
| Royalties payable |
982,270 | 673,265 | ||||||
| Advances from joint interest owners |
722,843 | 450,000 | ||||||
| Deferred income taxes |
1,473,619 | 339,471 | ||||||
| Dividends payable — Class B |
68,713 | 68,713 | ||||||
| Other liabilities |
23,577 | 80,904 | ||||||
|
|
|
|
|
|||||
| Total current liabilities |
30,096,506 | 8,868,158 | ||||||
| Long-term liabilities |
||||||||
| Borrowings under Credit Agreement |
25,000,000 | – | ||||||
| Asset retirement obligations |
3,695,017 | 2,551,637 | ||||||
| Deferred income taxes |
5,432,638 | 1,635,003 | ||||||
| Other long-term liabilities |
280,453 | 23,577 | ||||||
|
|
|
|
|
|||||
| Total long-term liabilities |
34,408,108 | 4,210,217 | ||||||
| Commitments and contingencies (Note 12) |
||||||||
| Shareholders’ equity |
||||||||
| Common stock — Class A, $0.01 par value, 80,000,000 shares authorized; 42,749,820 and 40,443,018 shares issued; and 41,570,645 and 40,375,348 shares outstanding, respectively |
427,498 | 404,430 | ||||||
| Common stock — Class B, $0.01 par value, 2,000,000 shares authorized; 1,030,700 shares issued and outstanding |
10,307 | 10,307 | ||||||
| Additional paid-in capital |
263,341,642 | 241,663,512 | ||||||
| Retained earnings |
28,862,518 | 22,760,408 | ||||||
| Treasury stock, at cost, 1,179,175 and 67,670 shares, respectively |
(10,764,822 | ) | (517,267 | ) | ||||
|
|
|
|
|
|||||
| Total shareholders’ equity |
281,877,143 | 264,321,390 | ||||||
|
|
|
|
|
|||||
| Total liabilities and shareholders’ equity |
$ | 346,381,757 | $ | 277,399,765 | ||||
|
|
|
|
|
|||||
The accompanying notes are an integral part of these financial statements.
F-3
Table of Contents
Index to Financial Statements
Matador Resources Company and Subsidiaries
CONSOLIDATED STATEMENTS OF OPERATIONS
| For the years ended December 31, | ||||||||||||
| 2010 | 2009 | 2008 | ||||||||||
| Revenues |
||||||||||||
| Oil and natural gas revenues |
$ | 34,041,607 | $ | 19,038,514 | $ | 30,645,065 | ||||||
| Realized gain (loss) on derivatives |
5,299,380 | 7,625,120 | (1,325,970 | ) | ||||||||
| Unrealized gain (loss) on derivatives |
3,138,726 | (2,374,638 | ) | 3,591,928 | ||||||||
|
|
|
|
|
|
|
|||||||
| Total revenues |
42,479,713 | 24,288,996 | 32,911,023 | |||||||||
| Expenses |
||||||||||||
| Production taxes and marketing |
1,981,550 | 1,077,145 | 1,639,198 | |||||||||
| Lease operating |
5,284,362 | 4,725,022 | 4,666,591 | |||||||||
| Depletion, depreciation and amortization |
15,596,470 | 10,742,873 | 12,127,251 | |||||||||
| Accretion of asset retirement obligations |
154,756 | 137,347 | 91,157 | |||||||||
| Full-cost ceiling impairment |
– | 25,243,738 | 22,195,127 | |||||||||
| General and administrative |
9,701,850 | 7,115,118 | 8,252,319 | |||||||||
|
|
|
|
|
|
|
|||||||
| Total expenses |
32,718,988 | 49,041,243 | 48,971,643 | |||||||||
|
|
|
|
|
|
|
|||||||
| Operating income (loss) |
9,760,725 | (24,752,247 | ) | (16,060,620 | ) | |||||||
| Other income (expense) |
||||||||||||
| Net (loss) gain on asset sales and inventory impairment |
(223,690 | ) | (379,316 | ) | 136,977,430 | |||||||
| Interest expense |
(3,235 | ) | – | – | ||||||||
| Interest and other income |
364,338 | 781,072 | 2,984,273 | |||||||||
|
|
|
|
|
|
|
|||||||
| Total other income |
137,413 | 401,756 | 139,961,703 | |||||||||
|
|
|
|
|
|
|
|||||||
| Income (loss) before income taxes |
9,898,138 | (24,350,491 | ) | 123,901,083 | ||||||||
| Income tax provision (benefit) |
||||||||||||
| Current |
(1,410,608 | ) | (2,324,338 | ) | 10,448,000 | |||||||
| Deferred |
4,931,783 | (7,600,811 | ) | 9,575,286 | ||||||||
|
|
|
|
|
|
|
|||||||
| Total income tax provision (benefit) |
3,521,175 | (9,925,149 | ) | 20,023,286 | ||||||||
|
|
|
|
|
|
|
|||||||
| Net income (loss) |
$ | 6,376,963 | $ | (14,425,342 | ) | $ | 103,877,797 | |||||
|
|
|
|
|
|
|
|||||||
| Earnings (loss) per common share |
||||||||||||
| Basic |
||||||||||||
| Class A |
$ | 0.15 | $ | (0.37 | ) | $ | 2.50 | |||||
|
|
|
|
|
|
|
|||||||
| Class B |
$ | 0.42 | $ | (0.10 | ) | $ | 2.77 | |||||
|
|
|
|
|
|
|
|||||||
| Diluted |
||||||||||||
| Class A |
$ | 0.15 | $ | (0.37 | ) | $ | 2.46 | |||||
|
|
|
|
|
|
|
|||||||
| Class B |
$ | 0.42 | $ | (0.10 | ) | $ | 2.73 | |||||
|
|
|
|
|
|
|
|||||||
| Weighted average common shares outstanding |
||||||||||||
| Basic |
||||||||||||
| Class A |
40,006,787 | 39,092,567 | 40,354,618 | |||||||||
| Class B |
1,030,700 | 1,030,700 | 1,030,700 | |||||||||
|
|
|
|
|
|
|
|||||||
| Total |
41,037,487 | 40,123,267 | 41,385,318 | |||||||||
|
|
|
|
|
|
|
|||||||
| Diluted |
||||||||||||
| Class A |
40,102,927 | 39,092,567 | 41,127,339 | |||||||||
| Class B |
1,030,700 | 1,030,700 | 1,030,700 | |||||||||
|
|
|
|
|
|
|
|||||||
| Total |
41,133,627 | 40,123,267 | 42,158,039 | |||||||||
|
|
|
|
|
|
|
|||||||
The accompanying notes are an integral part of these financial statements.
F-4
Table of Contents
Index to Financial Statements
Matador Resources Company and Subsidiaries
CONSOLIDATED STATEMENTS OF SHAREHOLDERS’ EQUITY
For the years ended December 31, 2010, 2009 and 2008
| Common stock | Additional paid-in capital |
Retained earnings (deficit) |
Total | |||||||||||||||||||||||||||||||||
| Class A | Class B | Treasury stock | ||||||||||||||||||||||||||||||||||
| Shares | Amount | Shares | Amount | Shares | Amount | |||||||||||||||||||||||||||||||
| Balance at January 1, 2008 |
40,303,537 | $ | 403,035 | 1,030,700 | $ | 10,307 | $ | 236,728,584 | $ | (65,076,243 | ) | (18,948 | ) | $ | (23,155 | ) | $ | 172,042,528 | ||||||||||||||||||
| Additional cost to issue equity |
– | – | – | – | (40 | ) | – | – | – | (40 | ) | |||||||||||||||||||||||||
| Stock options granted |
– | – | – | – | 528,480 | – | – | – | 528,480 | |||||||||||||||||||||||||||
| Stock options exercised |
235,500 | 2,355 | – | – | 1,046,145 | – | – | – | 1,048,500 | |||||||||||||||||||||||||||
| Restricted stock issued |
9,000 | 90 | – | – | (90 | ) | – | – | – | – | ||||||||||||||||||||||||||
| Restricted stock vested |
– | – | – | – | 60,000 | – | – | – | 60,000 | |||||||||||||||||||||||||||
| Class B dividends declared |
– | – | – | – | – | (274,853 | ) | – | – | (274,853 | ) | |||||||||||||||||||||||||
| Current period net income |
– | – | – | – | – | 103,877,797 | – | – | 103,877,797 | |||||||||||||||||||||||||||
| Issuance of treasury stock |
– | – | – | – | 50,890 | – | 5,775 | 26,110 | 77,000 | |||||||||||||||||||||||||||
| Purchase of treasury stock |
– | – | – | – | – | – | (26,700 | ) | (354,500 | ) | (354,500 | ) | ||||||||||||||||||||||||
|
|
|
|
|
|
|
|
|
|
|
|
|
|
|
|
|
|
|
|||||||||||||||||||
| Balance at December 31, 2008 |
40,548,037 | 405,480 | 1,030,700 | 10,307 | 238,413,969 | 38,526,701 | (39,873 | ) | (351,545 | ) | 277,004,912 | |||||||||||||||||||||||||
| Issuance of Class A common stock |
4,974,194 | 49,742 | – | – | 28,201,626 | – | – | – | 28,251,368 | |||||||||||||||||||||||||||
| Additional cost to issue equity |
– | – | – | – | (92,549 | ) | – | – | – | (92,549 | ) | |||||||||||||||||||||||||
| Repurchase and retirement of Class A common stock |
(5,422,713 | ) | (54,227 | ) | – | – | (26,686,133 | ) | (373,205 | ) | – | – | (27,113,565 | ) | ||||||||||||||||||||||
| Stock options granted |
– | – | – | – | 592,962 | – | – | – | 592,962 | |||||||||||||||||||||||||||
| Stock options exercised |
343,500 | 3,435 | – | – | 1,278,065 | – | – | – | 1,281,500 | |||||||||||||||||||||||||||
| Restricted stock vested |
– | – | – | – | 33,750 | – | – | – | 33,750 | |||||||||||||||||||||||||||
| Class B dividends declared |
– | – | – | – | – | (274,853 | ) | – | – | (274,853 | ) | |||||||||||||||||||||||||
| Current period net loss |
– | – | – | – | – | (14,425,342 | ) | – | – | (14,425,342 | ) | |||||||||||||||||||||||||
| Issuance of treasury stock |
– | – | – | – | (78,178 | ) | (692,893 | ) | 652,126 | 4,787,678 | 4,016,607 | |||||||||||||||||||||||||
| Purchase of treasury stock |
– | – | – | – | – | – | (679,923 | ) | (4,953,400 | ) | (4,953,400 | ) | ||||||||||||||||||||||||
|
|
|
|
|
|
|
|
|
|
|
|
|
|
|
|
|
|
|
|||||||||||||||||||
| Balance at December 31, 2009 |
40,443,018 | 404,430 | 1,030,700 | 10,307 | 241,663,512 | 22,760,408 | (67,670 | ) | (517,267 | ) | 264,321,390 | |||||||||||||||||||||||||
| Issuance of Class A common stock |
1,879,427 | 18,794 | – | – | 20,632,903 | – | – | – | 20,651,697 | |||||||||||||||||||||||||||
| Additional cost to issue equity |
– | – | – | – | (531,152 | ) | – | – | – | (531,152 | ) | |||||||||||||||||||||||||
| Issuance of Class A common stock to Board members |
20,000 | 200 | – | – | 197,800 | – | – | – | 198,000 | |||||||||||||||||||||||||||
| Stock options granted |
– | – | – | – | 414,610 | – | – | – | 414,610 | |||||||||||||||||||||||||||
| Stock options exercised |
392,375 | 3,924 | – | – | 1,974,451 | – | – | – | 1,978,375 | |||||||||||||||||||||||||||
| Stock options modified |
– | – | – | – | (1,086,271 | ) | – | – | – | (1,086,271 | ) | |||||||||||||||||||||||||
| Restricted stock issued |
15,000 | 150 | – | – | (150 | ) | – | – | – | – | ||||||||||||||||||||||||||
| Restricted stock vested |
– | – | – | – | 73,689 | – | – | – | 73,689 | |||||||||||||||||||||||||||
| Class B dividends declared |
– | – | – | – | – | (274,853 | ) | – | – | (274,853 | ) | |||||||||||||||||||||||||
| Current period net income |
– | – | – | – | – | 6,376,963 | – | – | 6,376,963 | |||||||||||||||||||||||||||
| Issuance of treasury stock |
– | – | – | – | 2,250 | – | 6,000 | 45,000 | 47,250 | |||||||||||||||||||||||||||
| Purchase of treasury stock |
– | – | – | – | – | – | (1,117,505 | ) | (10,292,555 | ) | (10,292,555 | ) | ||||||||||||||||||||||||
|
|
|
|
|
|
|
|
|
|
|
|
|
|
|
|
|
|
|
|||||||||||||||||||
| Balance at December 31, 2010 |
42,749,820 | $ | 427,498 | 1,030,700 | $ | 10,307 | $ | 263,341,642 | $ | 28,862,518 | (1,179,175 | ) | $ | (10,764,822 | ) | $ | 281,877,143 | |||||||||||||||||||
|
|
|
|
|
|
|
|
|
|
|
|
|
|
|
|
|
|
|
|||||||||||||||||||
The accompanying notes are an integral part of these financial statements.
F-5
Table of Contents
Index to Financial Statements
Matador Resources Company and Subsidiaries
CONSOLIDATED STATEMENTS OF CASH FLOWS
| For the years ended December 31, | ||||||||||||
| 2010 | 2009 | 2008 | ||||||||||
| Operating activities |
||||||||||||
| Net income (loss) |
$ | 6,376,963 | $ | (14,425,342 | ) | $ | 103,877,797 | |||||
| Adjustments to reconcile net income (loss) to net cash provided by operating activities |
||||||||||||
| Unrealized (gain) loss on derivatives |
(3,138,726 | ) | 2,374,638 | (3,591,928 | ) | |||||||
| Depletion, depreciation and amortization |
15,596,470 | 10,742,873 | 12,127,251 | |||||||||
| Accretion of asset retirement obligations |
154,756 | 137,347 | 91,157 | |||||||||
| Full-cost ceiling impairment |
– | 25,243,738 | 22,195,127 | |||||||||
| Stock option and grant expense |
824,048 | 622,337 | 605,480 | |||||||||
| Restricted stock grants |
73,689 | 33,750 | 60,000 | |||||||||
| Deferred income tax provision |
4,931,783 | (7,600,811 | ) | 9,575,286 | ||||||||
| Loss (gain) on asset sales and inventory impairment |
223,690 | 379,316 | (136,977,430 | ) | ||||||||
| Changes in operating assets and liabilities |
||||||||||||
| Accounts receivable |
(385,671 | ) | 408,710 | (7,136,855 | ) | |||||||
| Lease and well equipment inventory |
(8,078 | ) | (799,844 | ) | (607,460 | ) | ||||||
| Prepaid expenses |
(546,799 | ) | (153,206 | ) | (416,795 | ) | ||||||
| Accounts payable, accrued liabilities and other liabilities |
2,487,643 | (15,463,066 | ) | 26,010,659 | ||||||||
| Royalties payable |
309,005 | 35,763 | (60,100 | ) | ||||||||
| Advances from joint interest owners |
272,843 | 450,000 | – | |||||||||
| State income tax payable |
– | (48,000 | ) | 48,000 | ||||||||
| Other long-term liabilities |
101,423 | (147,155 | ) | 50,608 | ||||||||
|
|
|
|
|
|
|
|||||||
| Net cash provided by operating activities |
27,273,039 | 1,791,048 | 25,850,797 | |||||||||
| Investing activities |
||||||||||||
| Proceeds from sale of oil and natural gas properties |
– | 28,732 | 185,468,400 | |||||||||
| Oil and natural gas properties capital expenditures |
(159,050,066 | ) | (54,243,838 | ) | (104,118,639 | ) | ||||||
| Expenditures for other property and equipment |
(1,609,882 | ) | (306,642 | ) | (3,011,869 | ) | ||||||
| Purchases of certificates of deposit |
(3,739,000 | ) | (15,500,424 | ) | (20,781,934 | ) | ||||||
| Sales of certificates of deposit |
17,065,033 | 20,607,012 | – | |||||||||
| Sales of short-term investments |
– | – | 57,925,000 | |||||||||
|
|
|
|
|
|
|
|||||||
| Net cash (used in) provided by investing activities |
(147,333,915 | ) | (49,415,160 | ) | 115,480,958 | |||||||
| Financing activities |
||||||||||||
| Borrowings under Credit Agreement |
25,000,000 | – | – | |||||||||
| Proceeds from issuance of common stock, net of cost to issue equity |
20,479,719 | 28,158,819 | (40 | ) | ||||||||
| Proceeds from stock options exercised |
1,978,375 | 1,281,500 | 1,048,500 | |||||||||
| Payment of dividends — Class B |
(274,853 | ) | (274,853 | ) | (274,853 | ) | ||||||
| Repurchase and retirement of Class A common stock |
– | (27,113,565 | ) | – | ||||||||
| Issuance of treasury stock |
– | 3,987,231 | – | |||||||||
| Purchase of treasury stock |
(10,292,555 | ) | (4,953,400 | ) | (354,500 | ) | ||||||
|
|
|
|
|
|
|
|||||||
| Net cash provided by financing activities |
36,890,686 | 1,085,732 | 419,107 | |||||||||
|
|
|
|
|
|
|
|||||||
| (Decrease) increase in cash and cash equivalents |
$ | (83,170,190 | ) | $ | (46,538,380 | ) | $ | 141,750,862 | ||||
| Cash and cash equivalents at beginning of year |
104,229,709 | 150,768,089 | 9,017,227 | |||||||||
|
|
|
|
|
|
|
|||||||
| Cash and cash equivalents at end of year |
$ | 21,059,519 | $ | 104,229,709 | $ | 150,768,089 | ||||||
|
|
|
|
|
|
|
|||||||
Supplemental disclosures of cash flow information (Note 14)
The accompanying notes are an integral part of these financial statements.
F-6
Table of Contents
Index to Financial Statements
Matador Resources Company and Subsidiaries
NOTES TO CONSOLIDATED FINANCIAL STATEMENTS
December 31, 2010, 2009 and 2008
NOTE 1 — NATURE OF OPERATIONS
Matador Resources Company (“Matador” or “Company”) is an independent energy company engaged in the exploration, development, acquisition and production of oil and natural gas resources in the United States, with a particular emphasis on oil and natural gas shale plays and other unconventional resources. Matador’s current operations are located primarily in the Haynesville shale play in north Louisiana and east Texas and the Eagle Ford shale play in south Texas; these plays are key elements of the Company’s growth strategy. In addition to these primary operating areas, Matador has significant acreage positions in southeast New Mexico and west Texas and in southwest Wyoming and adjacent areas in Utah and Idaho where the Company continues to identify new oil and natural gas prospects.
Matador was founded on July 3, 2003 as a Texas corporation. Two equity investors contributed $6,000,000 for 900,000 shares of Matador Class B common stock on July 31, 2003, providing the Company’s initial capitalization. At December 31, 2010, Matador has issued 42,749,820 shares of Class A common stock and 1,030,700 shares of Class B common stock to qualified investors, which has resulted in net proceeds of $261,233,910. Matador holds the primary assets of the Company while its wholly owned subsidiary, Matador Production Company, serves as the operating entity.
In February 2006, the Company formed a wholly owned subsidiary, Longwood Gathering and Disposal Systems GP, Inc., for the business purpose of serving as the general partner of Longwood Gathering and Disposal Systems, LP. Longwood Gathering and Disposal Systems, LP was formed for the business purpose of owning and operating a majority of the pipeline systems and salt water disposal wells used in the Company’s operations, as well as to transport third-party natural gas.
In October 2006, the Company formed a wholly owned subsidiary, MRC Permian Company, via a merger, for the business purpose of establishing and conducting oil and natural gas exploration and development activities in southeast New Mexico.
In January 2009, the Company formed a wholly owned subsidiary, MRC Rockies Company, for the business purpose of establishing and conducting oil and natural gas exploration and development activities in the Rocky Mountains and specifically in the states of Wyoming, Utah and Idaho.
On November 22, 2010, Matador Resources Company formed a wholly-owned subsidiary, Matador Holdco, Inc. Pursuant to the terms of the corporate reorganization that was completed on August 9, 2011, Matador Resources Company changed its corporate name to MRC Energy Company and Matador Holdco, Inc. changed its corporate name to Matador Resources Company. As a part of this reorganization, MRC Energy Company became a wholly owned subsidiary of Matador Resources Company.
NOTE 2 — SUMMARY OF SIGNIFICANT ACCOUNTING POLICIES
Basis of Presentation
The consolidated financial statements include the accounts of Matador Resources Company and its four wholly owned subsidiaries, Matador Production Company, Longwood Gathering and Disposal Systems
F-7
Table of Contents
Index to Financial Statements
Matador Resources Company and Subsidiaries
NOTES TO CONSOLIDATED FINANCIAL STATEMENTS — CONTINUED
December 31, 2010, 2009 and 2008
NOTE 2 — SUMMARY OF SIGNIFICANT ACCOUNTING POLICIES — Continued
GP, Inc., MRC Permian Company and MRC Rockies Company, as well as the accounts of Longwood Gathering and Disposal Systems, LP. These consolidated financial statements have been prepared in accordance with generally accepted accounting principles in the United States of America (“U.S. GAAP”). The Company’s operations are conducted in the one segment generally referred to as the oil and natural gas exploration and production industry. All significant intercompany balances and transactions have been eliminated in consolidation.
Use of Estimates
The preparation of financial statements in conformity with U.S. GAAP requires management to make estimates and assumptions that affect the amounts reported in the financial statements and accompanying notes. These estimates and assumptions may also affect disclosure of contingent assets and liabilities at the date of the financial statements and the reported amounts of revenues and expenses during the reporting period. While the Company believes its estimates are reasonable, changes in facts and assumptions or the discovery of new information may result in revised estimates. Actual results could differ from these estimates.
The Company’s consolidated financial statements are based on a number of significant estimates, including oil and natural gas revenues, accrued assets and liabilities, stock-based compensation, valuation of derivative instruments and oil and natural gas reserves. The estimates of oil and natural gas reserves quantities and future net cash flows are the basis for the calculations of depletion and impairment of oil and natural gas properties, as well as estimates of asset retirement obligations and certain tax accruals. The Company’s oil and natural gas reserves estimates, which are inherently imprecise and based upon many factors that are beyond the Company’s control, including oil and natural gas prices, are prepared by the Company’s engineering staff in accordance with guidelines established by the Securities and Exchange Commission (“SEC”) and then audited for their reasonableness and conformance with SEC guidelines and generally accepted petroleum engineering and evaluation principles by independent outside petroleum engineers.
Cash and Cash Equivalents
The Company considers all highly liquid investments with an original maturity of thirty (30) days or less as cash equivalents, and cash equivalents are recorded at market. Except for small cash balances held in the Company’s operating accounts to conduct its ongoing business, the remainder of the Company’s cash equivalents at December 31, 2010 and 2009 was held in money market accounts composed of United States Treasury securities offering daily liquidity.
Certificates of Deposit
Certificates of deposit (“CDs”) are highly liquid, short-term investments with an original maturity of more than 30 days but not more than one year. Each CD is recorded at market and is fully insured by the Federal Deposit Insurance Corporation.
F-8
Table of Contents
Index to Financial Statements
Matador Resources Company and Subsidiaries
NOTES TO CONSOLIDATED FINANCIAL STATEMENTS — CONTINUED
December 31, 2010, 2009 and 2008
NOTE 2 — SUMMARY OF SIGNIFICANT ACCOUNTING POLICIES — Continued
Accounts Receivable
The Company sells its operated oil and natural gas production to various purchasers (see Note 13). Due to the nature of the markets for oil and natural gas, the Company does not believe that the loss of any one purchaser would significantly impact operations. In addition, the Company may participate with industry partners in the drilling, completion and operation of oil and natural gas wells. Substantially all of the Company’s accounts receivable are due from either purchasers of oil and natural gas or participants in oil and natural gas wells for which the Company serves as the operator. Accounts receivable are due within 30 to 45 days of the production or billing date and are stated at amounts due from purchasers and industry partners.
The Company reviews its need for an allowance for doubtful accounts on a periodic basis, and determines the allowance, if any, by considering the length of time past due, previous loss history, future net revenues of the debtor’s ownership interest in oil and natural gas properties operated by the Company and the debtor’s ability to pay its obligations, among other things. The Company has no allowance for doubtful accounts related to its accounts receivable for any reporting period presented.
During 2008, the Company wrote off a portion of its oil sales receivable totaling $223,770 from certain non-operated properties in Lea County, New Mexico as a result of SemCrude, L.P. and several of its subsidiaries and related entities filing for a Petition of Relief under Chapter 11 of the United States Bankruptcy Code in the United States Bankruptcy Court for the District of Delaware. The operators of these properties filed claims in the bankruptcy proceeding on behalf of their operating partners (including Matador), and in 2010, the Company received a partial recovery of $124,635 resulting from these claims. The Company did not write off any receivables in 2010 or 2009. When necessary, the Company accounts for a write off by recording the loss as an offset against accounts receivable once the specific account has been determined to be uncollectible.
Lease and Well Equipment Inventory
Lease and well equipment inventory is stated at the lower of cost or market and consists entirely of equipment scheduled for use in future well operations or equipment held for sale.
Property and Equipment
The Company uses the full-cost method of accounting for its investments in oil and natural gas properties. Under this method of accounting, all costs associated with the acquisition, exploration and development of oil and natural gas properties and reserves, including unproved and unevaluated property costs, are capitalized as incurred. Internal costs are capitalized only to the extent they are directly related to acquisition, exploration, or development activities and do not include any costs related to production, selling or general corporate administrative activities. The Company capitalized $1,604,682, $1,642,868 and $1,679,992 of these internal costs in 2010, 2009 and 2008, respectively.
If the net capitalized costs of evaluated oil and natural gas properties less related deferred income taxes exceed the estimated present value of after-tax future net cash flows from proved oil and natural gas
F-9
Table of Contents
Index to Financial Statements
Matador Resources Company and Subsidiaries
NOTES TO CONSOLIDATED FINANCIAL STATEMENTS — CONTINUED
December 31, 2010, 2009 and 2008
NOTE 2 — SUMMARY OF SIGNIFICANT ACCOUNTING POLICIES — Continued
reserves, discounted at 10%, such excess is charged to operations as a full-cost ceiling impairment. A discount factor of 10% is used for purposes of computing the full-cost ceiling in accordance with SEC guidelines. The present value at 10% discount of future after-tax net cash flows is not intended to represent the replacement cost or fair market value of the Company’s oil and natural gas properties.
The estimated present value of after-tax future net cash flows from proved oil and natural gas reserves is highly dependent on the commodity prices used in these estimates. These estimates are determined in accordance with guidelines established by the SEC for estimating and reporting oil and natural gas reserves. Under these guidelines, oil and natural gas reserves are estimated using then-current operating and economic conditions, with no provision for price and cost escalations in future periods except by contractual arrangements. In January 2009, the SEC issued The Modernization of Oil and Gas Reporting, Final Rule and in January 2010, the Financial Accounting Standards Board (“FASB”) amended Topic 932, Extractive Activities — Oil and Gas to align with this rule. As a result, beginning December 31, 2009, the commodity prices used to estimate oil and natural gas reserves are based on unweighted, arithmetic averages of first-day-of-the-month oil and natural gas prices for the previous 12-month period. For the period January through December 2010, these average oil and natural gas prices were $75.96 per barrel and $4.376 per MMBtu (million British thermal units), respectively. For the period January through December 2009, these average oil and natural gas prices were $57.65 per barrel and $3.866 per MMBtu, respectively. In estimating the present value of after-tax future net cash flows from proved oil and natural gas reserves, the average oil prices were further adjusted by property for quality, transportation fees and regional price differentials, and the average natural gas prices were further adjusted by property for energy content, transportation fees and regional price differentials.
Using the average commodity prices, as further adjusted, for 2010 to determine the Company’s estimated proved oil and natural gas reserves at December 31, 2010, the Company’s net capitalized costs less related deferred income taxes did not exceed the full-cost ceiling. As a result, the Company recorded no impairment to its net capitalized costs and no corresponding charge to its consolidated statement of operations for 2010. Changes in oil and natural gas production rates, reserves estimates, future development costs, and other factors will determine the Company’s actual ceiling test computation and impairment analyses in future periods.
Using the average commodity prices, as further adjusted, for 2009 to determine the Company’s estimated proved oil and natural gas reserves at December 31, 2009, the Company’s net capitalized costs less related deferred income taxes exceeded the full-cost ceiling by $16,267,822. The Company recorded an impairment charge of $25,243,738 to its net capitalized costs and a deferred income tax credit of $8,975,916 related to the full-cost ceiling limitation for 2009. Corresponding charges were also recorded to the Company’s consolidated statement of operations for 2009.
Prior to 2009, SEC guidelines for estimating and reporting oil and natural gas reserves required using commodity prices at the last day of the year. For 2008, these year-end oil and natural gas prices were $41.00 per barrel and $5.71 per MMBtu, respectively. The average oil price was further adjusted by property for quality, transportation fees and regional price differentials, and the average natural gas price was further adjusted by
F-10
Table of Contents
Index to Financial Statements
Matador Resources Company and Subsidiaries
NOTES TO CONSOLIDATED FINANCIAL STATEMENTS — CONTINUED
December 31, 2010, 2009 and 2008
NOTE 2 — SUMMARY OF SIGNIFICANT ACCOUNTING POLICIES — Continued
property for energy content, transportation fees and regional price differentials. Using these commodity prices, as further adjusted, for 2008 to determine the Company’s estimated proved oil and natural gas reserves at December 31, 2008, the Company’s net capitalized costs less related deferred income taxes exceeded the full-cost ceiling by $14,303,206. The Company recorded an impairment charge of $22,195,127 to its net capitalized costs and a deferred income tax credit of $7,891,921 related to the full-cost ceiling limitation for 2008. Corresponding charges were also recorded to the Company’s consolidated statement of operations for 2008.
As a non-cash item, the full-cost ceiling impairment impacts the accumulated depletion and the net carrying value of the Company’s assets on its balance sheet, as well as the corresponding shareholders’ equity, but it has no impact on the Company’s net cash flows as reported.
Capitalized costs of oil and natural gas properties are amortized using the unit-of-production method based upon production and estimates of proved reserves quantities. Unproved and unevaluated property costs are excluded from the amortization base used to determine depletion. Unproved and unevaluated properties are assessed for possible impairment on a periodic basis based upon changes in operating or economic conditions. This assessment includes consideration of the following factors, among others: the assignment of proved reserves, geological and geophysical evaluations, intent to drill, remaining lease term, and drilling activity and results. Upon impairment, the costs of the unproved and unevaluated properties are immediately included in the amortization base. Exploratory dry holes are included in the amortization base immediately upon determination that the well is not productive.
Sales of oil and natural gas properties are accounted for as adjustments to net capitalized costs with no gain or loss recognized, unless such adjustments would significantly alter the relationship between net capitalized costs and proved reserves of oil and natural gas. All costs related to production activities and maintenance and repairs are expensed as incurred. Significant workovers that increase the properties’ reserves are capitalized.
Other property and equipment are stated at cost. Computer equipment, furniture, software and other equipment are depreciated over their useful life (5 to 7 years) using the straight-line method. Support equipment and facilities include the pipelines and salt water disposal systems owned by Longwood Gathering and Disposal Systems, LP and are depreciated over a 30-year useful life using the straight-line, mid-month convention method. Leasehold improvements are depreciated over the lesser of their useful life or the term of the lease.
Asset Retirement Obligations
The Company recognizes the fair value of an asset retirement obligation in the period in which it is incurred if a reasonable estimate of fair value can be made. The asset retirement obligation is recorded as a liability at its estimated present value, with an offsetting increase recognized in oil and natural gas properties or support equipment and facilities on the balance sheet. Periodic accretion of the discounted value of the estimated liability is recorded as an expense in the consolidated statement of operations. In general, the Company’s future asset retirement obligations relate to future costs associated with plugging and abandonment of its oil and natural gas wells, removal of equipment and facilities from leased acreage
F-11
Table of Contents
Index to Financial Statements
Matador Resources Company and Subsidiaries
NOTES TO CONSOLIDATED FINANCIAL STATEMENTS — CONTINUED
December 31, 2010, 2009 and 2008
NOTE 2 — SUMMARY OF SIGNIFICANT ACCOUNTING POLICIES — Continued
and returning such land to its original condition. The amounts recognized are based on numerous estimates and assumptions, including future retirement costs, future recoverable quantities of oil and natural gas, future inflation rates and the credit-adjusted risk-free interest rate. Revisions to the liability can occur due to changes in its estimate or if federal or state regulators enact new plugging and abandonment requirements. At the time of actual plugging and abandonment of its oil and natural gas wells, the Company includes any gain or loss associated with the operation in the amortization base to the extent that the actual costs are different from the estimated liability.
Derivative Financial Instruments
From time to time, the Company uses derivative financial instruments to hedge its exposure to commodity price risk associated with natural gas prices. These instruments consist of put and call options in the form of costless collars. The Company’s derivative financial instruments are recorded on the balance sheet as either an asset or a liability measured at fair value. The Company has elected not to apply hedge accounting for its existing derivative financial instruments, and as a result, the Company recognizes the change in derivative fair value between reporting periods currently in its consolidated statement of operations (see Note 10). The fair value of the Company’s derivative financial instruments is determined based on its counterparty’s valuation model, which the Company verifies for its reasonableness with an independent third-party valuation using observable, market-corroborated inputs.
Revenue Recognition
The Company follows the sales method of accounting for its oil and natural gas revenue, whereby it recognizes revenue, net of royalties, on all oil or natural gas sold to purchasers regardless of whether the sales are proportionate to its ownership in the property. Under this method, revenue is recognized at the time oil and natural gas are produced and sold, and the Company accrues for revenue earned but not yet received.
Stock-Based Compensation
Non-qualified stock option expense is recognized in the Company’s consolidated statement of operations on the date of grant. Incentive stock options vest over four years, and the associated compensation expense is recognized on a straight-line basis over the vesting period. Prior to November 22, 2010, all of the Company’s outstanding stock options were classified as equity instruments, with all stock-based compensation expense measured on the date of grant and recognized over the vesting period, if any. On November 22, 2010, the Company changed its method of accounting for outstanding stock options, reclassifying all outstanding stock options from equity to liability instruments. This change was made as a result of the Company purchasing shares from certain of its employees to assist them in the exercise of outstanding options of the Company’s Class A common stock. As a result, at December 31, 2010, the Company measured and recognized the fair value of the liability associated with its outstanding stock options using an estimated fair value for the Company’s Class A common stock.
The Company’s consolidated statements of operations for the years ended December 31, 2010, 2009 and 2008 include a stock-based compensation (non-cash) expense of $897,737, $656,087 and $665,480,
F-12
Table of Contents
Index to Financial Statements
Matador Resources Company and Subsidiaries
NOTES TO CONSOLIDATED FINANCIAL STATEMENTS — CONTINUED
December 31, 2010, 2009 and 2008
NOTE 2 — SUMMARY OF SIGNIFICANT ACCOUNTING POLICIES — Continued
respectively. This stock-based compensation expense includes common stock and treasury stock issuances totaling $245,250, $29,375 and $77,000 in 2010, 2009 and 2008, respectively, paid to members of the Board of Directors and advisors as compensation for their services to the Company.
Income Taxes
The Company accounts for income taxes using the asset and liability approach for financial accounting and reporting. The Company evaluates the probability of realizing the future benefits of its deferred tax assets and provides a valuation allowance for the portion of any deferred tax assets where the likelihood of realizing an income tax benefit in the future does not meet the more likely than not criteria for recognition.
At January 1, 2008, the Company adopted the accounting guidance related to accounting for uncertainty in income taxes which provides for the financial statement benefit of a tax position as being recognized only after determining that the relevant tax authority would more likely than not sustain the position following an audit. For tax positions meeting the more-likely-than-not threshold, the amount recognized in the financial statements is the benefit that has a greater than 50 percent likelihood of being realized upon ultimate settlement with the relevant tax authority. Following adoption, the Company evaluated all tax positions for which the statute of limitations remained open, and management believes that the material positions taken by the Company would more likely than not be sustained by examination. The Company does not expect any change in unrecognized tax benefits in the next 12 months.
When necessary, the Company would include interest assessed by taxing authorities in “Interest expense” and penalties related to income taxes in “Other expense” on its consolidated statements of operations. At December 31, 2010, 2009 and 2008, the Company did not record any interest or penalties related to income tax.
Earnings Per Common Share
The Company reports basic earnings per common share, which excludes the effect of potentially dilutive securities, and diluted earnings per common shares, which includes the effect of all potentially dilutive securities, unless their impact is anti-dilutive. The Company has issued two classes of common stock, Class A and Class B. The holders of the Class B shares are entitled to be paid cumulative dividends at a per share rate of $0.26-2/3 annually out of funds legally available for the payment of dividends. These dividends are accrued and paid quarterly. Dividends declared during 2010, 2009 and 2008 totaled $274,853 in each year. The holders of the Class B shares are also entitled to share on an equivalent basis in any dividends paid to holders of the Class A shares when and as declared by the Board of Directors. At December 31, 2010, the Company had not paid any dividends to holders of the Class A shares.
F-13
Table of Contents
Index to Financial Statements
Matador Resources Company and Subsidiaries
NOTES TO CONSOLIDATED FINANCIAL STATEMENTS — CONTINUED
December 31, 2010, 2009 and 2008
NOTE 2 — SUMMARY OF SIGNIFICANT ACCOUNTING POLICIES — Continued
The following are reconciliations of the numerators and denominators used to compute the Company’s basic and diluted distributed and undistributed earnings per common share as reported for the years ended December 31, 2010, 2009 and 2008.
| Year ended December 31, | ||||||||||||
| 2010 | 2009 | 2008 | ||||||||||
| Net income (loss) — numerator |
||||||||||||
| Net income (loss) |
$ | 6,376,963 | $ | (14,425,342 | ) | $ | 103,877,797 | |||||
| Less dividends to Class B shareholders — distributed earnings |
(274,853 | ) | (274,853 | ) | (274,853 | ) | ||||||
|
|
|
|
|
|
|
|||||||
| Undistributed earnings |
$ | 6,102,110 | $ | (14,700,195 | ) | $ | 103,602,944 | |||||
|
|
|
|
|
|
|
|||||||
| Weighted average common shares outstanding — denominator |
||||||||||||
| Basic |
||||||||||||
| Class A |
40,006,787 | 39,092,567 | 40,354,618 | |||||||||
| Class B |
1,030,700 | 1,030,700 | 1,030,700 | |||||||||
|
|
|
|
|
|
|
|||||||
| Total |
41,037,487 | 40,123,267 | 41,385,318 | |||||||||
|
|
|
|
|
|
|
|||||||
| Diluted |
||||||||||||
| Class A |
||||||||||||
| Weighted average common shares outstanding for basic earnings per share |
40,006,787 | 39,092,567 | 40,354,618 | |||||||||
| Dilutive effect of options |
96,140 | – | 772,721 | |||||||||
|
|
|
|
|
|
|
|||||||
| Class A weighted average common shares outstanding — diluted |
41,102,927 | 39,092,567 | 41,127,339 | |||||||||
| Class B |
||||||||||||
| Weighted average common shares outstanding — no associated dilutive shares |
1,030,700 | 1,030,700 | 1,030,700 | |||||||||
|
|
|
|
|
|
|
|||||||
| Total diluted weighted average common shares outstanding |
41,133,627 | 40,123,267 | 42,158,039 | |||||||||
|
|
|
|
|
|
|
|||||||
F-14
Table of Contents
Index to Financial Statements
Matador Resources Company and Subsidiaries
NOTES TO CONSOLIDATED FINANCIAL STATEMENTS — CONTINUED
December 31, 2010, 2009 and 2008
NOTE 2 — SUMMARY OF SIGNIFICANT ACCOUNTING POLICIES — Continued
| Year ended December 31, | ||||||||||||
| 2010 | 2009 | 2008 | ||||||||||
| Earnings (loss) per common share |
||||||||||||
| Basic |
||||||||||||
| Class A |
||||||||||||
| Distributed earnings |
$ | – | $ | – | $ | – | ||||||
| Undistributed earnings (loss) |
$ | 0.15 | $ | (0.37 | ) | $ | 2.50 | |||||
|
|
|
|
|
|
|
|||||||
| Total |
$ | 0.15 | $ | (0.37 | ) | $ | 2.50 | |||||
|
|
|
|
|
|
|
|||||||
| Class B |
||||||||||||
| Distributed earnings |
$ | 0.27 | $ | 0.27 | $ | 0.27 | ||||||
| Undistributed earnings (loss) |
$ | 0.15 | $ | (0.37 | ) | $ | 2.50 | |||||
|
|
|
|
|
|
|
|||||||
| Total |
$ | 0.42 | $ | (0.10 | ) | $ | 2.77 | |||||
|
|
|
|
|
|
|
|||||||
| Diluted |
||||||||||||
| Class A |
||||||||||||
| Distributed earnings |
$ | – | $ | – | $ | – | ||||||
| Undistributed earnings (loss) |
$ | 0.15 | $ | (0.37 | ) | $ | 2.46 | |||||
|
|
|
|
|
|
|
|||||||
| Total |
$ | 0.15 | $ | (0.37 | ) | $ | 2.46 | |||||
|
|
|
|
|
|
|
|||||||
| Class B |
||||||||||||
| Distributed earnings |
$ | 0.27 | $ | 0.27 | $ | 0.27 | ||||||
| Undistributed earnings (loss) |
$ | 0.15 | $ | (0.37 | ) | $ | 2.46 | |||||
|
|
|
|
|
|
|
|||||||
| Total |
$ | 0.42 | $ | (0.10 | ) | $ | 2.73 | |||||
|
|
|
|
|
|
|
|||||||
A total of 1,551,750 options to purchase shares of the Company’s Class A common stock was excluded from the calculations above for the year ended December 31, 2009, because their effects were anti-dilutive.
Fair Value Measurements
The Company measures and reports certain assets and liabilities on a fair value basis. Fair value is the price that would be received to sell an asset or paid to transfer a liability in an orderly transaction between market participants at the measurement date (exit price). The Company follows FASB guidance establishing a fair value hierarchy that prioritizes the inputs to valuation methods used to measure fair value.
The carrying amounts reported on the balance sheet for cash and cash equivalents, certificates of deposit, accounts receivable, prepaid expenses, accounts payable, accrued liabilities, royalties payable, advances from joint interest owners, dividends payable and other liabilities approximate their fair values, due to the short-term maturity of these instruments.
At December 31, 2010, the carrying value of $25,000,000 for the Company’s borrowings under its $150,000,000 senior secured revolving credit agreement (“Credit Agreement”) on the consolidated balance
F-15
Table of Contents
Index to Financial Statements
Matador Resources Company and Subsidiaries
NOTES TO CONSOLIDATED FINANCIAL STATEMENTS — CONTINUED
December 31, 2010, 2009 and 2008
NOTE 2 — SUMMARY OF SIGNIFICANT ACCOUNTING POLICIES — Continued
sheet is approximately fair value as it is subject to short-term floating interest rates that approximate the rates available to the Company at the time.
Credit Risk
The Company uses derivative financial instruments to hedge its exposure to natural gas price volatility. These transactions expose the Company to potential credit risk from its single counterparty. Accounts receivable constitute the principal component of additional credit risk to which the Company may be exposed. The Company believes that any credit risk posed is insignificant and is offset by the credit worthiness of its customer base and industry partners.
Risks and Uncertainties
As an oil and natural gas exploration and production company focused on finding and developing its own prospects and reserves, the Company’s success is highly dependent on the results of its exploration program. Exploration activities involve numerous risks, including the risk that no commercially productive oil or natural gas reserves will be discovered. In addition, there are uncertainties as to the future costs or timing of drilling, completing and producing wells. Poor results from the Company’s exploration activities could limit the Company’s ability to replace and grow reserves and materially and adversely affect the Company’s financial position, results of operations and cash flows.
The Company does not operate properties constituting a significant portion of its oil and natural gas reserves. As a result of the Company’s sale of certain assets to Chesapeake Louisiana, L.P. (“Chesapeake”) in 2008, the Company does not operate its most significant natural gas asset, that being the deep rights to explore for and develop the Haynesville shale formation (underlying its existing Cotton Valley production) on the Company’s Elm Grove/Caspiana leasehold in north Louisiana. Although the Company has reserved the right to participate for a proportionately reduced 25% working interest in all wells that Chesapeake drills or participates in to develop the Haynesville formation on this acreage, and although the Company has the right to propose the drilling of Haynesville wells on these properties, the Company may have limited influence on when, how and at what pace these properties are developed. This could impact the Company’s ability to replace and grow reserves and materially and adversely affect the Company’s financial position, results of operations and cash flows. In addition, in 2009 and 2010, the Company acquired other non-operated acreage positions in north Louisiana that it believes to be prospective for the Haynesville shale. The Company has, or will have, small, non-operated working interests in the Haynesville units including these properties, and as a result, the Company will have limited influence on when, how and at what pace these properties are developed.
Estimating oil and natural gas reserves is complex and is not exact because of the numerous uncertainties inherent in the process. The process relies on interpretations of available geological, geophysical, petrophysical, engineering and production data. The extent, quality and reliability of both the data and the associated interpretations of that data can vary. The process also requires certain economic assumptions, including, but not limited to, oil and natural gas prices, drilling and operating expenses, capital
F-16
Table of Contents
Index to Financial Statements
Matador Resources Company and Subsidiaries
NOTES TO CONSOLIDATED FINANCIAL STATEMENTS — CONTINUED
December 31, 2010, 2009 and 2008
NOTE 2 — SUMMARY OF SIGNIFICANT ACCOUNTING POLICIES — Continued
expenditures and taxes. Actual future production, oil and natural gas prices, revenues, taxes, development expenditures, operating expenses and quantities of recoverable oil and natural gas most likely will vary from the Company’s estimates. Any significant variance could materially and adversely affect the Company’s future reserves estimates, financial position, results of operations and cash flows.
Historically, the market for oil and natural gas has experienced significant price fluctuations, and this has been particularly evident in recent years. Oil and natural gas prices are impacted by supply and demand, both domestic and international, seasonal variations caused by changing weather conditions, political conditions, governmental regulations, the availability, proximity and capacity of gathering systems for natural gas and numerous other factors. Increases or decreases in prices received could have a significant and material impact on the Company’s future reserves estimates, financial position, results of operations and cash flows.
To mitigate its exposure to fluctuations in natural gas prices, the Company, from time to time, enters into hedging arrangements, typically using put and call options in the form of “costless collars,” with respect to a portion of its natural gas production. Decisions as to whether and at what production volumes to hedge are difficult and depend on market conditions and the Company’s forecast of future production and commodity prices, and the Company may not always employ the optimal hedging strategy. The Company currently has no hedging contracts in place with regard to any of its oil production and no hedging contracts in place beyond 2011 with regard to any of its natural gas production.
The federal, state and local governments in the areas in which the Company operates or has assets impose taxes on the oil and gas products sold, and sales and use taxes are charged on significant portions of the Company’s drilling, completion and operating costs. Historically, there has been a significant amount of discussion by legislators and presidential administrations concerning a variety of energy tax proposals. U.S. President Obama has proposed sweeping changes in federal laws on the income taxation of oil and gas exploration and production companies. President Obama has proposed to eliminate allowing U.S. oil and gas companies to deduct intangible well costs as incurred and percentage depletion, among other proposals. Many states have raised state taxes on energy sources, and additional increases may occur. Changes to tax laws could materially and adversely affect the Company’s future financial position, results of operations and cash flows.
Recent Accounting Pronouncements
Subsequent Events. The Company incorporates the accounting and disclosure requirements for subsequent events in its financial statements. In accordance with U.S. GAAP, new terminology was introduced recently which defines the date through which management must evaluate subsequent events and lists the circumstances under which an entity must recognize and disclose events or transactions occurring after the balance sheet date. The Company adopted this guidance at December 31, 2009.
Oil and Natural Gas Reserves Reporting Requirements. In January 2009, the SEC issued The Modernization of Oil and Gas Reporting, Final Rule. In January 2010, the FASB amended Topic 932, Extractive Activities — Oil and Gas to align with this rule. The changes are designed to modernize and
F-17
Table of Contents
Index to Financial Statements
Matador Resources Company and Subsidiaries
NOTES TO CONSOLIDATED FINANCIAL STATEMENTS — CONTINUED
December 31, 2010, 2009 and 2008
NOTE 2 — SUMMARY OF SIGNIFICANT ACCOUNTING POLICIES — Continued
update the oil and gas disclosure requirements to align them with current practices and changes in technology. The new rules made a number of important changes including the following: (i) expanded the definition of oil and gas producing activities to include the extraction of saleable hydrocarbons from oil sands, shale, coalbeds, or other nonrenewable natural resources, (ii) amended the required price for estimating economic quantities for year-end reserves reporting to be the unweighted, arithmetic average of the first-day-of-the-month price for each month within the previous 12-month period, rather than the year-end price, and (iii) permitted proved reserves to be claimed beyond those development spacing areas that are immediately adjacent to developed spacing areas if it can be established with reasonable certainty that these reserves are economically producible. At December 31, 2009, the Company adopted the provisions of the new rule, and the Company has applied this new guidance for the reserves estimates at December 31, 2010 and 2009 included herein.
Derivative Financial Instruments. At December 31, 2008, the Company adopted new guidance to provide qualitative disclosures about its objectives and strategies for using derivative financial instruments and to provide a tabular presentation of quantitative information for derivatives designated as hedges, hedged items and other derivatives. This new guidance was effective for annual periods beginning after November 15, 2008. As its only requirement is to enhance disclosures, the new guidance had no material impact on the Company’s consolidated financial statements.
Fair Value. In May 2011, the FASB issued Accounting Standards Update (“ASU”) 2011-04, Amendments to Achieve Common Fair Value Measurement and Disclosure Requirements in U.S. GAAP and IFRS (“ASU 2011-04”). ASU 2011-04 amends Accounting Standards Codification (“ASC”) 820, Fair Value Measurements (“ASC 820”), providing a consistent definition and measurement of fair value, as well as similar disclosure requirements between U.S. GAAP and International Financial Reporting Standards. ASU 2011-04 changes certain fair value measurement principles, clarifies the application of existing fair value measurements and expands the ASC 820 disclosure requirements, particularly for Level 3 fair value measurements. The adoption of ASU 2011-04 is not expected to have a material effect on the Company’s consolidated financial statements, but may require certain additional disclosures. The amendments in ASU 2011-04 are to be applied prospectively. For public entities, the amendments are effective during interim and annual periods beginning after December 15, 2011.
In January 2010, the FASB issued authoritative guidance to update certain disclosure requirements and added two new disclosure requirements to fair value measurements. The guidance requires a gross presentation of activities within the Level 3 roll forward and adds a new requirement to disclose details of significant transfers in and out of Level 1 and 2 measurements and the reasons for the transfers. The new disclosures are required for all companies that are required to provide disclosures about recurring and non-recurring fair value measurements and are effective for the first interim or annual reporting period beginning after December 15, 2009, except for the gross presentation of Level 3 roll forward information, which is required for annual reporting periods beginning after December 15, 2010 and for interim reporting periods within those years. The Company adopted the first portion of this guidance beginning January 1, 2010. The Company does not expect the adoption of this new guidance to have a significant impact on the Company’s financial position, results of operations or cash flows.
F-18
Table of Contents
Index to Financial Statements
Matador Resources Company and Subsidiaries
NOTES TO CONSOLIDATED FINANCIAL STATEMENTS — CONTINUED
December 31, 2010, 2009 and 2008
NOTE 2 — SUMMARY OF SIGNIFICANT ACCOUNTING POLICIES — Continued
In September 2006, the FASB issued authoritative guidance for using fair value to measure assets and liabilities. The guidance applies whenever other standards require or permit assets or liabilities to be measured at fair value, but it did not expand the use of fair value in any new circumstances. In February 2009, the FASB delayed the effective date by one year for non-financial assets and liabilities. The Company adopted this guidance effective January 1, 2008 and delayed guidance relating to non-financial assets and liabilities until January 1, 2009. The adoption of this guidance did not have a significant impact on the Company’s financial position, results of operations or cash flows.
In February 2007, the Company adopted the accounting guidance permitting entities to choose to measure certain financial instruments and other items at fair value. The objective is to improve financial reporting by providing entities with the opportunity to mitigate volatility in reported earnings caused by measuring related assets and liabilities differently without having to apply complex hedge accounting provisions. Unrealized gains and losses on any items for which the fair value measurement option is elected are to be reported in the consolidated statement of operations. The Company adopted this guidance at January 1, 2008. The Company elected not to measure any eligible items using the fair value option in accordance with this guidance, and therefore, it did not have an impact on the Company’s financial position, results of operations or cash flows.
F-19
Table of Contents
Index to Financial Statements
Matador Resources Company and Subsidiaries
NOTES TO CONSOLIDATED FINANCIAL STATEMENTS — CONTINUED
December 31, 2010, 2009 and 2008
NOTE 3 — PROPERTY AND EQUIPMENT
The following table presents a summary of the Company’s property and equipment balances at December 31, 2010 and 2009.
| December 31, | ||||||||
| 2010 | 2009 | |||||||
| Oil and natural gas properties |
||||||||
| Evaluated (subject to amortization) |
$ | 255,408,993 | $ | 192,249,326 | ||||
| Unproved and unevaluated (not subject to amortization) |
||||||||
| Incurred in 2010 |
121,950,288 | – | ||||||
| Incurred in 2009 |
14,267,810 | 21,835,909 | ||||||
| Incurred in 2008 |
26,155,365 | 26,526,395 | ||||||
| Incurred in 2007 and prior |
10,077,986 | 11,452,242 | ||||||
|
|
|
|
|
|||||
| Total unproved and unevaluated |
172,451,449 | 59,814,546 | ||||||
|
|
|
|
|
|||||
| Total oil and natural gas properties |
427,860,442 | 252,063,872 | ||||||
| Accumulated depletion |
(134,700,857 | ) | (119,643,416 | ) | ||||
|
|
|
|
|
|||||
| Net oil and natural gas properties |
293,159,585 | 132,420,456 | ||||||
| Other property and equipment |
||||||||
| Computer equipment |
685,493 | 601,289 | ||||||
| Furniture |
416,095 | 407,723 | ||||||
| Software |
1,000,558 | 953,596 | ||||||
| Other equipment |
111,450 | 90,671 | ||||||
| Leasehold improvements |
65,899 | 65,899 | ||||||
| Support equipment and facilities |
11,755,515 | 10,355,037 | ||||||
|
|
|
|
|
|||||
| Total other property and equipment |
14,035,010 | 12,474,215 | ||||||
| Accumulated depreciation |
(3,314,129 | ) | (2,816,541 | ) | ||||
|
|
|
|
|
|||||
| Net other property and equipment |
10,720,881 | 9,657,674 | ||||||
|
|
|
|
|
|||||
| Net property and equipment |
$ | 303,880,466 | $ | 142,078,130 | ||||
|
|
|
|
|
|||||
The following table provides a breakdown of the Company’s unproved and unevaluated property costs not subject to amortization at December 31, 2010 and the year in which these costs were incurred.
| Description |
2010 | 2009 | 2008 | 2007 and prior |
Total | |||||||||||||||
| Costs incurred for |
||||||||||||||||||||
| Property acquisition |
$ | 86,043,632 | $ | 14,267,810 | $ | 26,155,365 | $ | 10,077,986 | $ | 136,544,793 | ||||||||||
| Exploratory and development wells |
35,906,656 | – | – | – | 35,906,656 | |||||||||||||||
|
|
|
|
|
|
|
|
|
|
|
|||||||||||
| Total |
$ | 121,950,288 | $ | 14,267,810 | $ | 26,155,365 | $ | 10,077,986 | $ | 172,451,449 | ||||||||||
|
|
|
|
|
|
|
|
|
|
|
|||||||||||
Property acquisition costs primarily include leasehold costs paid to secure oil and gas mineral leases, but may also include broker and legal expenses, geological and geophysical expenses and capitalized internal costs associated with developing oil and natural gas prospects on these properties. Property acquisition costs incurred in 2010 were primarily related to the Company’s leasing activities in the Eagle Ford shale play in south Texas and the Haynesville shale play in north Louisiana. The 2009 and 2008 property acquisition costs were primarily related to the Company’s leasing activities in the Haynesville
F-20
Table of Contents
Index to Financial Statements
Matador Resources Company and Subsidiaries
NOTES TO CONSOLIDATED FINANCIAL STATEMENTS — CONTINUED
December 31, 2010, 2009 and 2008
NOTE 3 — PROPERTY AND EQUIPMENT — Continued
play. Property acquisition costs incurred in 2007 and prior years were primarily related to the Company’s leasing activities in southwest Wyoming, northeast Utah and southeast Idaho. Property acquisition costs are transferred into the amortization base on an ongoing basis as these properties are evaluated and proved reserves are established or impairment is determined. Unproved and unevaluated properties are assessed for possible impairment on a periodic basis based upon changes in operating or economic conditions.
Unproved and unevaluated property costs include costs associated with exploratory and development wells in progress that were drilling or awaiting completion at year-end and for which proved reserves had yet to be determined. These costs totaled $35,906,656 at December 31, 2010 as compared with $6,379,008 at December 31, 2009. These costs are transferred into the amortization base on an ongoing basis, as exploratory and development wells are completed and proved reserves are established. Exploratory dry holes are included in the amortization base immediately upon determination that the well is not productive. At December 31, 2010, there were no exploratory or development well costs included in unproved and unevaluated property costs that were incurred in years prior to 2010.
NOTE 4 — ASSET RETIREMENT OBLIGATIONS
The following table summarizes the changes in the Company’s asset retirement obligations for the years ended December 31, 2010 and 2009.
| Year ended December 31, | ||||||||
| 2010 | 2009 | |||||||
| Beginning asset retirement obligations |
$ | 2,551,637 | $ | 1,763,299 | ||||
| Liabilities incurred during period |
847,845 | 199,556 | ||||||
| Revisions in estimated cash flows |
140,779 | 634,745 | ||||||
| Liabilities settled during period |
– | (183,310 | ) | |||||
| Accretion expense |
154,756 | 137,347 | ||||||
|
|
|
|
|
|||||
| Ending asset retirement obligations |
$ | 3,695,017 | $ | 2,551,637 | ||||
|
|
|
|
|
|||||
NOTE 5 — ASSET SALES AND IMPAIRMENT
In December 2010, the Company wrote off the Boise South Pipeline asset in Orange County, Texas from its Longwood Gathering and Disposal Systems, LP subsidiary and recorded a net loss of $173,690. The decision to write off this asset resulted from the fact that natural gas is no longer being put through this pipeline, nor is natural gas expected to be put through this pipeline in the future. In December 2010, the Company also recorded an impairment to some of its equipment held in inventory following a determination that the current market value of the equipment, consisting primarily of drilling rig parts, was less than the cost. The carrying value of the inventory was reduced by $50,000 on the balance sheet, and a corresponding charge was recorded to the consolidated statement of operations.
In December 2009, the Company recorded an impairment to some of its equipment held in inventory following a determination that the current market value of the equipment, consisting primarily of drilling rig parts, was less than the cost. The carrying value of the inventory was reduced by $323,500 on the balance
F-21
Table of Contents
Index to Financial Statements
Matador Resources Company and Subsidiaries
NOTES TO CONSOLIDATED FINANCIAL STATEMENTS — CONTINUED
December 31, 2010, 2009 and 2008
NOTE 5 — ASSET SALES AND IMPAIRMENT — Continued
sheet, and a corresponding charge was recorded to the consolidated statement of operations. In addition, the Company recorded a loss of $55,816 on certain other equipment that was sold during 2009.
In July 2008, the Company signed an agreement with Chesapeake for the joint exploration and development of the Haynesville shale formation (underlying its existing Cotton Valley production) on the Company’s Elm Grove/Caspiana leasehold in north Louisiana and received proceeds of $182,281,196. At the time of the Chesapeake transaction, the Company had no production from and no reserves assigned to the Haynesville formation. As noted previously, sales of the Company’s oil and natural gas properties are typically accounted for as adjustments to net capitalized costs with no gain or loss recognized, unless such adjustments would significantly alter the relationship between net capitalized costs and proved reserves of oil and natural gas (see Note 2). In accounting for this transaction, the Company concluded that such treatment would, in fact, substantially alter the relationship between net capitalized costs and proved reserves of oil and natural gas. Further, the Company determined there were significant differences between the properties sold and those retained, and in accordance with SEC Rule 4-10(C)(6)(i), capitalized costs should be allocated on the basis of the relative fair value of the properties at the time of the sale. The Company estimated that it sold approximately one-third of the then-fair value of its oil and natural gas properties in this transaction, and corresponding adjustments were made to its net capitalized costs. The Company reported a gain on this sale of $137,021,015, which is reflected in its consolidated statement of operations for 2008.
Additionally, in November 2008, certain equipment held in inventory was sold. The Company recorded a loss of $43,585 on the sale of this inventory.
NOTE 6 — REVOLVING CREDIT AGREEMENT
In March 2008, the Company entered into the Credit Agreement with Comerica Bank, N.A. (“Comerica Bank”) as Administrative Agent, Syndication and Documentation Agent and Issuing Lender. The Credit Agreement is secured by a significant portion of the Company’s oil and natural gas producing properties and by the equity interests of all its subsidiaries. In addition, all obligations under the Credit Agreement are guaranteed by the Company’s subsidiaries. The Credit Agreement matures in March 2013.
Borrowings under the Credit Agreement are limited to the lesser of $150,000,000 or the borrowing base, which is determined by the bank semi-annually on May 1 and November 1. The Company and Comerica Bank may each request an unscheduled redetermination of the borrowing base one time during any 12-month period. The borrowing base is adjusted at the discretion of the bank and is based in part on estimates of the Company’s proved oil and natural gas reserves, but also on external factors, such as Comerica Bank’s lending policies and estimates of future oil and natural gas prices, over which the Company has no control. In the event of a borrowing base increase, the Company pays a fee to Comerica Bank equal to 0.25% of the amount of the increase. If the borrowing base were to be less than the outstanding borrowings under the Credit Agreement at any time, the Company would be required to provide additional collateral satisfactory in nature and value to Comerica Bank to increase the borrowing base to an amount sufficient to cover such excess or to repay the deficit in equal installments over a period of six months.
F-22
Table of Contents
Index to Financial Statements
Matador Resources Company and Subsidiaries
NOTES TO CONSOLIDATED FINANCIAL STATEMENTS — CONTINUED
December 31, 2010, 2009 and 2008
NOTE 6 — REVOLVING CREDIT AGREEMENT — Continued
Borrowings under the Credit Agreement are subject to varying interest rates based on the total outstanding borrowings relative to the borrowing base and whether the loan is a Eurodollar loan or a base rate loan. Eurodollar loans bear interest at the Eurodollar rate plus the applicable margin of 1.250% to 1.875% based on the ratio of outstanding borrowings to the borrowing base. The Eurodollar rate for any interest period (one, two, three, six or twelve months as designated by the Company) is the rate equal to LIBOR, as published by Bloomberg Financial Markets Information Service or another source agreed upon by the Company and Comerica Bank, for deposits in United States dollars for a similar interest period. The base rate is the higher of the federal funds rate plus 1.0% or the annual rate of interest designated by Comerica Bank as its prime rate. A commitment fee of 0.250% to 0.375% based on the unused portion of the borrowing base is paid quarterly in arrears.
Key financial covenants under the Credit Agreement require the Company to maintain (1) a minimum current ratio (defined as total current assets plus availability under the Credit Agreement divided by total current liabilities) of 1.0 or greater at all times and (2) a debt to EBITDA ratio (defined as total debt outstanding divided by a rolling four-quarter EBITDA) of 3.75 or less at all times beginning twelve months from closing (4.00 or less until that time). Other restrictive covenants (1) prevent the Company from incurring other debt, subject to permitted exceptions, (2) prohibit the Company from declaring and paying dividends, except on its Class B common stock, and (3) limit the aggregate amount of oil and natural gas production that can be hedged pursuant to commodity hedging agreements and the maturity of those agreements. The Company was in compliance with all Comerica Bank’s covenants at December 31, 2010, 2009 and 2008.
At December 31, 2009 and 2008, the borrowing base was $20,000,000. In December 2010, the Credit Agreement was amended to increase the borrowing base from $20,000,000 to $55,000,000. At December 31, 2010, the Company had $25,000,000 of outstanding borrowings under the Credit Agreement and $50,000 in letters of credit secured by the Credit Agreement. At December 31, 2010, all borrowings under the Credit Agreement were Eurodollar loans, and the interest rate on the outstanding borrowings was 1.553%. The Company had an additional $325,000 in letters of credit secured by CD’s at Comerica Bank at December 31, 2010. The Company had no borrowings under the Credit Agreement at December 31, 2009 and 2008.
The Company obtained a written extension from Comerica Bank until July 15, 2011 to comply with a covenant under the Credit Agreement requiring submission of audited annual financial statements within 120 days of the prior year end and the submission of unaudited quarterly financial statements within 45 days of the prior quarter end. The Company submitted both sets of financial statements to Comerica Bank prior to this deadline.
F-23
Table of Contents
Index to Financial Statements
Matador Resources Company and Subsidiaries
NOTES TO CONSOLIDATED FINANCIAL STATEMENTS — CONTINUED
December 31, 2010, 2009 and 2008
NOTE 7 — INCOME TAXES
Deferred tax assets and liabilities are the result of temporary differences between the financial statement carrying values and the tax bases of assets and liabilities. The Company’s net deferred tax position at December 31, 2010 and 2009, respectively, is as follows.
| December 31, | ||||||||
| 2010 | 2009 | |||||||
| Deferred tax assets |
||||||||
| Net operating loss — federal and state |
$ | 21,768,007 | $ | 12,003,245 | ||||
| Federal alternative minimum tax |
6,659,528 | 8,070,166 | ||||||
|
|
|
|
|
|||||
| Total deferred tax assets |
28,427,535 | 20,073,411 | ||||||
| Deferred tax liabilities |
||||||||
| Property and equipment |
(33,800,718 | ) | (21,834,370 | ) | ||||
| Other |
(1,533,074 | ) | (213,515 | ) | ||||
|
|
|
|
|
|||||
| Total deferred tax liabilities |
(35,333,792 | ) | (22,047,885 | ) | ||||
|
|
|
|
|
|||||
| Total net deferred tax liabilities |
$ | (6,906,257 | ) | $ | (1,974,474 | ) | ||
|
|
|
|
|
|||||
At December 31, 2010, the Company recorded $1,473,619 of its deferred tax liabilities as current; these liabilities were attributable to the current portion of its unrealized derivative fair value.
At December 31, 2010, the Company had net operating loss carryforwards of $59,003,700 for federal income tax purposes and $49,317,749 for state income tax purposes available to offset future taxable income, as limited by the applicable provisions, and which expire at various dates through the tax year ending December 31, 2030.
F-24
Table of Contents
Index to Financial Statements
Matador Resources Company and Subsidiaries
NOTES TO CONSOLIDATED FINANCIAL STATEMENTS — CONTINUED
December 31, 2010, 2009 and 2008
NOTE 7 — INCOME TAXES — Continued
The income tax expense reconciled to the tax computed at the statutory federal rate for the years ended December 31, 2010, 2009 and 2008, respectively, is as follows.
| Year ended December 31, | ||||||||||||
| 2010 | 2009 | 2008 | ||||||||||
| Current income tax provision (benefit) |
||||||||||||
| State income tax |
$ | 30 | $ | (994,504 | ) | $ | 1,048,000 | |||||
| Federal alternative minimum tax |
(1,410,638 | ) | (1,329,834 | ) | 9,400,000 | |||||||
|
|
|
|
|
|
|
|||||||
| Net current income tax provision (benefit) |
(1,410,608 | ) | (2,324,338 | ) | 10,448,000 | |||||||
| Deferred income tax provision |
||||||||||||
| Federal tax expense at statutory rate (34%) |
3,365,367 | (7,941,036 | ) | 41,770,049 | ||||||||
| Statutory depletion carryover |
(157,278 | ) | (610,013 | ) | (273,484 | ) | ||||||
| Change in state rate applied |
275,030 | (158,638 | ) | 2,183,239 | ||||||||
| Nondeductible (additional) expense |
38,026 | 41,857 | (1,542 | ) | ||||||||
| Dividends received deduction |
– | (262,815 | ) | – | ||||||||
| Federal alternative minimum tax |
1,410,638 | 1,329,834 | (9,400,000 | ) | ||||||||
| Change in valuation allowance |
– | – | (24,702,976 | ) | ||||||||
|
|
|
|
|
|
|
|||||||
| Net deferred income tax provision |
4,931,783 | (7,600,811 | ) | 9,575,286 | ||||||||
|
|
|
|
|
|
|
|||||||
| Total income tax provision (benefit) |
$ | 3,521,175 | $ | (9,925,149 | ) | $ | 20,023,286 | |||||
|
|
|
|
|
|
|
|||||||
As a result of the sale of certain assets in 2008 (see Note 5) resulting in the use of a majority of the Company’s net operating loss carryforwards, the Company released the valuation allowance against its remaining deferred tax assets in the amount of $24,702,976. The Company believes it is more likely than not that future income, including income that may be generated as a result of certain tax planning strategies, together with future reversals of existing temporary tax differences, will be sufficient to fully recover the remaining deferred tax assets. Should the Company determine that all or part of its net deferred tax assets may not be realizable in the future, the Company will make an adjustment to the valuation allowance that would be charged against operations in the period such determination is made.
The Company files a United States federal income tax return and several state tax returns, a number of which remain open for examination. The tax years open for examination for the federal tax return are 2007, 2008, 2009 and 2010. The tax years open for examination by the state of Texas are 2008, 2009 and 2010. The tax years open for examination by the state of Louisiana are 2007, 2008, 2009 and 2010. At August 12, 2011, the Company’s 2007, 2008 and 2009 income and franchise tax returns are under examination by the state of Louisiana. The tax years open for examination by the state of New Mexico are 2008, 2009 and 2010. The Company has not paid any interest or penalties associated with its income taxes.
F-25
Table of Contents
Index to Financial Statements
Matador Resources Company and Subsidiaries
NOTES TO CONSOLIDATED FINANCIAL STATEMENTS — CONTINUED
December 31, 2010, 2009 and 2008
NOTE 8 — EMPLOYEE BENEFIT PLANS
Stock Options, Restricted Stock Grants and Performance Awards
The Company’s Board of Directors and shareholders approved in 2003 the Matador Resources Company 2003 Stock and Incentive Plan (“Stock and Incentive Plan”). The Stock and Incentive Plan, as amended, provides that a maximum of 3,481,569 shares of Class A common stock in the aggregate may be issued pursuant to options or restricted stock grants. The persons eligible to receive awards under the Stock and Incentive Plan include employees, directors, officers, consultants or advisors of the Company.
The Stock and Incentive Plan is administered by the Board of Directors, which determines the number of option or restricted shares to be granted, the effective dates and terms of the grants, the option or restricted share price, and the vesting period. Incentive stock options become exercisable in one to four years from the grant date and expire five years or ten years after the grant date. Non-qualified options become exercisable immediately upon grant and expire five years after the grant date. In the absence of an established market for shares of the Company’s common stock, the Board of Directors determines the fair market value of the Company’s common stock for purposes of awards under the Stock and Incentive Plan. The Company typically uses newly issued shares of common stock to satisfy option exercises or restricted share grants.
Non-qualified stock option expense is recognized in the Company’s consolidated statement of operations on the date of grant. Incentive stock option expense is recognized on a straight-line basis over the vesting period. Prior to November 22, 2010, all of the Company’s outstanding stock options were classified as equity instruments, with all stock-based compensation expense measured on the date of grant and recognized over the vesting period, if any.
Prior to November 22, 2010, the fair value of stock options granted under the Stock and Incentive Plan was estimated using the following weighted average assumptions for 2010, 2009 and 2008, respectively.
| Year ended December 31, | ||||||
| 2010 |
2009 |
2008 | ||||
| Stock option pricing model |
Binomial Lattice | Binomial Lattice | Binomial Lattice | |||
| Expected option life |
5.41 years | 3.73 years | 4.14 years | |||
| Risk-free interest rate |
2.58% | 2.43% | 2.84% | |||
| Volatility |
46.17% | 52.55% | 35.35% | |||
| Dividend yield |
0.0% | 0.0% | 0.0% | |||
| Estimated forfeiture rate |
11.15% | 3.39% | 11.39% | |||
| Weighted average fair value of options granted during the year |
$3.02 | $1.82 | $1.76 | |||
On November 22, 2010, the Company changed its method of accounting for its outstanding stock options, reclassifying all outstanding stock options from equity to liability instruments (see Note 2). As a result, at December 31, 2010, the Company measured and recognized the fair value of the liability associated with its outstanding stock options using an estimated fair value of $11.00 per share for the Company’s Class A common stock.
F-26
Table of Contents
Index to Financial Statements
Matador Resources Company and Subsidiaries
NOTES TO CONSOLIDATED FINANCIAL STATEMENTS — CONTINUED
December 31, 2010, 2009 and 2008
NOTE 8 — EMPLOYEE BENEFIT PLANS — Continued
Summarized information about stock options outstanding under the Company’s Stock and Incentive Plan is as follows.
| Number of options |
Price per share |
Aggregate option price |
Weighted average exercise price |
|||||||||||||
| Options outstanding at January 1, 2008 |
1,669,875 | $ | 10,139,250 | $ | 6.07 | |||||||||||
| Options granted |
608,250 | $ | 10.00-13.33 | 6,362,500 | 10.46 | |||||||||||
| Options exercised |
(235,500 | ) | 3.33-13.33 | (1,048,500 | ) | 4.45 | ||||||||||
| Options forfeited |
(154,875 | ) | 3.33-10.00 | (1,020,750 | ) | 6.59 | ||||||||||
|
|
|
|
|
|||||||||||||
| Options outstanding at December 31, 2008 |
1,887,750 | $ | 14,432,500 | $ | 7.65 | |||||||||||
| Options granted |
45,000 | $ | 7.50 | 337,500 | 7.50 | |||||||||||
| Options exercised |
(343,500 | ) | 3.33-5.00 | (1,281,500 | ) | 3.73 | ||||||||||
| Options forfeited |
(37,500 | ) | 3.33-13.33 | (360,500 | ) | 9.61 | ||||||||||
|
|
|
|
|
|||||||||||||
| Options outstanding at December 31, 2009 |
1,551,750 | 13,128,000 | 8.46 | |||||||||||||
| Options granted |
158,000 | $ | 9.00-11.00 | 1,468,000 | 9.29 | |||||||||||
| Options exercised |
(392,375 | ) | 5.00-10.00 | (1,978,375 | ) | 5.04 | ||||||||||
| Options forfeited or expired |
(99,875 | ) | 5.00-13.33 | (773,875 | ) | 7.75 | ||||||||||
|
|
|
|
|
|||||||||||||
| Options outstanding at December 31, 2010 |
1,217,500 | $ | 11,843,750 | $ | 9.73 | |||||||||||
|
|
|
|
|
|||||||||||||
| Options outstanding | Options exercisable | |||||||||||||||||||
| Range of exercise prices |
Shares outstanding |
Weighted average remaining contractual life |
Weighted average exercise price |
Shares exercisable |
Weighted average exercise price |
|||||||||||||||
| $7.50-$9.00 |
566,750 | 2.99 years | $ | 8.96 | 347,250 | $ | 8.98 | |||||||||||||
| $10.00-$13.33 |
650,750 | 2.41 years | $ | 10.40 | 352,500 | $ | 10.38 | |||||||||||||
At December 31, 2010, the Company recognized a total stock-based liability of $1,250,467 resulting from the reclassification of its outstanding stock options from equity to liability instruments, including a charge to shareholders’ equity of $1,086,271 and an additional (non-cash) compensation expense of $164,196. The Company recorded $1,095,014 of this stock-based liability as a current liability and $155,453 as a long-term liability.
At December 31, 2010, 2009 and 2008, the total remaining unrecognized compensation expense related to unvested stock options was approximately $376,986, $807,324 and $1,162,275, respectively, and the weighted average remaining requisite service period (vesting period) of all unvested stock options was approximately 1.65, 1.93 and 2.53 years, respectively.
F-27
Table of Contents
Index to Financial Statements
Matador Resources Company and Subsidiaries
NOTES TO CONSOLIDATED FINANCIAL STATEMENTS — CONTINUED
December 31, 2010, 2009 and 2008
NOTE 8 — EMPLOYEE BENEFIT PLANS — Continued
| Non-vested stock options |
Shares | Weighted average grant date fair value |
||||||
| Non-vested at January 1, 2010 |
658,125 | $ | 9.78 | |||||
| Granted |
158,000 | 9.29 | ||||||
| Vested |
(246,750 | ) | 9.78 | |||||
| Forfeited |
(51,625 | ) | 8.33 | |||||
|
|
|
|||||||
| Non-vested at December 31, 2010 |
517,750 | $ | 9.78 | |||||
|
|
|
|||||||
The fair value of option shares vested during 2010 was $2,413,250. Total compensation (non-cash) costs for stock-based payment arrangements recognized in the Company’s consolidated statement of operations were $897,737 for the year ending December 31, 2010. The tax-related benefit from the exercise of stock options totaled $779,907 for 2010.
On May 17, 2007, the Company made a restricted stock grant of 4,500 shares of Class A common stock to an employee. These shares vested according to the following schedule: 1,500 shares each on December 31, 2007, 2008 and 2009, respectively. At December 31, 2009, all 4,500 shares were vested to the employee.
On February 13, 2008, the Company made a restricted stock grant of 9,000 shares of Class A common stock to an employee. These shares vested according to the following schedule: 3,000 shares each on December 31, 2008, 2009 and 2010, respectively. At December 31, 2010, all 9,000 shares were vested to the employee.
On October 28, 2010, the Company made a restricted stock grant of 15,000 shares of Class A common stock to an employee. These shares vested or will vest according to the following schedule: 3,000 shares were fully vested upon grant and an incremental 4,000 shares will vest on each of October 28, 2011, 2012 and 2013. Should the employee cease to remain in service with the Company other than by death or disability, all unvested shares will be forfeited.
Following the closing of its transaction with Chesapeake in July 2008, the Board of Directors and/or Company management authorized the award of one-time, special cash bonuses to eligible employees in recognition of the significant increase in the Company’s value achieved as a result of the transaction and as an incentive to retain these employees. The Company recorded a compensation expense of $1,660,375 related to these bonuses in 2008.
In October 2008, the Company’s Board of Directors approved the adoption of the Employee Share Repurchase Program (“Repurchase Program”) authorizing the Company to repurchase shares of its Class A common stock from its employees, directors and officers, subject to certain conditions and restrictions. In 2010, the Company repurchased 117,505 shares of Class A common stock at $11.00 per share from thirteen employees (including the Executive Vice President, Chief Financial Officer and Chief Operating Officer,
F-28
Table of Contents
Index to Financial Statements
Matador Resources Company and Subsidiaries
NOTES TO CONSOLIDATED FINANCIAL STATEMENTS — CONTINUED
December 31, 2010, 2009 and 2008
NOTE 8 — EMPLOYEE BENEFIT PLANS — Continued
the Executive Vice President — Operations and the Vice President — Reservoir Engineering). In 2009, the Company repurchased 114,000 shares of Class A common stock at $7.33-$7.50 per share from ten employees (including the Vice President — Reservoir Engineering and the Vice President — Geophysics and New Ventures). In 2008, the Company repurchased 26,250 shares of Class A common stock at $13.33 per share from three employees (including the Vice President — Geophysics and New Ventures). No director nor the Company’s Chairman and Chief Executive Officer has ever participated in the Repurchase Program. The Company’s Board of Directors terminated the Repurchase Program in April 2011, and the Company is no longer authorized to repurchase shares of Class A common stock from its employees, directors and officers. No shares were repurchased in 2011 prior to the termination of the Repurchase Program by the Board of Directors.
In October 2008, the Company’s Board of Directors approved the adoption of the Employee Option Exercise Loan Program (“Loan Program”), authorizing the Company to establish a loan program with a financial institution to assist its employees, directors and officers in the exercise of their outstanding options to purchase shares of Class A common stock, subject to certain conditions and restrictions outlined in the Loan Program. As part of the Loan Program, the Company provides the financial institution with a guaranty of repayment of the loan and makes deposits of funds in certificates of deposit to secure its guaranty. Notwithstanding the guaranty, these loans are full recourse obligations of each loan recipient, and each loan recipient agrees to indemnify and reimburse the Company in full for all liabilities incurred by the Company in the event of the recipient’s default on the loan. Each loan recipient also pledges all shares purchased from the Company with the loan proceeds to further secure his or her obligations to the Company in return for its guaranty. No director nor the Company’s Chairman and Chief Executive Officer has ever participated in the Loan Program.
At December 31, 2010, the Company had secured the loans of eight employees (including the Executive Vice President, Chief Financial Officer and Chief Operating Officer, the Executive Vice President — Operations and the Vice President — Reservoir Engineering) pursuant to this Loan Program in the aggregate amount of $1,326,000. The Company considers the fair value of this aggregate guaranty to be minimal and has recorded no liability provision associated with this guaranty on its consolidated balance sheets in any reporting period presented. The Company’s Board of Directors terminated the Loan Program in April 2011, and the Company is no longer authorized to provide financial guaranties for additional loans. No new loans were guaranteed in 2011 prior to the termination of the Loan Program by the Board of Directors.
401(k) Plan
Effective July 3, 2003, the Company established a defined contribution retirement plan. All full-time Company employees are eligible to join the plan the first day of the calendar month immediately following their date of employment. Each participant may contribute up to the maximum allowable under the Internal Revenue Code. Each year, the Company makes a contribution to the plan which equals 3% of the employee’s annual compensation, referred to as the Employer’s Safe Harbor Non-Elective Contribution. The Company’s Safe Harbor match was $159,995, $140,543 and $142,779 in 2010, 2009 and 2008,
F-29
Table of Contents
Index to Financial Statements
Matador Resources Company and Subsidiaries
NOTES TO CONSOLIDATED FINANCIAL STATEMENTS — CONTINUED
December 31, 2010, 2009 and 2008
NOTE 8 — EMPLOYEE BENEFIT PLANS — Continued
respectively. In addition, each year the Company may determine and make a discretionary matching contribution as well as additional contributions. The Company’s discretionary matching contributions totaled $197,504, $167,456 and $176,545 in 2010, 2009 and 2008, respectively. The Company made no additional discretionary contributions in any reporting period presented.
NOTE 9 — COMMON STOCK
Increase in Authorized Shares
On October 23, 2008, at a Special Meeting of Shareholders called for the express purpose, the Company’s shareholders approved an amendment to the Articles of Incorporation of the Company increasing the number of shares of Class A common stock authorized to be issued by the Company to 80,000,000 shares having a par value of $0.01 per share.
Stock Split
The Company declared a three-for-one split of all its issued and outstanding shares of Class A and Class B common stock effective October 31, 2008. Each Class A and Class B shareholder received two new shares of Class A common stock for each share of Class A and Class B common stock held of record at October 31, 2008. All common shares and per common share amounts in the accompanying consolidated financial statements and notes have been adjusted to affect this stock split retroactively.
Dividends
The Company has issued two classes of common stock, Class A and Class B. The holders of the Class B shares are entitled to be paid cumulative dividends at a per share rate of $0.26-2/3 annually out of funds legally available for the payment of dividends. These dividends are accrued and paid quarterly. Dividends declared during 2010, 2009 and 2008 totaled $274,853 in each year. Dividends for the fourth quarter of 2010 were accrued and paid in January 2011. Dividends for the fourth quarter of 2009 and 2008 were accrued and paid in January 2010 and 2009, respectively. At December 31, 2010, the Company has not paid any dividends to holders of the Class A shares.
Stock Offerings, Retirement and Issuances
In October 2010, the Board of Directors approved and authorized the private offering and sale of additional shares of the Company’s Class A common stock at $11.00 per share in the period from October 2010 through January 2011. At December 31, 2010, the Company sold 1,868,427 shares and received net proceeds of $20,536,167. In January 2011, the Company sold an additional 53,772 shares as part of this private offering and received net proceeds of $584,918. The Company also sold 11,000 shares of Class A common stock at $9.00 per share to an accredited investor and received net proceeds of $99,000 in May 2010.
In February 2009, one of the Company’s largest shareholders at the time, Gandhara Capital (“Gandhara”), a large international hedge fund, notified the Company of its need to sell its entire holdings
F-30
Table of Contents
Index to Financial Statements
Matador Resources Company and Subsidiaries
NOTES TO CONSOLIDATED FINANCIAL STATEMENTS — CONTINUED
December 31, 2010, 2009 and 2008
NOTE 9 — COMMON STOCK — Continued
of the Company’s Class A common stock totaling 5,422,713 shares due to its plan for liquidation. The Board of Directors unanimously authorized the repurchase of all of Gandhara’s outstanding shares at $5.00 per share, and Gandhara accepted this offer. In April 2009, the Company repurchased 5,422,713 shares of its Class A common stock from Gandhara for $27,113,565. These shares were effectively retired by the Company; however, this share repurchase and effective retirement did not reduce the 80,000,000 total shares authorized for issue by the Company.
Following the repurchase of these shares from Gandhara, the Board of Directors approved and authorized the Company’s May 2009 private offering in which the Company sold 4,950,694 shares of Class A common stock and received net proceeds of $27,982,569. In addition to this private offering, the Company sold 23,500 shares of Class A common stock to two accredited shareholders and received net proceeds of $176,250 during 2009.
Treasury Stock
During 2010, the Company issued 6,000 shares of Class A common stock valued at $7.50-$9.00 per share from treasury stock. The Company also purchased 1,117,505 shares of Class A common stock for $9.00-$11.00 per share. These purchases included 1,000,000 shares of Class A common stock purchased from five shareholders, all advised by Wellington Management Company, in April 2010 at $9.00 per share, for a total of $9,000,000.
During 2009, the Company issued 652,126 shares of Class A common stock valued at $5.00-$7.50 per share from treasury stock. The Company also purchased 679,923 shares of Class A common stock from certain shareholders at $5.00-$7.50 per share.
During 2008, the Company issued 5,775 shares of Class A common stock valued at $13.33 per share from treasury stock. The Company also purchased 450 and 26,250 shares of Class A common stock from certain shareholders at $10.00 and $13.33 per share, respectively.
NOTE 10 — DERIVATIVE FINANCIAL INSTRUMENTS
From time to time, the Company uses derivative financial instruments to hedge its exposure to commodity price risk associated with natural gas prices. These instruments consist of put and call options in the form of costless collars. The Company records derivative financial instruments on its balance sheet as either an asset or a liability measured at fair value. The Company has elected not to apply hedge accounting for its existing derivative financial instruments. As a result, the Company recognizes the change in derivative fair value between reporting periods currently in its consolidated statement of operations as an unrealized gain or loss. The fair value of the Company’s derivative financial instruments is determined based on its counterparty’s valuation model, which the Company verifies for its reasonableness with an independent third-party valuation using observable, market-corroborated inputs.
During 2010, 2009 and 2008, the Company entered into various costless collar transactions, each with an established price floor and ceiling. For each calculation period, the specified price for determining the
F-31
Table of Contents
Index to Financial Statements
Matador Resources Company and Subsidiaries
NOTES TO CONSOLIDATED FINANCIAL STATEMENTS — CONTINUED
December 31, 2010, 2009 and 2008
NOTE 10 — DERIVATIVE FINANCIAL INSTRUMENTS — Continued
realized gain or loss to the Company pursuant to any of these transactions is the settlement price for the NYMEX Henry Hub natural gas futures contract for the delivery month corresponding to the calculation period’s calendar month for the last day of that contract period. When the settlement price is below the price floor established by these collars, the Company receives from Comerica Bank, as counterparty, an amount equal to the difference between the settlement price and the price floor multiplied by the contract natural gas volume hedged. When the settlement price is above the price ceiling established by these collars, the Company pays to Comerica Bank, as counterparty, an amount equal to the difference between the settlement price and the price ceiling multiplied by the contract natural gas volume hedged.
At December 31, 2010, the Company had seven costless collar contracts open and in place to mitigate its exposure to natural gas price volatility, each with a specific term (calculation period), notional quantity (volume hedged) and price floor and ceiling. Each contract is set to expire at varying times during 2011. The Company has no hedging contracts in place with regard to any of its oil production, and no hedging contracts in place beyond 2011 with regard to any of its natural gas production.
The following is a summary of the Company’s open costless collar contracts at December 31, 2010.
| Commodity |
Calculation Period | Notional Quantity |
Price Floor |
Price Ceiling |
Fair Value of Asset |
|||||||||||||||
| (MMBtu/month) | ($/MMBtu) | ($/MMBtu) | ||||||||||||||||||
| Natural Gas |
01/01/2010 - 12/31/2011 | 50,000 | 5.25 | 8.10 | $ | 533,839 | ||||||||||||||
| Natural Gas |
01/01/2010 - 12/31/2011 | 50,000 | 5.50 | 7.65 | 649,497 | |||||||||||||||
| Natural Gas |
01/01/2010 - 12/31/2011 | 50,000 | 5.00 | 8.65 | 420,065 | |||||||||||||||
| Natural Gas |
01/01/2010 - 12/31/2011 | 50,000 | 5.50 | 7.70 | 649,497 | |||||||||||||||
| Natural Gas |
01/01/2011 - 12/31/2011 | 90,000 | 5.50 | 7.85 | 1,172,754 | |||||||||||||||
| Natural Gas |
11/01/2010 - 03/31/2011 | 120,000 | 6.00 | 7.65 | 597,038 | |||||||||||||||
| Natural Gas |
07/01/2010 - 06/30/2011 | 60,000 | 4.50 | 6.55 | 121,721 | |||||||||||||||
|
|
|
|||||||||||||||||||
| Total |
$ | 4,144,411 | ||||||||||||||||||
|
|
|
|||||||||||||||||||
Additional Disclosures about Derivative Financial Instruments
The following table summarizes the location and fair value of all derivative financial instruments recorded in the consolidated balance sheets for the periods presented. These derivative financial instruments are not designated as hedging instruments.
| Type of Instrument |
Location in Balance Sheet |
December 31, | ||||||||
| 2010 | 2009 | |||||||||
| Derivative Instrument |
||||||||||
| Natural Gas |
Current assets: Derivative instruments | $ | 4,144,411 | $ | 1,005,685 | |||||
|
|
|
|
|
|||||||
| Total |
$ | 4,144,411 | $ | 1,005,685 | ||||||
|
|
|
|
|
|||||||
F-32
Table of Contents
Index to Financial Statements
Matador Resources Company and Subsidiaries
NOTES TO CONSOLIDATED FINANCIAL STATEMENTS — CONTINUED
December 31, 2010, 2009 and 2008
NOTE 10 — DERIVATIVE FINANCIAL INSTRUMENTS — Continued
The following table summarizes the location and fair value of all derivative financial instruments recorded in the consolidated statements of operations for the periods presented. These derivative financial instruments are not designated as hedging instruments.
| Type of Instrument |
Location in Statement of Operations |
Year ended December 31, | ||||||||||||
| 2010 | 2009 | 2008 | ||||||||||||
| Derivative Instrument |
||||||||||||||
| Natural Gas |
Revenues: Realized gain (loss) on derivatives | $ | 5,299,380 | $ | 7,625,120 | $ | (1,325,970 | ) | ||||||
| Revenues: Unrealized gain (loss) on derivatives | 3,138,726 | (2,374,638 | ) | 3,591,928 | ||||||||||
|
|
|
|
|
|
|
|||||||||
| Total |
$ | 8,438,106 | $ | 5,250,482 | $ | 2,265,958 | ||||||||
|
|
|
|
|
|
|
|||||||||
NOTE 11 — FAIR VALUE MEASUREMENTS
The Company measures and reports certain financial and non-financial assets and liabilities on a fair value basis. Fair value is the price that would be received to sell an asset or paid to transfer a liability in an orderly transaction between market participants at the measurement date (exit price). Fair value measurements are classified and disclosed in one of the following categories.
| Level 1 | Unadjusted quoted prices in active markets that are accessible at the measurement date for identical, unrestricted assets or liabilities. Active markets are considered to be those in which transactions for the assets or liabilities occur in sufficient frequency and volume to provide pricing information on an ongoing basis. | |
| Level 2 | Quoted prices in markets that are not active, or inputs which are observable, either directly or indirectly, for substantially the full term of the asset or liability. This category includes those derivative instruments that are valued using observable market data. Substantially all of these inputs are observable in the marketplace throughout the full term of the derivative instrument, can be derived from observable data or supported by observable levels at which transactions are executed in the marketplace. | |
| Level 3 | Unobservable inputs that are not corroborated by market data. This category is comprised of financial and non-financial assets and liabilities whose fair value is estimated based on internally developed models or methodologies using significant inputs that are generally less readily observable from objective sources. | |
Financial and non-financial assets and liabilities are classified based on the lowest level of input that is significant to the fair value measurement. The assessment of the significance of a particular input to the fair value measurement requires judgment, which may affect the valuation of the fair value of assets and liabilities and their placement within the fair value hierarchy levels.
F-33
Table of Contents
Index to Financial Statements
Matador Resources Company and Subsidiaries
NOTES TO CONSOLIDATED FINANCIAL STATEMENTS — CONTINUED
December 31, 2010, 2009 and 2008
NOTE 11 — FAIR VALUE MEASUREMENTS — Continued
The following tables summarize the valuation of the Company’s financial assets and liabilities that were accounted for at fair value on a recurring basis in accordance with the classifications provided above at December 31, 2010 and 2009.
| Description |
Fair Value Measurements
at December 31, 2010 using |
|||||||||||||||
| Level 1 | Level 2 | Level 3 | Total | |||||||||||||
| Assets (Liabilities) |
||||||||||||||||
| Certificates of deposit |
$ | – | $ | 2,349,313 | $ | – | $ | 2,349,313 | ||||||||
| Natural gas derivatives |
– | 4,144,411 | – | 4,144,411 | ||||||||||||
|
|
|
|
|
|
|
|
|
|||||||||
| Total |
$ | – | $ | 6,493,724 | $ | – | $ | 6,493,724 | ||||||||
|
|
|
|
|
|
|
|
|
|||||||||
| Description |
Fair Value Measurements
at December 31, 2009 using |
|||||||||||||||
| Level 1 | Level 2 | Level 3 | Total | |||||||||||||
| Assets (Liabilities) |
||||||||||||||||
| Certificates of deposit |
$ | – | $ | 15,675,346 | $ | – | $ | 15,675,346 | ||||||||
| Natural gas derivatives |
– | 1,005,685 | – | 1,005,685 | ||||||||||||
|
|
|
|
|
|
|
|
|
|||||||||
| Total |
$ | – | $ | 16,681,031 | $ | – | $ | 16,681,031 | ||||||||
|
|
|
|
|
|
|
|
|
|||||||||
The Company’s accounting policies for certificates of deposit and derivative financial instruments are discussed in Note 2; additional disclosures related to derivative financial instruments are provided in Note 10. For purposes of fair value measurement, the Company determined that CDs and derivative financial instruments (e.g., natural gas derivatives) should be classified at Level 2.
Effective January 1, 2009, the Company adopted the new disclosure requirements for non-financial assets and liabilities that are measured at fair value on a non-recurring basis. The Company accounts for additions to asset retirement obligations and lease and well equipment inventory at fair value on a non-recurring basis. The following tables summarize the valuation of the Company’s assets and liabilities that were accounted for at fair value on a non-recurring basis at December 31, 2010 and 2009.
| Description |
Fair Value Measurements
at December 31, 2010 using |
|||||||||||||||
| Level 1 | Level 2 | Level 3 | Total | |||||||||||||
| Assets (Liabilities) |
||||||||||||||||
| Asset retirement obligations |
$ | – | $ | – | $ | (847,845 | ) | $ | (847,845 | ) | ||||||
| Lease and well equipment inventory |
– | – | 442,500 | 442,500 | ||||||||||||
|
|
|
|
|
|
|
|
|
|||||||||
| Total |
$ | – | $ | – | $ | (405,345 | ) | $ | (405,345 | ) | ||||||
|
|
|
|
|
|
|
|
|
|||||||||
F-34
Table of Contents
Index to Financial Statements
Matador Resources Company and Subsidiaries
NOTES TO CONSOLIDATED FINANCIAL STATEMENTS — CONTINUED
December 31, 2010, 2009 and 2008
NOTE 11 — FAIR VALUE MEASUREMENTS — Continued
| Description |
Fair Value Measurements
at December 31, 2009 using |
|||||||||||||||
| Level 1 | Level 2 | Level 3 | Total | |||||||||||||
| Assets (Liabilities) |
||||||||||||||||
| Asset retirement obligations |
$ | – | $ | – | $ | (199,556 | ) | $ | (199,556 | ) | ||||||
| Lease and well equipment inventory |
– | – | 492,500 | 492,500 | ||||||||||||
|
|
|
|
|
|
|
|
|
|||||||||
| Total |
$ | – | $ | – | $ | (292,944 | ) | $ | (292,944 | ) | ||||||
|
|
|
|
|
|
|
|
|
|||||||||
The Company’s accounting policies for asset retirement obligations are discussed in Note 2; reconciliations of the Company’s asset retirement obligations are provided in Note 4 for the periods presented. For purposes of fair value measurement, the Company determined that the additions to asset retirement obligations should be classified at Level 3. The Company recorded additions to asset retirement obligations of $847,845 and $199,556 in 2010 and 2009, respectively.
The Company’s accounting policies for lease and well equipment inventory are discussed in Note 2. For purposes of fair value measurement, the Company determined that lease and well equipment inventory should be classified at Level 3. The Company recorded an impairment to some of its equipment held in inventory, consisting primarily of drilling rig parts, of $50,000 and $323,500 in 2010 and 2009, respectively. The Company periodically obtains estimates of the market value of its drilling rig parts held in inventory from an independent third-party seller of similar equipment and uses these estimates as a basis for its measurement of the fair value of its drilling rig parts.
NOTE 12 — COMMITMENTS AND CONTINGENCIES
Office Lease
The Company’s corporate headquarters are located in 20,869 square feet of office space at One Lincoln Centre, 5400 LBJ Freeway, Suite 1500, Dallas, Texas. The office lease commencement date was September 25, 2003 with an expiration date of June 30, 2011. In December 2010, the Company agreed to a third amendment to its office lease agreement, in which the office space will be increased to 26,089 square feet and the term of the lease is extended from July 1, 2011 to June 30, 2022. The effective base rent over the term of the new lease extension is $19.75 per square foot per year.
The following is a schedule of future minimum lease payments required under the office lease agreement at December 31, 2010.
| Year ending December 31, |
Amount | |||
| 2011 |
$ | 207,232 | ||
| 2012 |
260,890 | |||
| 2013 |
521,780 | |||
| 2014 |
521,780 | |||
| 2015 |
534,825 | |||
| Thereafter |
3,827,256 | |||
F-35
Table of Contents
Index to Financial Statements
Matador Resources Company and Subsidiaries
NOTES TO CONSOLIDATED FINANCIAL STATEMENTS — CONTINUED
December 31, 2010, 2009 and 2008
NOTE 12 — COMMITMENTS AND CONTINGENCIES — Continued
Rent expense, including fees for operating expenses and consumption of electricity, was $386,092, $417,371 and $431,880 for 2010, 2009 and 2008, respectively.
Other Capital Commitments
At December 31, 2010, the Company had outstanding capital commitments to participate in the drilling and completion of 10 gross non-operated wells in the Haynesville shale in north Louisiana. The Company has a 1.9% working interest in each well. At December 31, 2010, the Company had minimum outstanding capital commitments for its participation in these wells of approximately $1.7 million, assuming that all 10 wells were subsequently drilled and completed by the operator. The Company expects these costs to be incurred in the next 12 months.
At December 31, 2010, the Company had outstanding capital commitments with a geophysical contractor for two 3D seismic acquisition projects on a portion of its Eagle Ford acreage in south Texas and with a division of Core Laboratories, LP for core analysis services. At December 31, 2010, the outstanding aggregate capital commitments for these projects were approximately $1.2 million, and the Company expects these costs to be incurred in the next 12 months.
Legal Proceedings
The Company is a defendant in four lawsuits encountered in the ordinary course of its business, none of which, in the opinion of management, will have a material adverse impact on the Company’s financial position, results of operations or cash flows. Certain of these matters are covered to an extent by insurance. In other cases, the Company believes it has a meritorious defense.
General Federal and State Regulations
Oil and natural gas exploration, production and related operations are subject to extensive federal and state laws, rules and regulations. Failure to comply with these laws, rules and regulations can result in substantial penalties. The regulatory burden on the oil and natural gas industry increases the cost of doing business and affects profitability. The Company believes that it is in compliance with currently applicable state and federal regulations. Because these rules and regulations are frequently amended or reinterpreted, however, the Company is unable to predict the future cost or impact of complying with these regulations.
Environmental Regulations
The exploration, development and production of oil and natural gas, including the operation of saltwater injection and disposal wells, are subject to various federal, state and local environmental laws and regulations. These laws and regulations can increase the costs of planning, designing, installing, and operating oil and natural gas wells. The Company’s activities are subject to a variety of environmental laws and regulations, including, but not limited to, the Oil Pollution Act of 1990, the Clean Water Act, the Comprehensive Environmental Response, Compensation and Liability Act, the Resource Conservation and Recovery Act, the Clean Air Act, the Safe Drinking Water Act, and the Occupational Safety and Health
F-36
Table of Contents
Index to Financial Statements
Matador Resources Company and Subsidiaries
NOTES TO CONSOLIDATED FINANCIAL STATEMENTS — CONTINUED
December 31, 2010, 2009 and 2008
NOTE 12 — COMMITMENTS AND CONTINGENCIES — Continued
Act, as well as comparable state statutes and regulations. The Company is also subject to regulations governing the handling, transportation, storage and disposal of waste generated by its activities and of naturally occurring radioactive materials, or NORM, that may result from its oil and natural gas operations. Civil and criminal fines and penalties may be imposed for noncompliance with these environmental laws and regulations. Additionally, these laws and regulations require the acquisition of permits or other governmental authorizations before undertaking some activities, limit or prohibit other activities because of protected wetlands, areas or species, and require investigation and cleanup of pollution. The Company has no outstanding material environmental remediation liabilities and believes that it is in compliance with currently applicable environmental laws and regulations and that these laws and regulations will not have a material adverse impact on the financial position, results of operations or cash flows of the Company.
Changes in environmental laws and regulations occur frequently, however, and any changes that result in more stringent and costly waste handling, storage, transport, disposal or cleanup requirements could, and in all likelihood would, materially adversely affect the Company’s financial position, results of operations and cash flows, as well as those of the oil and natural gas industry in general. Because these rules and regulations are frequently amended or reinterpreted, the Company is unable to predict the future cost or impact of complying with these regulations. For instance, recent scientific studies have suggested that emissions of certain gases, commonly referred to as “greenhouse gases,” and including carbon dioxide and methane, may be contributing to the warming of the Earth’s atmosphere. As a result, there have been attempts to pass comprehensive greenhouse gas legislation. To date, such legislation has not been enacted. Any future federal or state laws or implementing regulations that may be adopted to address greenhouse gas emissions could, and in all likelihood would, require the Company to incur increased operating costs adversely affecting its financial position, results of operations and cash flows.
The Company’s activities involve the use of hydraulic fracturing. Recently, there has been increasing regulatory scrutiny of hydraulic fracturing, which is generally exempted from regulation as underground injection at the federal level. At the federal level and in some states, there have been efforts to place additional regulatory burdens on hydraulic fracturing activities. In addition, certain bills have been introduced in the Senate and the House of Representatives that, if adopted, could increase the possibility of litigation and establish an additional level of regulation at the federal level that could lead to operational delays or increased operating costs and could, and in all likelihood, would, result in additional regulatory burdens, making it more difficult to perform hydraulic fracturing operations and increasing the Company’s costs of compliance. At the state level, Wyoming and Texas, for example, have enacted requirements for the disclosure of the composition of the fluids used in hydraulic fracturing. On June 17, 2011, Texas signed into law a mandate for public disclosure of the chemicals that operators use during hydraulic fracturing in Texas. The law goes into effect September 1, 2011. State regulators have until 2013 to complete implementing rules. In addition, at least three local governments in Texas have imposed temporary moratoria on drilling permits within city limits so that local ordinances may be reviewed to assess their adequacy to address hydraulic fracturing activities. Additional burdens on hydraulic fracturing, such as reporting requirements or permitting requirements for hydraulic fracturing activities, could, and in all likelihood would, result in additional expense and delay the Company’s operations adversely affecting its financial position, results of operations and cash flows.
F-37
Table of Contents
Index to Financial Statements
Matador Resources Company and Subsidiaries
NOTES TO CONSOLIDATED FINANCIAL STATEMENTS — CONTINUED
December 31, 2010, 2009 and 2008
NOTE 12 — COMMITMENTS AND CONTINGENCIES — Continued
Oil and natural gas exploration and production, operations and other activities have been conducted at some of the Company’s properties by previous owners and operators. Materials from these operations remain on some of the properties, and, in some instances, require remediation. In addition, the Company occasionally must agree to indemnify sellers of producing properties the Company acquires against some or all of the liability for environmental claims associated with these properties. While the Company does not believe that the costs it incurs for compliance with environmental regulations and remediating previously or currently owned or operated properties will be material, the Company cannot provide assurances that these costs will not result in material expenditures that adversely affect its financial position, results of operations and cash flows.
The Company maintains insurance against some, but not all, potential risks and losses associated with the oil and natural gas industry and operations. The Company does not carry business interruption insurance. For some risks, the Company may not obtain insurance if it believes the cost of available insurance is excessive relative to the risks presented. In addition, pollution and environmental risks generally are not fully insurable. If a significant accident or other event occurs and is not fully covered by insurance, it could, and in all likelihood would, materially adversely affect the Company’s financial position, results of operations and cash flows.
NOTE 13 — MAJOR CUSTOMERS
For the year ended December 31, 2010, the Company had three significant purchasers that each accounted for more than 10% of its total oil and natural gas revenues: Chesapeake Operating, Inc. (42%), Regency Gas Services LP (17%) and Petrohawk Energy Corporation (11%). For the year ended December 31, 2009, the Company had three significant purchasers that each accounted for more than 10% of its total oil and natural gas revenues: Chesapeake Operating, Inc. (32%), Regency Gas Services LP (25%) and J-W Operating Company (17%). For the year ended December 31, 2008, the Company had two significant purchasers that each accounted for more than 10% of its total oil and natural gas revenues: Regency Gas Services LP (45%) and J-W Operating Company (24%). Due to the nature of the markets for oil and natural gas, the Company does not believe that the loss of any one purchaser would have a material adverse impact on the Company’s financial position, results of operations or cash flows.
For the years ended December 31, 2010 and 2009, the Company had one industry partner that accounted for approximately 93% and 94%, respectively, of its accounts receivable: Goodrich Petroleum Corporation.
F-38
Table of Contents
Index to Financial Statements
Matador Resources Company and Subsidiaries
NOTES TO CONSOLIDATED FINANCIAL STATEMENTS — CONTINUED
December 31, 2010, 2009 and 2008
NOTE 14 — SUPPLEMENTAL DISCLOSURES
Accrued Liabilities
The following table summarizes the Company’s current accrued liabilities at December 31, 2010 and 2009.
| December 31, | ||||||||
| 2010 | 2009 | |||||||
| Accrued evaluated and unproved and unevaluated property costs |
$ | 12,119,475 | $ | 3,932,500 | ||||
| Accrued support equipment and facilities costs |
40,145 | 4,875 | ||||||
| Accrued cost to issue equity |
359,175 | – | ||||||
| Accrued stock-based compensation |
1,095,014 | – | ||||||
| Other |
1,044,737 | 1,269,069 | ||||||
|
|
|
|
|
|||||
| Total accrued liabilities |
$ | 14,658,546 | $ | 5,206,444 | ||||
|
|
|
|
|
|||||
Supplemental Cash Flow Information
The following table provides supplemental disclosures of cash flow information for the years ended December 31, 2010, 2009 and 2008.
| Year ended December 31, | ||||||||||||
| 2010 | 2009 | 2008 | ||||||||||
| Cash (refunded) paid for income taxes |
$ | (2,155,517 | ) | $ | (1,235,672 | ) | $ | 10,400,000 | ||||
| Asset retirement obligations related to mineral properties |
862,238 | 642,836 | 435,089 | |||||||||
| Asset retirement obligations related to support equipment and facilities |
126,386 | 8,155 | 158,756 | |||||||||
| Increase/(decrease) in liabilities for oil and natural gas properties capital expenditures |
15,530,871 | (2,470,798 | ) | (5,155,186 | ) | |||||||
| Increase in liabilities for support equipment and facilities |
39,657 | – | – | |||||||||
| Issuance of treasury stock for Board and advisor services |
47,250 | 29,375 | 77,000 | |||||||||
| Increase in liabilities for accrued cost to issue equity |
359,174 | – | – | |||||||||
| Stock-based compensation expense recognized as liability |
164,188 | – | – | |||||||||
| Transfer of inventory to oil and natural gas properties |
353,395 | – | – | |||||||||
NOTE 15 — TRANSACTIONS WITH RELATED PARTIES
In January 2007, the Company entered into a joint venture with Marlan Downey and Julie Downey Garvin of Roxanna Oil Company (“Roxanna”) to assemble acreage for and to market a new gas shale prospect in southwest Wyoming, northeast Utah and southeast Idaho. Mr. Downey is a special advisor to the Company’s Board of Directors and a shareholder in the Company. Ms. Garvin is President of Roxanna, which is also a shareholder in Matador. Mr. Downey and Ms. Garvin developed the prospect concept independently and sought the Company’s expertise in assembling a large acreage position across the prospect. To date, the Company has assembled over 140,000 acres across the prospect at a total cost of
F-39
Table of Contents
Index to Financial Statements
Matador Resources Company and Subsidiaries
NOTES TO CONSOLIDATED FINANCIAL STATEMENTS — CONTINUED
December 31, 2010, 2009 and 2008
NOTE 15 — TRANSACTIONS WITH RELATED PARTIES — Continued
approximately $9,300,000. The Company actively marketed this prospect in conjunction with Mr. Downey and Ms. Garvin. In May 2010, the Company, Roxanna and its subsidiary, Roxanna Rocky Mountains, LLC, entered into participation and joint operating agreements with an industry partner for the joint exploration and development of this opportunity. Under these agreements, Roxanna Rocky Mountains, LLC reserves a 2.5% overriding royalty interest in the leases and has the opportunity to earn up to a 10% working interest in all wells drilled. The industry partner has a 50% working interest in the project, and the Company retains a working interest equal to the difference between 50% and the working interest participation elected by Roxanna Rocky Mountains, LLC. The Company, as operator, began drilling the initial test well for this prospect located in Lincoln County, Wyoming in February 2011.
On April 15, 2008, Joseph Wm. Foran, the Company’s Chairman of the Board and Chief Executive Officer, made a partial assignment to the Company of his rights, title and interest in and to oil and gas leases in lands located in southeast New Mexico, being specifically an undivided 29.222591% working interest in a 40-acre tract (approximately 12 net acres). Prior to this assignment, Mr. Foran had received a proposal from Samson Resources Company (“Samson”) requesting an assignment of this same undeveloped working interest in the subject lands in return for a substantial cash consideration and with Mr. Foran retaining a 12.5% overriding royalty interest proportionally reduced. Mr. Foran offered the Company the opportunity to acquire this interest on terms more favorable to the Company than he was offered by Samson. Following review of this opportunity, the Company’s technical staff and management (excluding Mr. Foran) recommended pursuing an assignment of these leasehold interests from Mr. Foran. With the full approval of the Company’s management and Board of Directors (excluding Mr. Foran), Mr. Foran assigned to the Company a 29.222591% working interest in the subject lands for no cash consideration, while retaining a proportionately reduced 12.5% overriding royalty interest as to the Company’s assigned working interest and a 4% working interest for his own account. Subsequent to this transaction, one well was drilled and completed as an oil producer by Samson, and both the Company and Mr. Foran participated in the drilling and completion of this well in accordance with their respective working interests.
NOTE 16 — SUPPLEMENTAL OIL AND NATURAL GAS DISCLOSURES (Unaudited)
Costs Incurred
The following table summarizes costs incurred and capitalized by the Company in the acquisition, exploration, and development of oil and natural gas properties for the years ended December 31, 2010, 2009 and 2008.
| Year ended December 31, | ||||||||||||
| 2010 | 2009 | 2008 | ||||||||||
| Property acquisition costs |
||||||||||||
| Proved |
$ | – | $ | – | $ | – | ||||||
| Unproved and unevaluated |
100,730,019 | 24,803,480 | 30,508,649 | |||||||||
| Exploration costs |
60,718,511 | 21,386,885 | 43,888,609 | |||||||||
| Development costs |
14,348,040 | 6,225,511 | 25,001,284 | |||||||||
|
|
|
|
|
|
|
|||||||
| Total costs incurred |
$ | 175,796,570 | $ | 52,415,876 | $ | 99,398,542 | ||||||
|
|
|
|
|
|
|
|||||||
F-40
Table of Contents
Index to Financial Statements
Matador Resources Company and Subsidiaries
NOTES TO CONSOLIDATED FINANCIAL STATEMENTS — CONTINUED
December 31, 2010, 2009 and 2008
NOTE 16 — SUPPLEMENTAL OIL AND NATURAL GAS DISCLOSURES (Unaudited) — Continued
Property acquisition costs are costs incurred to purchase, lease or otherwise acquire oil and natural gas properties, including both unproved and unevaluated leasehold and purchases of reserves in place. For the years ended December 31, 2010, 2009 and 2008, respectively, almost all of the Company’s property acquisition costs resulted from the acquisition of unproved and unevaluated leasehold positions.
Exploration costs are costs incurred in identifying areas of these oil and gas properties that may warrant further examination and in examining specific areas that are considered to have prospects of containing oil and natural gas, including costs of drilling exploratory wells, geological and geophysical costs, and costs of carrying and retaining unproved and unevaluated properties. Exploration costs may be incurred before or after acquiring the related oil and natural gas properties.
Development costs are costs incurred to obtain access to proved reserves and to provide facilities for extracting, treating, gathering and storing oil and natural gas. Development costs include the costs of preparing well locations for drilling, drilling and equipping development wells and related service wells (e.g., salt water disposal wells), and acquiring, constructing and installing production facilities.
Costs incurred also include new asset retirement obligations established, as well as changes to asset retirement obligations resulting from revisions in cost estimates or abandonment dates. Asset retirement obligations included in the table above were $988,624, $650,991 and $593,845 for the years ended December 31, 2010, 2009 and 2008, respectively. Capitalized general and administrative expenses that are directly related to acquisition, exploration and development activities are also included in the table above. The Company capitalized $1,604,682, $1,642,868 and $1,679,992 of these internal costs in 2010, 2009 and 2008, respectively.
Oil and Natural Gas Operating Results
The following table provides the results of operations from oil and gas producing activities, excluding corporate overhead and interest costs, for the years ended December 31, 2010, 2009 and 2008.
| Year ended December 31, | ||||||||||||
| 2010 | 2009 | 2008 | ||||||||||
| Oil and natural gas revenues |
$ | 34,041,607 | $ | 19,038,514 | $ | 30,645,065 | ||||||
| Production taxes and marketing expenses |
1,981,550 | 1,077,145 | 1,639,198 | |||||||||
| Lease operating expenses |
5,284,362 | 4,725,022 | 4,666,591 | |||||||||
| Depletion, depreciation and amortization |
15,423,044 | 10,510,769 | 11,786,399 | |||||||||
| Full-cost ceiling impairment |
– | 25,243,738 | 22,195,127 | |||||||||
|
|
|
|
|
|
|
|||||||
| Net operating income (loss) |
11,352,651 | (22,518,160 | ) | (9,642,250 | ) | |||||||
| Income tax provision (benefit) |
4,037,877 | (8,006,782 | ) | (3,428,495 | ) | |||||||
|
|
|
|
|
|
|
|||||||
| Results of oil and natural gas operations |
$ | 7,314,774 | $ | (14,511,378 | ) | $ | (6,213,755 | ) | ||||
|
|
|
|
|
|
|
|||||||
| Depletion, depreciation and amortization per MMcfe |
$ | 1.79 | $ | 2.10 | $ | 3.56 | ||||||
|
|
|
|
|
|
|
|||||||
F-41
Table of Contents
Index to Financial Statements
Matador Resources Company and Subsidiaries
NOTES TO CONSOLIDATED FINANCIAL STATEMENTS — CONTINUED
December 31, 2010, 2009 and 2008
NOTE 16 — SUPPLEMENTAL OIL AND NATURAL GAS DISCLOSURES (Unaudited) — Continued
Oil and Natural Gas Reserves
Proved reserves are estimated quantities of oil and natural gas which geological and engineering data demonstrate with reasonable certainty to be recoverable in future years from known reservoirs using existing economic and operating conditions. Estimating oil and natural gas reserves is complex and is not exact because of the numerous uncertainties inherent in the process. The process relies on interpretations of available geological, geophysical, petrophysical, engineering and production data. The extent, quality and reliability of both the data and the associated interpretations of that data can vary. The process also requires certain economic assumptions, including, but not limited to, oil and natural gas prices, drilling and operating expenses, capital expenditures and taxes. Actual future production, oil and natural gas prices, revenues, taxes, development expenditures, operating expenses and quantities of recoverable oil and natural gas most likely will vary from the Company’s estimates.
Oil and natural gas reserves are estimated using then-current operating and economic conditions, with no provision for price and cost escalations in future periods except by contractual arrangements. In January 2009, the SEC issued The Modernization of Oil and Gas Reporting, Final Rule and in January 2010, the FASB amended Topic 932, Extractive Activities — Oil and Gas to align with this rule. As a result, beginning December 31, 2009, the commodity prices used to estimate oil and natural gas reserves are based on unweighted, arithmetic averages of first-day-of-the-month oil and natural gas prices for the previous 12-month period. For the period January through December 2010, these average oil and natural gas prices were $75.96 per barrel and $4.376 per MMBtu (million British thermal units), respectively. For the period January through December 2009, these average oil and natural gas prices were $57.65 per barrel and $3.866 per MMBtu, respectively. Prior to 2009, SEC guidelines for estimating and reporting oil and natural gas reserves required using commodity prices at the last day of the year. For 2008, these year-end oil and natural gas prices were $41.00 per barrel and $5.71 per MMBtu, respectively.
The Company’s oil and natural gas reserves estimates are prepared by the Company’s engineering staff in accordance with guidelines established by the SEC and then audited for their reasonableness and conformance with SEC guidelines and generally accepted petroleum engineering and evaluation principles by independent outside petroleum engineers. For the year ended December 31, 2008, these reserves estimates were audited by LaRoche Petroleum Consultants, Ltd. For the years ended December 31, 2009 and 2010, the Company’s reserves estimates were audited by Netherland, Sewell & Associates, Inc.
The Company’s net ownership in estimated quantities of proved oil and natural gas reserves and changes in net proved reserves are summarized as follows. All of the Company’s oil and natural gas reserves are attributable to properties located in the United States. The estimated reserves shown below are for proved reserves only and do not include any value for unproved reserves classified as probable or possible reserves that might exist for these properties, nor do they include any consideration that could be attributed to interests in unevaluated acreage beyond those tracts for which reserves have been estimated. In the tables presented throughout this section, oil is converted to gas equivalent using the ratio of one barrel of oil, condensate or natural gas liquids to 6 Mcf (thousand standard cubic feet) of natural gas.
F-42
Table of Contents
Index to Financial Statements
Matador Resources Company and Subsidiaries
NOTES TO CONSOLIDATED FINANCIAL STATEMENTS — CONTINUED
December 31, 2010, 2009 and 2008
NOTE 16 — SUPPLEMENTAL OIL AND NATURAL GAS DISCLOSURES (Unaudited) — Continued
| Net Proved Reserves | ||||||||||||
| Oil | Gas | Gas Equivalent |
||||||||||
| (Mbbl) | (MMcf) | (MMcfe) | ||||||||||
| Proved Developed and Proved Undeveloped Reserves |
||||||||||||
| Total at December 31, 2007 |
136 | 33,280 | 34,098 | |||||||||
| Revisions of prior estimates |
12 | (17,492 | ) | (17,426 | ) | |||||||
| Extensions and discoveries |
20 | 6,493 | 6,614 | |||||||||
| Production |
(37 | ) | (3,085 | ) | (3,307 | ) | ||||||
|
|
|
|
|
|
|
|||||||
| Total at December 31, 2008 |
131 | 19,196 | 19,979 | |||||||||
| Revisions of prior estimates |
(13 | ) | (811 | ) | (883 | ) | ||||||
| Extensions and discoveries |
15 | 50,367 | 50,454 | |||||||||
| Production |
(30 | ) | (4,823 | ) | (5,002 | ) | ||||||
|
|
|
|
|
|
|
|||||||
| Total at December 31, 2009 |
103 | 63,929 | 64,548 | |||||||||
| Revisions of prior estimates |
66 | 874 | 1,265 | |||||||||
| Extensions and discoveries |
16 | 71,009 | 71,107 | |||||||||
| Production |
(33 | ) | (8,400 | ) | (8,597 | ) | ||||||
|
|
|
|
|
|
|
|||||||
| Total at December 31, 2010 |
152 | 127,412 | 128,323 | |||||||||
| Proved Developed Reserves |
||||||||||||
| December 31, 2008 |
131 | 19,196 | 19,979 | |||||||||
| December 31, 2009 |
103 | 25,368 | 25,988 | |||||||||
| December 31, 2010 |
152 | 43,143 | 44,054 | |||||||||
The following is a discussion of the changes in the Company’s proved oil and natural gas reserves estimates for the years ended December 31, 2010, 2009 and 2008.
The Company’s proved oil and natural gas reserves increased to 128.3 Bcfe at December 31, 2010 from 64.5 Bcfe at December 31, 2009. The Company increased its proved oil and natural gas reserves by 72.4 Bcfe and produced 8.6 Bcfe during the year ended December 31, 2010, resulting in a net gain of 63.8 Bcfe. A total of 71.1 Bcfe of the increase in proved oil and gas reserves was a result of extensions and discoveries during the year, almost all of which was attributable to drilling operations in the Haynesville shale play in north Louisiana. A total of 1.3 Bcfe of the increase in proved oil and natural gas reserves was attributable to revisions of previous estimates, representing the net impact of small changes in prior estimates of proved reserves on a well-by-well basis. The Company’s proved developed oil and natural gas reserves increased to 44.1 Bcfe at December 31, 2010 from 26.0 Bcfe at December 31, 2009, primarily due to proved developed reserves added as a result of drilling operations in the Haynesville shale play. At December 31, 2010, the Company’s proved reserves were made up of approximately 99% natural gas and 1% oil.
The Company’s proved oil and natural gas reserves increased to 64.5 Bcfe at December 31, 2009 from 20.0 Bcfe at December 31, 2008. The Company increased its proved oil and natural gas reserves by 49.5
F-43
Table of Contents
Index to Financial Statements
Matador Resources Company and Subsidiaries
NOTES TO CONSOLIDATED FINANCIAL STATEMENTS — CONTINUED
December 31, 2010, 2009 and 2008
NOTE 16 — SUPPLEMENTAL OIL AND NATURAL GAS DISCLOSURES (Unaudited) — Continued
Bcfe and produced 5.0 Bcfe during the year ended December 31, 2009, resulting in a net gain of 44.5 Bcfe. The Company added 50.4 Bcfe in proved oil and natural gas reserves as a result of extensions and discoveries during the year, almost all of which was attributable to drilling operations in the Haynesville shale play in north Louisiana. The Company’s oil and natural gas reserves decreased by 0.9 Bcfe during the year as a result of revisions to previous estimates, representing the net impact of small changes in prior estimates of proved reserves on a well-by-well basis. The Company’s proved developed oil and natural gas reserves increased to 26.0 Bcfe at December 31, 2009 from 20.0 Bcfe at December 31, 2008, primarily due to proved developed reserves added as a result of drilling operations in the Haynesville shale play. At December 31, 2009, the Company’s proved reserves were made up of approximately 99% natural gas and 1% oil.
The Company’s proved oil and natural gas reserves decreased to 20.0 Bcfe at December 31, 2008 from 34.1 Bcfe at December 31, 2007. The Company produced 3.3 Bcfe during the year and added 6.6 Bcfe in proved oil and natural gas reserves as a result of extensions and discoveries, almost all of which was attributable to drilling operations in the Cotton Valley play in north Louisiana. The Company’s oil and natural gas reserves decreased by 17.4 Bcfe during the year due to revisions of previous estimates, primarily attributable to a sharp decline in natural gas prices during the latter half of 2008, causing the Company to remove all proved undeveloped reserves (primarily in the Cotton Valley play) from its total proved reserves estimates. The Company’s proved developed oil and natural gas reserves increased to 20.0 Bcfe at December 31, 2008 from 14.3 Bcfe at December 31, 2007, primarily due to proved developed reserves added as a result of drilling operations in the Cotton Valley play. At December 31, 2008, the Company’s proved reserves were made up of approximately 96% natural gas and 4% oil.
Standardized Measure of Discounted Future Net Cash Flows and Changes Therein Relating to Proved Oil and Natural Gas Reserves
The standardized measure of discounted future net cash flows relating to proved oil and natural gas reserves is not intended to provide an estimate of the replacement cost or fair market value of the Company’s oil and natural gas properties. An estimate of fair market value would also take into account, among other things, the recovery of reserves not presently classified as proved, anticipated future changes in prices and costs, potential improvements in industry technology and operating practices, the risks inherent in reserves estimates and perhaps different discount rates.
As noted previously, for the period January through December 2010, average oil and natural gas prices were $75.96 per barrel and $4.376 per MMBtu (million British thermal units), respectively. For the period January through December 2009, average oil and natural gas prices were $57.65 per barrel and $3.866 per MMBtu, respectively. Prior to 2009, SEC guidelines for estimating and reporting oil and natural gas reserves required using commodity prices at the last day of the year. For 2008, year-end oil and natural gas prices were $41.00 per barrel and $5.71 per MMBtu, respectively.
Future net cash flows were computed by applying these oil and natural gas prices, adjusted for all associated transportation costs, gravity and energy content, and regional price differentials, to year-end
F-44
Table of Contents
Index to Financial Statements
Matador Resources Company and Subsidiaries
NOTES TO CONSOLIDATED FINANCIAL STATEMENTS — CONTINUED
December 31, 2010, 2009 and 2008
NOTE 16 — SUPPLEMENTAL OIL AND NATURAL GAS DISCLOSURES (Unaudited) — Continued
quantities of proved oil and natural gas reserves and accounting for any future production and development costs associated with producing these reserves; neither prices nor costs were escalated with time in these computations.
Future income taxes were computed by applying the statutory tax rate to the excess of future net cash flows relating to proved oil and natural gas reserves less the tax basis of the associated properties. Tax credits and net operating loss carryforwards available to the Company were also considered in the computation of future income taxes. Future net cash flows after income taxes were discounted using a 10% annual discount rate to derive the standardized measure of discounted future net cash flows.
The following table presents the standardized measure of discounted future net cash flows relating to proved oil and natural gas reserves (in thousands) for the years ended December 31, 2010, 2009 and 2008.
| Year ended December 31, | ||||||||||||
| 2010 | 2009 | 2008 | ||||||||||
| Future cash inflows |
$ | 470,386 | $ | 219,410 | $ | 113,940 | ||||||
| Future production costs |
(107,183 | ) | (55,513 | ) | (37,871 | ) | ||||||
| Future development costs |
(107,277 | ) | (35,788 | ) | (3,330 | ) | ||||||
| Future income tax expense |
(35,352 | ) | (15,805 | ) | (3,406 | ) | ||||||
|
|
|
|
|
|
|
|||||||
| Future net cash flows |
220,574 | 112,304 | 69,333 | |||||||||
| 10% annual discount for estimated timing of cash flows |
(109,497 | ) | (47,243 | ) | (26,079 | ) | ||||||
|
|
|
|
|
|
|
|||||||
| Standardized measure of discounted future net cash flows |
$ | 111,077 | $ | 65,061 | $ | 43,254 | ||||||
|
|
|
|
|
|
|
|||||||
F-45
Table of Contents
Index to Financial Statements
Matador Resources Company and Subsidiaries
NOTES TO CONSOLIDATED FINANCIAL STATEMENTS — CONTINUED
December 31, 2010, 2009 and 2008
NOTE 16 — SUPPLEMENTAL OIL AND NATURAL GAS DISCLOSURES (Unaudited) — Continued
The following table summarizes the changes in the standardized measure of discounted future net cash flows relating to proved oil and natural gas reserves (in thousands) for the years ended December 31, 2010, 2009 and 2008.
| Year ended December 31, | ||||||||||||
| 2010 | 2009 | 2008 | ||||||||||
| Balance, beginning of period |
$ | 65,061 | $ | 43,254 | $ | 53,934 | ||||||
| Net changes in sales and transfer prices and in production (lifting) costs related to future production |
7,632 | (10,433 | ) | (18,682 | ) | |||||||
| Changes in estimated future development costs |
(36,821 | ) | (17,502 | ) | 40,902 | |||||||
| Sales and transfers of oil and gas produced during the period |
(26,776 | ) | (13,236 | ) | (24,339 | ) | ||||||
| Net change due to extensions and discoveries |
94,265 | 70,361 | 15,257 | |||||||||
| Net change due to purchase of minerals in place |
– | – | – | |||||||||
| Net changes due to revisions in estimates of reserves quantities |
1,676 | (1,232 | ) | (40,197 | ) | |||||||
| Previously estimated development costs incurred during the period |
7,125 | (590 | ) | 9,108 | ||||||||
| Accretion of discount |
7,036 | 4,317 | 5,621 | |||||||||
| Other |
1,035 | (3,068 | ) | 3,713 | ||||||||
| Net change in income taxes |
(9,156 | ) | (6,810 | ) | (2,063 | ) | ||||||
| Standardized measure of discounted future net cash flows |
$ | 111,077 | $ | 65,061 | $ | 43,254 | ||||||
|
|
|
|
|
|
|
|||||||
NOTE 17 — SUBSEQUENT EVENTS
Subsequent events have been evaluated by the Company through August 12, 2011, the date the financial statements were available to be issued.
In January 2011, the Company sold 53,772 shares of Class A common stock at $11.00 per share and received net proceeds of $584,918 in conclusion of its October 2010 through January 2011 private offering (see Note 9).
Between January and July 2011, the Company committed to participate in 36 gross (approximately 1.1 net) non-operated wells in the Haynesville shale in north Louisiana. The Company has working interests ranging from 0.2% to 18.7% in these wells, and most of these wells are already in progress. The Company’s minimum outstanding capital commitments for its participation in these non-operated Haynesville wells are approximately $3.2 million, assuming that all these wells are drilled and completed by the operators.
In May and July 2011, the Company entered into two drilling rig contracts to explore and develop its Eagle Ford acreage in south Texas. The Company expects the first rig will begin drilling operations on its acreage in August 2011, with the second rig beginning drilling operations on its acreage in October 2011. Both contracts are for a term of six months. Should the Company elect to terminate both contracts prior to initiating drilling operations, and if the drilling contractor were unable to secure work for both rigs prior to the end of their respective contract terms, the Company would incur an aggregate termination obligation of approximately $5.5 million.
F-46
Table of Contents
Index to Financial Statements
Matador Resources Company and Subsidiaries
NOTES TO CONSOLIDATED FINANCIAL STATEMENTS — CONTINUED
December 31, 2010, 2009 and 2008
NOTE 17 — SUBSEQUENT EVENTS — Continued
In May 2011, the Company entered into three additional costless collar transactions to mitigate its risks associated with fluctuations in natural gas prices. The following table summarizes these natural gas hedging contracts.
| Commodity |
Calculation Period | Notional Quantity |
Price Floor |
Price Ceiling |
||||||||||||
| (MMBtu/ month) |
($/MMBtu) | ($/MMBtu) | ||||||||||||||
| Natural Gas |
07/01/2011 - 12/31/2012 | 300,000 | 4.50 | 5.60 | ||||||||||||
| Natural Gas |
07/01/2011 - 07/31/2013 | 150,000 | 4.50 | 5.75 | ||||||||||||
| Natural Gas |
01/01/2012 - 12/31/2012 | 150,000 | 4.25 | 6.17 | ||||||||||||
Between March and July 2011, the Company acquired leasehold interests in approximately 6,274 gross and 4,802 net acres in Karnes, DeWitt, Wilson and Gonzales Counties, Texas. This acreage is prospective for the Eagle Ford shale, an emerging oil and natural gas play in south Texas. The Company paid approximately $31.5 million in cash and agreed to additional drilling and completion incentives to the seller in the form of back-in interests and future participation rights to acquire this acreage.
In May 2011, the Company amended and restated its Credit Agreement with Comerica Bank. This amendment increased the borrowing base under the Credit Agreement from $55,000,000 to $80,000,000 and amended the debt to EBITDA ratio (defined as total debt outstanding divided by a rolling four-quarter EBITDA) to 4.00 or less at all times. Under the amended and restated Credit Agreement, the Company also entered into a term loan for $25,000,000 with a maturity date of December 31, 2011. Proceeds from the term loan were used in partial payment of the acreage acquisition described above; the remaining funds required for the acreage acquisition were provided under the borrowing base. The term loan bears interest at LIBOR plus 5.00%, and while the term loan is outstanding, the Company’s other borrowings under the Credit Agreement bear interest at the maximum rate of LIBOR plus 1.875%. At August 12, 2011, including the term loan, the Company had $85,000,000 of outstanding borrowings under the Credit Agreement and $375,000 in letters of credit secured by the Credit Agreement. All borrowings under the Credit Agreement are Eurodollar loans. The term loan bears interest at approximately 5.3%, and the other borrowings bear interest at approximately 2.1%.
In June 2011, the Company awarded bonuses to certain of its current employees, but not including any of its executive officers, in the aggregate amount of $1,240,000. These bonuses will be payable in a lump sum to each of these employees in June 2014, provided each continues to remain an employee in good standing with the Company at that time.
F-47
Table of Contents
Index to Financial Statements
Matador Resources Company and Subsidiaries
CONDENSED CONSOLIDATED FINANCIAL STATEMENTS
March 31, 2011
Contents
| Condensed Consolidated Financial Statements |
||||
| Condensed Consolidated Balance Sheets at March 31, 2011 (Unaudited) and December 31, 2010 |
F-49 | |||
| F-50 | ||||
| F-51 | ||||
| F-52 | ||||
| Notes to Condensed Consolidated Financial Statements (Unaudited) |
F-53 | |||
F-48
Table of Contents
Index to Financial Statements
Matador Resources Company and Subsidiaries
CONDENSED CONSOLIDATED BALANCE SHEETS
| March 31, 2011 |
December 31, 2010 |
|||||||
| (Unaudited) | ||||||||
| ASSETS |
||||||||
| Current assets |
||||||||
| Cash and cash equivalents |
$ | 14,460,867 | $ | 21,059,519 | ||||
| Certificates of deposit |
2,079,313 | 2,349,313 | ||||||
| Accounts receivable |
||||||||
| Oil and natural gas revenues |
9,050,230 | 6,514,122 | ||||||
| Joint interest billings |
2,109,850 | 2,042,999 | ||||||
| Other |
1,819,377 | 3,091,372 | ||||||
| Derivative instruments |
2,476,296 | 4,144,411 | ||||||
| Lease and well equipment inventory |
1,736,609 | 1,423,197 | ||||||
| Prepaid expenses |
1,366,323 | 1,876,358 | ||||||
|
|
|
|
|
|||||
| Total current assets |
35,098,865 | 42,501,291 | ||||||
| Property and equipment, at cost |
||||||||
| Oil and natural gas properties, full-cost method |
||||||||
| Evaluated |
322,056,677 | 255,408,993 | ||||||
| Unproved and unevaluated |
144,947,305 | 172,451,449 | ||||||
| Other property and equipment |
14,893,058 | 14,035,010 | ||||||
| Less accumulated depletion, depreciation and amortization |
(180,799,296 | ) | (138,014,986 | ) | ||||
|
|
|
|
|
|||||
| Net property and equipment |
301,097,744 | 303,880,466 | ||||||
|
|
|
|
|
|||||
| Total assets |
$ | 336,196,609 | $ | 346,381,757 | ||||
|
|
|
|
|
|||||
| LIABILITIES AND SHAREHOLDERS’ EQUITY |
||||||||
| Current liabilities |
||||||||
| Accounts payable |
$ | 10,926,715 | $ | 12,166,938 | ||||
| Accrued liabilities |
24,894,307 | 14,658,546 | ||||||
| Royalties payable |
1,398,440 | 982,270 | ||||||
| Advances from joint interest owners |
– | 722,843 | ||||||
| Deferred income taxes |
– | 1,473,619 | ||||||
| Dividends payable — Class B |
68,713 | 68,713 | ||||||
| Other liabilities |
156,039 | 23,577 | ||||||
|
|
|
|
|
|||||
| Total current liabilities |
37,444,214 | 30,096,506 | ||||||
| Long-term liabilities |
||||||||
| Borrowings under Credit Agreement |
40,000,000 | 25,000,000 | ||||||
| Asset retirement obligations |
3,809,319 | 3,695,017 | ||||||
| Deferred income taxes |
– | 5,432,638 | ||||||
| Other long-term liabilities |
134,137 | 280,453 | ||||||
|
|
|
|
|
|||||
| Total long-term liabilities |
43,943,456 | 34,408,108 | ||||||
| Commitments and contingencies (Note 8) |
||||||||
| Shareholders’ equity |
||||||||
| Common stock — Class A, $0.01 par value, 80,000,000 shares authorized; 42,826,842 and 42,749,820 shares issued; and 41,647,667 and 41,570,645 shares outstanding, respectively |
428,268 | 427,498 | ||||||
| Common stock — Class B, $0.01 par value, 2,000,000 shares authorized; 1,030,700 shares issued and outstanding |
10,307 | 10,307 | ||||||
| Additional paid-in capital |
263,937,046 | 263,341,642 | ||||||
| Retained earnings |
1,198,140 | 28,862,518 | ||||||
| Treasury stock, at cost, 1,179,175 shares |
(10,764,822 | ) | (10,764,822 | ) | ||||
|
|
|
|
|
|||||
| Total shareholders’ equity |
254,808,939 | 281,877,143 | ||||||
|
|
|
|
|
|||||
| Total liabilities and shareholders’ equity |
$ | 336,196,609 | $ | 346,381,757 | ||||
|
|
|
|
|
|||||
The accompanying notes are an integral part of these financial statements.
F-49
Table of Contents
Index to Financial Statements
Matador Resources Company and Subsidiaries
CONDENSED CONSOLIDATED STATEMENTS OF OPERATIONS (UNAUDITED)
| Three Months Ended March 31, |
||||||||
| 2011 | 2010 | |||||||
| Revenues |
||||||||
| Oil and natural gas revenues |
$ | 13,698,578 | $ | 9,190,073 | ||||
| Realized gain on derivatives |
1,849,750 | 301,560 | ||||||
| Unrealized (loss) gain on derivatives |
(1,668,115 | ) | 6,093,455 | |||||
|
|
|
|
|
|||||
| Total revenues |
13,880,213 | 15,585,088 | ||||||
| Expenses |
||||||||
| Production taxes and marketing |
1,299,557 | 267,324 | ||||||
| Lease operating |
1,605,092 | 1,332,036 | ||||||
| Depletion, depreciation and amortization |
7,111,211 | 3,361,835 | ||||||
| Accretion of asset retirement obligations |
39,220 | 37,800 | ||||||
| Full-cost ceiling impairment |
35,673,098 | – | ||||||
| General and administrative |
2,618,591 | 2,031,724 | ||||||
|
|
|
|
|
|||||
| Total expenses |
48,346,769 | 7,030,719 | ||||||
|
|
|
|
|
|||||
| Operating (loss) income |
(34,466,556 | ) | 8,554,369 | |||||
| Other income (expense) |
||||||||
| Interest and other income |
71,099 | 95,690 | ||||||
| Interest expense |
(106,465 | ) | – | |||||
|
|
|
|
|
|||||
| Total other (expense) income |
(35,366 | ) | 95,690 | |||||
|
|
|
|
|
|||||
| (Loss) income before income taxes |
(34,501,922 | ) | 8,650,059 | |||||
| Income tax (benefit) provision |
||||||||
| Current |
– | – | ||||||
| Deferred |
(6,906,257 | ) | 2,974,522 | |||||
|
|
|
|
|
|||||
| Total income tax (benefit) provision |
(6,906,257 | ) | 2,974,522 | |||||
| Net (loss) income |
$ | (27,595,665 | ) | $ | 5,675,537 | |||
|
|
|
|
|
|||||
| Earnings (loss) per common share |
||||||||
| Basic |
||||||||
| Class A |
$ | (0.65 | ) | $ | 0.14 | |||
|
|
|
|
|
|||||
| Class B |
$ | (0.58 | ) | $ | 0.21 | |||
|
|
|
|
|
|||||
| Diluted |
||||||||
| Class A |
$ | (0.65 | ) | $ | 0.14 | |||
|
|
|
|
|
|||||
| Class B |
$ | (0.58 | ) | $ | 0.21 | |||
|
|
|
|
|
|||||
| Weighted average common shares outstanding |
||||||||
| Basic |
||||||||
| Class A |
41,624,580 | 40,383,765 | ||||||
| Class B |
1,030,700 | 1,030,700 | ||||||
|
|
|
|
|
|||||
| Total |
42,655,280 | 41,414,465 | ||||||
|
|
|
|
|
|||||
| Diluted |
||||||||
| Class A |
41,624,580 | 40,445,245 | ||||||
| Class B |
1,030,700 | 1,030,700 | ||||||
|
|
|
|
|
|||||
| Total |
42,655,280 | 41,475,945 | ||||||
|
|
|
|
|
|||||
The accompanying notes are an integral part of these financial statements.
F-50
Table of Contents
Index to Financial Statements
Matador Resources Company and Subsidiaries
CONDENSED CONSOLIDATED STATEMENT OF SHAREHOLDERS’ EQUITY (UNAUDITED)
For the three months ended March 31, 2011
| Common stock | Additional paid-in capital |
Retained earnings (deficit) |
Total | |||||||||||||||||||||||||||||||||
| Class A | Class B | Treasury stock | ||||||||||||||||||||||||||||||||||
| Shares | Amount | Shares | Amount | Shares | Amount | |||||||||||||||||||||||||||||||
| Balance at January 1, 2011 |
42,749,820 | $ | 427,498 | 1,030,700 | $ | 10,307 | $ | 263,341,642 | $ | 28,862,518 | (1,179,175 | ) | $ | (10,764,822 | ) | $ | 281,877,143 | |||||||||||||||||||
| Issuance of Class A common stock |
53,772 | 538 | – | – | 590,954 | – | – | – | 591,492 | |||||||||||||||||||||||||||
| Additional cost to issue equity |
– | – | – | – | (267,411 | ) | – | – | – | (267,411 | ) | |||||||||||||||||||||||||
| Issuance of Class A common stock to Board members and advisors |
750 | 7 | – | – | 8,243 | – | – | – | 8,250 | |||||||||||||||||||||||||||
| Stock options granted |
– | – | – | – | 50,342 | – | – | – | 50,342 | |||||||||||||||||||||||||||
| Stock options exercised |
22,500 | 225 | – | – | 202,275 | – | – | – | 202,500 | |||||||||||||||||||||||||||
| Restricted stock vested |
– | – | – | – | 11,001 | – | – | – | 11,001 | |||||||||||||||||||||||||||
| Class B dividends declared |
– | – | – | – | – | (68,713 | ) | – | – | (68,713 | ) | |||||||||||||||||||||||||
| Current period net loss |
– | – | – | – | – | (27,595,665 | ) | – | – | (27,595,665 | ) | |||||||||||||||||||||||||
|
|
|
|
|
|
|
|
|
|
|
|
|
|
|
|
|
|
|
|||||||||||||||||||
| Balance at March 31, 2011 |
42,826,842 | $ | 428,268 | 1,030,700 | $ | 10,307 | $ | 263,937,046 | $ | 1,198,140 | (1,179,175 | ) | $ | (10,764,822 | ) | $ | 254,808,939 | |||||||||||||||||||
|
|
|
|
|
|
|
|
|
|
|
|
|
|
|
|
|
|
|
|||||||||||||||||||
The accompanying notes are an integral part of these financial statements.
F-51
Table of Contents
Index to Financial Statements
Matador Resources Company and Subsidiaries
CONDENSED CONSOLIDATED STATEMENTS OF CASH FLOWS (UNAUDITED)
| Three Months Ended March 31, |
||||||||
| 2011 | 2010 | |||||||
| Operating activities |
||||||||
| Net (loss) income |
$ | (27,595,665 | ) | $ | 5,675,537 | |||
| Adjustments to reconcile net (loss) income to net cash provided by operating activities |
||||||||
| Unrealized loss (gain) on derivatives |
1,668,115 | (6,093,455 | ) | |||||
| Depletion, depreciation and amortization |
7,111,211 | 3,361,835 | ||||||
| Accretion of asset retirement obligations |
39,220 | 37,800 | ||||||
| Full-cost ceiling impairment |
35,673,098 | – | ||||||
| Stock option and grant expense |
42,342 | 180,300 | ||||||
| Restricted stock grants |
11,001 | 5,625 | ||||||
| Deferred income tax (benefit) provision |
(6,906,257 | ) | 2,974,522 | |||||
| Changes in operating assets and liabilities |
||||||||
| Accounts receivable |
(1,487,670 | ) | 3,166,871 | |||||
| Lease and well equipment inventory |
– | (3,031 | ) | |||||
| Prepaid expenses |
510,035 | (1,092,349 | ) | |||||
| Accounts payable, accrued liabilities and other liabilities |
4,098,248 | 866,683 | ||||||
| Royalties payable |
416,170 | 32,153 | ||||||
| Advances from joint interest owners |
(722,843 | ) | – | |||||
| Other long-term liabilities |
(125,000 | ) | (11,788 | ) | ||||
|
|
|
|
|
|||||
| Net cash provided by operating activities |
12,732,005 | 9,100,703 | ||||||
| Investing activities |
||||||||
| Oil and natural gas properties capital expenditures |
(34,113,878 | ) | (22,208,253 | ) | ||||
| Expenditures for other property and equipment |
(1,180,181 | ) | (535,632 | ) | ||||
| Purchases of certificates of deposit |
(1,329,000 | ) | (3,489,000 | ) | ||||
| Sales of certificates of deposit |
1,599,000 | 4,490,000 | ||||||
|
|
|
|
|
|||||
| Net cash used in investing activities |
(35,024,059 | ) | (21,742,885 | ) | ||||
| Financing activities |
||||||||
| Borrowings under Credit Agreement |
15,000,000 | – | ||||||
| Proceeds from issuance of common stock, net of cost to issue equity |
559,615 | – | ||||||
| Proceeds from stock options exercised |
202,500 | 100,000 | ||||||
| Payment of dividends — Class B |
(68,713 | ) | (68,713 | ) | ||||
| Issuance of treasury stock |
– | – | ||||||
|
|
|
|
|
|||||
| Net cash provided by financing activities |
15,693,402 | 31,287 | ||||||
|
|
|
|
|
|||||
| Decrease in cash and cash equivalents |
(6,598,652 | ) | (12,610,895 | ) | ||||
| Cash and cash equivalents at beginning of period |
21,059,519 | 104,229,709 | ||||||
|
|
|
|
|
|||||
| Cash and cash equivalents at end of period |
$ | 14,460,867 | $ | 91,618,814 | ||||
|
|
|
|
|
|||||
The accompanying notes are an integral part of these financial statements.
F-52
Table of Contents
Index to Financial Statements
Matador Resources Company and Subsidiaries
NOTES TO CONDENSED CONSOLIDATED FINANCIAL STATEMENTS (UNAUDITED)
March 31, 2011
NOTE 1 — NATURE OF OPERATIONS
Matador Resources Company (“Matador” or “Company”) is an independent energy company engaged in the exploration, development, acquisition and production of oil and natural gas resources in the United States, with a particular emphasis on oil and natural gas shale plays and other unconventional resources. Matador’s current operations are located primarily in the Haynesville shale play in north Louisiana and east Texas and the Eagle Ford shale play in south Texas; these plays are key elements of the Company’s growth strategy. In addition to these primary operating areas, Matador has significant acreage positions in southeast New Mexico and west Texas and in southwest Wyoming and adjacent areas in Utah and Idaho where the Company continues to identify new oil and natural gas prospects.
On November 22, 2010, Matador Resources Company formed a wholly-owned subsidiary, Matador Holdco, Inc. Pursuant to the terms of the corporate reorganization that was completed on August 9, 2011, Matador Resources Company changed its corporate name to MRC Energy Company and Matador Holdco, Inc. changed its corporate name to Matador Resources Company. As a part of this reorganization, MRC Energy Company became a wholly owned subsidiary of Matador Resources Company.
NOTE 2 — SUMMARY OF SIGNIFICANT ACCOUNTING POLICIES
Interim Financial Statements, Basis of Presentation, Consolidation and Significant Estimates
The accompanying unaudited condensed consolidated financial statements of Matador and its subsidiaries have been prepared in accordance with generally accepted accounting principles in the United States of America (“U.S. GAAP”), but do not include all of the information and footnotes required for complete financial statements. All intercompany accounts and transactions have been eliminated in consolidation. In management’s opinion, these interim unaudited condensed consolidated financial statements include all adjustments of a normal recurring nature necessary for a fair statement of the Company’s consolidated financial position at March 31, 2011, consolidated results of operations for the three months ended March 31, 2011 and 2010, consolidated shareholders’ equity for the three months ended March 31, 2011 and consolidated cash flows for the three months ended March 31, 2011 and 2010.
Accounting measurements at interim dates inherently involve greater reliance on estimates than at year end and the results for the interim periods shown in this report are not necessarily indicative of results to be expected for the full year due in part to volatility in oil and natural gas prices, global economic and financial market conditions, interest rates, access to sources of liquidity, estimates of reserves, drilling risks, geological risks, transportation restrictions, oil and natural gas supply and demand, market competition and interruptions of production. These interim unaudited condensed consolidated financial statements should be read in conjunction with the Company’s audited consolidated financial statements and notes thereto for the year ended December 31, 2010.
The preparation of financial statements in conformity with U.S. GAAP requires management to make estimates and assumptions that affect the amounts reported in the financial statements and accompanying notes. These estimates and assumptions may also affect disclosure of contingent assets and liabilities at the date of the financial statements and the reported amounts of revenues and expenses during the reporting
F-53
Table of Contents
Index to Financial Statements
Matador Resources Company and Subsidiaries
NOTES TO CONDENSED CONSOLIDATED FINANCIAL STATEMENTS (UNAUDITED) — CONTINUED
March 31, 2011
NOTE 2 — SUMMARY OF SIGNIFICANT ACCOUNTING POLICIES — Continued
period. The Company’s consolidated financial statements are based on a number of significant estimates, including oil and natural gas revenues, accrued assets and liabilities, stock-based compensation, valuation of derivative instruments and oil and natural gas reserves. The estimates of oil and natural gas reserves quantities and future net cash flows are the basis for the calculations of depletion and impairment of oil and natural gas properties, as well as estimates of asset retirement obligations and certain tax accruals. While the Company believes its estimates are reasonable, changes in facts and assumptions or the discovery of new information may result in revised estimates. Actual results could differ from these estimates.
Property and Equipment
The Company uses the full-cost method of accounting for its investments in oil and natural gas properties. Under this method of accounting, all costs associated with the acquisition, exploration and development of oil and natural gas properties and reserves, including unproved and unevaluated property costs, are capitalized as incurred. Internal costs are capitalized only to the extent they are directly related to acquisition, exploration, or development activities and do not include any costs related to production, selling or general corporate administrative activities. The Company capitalized $501,519 of these internal costs for the three months ended March 31, 2011 and $1,604,682 of these internal costs in 2010.
If the net capitalized costs of evaluated oil and natural gas properties less related deferred income taxes exceed the present value of after-tax future net cash flows from proved oil and natural gas reserves, discounted at 10%, such excess is charged to operations as a full-cost ceiling impairment. The estimated present value of after-tax future net cash flows from proved oil and natural gas reserves is highly dependent on the commodity prices used in these estimates. These estimates are determined in accordance with guidelines established by the Securities and Exchange Commission (“SEC”) for estimating and reporting oil and natural gas reserves. Under these guidelines, oil and natural gas reserves are estimated using then-current operating and economic conditions, with no provision for price and cost escalations in future periods except by contractual arrangements.
Beginning December 31, 2009, the commodity prices used to estimate oil and natural gas reserves are based on unweighted, arithmetic averages of first-day-of-the-month oil and natural gas prices for the previous 12-month period. For the period April 1, 2010 through March 31, 2011, these average oil and natural gas prices were $80.04 per barrel and $4.102 per MMBtu (million British thermal units), respectively. In estimating the present value of after-tax future net cash flows from proved oil and natural gas reserves, the average oil prices were further adjusted by property for quality, transportation fees and regional price differentials, and the average natural gas prices were further adjusted by property for energy content, transportation fees and regional price differentials. At March 31, 2011, the Company’s oil and natural gas reserves estimates were prepared by the Company’s engineering staff in accordance with guidelines established by the SEC. The Company’s oil and natural gas reserves estimates at March 31, 2011 have been audited for their reasonableness and conformance with SEC guidelines and generally accepted petroleum engineering and evaluation principles by Netherland, Sewell & Associates, Inc., independent petroleum engineers.
F-54
Table of Contents
Index to Financial Statements
Matador Resources Company and Subsidiaries
NOTES TO CONDENSED CONSOLIDATED FINANCIAL STATEMENTS (UNAUDITED) — CONTINUED
March 31, 2011
NOTE 2 — SUMMARY OF SIGNIFICANT ACCOUNTING POLICIES — Continued
Using the average commodity prices, as further adjusted, to determine the Company’s estimated proved oil and natural gas reserves at March 31, 2011, the Company’s net capitalized costs less related deferred income taxes exceeded the full-cost ceiling by $22,989,866. The Company recorded an impairment charge of $35,673,098 to its net capitalized costs and a deferred income tax credit of $12,683,232 related to the full-cost ceiling limitation at March 31, 2011. Corresponding charges were also recorded to the Company’s unaudited condensed consolidated statement of operations for the three months ended March 31, 2011. The Company recorded no impairment to its net capitalized costs and no corresponding charge to its unaudited condensed consolidated statement of operations for the three months ended March 31, 2010.
As a non-cash item, the full-cost ceiling impairment impacts the accumulated depletion and the net carrying value of the Company’s assets on its balance sheet, as well as the corresponding shareholders’ equity, but it has no impact on the Company’s net cash flows as reported.
Capitalized costs of oil and natural gas properties are amortized using the unit-of-production method based upon production and estimates of proved reserves quantities. Unproved and unevaluated property costs are excluded from the amortization base used to determine depletion. Unproved and unevaluated properties are assessed for possible impairment on a periodic basis based upon changes in operating or economic conditions. This assessment includes consideration of the following factors, among others: the assignment of proved reserves, geological and geophysical evaluations, intent to drill, remaining lease term, and drilling activity and results. Upon impairment, the costs of the unproved and unevaluated properties are immediately included in the amortization base. Exploratory dry holes are included in the amortization base immediately upon determination that the well is not productive.
Income Taxes
The Company files a United States federal income tax return and several state tax returns, a number of which remain open for examination. The tax years open for examination for the federal tax return are 2007, 2008, 2009 and 2010. The tax years open for examination by the state of Texas are 2008, 2009 and 2010. The tax years open for examination by the state of Louisiana are 2007, 2008, 2009 and 2010. As of August 12, 2011, the Company’s 2007, 2008 and 2009 income and franchise tax returns are under examination by the state of Louisiana. The tax years open for examination by the state of New Mexico are 2008, 2009 and 2010.
The Company accounts for income taxes using the asset and liability approach for financial accounting and reporting. The Company evaluates the probability of realizing the future benefits of its deferred tax assets and provides a valuation allowance for the portion of any deferred tax assets where the likelihood of realizing an income tax benefit in the future does not meet the more likely than not criteria for recognition.
As noted previously, the Company recorded an impairment charge of $22,989,866 to its net capitalized costs, including a deferred income tax credit of $12,683,232 related to the full-cost ceiling limitation at March 31, 2011. This deferred income tax credit exceeded the Company’s deferred tax liabilities at
F-55
Table of Contents
Index to Financial Statements
Matador Resources Company and Subsidiaries
NOTES TO CONDENSED CONSOLIDATED FINANCIAL STATEMENTS
(UNAUDITED) — CONTINUED
March 31, 2011
NOTE 2 — SUMMARY OF SIGNIFICANT ACCOUNTING POLICIES — Continued
March 31, 2011. As a result, the Company established a valuation allowance in the amount of $5,261,763 at March 31, 2011 due to uncertainties regarding the future realization of its deferred tax assets. The Company will continue to assess the valuation allowance on a periodic basis and, to the extent the Company determines that the allowance is no longer required, the tax benefit of the remaining deferred tax assets will be recognized in the future.
We had a net loss for the three months ended March 31, 2011 and our effective tax rate for the three months ended March 31, 2010 was 34.38%. Total income tax expense for the three months ended March 31, 2011 and 2010 differed from the amounts computed by applying the U.S. statutory tax rates to income before income taxes due primarily to state taxes and the impact of permanent differences between book and taxable income.
Earnings Per Common Share
The Company reports basic earnings per common share, which excludes the effect of potentially dilutive securities, and diluted earnings per common share, which includes the effect of all potentially dilutive securities, unless their impact is anti-dilutive.
The Company has issued two classes of common stock, Class A and Class B. The holders of the Class B shares are entitled to be paid cumulative dividends at a per share rate of $0.26-2/3 annually out of funds legally available for the payment of dividends. These dividends are accrued and paid quarterly. Dividends declared during the three months ended March 31, 2011 and 2010 totaled $68,713 in each period. At March 31, 2011, the Company had not paid any dividends to holders of the Class A shares.
F-56
Table of Contents
Index to Financial Statements
Matador Resources Company and Subsidiaries
NOTES TO CONDENSED CONSOLIDATED FINANCIAL STATEMENTS (UNAUDITED) — CONTINUED
March 31, 2011
NOTE 2 — SUMMARY OF SIGNIFICANT ACCOUNTING POLICIES — Continued
The following are reconciliations of the numerators and denominators used to compute the Company’s basic and diluted distributed and undistributed earnings per common share as reported for the three months ended March 31, 2011 and 2010.
| Three Months Ended March 31, |
||||||||
| 2011 | 2010 | |||||||
| Net income (loss) — numerator |
||||||||
| Net (loss) income |
$ | (27,595,665 | ) | $ | 5,675,537 | |||
| Less dividends to Class B shareholders — distributed earnings |
(68,713 | ) | (68,713 | ) | ||||
|
|
|
|
|
|||||
| Undistributed earnings |
$ | (27,664,378 | ) | $ | 5,606,824 | |||
|
|
|
|
|
|||||
| Weighted average common shares outstanding — denominator |
||||||||
| Basic |
||||||||
| Class A |
41,624,580 | 40,383,765 | ||||||
| Class B |
1,030,700 | 1,030,700 | ||||||
|
|
|
|
|
|||||
| Total |
42,655,280 | 41,414,465 | ||||||
|
|
|
|
|
|||||
| Diluted |
||||||||
| Class A |
||||||||
| Weighted average common shares outstanding for basic earnings per share |
41,624,580 | 40,383,765 | ||||||
| Dilutive effect of options |
– | 61,480 | ||||||
|
|
|
|
|
|||||
| Class A weighted average common shares outstanding — diluted |
41,624,580 | 40,445,245 | ||||||
| Class B |
||||||||
| Weighted average common shares outstanding — no associated dilutive shares |
1,030,700 | 1,030,700 | ||||||
|
|
|
|
|
|||||
| Total diluted weighted average common shares outstanding |
42,655,280 | 41,475,945 | ||||||
|
|
|
|
|
|||||
F-57
Table of Contents
Index to Financial Statements
Matador Resources Company and Subsidiaries
NOTES TO CONDENSED CONSOLIDATED FINANCIAL STATEMENTS (UNAUDITED) — CONTINUED
March 31, 2011
NOTE 2 — SUMMARY OF SIGNIFICANT ACCOUNTING POLICIES — Continued
| Three Months Ended March 31, |
||||||||
| 2011 | 2010 | |||||||
| Earnings (loss) per common share |
||||||||
| Basic |
||||||||
| Class A |
||||||||
| Distributed earnings |
$ | – | $ | – | ||||
| Undistributed (loss) earnings |
$ | (0.65 | ) | $ | 0.14 | |||
|
|
|
|
|
|||||
| Total |
$ | (0.65 | ) | $ | 0.14 | |||
|
|
|
|
|
|||||
| Class B |
||||||||
| Distributed earnings |
$ | 0.07 | $ | 0.07 | ||||
| Undistributed (loss) earnings |
$ | (0.65 | ) | $ | 0.14 | |||
|
|
|
|
|
|||||
| Total |
$ | (0.58 | ) | $ | 0.21 | |||
|
|
|
|
|
|||||
| Diluted |
||||||||
| Class A |
||||||||
| Distributed earnings |
$ | – | $ | – | ||||
| Undistributed (loss) earnings |
$ | (0.65 | ) | $ | 0.14 | |||
|
|
|
|
|
|||||
| Total |
$ | (0.65 | ) | $ | 0.14 | |||
|
|
|
|
|
|||||
| Class B |
||||||||
| Distributed earnings |
$ | 0.07 | $ | 0.07 | ||||
| Undistributed (loss) earnings |
$ | (0.65 | ) | $ | 0.14 | |||
|
|
|
|
|
|||||
| Total |
$ | (0.58 | ) | $ | 0.21 | |||
|
|
|
|
|
|||||
A total of 1,178,500 options to purchase shares of the Company’s Class A common stock were excluded from the calculations above for the three months ended March 31, 2011 because their effects were anti-dilutive.
Fair Value Measurements
The Company measures and reports certain assets and liabilities on a fair value basis. Fair value is the price that would be received to sell an asset or paid to transfer a liability in an orderly transaction between market participants at the measurement date (exit price). The Company follows Financial Accounting Standards Board (“FASB”) guidance establishing a fair value hierarchy that prioritizes the inputs to valuation methods used to measure fair value.
The carrying amounts reported on the unaudited condensed consolidated balance sheet for cash and cash equivalents, certificates of deposit, accounts receivable, prepaid expenses, accounts payable, accrued liabilities, royalties payable, advances from joint interest owners, dividends payable and other liabilities approximate their fair values, due to the short-term maturity of these instruments.
F-58
Table of Contents
Index to Financial Statements
Matador Resources Company and Subsidiaries
NOTES TO CONDENSED CONSOLIDATED FINANCIAL STATEMENTS (UNAUDITED) — CONTINUED
March 31, 2011
NOTE 2 — SUMMARY OF SIGNIFICANT ACCOUNTING POLICIES — Continued
At March 31 2011, the carrying value of $40,000,000 for the Company’s borrowings under its $150,000,000 senior secured revolving Credit Agreement (the “Credit Agreement”) on the unaudited condensed consolidated balance sheet is approximately fair value as it is subject to short-term floating interest rates that approximate the rates available to the Company at the time.
Recent Accounting Pronouncements
Fair Value. In May 2011, the FASB issued Accounting Standards Update (“ASU”) 2011-04, Amendments to Achieve Common Fair Value Measurement and Disclosure Requirements in U.S. GAAP and IFRS (“ASU 2011-04”). ASU 2011-04 amends Accounting Standards Codification (“ASC”) 820, Fair Value Measurements (“ASC 820”), providing a consistent definition and measurement of fair value, as well as similar disclosure requirements between U.S. GAAP and International Financial Reporting Standards. ASU 2011-04 changes certain fair value measurement principles, clarifies the application of existing fair value measurements and expands the ASC 820 disclosure requirements, particularly for Level 3 fair value measurements. The adoption of ASU 2011-04 is not expected to have a material effect on the Company’s consolidated financial statements, but may require certain additional disclosures. The amendments in ASU 2011-04 are to be applied prospectively. For public entities, the amendments are effective during interim and annual periods beginning after December 15, 2011.
NOTE 3 — ASSET RETIREMENT OBLIGATIONS
The following table summarizes the changes in the Company’s asset retirement obligations for the three months ended March 31, 2011.
| Beginning asset retirement obligations |
$ | 3,695,017 | ||
| Liabilities incurred during period |
75,082 | |||
| Revisions in estimated cash flows |
– | |||
| Liabilities settled during period |
– | |||
| Accretion expense |
39,220 | |||
|
|
|
|||
| Ending asset retirement obligations |
$ | 3,809,319 | ||
|
|
|
NOTE 4 — REVOLVING CREDIT AGREEMENT
In March 2008, the Company entered into the Credit Agreement with Comerica Bank, N.A. (“Comerica Bank”) as Administrative Agent, Syndication and Documentation Agent and Issuing Lender. The Credit Agreement is secured by a significant portion of the Company’s oil and natural gas producing properties and by the equity interests of all its subsidiaries. In addition, all obligations under the Credit Agreement are guaranteed by the Company’s subsidiaries. The Credit Agreement matures in March 2013.
Borrowings under the Credit Agreement are limited to the lesser of $150,000,000 or the borrowing base, which is determined by Comerica Bank semi-annually on May 1 and November 1. At March 31, 2011,
F-59
Table of Contents
Index to Financial Statements
Matador Resources Company and Subsidiaries
NOTES TO CONDENSED CONSOLIDATED FINANCIAL STATEMENTS
(UNAUDITED) — CONTINUED
March 31, 2011
NOTE 4 — REVOLVING CREDIT AGREEMENT — Continued
the borrowing base was $55,000,000. The Company and Comerica Bank may each request an unscheduled redetermination of the borrowing base one time during any 12-month period. The borrowing base is adjusted at the discretion of Comerica Bank and is based in part on estimates of the Company’s proved oil and natural gas reserves, but also on external factors, such as Comerica Bank’s lending policies and estimates of future oil and natural gas prices, over which the Company has no control. In the event of a borrowing base increase, the Company pays a fee to Comerica Bank equal to 0.25% of the amount of the increase. If the borrowing base were to be less than the outstanding borrowings under the Credit Agreement at any time, the Company would be required to provide additional collateral satisfactory in nature and value to Comerica Bank to increase the borrowing base to an amount sufficient to cover such excess or to repay the deficit in equal installments over a period of six months.
Borrowings under the Credit Agreement are subject to varying interest rates based on the total outstanding borrowings relative to the borrowing base and whether the loan is a Eurodollar loan or a base rate loan. Eurodollar loans bear interest at the Eurodollar rate plus the applicable margin of 1.250% to 1.875% based on the ratio of outstanding borrowings to the borrowing base. The Eurodollar rate for any interest period (one, two, three, six or twelve months as designated by the Company) is the rate equal to LIBOR, as published by Bloomberg Financial Markets Information Service or another source agreed upon by the Company and Comerica Bank, for deposits in United States dollars for a similar interest period. The base rate is the higher of the federal funds rate plus 1.0% or the annual rate of interest designated by Comerica Bank as its prime rate. A commitment fee of 0.250% to 0.375% based on the unused portion of the borrowing base is paid quarterly in arrears.
Key financial covenants under the Credit Agreement require the Company to maintain (1) a minimum current ratio (defined as total current assets plus availability under the Credit Agreement divided by total current liabilities) of 1.0 or greater at all times and (2) a debt to EBITDA ratio (defined as total debt outstanding divided by a rolling four-quarter EBITDA) of 3.75 or less at all times. Other restrictive covenants (1) prevent the Company from incurring other debt, subject to permitted exceptions, (2) prohibit the Company from declaring and paying dividends, except on its Class B common stock, and (3) limit the aggregate amount of oil and natural gas production that can be hedged pursuant to commodity hedging agreements and the maturity of those agreements. The Company was in compliance with all of Comerica Bank’s covenants at March 31, 2011 and December 31, 2010.
At March 31, 2011, the Company had $40,000,000 of outstanding borrowings under the Credit Agreement and $50,000 in letters of credit secured by the Credit Agreement; all borrowings under the Credit Agreement were Eurodollar loans, and the interest rate on the outstanding borrowings was 1.81%. The Company had an additional $325,000 in letters of credit secured by certificates of deposit at Comerica Bank at March 31, 2011.
F-60
Table of Contents
Index to Financial Statements
Matador Resources Company and Subsidiaries
NOTES TO CONDENSED CONSOLIDATED FINANCIAL STATEMENTS
(UNAUDITED) — CONTINUED
March 31, 2011
NOTE 5 — COMMON STOCK
Stock Offerings, Retirement and Issuances
In October 2010, the Board of Directors approved and authorized the private offering and sale of additional shares of the Company’s Class A common stock at $11.00 per share in the period from October 2010 through January 2011. At December 31, 2010, the Company sold 1,868,427 shares and received net proceeds of $20,536,167. In January 2011, the Company sold an additional 53,772 shares as part of this private offering and received net proceeds of $584,918.
NOTE 6 — DERIVATIVE FINANCIAL INSTRUMENTS
From time to time, the Company uses derivative financial instruments to hedge its exposure to commodity price risk associated with natural gas prices. These instruments consist of put and call options in the form of costless collars. The Company records derivative financial instruments on its balance sheet as either an asset or a liability measured at fair value. The Company has elected not to apply hedge accounting for its existing derivative financial instruments. As a result, the Company recognizes the change in derivative fair value between reporting periods currently in its consolidated statement of operations as an unrealized gain or loss. The fair value of the Company’s derivative financial instruments is determined for interim periods based on its counterparty’s valuation model. The Company verifies its counterparty’s valuation model annually for its reasonableness with an independent third-party valuation using observable, market-corroborated inputs.
The Company has entered into various costless collar transactions to mitigate its exposure to natural gas price volatility, each with an established price floor and ceiling. For each calculation period, the specified price for determining the realized gain or loss to the Company pursuant to any of these transactions is the settlement price for the NYMEX Henry Hub natural gas futures contract for the delivery month corresponding to the calculation period’s calendar month for the last day of that contract period. When the settlement price is below the price floor established by these collars, the Company receives from Comerica Bank, as counterparty, an amount equal to the difference between the settlement price and the price floor multiplied by the contract natural gas volume hedged. When the settlement price is above the price ceiling established by these collars, the Company pays to Comerica Bank, as counterparty, an amount equal to the difference between the settlement price and the price ceiling multiplied by the contract natural gas volume hedged. These transactions expose the Company to potential credit risk from its single counterparty, Comerica Bank; however, the Company believes that any credit risk posed is insignificant and is offset by the credit worthiness of Comerica Bank.
At March 31, 2011, the Company had six costless collar contracts open and in place, each with a specific term (calculation period), notional quantity (volume hedged) and price floor and ceiling. Each contract is set to expire at varying times during 2011. The Company has no hedging contracts in place with regard to any of its oil production, and no hedging contracts in place beyond 2011 with regard to any of its natural gas production.
F-61
Table of Contents
Index to Financial Statements
Matador Resources Company and Subsidiaries
NOTES TO CONDENSED CONSOLIDATED FINANCIAL STATEMENTS (UNAUDITED) — CONTINUED
March 31, 2011
NOTE 6 — DERIVATIVE FINANCIAL INSTRUMENTS — Continued
The following table presents the fair value of the Company’s open costless collar contracts at March 31, 2011.
| Commodity |
Calculation Period | Notional Quantity |
Price Floor |
Price Ceiling |
March 31, 2011 Fair Value of Asset |
|||||||||||||||
| (MMBtu/ month) |
($/MMBtu) | ($/MMBtu) | ||||||||||||||||||
| Natural Gas |
01/01/2010 - 12/31/2011 | 50,000 | 5.25 | 8.10 | $ | 373,023 | ||||||||||||||
| Natural Gas |
01/01/2010 - 12/31/2011 | 50,000 | 5.50 | 7.65 | 465,603 | |||||||||||||||
| Natural Gas |
01/01/2010 - 12/31/2011 | 50,000 | 5.00 | 8.65 | 286,247 | |||||||||||||||
| Natural Gas |
01/01/2010 - 12/31/2011 | 50,000 | 5.50 | 7.70 | 465,855 | |||||||||||||||
| Natural Gas |
01/01/2011 - 12/31/2011 | 90,000 | 5.50 | 7.85 | 839,761 | |||||||||||||||
| Natural Gas |
07/01/2010 - 06/30/2011 | 60,000 | 4.50 | 6.55 | 45,807 | |||||||||||||||
|
|
|
|||||||||||||||||||
| Total |
$ | 2,476,296 | ||||||||||||||||||
|
|
|
|||||||||||||||||||
Additional Disclosures about Derivative Financial Instruments
The following table summarizes the location and fair value of all derivative financial instruments recorded in the consolidated balance sheets for the periods presented. These derivative financial instruments are not designated as hedging instruments.
| Type of Instrument |
Location in Balance Sheet | March 31, 2011 |
December 31, 2010 |
|||||||||
| Derivative Instrument |
Current assets: Derivative instruments | $ | 2,476,296 | $ | 4,144,411 | |||||||
|
|
|
|
|
|||||||||
| Total |
$ | 2,476,296 | $ | 4,144,411 | ||||||||
|
|
|
|
|
|||||||||
The following table summarizes the location and fair value of all derivative financial instruments recorded in the consolidated statements of operations for the periods presented. These derivative financial instruments are not designated as hedging instruments.
| Type of Instrument |
Location
in Statement of Operations |
Three Months Ended March 31, |
||||||||
| 2011 | 2010 | |||||||||
| Derivative Instrument |
||||||||||
| Natural Gas |
Revenues: Realized gain on derivatives | $ | 1,849,750 | $ | 301,560 | |||||
| Revenues: Unrealized (loss) gain on derivatives | (1,668,115 | ) | 6,093,455 | |||||||
|
|
|
|
|
|||||||
| Total |
$ | 181,635 | $ | 6,395,015 | ||||||
|
|
|
|
|
|||||||
F-62
Table of Contents
Index to Financial Statements
Matador Resources Company and Subsidiaries
NOTES TO CONDENSED CONSOLIDATED FINANCIAL STATEMENTS
(UNAUDITED) — CONTINUED
March 31, 2011
NOTE 7 — FAIR VALUE MEASUREMENTS
The Company measures and reports certain financial and non-financial assets and liabilities on a fair value basis. Fair value is the price that would be received to sell an asset or paid to transfer a liability in an orderly transaction between market participants at the measurement date (exit price). Fair value measurements are classified and disclosed in one of the following categories.
| Level 1 |
Unadjusted quoted prices in active markets that are accessible at the measurement date for identical, unrestricted assets or liabilities. Active markets are considered to be those in which transactions for the assets or liabilities occur in sufficient frequency and volume to provide pricing information on an ongoing basis. | |
| Level 2 |
Quoted prices in markets that are not active, or inputs which are observable, either directly or indirectly, for substantially the full term of the asset or liability. This category includes those derivative instruments that are valued using observable market data. Substantially all of these inputs are observable in the marketplace throughout the full term of the derivative instrument, can be derived from observable data or supported by observable levels at which transactions are executed in the marketplace. | |
| Level 3 |
Unobservable inputs that are not corroborated by market data. This category is comprised of financial and non-financial assets and liabilities whose fair value is estimated based on internally developed models or methodologies using significant inputs that are generally less readily observable from objective sources. | |
Financial and non-financial assets and liabilities are classified based on the lowest level of input that is significant to the fair value measurement. The assessment of the significance of a particular input to the fair value measurement requires judgment, which may affect the valuation of the fair value of assets and liabilities and their placement within the fair value hierarchy levels.
The following tables summarize the valuation of the Company’s financial assets and liabilities that were accounted for at fair value on a recurring basis in accordance with the classifications provided above at March 31, 2011 and December 31, 2010.
| Description |
Fair Value Measurements
at March 31, 2011 using |
|||||||||||||||
| Level 1 | Level 2 | Level 3 | Total | |||||||||||||
| Assets (Liabilities) |
||||||||||||||||
| Certificates of deposit |
$ | – | $ | 2,079,313 | $ | – | $ | 2,079,313 | ||||||||
| Natural gas derivatives |
– | 2,476,296 | – | 2,476,296 | ||||||||||||
|
|
|
|
|
|
|
|
|
|||||||||
| Total |
$ | – | $ | 4,555,609 | $ | – | $ | 4,555,609 | ||||||||
|
|
|
|
|
|
|
|
|
|||||||||
F-63
Table of Contents
Index to Financial Statements
Matador Resources Company and Subsidiaries
NOTES TO CONDENSED CONSOLIDATED FINANCIAL STATEMENTS (UNAUDITED) — CONTINUED
March 31, 2011
NOTE 7 — FAIR VALUE MEASUREMENTS — Continued
| Description |
Fair Value Measurements
at December 31, 2010 using |
|||||||||||||||
| Level 1 | Level 2 | Level 3 | Total | |||||||||||||
| Assets (Liabilities) |
||||||||||||||||
| Certificates of deposit |
$ | – | $ | 2,349,313 | $ | – | $ | 2,349,313 | ||||||||
| Natural gas derivatives |
– | 4,144,411 | – | 4,144,411 | ||||||||||||
|
|
|
|
|
|
|
|
|
|||||||||
| Total |
$ | – | $ | 6,493,724 | $ | – | $ | 6,493,724 | ||||||||
|
|
|
|
|
|
|
|
|
|||||||||
Additional disclosures related to derivative financial instruments are provided in Note 6. For purposes of fair value measurement, the Company determined that certificates of deposit and derivative financial instruments (e.g., natural gas derivatives) should be classified at Level 2.
The Company accounts for additions to asset retirement obligations and lease and well equipment inventory at fair value on a non-recurring basis. The following tables summarize the valuation of the Company’s assets and liabilities that were accounted for at fair value on a non-recurring basis at March 31, 2011 and December 31, 2010.
| Description |
Fair Value Measurements
at March 31, 2011 using |
|||||||||||||||
| Level 1 | Level 2 | Level 3 | Total | |||||||||||||
| Assets (Liabilities) |
||||||||||||||||
| Asset retirement obligations |
$ | – | $ | – | $ | (75,082 | ) | $ | (75,082 | ) | ||||||
| Lease and well equipment inventory |
– | – | 442,500 | 442,500 | ||||||||||||
|
|
|
|
|
|
|
|
|
|||||||||
| Total |
$ | – | $ | – | $ | 367,418 | $ | 367,418 | ||||||||
|
|
|
|
|
|
|
|
|
|||||||||
| Description |
Fair Value Measurements
at December 31, 2010 using |
|||||||||||||||
| Level 1 | Level 2 | Level 3 | Total | |||||||||||||
| Assets (Liabilities) |
||||||||||||||||
| Asset retirement obligations |
$ | – | $ | – | $ | (847,845 | ) | $ | (847,845 | ) | ||||||
| Lease and well equipment inventory |
– | – | 442,500 | 442,500 | ||||||||||||
|
|
|
|
|
|
|
|
|
|||||||||
| Total |
$ | – | $ | – | $ | (405,345 | ) | $ | (405,345 | ) | ||||||
|
|
|
|
|
|
|
|
|
|||||||||
For purposes of fair value measurement, the Company determined that the additions to asset retirement obligations should be classified at Level 3. The Company recorded additions to asset retirement obligations of $75,082 for the three months ended March 31, 2011 and $847,845 for the year ended December 31, 2010, respectively.
For purposes of fair value measurement, the Company determined that lease and well equipment inventory should be classified at Level 3. The Company recorded an impairment to some of its equipment held in inventory, consisting primarily of drilling rig parts, of $50,000 in 2010. The Company periodically
F-64
Table of Contents
Index to Financial Statements
Matador Resources Company and Subsidiaries
NOTES TO CONDENSED CONSOLIDATED FINANCIAL STATEMENTS (UNAUDITED) — CONTINUED
March 31, 2011
NOTE 7 — FAIR VALUE MEASUREMENTS — Continued
obtains estimates of the market value of its drilling rig parts held in inventory from an independent third-party seller of similar equipment and uses these estimates as a basis for its measurement of the fair value of its drilling rig parts.
NOTE 8 — COMMITMENTS AND CONTINGENCIES
Office Lease
The Company’s corporate headquarters are located in 20,869 square feet of office space at One Lincoln Centre, 5400 LBJ Freeway, Suite 1500, Dallas, Texas. The office lease commencement date was September 25, 2003 with an expiration date of June 30, 2011. In April 2011, the Company agreed to a restated third amendment to its office lease agreement, in which the office space will be increased to 28,743 square feet and the term of the lease is extended from July 1, 2011 to June 30, 2022. The effective base rate over the term of the new lease is $19.75 per square foot per year.
The Company has also entered into a project management agreement with Jones Lang LaSalle Americas, Inc. to provide project management services related to the expansion space.
Other Capital Commitments
At March 31, 2011, the Company had outstanding capital commitments to participate in the drilling and completion of 32 gross (approximately 0.7 net) non-operated wells in the Haynesville shale in north Louisiana. The Company has working interests ranging from 0.2% to 11.1% in these wells, and most of these wells are already in progress. The Company’s minimum outstanding capital commitments at March 31, 2011 for its participation in these non-operated Haynesville wells were approximately $5.0 million. The Company expects these costs to be incurred in the next 12 months.
At March 31, 2011, the Company had outstanding capital commitments with a geophysical contractor for two 3D seismic acquisition projects on a portion of its Eagle Ford acreage in south Texas and with a division of Core Laboratories, LP for core analysis services. At March 31, 2011, the outstanding aggregate capital commitments for these projects were approximately $1.2 million, and the Company expects these costs to be incurred in the next 12 months.
Loan Program
At March 31, 2011, the Company had secured the loans of eight employees (including the Executive Vice President, Chief Financial Officer and Chief Operating Officer, the Executive Vice President — Operations and the Vice President — Reservoir Engineering) with a financial institution pursuant to its Employee Option Exercise Loan Program (“Loan Program”) in the aggregate amount of $1,326,000. The Company considers the fair value of this aggregate guaranty to be minimal and has recorded no liability provision associated with this guaranty on its consolidated balance sheets in any reporting period presented. The Company’s Board of Directors terminated the Loan Program in April 2011, and the Company is no longer authorized to provide financial guaranties for additional loans. No new loans were guaranteed in
F-65
Table of Contents
Index to Financial Statements
Matador Resources Company and Subsidiaries
NOTES TO CONDENSED CONSOLIDATED FINANCIAL STATEMENTS (UNAUDITED) — CONTINUED
March 31, 2011
NOTE 8 — COMMITMENTS AND CONTINGENCIES — Continued
2011 prior to the termination of the Loan Program by the Board of Directors. No director nor the Company’s Chairman and Chief Executive Officer has ever participated in the Loan Program.
Legal Proceedings
The Company is a defendant in four lawsuits encountered in the ordinary course of its business, none of which, in the opinion of management, will have a material adverse impact on the Company’s financial position, results of operations or cash flows. Certain of these matters are covered to an extent by insurance. In other cases, the Company believes it has a meritorious defense.
NOTE 9 — SUPPLEMENTAL DISCLOSURES
Accrued Liabilities
The following table summarizes the Company’s current accrued liabilities at March 31, 2011 and December 31, 2010.
| March 31, 2011 |
December 31, 2010 |
|||||||
| Accrued evaluated and unproved and unevaluated property costs |
$ | 20,290,213 | $ | 12,119,475 | ||||
| Accrued support equipment and facilities costs |
– | 40,145 | ||||||
| Accrued cost to issue equity |
594,710 | 359,175 | ||||||
| Accrued stock-based compensation |
1,100,073 | 1,095,014 | ||||||
| Other |
2,909,311 | 1,044,737 | ||||||
|
|
|
|
|
|||||
| Total accrued liabilities |
$ | 24,894,307 | $ | 14,658,546 | ||||
|
|
|
|
|
|||||
Supplemental Cash Flow Information
The following table provides supplemental disclosures of cash flow information for the three months ended March 31, 2011 and 2010.
| Three Months Ended March 31, |
||||||||
| 2011 | 2010 | |||||||
| Asset retirement obligations related to mineral properties |
$ | 58,265 | $ | 24,463 | ||||
| Asset retirement obligations related to support equipment and facilities |
16,818 | – | ||||||
| Increases/decreases in liabilities for oil and natural gas properties capital expenditures |
4,829,298 | (1,427,942 | ) | |||||
| Decreases in liabilities for support equipment and facilities |
(40,145 | ) | – | |||||
| Issuance of treasury stock for Board and advisor services |
8,250 | 33,750 | ||||||
| Increases in liabilities for accrued cost to issue equity |
235,535 | – | ||||||
| Stock-based compensation expense recognized as liability |
(16,250 | ) | – | |||||
| Transfer of inventory to oil and natural gas properties |
(156,706 | ) | – | |||||
| Receivable for inventory from other joint interest owners |
(156,706 | ) | – | |||||
F-66
Table of Contents
Index to Financial Statements
Matador Resources Company and Subsidiaries
NOTES TO CONDENSED CONSOLIDATED FINANCIAL STATEMENTS
(UNAUDITED) — CONTINUED
March 31, 2011
NOTE 10 — SUBSEQUENT EVENTS
Subsequent events have been evaluated by the Company through August 12, 2011, the date the interim unaudited condensed consolidated financial statements were available to be issued.
In May 2011, the Company entered into three additional costless collar transactions to mitigate its risks associated with fluctuations in natural gas prices. The following table summarizes these natural gas hedging contracts.
| Commodity |
Calculation Period | Notional Quantity |
Price Floor |
Price Ceiling |
||||||||||||
| (MMBtu/ month) |
($/MMBtu) | ($/MMBtu) | ||||||||||||||
| Natural Gas |
07/01/2011 - 12/31/2012 | 300,000 | 4.50 | 5.60 | ||||||||||||
| Natural Gas |
07/01/2011 - 07/31/2013 | 150,000 | 4.50 | 5.75 | ||||||||||||
| Natural Gas |
01/01/2012 - 12/31/2012 | 150,000 | 4.25 | 6.17 | ||||||||||||
Between April and July 2011, the Company committed to participate in 14 gross (approximately 0.6 net) non-operated wells in the Haynesville shale in north Louisiana. The Company has working interests ranging from 0.05% to 18.7% in these wells, and most of these wells are already in progress. The Company’s minimum outstanding capital commitments for its participation in these non-operated Haynesville wells are approximately $0.5 million, assuming that all these wells are drilled and completed by the operators.
In May and July 2011, the Company acquired approximately 6,054 gross and 4,692 net acres in Karnes, DeWitt, Wilson and Gonzales Counties, Texas. This acreage is prospective for the Eagle Ford shale, an emerging oil and natural gas play in south Texas. The Company paid approximately $30.5 million in cash and agreed to additional drilling and completion incentives to the seller in the form of back-in interests and future participation rights to acquire this acreage. The Company previously acquired 220 gross and 110 net acres in DeWitt County from the same seller in March 2011 for $1.0 million.
In May 2011, the Company amended and restated its Credit Agreement with Comerica Bank. This amendment increased the borrowing base under the Credit Agreement from $55,000,000 to $80,000,000 and amended the debt to EBITDA ratio (defined as total debt outstanding divided by a rolling four-quarter EBITDA) to 4.00 or less at all times. Under the amended and restated Credit Agreement, the Company also entered into a term loan for $25,000,000 with a maturity date of December 31, 2011. Proceeds from the term loan were used in partial payment of the acreage acquisition described above; the remaining funds required for the acreage acquisition were provided under the borrowing base. The term loan bears interest at LIBOR plus 5.00%, and while the term loan is outstanding, the Company’s other borrowings under the Credit Agreement bear interest at the maximum rate of LIBOR plus 1.875%. At August 12 2011, including the term loan, the Company had $85,000,000 of outstanding borrowings under the Credit Agreement and $375,000 in letters of credit secured by the Credit Agreement. All borrowings under the Credit Agreement are Eurodollar loans. The term loan bears interest at approximately 5.3%, and the other borrowings bear interest at approximately 2.1%.
F-67
Table of Contents
Index to Financial Statements
Matador Resources Company and Subsidiaries
NOTES TO CONDENSED CONSOLIDATED FINANCIAL STATEMENTS (UNAUDITED) — CONTINUED
March 31, 2011
NOTE 10 — SUBSEQUENT EVENTS — Continued
In May and July 2011, the Company entered into two drilling rig contracts to explore and develop its Eagle Ford acreage in south Texas. The Company expects the first rig will begin drilling operations on its acreage in August 2011, with the second rig beginning drilling operations on its acreage in October 2011. Both contracts are for a term of six months. Should the Company elect to terminate both contracts prior to initiating drilling operations, and if the drilling contractor were unable to secure work for both rigs prior to the end of their respective contract terms, the Company would incur an aggregate termination obligation of approximately $5.5 million.
In June 2011, the Company awarded bonuses to certain of its current employees, but not including any of its executive officers, in the aggregate amount of $1,240,000. These bonuses will be payable in a lump sum to each of these employees in June 2014, provided each continues to remain an employee in good standing with the Company at that time.
F-68
Table of Contents
Index to Financial Statements
GLOSSARY OF OIL AND NATURAL GAS TERMS
The following is a description of the meanings of some of the oil and natural gas industry terms used in this prospectus.
Bbl. One stock tank barrel, or 42 U.S. gallons liquid volume, used in this prospectus in reference to crude oil or other liquid hydrocarbons.
Bcf. One billion cubic feet.
Bcfe. One billion cubic feet of natural gas equivalents, determined using the ratio of six Mcf of natural gas to one Bbl of crude oil, condensate or natural gas liquids.
BOE. Barrels of oil equivalent, determined using the ratio of one Bbl of crude oil, condensate or natural gas liquids, to six Mcf of natural gas.
Btu or British thermal unit. The quantity of heat required to raise the temperature of one pound of water by one degree Fahrenheit.
Completion. The operations required to establish production of oil or natural gas from a wellbore, usually involving perforations, stimulation and/or installation of permanent equipment in the well, or in the case of a dry hole, the reporting of abandonment to the appropriate agency.
Condensate. Liquid hydrocarbons associated with the production of a primarily natural gas reserve.
Conventional resources. Natural gas or oil that is produced by a well drilled into a geologic formation in which the reservoir and fluid characteristics permit the natural gas or oil to readily flow to the wellbore.
Developed acreage. The number of acres that are allocated or assignable to productive wells.
Development well. A well drilled into a proved oil or natural gas reservoir to the depth of a stratigraphic horizon known to be productive.
Dry hole. A well found to be incapable of producing hydrocarbons in sufficient quantities such that proceeds from the sale of such production exceed production-related expenses and taxes.
Exploratory well. A well drilled to find and produce oil or natural gas reserves not classified as proved, to find a new reservoir in a field previously found to be productive of oil or natural gas in another reservoir or to extend a known reservoir.
Farmin or farmout. An agreement under which the owner of a working interest in an oil or natural gas lease assigns the working interest or a portion of the working interest to another party who desires to drill on the leased acreage. Generally, the assignee is required to drill one or more wells in order to earn its interest in the acreage. The assignor usually retains a royalty or reversionary interest in the lease. The interest received by an assignee is a “farmin” while the interest transferred by the assignor is a “farmout.”
FERC. Federal Energy Regulatory Commission.
Field. An area consisting of a single reservoir or multiple reservoirs all grouped on or related to the same individual geological structural feature and/or stratigraphic condition.
A-1
Table of Contents
Index to Financial Statements
Fracture stimulation technology. The technique of improving a well’s production or injection rates by pumping a mixture of fluids into the formation and rupturing the rock, creating an artificial channel. As part of this technique, sand or other material may also be injected into the formation to prop the channel open, so that fluids or gases may more easily flow from the formation, through the fracture channel and into the wellbore. This technique may also be referred to as hydraulic fracturing.
Gross acres or gross wells. The total acres or wells in which a working interest is owned.
Held by production. An oil and natural gas property under lease in which the lease continues to be in force after the primary term of the lease in accordance with its terms as a result of production from the property.
Horizontal drilling or well. A drilling operation in which a portion of the well is drilled horizontally within a productive or potentially productive formation. This operation typically yields a horizontal well that has the ability to produce higher volumes than a vertical well drilled in the same formation. A horizontal well is designed to replace multiple vertical wells, resulting in lower capital expenditures for draining like acreage and limiting surface disruption.
Liquids. Liquids, or natural gas liquids, are marketable liquid products including ethane, propane, butane and pentane resulting from the further processing of liquefiable hydrocarbons separated from raw natural gas by a gas processing facility.
MBbl. One thousand barrels of crude oil or other liquid hydrocarbons.
Mcf. One thousand cubic feet of natural gas.
Mcfe. One thousand cubic feet of natural gas equivalents, determined using the ratio of six Mcf of natural gas to one Bbl of crude oil, condensate or natural gas liquids.
MMBtu. One million British thermal units.
MMcf. One million cubic feet of natural gas.
MMcf/d. MMcf per day.
MMcfe. One million cubic feet of natural gas equivalents, determined using the ratio of six Mcf of natural gas to one Bbl of crude oil, condensate or natural gas liquids.
MMcfe/day. MMcfe per day.
Net acres or net wells. The sum of the fractional working interest owned in gross acres or wells.
Net revenue interest. The interest that defines the percentage of revenue that an owner of a well receives from the sale of oil, gas and/or natural gas liquids that are produced from the well.
NYMEX. New York Mercantile Exchange.
Overriding royalty interest. A fractional interest in the gross production of oil and natural gas under a lease, in addition to the usual royalties paid to the lessor, free of any expense for exploration, drilling, development, operating, marketing and other costs incident to the production and sale of oil and natural gas produced from the lease. It is an interest carved out of the lessee’s working interest, as distinguished from the lessor’s reserved royalty interest.
Permeability. A reference to the ability of oil and/or natural gas to flow through a reservoir.
A-2
Table of Contents
Index to Financial Statements
Petrophysical analysis. The interpretation of well log measurements, obtained from a string of electronic tools inserted into the borehole, and from core measurements, in which rock samples are retrieved from the subsurface, then combining these measurements with other relevant geological and geophysical information to describe the reservoir rock properties.
Play. A set of known or postulated oil and/or natural gas accumulations sharing similar geologic, geographic and temporal properties, such as source rock, migration pathways, timing, trapping mechanism and hydrocarbon type.
Possible reserves. Additional reserves that are less certain to be recognized than probable reserves.
Probable reserves. Additional reserves that are less certain to be recognized than proved reserves but which, in sum with proved reserves, are as likely as not to be recovered.
Producing well, production well or productive well. A well that is found to be capable of producing hydrocarbons in sufficient quantities such that proceeds from the sale of the well’s production exceed production-related expenses and taxes.
Properties. Natural gas and oil wells, production and related equipment and facilities and natural gas, oil or other mineral fee, leasehold and related interests.
Prospect. A specific geographic area which, based on supporting geological, geophysical or other data and also preliminary economic analysis using reasonably anticipated prices and costs, is considered to have potential for the discovery of commercial hydrocarbons.
Proved developed non-producing. Hydrocarbons in a potentially producing horizon penetrated by a wellbore, the production of which has been postponed pending installation of surface equipment or gathering facilities, or pending the production of hydrocarbons from another formation penetrated by the wellbore. The hydrocarbons are classified as proved but non-producing reserves.
Proved developed reserves. Proved reserves that can be expected to be recovered through existing wells and facilities and by existing operating methods.
Proved reserves. Reserves of oil and natural gas that have been proved to a high degree of certainty by analysis of the producing history of a reservoir and/or by volumetric analysis of adequate geological and engineering data.
Proved undeveloped reserves. Proved reserves that are expected to be recovered from new wells on undrilled acreage or from existing wells where a relatively major expenditure is required for recompletion.
Recompletion. Completing in the same wellbore to reach a new reservoir after production from the original reservoir has been abandoned.
Repeatability. The potential ability to drill multiple wells within a prospect or trend.
Reservoir. A porous and permeable underground formation containing a natural accumulation of producible oil and/or natural gas that is confined by impermeable rock or water barriers and is individual and separate from other reservoirs.
A-3
Table of Contents
Index to Financial Statements
Royalty interest. An interest in an oil and natural gas lease that gives the owner of the interest the right to receive a portion of the production from the leased acreage (or of the proceeds of the sale thereof), but generally does not require the owner to pay any portion of the costs of drilling or operating the wells on the leased acreage. Royalties may be either landowner’s royalties, which are reserved by the owner of the leased acreage at the time the lease is granted, or overriding royalties, which are usually reserved by an owner of the leasehold in connection with a transfer to a subsequent owner.
2-D seismic. The method by which a cross-section of the earth’s subsurface is created through the interpretation of reflecting seismic data collected along a single source profile.
3-D seismic. The method by which a three-dimensional image of the earth’s subsurface is created through the interpretation of reflection seismic data collected over a surface grid. 3-D seismic surveys allow for a more detailed understanding of the subsurface than do 2-D seismic surveys and contribute significantly to field appraisal, exploitation and production.
Trend. A region of oil and/or natural gas production, the geographic limits of which have not been fully defined, having geological characteristics that have been ascertained through supporting geological, geophysical or other data to contain the potential for oil and/or natural gas reserves in a particular formation or series of formations.
Unconventional resource play. A set of known or postulated oil and or gas resources or reserves warranting further exploration which are extracted from (i) low-permeability sandstone and shale formations and (ii) coalbed methane. These plays require the application of advanced technology to extract the oil and natural gas resources.
Undeveloped acreage. Lease acreage on which wells have not been drilled or completed to a point that would permit the production of commercial quantities of oil and natural gas, regardless of whether such acreage contains proved reserves. Undeveloped acreage is usually considered to be all acreage that is not allocated or assignable to productive wells.
Unproved and unevaluated properties. Refers to properties where no drilling or other actions have been undertaken that permit such property to be classified as proved.
Vertical well. A hole drilled vertically into the earth from which oil, natural gas or water flows or is pumped.
Visualization. An exploration technique in which the size and shape of subsurface features are mapped and analyzed based upon information derived from well logs, seismic data and other well information.
Volumetric reserve analysis. A technique used to estimate the amount of recoverable oil and natural gas. It involves calculating the volume of reservoir rock and adjusting that volume for the rock porosity, hydrocarbon saturation, formation volume factor and recovery factor.
Wellbore. The hole made by a well.
Working interest. The operating interest that gives the owner the right to drill, produce and conduct operating activities on the property and receive a share of production.
A-4
Table of Contents
Index to Financial Statements
• Shares

Common Stock
Prospectus
•, 2011
Joint Book-Running Managers
| RBC CAPITAL MARKETS |
CITIGROUP |
Table of Contents
Index to Financial Statements
Part II
INFORMATION NOT REQUIRED IN PROSPECTUS
| Item 13. | Other Expenses of Issuance and Distribution |
The following table sets forth an itemized statement of the amounts of all expenses (excluding underwriting discounts and commissions) payable by us in connection with the registration of the common stock offered hereby. With the exception of the Registration Fee, FINRA Filing Fee and New York Stock Exchange listing fee, the amounts set forth below are estimates.
| SEC Registration Fee |
$ | 17,415 | ||
| FINRA Filing Fee |
15,500 | |||
| New York Stock Exchange listing fee |
— | |||
| Accountants’ fees and expenses |
— | |||
| Legal fees and expenses |
— | |||
| Printing and engraving expenses |
— | |||
| Transfer agent and registrar fees |
— | |||
| Miscellaneous |
— | |||
|
|
|
|||
| Total |
$ | — | ||
|
|
|
| Item 14. | Indemnification of Directors and Officers |
Our certificate of formation provides that our directors are not liable to the company or its shareholders for monetary damages for an act or omission in their capacity as a director. A director may, however, be found liable for:
| • | any breach of the director’s duty of loyalty to the company or its shareholders; |
| • | acts or omissions not in good faith that constitute a breach of the director’s duty to the company; |
| • | acts or omissions that involve intentional misconduct or a knowing violation of law; |
| • | any transaction from which the director receives an improper benefit; or |
| • | acts or omissions for which the liability is expressly provided by an applicable statute. |
Our certificate of formation also provides that we will indemnify our directors, and may indemnify our officers, employees and agents, to the fullest extent permitted by applicable Texas law from any expenses, liabilities or other matters. Insofar as indemnification for liabilities arising under the Securities Act may be permitted for directors, officers and controlling persons of Matador under our certificate of formation, it is the position of the SEC that such indemnification is against public policy as expressed in the Securities Act and is, therefore, unenforceable.
Further, our certificate of formation permits us to maintain insurance on behalf of our officers and directors against expense, liability or loss asserted incurred by them in their capacities as officers and directors. We have obtained directors’ and officers’ insurance to cover our directors, officers and our employees for certain liabilities.
II-1
Table of Contents
Index to Financial Statements
We have entered into indemnification agreements with each of our officers and directors. Under these agreements, we have agreed to indemnify the director or officer who acts on behalf of Matador and is made or threatened to be made a party to any action or proceeding for expenses, judgments, fines and amounts paid in settlement that are actually and reasonably incurred in connection with the action or proceeding. The indemnity provisions apply whether the action was instituted by a third party or by us. Generally, the principal limitation on our obligation to indemnify the director or officer will be if it is determined by a court of law, not subject to further appeal, that indemnification is prohibited by applicable law or the provisions of the indemnification agreement.
| Item 15. | Recent Sales of Unregistered Securities |
In the three years preceding the filing of this registration statement, we have issued and sold the following securities that were not registered under the Securities Act:
1. During 2008, we issued an aggregate of 235,500 shares of common stock pursuant to the exercise of stock options held by certain directors, employees and consultants and received an aggregate of $1,048,500 for such exercises. The issuance of these shares was exempt from the registration requirements of the Securities Act pursuant to Rule 701.
2. During 2008, we issued an aggregate of 2,775 shares of our common stock to our outside directors and advisors in connection with their service to the board. These shares were issued in transactions exempt from the registration requirements of the Securities Act under Section 4(2) of the Securities Act.
3. In October 2008, we issued 3,000 shares of our common stock at a fair market value of $13.33 per share to a consultant in exchange for services performed. These shares were issued in a transaction exempt from the registration requirements of the Securities Act under Section 4(2) of the Securities Act.
4. During 2009, we issued an aggregate of 343,500 shares of common stock pursuant to the exercise of stock options held by certain directors, employees and consultants and received an aggregate of $1,281,500 for such exercises. The issuance of these shares was exempt from the registration requirements of the Securities Act pursuant to Rule 701.
5. During 2009, we issued an aggregate of 5,375 shares of our common stock to our outside directors and advisors in connection with their service to the board. These shares were issued in transactions exempt from the registration requirements of the Securities Act under Section 4(2) of the Securities Act.
6. In June 2009, we sold 166,667 shares of our common stock to an accredited investor for the consideration of $1,000,002. These shares were issued in a transaction exempt from the registration requirements of the Securities Act under Section 4(2) of the Securities Act.
7. In July 2009, we sold 20,550 shares of our common stock to an accredited investor for the consideration of $102,750. These shares were issued in a transaction exempt from the registration requirements of the Securities Act under Section 4(2) of the Securities Act.
8. In July 2009, we sold 333,334 shares of our common stock to an accredited investor for the consideration of $2,000,004. These shares were issued in a transaction exempt from the registration requirements of the Securities Act under Section 4(2) of the Securities Act.
9. In July 2009, we issued 500 shares of our common stock at a fair market value of $5.00 per share to an advisor in exchange for services performed. These shares were issued in a transaction exempt from the registration requirements of the Securities Act under Section 4(2) of the Securities Act.
II-2
Table of Contents
Index to Financial Statements
10. In August 2009, we sold 77,700 shares of our common stock to an accredited investor for the consideration of $524,475. These shares were issued in a transaction exempt from the registration requirements of the Securities Act under Section 4(2) of the Securities Act.
11. In May through September 2009, we sold 4,950,694 shares of our common stock to certain investors for the aggregate consideration of $28,075,118. These shares were issued in a transaction exempt from the registration requirements of the Securities Act under Section 4(2) of the Securities Act and Rule 506.
12. In November 2009, we sold 13,500 shares of our common stock to an accredited investor for the consideration of $101,250. These shares were issued in a transaction exempt from the registration requirements of the Securities Act under Section 4(2) of the Securities Act.
13. In December 2009, we sold 10,000 shares of our common stock to an accredited investor for the consideration of $75,000. These shares were issued in a transaction exempt from the registration requirements of the Securities Act under Section 4(2) of the Securities Act.
14. In December 2009, we sold 40,000 shares of our common stock to an accredited investor for the consideration of $300,000. These shares were issued in a transaction exempt from the registration requirements of the Securities Act under Section 4(2) of the Securities Act.
15. In December 2009, we sold 8,000 shares of our common stock to an accredited investor for the consideration of $60,000. These shares were issued in a transaction exempt from the registration requirements of the Securities Act under Section 4(2) of the Securities Act.
16. During 2010, we issued an aggregate of 392,375 shares of common stock pursuant to the exercise of stock options held by certain employees and received an aggregate of $1,978,375 for such exercises. The issuance of these shares was exempt from the registration requirements of the Securities Act pursuant to Rule 701.
17. During 2010, we issued an aggregate of 20,250 shares of our common stock to our outside directors and advisors in connection with their service to the board. These shares were issued in transactions exempt from the registration requirements of the Securities Act under Section 4(2) of the Securities Act.
18. In June 2010, we issued 11,000 shares of our common stock to an accredited investor for the consideration of $99,000. These shares were issued in a transaction exempt from the registration requirements of the Securities Act under Section 4(2) of the Securities Act.
19. In September 2010, we issued 250 shares of our common stock at a fair market value of $9.00 per share to an advisor in exchange for services performed. These shares were issued in a transaction exempt from the registration requirements of the Securities Act under Section 4(2) of the Securities Act.
20. In October 2010, we issued 5,000 shares of our common stock at a fair market value of $11.00 per share to a consultant in exchange for services performed. These shares were issued in a transaction exempt from the registration requirements of the Securities Act under Section 4(2) of the Securities Act.
21. In December 2010, we issued 500 shares of our common stock at a fair market value of $11.00 per share to an advisor in exchange for services performed. These shares were issued in a transaction exempt from the registration requirements of the Securities Act under Section 4(2) of the Securities Act.
II-3
Table of Contents
Index to Financial Statements
22. From October 2010 through January 2011, we sold 1,922,199 shares of our common stock to accredited investors for the aggregate consideration of $21,144,189. These shares were issued in a transaction exempt from the registration requirements of the Securities Act under Section 4(2) of the Securities Act and Rule 506.
23. From January 1, 2011 through July 31, 2011, we issued an aggregate of 80,556 shares of common stock pursuant to the exercise of stock options held by certain directors and employees and received an aggregate of $725,004 for such exercises. The issuance of these shares was exempt from the registration requirements of the Securities Act pursuant to Rule 701.
24. From January 1, 2011 through July 31, 2011, we issued an aggregate of 10,500 shares of our common stock to our outside directors and advisors in connection with their service to the board. These shares were issued in transactions exempt from the registration requirements of the Securities Act under Section 4(2) of the Securities Act.
| Item 16. | Exhibits And Financial Statement Schedules |
(a) Exhibits
| Exhibit Number |
Description | |
| 1.1* | Form of Underwriting Agreement | |
| 2.1 | Agreement and Plan of Merger, by and among Matador Resources Company (now known as MRC Energy Company), Matador Holdco, Inc. (now known as Matador Resources Company) and Matador Merger Co., dated August 8, 2011 | |
| 3.1 | Certificate of Formation of Matador Resources Company (formerly known as Matador Holdco, Inc.) | |
| 3.2 | Certificate of Amendment to Certificate of Formation of Matador Resources Company (formerly known as Matador Holdco, Inc.) | |
| 3.3 | Certificate of Amendment to Certificate of Formation of Matador Resources Company (formerly known as Matador Holdco, Inc.) | |
| 3.4 | Certificate of Merger between Matador Resources Company (now known as MRC Energy Company) and Matador Merger Co. | |
| 3.5 | Bylaws of Matador Resources Company (formerly known as Matador Holdco, Inc.) | |
| 3.6 | Amendment to the Bylaws of Matador Resources Company (formerly known as Matador Holdco, Inc.) | |
| 4.1* | Form of Common Stock Certificate | |
| 5.1* | Opinion of Haynes and Boone, LLP as to the legality of the securities being registered | |
| 10.1* | Amended and Restated Credit Agreement, dated at May 19, 2011, by and among Matador Resources Company (now known as MRC Energy Company), Comerica Bank, N.A. and the Lenders signatory thereto, as amended by that certain | |
| 10.2* | Pledge and Security Agreement, by and between Matador Resources Company (formerly known as Matador Holdco, Inc.) and Comerica Bank, N.A., dated at August 9, 2011 | |
| 10.3* | Employment Agreement between Matador Resources Company (formerly known as Matador Holdco, Inc.) and Joseph Wm. Foran | |
| 10.4* | Employment Agreement between Matador Resources Company (formerly known as Matador Holdco, Inc.) and David E. Lancaster | |
| 10.5* | Employment Agreement between Matador Resources Company and (formerly known as Matador Holdco, Inc.) Matthew Hairford | |
| 10.6* | Employment Agreement between Matador Resources Company and (formerly known as Matador Holdco, Inc.) Bradley M. Robinson | |
II-4
Table of Contents
Index to Financial Statements
| 10.7* | Independent Contractor Agreement between Matador Resources Company (formerly known as Matador Holdco, Inc.) and David F. Nicklin | |
| 10.8* | 2011 Long-Term Incentive Plan of Matador Resources Company (formerly known as Matador Holdco, Inc.) | |
| 10.9* | Matador Resources Company (formerly known as Matador Holdco, Inc.) Annual Incentive Plan for Management and Key Employees | |
| 10.10* | Matador Resources Company (formerly known as Matador Holdco, Inc.) 2011 Incentive Program under the Matador Resources Company Annual Incentive Plan for Management and Key Employees | |
| 10.11* | Matador Resources Company (now known as MRC Energy Company) 2003 Stock and Incentive Plan, dated October 23, 2003 | |
| 10.12* | First Amendment to Matador Resources Company (now known as MRC Energy Company) 2003 Stock and Incentive Plan, dated January 29, 2004 | |
| 10.13* | Second Amendment to Matador Resources Company (now known as MRC Energy Company) 2003 Stock and Incentive Plan, dated February 3, 2005 | |
| 10.14* | Third Amendment to Matador Resources Company (now known as MRC Energy Company) 2003 Stock and Incentive Plan, dated February 1, 2006 | |
| 10.15* | Fourth Amendment to Matador Resources Company (now known as MRC Energy Company) 2003 Stock and Incentive Plan, dated May 1, 2006 | |
| 10.16* | Fifth Amendment to Matador Resources Company (now known as MRC Energy Company) 2003 Stock and Incentive Plan, dated February 13, 2008 | |
| 10.17* | Sixth Amendment to Matador Resources Company (now known as MRC Energy Company) 2003 Stock and Incentive Plan, dated August 5, 2008 | |
| 10.18* |
Form of Indemnification Agreement between Matador Resources Company (formerly known as Matador Holdco, Inc.) and each of the directors and executive officers thereof | |
| 10.19* |
Purchase and Sale Agreement, between Matador Resources Company (now known as MRC Energy Company) and Chesapeake Louisiana, L.P., dated at July 10, 2008 | |
| 10.20* |
Purchase and Sale Agreement, by and between Matador Resources Company (now known as MRC Energy Company) and Stroud Exploration Company, L.L.C. and Stroud Petroleum, Inc., dated at August 26, 2009 | |
| 10.21* |
Participation Agreement, by and among MRC Rockies Company, Matador Resources Company (now known as MRC Energy Company), Matador Production Company, Roxanna Rocky Mountains, LLC, Roxanna Oil, Inc., Alliance Capital Real Estate, Inc. and AllianceBernstein L.P., dated at May 14, 2010 | |
| 10.22* |
Assignment, Bill of Sale and Conveyance, by and among Winn Exploration Co., Inc., Pinion Exploration, LLP, McDay Oil & Gas, Inc. and Matador Resources Company (now known as MRC Energy Company), dated effective at December 1, 2010 | |
| 10.23* |
Purchase, Sale and Participation Agreement, by and between Matador Resources Company (now known as MRC Energy Company) and Orca ICI Development, JV, dated at May 16, 2011 | |
| 16.1 |
Letter of Grant Thornton LLP, addressed to the Securities and Exchange Commission | |
| 16.2 |
Letter of Ernst & Young LLP, addressed to the Securities and Exchange Commission | |
| 21.1 |
List of Subsidiaries of Matador Resources Company (formerly known as Matador Holdco, Inc.) | |
| 23.1 |
Consent of Grant Thornton LLP | |
| 23.2 |
Consent of LaRoche Petroleum Consultants, Ltd. | |
II-5
Table of Contents
Index to Financial Statements
| 23.3 | Consent of Netherland, Sewell & Associates | |
| 23.4* | Consent of Haynes and Boone, LLP (included as part of Exhibit 5.1 hereto) | |
| 24.1 | Power of Attorney (included on the signature page of the initial filing of the registration statement) | |
| 99.1 | Audit report of Netherland, Sewell & Associates, Inc. for reserves at March 31, 2011 | |
| 99.2 | Audit report of Netherland, Sewell & Associates, Inc. for reserves at December 31, 2010 | |
| 99.3 | Audit report of Netherland, Sewell & Associates, Inc. for reserves at December 31, 2009 | |
| 99.4 | Audit report of LaRoche Petroleum Consultants, Ltd. for reserves at December 31, 2008 | |
| * | To be filed by amendment. |
| ITEM 17. | Undertakings |
The undersigned registrant hereby undertakes to provide to the underwriters at the closing specified in the underwriting agreement certificates in such denominations and registered in such names as required by the underwriters to permit prompt delivery to each purchaser.
Insofar as indemnification for liabilities arising under the Securities Act may be permitted to directors, officers and controlling persons of the registrant pursuant to the foregoing provisions, or otherwise, the registrant has been advised that in the opinion of the Securities and Exchange Commission such indemnification is against public policy as expressed in the Securities Act and is, therefore, unenforceable. In the event that a claim for indemnification against such liabilities (other than the payment by the registrant of expenses incurred or paid by a director, officer or controlling person of the registrant in the successful defense of any action, suit or proceeding) is asserted by such director, officer or controlling person in connection with the securities being registered, the registrant will, unless in the opinion of its counsel the matter has been settled by controlling precedent, submit to a court of appropriate jurisdiction the question whether such indemnification by it is against public policy as expressed in the Securities Act and will be governed by the final adjudication of such issue.
The undersigned registrant hereby undertakes that:
(1) For purposes of determining any liability under the Securities Act, the information omitted from the form of prospectus filed as part of this registration statement in reliance upon Rule 430A and contained in a form of prospectus filed by the registrant pursuant to Rule 424(b)(1) or (4) or 497(h) under the Securities Act shall be deemed to be part of this registration statement at the time it was declared effective.
(2) For the purpose of determining any liability under the Securities Act, each post-effective amendment that contains a form of prospectus shall be deemed to be a new registration statement relating to the securities offered therein, and the offering of such securities at that time shall be deemed to be the initial bona fide offering thereof.
II-6
Table of Contents
Index to Financial Statements
SIGNATURES
Pursuant to the requirements of the Securities Act of 1933, the registrant has duly caused this registration statement to be signed on its behalf by the undersigned, thereunto duly authorized in the City of Dallas, State of Texas, on August 12, 2011.
| MATADOR RESOURCES COMPANY | ||||||
| By: | /s/ Joseph Wm. Foran | |||||
| Joseph Wm. Foran | ||||||
| Chairman, President and Chief Executive Officer | ||||||
Each person whose signature appears below appoints Joseph Wm. Foran and David E. Lancaster, and each of them, any of whom may act without the joinder of the other, as his true and lawful agents, with full power of substitution and resubstitution, for him and in his name, place and stead, in any and all capacities, to sign any and all amendments (including post-effective amendments) to this registration statement and any registration statement (including any amendment thereto) for this offering that is to be effective upon filing pursuant to Rule 462(b) under the Securities Act of 1933, as amended, and to file the same, with all exhibits thereto, and all other documents in connection therewith, with the Securities and Exchange Commission, granting unto said agents full power and authority to do and perform each and every act and thing requisite and necessary to be done, as fully to all intents and purposes as he might or would do in person, hereby ratifying and confirming all that said agents or any of them or their or his substitute or substitutes, may lawfully do or cause to be done by virtue hereof.
Pursuant to the requirements of the Securities Act of 1933, this registration statement has been signed by the following persons in the capacities and on the dates indicated.
| Signature |
Title |
Date | ||
| /s/ Joseph Wm. Foran Joseph Wm. Foran |
Chairman, President and Chief Executive Officer (Principal Executive Officer) |
August 12, 2011 | ||
|
/s/ David E. Lancaster David E. Lancaster |
Executive Vice President, Chief Operating Officer and Chief Financial Officer (Principal Financial Officer) |
August 12, 2011 | ||
| /s/ Kathryn L. Wayne Kathryn L. Wayne |
Controller and Treasurer (Principal Accounting Officer) |
August 12, 2011 | ||
| /s/ Stephen A. Holditch Stephen A. Holditch |
Director | August 12, 2011 | ||
| /s/ David M. Laney David M. Laney |
Director | August 12, 2011 | ||
| /s/ Gregory E. Mitchell Gregory E. Mitchell |
Director | August 12, 2011 | ||
| /s/ Steven W. Ohnimus Steven W. Ohnimus |
Director | August 12, 2011 | ||
| /s/ Michael C. Ryan Michael C. Ryan |
Director | August 12, 2011 | ||
| /s/ Margaret B. Shannon Margaret B. Shannon |
Director | August 12, 2011 | ||
II-7
Table of Contents
Index to Financial Statements
INDEX TO EXHIBITS
| Exhibit Number |
Description | |
| 1.1* | Form of Underwriting Agreement | |
| 2.1 | Agreement and Plan of Merger, by and among Matador Resources Company (now known as MRC Energy Company), Matador Holdco, Inc. (now known as Matador Resources Company) and Matador Merger Co., dated August 8, 2011 | |
| 3.1 | Certificate of Formation of Matador Resources Company (formerly known as Matador Holdco, Inc.) | |
| 3.2 | Certificate of Amendment to Certificate of Formation of Matador Resources Company (formerly known as Matador Holdco, Inc.) | |
| 3.3 | Certificate of Amendment to Certificate of Formation of Matador Resources Company (formerly known as Matador Holdco, Inc.) | |
| 3.4 | Certificate of Merger between Matador Resources Company (now known as MRC Energy Company) and Matador Merger Co. | |
| 3.5 | Bylaws of Matador Resources Company (formerly known as Matador Holdco, Inc.) | |
| 3.6 | Amendment to the Bylaws of Matador Resources Company (formerly known as Matador Holdco, Inc.) | |
| 4.1* | Form of Common Stock Certificate | |
| 5.1* | Opinion of Haynes and Boone, LLP as to the legality of the securities being registered | |
| 10.1* | Amended and Restated Credit Agreement, dated at May 19, 2011, by and among Matador Resources Company (now known as MRC Energy Company), Comerica Bank, N.A. and the Lenders signatory thereto, as amended by that certain | |
| 10.2* | Pledge and Security Agreement, by and between Matador Resources Company (formerly known as Matador Holdco, Inc.) and Comerica Bank, N.A., dated at August 9, 2011 | |
| 10.3* | Employment Agreement between Matador Resources Company (formerly known as Matador Holdco, Inc.) and Joseph Wm. Foran | |
| 10.4* | Employment Agreement between Matador Resources Company (formerly known as Matador Holdco, Inc.) and David E. Lancaster | |
| 10.5* | Employment Agreement between Matador Resources Company (formerly known as Matador Holdco, Inc.) and Matthew Hairford | |
| 10.6* | Employment Agreement between Matador Resources Company (formerly known as Matador Holdco, Inc.) and Bradley M. Robinson | |
| 10.7* | Independent Contractor Agreement between Matador Resources Company (formerly known as Matador Holdco, Inc.) and David F. Nicklin | |
| 10.8* | 2011 Long-Term Incentive Plan of Matador Resources Company (formerly known as Matador Holdco, Inc.) | |
| 10.9* | Matador Resources Company (formerly known as Matador Holdco, Inc.) Annual Incentive Plan for Management and Key Employees | |
| 10.10* | Matador Resources Company (formerly known as Matador Holdco, Inc.) 2011 Incentive Program under the Matador Resources Company Annual Incentive Plan for Management and Key Employees | |
| 10.11* | Matador Resources Company (now known as MRC Energy Company) 2003 Stock and Incentive Plan, dated October 23, 2003 | |
| 10.12* | First Amendment to Matador Resources Company (now known as MRC Energy Company) 2003 Stock and Incentive Plan, dated January 29, 2004 | |
| 10.13* | Second Amendment to Matador Resources Company (now known as MRC Energy Company) 2003 Stock and Incentive Plan, dated February 3, 2005 | |
| 10.14* | Third Amendment to Matador Resources Company (now known as MRC Energy Company) 2003 Stock and Incentive Plan, dated February 1, 2006 | |
| 10.15* | Fourth Amendment to Matador Resources Company (now known as MRC Energy Company) 2003 Stock and Incentive Plan, dated May 1, 2006 | |
| 10.16* | Fifth Amendment to Matador Resources Company (now known as MRC Energy Company) 2003 Stock and Incentive Plan, dated February 13, 2008 | |
Table of Contents
Index to Financial Statements
| 10.17* | Sixth Amendment to Matador Resources Company (now known as MRC Energy Company) 2003 Stock and Incentive Plan, dated August 5, 2008 | |
| 10.18* | Form of Indemnification Agreement between Matador Resources Company (formerly known as Matador Holdco, Inc.) and each of the directors and executive officers thereof | |
| 10.19* | Purchase and Sale Agreement, between Matador Resources Company (now known as MRC Energy Company) and Chesapeake Louisiana, L.P., dated at July 10, 2008 | |
| 10.20* | Purchase and Sale Agreement, by and between Matador Resources Company (now known as MRC Energy Company) and Stroud Exploration Company, L.L.C. and Stroud Petroleum, Inc., dated at August 26, 2009 | |
| 10.21* | Participation Agreement, by and among MRC Rockies Company, Matador Resources Company (now known as MRC Energy Company), Matador Production Company, Roxanna Rocky Mountains, LLC, Roxanna Oil, Inc., Alliance Capital Real Estate, Inc. and AllianceBernstein L.P., dated at May 14, 2010 | |
| 10.22* | Assignment, Bill of Sale and Conveyance, by and among Winn Exploration Co., Inc., Pinion Exploration, LLP, McDay Oil & Gas, Inc. and Matador Resources Company (now known as MRC Energy Company), dated effective at December 1, 2010 | |
| 10.23* | Purchase, Sale and Participation Agreement, by and between Matador Resources Company (now known as MRC Energy Company) and Orca ICI Development, JV, dated at May 16, 2011 | |
| 16.1 | Letter of Grant Thornton LLP, addressed to the Securities and Exchange Commission | |
| 16.2 | Letter of Ernst & Young LLP, addressed to the Securities and Exchange Commission | |
| 21.1 | List of Subsidiaries of Matador Resources Company | |
| 23.1 | Consent of Grant Thornton LLP | |
| 23.2 | Consent of LaRoche Petroleum Consultants, Ltd. | |
| 23.3 | Consent of Netherland, Sewell & Associates | |
| 23.4* | Consent of Haynes and Boone, LLP (included as part of Exhibit 5.1 hereto) | |
| 24.1 | Power of Attorney (included on the signature page of the initial filing of the registration statement) | |
| 99.1 | Audit report of Netherland, Sewell & Associates, Inc. for reserves at March 31, 2011 | |
| 99.2 | Audit report of Netherland, Sewell & Associates, Inc. for reserves at December 31, 2010 | |
| 99.3 | Audit report of Netherland, Sewell & Associates, Inc. for reserves at December 31, 2009 | |
| 99.4 | Audit report of LaRoche Petroleum Consultants, Ltd. for reserves at December 31, 2008 | |
| * | To be filed by amendment. |