Attached files
UNITED STATES
SECURITIES AND EXCHANGE COMMISSION
Washington, D.C. 20549
FORM 10-Q
x QUARTERLY REPORT UNDER SECTION 13 OR 15(d) OF THE
SECURITIES EXCHANGE ACT OF 1934.
For the quarterly period ended June 30, 2011
OR
o TRANSITION REPORT PURSUANT TO SECTION 13 OR 15(d)
OF THE SECURITIES EXCHANGE ACT OF 1934.
Commission File Number 1-33094
AMERICAN CARESOURCE HOLDINGS, INC.
(Exact name of registrant as specified in its charter)
DELAWARE | 20-0428568 | |||
(State or other jurisdiction of | (I.R.S. employer | |||
incorporation or organization) | identification no.) | |||
5429 LYNDON B. JOHNSON FREEWAY | ||||
SUITE 850 | ||||
DALLAS, TEXAS | ||||
75240 | ||||
(Address of principal executive offices) | ||||
(Zip code) | ||||
(972) 308-6830
(Registrant’s telephone number, including area code)
Indicate by check mark whether the registrant (1) has filed all reports required to be filed by Section 13 or 15(d) of the Securities Exchange Act of 1934 during the preceding 12 months (or for such shorter period that the registrant was required to file such reports), and (2) has been subject to such filing requirements for the past 90 days. Yes x No o
Indicate by check mark whether the registrant has submitted electronically and posted on its corporate Web site, if any, every Interactive Data File required to be submitted and posted pursuant to Rule 405 of Regulation S-T (§232.405 of this chapter) during the preceding 12 months (or for such shorter period that the registrant was required to submit and post such files). Yes xNo o
Indicate by check mark whether the registrant is a large accelerated filer, an accelerated filer, a non-accelerated filer or a smaller reporting company. See the definitions of “accelerated filer”,” large accelerated filer” and “smaller reporting company” in Rule 12b-2 of the Exchange Act.
Large accelerated filer o | Non-accelerated filer o |
Accelerated filer o (do not check if a smaller reporting company) | Smaller Reporting Company x |
Indicated by check mark whether the registrant is a shell company (as defined in Rule 12b-2 of the Act.) Yes o No x
Indicate the number of shares outstanding of each of the issuer’s classes of common stock, as of the latest practicable date: The number of shares of common stock of registrant outstanding on August 8, 2011 was 16,987,117.
TABLE OF CONTENTS
AMERICAN CARESOURCE HOLDINGS, INC.
FORM 10-Q
FOR THE QUARTER ENDED JUNE 30, 2011
PART I. FINANCIAL INFORMATION
ITEM 1. Financial Statements
AMERICAN CARESOURCE HOLDINGS, INC.
CONSOLIDATED STATEMENTS OF OPERATIONS
(Unaudited)
(amounts in thousands, except per share data)
Three months ended June 30, | Six months ended June 30, | ||||||||||||||
2011 | 2010 | 2011 | 2010 | ||||||||||||
Net revenues | $ | 11,308 | $ | 15,958 | $ | 24,385 | $ | 30,329 | |||||||
Cost of revenues: | |||||||||||||||
Provider payments | 8,815 | 11,688 | 18,624 | 22,102 | |||||||||||
Administrative fees | 503 | 984 | 1,175 | 1,753 | |||||||||||
Claims administration and provider development | 1,146 | 1,188 | 2,253 | 2,408 | |||||||||||
Total cost of revenues | 10,464 | 13,860 | 22,052 | 26,263 | |||||||||||
Contribution margin | 844 | 2,098 | 2,333 | 4,066 | |||||||||||
Selling, general and administrative expenses | 1,628 | 1,481 | 3,165 | 3,276 | |||||||||||
Depreciation and amortization | 191 | 192 | 381 | 374 | |||||||||||
Total operating expenses | 1,819 | 1,673 | 3,546 | 3,650 | |||||||||||
Operating income (loss) | (975 | ) | 425 | (1,213 | ) | 416 | |||||||||
Other Income | 10 | 25 | 24 | 61 | |||||||||||
Income (loss) before income taxes | (965 | ) | 450 | (1,189 | ) | 477 | |||||||||
Income tax provision (benefit) | (320 | ) | 151 | (322 | ) | 177 | |||||||||
Net income (loss) | $ | (645 | ) | $ | 299 | $ | (867 | ) | $ | 300 | |||||
Earnings (loss) per common share: | |||||||||||||||
Basic | $ | (0.04 | ) | $ | 0.02 | $ | (0.05 | ) | $ | 0.02 | |||||
Diluted | $ | (0.04 | ) | $ | 0.02 | $ | (0.05 | ) | $ | 0.02 | |||||
Basic weighted average common shares outstanding | 16,962 | 16,393 | 16,962 | 16,299 | |||||||||||
Diluted weighted average common shares outstanding | 16,962 | 17,120 | 16,962 | 17,082 | |||||||||||
See accompanying notes.
1
AMERICAN CARESOURCE HOLDINGS, INC.
CONSOLIDATED BALANCE SHEETS
(amounts in thousands except per share amounts)
June 30, 2011 (Unaudited) | December 31, 2010 | ||||||
ASSETS | |||||||
Current assets: | |||||||
Cash and cash equivalents | $ | 11,353 | $ | 14,512 | |||
Accounts receivable, net | 5,297 | 5,510 | |||||
Prepaid expenses and other current assets | 590 | 532 | |||||
Deferred income taxes | 198 | 237 | |||||
Total current assets | 17,438 | 20,791 | |||||
Property and equipment, net | 1,879 | 1,824 | |||||
Other assets: | |||||||
Deferred income taxes | 978 | 609 | |||||
Other non-current assets | 215 | 340 | |||||
Intangible assets, net | 960 | 1,025 | |||||
Goodwill | 4,361 | 4,361 | |||||
$ | 25,831 | $ | 28,950 | ||||
LIABILITIES AND SHAREHOLDERS' EQUITY | |||||||
Current liabilities: | |||||||
Due to service providers | $ | 4,259 | $ | 6,718 | |||
Accounts payable and accrued liabilities | 1,224 | 1,446 | |||||
Total current liabilities | 5,483 | 8,164 | |||||
Commitments and contingencies | |||||||
Shareholders' equity: | |||||||
Preferred stock, $0.01 par value; 10,000 shares authorized, none issued | — | — | |||||
Common stock, $0.01 par value; 40,000 shares authorized; 16,950 and 16,922 shares issued and outstanding in 2011 and 2010, respectively | 170 | 169 | |||||
Additional paid-in capital | 22,030 | 21,602 | |||||
Accumulated deficit | (1,852 | ) | (985 | ) | |||
Total shareholders' equity | 20,348 | 20,786 | |||||
$ | 25,831 | $ | 28,950 | ||||
See accompanying notes.
2
AMERICAN CARESOURCE HOLDINGS, INC.
CONSOLIDATED STATEMENT OF STOCKHOLDERS' EQUITY
(Unaudited)
(amounts in thousands)
Additional | Total | |||||||||||||||||
Common Stock | Paid-in | Accumulated | Stockholders' | |||||||||||||||
Shares | Amount | Capital | Deficit | Equity | ||||||||||||||
Balance at December 31, 2010 | 16,922 | $ | 169 | $ | 21,602 | $ | (985 | ) | $ | 20,786 | ||||||||
Net loss | — | — | — | (867 | ) | (867 | ) | |||||||||||
Stock-based compensation expense | — | — | 445 | — | 445 | |||||||||||||
Issuance of common stock upon conversion of restricted stock units, net of tax withholdings | 28 | 1 | (17 | ) | — | (16 | ) | |||||||||||
Balance at June 30, 2011 | 16,950 | $ | 170 | $ | 22,030 | $ | (1,852 | ) | $ | 20,348 | ||||||||
See accompanying notes.
3
AMERICAN CARESOURCE HOLDINGS, INC.
CONSOLIDATED STATEMENTS OF CASH FLOWS
(Unaudited)
(amounts in thousands)
Six months ended June 30, | |||||||
2011 | 2010 | ||||||
Cash flows from operating activities: | |||||||
Net income (loss) | $ | (867 | ) | $ | 300 | ||
Adjustments to reconcile net income (loss) to net cash used by operations: | |||||||
Stock-based compensation expense | 445 | 375 | |||||
Depreciation and amortization | 381 | 374 | |||||
Unrealized gain on warrant derivative | — | (16 | ) | ||||
Amortization of long-term client agreement | 125 | 125 | |||||
Client administration fee expense related to warrants | 67 | 100 | |||||
Deferred income taxes | (330 | ) | 164 | ||||
Changes in operating assets and liabilities: | |||||||
Accounts receivable | 213 | 856 | |||||
Prepaid expenses and other assets | (130 | ) | (89 | ) | |||
Accounts payable and accrued liabilities | (232 | ) | (496 | ) | |||
Due to service providers | (2,459 | ) | (1,773 | ) | |||
Net cash used by operating activities | (2,787 | ) | (80 | ) | |||
Cash flows from investing activities: | |||||||
Investment in software development costs | (353 | ) | (182 | ) | |||
Additions to property and equipment | (19 | ) | (262 | ) | |||
Net cash used in investing activities | (372 | ) | (444 | ) | |||
Net decrease in cash and cash equivalents | (3,159 | ) | (524 | ) | |||
Cash and cash equivalents at beginning of period | 14,512 | 11,868 | |||||
Cash and cash equivalents at end of period | $ | 11,353 | $ | 11,344 | |||
Supplemental cash flow information: | |||||||
Cash paid for taxes | $ | — | $ | 122 | |||
Supplemental non-cash financing activity: | |||||||
Income tax withholdings on conversion of equity incentives | $ | 16 | $ | 19 | |||
See accompanying notes.
4
AMERICAN CARESOURCE HOLDINGS, INC.
NOTES TO UNAUDITED CONSOLIDATED FINANCIAL STATEMENTS
(Unaudited)
(tables in thousands, except per share data)
1. Description of Business and Basis of Presentation
American CareSource Holdings, Inc. (“ACS,” “Company,” the “Registrant,” “we,” “us,” or “our”) is an ancillary services company that offers cost effective access to a comprehensive national network of ancillary healthcare service providers. The Company sells its services to a number of healthcare companies including preferred provider organizations ("PPOs"), third party administrators (“TPAs”), insurance companies, large self-funded organizations, various employee groups and other middle-market organizations. The Company offers payors this solution by:
• | lowering its payors’ ancillary care costs throughout our network of high quality, cost effective providers that the Company has under contract at more favorable terms than they could generally obtain on their own; |
• | providing payors with a comprehensive network of ancillary healthcare services providers that is tailored to each payor’s specific needs and is available to each payor’s covered persons for covered services; |
• | providing payors with claims management, reporting and processing and payment services; |
• | performing network/needs analysis to assess the benefits to payors of adding additional/different service providers to the payor -specific provider networks; and |
• | credentialing network service providers for inclusion in the payor -specific provider networks. |
The accompanying unaudited condensed consolidated financial statements have been prepared in accordance with accounting principles generally accepted in the United States (“GAAP”), interim reporting requirements of Form 10-Q and Rule 8-03 of Regulation S-X of the rules and regulations of the Securities and Exchange Commission (“SEC”). Consequently, financial information and disclosures normally included in financial statements prepared annually in accordance with GAAP have been condensed or omitted. Balance sheet amounts are as of June 30, 2011 and December 31, 2010 and operating results are for the three and six months ended June 30, 2011 and 2010, and include all normal and recurring adjustments we consider necessary for the fair, summarized presentation of our financial position and operating results. As these are condensed financial statements, readers of this report should, therefore, refer to the consolidated financial statements and the notes included in our Annual Report on Form 10-K for the fiscal year ended December 31, 2010, filed with the SEC on March 18, 2011.
The Company uses the “management approach” for reporting information about segments in annual and interim financial statements. The management approach is based on the way the chief operating decision-maker organizes segments within a company for making operating decisions and assessing performance. Reportable segments are based on products and services, geography, legal structure, management structure and any other manner in which management disaggregates a company. Based on the “management approach” model, the Company has determined that its business is comprised of a single operating segment.
Our interim results of operations are not necessarily indicative of results of operations that will be realized for the full fiscal year.
Certain prior year amounts have been reclassified within the condensed consolidated financial statements to conform to the current year presentation.
2. Revenue Recognition
The Company recognizes revenue on the services that it provides, which includes (i) providing payor clients with a comprehensive network of ancillary healthcare providers, (ii) providing claims management, reporting, processing and payment services, (iii) providing network/need analysis to assess the benefits to payor clients of adding what additional/different service providers to the client-specific provider networks and (iv) providing credentialing of network services providers for inclusion in the client payor-specific provider networks. Revenue is recognized when services are delivered, which occurs after processed claims are billed to the client payors and collections are reasonably assured. The Company estimates revenues and costs of revenues using average historical collection rates and average historical margins earned on claims. Periodically, revenues are adjusted to reflect actual cash collections so that revenues recognized accurately reflect cash collected.
5
The Company determines whether it is acting as a principal or agent in the fulfillment of the services rendered. After careful evaluation of the key gross and net revenue recognition indicators, the Company acknowledges that while the determination of gross versus net reporting is highly judgmental in nature, the Company has concluded that its circumstances are most consistent with those key indicators that support gross revenue reporting.
Following are the key indicators that support the Company’s conclusion that it acts as a principal when settling claims for service providers through its contracted service provider network:
• | The Company is the primary obligor in the arrangement. The Company has assessed its role as primary obligor as a strong indicator of gross reporting. The Company believes that it is the primary obligor in its transactions because it is responsible for providing the services desired by its client payors. The Company has distinct, separately negotiated contractual relationships with its client payors and with the ancillary health care providers in its networks. The Company does not negotiate “on behalf of” its client payors and does not hold itself out as the agent of the client payors when negotiating the terms of the Company’s ancillary healthcare service provider agreements. The Company’s agreements contractually prohibit client payors and service providers to enter into direct contractual relationships with one another. The client payors have no control over the terms of the Company’s agreements with the service providers. In executing transactions, the Company assumes key performance-related risks. The client payors hold the Company responsible for fulfillment, as the provider, of all of the services the client payors are entitled to under their contracts; client payors do not look to the service providers for fulfillment. In addition, the Company bears the pricing/margin risk as the principal in the transactions. Because the contracts with the client payors and service providers are separately negotiated, the Company has complete discretion in negotiating both the prices it charges its client payors and the financial terms of its agreements with the service providers. Since the Company’s profit is the spread between the amounts received from the client payors and the amount paid to the service providers, it bears significant pricing/margin risk. There is no guaranteed mark-up payable to the Company on the amount the Company has contracted. Thus, the Company bears the risk that amounts paid to the service provider will be greater than the amounts received from the client payors, resulting in a loss or negative claim. |
• | The Company has latitude in establishing pricing. As stated above, the Company has complete latitude in negotiating the price to be paid to the Company by each client payor and the price to be paid to each contracted service provider. This type of pricing latitude indicates that the Company has the risks and rewards normally attributed to a principal in the transactions. |
• | The Company changes the product or performs part of the services. The Company provides the benefits associated with the relationships it builds with the client payors and the services providers. While the parties could deal with each other directly, the client payors would not have the benefit of the Company’s experience and expertise in assembling a comprehensive network of service providers, in claims management, reporting and processing and payment services, in performing network/needs analysis to assess the benefits to client payors of adding additional/different service providers to the client payor-specific provider networks, and in credentialing network service providers. |
• | The Company has complete discretion in supplier selection. One of the key factors considered by client payors who engage the Company is to have the Company undertake the responsibility for identifying, qualifying, contracting with and managing the relationships with the ancillary healthcare service providers. As part of the contractual arrangement between the Company and its client payors, the payors identify their obligations to their respective covered persons and then work with the Company to determine the types of ancillary healthcare services required in order for the payors to meet their obligations. The Company may select the providers and contract with them to provide services at its discretion. |
• | The Company is involved in the determination of product or service specifications. The Company works with its client payors to determine the types of ancillary healthcare services required in order for the payors to meet their obligations to their respective covered persons. In some respects, the Company is customizing the product through its efforts and ability to assemble a comprehensive network of providers for its payors that is tailored to each payor’s specific needs. In addition, as part of its claims processing and payment services, the Company works with the client payors, on the one hand, and the providers, on the other, to set claims review, management and payment specifications. |
• | The supplier (and not the Company) has credit risk. The Company believes it has some level of credit risk, but that risk is mitigated because the Company does not remit payment to providers unless and until it has received payment from the relevant client payors following the Company’s processing of a claim. |
• | The amount that the Company earns is not fixed. The Company does not earn a fixed amount per transaction nor does it realize a per-person per-month charge for its services. |
6
The Company has evaluated the other indicators of gross and net revenue recognition, including whether or not the Company has general inventory risk. The Company does not have any general inventory risk, as its business is not related to the manufacture, purchase or delivery of goods and it does not purchase in advance any of the services to be provided by the ancillary healthcare service providers. While the absence of this risk would be one indicator in support of net revenue reporting, as described in detail above, the Company has carefully evaluated all of the key gross and net revenue recognition indicators and has concluded that its circumstances are most consistent with those key indicators that support gross revenue reporting.
If the Company were to report its revenues net of provider payments rather than on a gross reporting basis, for the three and six months ended June 30, 2011, its net revenues would have been approximately $2.5 million and $5.8 million, respectively. For the three and six months ended June 30, 2010, its net revenues would have been approximately $4.3 million and $8.2 million, respectively.
The Company records a provision for refunds on a periodic basis. Refunds are paid to payors for overpayments on claims, claims paid in error, and claims paid for non-covered services. In some instances, we will recoup payments made to the ancillary service provider if the claim has been fully resolved. The evaluation is performed periodically and is based on historical data. We present revenue net of the provision for refunds on the consolidated statement of operations.
During the three and six months ended June 30, 2011 and 2010, two of the Company’s clients comprised a significant portion of the Company’s revenues. The following is a summary of the approximate amounts of the Company’s revenue and accounts receivable contributed by each of those clients as of the dates and for the periods presented (amounts in thousands):
Periods ended June 30, 2011 | Periods ended June 30, 2010 | ||||||||||||||||||||||||||||||||||
As of June 30, 2011 | Three months | Six months | As of June 30, 2010 | Three months | Six months | ||||||||||||||||||||||||||||||
Accounts Receivable | Net Revenue | % of Total Revenue | Net Revenue | % of Total Revenue | Accounts Receivable | Net Revenue | % of Total Revenue | Net Revenue | % of Total Revenue | ||||||||||||||||||||||||||
Client A | $ | 1,864 | $ | 3,071 | 27 | % | $ | 8,178 | 33 | % | $ | 3,197 | $ | 8,551 | 53 | % | $ | 15,557 | 51 | % | |||||||||||||||
Client B | 1,067 | 2,455 | 22 | 5,259 | 22 | 1,877 | 4,334 | 27 | 9,300 | 31 | |||||||||||||||||||||||||
All Others | 2,531 | 5,850 | 52 | 11,252 | 46 | 1,759 | 3,133 | 20 | 5,592 | 18 | |||||||||||||||||||||||||
Allowance for Uncollectable Receivables/Provision for refunds | (165 | ) | (68 | ) | (1 | ) | (304 | ) | (1 | ) | (271 | ) | (60 | ) | — | (120 | ) | — | |||||||||||||||||
$ | 5,297 | $ | 11,308 | 100 | % | $ | 24,385 | 100 | % | $ | 6,562 | $ | 15,958 | 100 | % | 30,329 | 100 | % | |||||||||||||||||
7
3. Earnings Per Share
The following table details the reconciliation of basic earnings per share to diluted earnings per share (amounts in thousands except per share amounts):
Three months ended June 30, | Six months ended June 30, | ||||||||||||||
2011 | 2010 | 2011 | 2010 | ||||||||||||
Numerator: | |||||||||||||||
Net income (loss) for basic earnings per share | $ | (645 | ) | $ | 299 | $ | (867 | ) | $ | 300 | |||||
Less: | |||||||||||||||
Change in fair value of warrant derivative liability | — | 2 | — | 16 | |||||||||||
Net loss for diluted earnings per share | $ | (645 | ) | $ | 297 | $ | (867 | ) | $ | 284 | |||||
Denominator: | |||||||||||||||
Weighted-average basic and diluted common shares outstanding | 16,962 | 16,393 | 16,962 | 16,299 | |||||||||||
Assumed conversion of dilutive securities: | |||||||||||||||
Stock options | — | 262 | — | 303 | |||||||||||
Stock warrants | — | 465 | — | 480 | |||||||||||
Restricted stock units | — | — | — | — | |||||||||||
Potentially dilutive common shares | — | 727 | — | 783 | |||||||||||
Denominator for diluted earnings per share -- Adjusted weighted average shares | 16,962 | 17,120 | 16,962 | 17,082 | |||||||||||
Earnings (loss) per common share: | |||||||||||||||
Basic | $ | (0.04 | ) | $ | 0.02 | $ | (0.05 | ) | $ | 0.02 | |||||
Diluted | $ | (0.04 | ) | $ | 0.02 | $ | (0.05 | ) | $ | 0.02 | |||||
For purposes of this calculation, outstanding stock options, stock warrants, and unvested restricted stock units are considered common stock equivalents using the treasury stock method, and are the only such equivalents outstanding. For the six months ended June 30, 2011, options to purchase approximately 2.6 million shares of common stock, warrants to purchase 475,000 shares of common stock and approximately 34,000 unvested restricted stock units were excluded from the calculation as their impact would be anti-dilutive.
8
4. Software Development Costs
The Company capitalizes costs associated with internally developed software, developed for internal use only, during the application development stage. Application development stage costs generally include costs associated with internal-use software configuration, coding, installation and testing. Costs of significant upgrades and enhancements that result in additional functionality also are capitalized, whereas costs incurred for maintenance and minor upgrades and enhancements are expensed as incurred. Capitalized costs include external direct costs of materials and services utilized in developing or obtaining internal-use software and payroll and payroll-related expenses for employees who are directly associated with and devote time to the internal-use software projects. Capitalization of such costs begins when the preliminary project stage is complete and ceases no later than the point at which the project is substantially complete and ready for its intended purpose. Capitalized costs are amortized using the straight-line method over the useful life of the software, which is typically five years.
During the three and six months ended June 30, 2011, the Company capitalized $237,000 and $353,000, respectively. During the three and six months ended June 30, 2010, the Company capitalized approximately $55,000 and $182,000, respectively.
5. Income Taxes
Income tax provision (benefit) for the six months ended June 30 differed from the U.S. federal income tax rate of 34% approximately in the amounts indicated as a result of the following:
2011 | 2010 | |||||||
Computed “expected” tax provision (benefit) | $ | (404 | ) | $ | 162 | |||
Permanent differences | 7 | (510 | ) | |||||
Shortfall from restricted stock units conversion | 69 | — | ||||||
Warrant deduction | — | 511 | ||||||
State taxes | 10 | 21 | ||||||
Other | (4 | ) | (7 | ) | ||||
Total income tax provision (benefit) | $ | (322 | ) | $ | 177 | |||
The Company was notified during the six months ended June 30, 2011 of an examination by tax authorities for its U.S. federal return for the year ended 2009. The examination began in April 2011 and is currently in process.
6. Warrants
The Company entered into an agreement as of February 25, 2011, whereby the Company agreed to issue warrants to purchase 250,000 shares of common stock with an exercise price of $1.67. The warrants vest in increments pursuant to the achievement of defined, agreed upon revenue targets generated by new clients within a five year term. The agreement also obligates the Company to issue warrants to purchase up to an additional 500,000 shares of common stock (issued in 250,000 increments) pursuant to the achievement of additional defined agreed upon revenue targets.
During the six months ended June 30, 2011, we recognized compensation costs of approximately $14,000 associated with the warrant. The cost has been adjusted for the probability that the revenue targets will be reached. That probability will be re-evaluated and updated based on current market conditions, on a quarterly basis, and compensation costs will be adjusted accordingly.
7. Subsequent Events
On July 25, 2011, the Board of Directors (the "Board") of the Company appointed William J. Simpson, Jr., as President and Chief Operating Officer of the Company and Kenneth S. George, as Chief Executive Officer of the Company. The appointments followed the acceptance by the Board of Directors of David S. Boone's resignation from his positions with the Company, including his positions as President, Chief Executive Officer and director, earlier that day.
In connection with his resignation, Mr. Boone entered into a severance agreement and general release with the Company, effective July 25, 2011. Under the agreement, Mr. Boone will receive, in addition to any base compensation owed and earned but unused vacation pay, severance payments over a six month period that in the aggregate equal six months' worth of his annual base compensation, and has the right to continue participation in the Company-sponsored group health insurance plan in accordance with COBRA. In addition, the terms of his vested but unexercised stock options will be extended to the date that is 60 days from the date of the public release by the Company of its earnings for the quarter ended June 30, 2011.
9
FORWARD-LOOKING STATEMENTS
This document contains forward-looking statements within the meaning of Section 27A of the Securities Act of 1933, as amended, and Section 21E of the Securities Exchange Act of 1934, as amended. These statements can be identified by forward-looking words such as “may,” “will,” “expect,” “intend”, “anticipate,” “believe,” “estimate” and “continue” or similar words and discuss the Company’s plans, objectives and expectations for future operations, including its services, contain projections of the Company’s future operating results or financial condition, and discuss its expectations with respect to the growth in health care costs in the United States, the demand for ancillary benefits management services, and the Company’s competitive advantages, or contain other “forward-looking” information.
Such forward-looking statements are based on current information, assumptions and belief of management, and are not guarantees of future performance. Substantial risks and uncertainties could cause actual results to differ materially from those indicated by such forward-looking statements, including, but not limited to, the Company’s inability to attract or maintain providers or clients or achieve its financial results, changes in national health care policy, federal or state regulation, and/or rates of reimbursement including without limitation the impact of the newly-enacted Patient Protection and Affordable Care Act, Health Care and Educational Affordability Reconciliation Act and medical loss ratio regulations, general economic conditions (including the recent economic downturns and increases in unemployment), lower than anticipated demand for ancillary services, pricing, market acceptance/preference, the Company’s ability to integrate with its clients, consolidation in the industry that may affect the Company’s key clients, changes in the business decisions by significant clients, increased competition, the Company’s inability to manage growth, implementation and performance difficulties, and other risk factors detailed from time to time in the Company’s periodic filings with the Securities and Exchange Commission, including its annual report on Form 10-K for the year ended December 31, 2010 and the quarterly reports on Form 10-Q filed for each of the subsequent quarters.
Do not place undue reliance on these forward-looking statements, which speak only as of the date this document was prepared. All forward-looking statements included herein are expressly qualified in their entirety by the cautionary statements contained or referred to in this section. Except to the extent required by applicable securities laws and regulations, the Company undertakes no obligation to update or revise these forward-looking statements to reflect events or circumstances after the date of this document or to reflect the occurrence of unanticipated events.
ITEM 2. Management's Discussion and Analysis of Financial Condition and Results of Operations
GENERAL
Management’s discussion and analysis provides a review of the Company’s operating results for the three and six months ended June 30, 2011 and its financial condition at June 30, 2011. The focus of this review is on the underlying business reasons for significant changes and trends affecting the net revenues, operating results and financial condition of the Company. This review should be read in conjunction with the accompanying unaudited consolidated financial statements and the audited consolidated financial statements and the notes thereto included in our Annual Report on Form 10-K for the year ended December 31, 2010.
OVERVIEW
American CareSource Holdings, Inc. (“ACS,” “Company,” the “Registrant,” “we,” “us,” or “our”) works to help employers control healthcare costs by offering cost effective access to a comprehensive national network of ancillary healthcare service providers. The Company sells its services to a number of healthcare companies including preferred provider organizations ("PPOs"), third party administrators (“TPAs”), insurance companies, large self-funded organizations and various employee groups. The Company offers payors this solution by:
• | lowering its payors’ ancillary care costs throughout our network of high quality, cost effective providers that the Company has under contract at more favorable terms than they could generally obtain on their own; |
• | providing payors with a comprehensive network of ancillary healthcare services providers that is tailored to each payor’s specific needs and is available to each payor’s members for covered services; |
• | providing payors with claims management, reporting and processing and payment services; |
• | performing network/needs analysis to assess the benefits to payors of adding additional/different service providers to the payor -specific provider networks; and |
10
• | credentialing network service providers for inclusion in the payor -specific provider networks. |
The Company’s business model, illustrating the relationships among the persons involved, directly or indirectly, in the Company’s business and its generation of revenue and expenses, is depicted below:
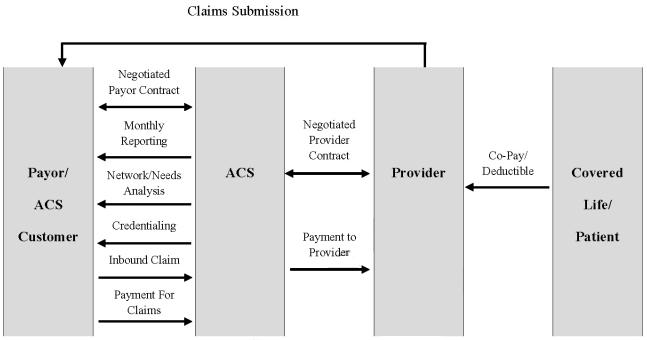
Payors route healthcare claims to us after service has been performed by participant providers in our network. We process those claims and charge the payor according to its contractual rate for the services according to our contract with the payor. In processing the claim, we are paid directly by the payor or the insurer for the service. We then pay the provider of service according to its independently-negotiated contractual rate. We assume the risk of generating positive margin, the difference between the payment we receive for the service and the amount we are obligated to pay the provider of service.
The Company recognizes revenues for ancillary healthcare services when services by providers have been authorized and performed, the claim has been billed to the payor and collections from payors are reasonably assured. Cost of revenues for ancillary healthcare services consist of amounts due to providers for providing ancillary health care services, client administration fees paid to our client payors to reimburse them for routing the claims to us for processing, and the Company’s related direct labor and overhead of processing billings, collections and payments. The Company is not liable for costs incurred by independent contract service providers until payment is received by it from the payors. The Company recognizes actual or estimated liabilities to independent contract service providers as the related revenues are recognized.
The Company is seeking growth in the number of client payors and service provider relationships it secures by focusing on providing in-network services for its payors and aggressively pursuing additional TPAs, self-insured employers and other direct payors as its primary sales targets. The Company believes this strategy should increase the volume of claims the Company can process in addition to the expansion in the number of lives that are eligible to receive ancillary health care benefits. No assurances can be given that the Company can expand its service provider or payor relationships, nor that any such expansion will result in an improvement in the results of operations of the Company.
In addition, under the Minimum Loss Ratio regulations ("MLR") included in the Affordable Care Act, it is possible that a portion of the fees our existing and prospective payors are contractually required to pay us and that do not qualify as 'incurred claims' may not be included as expenditures for activities that improve health care quality. Such a determination may make it more difficult for us to retain existing clients and/or add new clients, because our clients' or prospective clients' MLR may otherwise not meet the specified targets. This may reduce our net revenues and profit margins. See "Proposed health care reforms could materially adversely affect our revenues, financial position and our results of operations" under "Item 1.A. Risk Factors" in our Annual Report on Form 10-K for the year ended December 31, 2010.
11
CRITICAL ACCOUNTING POLICIES AND ESTIMATES
Management’s discussion and analysis of our financial condition and results of operations is based upon our condensed consolidated financial statements. These condensed consolidated financial statements have been prepared following the requirements of accounting principles generally accepted in the United States (“GAAP”) for interim periods and require us to make estimates and judgments that affect the reported amounts of assets, liabilities, revenues and expenses, and related disclosure of contingent assets and liabilities. On an ongoing basis, we evaluate our estimates, including those related to revenue recognition, provider cost recognition, the resulting contribution margins, amortization and potential impairment of intangible assets and goodwill and stock-based compensation expense. As these are condensed consolidated financial statements, you should also read expanded information about our critical accounting policies and estimates provided in Item 7, “Management’s Discussion and Analysis of Financial Condition and Results of Operations” under the heading “Critical Accounting Policies,” included in our Annual Report on Form 10-K for the year ended December 31, 2010. There have been no material changes to our critical accounting policies and estimates from the information provided in our Form 10-K for the year ended December 31, 2010.
ANALYSIS OF RESULTS OF OPERATIONS
Net Revenues
The Company’s net revenues are generated from ancillary healthcare service claims. Revenue is recognized when we bill our client payors for services performed and collection is reasonably assured. The Company estimates revenues using average historical collection rates. When estimating collectibility, we assess the impact of items such as non-covered benefits, denied claims, deductibles and co-payments. Periodically, revenues are adjusted to reflect actual cash collections so that revenues recognized accurately reflect cash collected. There are no assurances that actual cash collections will meet or exceed estimated cash collections.
The following table sets forth a comparison of our net revenues for the following periods presented ended June 30:
Second Quarter | Six Months | ||||||||||||||||||||||||||||
Change | Change | ||||||||||||||||||||||||||||
($ in thousands) | 2011 | 2010 | $ | % | 2011 | 2010 | $ | % | |||||||||||||||||||||
Net Revenues | $ | 11,308 | $ | 15,958 | (4,650 | ) | (29 | )% | $ | 24,385 | $ | 30,329 | $ | (5,944 | ) | (20 | )% | ||||||||||||
In addition, the following table sets forth a comparison of processed and billed claims for the following periods presented ended June 30:
Second Quarter | Six months | |||||||||||||||||||||||
Change | Change | |||||||||||||||||||||||
(in thousands) | 2011 | 2010 | Claims | % | 2011 | 2010 | Claims | % | ||||||||||||||||
Processed | 82 | 100 | (18 | ) | (18 | )% | 167 | 205 | (38 | ) | (19 | )% | ||||||||||||
Billed | 67 | 85 | (18 | ) | (21 | ) | 135 | 171 | (36 | ) | (21 | ) | ||||||||||||
The decrease in net revenue for the three and six months ended June 30, 2011 as compared to the same periods in 2010 was due to the overall decline in claims volume. The decline was primarily the result of the following factors:
• | Loss of a significant employer group by our largest client. Claims from the group generated revenue of approximately $3.0 million in the second quarter of 2010 and $4.8 million for the six months ended June 30, 2010. Claims from the group generated revenue of approximately $500,000 during the six months ended June 30, 2011; |
• | The ongoing transition status of our other key account related to a business combination resulting in declining revenues; |
• | Stronger presence of larger carriers in the market, which resulted in loss of market share; |
• | Loss of key relationship with a national laboratory services provider in the second quarter of 2010; |
• | The change in patient and specialty mix and benefit plan design changes, which has resulted in the increase in non-covered benefits; and |
• | The extended sales cycle as we move more heavily into the TPA and direct payor market. |
The decline in net revenue was partially offset by $2.0 million and $4.5 million of incremental revenue generated in the three and six months ended June 30, 2011, respectively, from fifteen new clients implemented in 2010 and the first-half of 2011.
12
The following table details the change in client accounts for the periods ended June 30:
Net Revenue | Billed Claims Volume | |||||||||||||||||||||||||
Second Quarter | Change | Second Quarter | Change | |||||||||||||||||||||||
(in thousands) | 2011 | 2010 | $ | % | 2011 | 2010 | Claims | % | ||||||||||||||||||
Client A | $ | 3,071 | $ | 8,551 | $ | (5,480 | ) | (64 | )% | 21 | 33 | (13 | ) | (38 | )% | |||||||||||
Client B | 2,455 | 4,334 | (1,879 | ) | (43 | ) | 11 | 26 | (15 | ) | (58 | ) | ||||||||||||||
Other clients | 2,701 | 2,004 | 697 | 35 | 18 | 21 | (3 | ) | (13 | ) | ||||||||||||||||
Clients implemented in 2010 | 2,854 | 1,129 | 1,725 | 153 | 16 | 4 | 12 | 273 | ||||||||||||||||||
Clients implemented in 2011 | 295 | — | 295 | nm | 2 | — | 2 | nm | ||||||||||||||||||
Total | 11,376 | 16,018 | (4,642 | ) | (29 | )% | 67 | 85 | (18 | ) | (21 | )% | ||||||||||||||
Provision for refunds | (68 | ) | (60 | ) | (8 | ) | nm | — | — | — | nm | |||||||||||||||
Net Revenue | $ | 11,308 | $ | 15,958 | $ | (4,650 | ) | (29 | )% | 67 | 85 | (18 | ) | (21 | )% | |||||||||||
The following table details the change in client accounts for the periods ended June 30:
Net Revenue | Billed Claims Volume | |||||||||||||||||||||||||
Six Months | Change | Six Months | Change | |||||||||||||||||||||||
(in thousands) | 2011 | 2010 | $ | % | 2011 | 2010 | Claims | % | ||||||||||||||||||
Client A | $ | 8,178 | $ | 15,557 | $ | (7,379 | ) | (47 | )% | 40 | 66 | (26 | ) | (39 | )% | |||||||||||
Client B | 5,259 | 9,300 | (4,041 | ) | (43 | ) | 24 | 56 | (32 | ) | (58 | ) | ||||||||||||||
Other clients | 5,367 | 4,198 | 1,169 | 28 | 38 | 44 | (6 | ) | (13 | ) | ||||||||||||||||
Clients implemented in 2010 | 5,533 | 1,394 | 4,139 | 297 | 31 | 6 | 25 | 417 | ||||||||||||||||||
Clients implemented in 2011 | 352 | — | 352 | nm | 2 | — | 2 | nm | ||||||||||||||||||
Total | 24,689 | 30,449 | (5,760 | ) | (19 | )% | 135 | 171 | (36 | ) | (21 | )% | ||||||||||||||
Provision for refunds | (304 | ) | (120 | ) | (184 | ) | (153 | ) | — | — | — | nm | ||||||||||||||
Net Revenue | $ | 24,385 | $ | 30,329 | $ | (5,944 | ) | (20 | )% | 135 | 171 | (36 | ) | (21 | )% | |||||||||||
The Company is seeking growth by aggressively pursuing middle-market insurance companies, TPAs and direct payors. The Company continues to derive a significant amount of its revenues from its traditional PPO relationships, but we have shifted our focus and now aggressively target TPAs and direct payors. A portion of our target market is Employee Retirement Income Security Act ("ERISA")-based health plans that seek cost-effective healthcare benefits for its members and present an opportunity for the Company to influence plan design and provide incentives.
Despite the growth from new clients, we continue to see revenue decline from our two most significant clients, both of which are PPOs. While our new client additions have offset some of the declines, we expect that revenues will continue to decline further as a result of the loss of business from our two largest clients.
The following table details the change in revenue generated from different client groups for the periods ended June 30:
Second Quarter | ||||||||||||||||||||||||||
2011 | 2010 | Change | ||||||||||||||||||||||||
($ in thousands) | Count | Revenue | % of revenue | Count | Revenue | % of revenue | $ | % | ||||||||||||||||||
PPOs | 10 | $ | 5,705 | 50.2 | % | 9 | $ | 12,312 | 76.9 | % | $ | (6,607 | ) | (54 | )% | |||||||||||
TPAs | 20 | 4,198 | 36.9 | 9 | 2,434 | 15.2 | 1,764 | 72 | ||||||||||||||||||
Direct/Insurance Companies | 3 | 1,473 | 12.9 | 3 | 1,272 | 7.9 | 201 | 16 | ||||||||||||||||||
Total | 33 | $ | 11,376 | 100.0 | % | 21 | $ | 16,018 | 100.0 | % | $ | (4,642 | ) | (29 | )% | |||||||||||
13
The following table details the change in revenue generated from different client groups for the periods ended June 30:
Six months | ||||||||||||||||||||||||||
2011 | 2010 | Change | ||||||||||||||||||||||||
($ in thousands) | Count | Revenue | % of revenue | Count | Revenue | % of revenue | $ | % | ||||||||||||||||||
PPOs | 10 | $ | 13,461 | 54.5 | % | 9 | $ | 23,779 | 78.1 | % | $ | (10,318 | ) | (43 | )% | |||||||||||
TPAs | 20 | 7,971 | 32.3 | 9 | 4,171 | 13.7 | 3,800 | 91 | ||||||||||||||||||
Direct/Insurance Companies | 3 | 3,257 | 13.2 | 3 | 2,499 | 8.2 | 758 | 30 | ||||||||||||||||||
Total | 33 | $ | 24,689 | 100.0 | % | 21 | $ | 30,449 | 100.0 | % | $ | (5,760 | ) | (19 | )% | |||||||||||
Cost of Revenues
Cost of revenues is comprised of payments to our providers, administrative fees paid to our clients for converting claims to electronic data interchange and routing them to both the Company for processing and to their payors for payment, and the fixed costs of our claims administration and ancillary service provider development organizations. Payments to providers is the largest component of our cost of revenues and it consists of our payments for ancillary care services in accordance with contracts negotiated separately with providers for specific ancillary services.
The following table sets forth a comparison of the components of our cost of revenues, for the periods presented ended June 30:
Second Quarter | |||||||||||||||||||||
Change | |||||||||||||||||||||
($ in thousands) | 2011 | % of net revenue | 2010 | % of net revenue | $ | % | |||||||||||||||
Provider payments | $ | 8,815 | 78.0 | % | $ | 11,688 | 73.2 | % | $ | (2,873 | ) | (25 | )% | ||||||||
Administrative fees | 503 | 4.4 | 984 | 6.2 | (481 | ) | (49 | ) | |||||||||||||
Claims administration and provider development | 1,146 | 10.1 | 1,188 | 7.4 | (42 | ) | (4 | ) | |||||||||||||
Total cost of revenues | $ | 10,464 | 92.5 | % | $ | 13,860 | 86.8 | % | $ | (3,396 | ) | (25 | )% | ||||||||
The following table sets forth a comparison of the components of our cost of revenues, for the periods presented ended June 30:
Six Months | |||||||||||||||||||||
Change | |||||||||||||||||||||
($ in thousands) | 2011 | % of net revenue | 2010 | % of net revenue | $ | % | |||||||||||||||
Provider payments | $ | 18,624 | 76.4 | % | $ | 22,102 | 72.9 | % | $ | (3,478 | ) | (16 | )% | ||||||||
Administrative fees | 1,175 | 4.8 | 1,753 | 5.8 | (578 | ) | (33 | ) | |||||||||||||
Claims administration and provider development | 2,253 | 9.2 | 2,408 | 7.9 | (155 | ) | (6 | ) | |||||||||||||
Total cost of revenues | $ | 22,052 | 90.4 | % | $ | 26,263 | 86.6 | % | $ | (4,211 | ) | (16 | )% | ||||||||
Provider payments. The 25% and 16% decrease in provider payments for the second quarter and first half of 2010, respectively, is consistent with the decline in revenue, primarily related to our two significant clients. The increase in provider payments as a percentage of net revenues compared to the same prior year periods is primarily due to the following:
• | A shift in mix from clients that generate higher margins, relative to other clients, primarily as a result of the loss a large payor group by our largest client; and |
• | A shift in mix from higher margin categories, such as laboratory and infusion services, to lower margin categories, such as dialysis services. In addition, margins on dialysis services claims declined as a result of a shift to service providers with which we have less advantageous pricing resulting in pressure on contribution margin. |
14
Administrative fees. Administrative fees paid in the second quarter to clients as a percent of net revenues decreased to 4.4% compared to 6.2% in the same prior year period. Administrative fees paid to clients during the six months ended June 30, 2011 decreased to 4.8% compared to 5.8% in the same prior year period. The decrease is due to a change in mix from clients with higher administrative fees to clients with lower administrative fees, primarily clients implemented in 2010.
Claims administration and provider development. Our claims administration organization consists of our operations and information technology groups. Our operations group is responsible for all aspects of the claims management and processing including billing, quality assurance and collections efforts. In addition, our operations group is responsible for credentialing contracted ancillary service providers. Our information technology group is responsible for maintaining and enhancing the technological capabilities and applications of the claims management process. Our provider development group is responsible for developing our network of ancillary healthcare service providers, which includes contracting with providers to be included in the network and maintaining a relationship with existing providers, all for the purpose of enhancing our ancillary service provider network offering to our client payors. The following table sets forth a comparison of the groups related to claims administration and provider development for the periods presented ended June 30:
Second Quarter | Six months | |||||||||||||||||||||||||||||
Change | Change | |||||||||||||||||||||||||||||
($ in thousands) | 2011 | 2010 | $ | % | 2011 | 2010 | $ | % | ||||||||||||||||||||||
Claims administration | $ | 795 | $ | 710 | $ | 85 | 12 | % | $ | 1,583 | $ | 1,396 | $ | 187 | 13 | % | ||||||||||||||
Provider development | 351 | 478 | (127 | ) | (27 | ) | 670 | 1,012 | (342 | ) | (34 | ) | ||||||||||||||||||
Total cost of revenues | $ | 1,146 | $ | 1,188 | $ | (42 | ) | (4 | )% | $ | 2,253 | $ | 2,408 | $ | (155 | ) | (6 | )% | ||||||||||||
The increase in claims administration costs and decrease in provider development costs are primarily due to changes in headcount. Effective January 1, 2011, the Company strategically realigned personnel within departments based on responsibilities and functionality in order to achieve a more productive alignment. As a result, five positions were realigned out of the provider development group; three were allocated to the finance group (classified as Selling, General and Administrative) and two to the operations group. The following table details the change in average headcount in the groups related to claims administration and provider development for the periods presented ended June 30:
Headcount (average) | 2011 | 2010 | ||||
Operations | 23 | 21 | ||||
Information technology | 14 | 13 | ||||
Total claims administration | 37 | 34 | ||||
Provider development | 9 | 15 | ||||
Contribution Margin
Contribution margin is calculated by dividing the difference between net revenues and total costs of revenues by net revenues. The following table sets forth a comparison of contribution margin percentage for the periods ended June 30:
Second Quarter | Six Months | |||||||||||||||||
2011 | 2010 | Percent Change | 2011 | 2010 | Percent Change | |||||||||||||
Contribution margin | 7.5 | % | 13.2 | % | (5.7 | )% | 9.6 | % | 13.4 | % | (3.8 | )% | ||||||
The factors driving the overall decline in contribution margin percentage was discussed in the cost of revenue section. Our contribution margin percentage fluctuates over time due to changes in the prices we charge our client payors as compared to the financial terms of our provider agreements, changes in costs of claims administration and provider development, and changes in the mix of services we provide. There can be no assurances that we will be able to maintain contribution margin at current levels, either in absolute or in percentage terms.
15
Selling, General and Administrative Expenses
Selling, general and administrative (“SG&A”) expenses consist primarily of salaries and related benefits, travel costs, sales commissions, sales materials, other marketing related expenses, costs of corporate operations, finance and accounting, human resources and other general operating expenses of the Company. The following table sets forth a comparison of our SG&A expenses for the periods presented ending June 30:
Second Quarter | Six Months | |||||||||||||||||||||||||||
Change | Change | |||||||||||||||||||||||||||
($ in thousands) | 2011 | 2010 | $ | % | 2011 | 2010 | $ | % | ||||||||||||||||||||
Selling, general and administrative expenses | $ | 1,628 | $ | 1,481 | $ | 147 | 10 | % | $ | 3,165 | $ | 3,276 | $ | (111 | ) | (3 | )% | |||||||||||
Percentage of total net revenues | 14.4 | % | 9.3 | % | 13.0 | % | 10.8 | % | ||||||||||||||||||||
SG&A expenses as a percentage of total net revenues increased during the three and six months ended June 30, 2011 compared to the same prior year periods is due primarily to the decline in net revenues compared to the same periods.
The 10% increase in SG&A expenses during the three months ended June 30, 2011 as compared to the same prior year period is primarily the result of the strategic realignment which was effective January 1, 2011. As a result, three employees were realigned out of the provider development group and allocated to the finance group.
SG&A expenses for the six months ended June 30, 2010 include severance charges of approximately $143,000 related to the departure of our former Chief Financial Officer. Excluding those severance charges, SG&A expenses increased approximately $32,000, or 1%, in the six months ended June 30, 2011 compared to the same prior year period.
Depreciation and Amortization
The following table sets forth a comparison of depreciation and amortization for the periods presented ended June 30:
Second Quarter | Six month | |||||||||||||||||||||||||||
Change | Change | |||||||||||||||||||||||||||
($ in thousands) | 2011 | 2010 | $ | % | 2011 | 2010 | $ | % | ||||||||||||||||||||
Depreciation | $ | 159 | $ | 160 | $ | (1 | ) | (1 | )% | $ | 318 | $ | 310 | $ | 8 | 3 | % | |||||||||||
Amortization | 32 | 32 | — | — | 64 | 64 | — | — | ||||||||||||||||||||
Total Depreciation and Amortization | $ | 191 | $ | 192 | $ | (1 | ) | (1 | )% | $ | 382 | $ | 374 | $ | 8 | 2 | % | |||||||||||
Income Tax Provision
The effective income tax rates for the three and six months ended June 30, 2011 and 2010 were different from the statutory United States federal income tax rate of 34% primarily due to state income taxes and permanent differences. Reconciliations of the differences for the periods presented are disclosed in Item 1, Financial Statements, Note 5.
16
FINANCIAL CONDITION AND LIQUIDITY
As of June 30, 2011 the Company had working capital of $12.0 million compared to $12.6 million at December 31, 2010. Our cash and cash equivalents balance decreased to $11.4 million as of June 30, 2011 compared to $14.5 million at December 31, 2010. The decrease in cash during the first quarter of 2011 is primarily related to the timing of payments to providers as of June 30, 2011 compared to December 31, 2010, as well as the decline in claims volume and resulting revenue and losses during the six months ended June 30, 2011, compared to the same prior year period.
For the three and six months ended June 30, 2011, operating activities used net cash of approximately 2.8 million, the primary components of which were a net loss of approximately $867,000, adjusted for non-cash items including: share-based compensation expense of approximately $445,000, depreciation and amortization of approximately $381,000, amortization of warrant costs of approximately $67,000, amortization of the costs associated with the amendment to the contract with one of our significant clients of approximately $125,000, and a decrease in deferred taxes of approximately $330,000, as well as, a net cash outflow from net operating assets and liabilities of approximately $2.6 million. The net cash outflow from net operating assets and liabilities was due primarily to a decline in revenue during the six months ended June 30, 2011 and losses of $745,000 as compared to prior periods and the timing of payments to providers and receipts from payors as of June 30, 2011 compared to December 31, 2010.
Investing activities during the six months ended June 30, 2011 were comprised mainly of investments in software development of approximately $353,000. The software development costs relate primarily to enhancements of our internal billing system.
The company had no net cash provided by financing activities during the three and six months ended June 30, 2011.
INFLATION
Inflation did not have a significant impact on the Company’s costs during the quarters ended June 30, 2011 and June 30, 2010, respectively. The Company continues to monitor the impact of inflation in order to minimize its effects through pricing strategies, productivity improvements and cost reductions.
OFF-BALANCE SHEET ARRANGEMENTS
The Company does not have any off-balance sheet arrangements as of June 30, 2011 or 2010 or for the periods then ended.
ITEM 3. Quantitative and Qualitative Disclosures About Market Risk
Not applicable.
ITEM 4. Controls and Procedures
Evaluation of Disclosure Controls and Procedures. Our management, with the participation of our Chief Executive Officer and Chief Financial Officer, has evaluated the effectiveness of our disclosure controls and procedures as of June 30, 2011. Based upon this evaluation, our Chief Executive Officer and Chief Financial Officer concluded that our disclosure controls and procedures (as defined in Rules 13a-15(e) and 15d-15(e) under the Securities Exchange Act of 1934, as amended (the “Exchange Act”)) are effective to ensure that information required to the disclosed by us in reports we file or submit under the Exchange Act is recorded, processed, summarized and reported within the time periods specified in the SEC’s rules and forms, and is accumulated and communicated to our management, including our Chief Executive Officer and Chief Financial Officer, as appropriate to allow timely decisions regarding required disclosures.
Changes in Internal Controls Over Financial Reporting. Our management, with the participation of our Chief Executive Officer and Chief Financial Officer, has concluded that there were no changes in the Company’s internal controls over financial reporting (as defined in Rules 13a-15(f) and 15d-15(f) under the Exchange Act) since the last fiscal quarter that have materially affected the Company’s internal controls over financial reporting or are reasonably likely to materially affect internal controls over financial reporting.
17
PART II. OTHER INFORMATION
ITEM 1A. Risk Factors
The Company has experienced declining revenue over the last two years primarily as a result of the decline in business from its two largest clients. Although we continue to seek new clients and to expand our product offerings, we expect that our revenues will continue to decline over the next several quarters while we explore various options to offset revenue declines and return to a certain level of profitability.
In addition to the other information set forth in this report, one should carefully consider the discussion of various risks and uncertainties contained in Part I, “Item 1A. Risk Factors” in our 2010 Annual Report on Form 10-K. We believe those risk factors are the most relevant to our business and could cause our results to differ materially from the forward-looking statements made by us.
ITEM 5. Other Information
The Company has postponed the date of its 2011 Annual Meeting of Stockholders, originally scheduled for May 23, 2011. The meeting is now scheduled for September 26, 2011.
The date of the 2011 Annual Meeting will be more than 30 days after the anniversary date of the 2010 Annual Meeting. Pursuant to Rule 14a-8 under the Securities and Exchange Act of 1934, as amended, stockholders may present proposals for inclusion in the Company's proxy statement for the 2011 Annual Meeting by submitting their proposals to the Company at 5429 Lyndon B. Johnson Freeway, Suite 850, Dallas, Texas 75240, Attention: Chief Executive Officer, a reasonable time before the Company begins to print and send its proxy materials.
ITEM 6. Exhibits
Exhibit 31.1 | Certification Pursuant to Section 302 of the Sarbanes-Oxley Act of 2002 |
Exhibit 31.2 | Certification Pursuant to Section 302 of the Sarbanes-Oxley Act of 2002 |
Exhibit 32.1 | Certifications Pursuant to 18 U.S.C. Section 1350, as adopted pursuant to Section 906 of the Sarbanes-Oxley Act of 2002 |
Exhibit 101 | The following financial statements and footnotes from the American Caresource Holdings, Inc. Quarterly Report on Form 10-Q for the quarter ended June 30, 2011 formatted in Extensible Business Reporting Language (XBRL): (i) Consolidated Statements of Operations; (ii) Consolidated Balance Sheets; (iii) Consolidated Statement of Stockholders' Equity; (iv) Consolidated Statements of Cash Flows; and (v) the Notes to Unaudited Consolidated Financial Statements, tagged as blocks of text.* |
*Pursuant to Rule 406T of Regulation S-T, the Interactive Data Files on Exhibit 101 hereto are deemed not filed or part of a registration statement or prospectus for purposes of Sections 11 or 12 of the Securities Act of 1933, as amended, are deemed not filed for purposes of Section 18 of the Securities Exchange Act of 1934, as amended, and otherwise are not subject to liability under those sections.
18
SIGNATURES
Pursuant to the requirements of the Securities Exchange Act of 1934, the registrant has duly caused this report to be signed on its behalf by the undersigned thereunto duly authorized.
AMERICAN CARESOURCE HOLDINGS, INC. | |||
Date: | August 12, 2011 | By: | /s/ Kenneth S. George |
Kenneth S. George | |||
Chairman of the Board of Directors and Chief Executive Officer (Principal Executive Officer) | |||
Date: | August 12, 2011 | By: | /s/ Matthew D. Thompson |
Matthew D. Thompson | |||
Chief Financial Officer (Principal Financial Officer and Principal Accounting Officer) | |||
19