Attached files
| file | filename |
|---|---|
| 8-K/A - AMENDMENT NO. 1 TO FORM 8-K - MOSAIC CO | d8ka.htm |
 The Mosaic Company
August 2011
Exhibit 99.1 |
 Safe Harbor Statement
2
This presentation contains forward-looking statements within the meaning of the Private Securities
Litigation Reform Act of 1995. Such statements include, but are not limited to, statements
about future financial and operating results. Such statements are based upon the current
beliefs and expectations of The Mosaic Company’s management and are subject to significant risks and uncertainties. These risks
and uncertainties include but are not limited to the predictability and volatility of, and customer
expectations about, agriculture, fertilizer, raw material, energy and transportation markets
that are subject to competitive and other pressures and the effects of the current economic and
financial turmoil; the level of inventories in the distribution channels for crop nutrients; changes
in foreign currency and exchange rates; international trade risks; changes in government
policy; changes in environmental and other governmental regulation, including greenhouse gas
regulation and implementation of the U.S. Environmental Protection Agency’s numeric water quality standards for the discharge of
nutrients into Florida lakes and streams; further developments in the lawsuit involving the federal
wetlands permit for the extension of the Company’s South Fort Meade, Florida, mine into
Hardee County, including orders, rulings, injunctions or other actions by the court or actions
by the plaintiffs, the Army Corps of Engineers or others in relation to the lawsuit, or any actions
the Company may identify and implement in an effort to mitigate the effects of the lawsuit;
other difficulties or delays in receiving, or increased costs of, necessary governmental permits
or approvals; further developments in the lawsuit involving the tolling agreement at the Company's
Esterhazy, Saskatchewan, potash mine, including settlement or orders, rulings, injunctions or
other actions by the court, the plaintiff or others in relation to the lawsuit; the
effectiveness of our processes for managing our strategic priorities; adverse weather conditions
affecting operations in Central Florida or the Gulf Coast of the United States, including
potential hurricanes or excess rainfall; actual costs of asset retirement, environmental remediation,
reclamation or other environmental regulation differing from management’s current estimates;
accidents and other disruptions involving Mosaic’s operations, including brine inflows at
its Esterhazy, Saskatchewan potash mine and other potential mine fires, floods, explosions,
seismic events or releases of hazardous or volatile chemicals, as well as other risks and
uncertainties reported from time to time in The Mosaic Company’s reports filed with the
Securities and Exchange Commission. Actual results may differ from those set forth in the forward-
looking statements. |
 Mosaic is well positioned to capitalize on attractive
near and long-term opportunities:
3
High quality production and distribution
assets
•
Largest combined P&K producer
•
Global presence
Experienced and talented management team
focused on operational excellence and
execution
•
$5 billion potash expansion, on time, on budget
•
Operational excellence driving maintenance,
energy, and other savings
•
Productivity enhancements increasing operating
rates
Strong balance sheet reflecting store of value
and flexibility to capitalize on investment
opportunities
•
Over $3.9 billion in cash
•
Significant debt capacity
•
Fiscal
2011
ROIC
of
22.3
percent
(c)
(a)
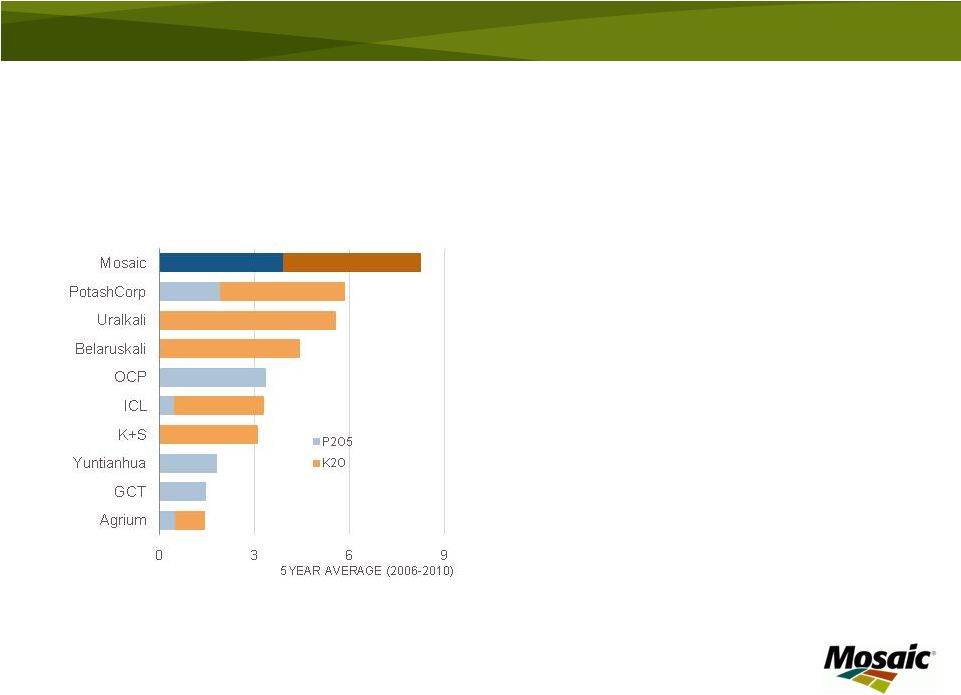
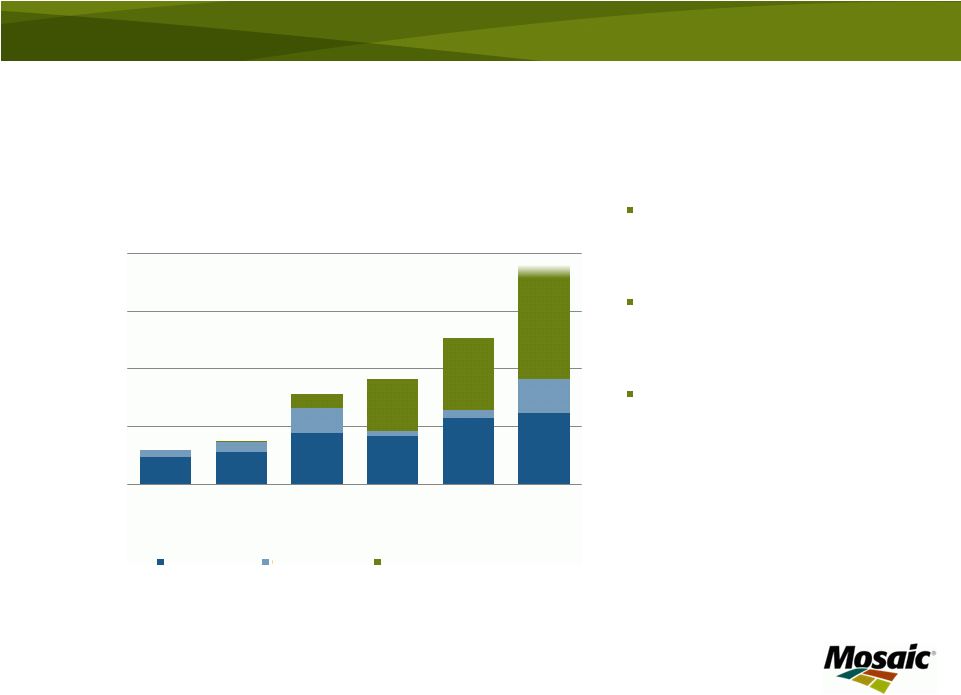
Mosaic K2O production includes the POT / MOS tolling agreement
production, mined, milled and shipped by MOS. This production
is excluded from PotashCorp production statistics
(b)
Reflects combined Uralkali and Silvinit production over the period
(c)
See appendix 2 for ROIC calculation
Source: IFA, company reports and Mosaic estimate
WORLD’S LARGEST P&K COMPANIES
MILLION TONNES PRODUCTION |
 Market Overview
4
Attractive near and long term industry fundamentals will
drive crop nutrient demand growth |
 Crop Nutrients Required to Meet Global
Demand for Food, Fuel, Feed and Fiber
Crop nutrients are a key component required to meet the food security
challenge
Key demand drivers suggest strong nutrient demand
Global population growth
Growing affluence leading to higher protein usage
Biofuel production
Farm economics
Planted area
Application rates
5 |
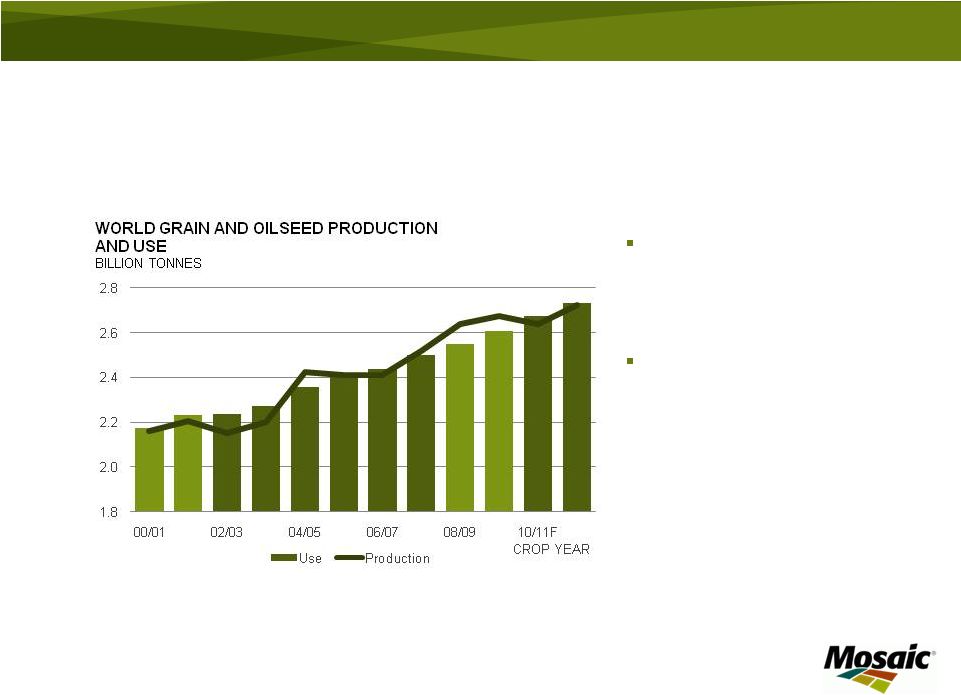 Accelerating Grain and Oilseed Use
6
Agricultural commodity
prices highly sensitive to
weather and political
developments
Steady upward trend in
demand
Source: USDA, lighter bars indicate recession years
|
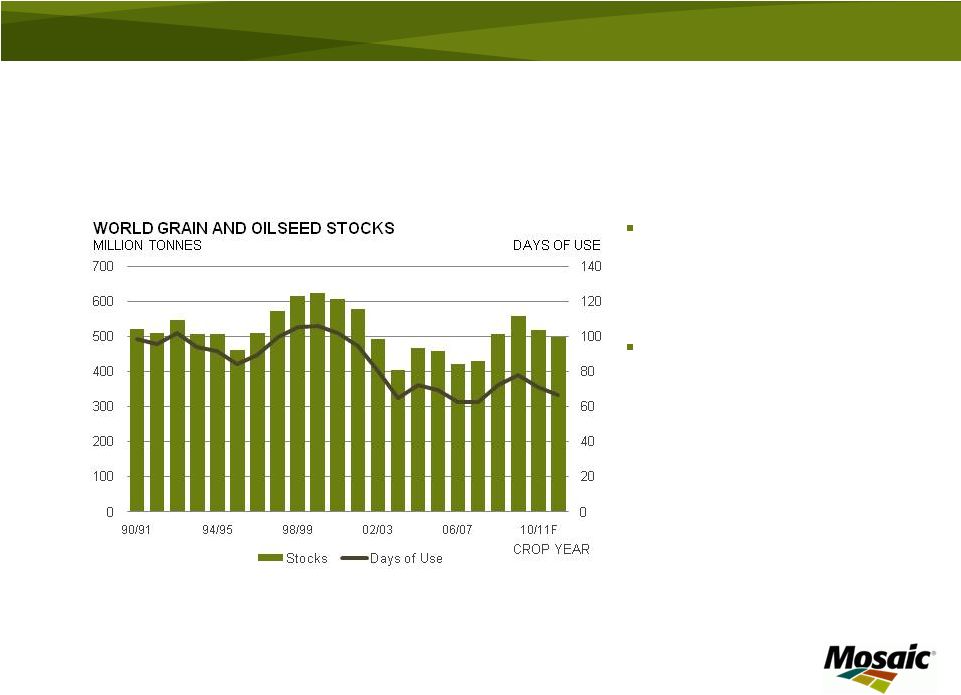 Stocks Remain at Low Levels
7
World requires record
yields and harvested area
to maintain stocks at
secure levels
Crop nutrient needed to
deliver required yields
Source: USDA |
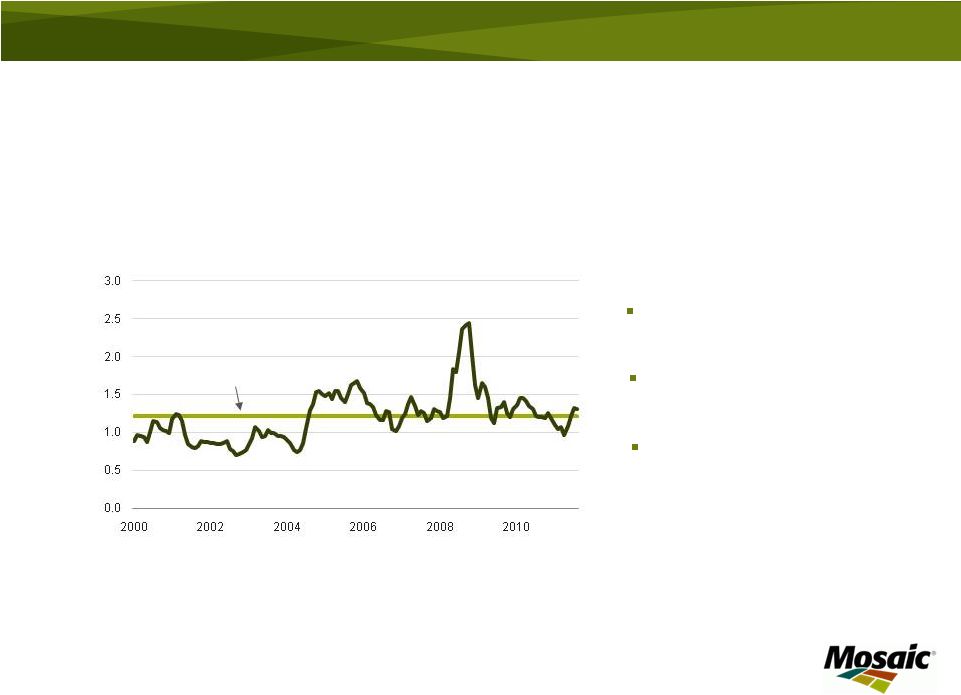 Crop Nutrients Very Affordable
8
Crop nutrients provide
farmers an excellent return
on investment:
Crop Nutrient Price Index: NPK weighting based on US nutrient use from
2005/06 thru 2007/08, indexed to average prices in 2000 = 100
Crop Price Index: Crop price weighting based on Corn/Wheat/Soybean US acreage
in 2007, indexed to average prices in 2000 = 100
Source: Mosaic
Fertilizer use less attractive
Fertilizer use more attractive
Average
Crop prices comfortable
relative to historical prices
Input costs well below
their highs
China, Brazil and India
farm economics at, or
near, record levels
CROP NUTRIENT AFFORDABILITY IN THE U.S CROP NUTRIENT
PRICE INDEX/CROP PRICE INDEX
CALENDAR YEAR |
 Record Phosphate and Potash Demand
Positive P&K demand prospects underpinned by high agricultural commodity
prices and outstanding farm economics worldwide
Producers running hard to keep up, inventories expected to remain lean
Expect 2011 global processed phosphate shipments of 60 to 62 million tonnes
Expect 2011 global MOP shipments of 55 to 58 million tonnes
9
Source: Fertecon and Mosaic
(1) February 2011 Fertecon growth estimates through 2020
0
10
20
30
40
50
60
70
80
90
00
01
02
03
04
05
06
07
08
09
10E
11F
20F
CALENDAR YEAR
WORLD PROCESSED PHOSPHATE
SHIPMENTS
MILLION TONNES
0
10
20
30
40
50
60
70
80
00
01
02
03
04
05
06
07
08
09
10E
11F
20F
CALENDAR YEAR
WORLD MOP SHIPMENTS
MILLION TONNES |
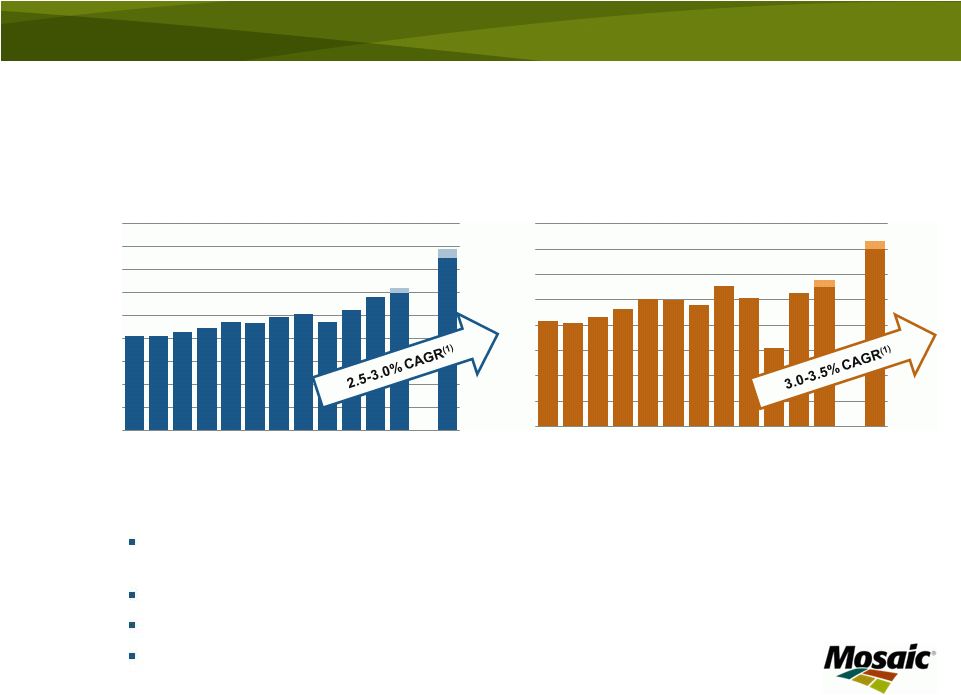
 New Capacity Required
Significant capacity expected to be required to meet growing demand
for crop nutrients
Key supply drivers suggest capacity constraints
Large capital requirements
Long lead time for new capacity
Operating rates high
Limited global rock reserves
10 |
 High Operating Rates Required to
Balance Supply and Demand
Operating rates expected to remain at high levels to meet projected
demand growth, with both brownfield and greenfield capacity added
11
Source: Fertecon demand assumptions, Mosaic estimates of
capacity additions of 11 million tonnes of phosphoric acid in
Middle East, North Africa, China and Latin America based on
announced expansion plans, including: Ma’aden on line in
2011, doubling in 2017.
Source: Fertecon demand assumptions, Mosaic estimates of
capacity additions of 23 million tonnes, with 17 million tonnes
from announced brownfield expansions and the remainder
from greenfield expansions. Does not include BHP’s Jansen
greenfield mine.
50%
60%
70%
80%
90%
100%
1995
2000
2005
2010
2015F
2020F
GLOBAL P2O5 OPERATING RATE
50%
60%
70%
80%
90%
100%
1995
2000
2005
2010
2015F
2020F
GLOBAL MOP OPERATING RATE
Projected
Projected
Actual
Actual |
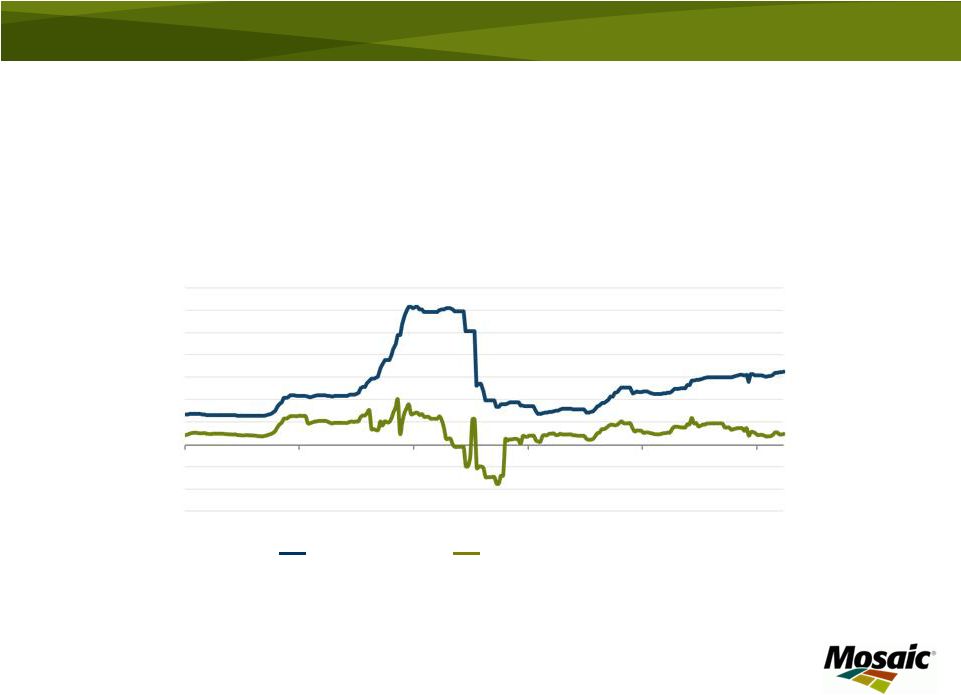 DAP Prices Impacted by Raw Material
Input Costs
12
Slide
depicts
margin
after
raw
material
costs
for
non
integrated
producers
RAW
MATERIAL
COST
IN
ONE
TONNE
OF
DAP
$ PER TONNE
-600
-400
-200
0
200
400
600
800
1,000
1,200
1,400
May 06
May 07
May 08
May 09
May 10
May 11
DAP Export Price
Margin After Raw Material Cost
Source: Green Markets
Margin after raw material cost = price of 1 tonne of DAP, less cost for input prices of approximately
1.7 tonnes phosphate rock, .44 tonnes sulfur and .23 tonnes ammonia
|
 Significant Cost Advantage for Integrated
Producers
13
Source: Fertecon and Mosaic
Note: This analysis assumes 68% BPL rock and a 92% recovery rate.
Prices as reported by Fertecon. Central Florida producers integrated
in rock, partially in ammonia. •
Approximately one-third of industry production is by non-integrated
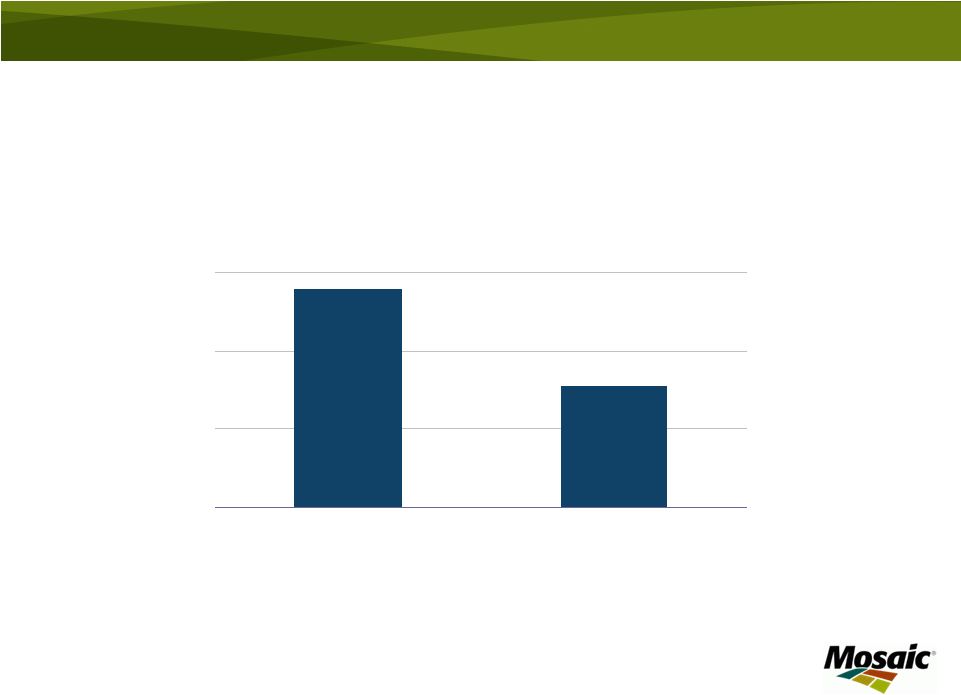
producers ESTIMATED RAW MATERIAL COSTS
$ PER TONNE DAP
0
200
400
600
Typical Producer in India
(Non Integrated)
Typical Producer in Central Florida
(Integrated) |
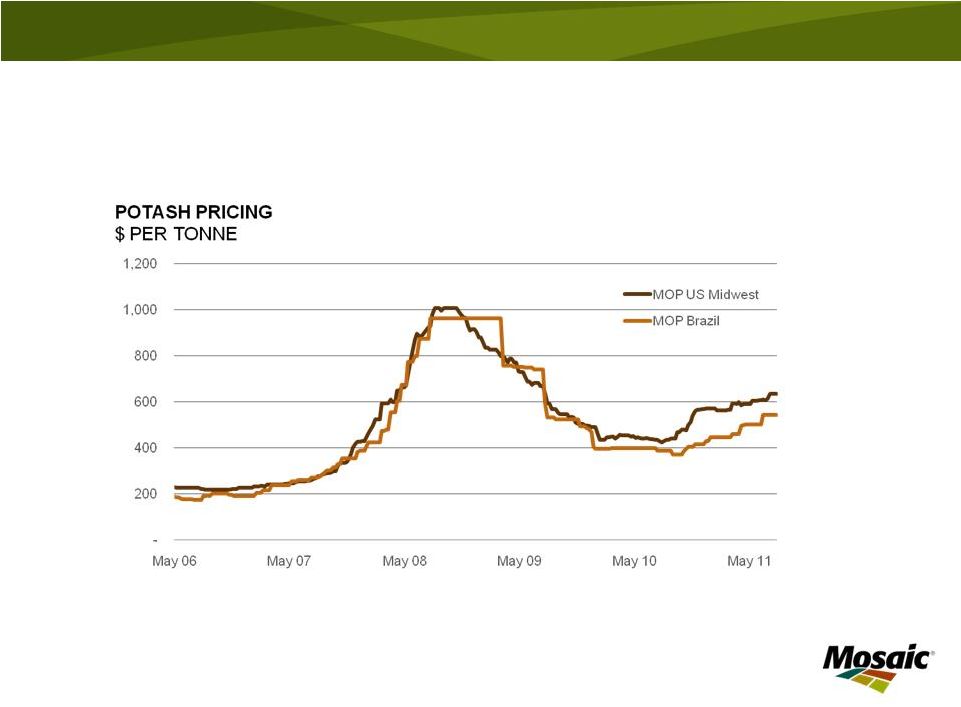 Potash Prices Strengthening
14
Source: Green Markets, ICIS |
 Strategic and Business Overview
15
As a leader in crop nutrients, Mosaic is positioned to
capitalize on strong industry fundamentals and grow
shareholder value |
 Strategic Overview
As a global leader in crop nutrients, Mosaic
is positioned to benefit from attractive long-
term agricultural fundamentals:
Potash –
grow cash flow by increasing
volume
Phosphates –
grow cash flow by
optimizing return on invested capital
Leverage global distribution assets to
enhance production efficiency
Balanced product portfolio
16 |
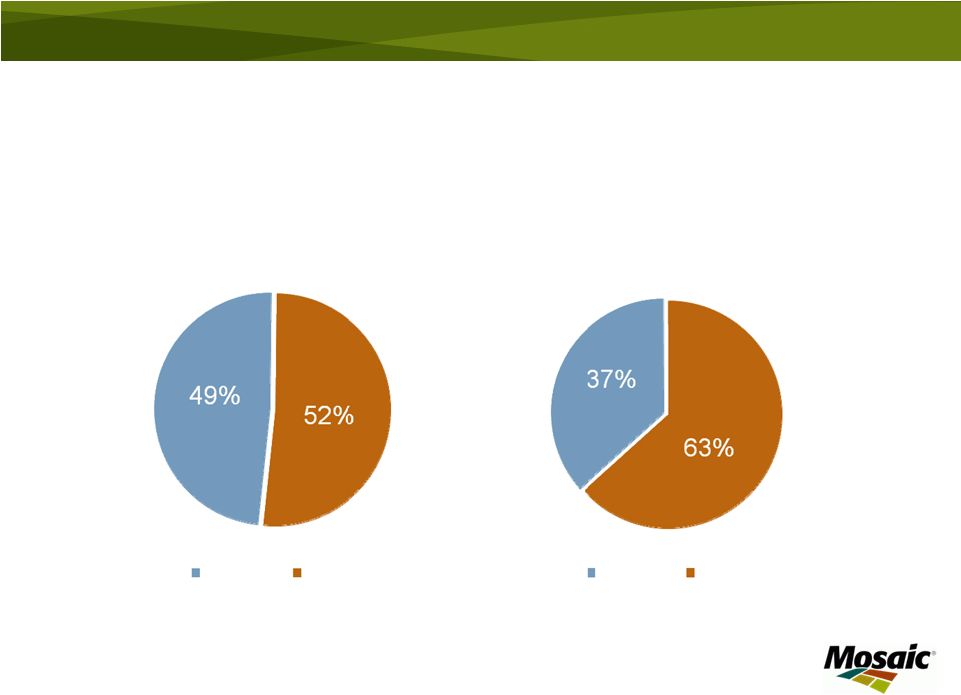 Changing Business Mix Expected to
Enhance Already Strong Returns
17
* Phosphates: FY11 processed phosphate operational capacity, assumed
to stay constant in the future.
Potash:
FY11
peaking
capacity,
assumed
to
add
4.9
million
tonnes
from
expansions
and
1.3
million
tonnes
from
reversion
of
the
Esterhazy
tolling
agreement
Current Business Mix
(FY 2011 capacity*)
Future Business Mix
(projected capacity*)
Phosphate
Phosphate
Potash
Potash |
 A
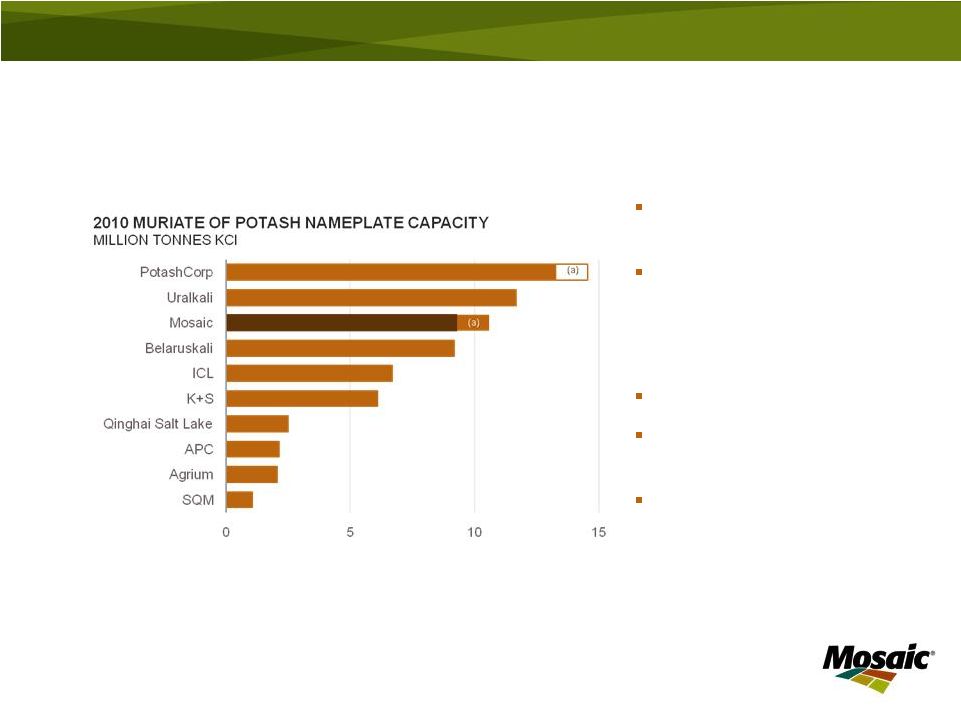
Leading Global Potash Producer 18
World MOP nameplate capacity
approximates 70 million tonnes
Mosaic FY11 MOP production
share
–
12% Global
–
38% North America
Global scale
Growing volume through
brownfield expansions
Top 10 producers represent over
90% of industry production
(a)
Reflects
capacity
related
to
Esterhazy
tolling
agreement
between
Mosaic
and PotashCorp in which up to 1.3 million tonnes will revert to Mosaic at
the expiration of the agreement
Source: IFA, Fertecon, company reports and Mosaic
|
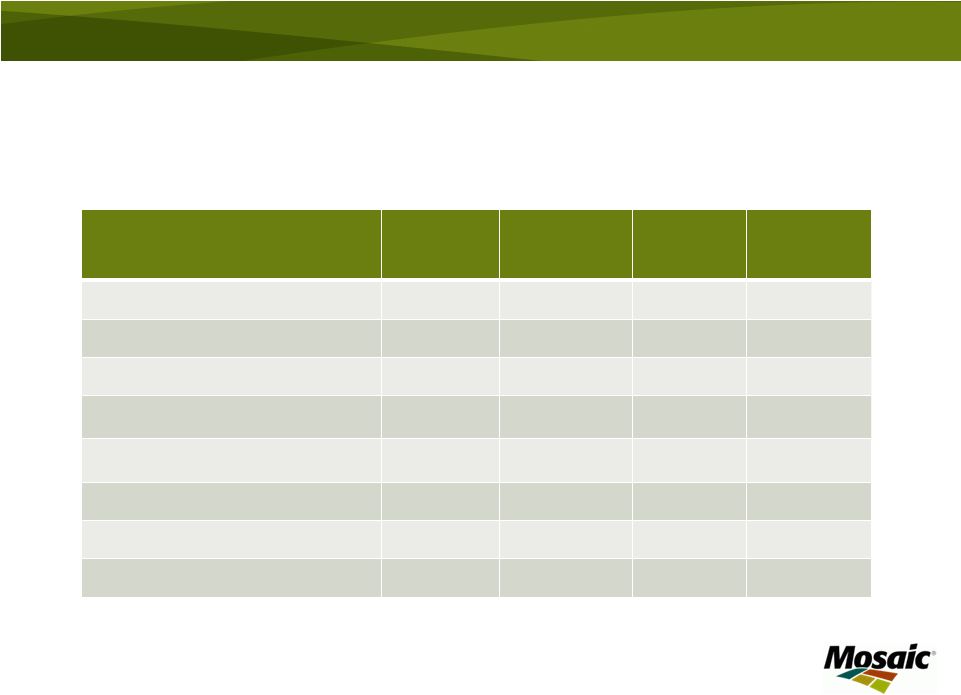
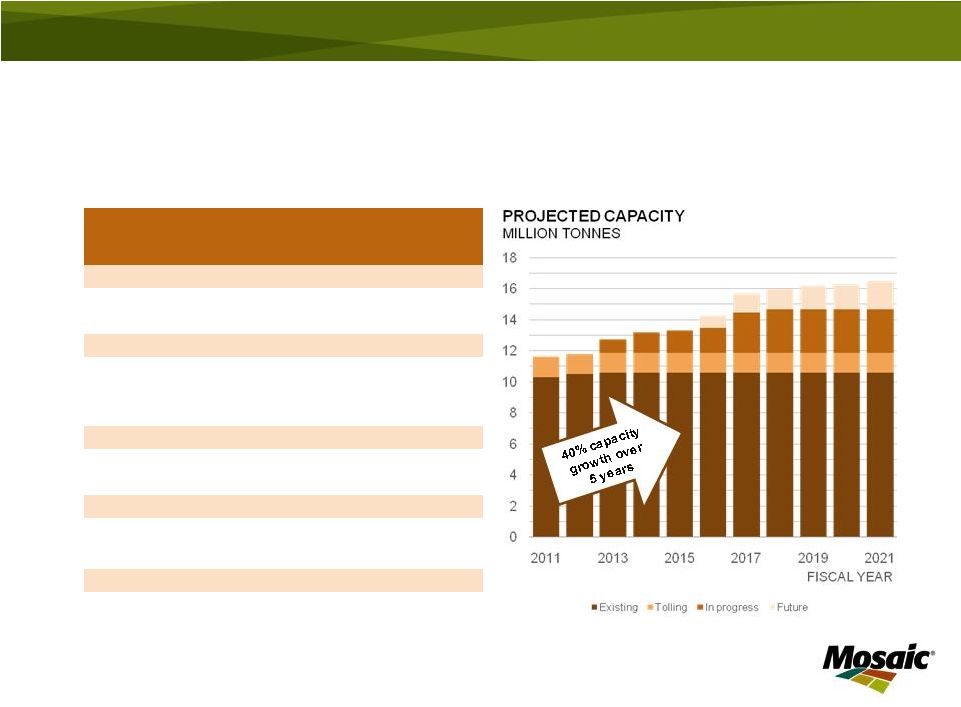 Potash –
Grow Cash Flow Through
Increased Volume
19
PROJECTED
INVESTMENT
($ IN BILLIONS)
PEAKING
CAPACITY
(MILLION TONNES)
ESTIMATED
CONSTRUCTION
COMPLETION
(FISCAL YEAR)
CONSTRUCTION COMPLETE
Colonsay
0.0
0.2
Esterhazy
0.0
0.1
CONSTRUCTION IN PROCESS
Belle Plaine
0.5
0.6
2012
Colonsay
0.7
0.5
2013
Esterhazy
2.0
1.7
2012-17
FUTURE
Belle Plaine
1.3
2016-19
Colonsay
0.5
2016
4.9
Tolling agreement
1.3
Capacity at May 31, 2011
10.3
16.5
Note:
The
projected
annual
capacity
includes
up
to
an
approximate
1.3
million
tonnes,
under
a
tolling
agreement
with
PotashCorp,
at
our
Esterhazy, Saskatchewan potash mine that reverts to us when the tolling agreement
expires. We have notified PotashCorp that our obligation to produce
additional product under the contract has expired. PotashCorp disputes our determination of the expiration date. |
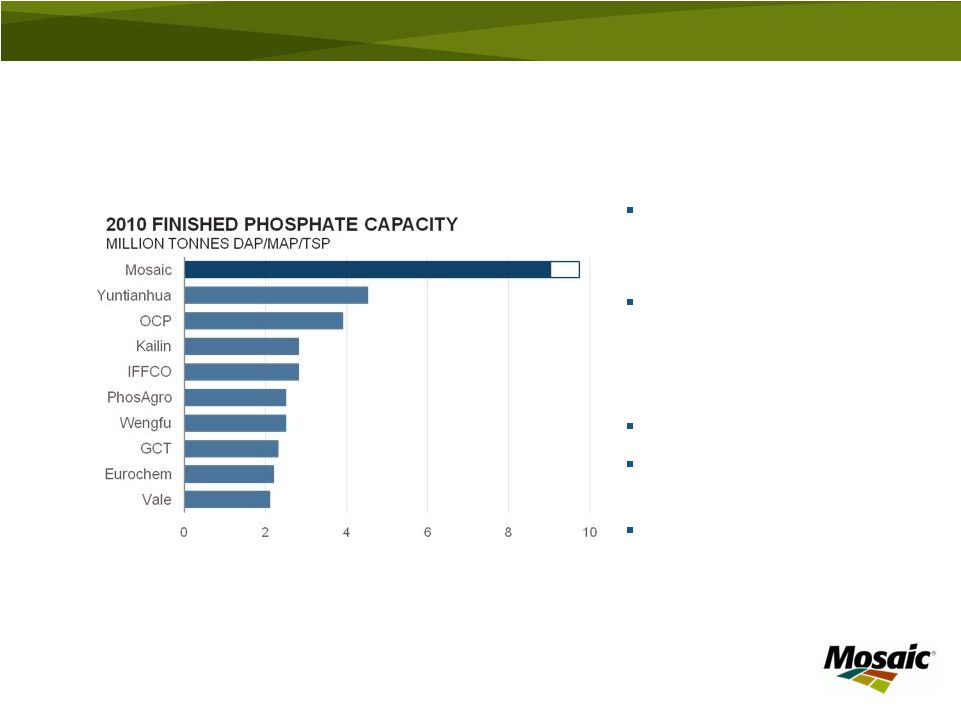 World’s Largest Integrated Phosphate Producer
World capacity
approximates 80 million
tonnes (DAP/MAP/TSP)
Mosaic FY11 phosphate
production share
–
13% Global
–
57% North America
Vertically integrated
Large scale of mines and
plants
Geographic advantages
(a)
Feed phosphate production capacity
This chart does not include Ma’aden estimated capacity that, when completed,
will Source: IFA, Fertecon, company reports and Mosaic
20
(a)
World capacity
approximates 80 million
tonnes (DAP/MAP/TSP)
Mosaic FY11 phosphate
production share
–
13% Global
–
57% North America
Vertically integrated
Large scale of mines and
plants
Geographic advantages
approximate three million tonnes per year |
 Phosphates –
Grow Cash
Flow by Optimizing ROIC
21
Grow innovative, high value products
Leverage scale and location
Low cost producer
Cost advantaged sulfur, competitive ammonia
Procurement leverage
Extend phosphate reserves
(incl. investment in Miski Mayo)
Operational excellence
Maintenance practices
Energy use and co-generation capacity
Improve coordination of sales and operations
planning |
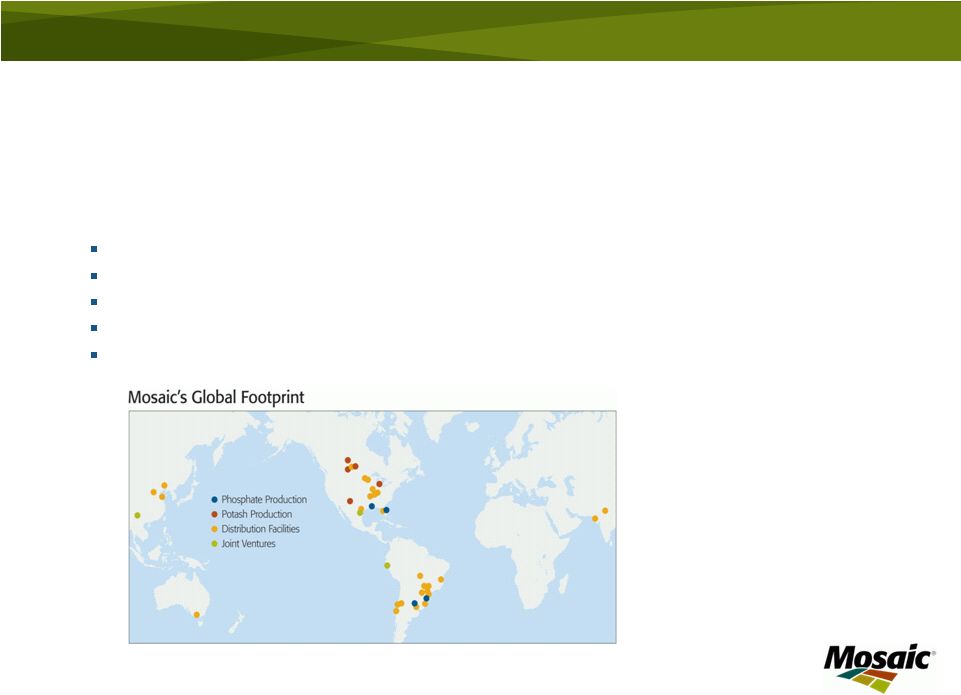 A
Global Presence 22
Global distribution capabilities with local presence provides additional
flexibility to maximize cash flow generation:
Ship product to approximately 40 countries
Balance seasonal demand to improve operating efficiency
Increase ability to effectively position product and improve logistics
efficiencies Gather on the ground intelligence to improve decision
making Work with Canpotex and PhosChem export associations
|
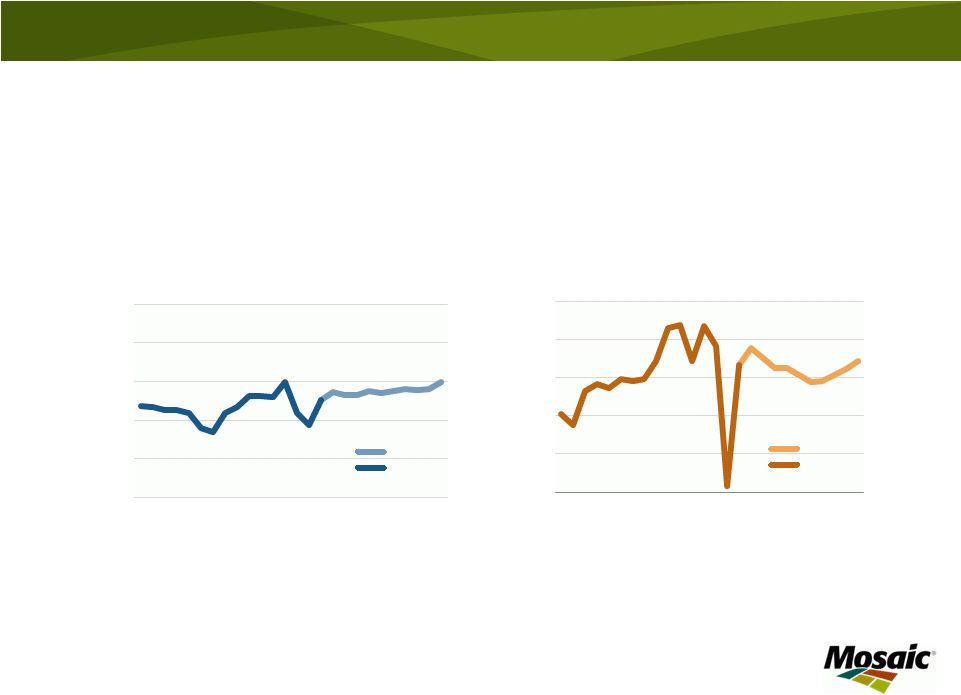
 Financial Performance
Substantially improved profitability, a strong balance
sheet and significant financial flexibility allow investments
to capitalize on opportunities across the cycle and
generate shareholder value |
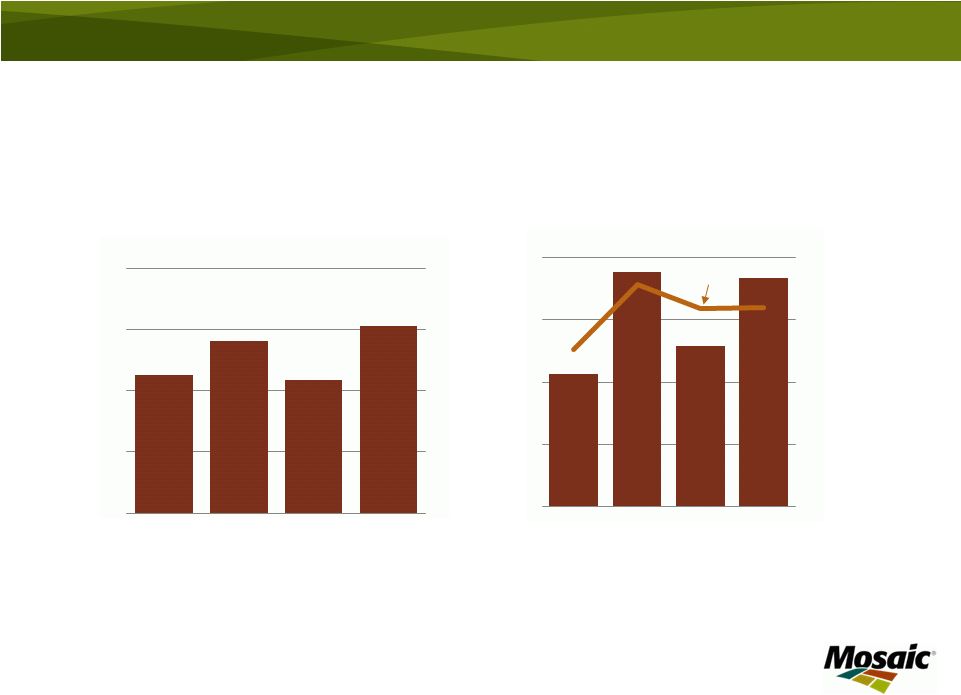 Potash Sales and Gross Margin
24
Fiscal year end: May 31
0
1
2
3
4
FY08
FY09
FY10
FY11
SEGMENT SALES
$ IN BILLIONS
0%
15%
30%
45%
60%
0
400
800
1,200
1,600
FY08
FY09
FY10
FY11
SEGMENT GROSS MARGIN
$ IN MILLIONS
GROSS
MARGIN % |
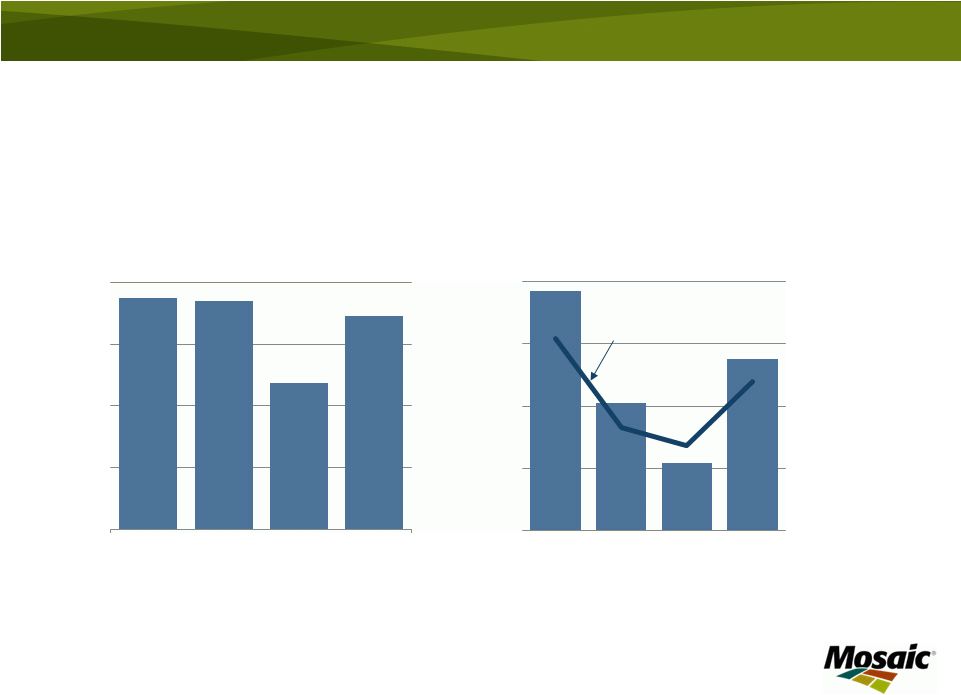 Phosphate Sales and
Gross Margin 25
Fiscal year end: May 31
0
2
4
6
8
FY08
FY09
FY10
FY11
FY08
FY09
FY10
FY11
0
600
1,200
1,800
2,400
GROSS
MARGIN %
40%
30%
20%
10%
0%
SEGMENT SALES
$ IN BILLIONS
SEGMENT GROSS MARGIN
$ IN BILLIONS |
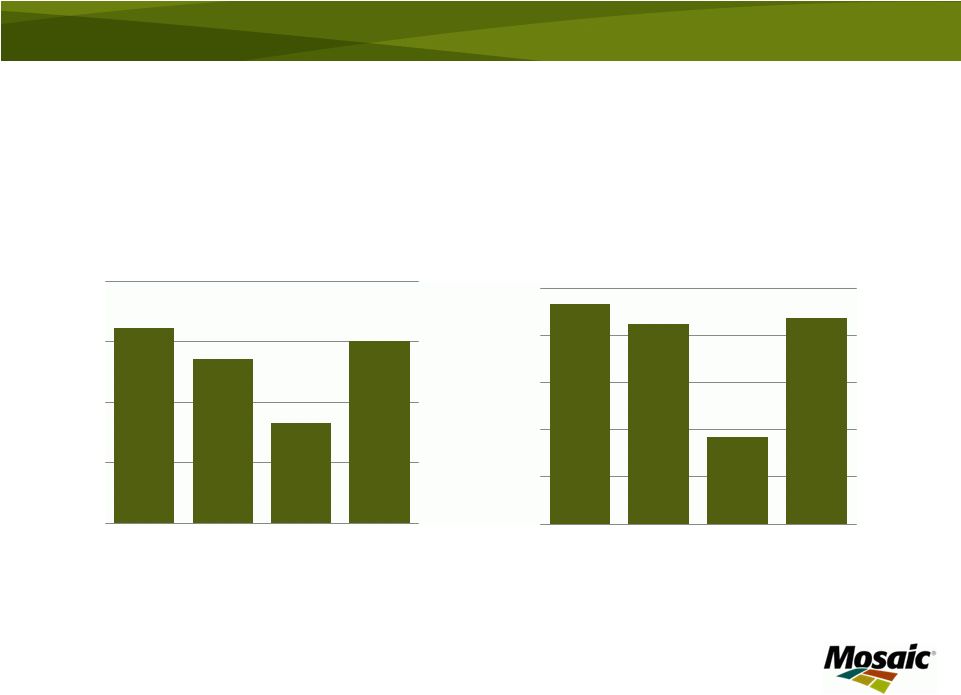 EBITDA and Earnings Per Share
26
Fiscal year end: May 31
* Excludes gain on sale from Saskferco and Fosfertil S.A. See Appendix
1 for reconciliation of Adusted EBITDA and Appendix 4 for reconciliation of
EPS Excluding gain on sale from Saskferco and Fosfertil S.A.
0
1
2
3
4
FY08
FY09
FY10
FY11
ADJUSTED EBITDA
*
$ IN BILLIONS
0
1
2
3
4
5
FY08
FY09
FY10
FY11
ADJUSTED EARNINGS PER SHARE*
$ |
 Investing for Growth and Returns
27
Fiscal FY12 Capex
guidance $1.6 to $1.9
billion
Potash expansion project
expenditures continuing
at high level
Increase in opportunity
investments to improve
returns on invested
capital
Fiscal year end: May 31
2007
2008
2009
2010
2011
2012F
CAPITAL EXPENDITURES
$ IN BILLIONS
Sustaining
Opportunity
Potash Expansion
FISCAL YEAR
0.0
0.5
1.0
1.5
2.0 |
 Financial Strength & Flexibility
High Cash and Low Debt
Financial Targets
•
$3.9 billion in cash and cash equivalents
•
$2.4 billion in cash from operations in
fiscal 2011
•
$0.8 billion in long-term debt
•
Maintain $1.5 billion in liquidity
•
Maintain “BBB”
rating, Moody’s criteria
(a)
:
–
Debt
to
EBITDA
of
2.25
to
3
times
–
Coverage ratio of 5 to 10 times
–
Viewed over the cycle
Investment Priorities
Return Capital to Shareholders
•
Maintain financial targets
•
Invest in organic opportunities
•
Invest in strategic opportunities
•
Return capital to shareholders
•
Regular dividend appropriate for cyclical
industry
•
Share repurchases over special
dividends
•
Near term constraints
28
Disciplined capital allocation drives substantial value in cyclical, capital
intense businesses, like crop nutrients.
(a) Moody’s Global Chemical Industry Rating Methodology, 2009
|
 Positioned to Create Value
As the leading producer of phosphate and potash crop nutrients, Mosaic is well
positioned to create value:
High quality assets
Industry leading facilities
Global marketing and distribution
Differentiated products
Excellence in execution
Potash expansions
Operational excellence
Efficient capital allocation
Strong balance sheet and cash position
Investing to drive shareholder value
29
Mosaic: positioned to create long-term
shareholder value |
 Thank you |
 Appendix |
 Appendix 1: EBITDA Reconciliation
32
$ IN MILLIONS
(1)
Gain on sale of our interest in Saskferco
(2)
Gain on the sale of our interest in Fosfertil S.A.
FY2008
FY2009
FY2010
FY2011
Net earnings
$2,082.8
$2,350.2
$827.1
$2,514.6
Interest expense, net
90.5
43.3
49.6
5.1
Income tax expense
714.9
649.3
347.3
752.8
Depreciation, depletion & amortization
358.1
360.5
445.0
447.4
Amortization of out-of-market contracts
-19.4
-17.2
-12.6
-14.7
EBITDA
3,226.9
3,385.7
1,656.4
3,705.2
Gain on sale
673.4
(1)
685.6
(2)
Adjusted EBITDA
$3,226.9
$2,712.3
$1,656.4
$3,019.6 |
 Appendix 2: Return on Invested Capital
33
FY 2010
FY 2011
Short term debt
$83.1
$23.6
Current maturity of long-term debt
15.2
48.0
Long-term debt, less current maturities
1,245.6
761.3
Total equity
8,748.4
11,661.9
Total capitalization
10,092.3
12,494.8
Average capitalization
$11,293.6
Net income
$2,514.6
Return on invested capital
22.3%
$ IN MILLIONS |
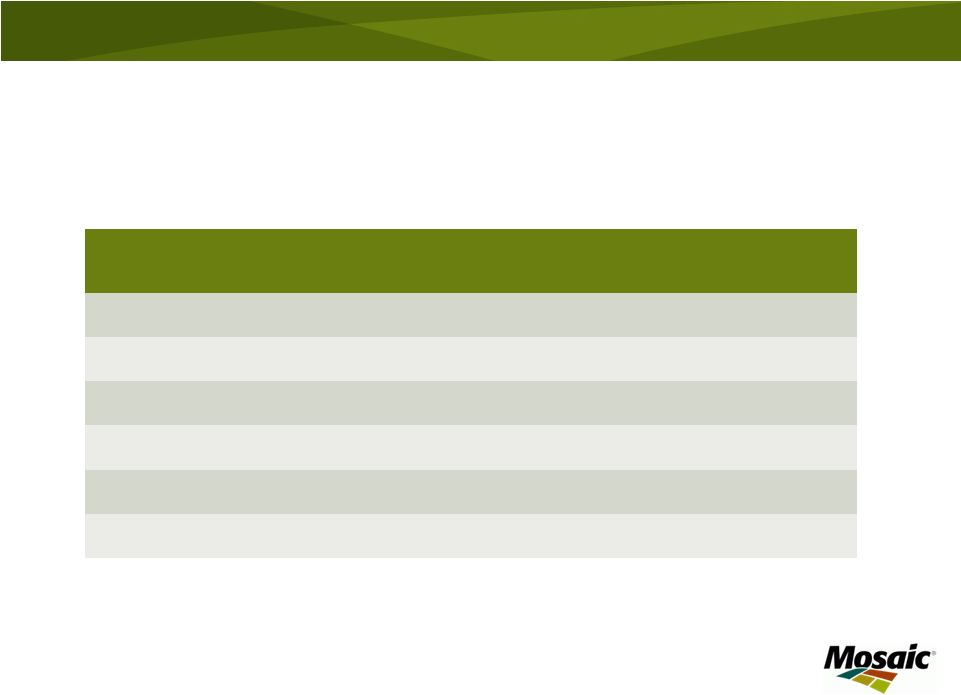
 Appendix 3: Orderly Distribution of
Cargill Shares
34
Formation Offerings
Post –
Formation Offerings
Initial formation offering of approximately 115 million
shares on May 25, 2011
42 million shares from Charitable Trusts remain to be
sold within 15 months after closing
Possible disposition:
•
S&P inclusion offering
•
Second Formation Offering within 6-9 months
•
Mosaic could buy shares from the Trusts
Beginning 2 years from closing, 1/3 shares remaining
after formation offerings held by Charitable Trusts and
other Cargill shareholders become eligible to be
distributed annually
Closing
6-15 months
2 –
2.5 years
3 –
3.5 years
4 –
4.5 years
Initial
Formation
Offering
Additional Formation Offerings
and/or share repurchases
Released share
offering
Released
share offering
Released share
offering
115 million
shares
42 million shares
129 million shares |
 Appendix 4: EPS Reconciliation
35
(1)
Gain on sale of our interest in Saskferco
(2)
Gain on sale of our interest in Fosfertil S.A.
FY2008
FY2009
FY2010
FY2011
EPS
$4.67
$5.27
$1.85
$5.62
Gain on sales
1.03
(1)
1.25
(2)
Adjusted EPS
$4.67
$4.24
$1.85
$4.37 |
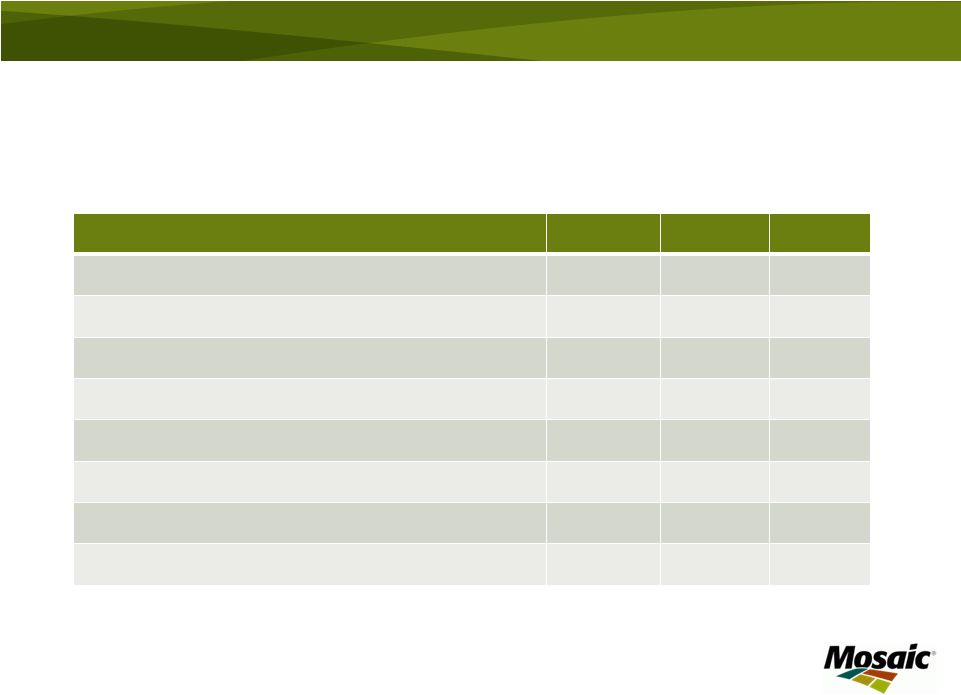
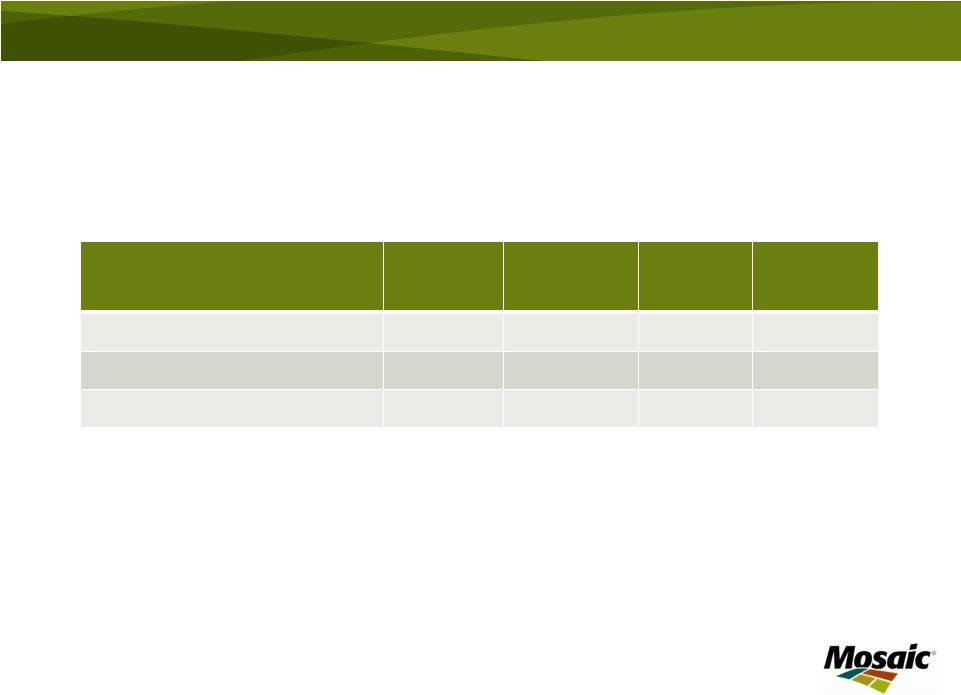
 Appendix 5: Earnings Sensitivity to Key
Drivers
(a)
(a)
These factors do not change in isolation; actual results could vary from the above
estimates 36
2011 Actual
Change
Estimated Change in
Pre-Tax Earnings
($ in millions)
Estimated
Change in
Annual EPS
MOP Price ($/tonne)
$359
$50
$368
$0.59
Potash Volume (000 tonnes)
7.5
500
$157
$0.25
DAP Price ($/tonne)
$491
$50
$412
$0.66
Phosphates Volume (000 tonnes)
12.0
500
$92
$0.15
Sulfur ($/lt)
$162
$25
$173
$0.28
Ammonia ($/tonne)
$407
$25
$77
$0.12 |