Attached files
| file | filename |
|---|---|
| 8-K - MEADOWBROOK INSURANCE GROUP INC 8-K 8-9-2011 - MEADOWBROOK INSURANCE GROUP INC | form8k.htm |
| EX-99.1 - EXHIBIT 99.1 - MEADOWBROOK INSURANCE GROUP INC | ex99_1.htm |
Exhibit 99.2

Investor Supplement
Second Quarter Update - 2011

2
Forward-Looking Statements
Certain statements made by Meadowbrook Insurance Group, Inc. in this
presentation may constitute forward-looking statements including, but not limited
to, those statements that include the words "believes," "expects," "anticipates,"
"estimates," or similar expressions. Please refer to the Company's most recent
10-K, 10-Q, and other Securities and Exchange Commission filings for more
information on risk factors. Actual results could differ materially. These forward-
looking statements involve risks and uncertainties including, but not limited to the
following: the frequency and severity of claims; uncertainties inherent in reserve
estimates; catastrophic events; a change in the demand for, pricing of,
availability or collectability of reinsurance; increased rate pressure on premiums;
obtainment of certain rate increases in current market conditions; investment
rate of return; changes in and adherence to insurance regulation; actions taken
by regulators, rating agencies or lenders; obtainment of certain processing
efficiencies; changing rates of inflation; and general economic conditions.
Meadowbrook is not under any obligation to (and expressly disclaims any such
obligation to) update or alter its forward-looking statements whether as a result
of new information, future events or otherwise.
3
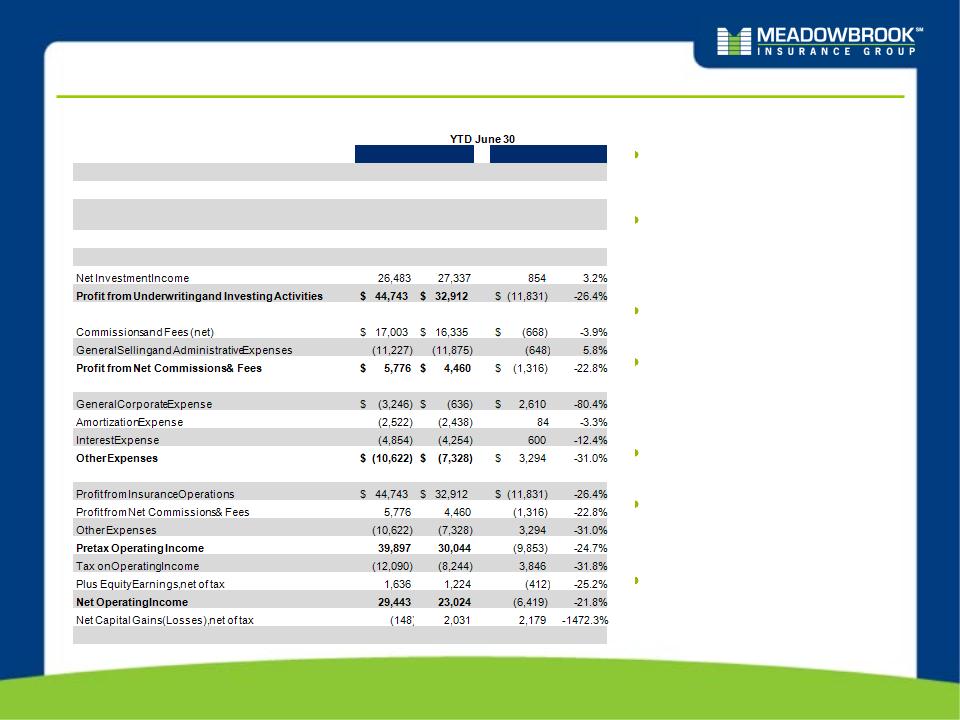
Six Months Ended 2011 vs. 2010 Comparison
Underwriting and Investing
Activities
Activities
Top line earned premium growth
driven primarily by growth within our
existing programs and new business
from recent years.
driven primarily by growth within our
existing programs and new business
from recent years.
Excluding prior year development,
profit from underwriting activities has
increased meaningfully year over
year.
profit from underwriting activities has
increased meaningfully year over
year.
Net Commissions & Fees
Decline in fee and commission
revenue is driven by conversion of
USSU to our paper.
revenue is driven by conversion of
USSU to our paper.
The increase in GS&A relates
primarily to investments in sales
initiatives to stimulate revenue growth
in net commissions and fees.
primarily to investments in sales
initiatives to stimulate revenue growth
in net commissions and fees.
Other Expenses
General Corporate expenses are
down as a result of a reduction in the
variable compensation accrual.
down as a result of a reduction in the
variable compensation accrual.
Interest expense is down due to a
decrease in the average outstanding
debt (term loan).
decrease in the average outstanding
debt (term loan).
Taxes
Taxes are lower because tax exempt
interest accounts for a larger portion
of pre-tax income in 2011. The 2011
YTD effective tax rate on operating
income (adjusted for unusual storm
losses) is 27.7%.
interest accounts for a larger portion
of pre-tax income in 2011. The 2011
YTD effective tax rate on operating
income (adjusted for unusual storm
losses) is 27.7%.
|
|
2010
|
2011
|
|
$ Change
|
% Change
|
|
Net Earned Premium
|
$ 314,201
|
$ 352,128
|
|
$ 37,927
|
12.1%
|
|
Net Losses & Loss Adjustment Expenses-AY
|
(203,161)
|
(229,032)
|
|
(25,871)
|
12.7%
|
|
Favorable Development on Prior Accident Year Reserves
|
16,469
|
2,367
|
|
(14,102)
|
-85.6%
|
|
Policy Acquisition and Other Underwriting Expenses
|
(109,249)
|
(119,888)
|
|
(10,639)
|
9.7%
|
|
Profit from Underwriting Activities
|
$ 18,260
|
$ 5,575
|
|
$ (12,685)
|
-69.5%
|
|
|
|||||
|
|
|||||
|
|
|
|
|
|
|
|
|
|||||
|
|
|||||
|
|
|||||
|
|
|
|
|
|
|
|
|
|||||
|
|
|||||
|
|
|||||
|
|
|||||
|
|
|
|
|
|
|
|
|
|||||
|
|
|||||
|
|
|||||
|
|
|||||
|
|
|||||
|
|
|||||
|
|
|||||
|
|
|||||
|
Net Income
|
$ 29,295
|
$ 25,055
|
|
$ (4,240)
|
-14.5%
|

4
Six Months Ended 2011 vs. 2010 Combined Ratio Analysis
Loss and LAE Ratio
The 2011 Loss and LAE ratio includes 0.6 points of
favorable development compared to 5.3 points of
favorable development in 2010.
favorable development compared to 5.3 points of
favorable development in 2010.
The 2011 Loss and LAE ratio includes 1.6 points of
unusual storm losses compared to 0.6 points in
2010.
unusual storm losses compared to 0.6 points in
2010.
Expense Ratio
The 2011 expense ratio decreased 0.8 points in
comparison to the same 2010 period. The
decrease reflects a reduction in the variable
compensation accrual.
comparison to the same 2010 period. The
decrease reflects a reduction in the variable
compensation accrual.
*Unusual Storm Losses
The 6/30 YTD unusual storm losses (net of tax) for
2010 and 2011 are $1.3M and $3.6M respectively.
2010 and 2011 are $1.3M and $3.6M respectively.
The 6/30 QTD unusual storm losses (net of tax) for
2010 and 2011 are $1.3M and $4.1M respectively.
2010 and 2011 are $1.3M and $4.1M respectively.
|
|
|
|
|
|
|
|
|
|
|
|
|
|
|
|
|
|
|
|
|
|
|
|
|
|
|
|
|
|
|
|
|
|
|
|
|
|
|
|

2011 Return on Average Equity ROAE Contribution Estimates Ex Unusual Storm Losses With Unusual Storm Losses Combined Ratio 96.5% 97.4% Underwriting Margin 3.5% 2.6% x Underwriting Leverage (NEP / Equity) 1.28 1.28 ROAE from Underwriting 4.4% 3.4% NII / Avg. Cash and Inv. Assets 4.0% 4.0% x Investment Leverage (Avg Cash & Inv. Assets / Equity) 2.4 2.4 ROAE from Investments 9.6% 9.6% ROAE from Commission and Fee 1.5% 1.5% Amortization of intangible assets contribution to ROAE -0.8% -0.8% Holding Company contribution to ROAE -1.7% -1.7% Pretax ROAE 13.0% 12.0% Impact of taxes -3.5% -3.2% Equity earnings 0.3% 0.3% Realized Gains and Losses 0.3% 0.3% After Tax ROAE 10.1% 9.4% ROAE Excluding Unrealized Gains 10.8% 10.0%
ROAE Components 2011 Projected ROAE Including and Excluding Unusual Storm Losses

6
ROAE & Combined Ratio Illustration
We strive to deliver predictable earnings across the market cycle with a return on average
equity target of 10% - 17%.
equity target of 10% - 17%.
2010 - ROAE of 11.4%, Combined Ratio of 95.0% and Investment Yield of 4.2%
2011 - Projected ROAE of 9.4%, Combined Ratio of 97.4% and Investment Yield of 4.2%
2010A

7
Investment Portfolio Appendix

We Maintain a High Quality, Low Risk Investment Portfolio
We maintain a conservative investment portfolio
Portfolio Allocation and Quality
Low equity risk exposure
– 98% fixed income and
cash
cash
– 2% equity
High credit quality
– 99% of bonds are
investment grade
investment grade
– Average S&P rating of
AA / Moody’s of Aa3
AA / Moody’s of Aa3
Interest Rate Risk Protection
– Hold to Maturity
– High Credit Quality =
Low Historical
Impairments
Low Historical
Impairments
– Access to additional
capital if needed
capital if needed
NOTE: Data above as of June 30, 2011
|
$’s in (000’s)
|
%
Allocation 6/30/2011 |
Fair Value
|
Gross
Unrealized Gain Position |
Avg.
Moody's |
Avg.
S&P |
|
Fixed Income
|
|
|
|
|
|
|
US Government and Agencies
|
2%
|
$ 24,696
|
$ 1,373
|
Aaa
|
AAA
|
|
Corporate
|
34%
|
$ 456,077
|
$ 23,993
|
A2
|
A
|
|
Mortgage and Asset Backed
|
18%
|
$ 243,220
|
$ 13,725
|
Aaa
|
AAA
|
|
Municipal
|
43%
|
$ 571,583
|
$ 29,643
|
Aa2
|
AA+
|
|
Preferred Stock Debt
|
0%
|
$ 2,416
|
$ 492
|
Ba2
|
BB
|
|
Total Fixed Income
|
98%
|
$1,297,993
|
$ 69,226
|
|
|
|
Equities
|
|
|
|
|
|
|
Preferred Stock
|
1%
|
$ 13,881
|
$ 2,509
|
|
|
|
Mutual Funds
|
1%
|
$ 15,783
|
$ 1,020
|
|
|
|
Total Equities
|
2%
|
$ 29,664
|
$ 3,529
|
|
|

9
Municipal Bonds - June 30, 2011 Profile
Summary Profile
$571.6M market value; 43% of the
investment portfolio
investment portfolio
June 30, 2011 net unrealized gain was
$29.6M
$29.6M
Tax exempt unrealized gain $28.0M
Taxable unrealized gain $ 1.6M
Average tax equivalent yield: 5.48%
Quality Indicators & Geographic
Distribution
Distribution
Municipals vs. Entire Portfolio
|
State
|
% of Municipal Allocation
|
|
Texas
|
7.6%
|
|
New York
|
6.5%
|
|
Washington
|
6.2%
|
|
Colorado
|
3.8%
|
|
Virginia
|
3.8%
|
|
Nevada
|
3.5%
|
|
Oregon
|
3.3%
|
|
Minnesota
|
3.2%
|
|
Indiana
|
3.2%
|
|
Missouri
|
3.1%
|
|
All other
|
55.8%
|

10
Structured Securities - June 30, 2011 Profile
Summary Profile
$243.2M market value; 18% of the managed
portfolio
portfolio
June 30, 2011 unrealized gain was $13.7M
RMBS unrealized gain $11.3M
CMBS unrealized loss $ 1.3M
ABS unrealized loss $ 1.1M
Average investment yield: 5.04%
Quality Indicators
Structured vs. Entire Portfolio
Structured Profile

11
Corporate Fixed Income- June 30, 2011 Profile
Summary Profile
$456.1M market value; 34% of the investment
portfolio
portfolio
June 30, 2011 unrealized gain was $24.0M.
Average investment yield: 4.41%
Quality Indicators
Corporate vs. Entire Portfolio
Corporate Profile
|
|
Corporates
|
|
Average Quality
|
A
|
|
Investment Grade
|
98%
|
|
|
|
|
A-/A3 or Better
|
78%
|
|
AII BBB and Baa
|
20%
|
|
Not Rated
|
0%
|
|
Non Investment Grade
|
2%
|
|
Banking
|
15.1%
|
|
Healthcare/Pharmaceutical
|
13.9%
|
|
Energy
|
10.0%
|
|
Electric
|
9.6%
|
|
Technology
|
7.0%
|
|
Capital Goods
|
6.5%
|
|
Food, Beverage
|
5.1%
|
|
Chemicals
|
4.5%
|
|
Natural Gas
|
3.7%
|
|
Telecommunications
|
3.4%
|
|
All Other Sectors
|
21.2%
|

12
Government and Agency - June 30, 2011 Profile
Summary Profile
$24.7 million market value; approximately 2% of
the managed portfolio
the managed portfolio
100% rated AAA
June 30, 2011 unrealized gain was $1.4 million
Average investment yield: 3.24%
Government & Agency vs. Entire
Portfolio
Portfolio
Government vs. Agency

13
Equities - June 30, 2011 Profile
Summary Profile
$29.7million market value; 2% of the managed
portfolio
portfolio
June 30, 2011 unrealized gain was $3.5M
Preferred stock unrealized gain $2.5M
Bond mutual fund unrealized gain
$1.0M
$1.0M
Average tax equivalent yield: 8.61%
Equities vs. Entire Portfolio
Equity Mix