Attached files
| file | filename |
|---|---|
| 8-K - FORM 8-K - CAPSTEAD MORTGAGE CORP | d8k.htm |
Exhibit 99.1

About Us
Capstead is based in Dallas, Texas and is listed on the New York Stock Exchange (symbol CMO). Having been formed in 1985, we hold the distinction of being the oldest of the publicly-traded mortgage REITs.
Proven Strategy
We invest in a leveraged portfolio of residential adjustable-rate mortgage (“ARM”) securities issued and guaranteed by Fannie Mae, Freddie Mac or Ginnie Mae.
Our investment strategy differentiates us from our peers because ARM securities reset to more current interest rates within a relatively short period of time allowing for:
| • | the recovery of financing spreads diminished during periods of rising interest rates, and |
| • | smaller fluctuations in portfolio values from changes in interest rates compared to fixed-rate mortgage securities. |
Quality Assets
Agency-guaranteed residential mortgage securities are considered to have little, if any, credit risk, particularly given federal government support for Fannie Mae and Freddie Mac. These mortgage investments are highly liquid and can be financed with multiple funding providers through standard repurchase arrangements.
Conservatively Financed
We prudently leverage our portfolio to provide financial flexibility needed to successfully manage through periods of changing market conditions, and we have long-standing relationships with numerous lending counterparties. Further, our use of interest rate swap agreements helps mitigate the effects of rising short-term interest rates.
Experienced Management in a Stockholder Friendly Structure
Our management team has over 80 years of combined mortgage finance industry experience. We are self-managed with low operating costs and rely heavily on performance-based compensation. This structure greatly enhances the alignment of management interests with those of our stockholders.


Second Quarter Highlights
| • | Reported earnings of $42.5 million, or $0.48 per diluted common share. |
| • | Increased book value by $0.31 to $12.46 per common share at June 30, 2011. |
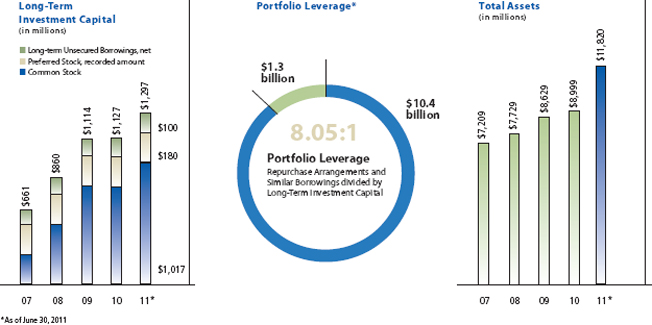
| • | Increased investment portfolio by $996 million to $11.42 billion at June 30, 2011. |
| • | Increased portfolio leverage to 8.05 times long-term investment capital at June 30, 2011. |
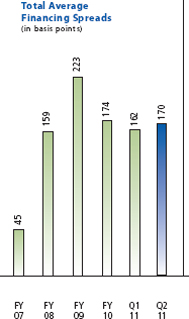
| • | Total financing spreads increased 8 basis points to average 1.70%. |
| • | Raised $83 million in new equity capital. |
Quarterly Results
| (In thousands, except per share data) | June 30, 2011 |
March 31, 2011 |
Dec. 31, 2010 |
Sept. 30, 2010 |
June 30, 2010 |
|||||||||||||||
| Interest income |
$ | 63,194 | $ | 53,254 | $ | 51,042 | $ | 40,725 | $ | 47,769 | ||||||||||
| Interest expense* |
(15,894 | ) | (14,513 | ) | (14,081 | ) | (13,282 | ) | (13,333 | ) | ||||||||||
|
|
|
|
|
|
|
|
|
|
|
|||||||||||
| Net interest margin |
47,300 | 38,741 | 36,961 | 27,443 | 34,436 | |||||||||||||||
|
|
|
|
|
|
|
|
|
|
|
|||||||||||
| Miscellaneous other revenue (expense) |
(534 | ) | (153 | ) | (109 | ) | (363 | ) | (33 | ) | ||||||||||
| Incentive compensation |
(1,487 | ) | (1,233 | ) | (1,327 | ) | (983 | ) | (1,330 | ) | ||||||||||
| Salaries and benefits |
(1,672 | ) | (1,700 | ) | (1,566 | ) | (1,425 | ) | (1,463 | ) | ||||||||||
| Other general and administrative expense |
(1,066 | ) | (963 | ) | (932 | ) | (999 | ) | (1,851 | ) | ||||||||||
|
|
|
|
|
|
|
|
|
|
|
|||||||||||
| (4,759 | ) | (4,049 | ) | (3,934 | ) | (3,770 | ) | (4,677 | ) | |||||||||||
|
|
|
|
|
|
|
|
|
|
|
|||||||||||
| Net income |
42,541 | 34,692 | 33,027 | 23,673 | 29,759 | |||||||||||||||
| Diluted earnings per common share |
0.48 | 0.41 | 0.40 | 0.27 | 0.35 | |||||||||||||||
| Common dividends per share |
0.48 | 0.41 | 0.39 | 0.26 | 0.36 | |||||||||||||||
| New equity capital |
83,453 | 60,071 | — | — | — | |||||||||||||||
| Common shares outstanding (EOQ) |
81,311 | 74,994 | 70,259 | 70,129 | 70,129 | |||||||||||||||
| * | Including $2.2 million of interest charges on unsecured borrowings for each period presented. |
| Analysts | ||||
| Firm |
Rating* | |||
| Cantor Fitzgerald |
Buy | |||
| Deutsche Bank |
Hold | |||
| FBR Capital Markets |
Outperform | |||
| JMP Securities LLC |
Buy | |||
| Keefe, Bruyette &Woods |
Outperform | |||
| Lazard Capital |
Neutral | |||
| Macquarie |
Outperform | |||
| RBC Capital Markets |
Outperform | |||
| Sandler O’Neill |
Hold | |||
| Sterne Agee |
Neutral | |||
| Stifel Nicolaus |
Buy | |||
| Wunderlich |
Buy | |||
| Ownership
|
% of
Shares Outstanding** |
|||
| Institution |
||||
| Wells Capital Management Inc. |
7.09 | |||
| BlackRock Fund Advisors |
4.41 | |||
| Vanguard Group Inc. |
3.44 | |||
| GW Capital Inc |
2.37 | |||
| Clough Capital Partners LP |
2.31 | |||
| Thornburg Investment Management Inc |
2.19 | |||
| Highland Capital Management LP |
2.04 | |||
| Jennison Associates LLC |
2.04 | |||
| State Street Global Advisors Inc. |
2.03 | |||
| Northern Trust Global Investments Ltd. |
1.87 | |||
| Common Stock Information | ||||
| NYSE Ticker: CMO |
||||
| Price as of 7/26/11: |
$ | 13.21 | ||
| 52-wk High/Low: |
$ | 13.95/$10.69 | ||
| 2Q Dividend: |
$ | 0.48 | ||
| Dividend yield: |
14.5 | % | ||
| (based on annualized 2Q dividend) |
||||
| 2Q Avg Daily Vol: |
730,303 shares | |||
| Series A/Series B | ||||
| Preferred Stock Info | ||||
| NYSE Ticker: CMOPRA / CMOPRB |
||||
| Prices as of 7/26/11: $22.64/$14.56 |
||||
| Redemption Price: $16.40 / $12.50 |
||||
| Liquidation Preference: $16.40 / $11.38 |
||||
| Conversion Ratio: 1.6520 / 0.6382 |
||||
| Annualized Dividend: $1.60 / $1.26 |
||||
| Continuous Offering Program |
||||
| When conditions warrant, we make use of an at-the-market, continuous offering program to raise new common and Series B preferred equity capital. | ||||
| * | As of July 26, 2011 |
| ** | % based on available filings as of July 25, 2011 and shares outstanding as of June 30, 2011. |
