Attached files
Exhibit 10.10
CEO Recommendation
To
Compensation Committee
for
2010 Executive Compensation Plan
Presented by: John Kispert & Carmine Renzulli
May 10, 2010
CEO
Total Compensation Package Recommendation
for
2010

| Page 2 |
High level executive compensation plan for Spansion
For CEO:
High level strategy:
Our primarily long-term corporate objective is to create superior value for our stockholders. The objective of the executive compensation program is to attract, motivate, reward and retain highly qualified executive officers who are able to achieve the corporate objective of superior value for our stockholders. The executive compensation program is designed to provide a foundation of fixed compensation (based salary and time based stock options) and a meaningful portion of performance-based compensation.
At the CEO level, there is the greatest emphasis on linking pay to performance so as to align the interest of the CEO directly with those of stockholders. Accordingly, compensation is structured so that approximately 70% of CEO compensation is performance-based depending upon Spansion’s financial results, with the remaining 30% comprising base pay and benefits.
Base Pay
Base Pay: $900,000
Incentive Compensation
The target incentive compensation percentage for the CEO in fiscal 2010 is 200% of base pay. The incentive compensation award is based on achievement of the 2010 Budgeted revenue and operating margin. See the Incentive Compensation Matrix on page 4. The 100% figure on the matrix equates to the CEO receiving 100% of his targeted 200% of base pay.
Philosophy for setting financial goals
Spansion’s philosophy for setting annual financial goals is to be aggressive. This can be seen by the matrix below. To drive home this point, in 2008 Spansion’s operating income was a loss of approximately $2.3 billion representing an operating margin of a negative 99.6%. In 2009, operating income was again a loss of approximately $240 million or an operating margin of approximately a negative 9.6%. Also, Spansion had never been profitable as a public company until the fourth quarter of 2009.
As such, to include an operating margin target of positive 13.9% is clearly a stretch. Also, the $1.2 billion in revenue will likewise represent a stretch. In Q1 2010, Spansion will be at its trough or nominal run rate after its strategic decision made in early 2008 to exit the wireless business (with the exception of a small portion of the wireless business that was retained now referred to as mobility). This trough or nominal run rate has revenue at $271 million or $1.08 billion annualized. The mix is estimated to be approximately $200 million embedded (74%) and $71 million mobility (26%). Critical to the assumptions here is the embedded business is forecasted by industry experts to be flat to negative growth. Thus a revenue plan of $1.2 billion
| Page 3 |
that incorporates increasing Q1 revenue from $271 to $328 million by Q4, a 21.0% increase, is an aggressive revenue plan.
One other key point to understand in the incentive compensation plan matrix is the scale is not linear. The result of this design is that if the CEO and his team miss the financial goals by even a slight amount ($100 million, 8.3% on revenue and/or by 1 point, 7.2% on operating margin) no bonus has been earned. Conversely, to achieve the maximum, the CEO and his team would be required to achieve both an incremental $300 million (+25%) in revenue and a 3 point (21.6%) increase in operating margin. Accomplishing this would add an incremental 52.0% or approximately $87 million increase in operating income, clearly a meaningful net benefit to stockholders. The net is a very aggressive plan with little room for error and stretch goals, that if achieved, would add significant stockholder value.
Incentive Compensation Matrix
|
|
Revenue (M$) | |||||||||||||||||||||||
| < $1,100 | $1,100 | $1,125 | $1,150 | $1,175 | $1,200 | $1,275 | $1,350 | $1,425 | $1,500 | |||||||||||||||
| < -8% | -8% | -6% | -4% | -2% | 0% | 6% | 13% | 19% | 25% | |||||||||||||||
| 16.90% | 22% | 0% | 120% | 130% | 140% | 150% | 160% | 170% | 180% | 190% | 200% | |||||||||||||
| 16.15% | 16% | 0% | 110% | 119% | 128% | 136% | 145% | 155% | 165% | 175% | 185% | |||||||||||||
| 15.40% | 11% | 0% | 100% | 108% | 115% | 123% | 130% | 140% | 150% | 160% | 170% | |||||||||||||
| 14.65% | 5% | 0% | 90% | 96% | 103% | 109% | 115% | 125% | 135% | 145% | 155% | |||||||||||||
| 13.90% | 0% | 0% | 80% | 85% | 90% | 95% | 100% | 110% | 120% | 130% | 140% | |||||||||||||
| 13.65% | -2% | 0% | 73% | 78% | 83% | 88% | 93% | 103% | 113% | 123% | 135% | |||||||||||||
| 13.40% | -4% | 0% | 65% | 70% | 75% | 80% | 85% | 95% | 105% | 115% | 130% | |||||||||||||
| 13.15% | -5% | 0% | 58% | 63% | 68% | 73% | 83% | 93% | 103% | 113% | 125% | |||||||||||||
| 12.90% | -7% | 0% | 50% | 55% | 63% | 70% | 80% | 90% | 100% | 110% | 120% | |||||||||||||
| < 12.9% | < -7% | 0% | 0% | 0% | 0% | 0% | 0% | 0% | 0% | 0% | 0% | |||||||||||||
Note: Company payout factor is capped at 200%, and revenue and operating margin are measured as follows:
| • | Revenue refers to sales generated from all Spansion’s products and services as reported in Spansion’s pro-forma P&L. Pro-forma adjustments to GAAP revenue would include: |
| • | Add back of deferred revenue lost due to fresh start accounting; and |
| • | Reduction of revenue from companies acquired during fiscal 2010. |
| • | Operating Margin is derived from Operating Income divided by Revenue (as defined above). Operating Income refers to Spansion’s earnings before interest income/expense, other income/expense, taxes and extraordinary items as reported in Spansion’s pro-forma P&L. Pro-forma adjustments to GAAP Operating Income would include: |
| • | Revenue adjustments; and |
| • | Expense adjustments indicated on next page. |
| • | Elimination of bankruptcy-related reorganization, restructuring, and any other applicable costs, including any items identified as such in the 2010 Annual Budget; |
| • | Elimination of any other fees or bonuses that are required for or upon the company’s successful emergence from Chapter 11 bankruptcy; |
| • | Adjustment for Spansion Japan or Spansion Nihon KK related payments or expenses, settlement, or other such activities |
| • | Adjustments for changes in the carrying costs of assets and depreciation levels due to fresh start accounting, including but not limited to inventory, property and equipment, and intangibles; |
| • | Adjustments for changes in the liabilities due to fresh start accounting, including but not limited to market valuation of debt, capital leases, and other such items; |
| • | Adjustment for change in expenses due to equity grants (valuation, vesting, etc); |
| • | Elimination of costs and expenses from companies acquired during fiscal 2010 and any administrative costs associated with board-approved transactions; and |
| • | Elimination of any expenses or credits recorded on unconventional line items in GAAP Operating Income due to unforeseen accounting situations (e.g., sort reserve, claims agent, gain on extinguishment of debt, ARS, etc). |
Performance-Based Restricted Stock Units
| Page 4 |
The initial grant is 431,775 performance-based restricted shares that vest and are earned as follows:
2010 target – 25.0% or 107,944 shares is target (note, these shares will be granted in May 2010 and thus will vest (but not be earned) on December 31, 2010 - a period of less than one year)
2011 target - 25.0% or 107,944 shares is target
2012 target - 25.0% or 107,944 shares is target
2013 target - 25.0% or 107,943 shares is target
The key elements of the performance-based restricted stock unit program are:
| • | Performance-based restricted stock units will vest (though not necessarily be earned) on an annual basis: 25% a year beginning with the year ending December 31, 2010. On the final trading day of January of the following year the actual number of shares earned will be awarded based on the achieved financials (“Payout Factor”) as defined in the Restricted Stock Units Earned Matrix on Page 6. The period for Company performance measurement will be the Company’s fiscal year. |
| • | Each participant will have a target number of shares for each year of the plan. This is referred to as the “Base Number of Shares”. The Base Number of shares is equal to 25% of the total number of shares awarded. For example, if the CEO was awarded 450,000 shares in year 1, his year one Base Number of Shares would be 112,500. And, if the CEO was awarded 200,000 additional shares in year 2, the CEO’s 2nd year Base Number of Shares would be 162,500 (112,500 for the year one grant plus 50,000 for the year two grant). |
| • | If the Company’s Payout Factor equals the 100% figure in the matrix, then the participant will earn 100% of the Base Number of Shares for the year. |
| • | If the Company’s Payout Factor falls below the 100% payout level in any year, then the percentage achieved will be applied to the Base Number of Shares with the additional, unearned shares deferred to the subsequent year (“Carry Forward” number of shares). |
| • | If the Company’s Payout Factor exceeds the 100% payout level in any year, then the Payout Factor will be applied to the Base Number of Shares. Any shares earned in excess of the Base Number of Shares will be funded by the carry forward shares. If an insufficient number of Carry Forward shares exists, excess shares will be accelerated from the furthest year out (i.e. if in 2010 more than 100% of the Base Number of Shares are earned, then the excess shares are accelerated from the Base Number of Shares scheduled to vest in 2013). |
| • | Upon acceleration, the Base Number of Shares from which the shares were accelerated shall be reduced by the corresponding number of accelerated shares. |
| • | No participant may earn additional shares over the initial number of shares granted; if performance in a given year warrants acceleration but the Base Number of Shares in subsequent years have already been depleted, no acceleration occurs. |
| • | Any Carry Forward shares not used to fund above target payouts are carried forward to the subsequent year. |
| • | Carry Forward shares not earned at the conclusion of the final performance period will be forfeited. |
Note: the 2010 performance-based restricted stock unit program truly has RSUs at risk. Even though on the “upside”, RSUs accelerate, no “additional” shares over the initial grant can be
| Page 5 |
earned. If the financial performance goals are not achieved in any given year, shares are pushed to the following year, but there is no guarantee that the shares push out will ever be earned, particularly since any unearned shares are forfeited after the four-year vesting period.
Performance-Based Restricted Stock Units Earned Matrix
| Revenue (M$) | ||||||||||||||||||||||||
| < $1,100 | $1,100 | $1,125 | $1,150 | $1,175 | $1,200 | $1,275 | $1,350 | $1,425 | $1,500 | |||||||||||||||
|
|
< -8% | -8% | -6% | -4% | -2% | 0% | 6% | 13% | 19% | 25% | ||||||||||||||
| 16.90% | 22% | 50% | 120% | 130% | 140% | 150% | 150% | 150% | 150% | 150% | 150% | |||||||||||||
| 16.15% | 16% | 50% | 110% | 119% | 128% | 136% | 145% | 150% | 150% | 150% | 150% | |||||||||||||
| 15.40% | 11% | 50% | 100% | 108% | 115% | 123% | 130% | 140% | 150% | 150% | 150% | |||||||||||||
| 14.65% | 5% | 50% | 90% | 96% | 103% | 109% | 115% | 125% | 135% | 145% | 150% | |||||||||||||
| 13.90% | 0% | 50% | 80% | 85% | 90% | 95% | 100% | 110% | 120% | 130% | 140% | |||||||||||||
| 13.65% | -2% | 50% | 73% | 78% | 83% | 88% | 93% | 103% | 113% | 123% | 135% | |||||||||||||
| 13.40% | -4% | 50% | 65% | 70% | 75% | 80% | 85% | 95% | 105% | 115% | 130% | |||||||||||||
| 13.15% | -5% | 50% | 58% | 63% | 68% | 73% | 83% | 93% | 103% | 113% | 125% | |||||||||||||
| 12.90% | -7% | 50% | 50% | 55% | 63% | 70% | 80% | 90% | 100% | 110% | 120% | |||||||||||||
| < 12.9% | < -7% | 50% | 50% | 50% | 50% | 50% | 50% | 50% | 50% | 50% | 50% | |||||||||||||
Stock Options
The initial grant is 802,606 stock options. The options will vest as follows: 33.3% after one year and then monthly thereafter – 3 year schedule.
The plan would be to receive a onetime cash bonus that is on top of and in addition to the incentive compensation plan outlined above that will be in the total amount of $1,736,342. This would be paid on or about November 1, 2010 and May 1, 2011 in equal installments.
| Page 6 |
Named Executive Officers (NEOs)
Total Compensation Package Recommendation
for
2010
| Page 7 |
For NEOs (other than the CEO):
High level strategy (same as CEO):
Our primarily long-term corporate objective is to create superior value for our stockholders. The objective of the executive compensation program is to attract, motivate, reward and retain highly qualified executive officers who are able to achieve the corporate objective of superior value for our stockholders. The executive compensation program is designed to provide a foundation of fixed compensation (based salary and time based restricted shares) and a significant portion of performance-based compensation.
Base Pay
EVP, CFO (Randy Furr): $440,000
EVP, Worldwide Sales (Ahmed Nawaz): $409,275
EVP, Marketing (Jim Reid): $370,000
Incentive compensation
See incentive compensation philosophy discussed in the CEO section. The philosophy here is the same.
The 2010 incentive compensation for the NEOs works as follows:
| Base Pay | X | Individual Target Bonus |
X | Company Payout Factor |
X | Individual Payout Factor |
= | Bonus Amount |
With the following definitions:
Base Pay: bonus period ending annual base pay rate
Individual Target Bonus Percentage: defined below as recommended by CEO and approved by Compensation Committee
Company Payout Factor: defined from table below which is a function of revenue and operating margin as recommended annually by the CEO and approved by the BOD/Compensation Committee
Individual Payout Factor: These are both objective and subjective factors considered based on predetermined goals and objectives established by the CEO for each NEO and approved by the Compensation Committee and can affect the calculated performance bonus by as much as 50% down or 50% up with the stipulation that the total combined bonuses of the NEOs is a zero sum (i.e. assuming the same base pay, if one NEO received 125%, one other would receive 75% to offset the addition). See Exhibit A for Spansion Corporate goals and Exhibit B for the individual goals and objectives for each NEO.
The target incentive compensation percentage for the NEOs in fiscal 2010 is as follows:
| Page 8 |
EVP, CFO (Randy Furr): 125%
EVP, Worldwide Sales (Ahmed Nawaz): 80%
EVP, Marketing (Jim Reid): 80%
The above percentages apply against base pay based on achievement of the 2010 Budget as follows (100% equates to the NEOs receiving 100% of his/her targeted percentage of base pay):
Incentive Compensation Matrix
| Revenue (M$) | ||||||||||||||||||||||||
| < $1,100 | $1,100 | $1,125 | $1,150 | $1,175 | $1,200 | $1,275 | $1,350 | $1,425 | $1,500 | |||||||||||||||

|
< -8% | -8% | -6% | -4% | -2% | 0% | 6% | 13% | 19% | 25% | ||||||||||||||
| 16.90% | 22% | 0% | 120% | 130% | 140% | 150% | 160% | 170% | 180% | 190% | 200% | |||||||||||||
| 16.15% | 16% | 0% | 110% | 119% | 128% | 136% | 145% | 155% | 165% | 175% | 185% | |||||||||||||
| 15.40% | 11% | 0% | 100% | 108% | 115% | 123% | 130% | 140% | 150% | 160% | 170% | |||||||||||||
| 14.65% | 5% | 0% | 90% | 96% | 103% | 109% | 115% | 125% | 135% | 145% | 155% | |||||||||||||
| 13.90% | 0% | 0% | 80% | 85% | 90% | 95% | 100% | 110% | 120% | 130% | 140% | |||||||||||||
| 13.65% | -2% | 0% | 73% | 78% | 83% | 88% | 93% | 103% | 113% | 123% | 135% | |||||||||||||
| 13.40% | -4% | 0% | 65% | 70% | 75% | 80% | 85% | 95% | 105% | 115% | 130% | |||||||||||||
| 13.15% | -5% | 0% | 58% | 63% | 68% | 73% | 83% | 93% | 103% | 113% | 125% | |||||||||||||
| 12.90% | -7% | 0% | 50% | 55% | 63% | 70% | 80% | 90% | 100% | 110% | 120% | |||||||||||||
| < 12.9% | < -7% | 0% | 0% | 0% | 0% | 0% | 0% | 0% | 0% | 0% | 0% | |||||||||||||
Note: Company payout factor is capped at 200%, revenue and operating margin is measured as follows:
| • | Revenue refers to sales generated from all Spansion’s products and services as reported in Spansion’s pro-forma P&L. Pro-forma adjustments to GAAP revenue would include: |
| • | Add back of deferred revenue lost due to fresh start accounting; and |
| • | Reduction of revenue from companies acquired during fiscal 2010. |
| • | Operating Margin is derived from Operating Income divided by Revenue (as defined above). Operating Income refers to Spansion’s earnings before interest income/expense, other income/expense, taxes and extraordinary items as reported in Spansion’s pro-forma P&L. Pro-forma adjustments to GAAP Operating Income would include: |
| • | Revenue adjustments; and |
| • | Expense adjustments indicated on next page. |
| • | Elimination of bankruptcy-related reorganization, restructuring, and any other applicable costs, including any items identified as such in the 2010 Annual Budget; |
| • | Elimination of any other fees or bonuses that are required for or upon the company’s successful emergence from Chapter 11 bankruptcy; |
| • | Adjustment for Spansion Japan or Spansion Nihon KK related payments or expenses, settlement, or other such activities |
| • | Adjustments for changes in the carrying costs of assets and depreciation levels due to fresh start accounting, including but not limited to inventory, property and equipment, and intangibles; |
| • | Adjustments for changes in the liabilities due to fresh start accounting, including but not limited to market valuation of debt, capital leases, and other such items; |
| • | Adjustment for change in expenses due to equity grants (valuation, vesting, etc) |
| • | Elimination of costs and expenses from companies acquired during fiscal 2010 and any administrative costs associated with board-approved transactions. |
| • | Elimination of any expenses or credits recorded on unconventional line items in GAAP Operating Income due to unforeseen accounting situations (e.g., sort reserve, claims agent, gain on extinguishment of debt, ARS, etc) |
Performance-Based Restricted Stock Units
The initial grant of performance-based restricted shares for the NEOs are as follows:
| 2010 Initial Grant | ||||
| EVP, CFO (Randy Furr) |
215,888 | |||
| EVP, Worldwide Sales (Ahmed Nawaz) |
115,140 | |||
| EVP, Marketing (Jim Reid) |
124,735 | |||
| Page 9 |
The key elements of the performance-based restricted stock unit program are:
| • | Performance-based restricted stock units will vest (though not necessarily be earned) on an annual basis: 25% a year beginning with the year ending December 31, 2010. On the final trading day of January of the following year the actual number of shares earned will be awarded based on the achieved financials (“Payout Factor”) as defined in the Restricted Stock Units Earned Matrix on Page 6. The period for Company performance measurement will be the Company’s fiscal year. |
| • | Each participant will have a target number of shares for each year of the plan. This is referred to as the “Base Number of Shares”. The Base Number of shares equal to 25% of the total number of shares awarded. For example, if the executive was awarded 100,000 shares in year 1, his year one Base Number of Shares would be 25,000. And, if the executive was awarded 50,000 additional shares in year 2, the executive’s 2nd year Base Number of Shares would be 62,500 (50,000 for the year one grant plus 12,500 for the year two grant). |
| • | If the Company’s Payout Factor equals the 100% figure in the matrix, then the participant will earn 100% of the Base Number of Shares for the year. |
| • | If the Company’s Payout Factor falls below the 100% payout level in any year, then the percentage achieved will be applied to the Base Number of Shares with the additional, unearned shares deferred to the subsequent year (“Carry Forward” number of shares). |
| • | If the Company’s Payout Factor exceeds the 100% payout level in any year, then the Payout Factor will be applied to the Base Number of Shares. Any shares earned in excess of the Base Number of Shares will be funded by the carry forward shares. If an insufficient number of Carry Forward shares exists excess shares will be accelerated from the furthest year out (i.e. if in 2010 more than 100% of the Base number of Shares are earned, then the excess shares are accelerated from the Base Number of Shares scheduled to vest in 2013). |
| • | Upon acceleration, the Base Number of Shares from which the shares were accelerated shall be reduced by the corresponding number of accelerated shares. |
| • | No participant may earn additional shares over the initial number of shares granted; if performance in a given year warrants acceleration but the Base Number of Shares in subsequent years have already been depleted, no acceleration occurs. |
| • | Any Carry Forward shares not used to fund above target payouts are carried forward to the subsequent year |
| • | Carry Forward shares not earned at the conclusion of the final performance period will be forfeited. |
Note: the 2010 performance-based restricted stock unit program truly has RSUs at risk. Even though on the “upside”, RSUs accelerate, no “additional” shares over the initial grant can be earned. If the financial performance goals are not achieved in any given year, shares are pushed to the following year, but there is no guarantee that the shares push out will ever be earned, particularly since any unearned shares are forfeited after the four-year vesting period.
| Page 10 |
Performance-Based Restricted Stock Units Earned Matrix
| Revenue (M$) | ||||||||||||||||||||||||
| < $1,100 | $1,100 | $1,125 | $1,150 | $1,175 | $1,200 | $1,275 | $1,350 | $1,425 | $1,500 | |||||||||||||||
|
|
< -8% | -8% | -6% | -4% | -2% | 0% | 6% | 13% | 19% | 25% | ||||||||||||||
| 16.90% | 22% | 50% | 120% | 130% | 140% | 150% | 150% | 150% | 150% | 150% | 150% | |||||||||||||
| 16.15% | 16% | 50% | 110% | 119% | 128% | 136% | 145% | 150% | 150% | 150% | 150% | |||||||||||||
| 15.40% | 11% | 50% | 100% | 108% | 115% | 123% | 130% | 140% | 150% | 150% | 150% | |||||||||||||
| 14.65% | 5% | 50% | 90% | 96% | 103% | 109% | 115% | 125% | 135% | 145% | 150% | |||||||||||||
| 13.90% | 0% | 50% | 80% | 85% | 90% | 95% | 100% | 110% | 120% | 130% | 140% | |||||||||||||
| 13.65% | -2% | 50% | 73% | 78% | 83% | 88% | 93% | 103% | 113% | 123% | 135% | |||||||||||||
| 13.40% | -4% | 50% | 65% | 70% | 75% | 80% | 85% | 95% | 105% | 115% | 130% | |||||||||||||
| 13.15% | -5% | 50% | 58% | 63% | 68% | 73% | 83% | 93% | 103% | 113% | 125% | |||||||||||||
| 12.90% | -7% | 50% | 50% | 55% | 63% | 70% | 80% | 90% | 100% | 110% | 120% | |||||||||||||
| < 12.9% | < -7% | 50% | 50% | 50% | 50% | 50% | 50% | 50% | 50% | 50% | 50% | |||||||||||||
Stock Options
The initial grant of stock options to the NEOs are as follows:
| 2010 Initial Grant | ||||
| EVP, CFO (Randy Furr) |
401,303 | |||
| EVP, Worldwide Sales (Ahmed Nawaz) |
215,362 | |||
| EVP, Marketing (Jim Reid) |
223,600 | |||
The options will vest as follows: 33.3% after one year and then monthly thereafter – 3 year schedule.
The plan would be to receive a onetime cash bonus that is on top of and in addition to the incentive compensation plan outlined above. The onetime cash bonus will be $868,170.00 for Randy Furr, $483,732 for Jim Reid, and $465,908 for Ahmed Nawaz. This would be paid on or about November 1, 2010 and May 1, 2011 in equal installments.
| Page 11 |
For CEO direct reports (other than NEOs)
Total Compensation Package Recommendation
for
2010
| Page 12 |
For CEO direct reports (other than NEOs):
High level strategy (same as CEO & NEOs):
Our primarily long-term corporate objective is to create superior value for our stockholders. The objective of the executive compensation program is to attract, motivate, reward and retain highly qualified executive officers who are able to achieve the corporate objective of superior value for our stockholders. The executive compensation program is designed to provide a foundation of fixed compensation (based salary and time based restricted shares) and a significant portion of performance-based compensation.
Base Pay
SVP, Engineering (Joe Rauschmayer): $354,765
SVP, Human Resources (Carmine Renzulli): $300,000
SVP, CTO (Ali Pourkeramati): $336,013
SVP, Legal (Nancy Richardson): $300,000
SVP, Business Unit (Tom Eby): $396,309
Incentive compensation
See incentive compensation philosophy discussed in the CEO section. The philosophy here is the same.
The 2010 incentive compensation for the CEO’s direct reports works as follows:
| Base Pay | X |
Individual Target Bonus Percentage |
X | Company Payout Factor |
X | Individual Payout Factor |
= | Bonus Amount |
With the following definitions:
Base Pay: bonus period ending annual base pay rate
Individual Target Bonus Percentage: defined below as recommended by CEO and approved by Compensation Committee
Company Payout Factor: defined from table below which is a function of revenue and operating margin as recommended annually by the CEO and approved by the BOD/Compensation Committee
Individual Payout Factor: These are both objective and subjective factors considered based on predetermined goals and objectives established by the CEO for each NEO and approved by the Compensation Committee and can affect the calculated performance bonus by as much as 50% down or 50% up with the stipulation that the total combined bonuses of the NEOs is a zero sum (i.e. assuming the same base pay, if one NEO received 125%, one other would receive 75% to offset
| Page 13 |
the addition). See Exhibit A for Spansion Corporate goals and Exhibit B for the individual goals and objectives for each CEO direct report.
The target incentive compensation percentage for the CEO’s direct reports in fiscal 2010 is as follows:
SVP, Engineering (Joe Rauschmayer): 60%
SVP, Human Resources (Carmine Renzulli): 60%
SVP, CTO (Ali Pourkeramati): 60%
SVP, Legal (Nancy Richardson): 60%
SVP, Strategy & Communications (Tom Eby): 60%
The above percentages apply against base pay based on achievement of the 2010 Budget as follows (100% equates to the CEO’s direct reports receiving 100% of his/her targeted percentage of base pay):
Incentive Compensation Matrix
| Revenue (M$) | ||||||||||||||||||||||||
| < $1,100 | $1,100 | $1,125 | $1,150 | $1,175 | $1,200 | $1,275 | $1,350 | $1,425 | $1,500 | |||||||||||||||
| < -8% | -8% | -6% | -4% | -2% | 0% | 6% | 13% | 19% | 25% | |||||||||||||||
|
|
16.90% | 22% | 0% | 120% | 130% | 140% | 150% | 160% | 170% | 180% | 190% | 200% | ||||||||||||
| 16.15% | 16% | 0% | 110% | 119% | 128% | 136% | 145% | 155% | 165% | 175% | 185% | |||||||||||||
| 15.40% | 11% | 0% | 100% | 108% | 115% | 123% | 130% | 140% | 150% | 160% | 170% | |||||||||||||
| 14.65% | 5% | 0% | 90% | 96% | 103% | 109% | 115% | 125% | 135% | 145% | 155% | |||||||||||||
| 13.90% | 0% | 0% | 80% | 85% | 90% | 95% | 100% | 110% | 120% | 130% | 140% | |||||||||||||
| 13.65% | -2% | 0% | 73% | 78% | 83% | 88% | 93% | 103% | 113% | 123% | 135% | |||||||||||||
| 13.40% | -4% | 0% | 65% | 70% | 75% | 80% | 85% | 95% | 105% | 115% | 130% | |||||||||||||
| 13.15% | -5% | 0% | 58% | 63% | 68% | 73% | 83% | 93% | 103% | 113% | 125% | |||||||||||||
| 12.90% | -7% | 0% | 50% | 55% | 63% | 70% | 80% | 90% | 100% | 110% | 120% | |||||||||||||
| < 12.9% | < -7% | 0% | 0% | 0% | 0% | 0% | 0% | 0% | 0% | 0% | 0% | |||||||||||||
Note: Company payout factor is capped at 200%, revenue and operating margin is measured as follows:
| • | Revenue refers to sales generated from all Spansion’s products and services as reported in Spansion’s pro-forma P&L. Pro-forma adjustments to GAAP revenue would include: |
| • | Add back of deferred revenue lost due to fresh start accounting; and |
| • | Reduction of revenue from companies acquired during fiscal 2010. |
| • | Operating Margin is derived from Operating Income divided by Revenue (as defined above). Operating Income refers to Spansion’s earnings before interest income/expense, other income/expense, taxes and extraordinary items as reported in Spansion’s pro-forma P&L. Pro-forma adjustments to GAAP Operating Income would include: |
| • | Revenue adjustments; and |
| • | Expense adjustments indicated on next page. |
| • | Elimination of bankruptcy-related reorganization, restructuring, and any other applicable costs, including any items identified as such in the 2010 Annual Budget; |
| • | Elimination of any other fees or bonuses that are required for or upon the company’s successful emergence from Chapter 11 bankruptcy; |
| • | Adjustment for Spansion Japan or Spansion Nihon KK related payments or expenses, settlement, or other such activities |
| • | Adjustments for changes in the carrying costs of assets and depreciation levels due to fresh start accounting, including but not limited to inventory, property and equipment, and intangibles; |
| • | Adjustments for changes in the liabilities due to fresh start accounting, including but not limited to market valuation of debt, capital leases, and other such items; |
| • | Adjustment for change in expenses due to equity grants (valuation, vesting, etc) |
| • | Elimination of costs and expenses from companies acquired during fiscal 2010 and any administrative costs associated with board-approved transactions. |
| Page 14 |
| • | Elimination of any expenses or credits recorded on unconventional line items in GAAP Operating Income due to unforeseen accounting situations (e.g., sort reserve, claims agent, gain on extinguishment of debt, ARS, etc) |
Performance-Based Restricted Stock Units
The initial grant of performance-based restricted shares for the CEO direct reports are as follows:
| 2010 Initial Grant | ||||
| SVP, Engineering (Joe Rauschmayer) |
66,206 | |||
| SVP, Human Resources (Carmine Renzulli) |
49,935 | |||
| SVP, CTO (Ali Pourkeramati) |
75,801 | |||
| SVP, Legal (Nancy Richardson) |
49,935 | |||
| SVP, Business Unit (Tom Eby) |
66,206 | |||
The key elements of the performance-based restricted stock unit program are:
| • | Performance-based restricted stock units will vest (though not necessarily be earned) on an annual basis: 25% a year beginning with the year ending December 31, 2010. On the final trading day of January of the following year the actual number of shares earned will be awarded based on the achieved financials (“Payout Factor”) as defined in the Restricted Stock Units Earned Matrix on Page 6. The period for Company performance measurement will be the Company’s fiscal year. |
| • | Each participant will have a target number of shares for each year of the plan. This is referred to as the “Base Number of Shares”. The Base Number of shares equal to 25% of the total number of shares awarded. For example, if the executive was awarded 100,000 shares in year 1, his year one Base Number of Shares would be 25,000. And, if the executive was awarded 50,000 additional shares in year 2, the executive’s 2nd year Base Number of Shares would be 62,500 (50,000 for the year one grant plus 12,500 for the year two grant). |
| • | If the Company’s Payout Factor equals the 100% figure in the matrix, then the participant will earn 100% of the Base Number of Shares for the year. |
| • | If the Company’s Payout Factor falls below the 100% payout level in any year, then the percentage achieved will be applied to the Base Number of Shares with the additional, unearned shares deferred to the subsequent year (“Carry Forward” number of shares). |
| • | If the Company’s Payout Factor exceeds the 100% payout level in any year, then the Payout Factor will be applied to the Base Number of Shares. Any shares earned in excess of the Base Number of Shares will be funded by the carry forward shares. If an insufficient number of Carry Forward shares exists excess shares will be accelerated from the furthest year out (i.e. if in 2010 more than 100% of the Base number of Shares are earned, then the excess shares are accelerated from the Base Number of Shares scheduled to vest in 2013). |
| • | Upon acceleration, the Base Number of Shares from which the shares were accelerated shall be reduced by the corresponding number of accelerated shares. |
| • | No participant may earn additional shares over the initial number of shares granted; if performance in a given year warrants acceleration but the Base Number of Shares in subsequent years have already been depleted, no acceleration occurs. |
| • | Any Carry Forward shares not used to fund above target payouts are carried forward to the subsequent year |
| Page 15 |
| • | Carry Forward shares not earned at the conclusion of the final performance period will be forfeited. |
Note: the 2010 performance-based restricted stock unit program truly has RSUs at risk. Even though on the “upside”, RSUs accelerate, no “additional” shares over the initial grant can be earned. If the financial performance goals are not achieved in any given year, shares are pushed to the following year, but there is no guarantee that the shares push out will ever be earned, particularly since any unearned shares are forfeited after the four-year vesting period.
Performance-Based Restricted Stock Units Earned Matrix
| Revenue (M$) | ||||||||||||||||||||||||
| < $1,100 | $1,100 | $1,125 | $1,150 | $1,175 | $1,200 | $1,275 | $1,350 | $1,425 | $1,500 | |||||||||||||||
| < -8% | -8% | -6% | -4% | -2% | 0% | 6% | 13% | 19% | 25% | |||||||||||||||
|
|
16.90% | 22% | 50% | 120% | 130% | 140% | 150% | 150% | 150% | 150% | 150% | 150% | ||||||||||||
| 16.15% | 16% | 50% | 110% | 119% | 128% | 136% | 145% | 150% | 150% | 150% | 150% | |||||||||||||
| 15.40% | 11% | 50% | 100% | 108% | 115% | 123% | 130% | 140% | 150% | 150% | 150% | |||||||||||||
| 14.65% | 5% | 50% | 90% | 96% | 103% | 109% | 115% | 125% | 135% | 145% | 150% | |||||||||||||
| 13.90% | 0% | 50% | 80% | 85% | 90% | 95% | 100% | 110% | 120% | 130% | 140% | |||||||||||||
| 13.65% | -2% | 50% | 73% | 78% | 83% | 88% | 93% | 103% | 113% | 123% | 135% | |||||||||||||
| 13.40% | -4% | 50% | 65% | 70% | 75% | 80% | 85% | 95% | 105% | 115% | 130% | |||||||||||||
| 13.15% | -5% | 50% | 58% | 63% | 68% | 73% | 83% | 93% | 103% | 113% | 125% | |||||||||||||
| 12.90% | -7% | 50% | 50% | 55% | 63% | 70% | 80% | 90% | 100% | 110% | 120% | |||||||||||||
| < 12.9% | < -7% | 50% | 50% | 50% | 50% | 50% | 50% | 50% | 50% | 50% | 50% | |||||||||||||
Stock Options
Initial grant of stock options to be granted at market for the CEO’s direct reports are as follows:
| 2010 Initial Grant | ||||
| SVP, Engineering (Joe Rauschmayer) |
122,980 | |||
| SVP, Human Resources (Carmine Renzulli) |
91,794 | |||
| SVP, CTO (Ali Pourkeramati) |
122,980 | |||
| SVP, Legal (Nancy Richardson) |
91,794 | |||
| SVP, Strategy & Communications (Tom Eby) |
122,980 | |||
The shares will vest as follows: 33.3% after one year and then monthly thereafter – 3 year vesting schedule.
The plan would be to receive a onetime cash bonus that is on top of and in addition to the incentive compensation plan outlined above in the amounts of $266,053 for Joe Rauschmayer, $198,584 for Carmine Renzulli, $266,053 for Ali Pourkeramati, $198,584 for Nancy Richardson, and $266,053 for Tom Eby. This would be paid on or about November 1, 2010 and May 1, 2011 in equal installments.
| Page 16 |
Exhibit A
| Page 17 |
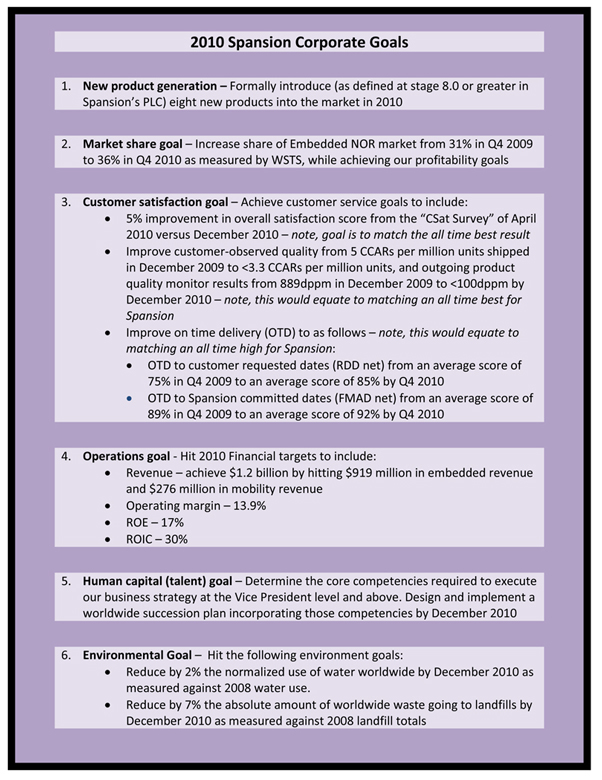
Exhibit B
| Page 18 |
CEO, NEOs and Direct Reports Goals & Objectives for 2010
Randy Furr:
| 1. | Get out of Chapter 11 - achieve a combination of the most advantageous plan of reorganization in the shortest possible time and complete the financial reporting, to include Fresh Start Account, in a timely manner that would allow Spansion to list and trade its new common stock with a national exchange within 90 days emergence from Chapter 11. |
| 2. | Hit or exceed the 2010 budget and continuously review and bring to executive management’s attention ways to improve Company profits to include increasing new sales as well as reducing expenses. |
| 3. | Improve the Company’s product cost system to include product costing and inventory costing/management. |
| 4. | Identify potential improvements and make recommendations on how Sales and Operations can improve the match between what is forecasted “supply” and what is sold “demand”. The goal here will be both to improve margin in products sold as well as minimize any excess and/or obsolete inventory. |
| 5. | Develop a long term strategy (3 to 5 years) with respect to Spansion’s final manufacturing operations |
| 6. | Drive down Spansion’s full year average commodity cost (all commodities, not just selected commodities) by an amount equal to or greater than the Company’s full year average ASP decline. |
Jim Reid:
| 1. | Revenue Goal - Achieve $919M in Embedded Revenue and $276M in Mobility to hit the $1,210M Corporate Plan while meeting the targeted expense budget |
| 2. | Process Goal - Acquire eight new market segment leading customers by December 31, 2010 |
| 3. | Market Share - Increase share of Embedded NOR market from 31% in Q4 2009 to 36% in Q4 2010 as measured by WSTS, while achieving our profitability goals |
| 4. | Product Goal - Release eight new NOR products to M8.0 by December 31, 2010. |
| 5. | Margin Goal – Achieve 37% average gross margin and 13.9% operating margin for 2010 |
| Page 19 |
| 6. | Drive migration from 110nm and larger technologies to 90nm and smaller technologies to a point where 50% (up from approximately 25% at the beginning of the year) of the company’s products are 90nm and smaller by December 31, 2010 |
Ahmed Nawaz:
| 1. | Achieve $919M in Embedded Revenue and $276M in Mobility to hit the $1,210M Corporate Plan while meeting the targeted expense budget |
| 2. | Market share goal – Increase share of Embedded NOR market from 31% in Q4 2009 to 36% in Q4 2010 as measured by WSTS, while achieving our profitability goals |
| 3. | Increase Global Distribution Market share to 50% by Year-end while consolidating Channel Partners from 11 to 9 |
| 4. | 5% improvement in overall satisfaction score from the “CSat Survey” of April 2010 versus December 2010 |
| 5. | Seamless Integration of NSKK into Spansion and gain 5% Embedded market share in Japan |
| 6. | New Sales Leadership in China (VP Sales, Sales Dir. in Shenzhen), Japan (President of NSKK and VP Marketing) and Sales Mgr in India by Mid-Year |
| 7. | Staff and operationalize the New Eco-System Development (EDO) Group. Develop OEM and Distribution Chipset Reference Collateral by Sep 30. Increase SalesForce.com reporting of Chipset/Flash Pairing 100% by 6/30 |
| 8. | Drive migration from 110nm and larger technologies to 90nm and smaller technologies to a point where 50% (up from approximately 25% at the beginning of the year) of the company’s products are 90nm and smaller by December 31, 2010 |
Joe Rauschmayer:
| 1. | Support the revenue plan of $1.2B, with cost maintained to drive $437M in Gross Margin and $271M of EBITDA. |
| 2. | Manage expenses for each area to meet the budget, with Fab 25 at $201M, OCOGS at $18.2M, R&D at $21.1M and SG&A at $9.3M. |
| 3. | Drive the release of 8 new products through M8.0 on schedule (dated 3/31/10) and 4 internal fab transfers to M10. All products to be compliant to the PLC procedures. |
| 4. | Improve Quality by driving CCARs/million shipped from 5.0 to 3.3, by December, 2010. |
| Page 20 |
| 5. | Ramp WXIC for 65 nm at budgeted indices by December 24, 2010. Choose a 45 nm foundry by April 15, 2010, begin 45 nm transfer by July 1, 2010, and achieve milestones necessary to begin production by December 30, 2011. |
Carmine Renzulli:
| 1. | Design and deliver a leadership development program (management level) by December 2010 which focus’ on competencies critical for successful leadership and development in a high-performance organization. |
| 2. | Rewards and Recognition-deliver a reward and recognition program that recognizes high-performance, alignment with the business objective, s and reinforces the corporate culture and values within three weeks after our emergence from bankruptcy. |
| 3. | Ensure the proper balance is achieved between full time and part time headcount within sixty days of emergence from bankruptcy and is maintained throughout the year. |
| 4. | Well-developed succession plan for Vice Presidents and Directors worldwide by December 31, 2010. |
Ali Pourkeramati:
| 1- | PLC initiatives and PMO: Creating a PMO function to support and maintain PLC and UMS by 6/1/2010. |
| 2- | Technology Development: Qualify 65nm technology in WXIC by 8/6/10 and Fab25 by 12/31/10, Transferring 43nm NAND technology to Elpida and qualify by 3/31/11. |
| 3- | Product Design: Release of XGL-R and XFL-R products to M6.0 by 12/31/10, release 8 new products to M8.0 by 12/31/10 |
| 4- | Embedded Flash: Preparing new “Future Growth” products for Phase 0 by 12/31/10 |
| 5- | Spansion Flash file System: Release to market Spansion Flash File Software by 12/31/10 |
| 6- | Support the revenue and managing R&D Budget: Support the revenue plan of $1.2B and 13.9% operating margin by keeping R&D budget below 10% of revenue. |
| Page 21 |
Nancy Richardson:
| 1. | Ensure that Spansion is timely listed on a national stock exchange within 90 days of emergence from Chapter 11 |
| 2. | Bring home a win in the ITC investigation against Samsung by either securing a determination in Spansion’s favor by the Administrative Law Judge (ALJ) or signing a settlement worth more than $85M to Spansion before the ALJ rules |
| 3. | Reevaluate existing corporate governance and SEC compliance processes and programs and implement changes that the make the process more efficient and effective by June 30, 2010 |
| 4. | I will obtain a Green Belt in Kaizen before year end |
Tom Eby:
| 1. | Corporate Development - Manage and as appropriate extend the Elpida relationship to support the following objectives: 1. Implementation of existing agreements and completion of a MB-NAND foundry agreement in a timeframe consistent with the MB-NAND PLC schedule. 2. Completion of a 45nm NOR foundry agreement consistent with the timing identified in the 45nm platform stage 0 exit. Close Winbond agreement no later than 3/31/10. Support implementation of agreement to enable small sector SPI product shipments consistent with the PLC schedule. Evaluate and, as appropriate, negotiate and close additional transactions in a timely manner in support of the strategic plan, including corporate development support for “flash superset” products. |
| 2. | Corporate Strategy - Work with the CFO to support completion of the strategic plan by June 25, 2010, and more specifically to drive alignment regarding critical elements of our strategy including: (i) The foundation of our customer/market value proposition. (ii) How we will position the company effectively versus our competitors. (iii) The degree of diversification beyond “pure memory” markets. |
| 3. | Spansion Brand – Drive alignment among the EOC of Spansion’s key desired brand attributes by [4/30/10]. Leverage Spansion’s Chapter 11 emergence to drive awareness of Spansion in areas including product, technology & thought leadership via PLC-aligned product introductions, white papers, documentation, segment-specific perspectives and ongoing customer and chipset design wins. Baseline Spansion’s brand awareness / preference via a survey of customers, chipset and channel partners at least 50% of whom from Asia by [6/30/10]. Measure improvement in brand awareness / preference via updated survey completed by 12/31/10. Comprehensiveness of brand survey and specific metrics for improvement will be a function of the affordability of the surveys. Complete revision of Website by 9/30/10. |
| 4. | Japan – Working with John Kispert, Ahmed Nawaz, and Carmine Renzulli, identify and have in place the leadership of Nippon Spansion K.K. (NSKK) before the NSKK transaction closes. Drive necessary actions to ensure that NSKK is established and all other definitive agreements are closed and effective no later than 5/24/10. Drive agreement on the alignment between the NSKK organization and the respective functional owners globally no later than the establishment of NSKK (5/24/10). Support reengagement with Japan customers to support an annual revenue run-rate >$300M no |
| Page 22 |
| later than Q3 2010. |
| Page 23 |
Exhibit C
Incentive Plan Martix Details
| Bonus Payout Matrix | ||||||||||||||||||||||||
| Revenue (M$) | ||||||||||||||||||||||||
|
|
< $1,100 | $1,100 | $1,125 | $1,150 | $1,175 | $1,200 | $1,275 | $1,350 | $1,425 | $1,500 | ||||||||||||||
| < -8% | -8% | -6% | -4% | -2% | 0% | 6% | 13% | 19% | 25% | |||||||||||||||
| 16.90% | 22% | 0% | 120% | 130% | 140% | 150% | 160% | 170% | 180% | 190% | 200% | |||||||||||||
| 16.15% | 16% | 0% | 110% | 119% | 128% | 136% | 145% | 155% | 165% | 175% | 185% | |||||||||||||
| 15.40% | 11% | 0% | 100% | 108% | 115% | 123% | 130% | 140% | 150% | 160% | 170% | |||||||||||||
| 14.65% | 5% | 0% | 90% | 96% | 103% | 109% | 115% | 125% | 135% | 145% | 155% | |||||||||||||
| 13.90% | 0% | 0% | 80% | 85% | 90% | 95% | 100% | 110% | 120% | 130% | 140% | |||||||||||||
| 13.65% | -2% | 0% | 73% | 78% | 83% | 88% | 93% | 103% | 113% | 123% | 135% | |||||||||||||
| 13.40% | -4% | 0% | 65% | 70% | 75% | 80% | 85% | 95% | 105% | 115% | 130% | |||||||||||||
| 13.15% | -5% | 0% | 58% | 63% | 68% | 73% | 83% | 93% | 103% | 113% | 125% | |||||||||||||
| 12.90% | -7% | 0% | 50% | 55% | 63% | 70% | 80% | 90% | 100% | 110% | 120% | |||||||||||||
| < 12% | < -7% | 0% | 0% | 0% | 0% | 0% | 0% | 0% | 0% | 0% | 0% | |||||||||||||
| Total Bonus Payout | ||||||||||||||||||||||||
| Target | ||||||||||||||||||||||||
| Plan Cost | Revenue (M$) | |||||||||||||||||||||||
|
|
$31.1 | < $1,100 | $1,100 | $1,125 | $1,150 | $1,175 | $1,200 | $1,275 | $1,350 | $1,425 | $1,500 | |||||||||||||
| 16.90% | $0.0 | $37.3 | $40.4 | $43.5 | $46.6 | $49.7 | $52.8 | $55.9 | $59.0 | $62.1 | ||||||||||||||
| 16.15% | $0.0 | $34.2 | $36.9 | $39.6 | $42.3 | $45.1 | $48.2 | $51.3 | $54.4 | $57.5 | ||||||||||||||
| 15.40% | $0.0 | $31.1 | $33.4 | $35.7 | $38.1 | $40.4 | $43.5 | $46.6 | $49.7 | $52.8 | ||||||||||||||
| 14.65% | $0.0 | $28.0 | $29.9 | $31.8 | $33.8 | $35.7 | $38.8 | $41.9 | $45.1 | $48.2 | ||||||||||||||
| 13.90% | $0.0 | $24.9 | $26.4 | $28.0 | $29.5 | $31.1 | $34.2 | $37.3 | $40.4 | $43.5 | ||||||||||||||
| 13.65% | $0.0 | $22.5 | $24.1 | $25.6 | $27.2 | $28.7 | $31.8 | $35.0 | $38.1 | $41.9 | ||||||||||||||
| 13.40% | $0.0 | $20.2 | $21.7 | $23.3 | $24.9 | $26.4 | $29.5 | $32.6 | $35.7 | $40.4 | ||||||||||||||
| 13.15% | $0.0 | $17.9 | $19.4 | $21.0 | $22.5 | $25.6 | $28.7 | $31.8 | $35.0 | $38.8 | ||||||||||||||
| 12.90% | $0.0 | $15.5 | $17.1 | $19.4 | $21.7 | $24.9 | $28.0 | $31.1 | $34.2 | $37.3 | ||||||||||||||
| < 12% | $0.0 | $0.0 | $0.0 | $0.0 | $0.0 | $0.0 | $0.0 | $0.0 | $0.0 | $0.0 | ||||||||||||||
| Bonus as % of Operating Profit | ||||||||||||||||||||||||
| Target | ||||||||||||||||||||||||
| Plan Cost | Revenue (M$) | |||||||||||||||||||||||
|
|
$31.1 | < $1,100 | $1,100 | $1,125 | $1,150 | $1,175 | $1,200 | $1,275 | $1,350 | $1,425 | $1,500 | |||||||||||||
| 16.90% | 0% | 20.1% | 21.2% | 22.4% | 23.5% | 24.5% | 24.5% | 24.5% | 24.5% | 24.5% | ||||||||||||||
| 16.15% | 0% | 19.2% | 20.3% | 21.3% | 22.3% | 23.2% | 23.4% | 23.5% | 23.6% | 23.7% | ||||||||||||||
| 15.40% | 0% | 18.3% | 19.3% | 20.2% | 21.0% | 21.9% | 22.2% | 22.4% | 22.7% | 22.9% | ||||||||||||||
| 14.65% | 0% | 17.4% | 18.1% | 18.9% | 19.6% | 20.3% | 20.8% | 21.2% | 21.6% | 21.9% | ||||||||||||||
| 13.90% | 0% | 16.3% | 16.9% | 17.5% | 18.1% | 18.6% | 19.3% | 19.9% | 20.4% | 20.9% | ||||||||||||||
| 13.65% | 0% | 15.0% | 15.7% | 16.3% | 17.0% | 17.5% | 18.3% | 19.0% | 19.6% | 20.5% | ||||||||||||||
| 13.40% | 0% | 13.7% | 14.4% | 15.1% | 15.8% | 16.4% | 17.3% | 18.0% | 18.7% | 20.1% | ||||||||||||||
| 13.15% | 0% | 12.4% | 13.1% | 13.9% | 14.6% | 16.2% | 17.1% | 17.9% | 18.7% | 19.7% | ||||||||||||||
| 12.90% | 0% | 10.9% | 11.8% | 13.1% | 14.3% | 16.1% | 17.0% | 17.8% | 18.6% | 19.3% | ||||||||||||||
| < 12% | 0% | 0% | 0% | 0% | 0% | 0% | 0% | 0% | 0% | 0% | ||||||||||||||
| Page 24 |