Attached files
| file | filename |
|---|---|
| 8-K - ABOVENET INC | v230917_8k.htm |
| EX-99.1 - ABOVENET INC | v230917_ex99-1.htm |
AboveNet, Inc.
Second Quarter 2011 Earnings Conference Call
August 5, 2011
Bill LaPerch, President & CEO
Joe Ciavarella, SVP & CFO
High Bandwidth Connectivity Solutions
Safe Harbor Statement
Statements made in this presentation that are not historical in nature constitute forward-looking statements within the meaning of the Safe Harbor Provisions of the Private Securities Litigation Reform Act of 1995. We cannot assure you that the future results expressed or implied by the forward-looking statements will be achieved. Such statements are based on the current expectations and beliefs of the management of AboveNet, Inc. and are subject to a number of risks and uncertainties that could cause actual results to differ materially from the future results expressed or implied by such forward-looking statements. These risks and uncertainties include, but are not limited to, industry competition, pricing and macro-economic conditions and the Company's financial and operating prospects. The Company's business could be materially adversely affected and the trading price of the Company's common stock could decline if these risks and uncertainties develop into actual events. The Company cautions you not to place undue reliance on these forward-looking statements, which speak only as of their respective dates. The Company undertakes no obligation to publicly update or revise forward-looking statements to reflect events or circumstances after the date of this presentation or to reflect the occurrence of unanticipated events. A more detailed discussion of factors that may affect the Company's business and future financial results is included in the Company’s SEC filings, including, but not limited to, those described in “Risk Factors” and "Management's Discussion and Analysis of Financial Condition and Results of Operations" in the Company's Annual Report on Form 10-K for the year ended December 31, 2010 and in the Company's subsequently filed Quarterly Report(s) on Form 10-Q. We discuss certain non-GAAP financial measures in this presentation and provide the GAAP financial measures that correspond to such non-GAAP measures, as well as the reconciliation between the two.
High Bandwidth Connectivity Solutions
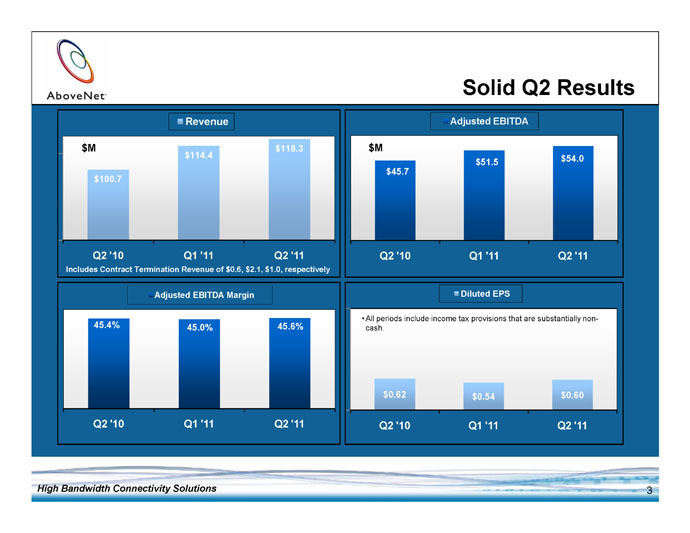
Solid Q2 Results Revenue $M $118.3 $114.4 $100.7 Q2 '10 Q1 '11 Q2 '11 Includes Contract Termination Revenue of $0.6, $2.1, $1.0, respectively Adjusted EBITDA $M $54.0 $51.5 $45.7 Q2 '10 Q1 '11 Q2 '11 Adjusted EBITDA Margin 45.4% 45.0% 45.6% Q2 '10 Q1 '11 Q2 '11 Diluted EPS • All periods include income tax provisions that are substantially non-cash. $0.62 $0.54 $0.60 Q2 '10 Q1 '11 Q2 '11 High Bandwidth Connectivity Solutions

Q2 2011 Highlights Industry trends Financial services consolidation High bandwidth needs in more verticals Cloud computing continues to gain traction Customers’ evolving data center strategies Opportunities Continue to diversify revenue mix Greater need for connectivity to, from and around the cloud Customers’ data center strategies require increased connectivity High Bandwidth Connectivity Solutions
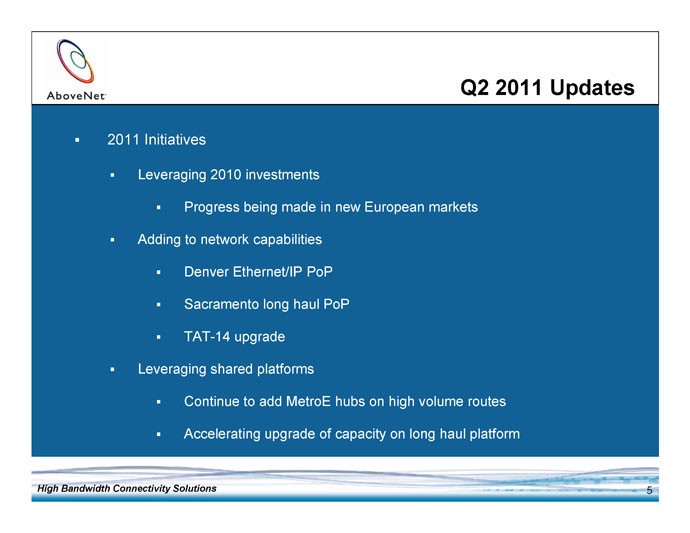
Q2 2011 Updates 2011 Initiatives Leveraging 2010 investments Progress being made in new European markets Adding to network capabilities Denver Ethernet/IP PoP Sacramento long haul PoP TAT-14 upgrade Leveraging shared platforms Continue to add MetroE hubs on high volume routes Accelerating upgrade of capacity on long haul platform High Bandwidth Connectivity Solutions
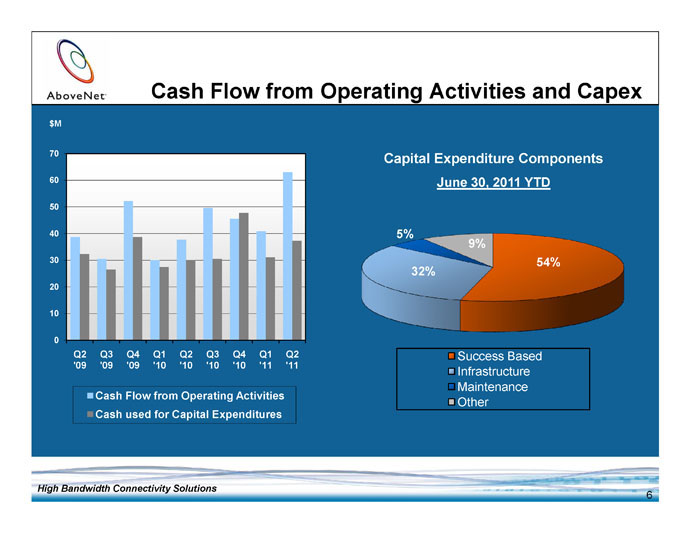
Cash Flow from Operating Activities and Capex $M 70 60 50 40 30 20 10 0 Q2 Q3 Q4 Q1 Q2 Q3 Q4 Q1 Q2 '09 '09 '09 '10 '10 '10 '10 '11 '11 Cash Flow from Operating Activities Cash used for Capital Expenditures Capital Expenditure Components June 30, 2011 YTD 5% 9% 54% 32% Success Based Infrastructure Maintenance Other High Bandwidth Connectivity Solutions
Financial Review High Bandwidth Connectivity Solutions
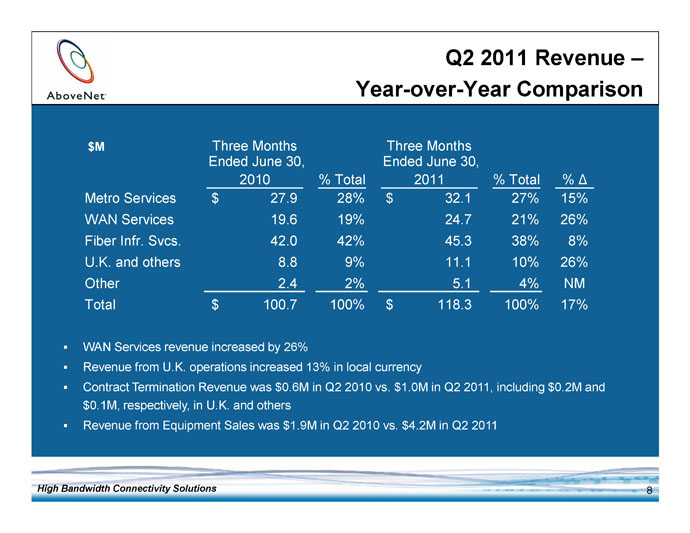
Q2 2011 Revenue –Year-over-Year Comparison $M Three Months Three Months Ended June 30, Ended June 30, 2010 % Total 2011 % Total % Metro Services $ 27.9 28% $ 32.1 27% 15% WAN Services 19.6 19% 24.7 21% 26% Fiber Infr. Svcs. 42.0 42% 45.3 38% 8% U.K. and others 8.8 9% 11.1 10% 26% Other 2.4 2% 5.1 4% NM Total $ 100.7 100% $ 118.3 100% 17% WAN Services revenue increased by 26% Revenue from U.K. operations increased 13% in local currency Contract Termination Revenue was $0.6M in Q2 2010 vs. $1.0M in Q2 2011, including $0.2M and $0.1M, respectively, in U.K. and others Revenue from Equipment Sales was $1.9M in Q2 2010 vs. $4.2M in Q2 2011 High Bandwidth Connectivity Solutions
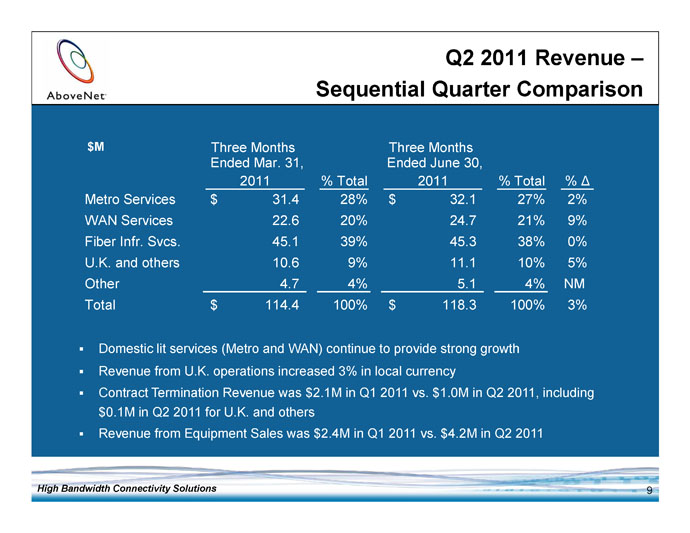
Q2 2011 Revenue –Sequential Quarter Comparison $M Three Months Three Months Ended Mar. 31, Ended June 30, 2011 % Total 2011 % Total % Metro Services $ 31.4 28% $ 32.1 27% 2% WAN Services 22.6 20% 24.7 21% 9% Fiber Infr. Svcs. 45.1 39% 45.3 38% 0% U.K. and others 10.6 9% 11.1 10% 5% Other 4.7 4% 5.1 4% NM Total $ 114.4 100% $ 118.3 100% 3% Domestic lit services (Metro and WAN) continue to provide strong growth Revenue from U.K. operations increased 3% in local currency Contract Termination Revenue was $2.1M in Q1 2011 vs. $1.0M in Q2 2011, including $0.1M in Q2 2011 for U.K. and others Revenue from Equipment Sales was $2.4M in Q1 2011 vs. $4.2M in Q2 2011 High Bandwidth Connectivity Solutions
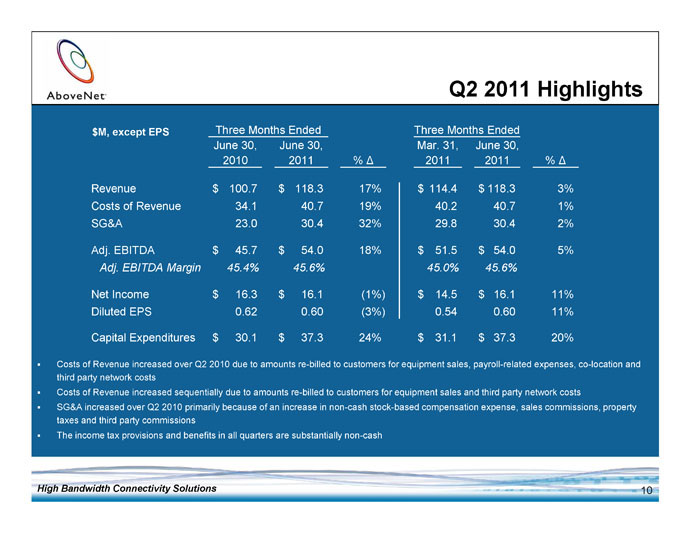
Q2 2011 Highlights $M, except EPS Three Months Ended Three Months Ended June 30, June 30, Mar. 31, June 30, 2010 2011 % 2011 2011 % Revenue $ 100.7 $ 118.3 17% $ 114.4 $ 118.3 3% Costs of Revenue 34.1 40.7 19% 40.2 40.7 1% SG&A 23.0 30.4 32% 29.8 30.4 2% Adj. EBITDA $ 45.7 $ 54.0 18% $ 51.5 $ 54.0 5% Adj. EBITDA Margin 45.4% 45.6% 45.0% 45.6% Net Income $ 16.3 $ 16.1 (1%) $ 14.5 $ 16.1 11% Diluted EPS 0.62 0.60 (3%) 0.54 0.60 11% Capital Expenditures $ 30.1 $ 37.3 24% $ 31.1 $ 37.3 20% Costs of Revenue increased over Q2 2010 due to amounts re-billed to customers for equipment sales, payroll-related expenses, co-location and third party network costs Costs of Revenue increased sequentially due to amounts re-billed to customers for equipment sales and third party network costs SG&A increased over Q2 2010 primarily because of an increase in non-cash stock-based compensation expense, sales commissions, property taxes and third party commissions The income tax provisions and benefits in all quarters are substantially non-cash High Bandwidth Connectivity Solutions
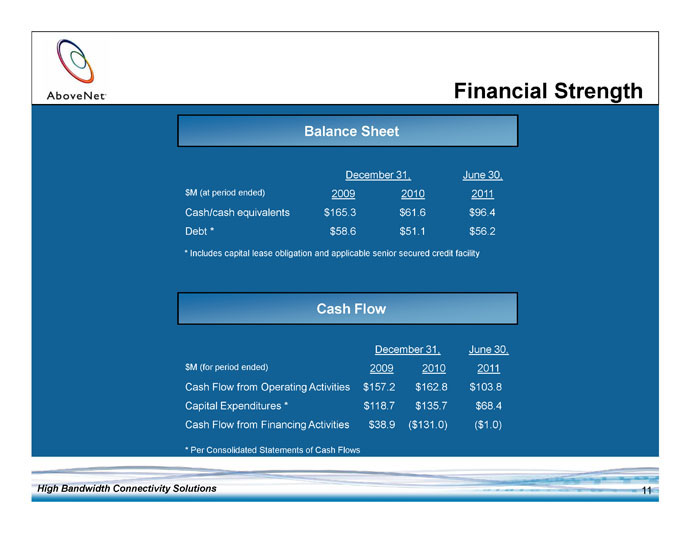
Financial Strength Balance Sheet December 31, June 30, $M (at period ended) 2009 2010 2011 Cash/cash equivalents $165.3 $61.6 $96.4 Debt * $58.6 $51.1 $56.2 * Includes capital lease obligation and applicable senior secured credit facility Cash Flow December 31, June 30, $M (for period ended) 2009 2010 2011 Cash Flow from Operating Activities $157.2 $162.8 $103.8 Capital Expenditures * $118.7 $135.7 $68.4 Cash Flow from Financing Activities $38.9 ($131.0) ($1.0) * Per Consolidated Statements of Cash Flows High Bandwidth Connectivity Solutions
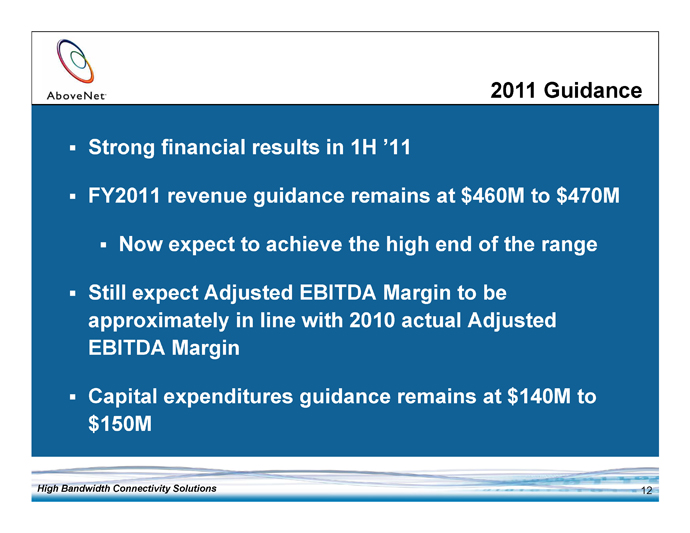
2011 Guidance Strong financial results in 1H ’11 FY2011 revenue guidance remains at $460M to $470M Now expect to achieve the high end of the range Still expect Adjusted EBITDA Margin to be approximately in line with 2010 actual Adjusted EBITDA Margin Capital expenditures guidance remains at $140M to $150M High Bandwidth Connectivity Solutions
Appendix High Bandwidth Connectivity Solutions
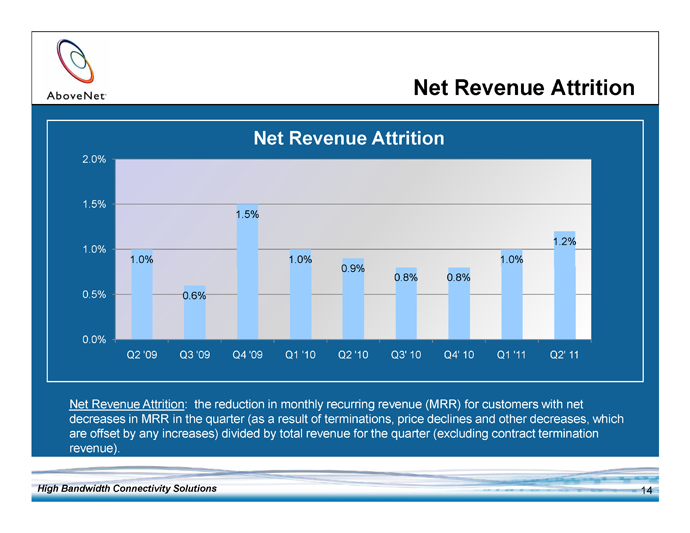
Net Revenue Attrition Net Revenue Attrition 2.0% 1.5% 1.5% 1.2% 1.0% 1.0% 1.0% 1.0% 0.9% 0.8% 0.8% 0.5% 0.6% 0.0% Q2 '09 Q3 '09 Q4 '09 Q1 '10 Q2 '10 Q3' 10 Q4' 10 Q1 '11 Q2' 11 Net Revenue Attrition: the reduction in monthly recurring revenue (MRR) for customers with net decreases in MRR in the quarter (as a result of terminations, price declines and other decreases, which are offset by any increases) divided by total revenue for the quarter (excluding contract termination revenue). High Bandwidth Connectivity Solutions
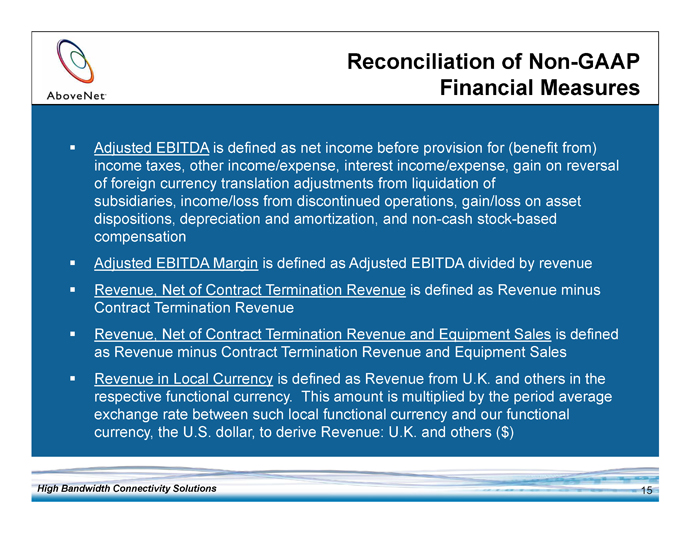
Reconciliation of Non-GAAP Financial Measures Adjusted EBITDA is defined as net income before provision for (benefit from) income taxes, other income/expense, interest income/expense, gain on reversal of foreign currency translation adjustments from liquidation of subsidiaries, income/loss from discontinued operations, gain/loss on asset dispositions, depreciation and amortization, and non-cash stock-based compensation Adjusted EBITDA Margin is defined as Adjusted EBITDA divided by revenue Revenue, Net of Contract Termination Revenue is defined as Revenue minus Contract Termination Revenue Revenue, Net of Contract Termination Revenue and Equipment Sales is defined as Revenue minus Contract Termination Revenue and Equipment Sales Revenue in Local Currency is defined as Revenue from U.K. and others in the respective functional currency. This amount is multiplied by the period average exchange rate between such local functional currency and our functional currency, the U.S. dollar, to derive Revenue: U.K. and others ($) High Bandwidth Connectivity Solutions
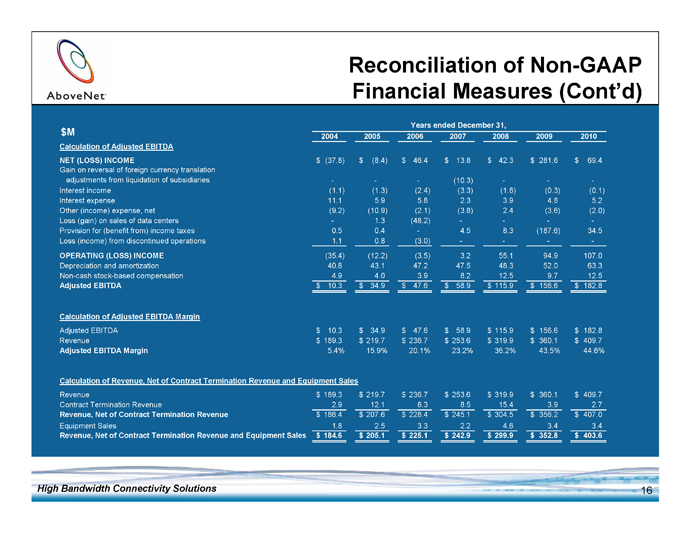
Reconciliation of Non-GAAP Financial Measures (Cont’d) Years ended December 31, $M 2004 2005 2006 2007 2008 2009 2010 Calculation of Adjusted EBITDA NET (LOSS) INCOME $ (37.8) $ (8.4) $ 46.4 $ 13.8 $ 42.3 $ 281.6 $ 69.4 Gain on reversal of foreign currency translation adjustments from liquidation of subsidiaries - - - (10.3) - - -Interest income (1.1) (1.3) (2.4) (3.3) (1.8) (0.3) (0.1) Interest expense 11.1 5.9 5.8 2.3 3.9 4.8 5.2 Other (income) expense, net (9.2) (10.9) (2.1) (3.8) 2.4 (3.6) (2.0) Loss (gain) on sales of data centers - 1.3 (48.2) - - - -Provision for (benefit from) income taxes 0.5 0.4 - 4.5 8.3 (187.6) 34.5 Loss (income) from discontinued operations 1.1 0.8 (3.0) - - - - OPERATING (LOSS) INCOME (35.4) (12.2) (3.5) 3.2 55.1 94.9 107.0 Depreciation and amortization 40.8 43.1 47.2 47.5 48.3 52.0 63.3 Non-cash stock-based compensation 4.9 4.0 3.9 8.2 12.5 9.7 12.5 Adjusted EBITDA $ 10.3 $ 34.9 $ 47.6 $ 58.9 $ 115.9 $ 156.6 $ 182.8 Calculation of Adjusted EBITDA Margin Adjusted EBITDA $ 10.3 $ 34.9 $ 47.6 $ 58.9 $ 115.9 $ 156.6 $ 182.8 Revenue $ 189.3 $ 219.7 $ 236.7 $ 253.6 $ 319.9 $ 360.1 $ 409.7 Adjusted EBITDA Margin 5.4% 15.9% 20.1% 23.2% 36.2% 43.5% 44.6% Calculation of Revenue, Net of Contract Termination Revenue and Equipment Sales Revenue $ 189.3 $ 219.7 $ 236.7 $ 253.6 $ 319.9 $ 360.1 $ 409.7 Contract Termination Revenue 2.9 12.1 8.3 8.5 15.4 3.9 2.7 Revenue, Net of Contract Termination Revenue $ 186.4 $ 207.6 $ 228.4 $ 245.1 $ 304.5 $ 356.2 $ 407.0 Equipment Sales 1.8 2.5 3.3 2.2 4.6 3.4 3.4 Revenue, Net of Contract Termination Revenue and Equipment Sales $ 184.6 $ 205.1 $ 225.1 $ 242.9 $ 299.9 $ 352.8 $ 403.6 High Bandwidth Connectivity Solutions
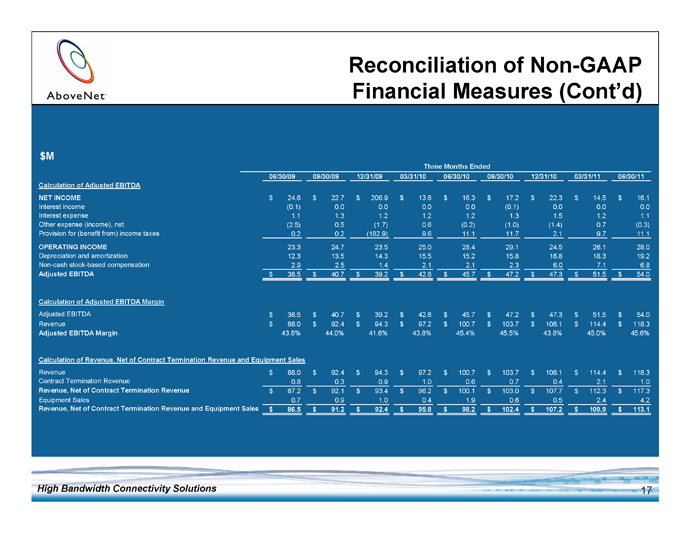
Reconciliation of Non-GAAP Financial Measures (Cont’d) $M Three Months Ended 06/30/09 09/30/09 12/31/09 03/31/10 06/30/10 09/30/10 12/31/10 03/31/11 06/30/11 Calculation of Adjusted EBITDA NET INCOME $ 24.6 $ 22.7 $ 206.9 $ 13.6 $ 16.3 $ 17.2 $ 22.3 $ 14.5 $ 16.1 Interest income (0.1) 0.0 0.0 0.0 0.0 (0.1) 0.0 0.0 0.0 Interest expense 1.1 1.3 1.2 1.2 1.2 1.3 1.5 1.2 1.1 Other expense (income), net (2.5) 0.5 (1.7) 0.6 (0.2) (1.0) (1.4) 0.7 (0.3) Provision for (benefit from) income taxes 0.2 0.2 (182.9) 9.6 11.1 11.7 2.1 9.7 11.1 OPERATING INCOME 23.3 24.7 23.5 25.0 28.4 29.1 24.5 26.1 28.0 Depreciation and amortization 12.3 13.5 14.3 15.5 15.2 15.8 16.8 18.3 19.2 Non-cash stock-based compensation 2.9 2.5 1.4 2.1 2.1 2.3 6.0 7.1 6.8 Adjusted EBITDA $ 38.5 $ 40.7 $ 39.2 $ 42.6 $ 45.7 $ 47.2 $ 47.3 $ 51.5 $ 54.0 Calculation of Adjusted EBITDA Margin Adjusted EBITDA $ 38.5 $ 40.7 $ 39.2 $ 42.6 $ 45.7 $ 47.2 $ 47.3 $ 51.5 $ 54.0 Revenue $ 88.0 $ 92.4 $ 94.3 $ 97.2 $ 100.7 $ 103.7 $ 108.1 $ 114.4 $ 118.3 Adjusted EBITDA Margin 43.8% 44.0% 41.6% 43.8% 45.4% 45.5% 43.8% 45.0% 45.6% Calculation of Revenue, Net of Contract Termination Revenue and Equipment Sales Revenue $ 88.0 $ 92.4 $ 94.3 $ 97.2 $ 100.7 $ 103.7 $ 108.1 $ 114.4 $ 118.3 Contract Termination Revenue 0.8 0.3 0.9 1.0 0.6 0.7 0.4 2.1 1.0 Revenue, Net of Contract Termination Revenue $ 87.2 $ 92.1 $ 93.4 $ 96.2 $ 100.1 $ 103.0 $ 107.7 $ 112.3 $ 117.3 Equipment Sales 0.7 0.9 1.0 0.4 1.9 0.6 0.5 2.4 4.2 Revenue, Net of Contract Termination Revenue and Equipment Sales $ 86.5 $ 91.2 $ 92.4 $ 95.8 $ 98.2 $ 102.4 $ 107.2 $ 109.9 $ 113.1 High Bandwidth Connectivity Solutions
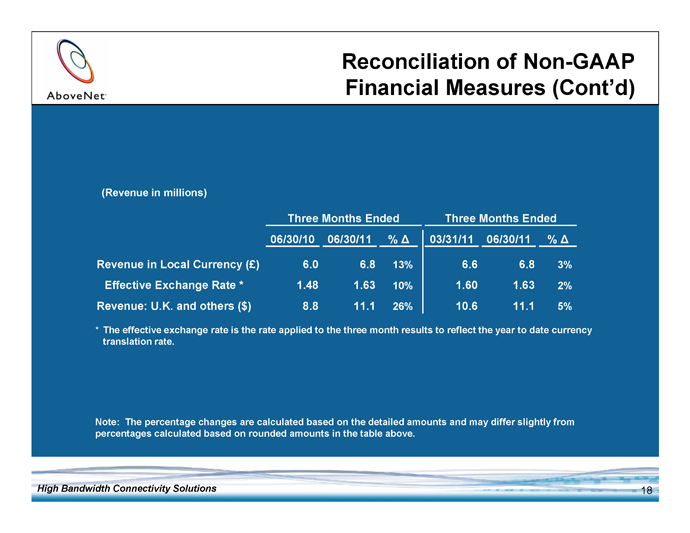
Reconciliation of Non-GAAP Financial Measures (Cont’d) (Revenue in millions) Three Months Ended Three Months Ended 06/30/10 06/30/11 % 03/31/11 06/30/11 % Revenue in Local Currency (£) 6.0 6.8 13% 6.6 6.8 3% Effective Exchange Rate * 1.48 1.63 10% 1.60 1.63 2% Revenue: U.K. and others ($) 8.8 11.1 26% 10.6 11.1 5% * The effective exchange rate is the rate applied to the three month results to reflect the year to date currency translation rate. Note: The percentage changes are calculated based on the detailed amounts and may differ slightly from percentages calculated based on rounded amounts in the table above. High Bandwidth Connectivity Solutions
Reconciliation of Non-GAAP Financial Measures (Cont’d) AboveNet’s management believes that adjusted or modified EBITDA and its related margin are measures of operating performance that are commonly reported and widely used by analysts, investors, and other interested parties in the telecommunications industry because they eliminate many differences in financial, capitalization, and tax structures, as well as certain non-cash and non-operating charges to earnings. AboveNet’s management currently uses Adjusted EBITDA and Adjusted EBITDA Margin for these purposes. AboveNet’s management believes that Adjusted EBITDA and Adjusted EBITDA Margin trends can be used as indicators of whether the Company’s operations are able to produce sufficient operating cash flow to fund working capital needs, service debt obligations and fund capital expenditures. Adjusted EBITDA is also used by the Company for other purposes, including management’s assessment of ongoing operations and as a measure for performance-based compensation. However, the definition of adjusted EBITDA for other purposes may differ from the definition of Adjusted EBITDA used herein. For example, since 2009 the definition of adjusted EBITDA in the Company’s incentive cash bonus plan has excluded certain customer termination fees. Additionally, Adjusted EBITDA as used in this press release may not be calculated identically to similarly titled measures reported by other companies. The Company also reviews revenue, net of contract termination revenue and revenue, net of contract termination revenue and equipment sales as well as revenue in local currency. Revenue, net of contract termination revenue shows the change in the Company’s recurring revenue from period to period excluding the impact of non-recurring contract termination revenue. Revenue, net of contract termination revenue and equipment sales shows the change in the Company’s recurring revenue from period to period excluding the impact of non-recurring contract termination revenue and equipment sales. Revenue in local currency shows the changes of foreign subsidiary revenue without the impact of currency fluctuations. Management believes these non-GAAP metrics provide helpful insight into revenue trends. High Bandwidth Connectivity Solutions