Attached files
 Exhibit 99.3
SUPPLEMENTAL PORTFOLIO INFORMATION
THE PMI GROUP, INC. |
 DEFINITION
OF TERMS 2/28s
–
refers to loans with interest rates that are fixed for two years and reset to a new
interest rate at the end of year two for the remaining term of the loan.
ARMs
–
refers to loans with adjustable interest rates. We consider a loan an ARM if its
interest rate may be adjusted prior to the loan’s fifth anniversary.
A Quality Loans
–
we define A quality to include loans with credit scores of 620 and greater.
Alt-A Loans
–
we consider a loan Alt-A if it has a credit score of 620 or greater and the borrower
requests and is given the option of providing reduced documentation verifying
income, assets, deposit information and/or employment. Captive Reinsurance
–
refers to agreements in which a portion of risk insured by PMI is reinsured by a captive
reinsurance company affiliated with the mortgage originator or
investor. Defaults – our
primary mortgage insurance master policy defines “default” as the
borrower’s failure to pay when due an amount equal to the scheduled monthly
mortgage payment under the terms of the mortgage. Generally, the master policies require an
insured to notify PMI of a default no later than the last business day of the month
following the month in which the borrower becomes three monthly payments in
default. For reporting purposes and internal tracking purposes, we do not consider a loan to
be in default until the borrower has missed two consecutive payments. Depending upon
its scheduled payment date, a loan delinquent
for
two
consecutive
monthly
payments
could
be
reported
to
PMI
between
the
31
st
and
the
60
th
day
after
the
first
missed
payment.
Flow
–
generally refers to mortgage insurance offered on a loan-by-loan basis to
lenders. GSE Pool –
refers to a traditional pool product for mortgage loans sold by PMI’s customers to
the GSEs. This product was available from 1997 to 2001.
Interest Only Loans
–
refers to loans that do not reduce principal during the initial
deferral period (usually between two and ten
years) and therefore do not accumulate equity through loan amortization during the initial
deferral period. Insurance in Force (IIF)
–
refers to the current principal balance of all outstanding mortgage loans with insurance
coverage as of a given date.
Less-than-A Quality Loans
–
we define less-than-A credit quality loans to include loans with credit scores of
619 or below. The majority of our less-than-A-quality loans have credit
scores above 575. 2 |
 DEFINITION
OF TERMS 3
Loan Modification –
a permanent change in one or more of the terms of a mortgagor’s loan, which allows
the loan to be reinstated. Modified Pool Insurance
–
modified pool insurance may be used in addition to primary mortgage insurance or may be
placed on loans that do not require primary insurance. Coverage of modified
pool products varies. Some products provide first loss protection by covering
a percentage of the losses on individual loans held within the pool of insured loans up to a stated
aggregate loss limit (“stop loss limit”) for the entire pool. Some
modified pool products offer mezzanine-level coverage by providing for claims
payments only after a predetermined cumulative claims level, or deductible, is reached.
New Insurance Written (NIW)
–
refers to the original principal balance of all loans that receive new primary mortgage
insurance coverage during a given period.
New Risk Written (NRW)
–
refers to the aggregate dollar amount of each insured mortgage loan’s current
principal balance multiplied
by
the
insurance
coverage
percentage
specified
in
the
policy
for
all
loans
that
receive
new
primary
mortgage
insurance
coverage during a given period.
Old Pool –
refers to a traditional pool product for mortgage loans sold by PMI’s customers to
capital market participants. Organic Cure –
generally refers to the borrower paying the mortgage payments in arrears and the loan
being reported by the servicers as current.
Payment Option ARMs
–
generally refers to loans that provide the borrower an option every month to make a
payment consisting of principal and interest, interest only, or an amount
established by the lender that may be less than the interest owed.
Primary
Insurance
–
refers
to
mortgage
insurance
placed
on
a
loan-by-loan
basis
through
our
“flow”
channel
and
mortgage
insurance
issued
for
mortgage-backed
securities
and
portfolio
investors
through
our
“structured
transactions”
channel.
Primary
insurance
does not include pool or modified pool information.
Primary Risk in Force
–
refers to the aggregate dollar amount of each insured mortgage loan’s current
principal balance multiplied by
the
insurance
coverage
percentage
specified
in
the
policy
for
insurance
policies
issued
through
our
“flow”
and
“structured
transactions”
channels only.
Risk in Force (RIF) –
refers to the aggregate dollar amount of each insured mortgage loan’s current
principal balance multiplied by the insurance coverage percentage specified in the
policy. Structured
–
generally refers to mortgage insurance offered by PMI that covers large portfolios of
mortgage loans and is provided to issuers of mortgage backed securities
(“MBS”) and portfolio investors. Traditional Pool
–
covers the entire loss on a defaulted mortgage loan that exceeds the claim payment under
any primary insurance coverage,
up
to
a
stated
aggregate
loss
limit,
or
stop
loss,
for
all
of
the
loans
in
a
pool.
PMI
is
not
currently
offering
traditional
pool insurance to its customers. |
 CURES
FOCUS ON PARTICULAR PRIMARY PORTFOLIO SEGMENTS
PRIMARY PORTFOLIO CHARACTERISTICS BY VINTAGE
MODIFIED POOL CHARACTERISTICS BY VINTAGE
9
16
18
25
32
4
CAPTIVE REINSURANCE
35
PORTFOLIO CATEGORIES
5
CONTENTS OF PRESENTATION
PRIMARY PORTFOLIO CHARACTERISTICS
PRIMARY PORTFOLIO VINTAGE DEVELOPMENT
14 |
 PORTFOLIO
CATEGORIES 5
PORTFOLIO CATEGORIES
*
*
*
*
*
*
*
*
*
*
*
*
*
*
*
*
*
*
*
*
*
*
*
*
*
*
*
* |
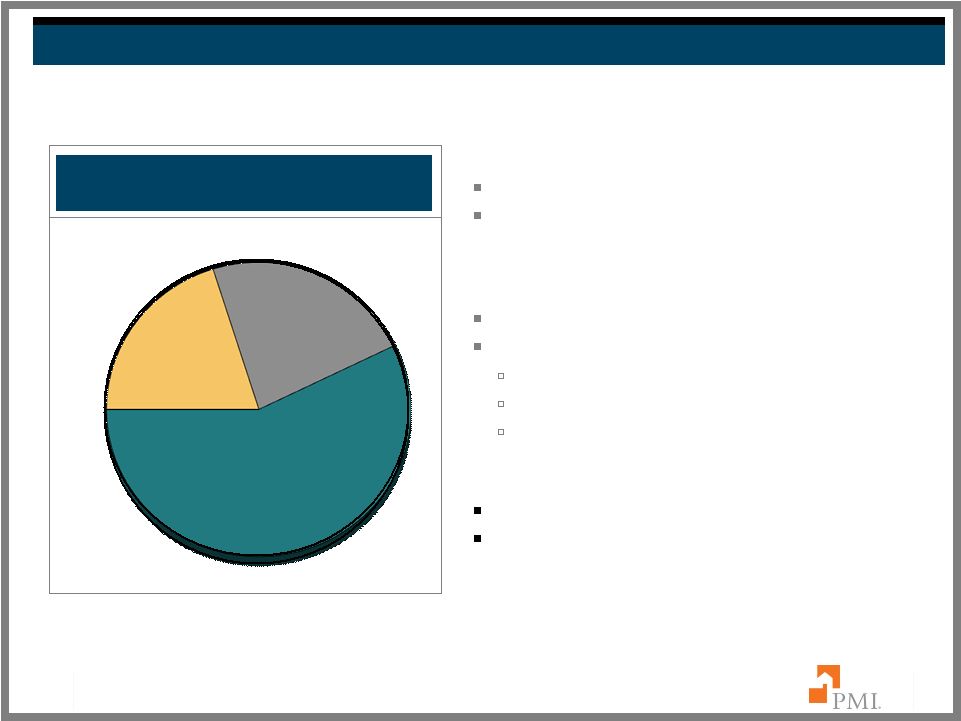
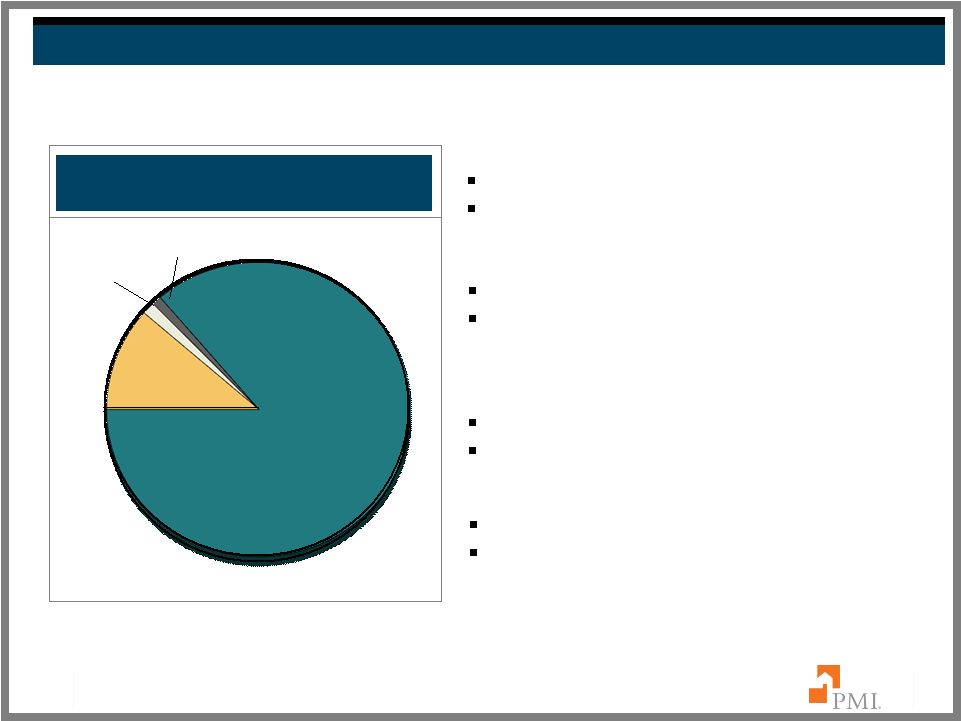 6
Primary Flow
86%
Primary
Structured
12%
Modified
Pool
1%
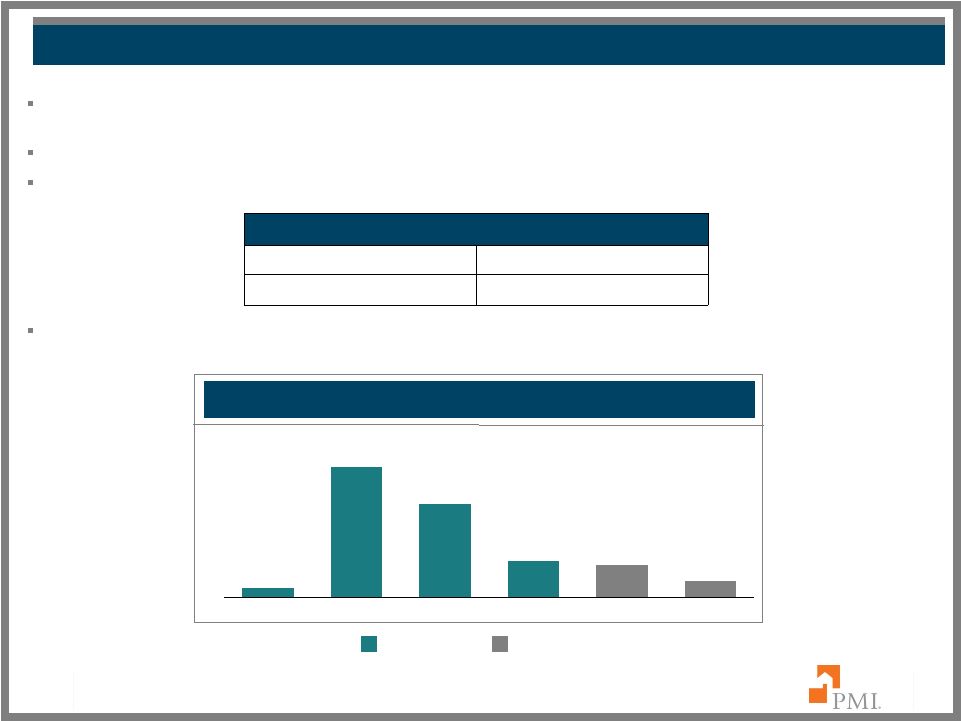
GENERAL PORTFOLIO CATEGORIES
Primary Flow Insurance
$21.0 billion of risk in force.
Primary mortgage insurance offered to lenders on a
loan-by-loan basis.
Primary Structured Insurance
$2.8 billion of risk in force.
Credit enhancement solutions offered across the credit
spectrum to agency and non-agency MBS issuers as
well as portfolio investors.
Modified Pool Risk in Force
$0.3 billion of remaining risk in force.
(1)
Insurance offered to agency and non-agency MBS issuers
and investors.
Other Pool
$0.3 billion of remaining risk in force.
(1)
Prior to 2002, PMI offered certain pool insurance
products, referred to principally as GSE or Old Pool, to
lenders, the GSEs and non-agency market.
Other
Pool
1%
* At June 30, 2011.
Note: Due to rounding, the sum of percentages may not total 100%.
(1)
Remaining risk in force for modified and other pool excludes non-performing risk
exposures, for which loss reserves have been established. $23.7 BILLION
PRIMARY RISK IN FORCE AND $0.6 BILLION POOL RISK IN FORCE*
|
 7
$23.7 BILLION PRIMARY RISK IN FORCE*
Legacy: Performing
56%
New writings
23%
GENERAL PORTFOLIO CATEGORIES
Legacy
(1)
: Performing
$13.2 billion of risk in force.
Continues to perform through the housing downturn
and generates strong annual revenues.
Legacy
(1)
: Non-performing
$5.1 billion of risk in force.
Key focus of PMI’s loss mitigation efforts.
PMI’s Homeownership Preservation Initiatives.
Home Affordable Modification Program (HAMP).
Other loan modification and workout programs.
New writings
(2)
$5.4 billion of risk in force.
High quality business originated under new guidelines and
higher premium rates.
* At June 30, 2011.
Note: Due to rounding, the sum of percentages may not total 100%.
Legacy:
Non-performing
21%
(1)
Legacy refers to risk in force from June 30, 2008 and prior.
(2)
New writings refers to risk in force originated from July 1, 2008 through June 30, 2011.
|
 8
NEW WRITINGS*
New writings
$5.4 billion of risk in force from $30.6 billion of new insurance written in 2H 2008,
2009, 2010 and 1H 2011. High quality business originated under new guidelines and
higher premium rates.
* At June 30, 2011.
(1)
Condominium includes Townhouses and Cooperatives.
New writings characteristics as percentage of risk in force:
Loan Type
100% Fixed Rate
Documentation
100% Full Documentation
Property Type
85% Single Family
15% Condominium
(1)
Occupancy
96% Owner Occupied
3% Second Home
Average FICO of 746
94% FICO 680 and above
75% FICO 720 and above
Average Loan to Value of 90%
98% at 95% LTV and below
60% at 90% LTV and below
Average loan size of $216,337 |
 9
*
*
*
*
*
*
*
*
*
*
*
*
*
*
*
*
*
*
*
*
*
*
*
*
*
*
*
* |
 U.S.
PORTFOLIO AGE DISTRIBUTION 10
(1)
Average loan fixed annual mortgage interest rate.
Note: Due to rounding, the sum of percentages may not total 100%.
|
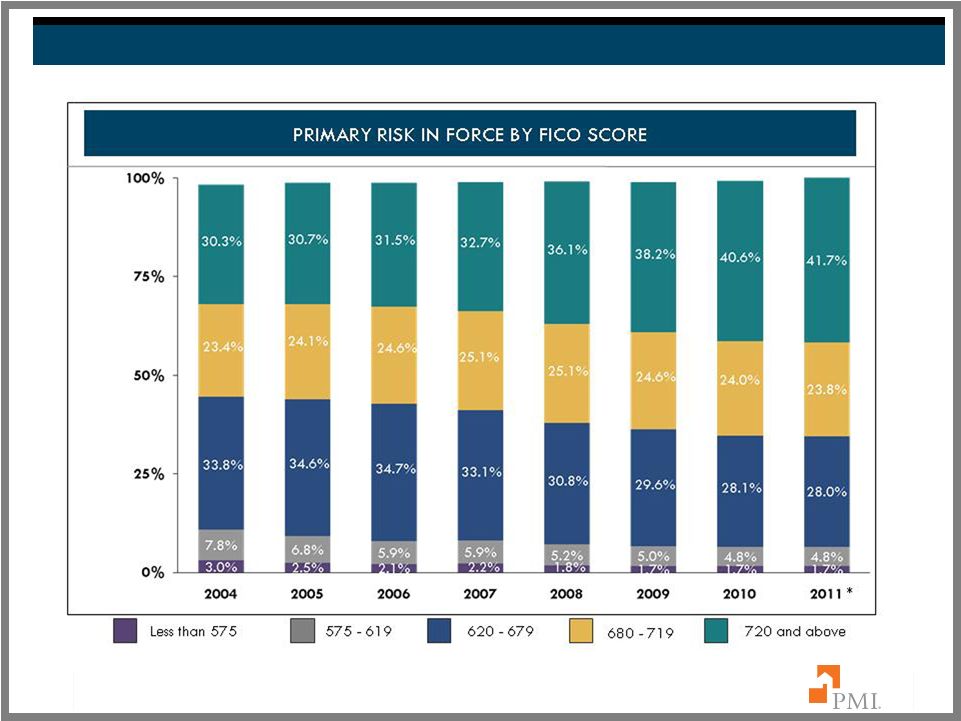 U.S.
PORTFOLIO CREDIT SCORE DISTRIBUTION 11
Note: Due to rounding, the sum of percentages may not total 100%.
* Through June 30, 2011. |
 U.S.
PORTFOLIO LOAN TO VALUE DISTRIBUTION 12
Note: Due to rounding, the sum of percentages may not total 100%.
LTVs between 85.01%
and 90%
LTVs above
97%
LTVs between 95.01%
and 97%
LTVs between 90.01% and
95%
LTVs of 85% and
below
(1)
At origination.
* Through June 30, 2011. |
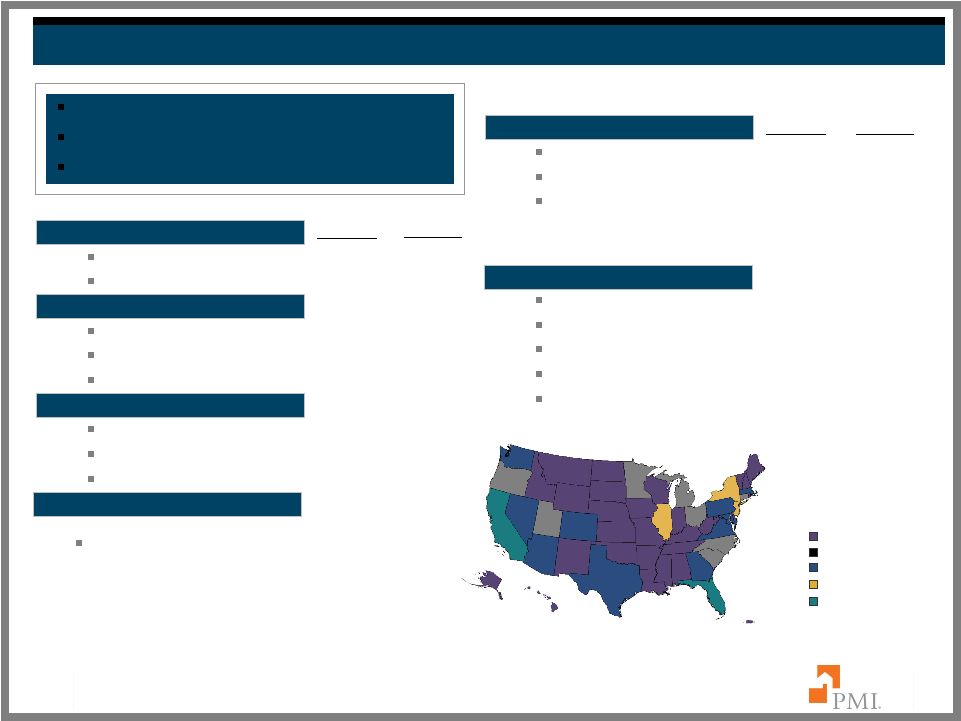
 U.S.
PORTFOLIO GEOGRAPHIC DISTRIBUTION 13
(1)
Top ten states as determined by primary RIF on June 30, 2011.
(2)
Default rates as of June 30, 2011, December 31, 2010 and June 30, 2010
9.4%
8.2%
7.4%
5.2%
4.0%
3.5%
4.1%
3.4%
4.6%
3.3%
Florida
9.4%
39.99%
40.57%
40.75%
Texas
8.2%
10.11%
11.45%
11.88%
California
7.4%
26.59%
29.48%
33.82%
Illinois
5.2%
23.84%
24.63%
24.92%
Georgia
4.6%
19.18%
20.59%
22.19%
% of RIF
(1)
Jun 2011
Dec 2010
Jun 2010
New York
4.1%
20.18%
20.39%
19.55%
Ohio
4.0%
16.54%
17.20%
17.03%
Pennsylvania
3.5%
15.32%
15.80%
15.05%
New Jersey
3.4%
26.26%
25.35%
24.88%
Washington
3.3%
18.36%
17.76%
17.12%
% of RIF
(1)
Jun 2010
Dec 2010
Jun 2010
TOP TEN STATES –
PERCENT OF PRIMARY RISK IN FORCE AND DEFAULT RATES
Primary Default Rates
(2)
Primary Default Rates
(2) |
 14
*
*
*
*
*
*
*
*
*
*
*
*
*
*
*
*
*
*
*
*
*
*
*
*
*
*
*
* |
 PRIMARY
PORTFOLIO VINTAGE DEVELOPMENT 15
NOTICE OF DEFAULT RECEIVED BY VINTAGE
Note: Vintage refers to the origination year.
1
2
3
4
5
6
New
notices
of
default
have
declined
from
their
peaks
for
2005,
2006,
2007
and
2008
vintages.
The 2008, 2009 and 2010 vintages are exhibiting fewer new notices of default than previous
vintages.
2007
2006
2008
2005
2009
2010 |
 16
*
*
*
*
*
*
*
*
*
*
*
*
*
*
*
*
*
*
*
*
*
*
*
*
*
*
*
* |
 17
Note: Due to reporting lags from servicers, cures are understated.
Excludes rescissions and claim denials.
(1)
Other workouts includes forbearance plans and other retention workouts.
29,057
26,349
14,139
(1)
23,375
5,141
4,645
2-3 Payments
in Default
4-11 Payments
in Default
12 Payments
or more in Default
Organic cures, as a percentage of total cures, increased in the 2-3 and 4-11
payments in default categories in 1H 2011, while remaining essentially flat in the
12 payments or more default category.
CURES |
 18
*
*
*
*
*
*
*
*
*
*
*
*
*
*
*
*
*
*
*
*
*
*
*
*
*
*
*
* |
 19
2011
2012
2013
TOTAL INTEREST RATE ADJUSTMENTS AS A PERCENTAGE OF PRIMARY RISK IN FORCE:
0.053%
0.004%
0.004%
U.S. PORTFOLIO INTEREST RATE ADJUSTMENTS |
 20
(1)
Condominium includes Townhouses and Cooperatives.
(2)
Excludes unreported FICO scores.
(3)
At origination.
% of
CA RIF
CA % of
Total RIF
CA % of
Total RIF
% of
CA RIF
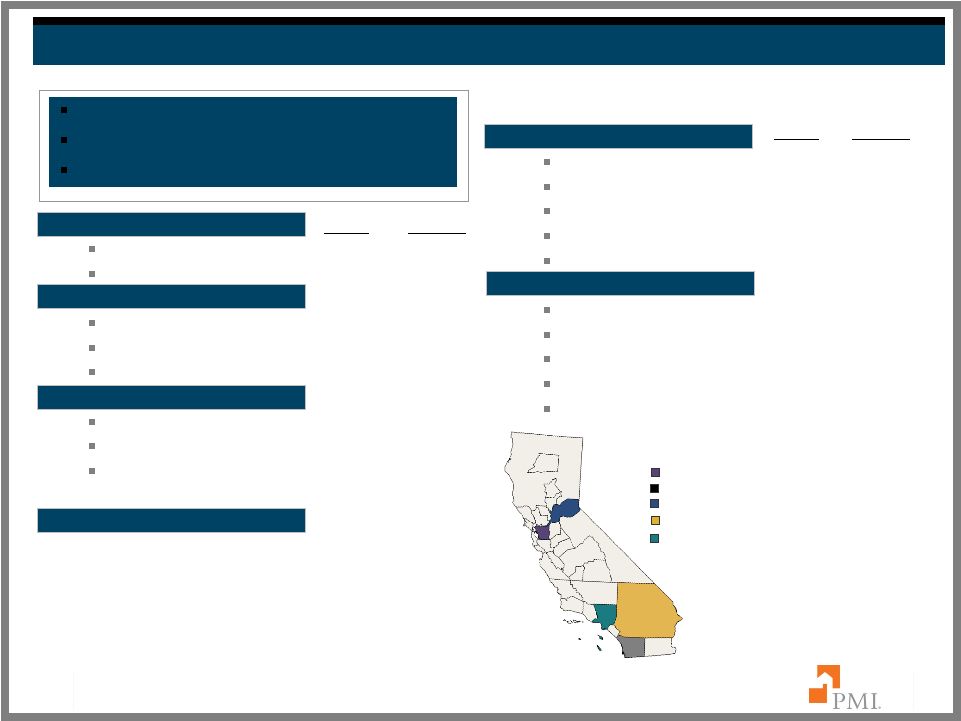
CALIFORNIA AT JUNE 30, 2011
$1.7 BILLION OF TOTAL RISK IN FORCE
7.4% OF PMI’S PRIMARY RISK IN FORCE
$287,127 AVERAGE LOAN SIZE
MSA Distribution of Total Primary RIF
Oakland-Fremont-Hayward, CA–
0.4%
San Diego-Carlsbad-San Marcos –
0.6%
Sacramento--Arden-Arcade—Roseville –
0.7%
Riverside-San Bernardino-Ontario –
1.3%
Los Angeles-Long Beach-Glendale –
1.5%
Note: Due to rounding, the sum of percentages may not total 100%.
LOAN TYPE
Fixed Rate
83.2%
6.1%
ARM
16.8%
1.2%
PROPERTY TYPE
(1)
Single Family
81.0%
6.0%
Condominium
16.0%
1.2%
Multi-Family and other
3.0%
0.2%
OCCUPANCY
Primary Residence
94.4%
6.9%
Second Home
2.6%
0.2%
Non-owner occupied
3.0%
0.2%
ALT-A
24.2%
1.8%
FICO SCORES
(2)
720 and above
47.1%
3.5%
680-719
25.2%
1.9%
620-679
24.8%
1.8%
575-619
2.2%
0.2%
Less than 575
0.6%
0.0%
LOAN TO VALUE
(3)
Above 97.00%
11.4%
0.8%
95.01% to 97.00%
2.1%
0.2%
90.01% to 95.00%
20.4%
1.5%
85.01% to 90.00%
53.3%
3.9%
85.00% and below
12.8%
0.9% |
 FLORIDA AT
JUNE 30, 2011 21
% of
FL RIF
FL % of
Total RIF
% of
FL RIF
FL % of
Total RIF
$2.2 BILLION OF TOTAL RISK IN FORCE
9.4% OF PMI’S PRIMARY RISK IN FORCE
$170,957 AVERAGE LOAN SIZE
Note: Due to rounding, the sum of percentages may not total 100%.
Tampa-St. Petersburg-Clearwater, FL–
1.4%
MSA Distribution of Total Primary RIF
Jacksonville, FL–
0.7%
Fort Lauderdale-Deerfield Beach, FL–
1.0%
Miami-Miami Beach-Kendall, FL–
1.5%
Orlando-Kissimmee, FL–
1.4%
(1)
Condominium includes Townhouses and Cooperatives.
(2)
Excludes unreported FICO scores.
(3)
At origination.
LOAN TYPE
Fixed Rate
85.8%
8.0%
ARM
14.2%
1.3%
PROPERTY TYPE
(1)
Single Family
73.2%
6.8%
Condominium
25.0%
2.3%
Multi-Family and other
1.8%
0.2%
OCCUPANCY
Primary Residence
81.6%
7.6%
Second Home
11.0%
1.0%
Non-owner occupied
7.4%
0.7%
ALT-A
30.6%
2.9%
FICO SCORES
(2)
720 and above
36.6%
3.4%
680-719
26.8%
2.5%
620-679
30.7%
2.9%
575-619
4.3%
0.4%
Less than 575
1.3%
0.1%
LOAN TO VALUE
(3)
Above 97.00%
20.0%
1.9%
95.01% to 97.00%
2.9%
0.3%
90.01% to 95.00%
29.5%
2.8%
85.01% to 90.00%
41.0%
3.8%
85.00% and below
6.6%
0.6% |
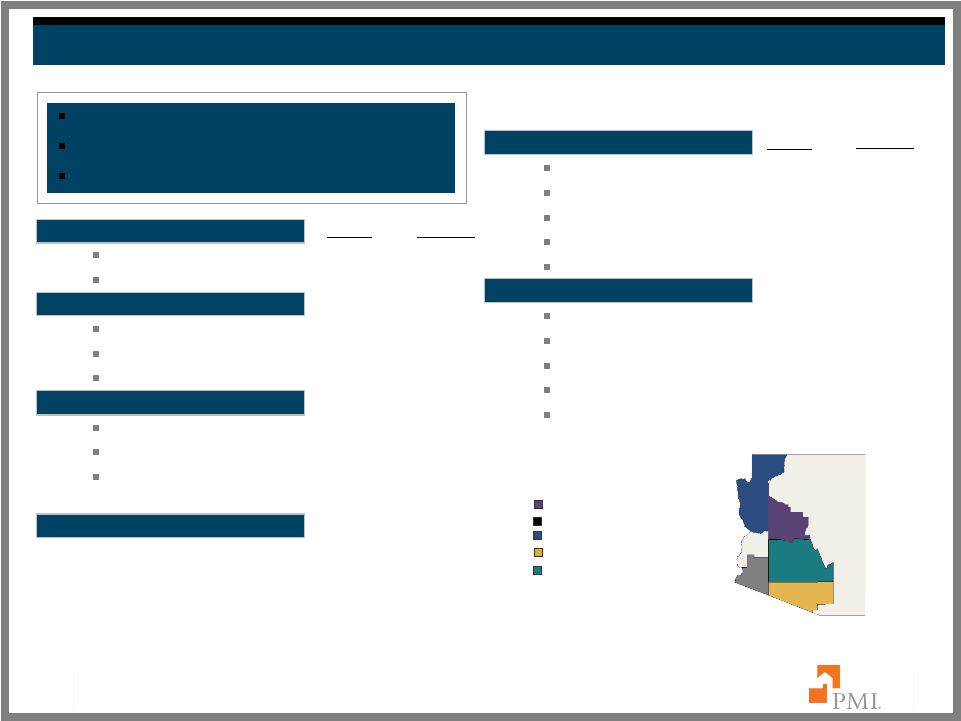 ARIZONA AT
JUNE 30, 2011 22
% of AZ % of
AZ RIF
Total RIF
% of
AZ RIF
AZ % of
Total RIF
$0.6 BILLION OF TOTAL RISK IN FORCE
2.3% OF PMI’S PRIMARY RISK IN FORCE
$181,716 AVERAGE LOAN SIZE
Lake Havasu City-Kingman, AZ-0.1%
Prescott, AZ –
0.1%
Yuma, AZ-0.1%
Tucson, AZ-0.4%
Phoenix-Mesa, AZ –
1.6%
MSA Distribution of Total Primary RIF
Note: Due to rounding, the sum of percentages may not total 100%.
(1)
Condominium includes Townhouses and Cooperatives.
(2)
Excludes unreported FICO scores.
(3)
At origination.
LOAN TYPE
Fixed Rate
91.5% 2.1%
ARM
8.5%
0.2%
PROPERTY TYPE
(1)
Single Family
85.7% 2.0%
Condominium
11.3%
0.3%
Multi-Family and other
3.0%
0.1%
OCCUPANCY
Primary Residence
87.6% 2.0%
Second Home
7.9%
0.2%
Non-owner occupied
4.4%
0.1%
ALT-A
17.6%
0.4%
FICO SCORES
(2)
720 and above
40.8%
1.0%
680-719
25.6%
0.6%
620-679
27.8%
0.6%
575-619
3.7%
0.1%
Less than 575
0.9%
0.0%
LOAN TO VALUE
(
3)
Above 97.00%
95.01% to 97.00%
2.7%
0.1%
90.01% to 95.00%
24.2%
0.6%
85.01% to 90.00%
41.0%
1.0%
85.00% and below
7.2%
0.2%
24.9%
0.6% |
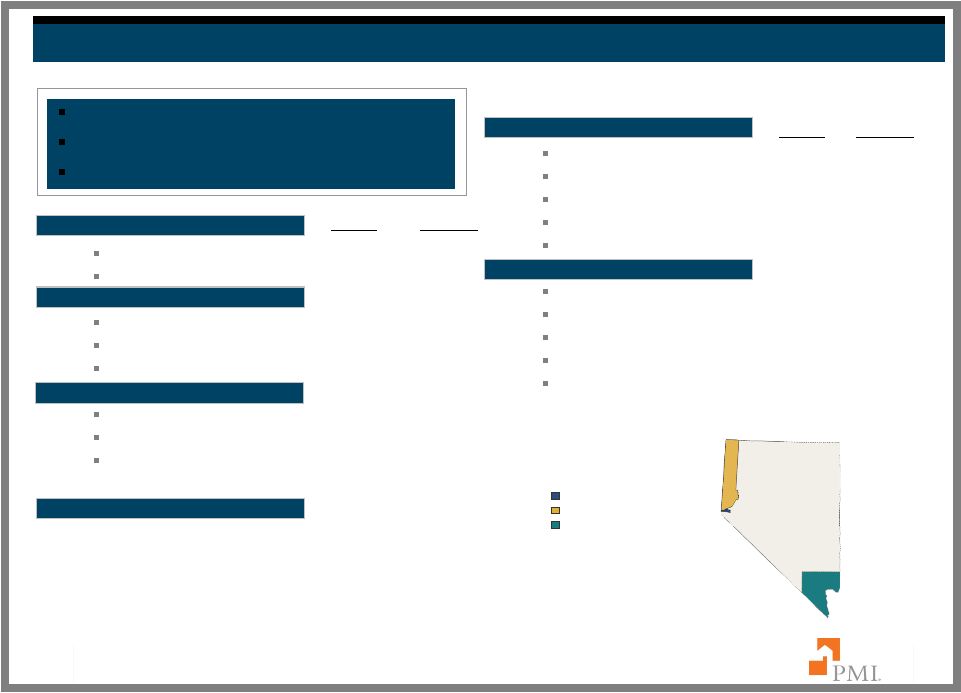 NEVADA AT
JUNE 30, 2011 23
% of NV % of
NV RIF
Total RIF
% of
NV RIF
NV % of
Total RIF
$0.3 BILLION OF TOTAL RISK IN FORCE
1.4% OF PMI’S PRIMARY RISK IN FORCE
$223,124 AVERAGE LOAN SIZE
Note: Due to rounding, the sum of percentages may not total 100%.
Las Vegas-Paradise, NV-1.1%
Reno-Sparks, NV-0.2%
Carson City, NV-0.01%
MSA Distribution of Total Primary RIF
(1)
Condominium includes Townhouses and Cooperatives.
(2)
Excludes unreported FICO scores.
(3)
At origination.
LOAN TYPE
Fixed Rate
84.5% 1.2%
ARM
15.5%
0.2%
PROPERTY TYPE
(1)
Single Family
80.0% 1.1%
Condominium
18.4%
0.3%
Multi-Family and other
1.6%
0.0%
OCCUPANCY
Primary Residence
84.2% 1.2%
Second Home
11.3%
0.2%
Non-owner occupied
4.5%
0.1%
ALT-A
25.5%
0.4%
FICO SCORES
(2)
720 and above
41.6%
0.6%
680-719
27.0%
0.4%
620-679
28.2%
0.4%
575-619
2.4%
0.0%
Less than 575
0.4%
0.0%
LOAN TO VALUE
(3)
Above 97.00%
17.0%
0.2%
95.01% to 97.00%
1.7%
0.0%
90.01% to 95.00%
26.7%
0.4%
85.01% to 90.00%
47.0%
0.7%
85.00% and below
7.6%
0.1% |
 ALT-A
AT JUNE 30, 2011 24
% of
Alt-A RIF
Alt-A % of
Total RIF
Alt-A % of
Total RIF
$3.5 BILLION OF TOTAL RISK IN FORCE
14.7% OF PMI’S PRIMARY RISK IN FORCE
$201,437 AVERAGE LOAN SIZE
GUIDELINE CHANGES
% of
Alt-A RIF
Note: Due to rounding, the sum of percentages may not total 100%.
(1)
Condominium includes Townhouses and Cooperatives.
(2)
Excludes unreported FICO scores.
(3)
At origination.
State Distribution of Alt-A RIF
0.00% to 1.00%
1.00% to 2.00%
2.00% to 5.00%
5.00% to 10.00%
>10.00%
With the exception of previously issued
commitments, effective June 1, 2008, PMI no
longer insures Alt-A
LOAN TYPE
Fixed Rate
78.8% 11.6%
ARM
21.2%
3.1%
PROPERTY TYPE
(1)
Single Family
77.9% 11.4%
Condominium
14.8%
2.2%
Multi-Family and other
7.3%
1.1%
OCCUPANCY
Primary Residence
83.0% 12.2%
Second Home
6.2%
0.9%
Non-owner occupied
10.7%
1.6%
FICO SCORES
(2)
720 and above
37.5%
5.5%
680-719
35.4%
5.2%
620-679
27.1%
4.0%
LOAN TO VALUE
(3)
Above 97.00%
12.0%
1.8%
95.01% to 97.00%
0.2%
0.0%
90.01% to 95.00%
27.7%
4.1%
85.01% to 90.00%
50.5%
7.4%
85.00% and below
9.6%
1.4% |
 25
*
*
*
*
*
*
*
*
*
*
*
*
*
*
*
*
*
*
*
*
* |
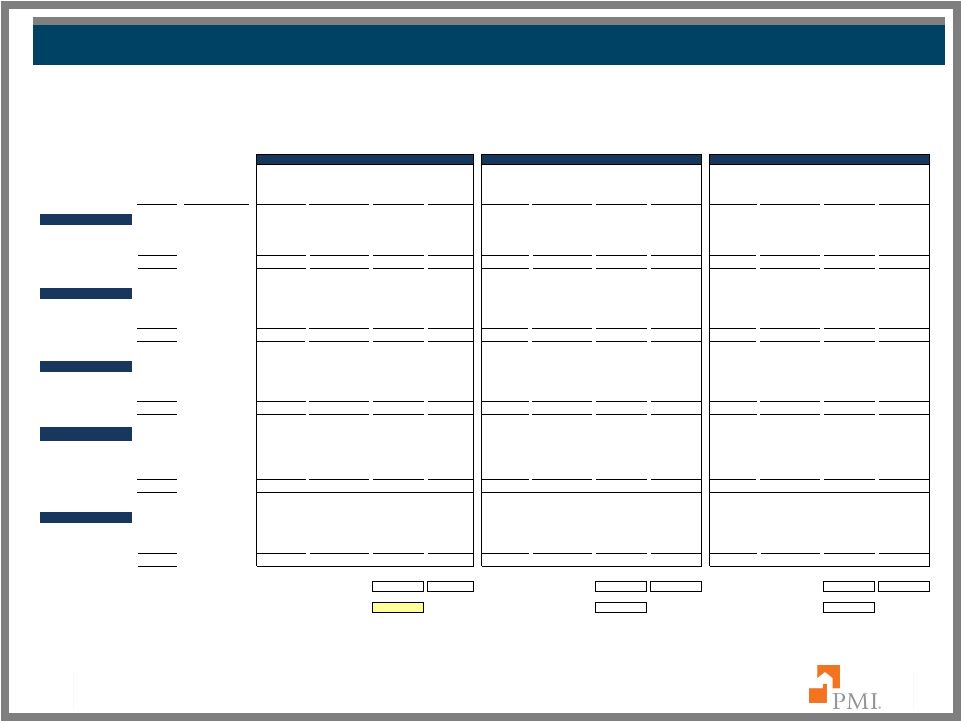
 RISK
CHARACTERISTICS: TOTAL PRIMARY PORTFOLIO Risk in Force (dollars in millions).
Default Rate (as measured by policies).
TOTAL PRIMARY RISK IN FORCE AS OF JUNE 30, 2011
Total Primary Portfolio:
PMI’s total primary book is primarily driven by the flow channel.
Loans are primarily fixed rate and owner occupied with FICO scores greater than 620.
Certain geographies and select products have exhibited heightened levels of
defaults. 26 |
 PORTFOLIO
CHARACTERISTICS – PRIMARY RIF AS OF JUNE 30, 2011
27
(1)
Excludes unreported FICO scores.
(2 )
At origination.
Note: Categories are not mutually exclusive except for Credit Score and Loan
Type. Vintage refers to the year that the insurance was issued. All $ in
Millions CREDIT SCORE
(1)
LOAN TYPE
Total
Less than 575
575 - 619
620 - 679
680 - 719
720 and above
Fixed Rate
ARM
2/28s
Total Portfolio
$23,744.0
$396.3
$1,128.2
$6,503.5
$5,660.8
$9,911.2
$21,933.6
$1,499.1
$311.3
Default Rate
19.4%
40.2%
33.4%
26.6%
19.5%
10.4%
17.9%
40.9%
50.8%
2011 Vintage
$700.1
$0.0
$0.0
$2.3
$122.7
$573.6
$699.4
$0.7
$0.0
Default Rate
0.0%
NA
NA
0.0%
0.0%
0.0%
0.0%
0.0%
NA
2010 Vintage
$1,445.6
$0.1
$0.0
$0.8
$240.6
$1,203.5
$1,444.6
$1.0
$0.0
Default Rate
0.2%
0.0%
NA
0.0%
0.5%
0.1%
0.2%
0.0%
NA
2009 Vintage
$1,518.4
$0.2
$0.2
$56.9
$272.9
$1,185.6
$1,514.8
$3.5
$0.0
Default Rate
1.9%
0.0%
0.0%
9.7%
3.3%
1.2%
1.8%
12.5%
NA
2008 Vintage
$3,356.0
$4.4
$40.1
$629.4
$888.4
$1,790.4
$3,314.9
$41.1
$0.0
Default Rate
13.2%
49.2%
34.9%
22.1%
14.6%
8.4%
13.1%
28.8%
NA
2007 Vintage
$6,181.5
$152.9
$423.0
$1,964.7
$1,565.0
$2,060.1
$5,795.0
$355.7
$30.8
Default Rate
27.8%
46.0%
38.2%
31.1%
27.0%
19.3%
27.1%
38.0%
52.6%
2006 Vintage
$3,333.9
$45.5
$153.9
$1,209.0
$861.6
$1,046.9
$2,753.7
$424.4
$155.8
Default Rate
28.6%
46.1%
37.1%
32.8%
28.9%
20.5%
25.2%
51.5%
54.3%
2005 Vintage
$2,712.4
$38.6
$126.0
$1,010.0
$691.6
$824.8
$2,220.7
$392.3
$99.3
Default Rate
23.8%
40.5%
32.9%
28.3%
24.0%
15.7%
20.1%
46.2%
52.3%
2004 Vintage and Prior
$4,496.1
$154.6
$385.0
$1,630.4
$1,018.0
$1,226.3
$4,190.3
$280.3
$25.4
Default Rate
17.2%
34.1%
28.2%
20.5%
14.6%
9.0%
16.3%
31.0%
36.0%
All $ in Millions, except for Average Loan Size
SPECIFIC PORTFOLIO CHARACTERISTICS
Interest Only
LTV > 97%
Alt-A
California
Florida
Auto States
Avg Loan Size
Avg LTV
(2)
Avg FICO
Total Portfolio
$2,224.2
$4,520.2
$3,485.8
$1,746.1
$2,222.2
$3,212.0
$162,370
93%
699
Default Rate
39.0%
24.9%
38.8%
26.6%
40.0%
19.9%
2011 Vintage
$0.0
$0.0
$0.0
$67.0
$9.0
$79.5
$224,423
91%
756
Default Rate
NA
NA
NA
0.0%
0.6%
0.0%
2010 Vintage
$0.0
$0.0
$0.0
$103.8
$16.4
$173.8
$217,846
90%
758
Default Rate
0.0%
NA
NA
0.2%
0.6%
0.2%
2009 Vintage
$2.4
$0.0
$1.9
$49.8
$30.6
$179.5
$208,175
90%
750
Default Rate
3.1%
0.0%
47.4%
1.2%
4.0%
1.9%
2008 Vintage
$182.5
$205.1
$164.3
$345.1
$177.5
$413.6
$199,826
91%
721
Default Rate
22.9%
21.9%
32.4%
15.3%
29.3%
14.1%
2007 Vintage
$1,096.1
$2,121.8
$1,410.8
$549.9
$686.2
$706.3
$182,628
94%
686
Default Rate
40.8%
29.0%
41.6%
39.0%
50.3%
26.5%
2006 Vintage
$557.7
$897.8
$994.1
$245.8
$495.7
$452.0
$167,310
93%
690
Default Rate
41.0%
25.4%
43.3%
50.9%
55.7%
25.6%
2005 Vintage
$322.0
$539.4
$541.3
$208.1
$399.6
$418.6
$150,934
92%
691
Default Rate
40.2%
22.3%
40.0%
44.9%
44.6%
22.1%
2004 Vintage and Prior
$63.6
$756.0
$373.5
$176.6
$407.3
$788.8
$106,455
93%
681
Default Rate
32.7%
17.9%
25.3%
15.7%
23.6%
20.8% |
 $19,835
$5,073
$5,542
$9,138
$20,972
$855
$3,709
$2,749
$1,452
$1,929
$1,136
$1,761
$231
$0
$2,836
41.9%
25.5%
19.0%
10.1%
18.3%
33.5%
39.0%
25.4%
39.4%
24.6%
40.0%
17.4%
18.7%
44.1%
Total
720 and
above
680 -
719
620 -
679
575 -
619
Less
than 575
Fixed
Rate
ARMs
2/28s
Interest
Only
LTV>97
Alt-A
Calif.
Florida
Auto
States
CREDIT SCORE
LOAN TYPE
RISK CHARACTERISTICS
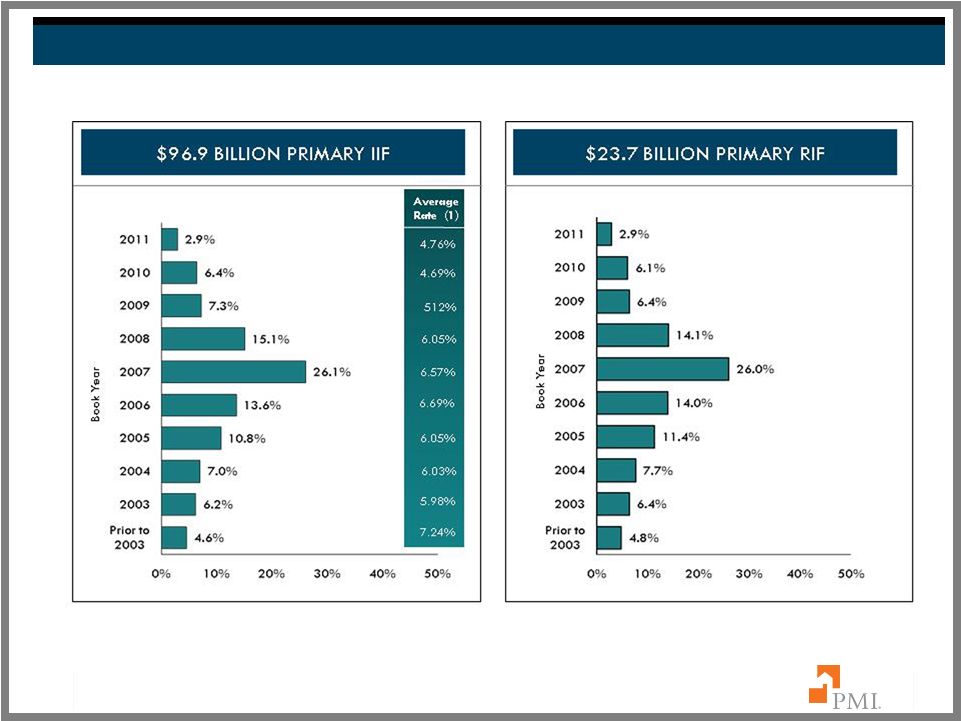
RISK CHARACTERISTICS: FLOW
28
TOTAL
Primary Flow Portfolio:
PMI’s primary flow book represents 88% of primary risk in force and is primarily
owner occupied, fixed rate loans with FICO scores greater than 620.
Approximately 94% of flow risk in force is within conforming loan limits.
Approximately 39% of flow risk in force is in captive reinsurance agreements.
FLOW RISK IN FORCE AS OF JUNE 30, 2011
Risk in Force (dollars in millions).
Default Rate (as measured by policies). |
 PORTFOLIO
CHARACTERISTICS – FLOW RIF AS OF JUNE 30, 2011
29
(1)
Excludes unreported FICO scores.
(2 )
At origination.
Note: Categories are not mutually exclusive except for Credit Score and Loan
Type. Vintage refers to the year that the insurance was issued. All $ in
Millions, except for Average Loan Size CREDIT SCORE
(1)
LOAN TYPE
Total
Less than 575
575 - 619
620 - 679
680 - 719
720 and above
Fixed Rate
ARM
2/28s
CREDIT SCORE
(1)
CREDIT SCORE
(1)
CREDIT SCORE
(1)
CREDIT SCORE
(1)
CREDIT SCORE
(1)
Total Portfolio
$20,971.5
$230.5
$855.1
$5,542.3
$5,072.9
$9,137.6
$19,835.1
$1,136.4
n/a
Default Rate
18.3%
44.1%
33.5%
25.5%
19.0%
10.1%
17.4%
41.9%
n/a
2011 Vintage
$700.1
$0.0
$0.0
$2.3
$122.7
$573.6
$699.4
$0.7
n/a
Default Rate
0.0%
NA
NA
0.0%
0.0%
0.0%
0.0%
0.0%
n/a
2010 Vintage
$1,445.6
$0.1
$0.0
$0.8
$240.6
$1,203.5
$1,444.6
$1.0
n/a
Default Rate
0.2%
0.0%
NA
0.0%
0.5%
0.1%
0.2%
0.0%
n/a
2009 Vintage
$1,518.3
$0.2
$0.2
$56.9
$272.9
$1,185.6
$1,514.7
$3.5
n/a
Default Rate
1.9%
0.0%
0.0%
9.7%
3.3%
1.2%
1.8%
12.5%
n/a
2008 Vintage
$3,309.6
$3.6
$38.1
$616.2
$876.1
$1,772.2
$3,273.6
$36.0
n/a
Default Rate
13.2%
48.9%
34.3%
22.0%
14.7%
8.5%
13.0%
31.1%
n/a
2007 Vintage
$5,135.3
$105.7
$340.6
$1,693.3
$1,329.2
$1,650.6
$4,913.9
$221.4
n/a
Default Rate
28.7%
53.1%
39.8%
31.4%
28.1%
20.8%
28.1%
48.3%
n/a
2006 Vintage
$2,520.8
$19.2
$106.1
$869.3
$676.4
$832.8
$2,190.2
$330.6
n/a
Default Rate
27.1%
49.6%
35.4%
30.2%
28.3%
20.5%
24.7%
54.7%
n/a
2005 Vintage
$2,334.3
$16.9
$89.8
$834.2
$608.9
$763.1
$2,020.2
$314.1
n/a
Default Rate
22.2%
41.5%
30.3%
25.8%
23.0%
15.6%
19.8%
44.1%
n/a
2004 Vintage and Prior
$4,007.5
$84.7
$280.3
$1,469.4
$946.0
$1,156.3
$3,778.4
$229.1
n/a
Default Rate
16.7%
35.8%
28.1%
20.4%
14.7%
9.1%
16.1%
28.1%
n/a
SPECIFIC PORTFOLIO CHARACTERISTICS
Interest Only
LTV > 97%
Alt-A
California
Florida
Auto States
Avg Loan Size
Avg LTV
(2)
Avg FICO
Total Portfolio
$1,760.7
$3,709.2
$2,749.4
$1,451.6
$1,928.5
$2,836.4
$163,281
93%
703
Default Rate
39.0%
25.4%
39.4%
24.6%
40.0%
18.7%
2011 Vintage
$0.0
$0.0
$0.0
$67.0
$9.0
$79.5
$224,423
91%
756
Default Rate
NA
NA
NA
0.0%
0.6%
0.0%
2010 Vintage
$0.0
$0.0
$0.0
$103.8
$16.4
$173.8
$217,846
90%
758
Default Rate
0.0%
NA
NA
0.2%
0.6%
0.2%
2009 Vintage
$2.4
$0.0
$1.9
$49.8
$30.6
$179.5
$208,177
90%
750
Default Rate
3.1%
0.0%
47.4%
1.2%
4.0%
1.9%
2008 Vintage
$181.7
$187.9
$163.0
$343.9
$175.9
$409.7
$199,907
91%
721
Default Rate
23.0%
22.2%
32.7%
15.3%
29.1%
13.9%
2007 Vintage
$949.6
$1,794.8
$1,221.8
$463.2
$562.5
$593.9
$183,482
94%
688
Default Rate
42.3%
29.9%
42.9%
40.8%
53.4%
26.5%
2006 Vintage
$347.7
$682.5
$633.9
$142.5
$401.1
$334.3
$166,581
93%
694
Default Rate
42.9%
25.3%
46.5%
51.2%
55.6%
23.6%
2005 Vintage
$223.2
$481.2
$419.4
$133.3
$370.9
$350.4
$149,565
93%
695
Default Rate
35.4%
21.1%
38.5%
42.7%
43.9%
20.6%
2004 Vintage and Prior
$55.9
$562.9
$309.4
$148.1
$362.1
$715.3
$106,338
93%
687
Default Rate
30.2%
18.7%
25.1%
14.8%
23.8%
20.1% |
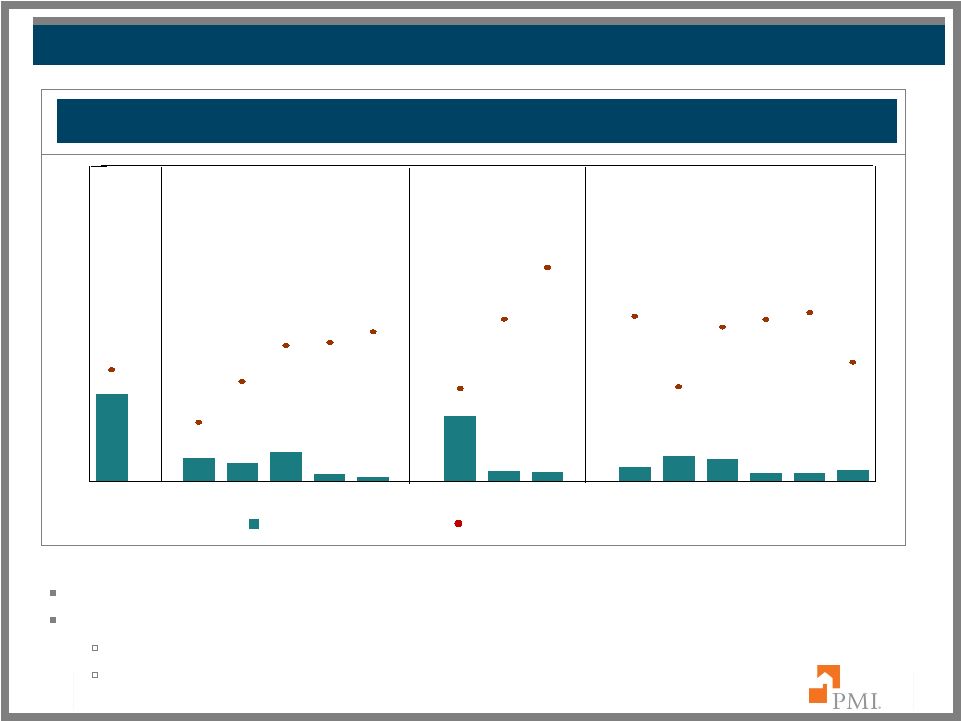 RISK
CHARACTERISTICS: STRUCTURED TRANSACTIONS 30
Primary Structured Portfolio:
PMI’s primary structured book represents approximately 12% of total primary risk in
force. Highest defaults are reported in the 2/28 hybrid ARMs product, in
which: All of the 2/28 hybrid ARM risk in force has passed the interest rate reset
date. Monthly reporting of notices of default began to decline in August 2007.
$376
$311
$166
$464
$363
$294
$295
$737
$811
$273
$2,773
$774
$961
$588
$2,099
35.6%
28.4%
22.1%
40.2%
38.5%
36.7%
22.6%
39.3%
50.8%
33.1%
26.6%
14.1%
23.8%
32.4%
38.6%
Total
720 and
above
680 -
719
620 -
679
575 -
619
Less
than 575
Fixed
Rate
ARMs
2/28s
Interest
Only
LTV>97
Alt-A
Calif.
Florida
Auto
States
CREDIT SCORE
LOAN TYPE
RISK CHARACTERISTICS
STRUCTURED TRANSACTIONS RISK IN FORCE AS OF JUNE 30, 2011
Risk in Force (dollars in millions).
Default Rate (as measured by policies). |
 31
(1)
Excludes unreported FICO scores.
(2 )
At origination.
Note: Categories are not mutually exclusive except for Credit Score and Loan
Type. Vintage refers to the year that the insurance was issued. |
 32
*
*
*
*
*
*
*
*
*
*
*
*
*
*
*
*
*
*
*
*
*
*
*
*
*
*
*
* |
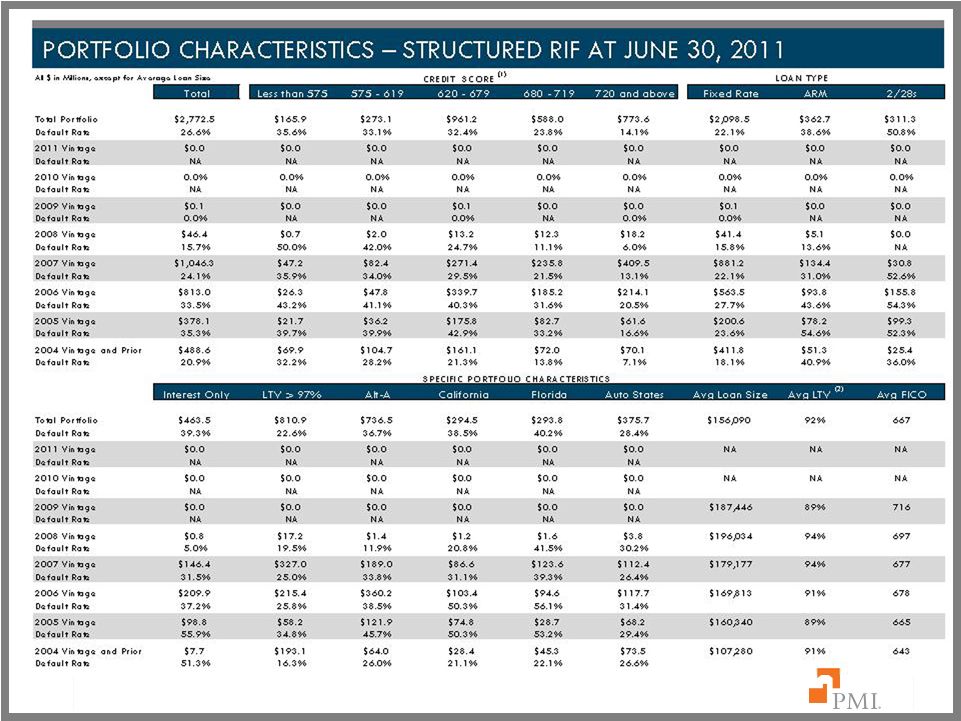
 MODIFIED
POOL PORTFOLIO CHARACTERISTICS AT JUNE 30, 2011 33
All $ in Millions
Modified Pool:
Data shown in this exhibit is an aggregation of unique pools by book years.
Remaining risk in force
(3)
for modified pool was approximately $328 million at June 30, 2011.
Modified Pool with Deductibles remaining risk in force
(3)
was approximately $80 million.
Modified Pool without Deductibles remaining risk in force
(3)
was approximately $248 million.
All $ in Millions
2004 and Prior
2005
2006
2007
2008 / 2009
Insurance in Force
$2,721
$167
$98
$926
n/a
Stop Loss Amount
$121
$24
$12
$44
n/a
Losses Applicable to Deductible
$29
$11
$2
$12
n/a
Deductible Balance
$28
$0
$0
$8
n/a
PMI's Claims Paid to Date
(1)
$0
$2
$1
$2
n/a
Reserves for Losses
(2)
$12
$7
$3
$4
n/a
Remaining Risk In Force
(3)
$53
$3
$6
$19
n/a
2004 and Prior
2005
2006
2007
2008 / 2009
Insurance in Force
$1,225
$549
$3,123
n/a
n/a
Stop Loss Amount
$208
$25
$305
n/a
n/a
PMI's Claims Paid to Date
(1)
$40
$10
$99
n/a
n/a
Reserves for Losses
(2)
$23
$10
$39
n/a
n/a
Remaining Risk In Force
(3)
$76
$5
$167
n/a
n/a
(1)
PMI’s claims paid to date relates to the modified pool contracts in force as of June
30, 2011 and therefore excludes any payments made as part of restructurings.
(2)
Established loss reserves for non-performing (i.e. delinquent) modified pool loans,
which represents PMI’s estimate of losses for those loans at June 30, 2011.
(3)
Remaining risk in force excludes non-performing risk exposures, for which loss
reserves have been established. |
 2/28S
MODIFIED POOL PORTFOLIO CHARACTERISTICS AT JUNE 30, 2011
34
(1)
Excludes unreported FICO scores.
(2)
Excludes Balloon, Buy Down, and Other.
(3)
At origination.
Note: PMI did not insure any modified pool contracts with deductibles in 2008 or
2009 and did not insure any modified pool contracts without deductibles in 2007, 2008 or 2009.
Categories are not mutually exclusive except for Credit Score and Loan Type. Vintage
refers to the year that the insurance was issued. All $ in Millions, except for
Average Loan Size Modified Pool Portfolio Insurance in Force
DEDUCTIBLE
Total
Less than 575
575 - 619
620 - 679
680 - 719
720 and above
Fixed Rate
ARM
2/28s
Total Portfolio
$3,913
$163
$330
$1,074
$795
$1,549
$3,487
$425
$0
2008 Vintage
$0
$0
$0
$0
$0
$0
$0
$0
$0
2007 Vintage
$926
$100
$220
$388
$156
$61
$586
$340
$0
2006 Vintage
$98
$32
$35
$28
$3
$0
$98
$0
$0
2005 Vintage
$167
$0
$0
$58
$43
$66
$105
$62
$0
2004 Vintage and Prior
$2,721
$31
$75
$601
$592
$1,422
$2,698
$23
$0
Interest Only
LTV > 97%
Alt-A
California
Florida
Auto States
Avg Loan Size
Avg LTV
(3)
Avg FICO
Total Portfolio
$93
$515
$1,257
$541
$258
$524
$129,131
74
703
2008 Vintage
$0
$0
$0
$0
$0
$0
$0
0
0
2007 Vintage
$0
$502
$0
$93
$74
$118
$171,774
95
639
2006 Vintage
$0
$12
$0
$5
$9
$13
$140,334
82
595
2005 Vintage
$0
$0
$135
$30
$20
$15
$179,717
77
706
2004 Vintage and Prior
$93
$1
$1,122
$414
$155
$378
$116,899
69
722
Avg LTV
(2)
NON DEDUCTIBLE
Total
Less than 575
575 - 619
620 - 679
680 - 719
720 and above
Fixed Rate
ARM
2/28s
Total Portfolio
$4,897
$269
$597
$1,879
$1,122
$882
$2,827
$2,068
$0
2006 Vintage
$3,123
$268
$582
$1,397
$604
$273
$1,126
$1,997
$0
2005 Vintage
$549
$0
$4
$134
$174
$226
$544
$5
$0
2004 Vintage and Prior
$1,225
$2
$12
$348
$344
$383
$1,156
$66
$0
Interest Only
LTV > 97%
Alt-A
California
Florida
Auto States
Avg Loan Size
Avg LTV
(3)
Avg FICO
Total Portfolio
$280
$1,162
$1,460
$750
$441
$620
$146,552
87
667
2006 Vintage
$95
$1,160
$133
$337
$323
$521
$147,637
94
647
2005 Vintage
$61
$0
$429
$143
$26
$24
$186,213
73
713
2004 Vintage and Prior
$123
$2
$898
$270
$92
$75
$131,526
76
703
SPECIFIC PORTFOLIO CHARACTERISTICS
CREDIT SCORES
(1)
LOAN TYPE
(2)
SPECIFIC PORTFOLIO CHARACTERISTICS
CREDIT SCORES
(1)
LOAN TYPE
(2) |
 35
*
*
*
*
*
*
*
*
*
*
*
*
*
*
*
*
*
*
*
*
*
*
*
*
*
*
*
* |
 Captive
reinsurers are wholly-owned, bankruptcy remote subsidiaries of originators that provide mezzanine level reinsurance for loans for
which PMI has provided primary mortgage insurance coverage.
PMI is the named beneficiary on captive trust balances totaling approximately $635 million
as of June 30, 2011. At June 30, 2011, approximately 39% of flow risk in force was
covered by captive reinsurance agreements, including: Based on current expectations
of defaults, PMI forecasts the following approximate reductions to total incurred losses as a result of captive
reinsurance agreements in 2011 and 2012:
PMI’S CAPTIVE REINSURANCE AGREEMENTS
FLOW RISK IN FORCE COVERED BY CAPTIVES
~ 43% of prime
~ 45% of Alt-A
~ 51% of less-than-A quality
~ 50% of LTVs >97%*
36
*
Captive coverage for LTVs greater than 97% may overlap with other listed
categories. BENEFIT FROM CAPTIVE REINSURANCE AGREEMENTS
(Dollars in Millions)
Actual
Projected
$60
$122
$137
$350
$491
$34
2007
2008
2009
2010
2011
2012 |
 PMI’S
CAPTIVE REINSURANCE AGREEMENTS 37
Note: Due to rounding, the totals may not equal the sum of each category.
Note:
For
the
combined
captive
trust
arrangements,
the
weighted
average
entry
point
is
4.04%
and
the
weighted
average
exit
point
is
11.73%.
Original RIF has been recalculated for the impact of rescissions.
The cumulative captive benefit on this page is for excess-of-loss (XOL) captive
reinsurance agreements only. PMI MORTGAGE INSURANCE CO.
CAPTIVE REINSURANCE AGREEMENTS ATTACHMENT ANALYSIS
(Dollars in millions)
Original
Progression to
Book Year
RIF
Attachment Point
2004 & Prior Total
$10,004
0 - 50%
$226
$148.1
$373
$155.9
$645
$183.1
5,892
50 - 75%
383
156.3
672
196.1
605
165.0
2,399
75 - 99%
262
76.0
432
98.3
336
70.0
8,608
Attached
1,210
409.0
974
290.7
1,251
308.4
$26,904
$2,082
$789.4
$94.9
$10.9
$2,450
$741.0
$65.6
$6.8
$2,838
$726.5
$59.6
$4.4
2005 Total
$11
0 - 50%
$3
$0.2
$7
$0.3
$8
$0.3
44
50 - 75%
22
1.5
19
1.0
21
0.8
0
75 - 99%
0
0.0
0
0.0
4
0.4
4,499
Attached
1,535
614.9
1,650
575.7
1,916
525.4
$4,554
$1,559
$616.6
$308.1
$205.2
$1,676
$577.0
$284.8
$179.8
$1,949
$526.9
$242.5
$125.6
2006 Total
$4
0 - 50%
$2
$0.1
$2
$0.1
$2
$0.1
27
50 - 75%
13
0.9
7
0.4
15
0.7
14
75 - 99%
6
0.6
14
1.1
12
0.9
3,271
Attached
1,449
646.7
1,567
619.9
1,892
558.6
$3,316
$1,469
$648.4
$258.8
$205.5
$1,589
$621.6
$273.1
$191.0
$1,921
$560.3
$246.1
$124.1
2007 Total
$21
0 - 50%
$12
$0.3
$12
$0.1
$22
$0.6
9
50 - 75%
4
0.3
7
0.4
0
0.0
5
75 - 99%
2
0.2
0
0.0
7
0.4
4,822
Attached
2,755
894.3
3,025
789.8
3,653
756.1
$4,856
$2,774
$895.1
$337.9
$230.7
$3,045
$790.3
$317.6
$140.5
$3,681
$757.1
$327.1
$41.8
2008 Total
$84
0 - 50%
$48
$1.4
$43
$0.8
$123
$2.3
52
50 - 75%
6
0.5
143
6.3
167
6.8
263
75 - 99%
182
11.8
139
8.2
79
3.8
1,318
Attached
884
112.5
938
95.6
1,038
89.0
$1,717
$1,119
$126.2
$42.9
$2.3
$1,263
$110.9
$32.9
$0.5
$1,408
$101.9
$30.0
$0.0
Cumulative Captive Benefit (MM)
$1,042.6
$654.6
$974.0
$518.5
$905.3
$295.9
Total Captive Trust Balances (MM)
$634.7
$724.3
$900.2
Ever to Date
Incurred Losses
Paid Loss
Paid Loss
RIF
Incurred Loss
Captive
Current
Current
RIF
Captive
RIF
Incurred Losses
Benefit
Cumulative
June 30, 2011
Incurred Loss
Cumulative
Cumulative
Cumulative
Cumulative
Cumulative
December 31, 2010
June 30, 2010
Benefit
Benefit
Incurred Loss
Paid Loss
Captive
Captive
Incurred Losses
Ever to Date
Benefit
Captive
Benefit
Captive
Benefit
Current
Ever to Date |
 FORWARD-LOOKING STATEMENT
CAUTIONARY
STATEMENT:
Statements
in
this
portfolio
supplement
that
are
not
historical
facts,
or
that
relate
to
future
plans,
events
or
performance,
are
“forward-looking”
statements
within
the
meaning
of
the
Private
Securities
Litigation
Reform
Act
of
1995.
Such
forward-looking
statements
include
our
estimates
with
respect
to
the
future
benefits
of
captive
reinsurance.
There
can
be
no
assurance
that
we
will
realize
the
expected
future
benefits
from
our
captive
reinsurance
arrangements.
Readers
are
cautioned
that
forward-looking
statements
by
their
nature
involve
risk
and
uncertainty
because
they
relate
to
events
and
depend
on
circumstances
that
will
occur
in
the
future.
Many
factors
could
cause
actual
results
and
developments
to
differ
materially
from
those
expressed
or
implied
by
forward-looking
statements.
Other
risks
and
uncertainties
are
discussed
in
the
Cautionary
Statement
to
our
press
release
and
supplement
dated
August
4,
2011
regarding
our
Second
Quarter
2011
Financial
Results
and
in
our
SEC
filings,
including
in
Item
1A
of
our
Annual
Report
on
Form
10-K
for
the
year
ended
December
31,
2010
and
Item
1A
of
our
Quarterly
Report
on
Form
10-Q
for
the
quarters
ended
March
31
and
June
30,
2011.
We
undertake
no
obligation
to
update
forward-looking
statements.
38 |
 |