Attached files
| file | filename |
|---|---|
| 8-K - FORM 8-K - General Motors Co | d8k.htm |
| EX-99.1 - NEWS RELEASE DATED AUGUST 4, 2011 AND FINANCIAL STATEMENTS - General Motors Co | dex991.htm |
 General Motors Company
Q2 2011 Results
August 4, 2011
Exhibit 99.2 |
 Forward Looking Statements
1
In this presentation and in related comments by our management, our use of
the words “expect,” “anticipate,” “possible,” “potential,”
“target,” “believe,” “commit,” “intend,”
“continue,” “may,” “would,” “could,” “should,” “project,”
“projected,” “positioned” or similar expressions is intended to identify forward
looking statements that represent our current judgment about possible future
events. We believe these judgments are reasonable, but these statements
are not guarantees of any events or financial results, and our actual results
may differ materially due to a variety of important factors. Among other items,
such factors might include: our ability to realize production efficiencies and to
achieve reductions in costs as a result of our restructuring initiatives and
labor modifications; our ability to maintain quality control over our vehicles
and avoid material vehicle recalls; our suppliers’ ability to deliver parts,
systems and components at such times to allow us to meet production
schedules; our ability to maintain adequate liquidity and financing sources
and an appropriate level of debt, including as required to fund our planned
significant investment in new technology; our ability to realize successful
vehicle applications of new technology; and our ability to continue to attract
new customers, particularly for our new products. GM's most recent
annual report on Form 10-K and quarterly report on Form 10-Q provides information
about these and other factors, which we may revise or supplement in future reports to the SEC.
|
 Second Quarter 2011 Highlights
2
Q2 ‘11
F/(U) vs.
Q2 ‘10
Global Deliveries
2.3M
Net Revenue
$39.4B
EBIT -
Adj.
$3.0B
-
GMNA
$2.2B
-
GME
$0.1B
-
GMIO
$0.6B
-
GMSA
$0.1B
Auto Free Cash Flow
$3.8B |
 Q2
2010
Q2
2011
GAAP
Net Revenue ($B)
33.2
39.4
Operating Income ($B)
1.9
2.5
Net Income to Common Stockholders ($B)
1.3
2.5
EPS –
Diluted ($/Share)
0.85
1.54
Non-
GAAP
EBIT-
Adj. ($B)
2.0
3.0
Automotive Free Cash Flow ($B)
2.8
3.8
Summary of Q2 2011 Results
3
Note: Starting Q4 2010 EBIT-Adj. includes GM Financial on an Earnings Before
Tax (EBT) basis |
 Net
Income Impact of Special Items 4
Q2
2010
Q2
2011
Net Income to Common Stockholders ($B)
1.3
2.5
EPS –
Diluted ($/Share)
0.85
1.54
Special Items Included ($B):
None
-
-
Total Impact of Special Items:
Net Income to Common Stockholders ($B)
-
-
EPS –
Diluted ($/Share)
-
- |
 5
Info Item: Fully Diluted EPS Calculation
Q2
2010
Q1
2011
Q2
2011
Net income to stockholders ($B)
Cumulative dividend on Series A
Cumulative dividend on Series B
Undistributed earnings allocated to Series B
Net income to common ($B)
1.5
(0.2)
n/a
n/a
1.3
3.4
(0.2)
(0.1)
0.0
3.2
3.0
(0.2)
(0.1)
(0.3)
2.5
Add back Series B Preferred dividend
n/a
0.1
0.0
Net income to common –
diluted EPS calc. ($B)
1.3
3.2
2.5
Fully diluted share count (M)
Memo: Series B equivalents included
1,567
n/a
1,817
148
1,654
0
EPS –
Diluted ($/share)
0.85
1.77
1.54
Memo:
Average
stock
price
in
$33.00
-
$39.60
range
EPS calculation method
n/a
n/a
Y
If Converted
N
Two-Class
Note: Results may not foot due to rounding |
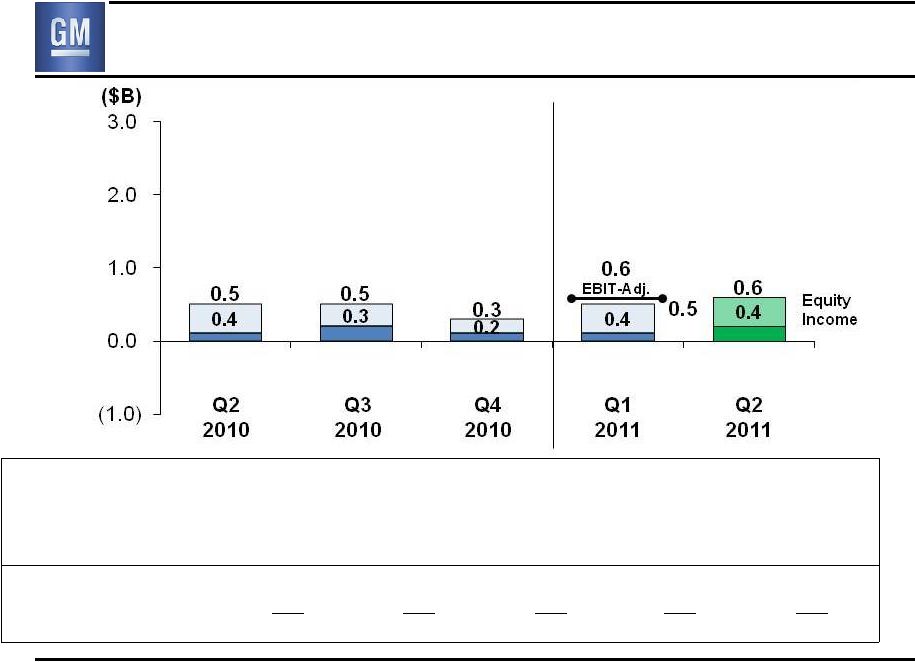
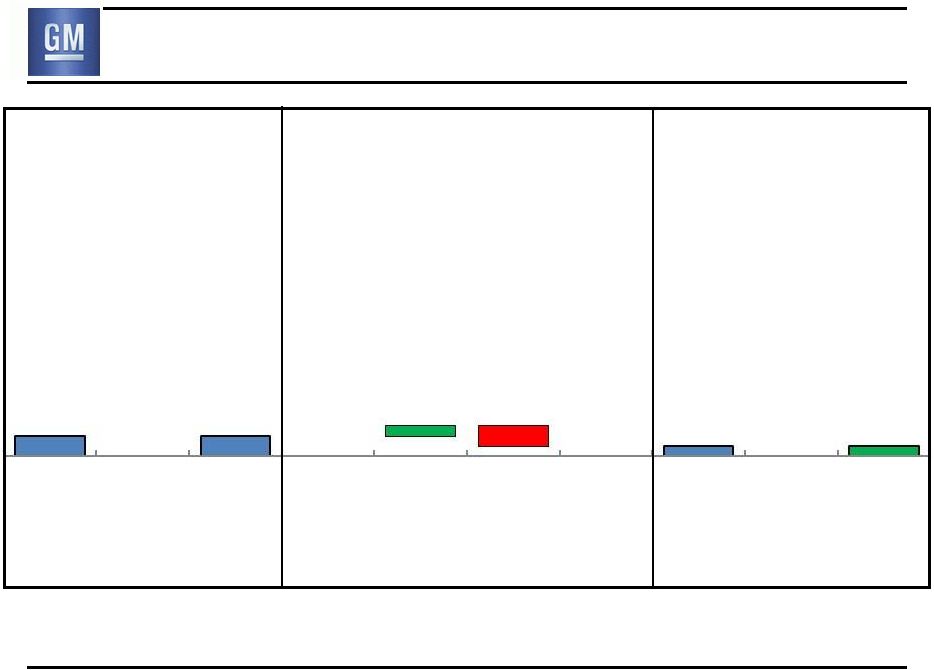
 Q2
Operating Income Walk to EBIT- Adj.
6
($B)
Q2
2010
Q2
2011
Operating Income
1.9
2.5
Equity Income
0.4
0.4
Non-Controlling Interests
(0.1)
0.0
Non-Operating Income
(0.2)
0.2
Earnings Before Interest & Taxes (EBIT)
2.0
3.0
Less Special Items
0.0
0.0
EBIT-
Adj.
2.0
3.0
Note: Results may not foot due to rounding
Note: Starting Q4 2010 EBIT & EBIT-Adj. include GM Financial on an Earnings
Before Tax (EBT) basis |
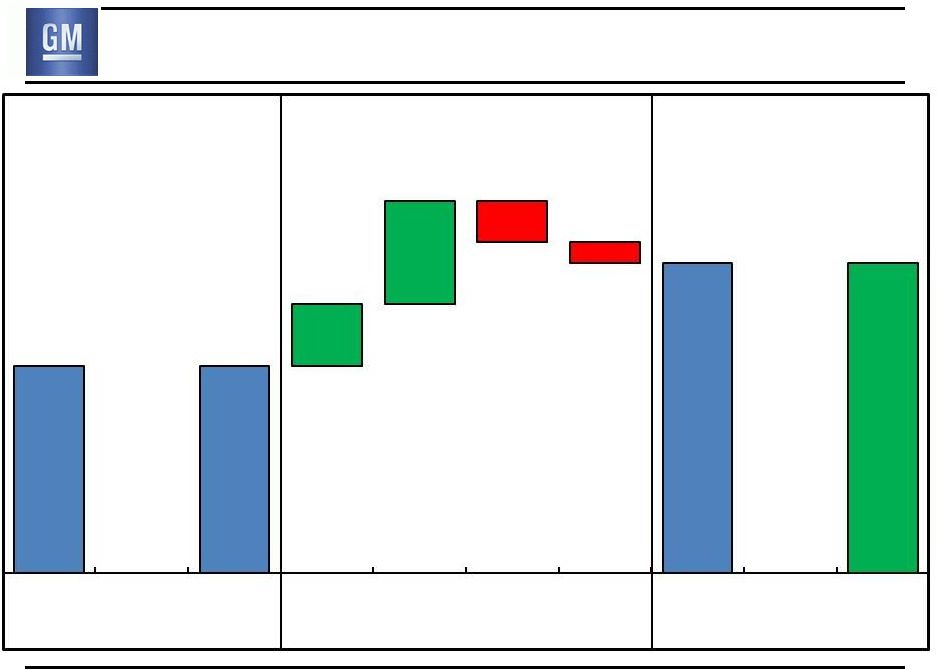
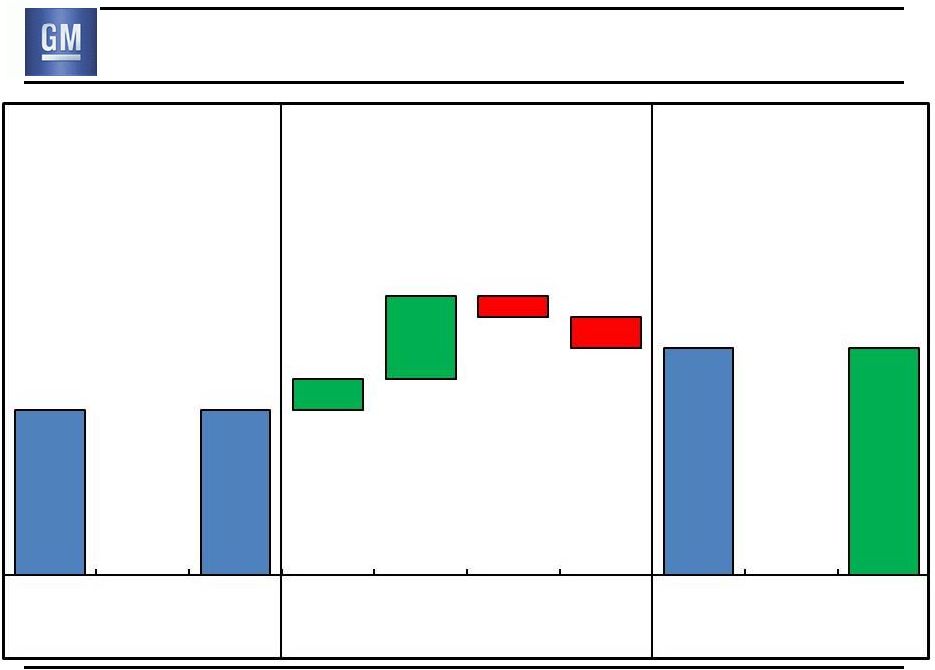
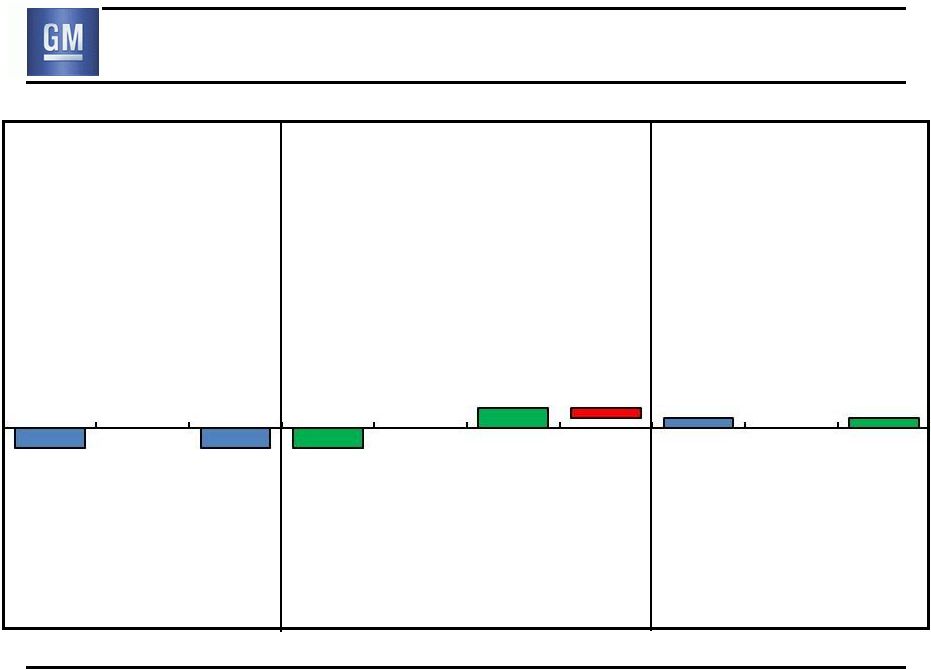
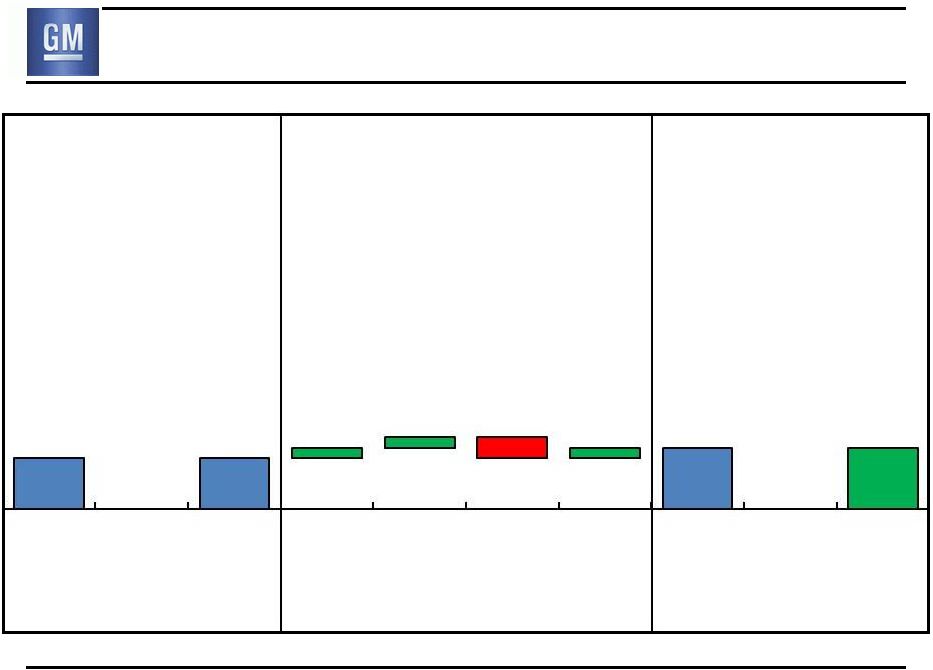
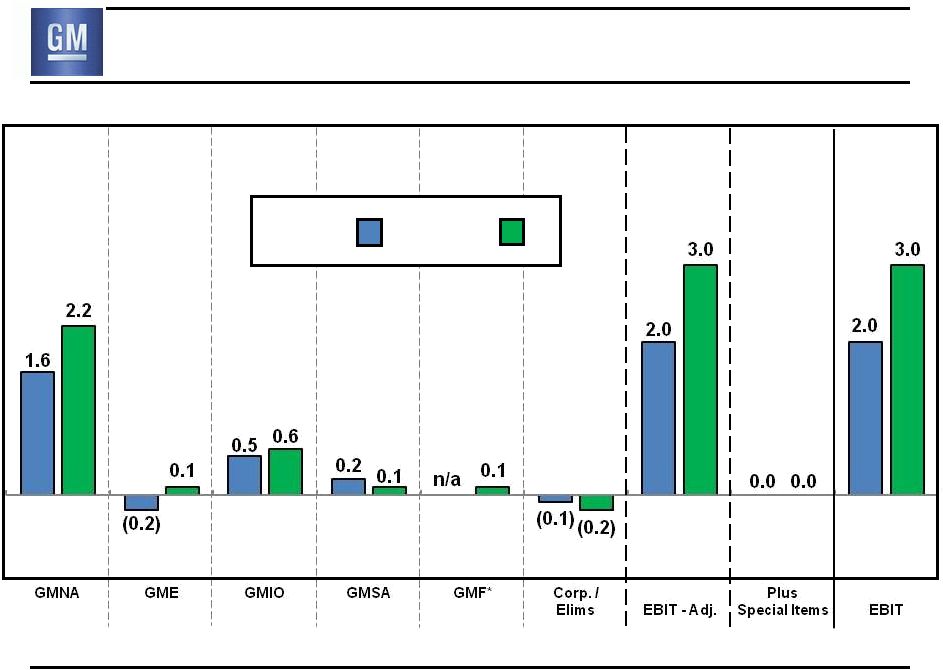 Q2
EBIT & EBIT- Adj.
($B)
* GMF at an Earnings Before Tax basis (EBT)
GMNA
GME
GMIO
GMSA
GMF*
Corp./
Elims
EBIT-Adj.
Plus
Special Items
EBIT
Q2 2010
Q2 2011
Note: Results may not foot due to rounding
7 |
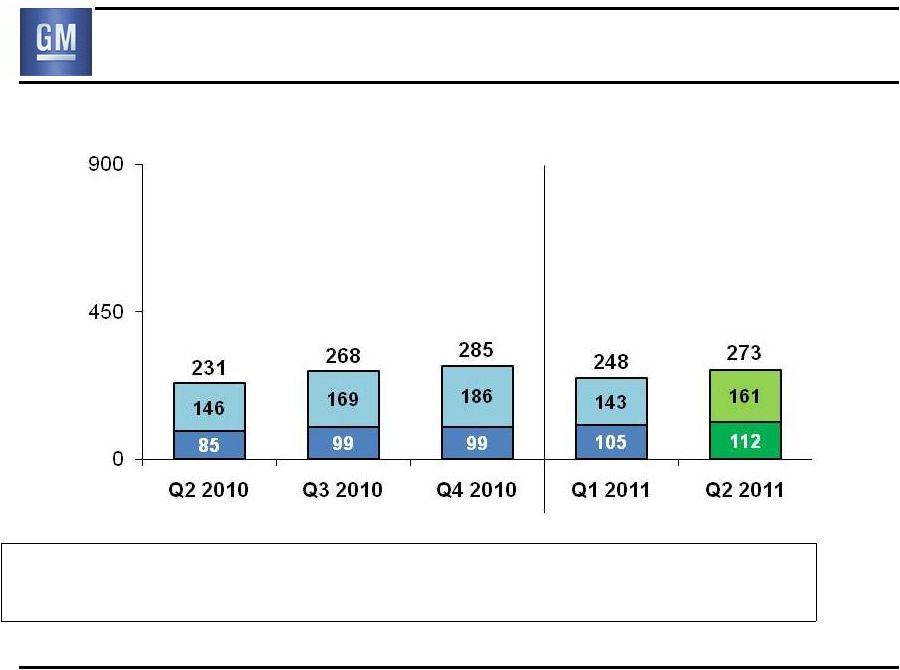
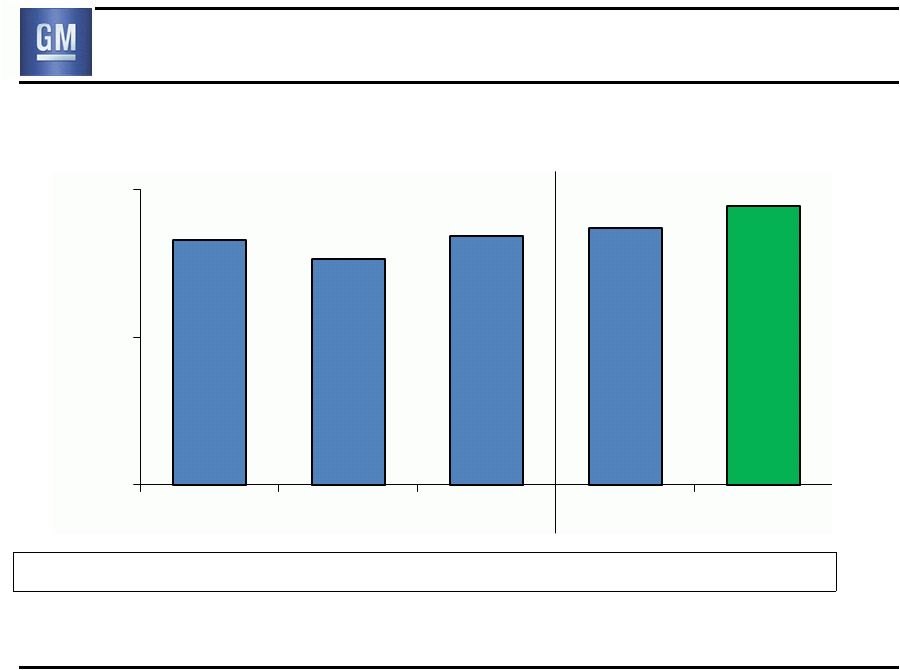 Global Deliveries
(000’s)
Global Share
11.4%
11.5%
11.4%
12.2%
GM deliveries & market share include vehicles sold around the world under GM
and JV brands, and through GM-branded distribution network
8
2,162
2,068
2,179
2,216
2,320
1,000
1,700
2,400
Q2 2010
Q3 2010
Q4 2010
Q1 2011
Q2 2011
11.6% |
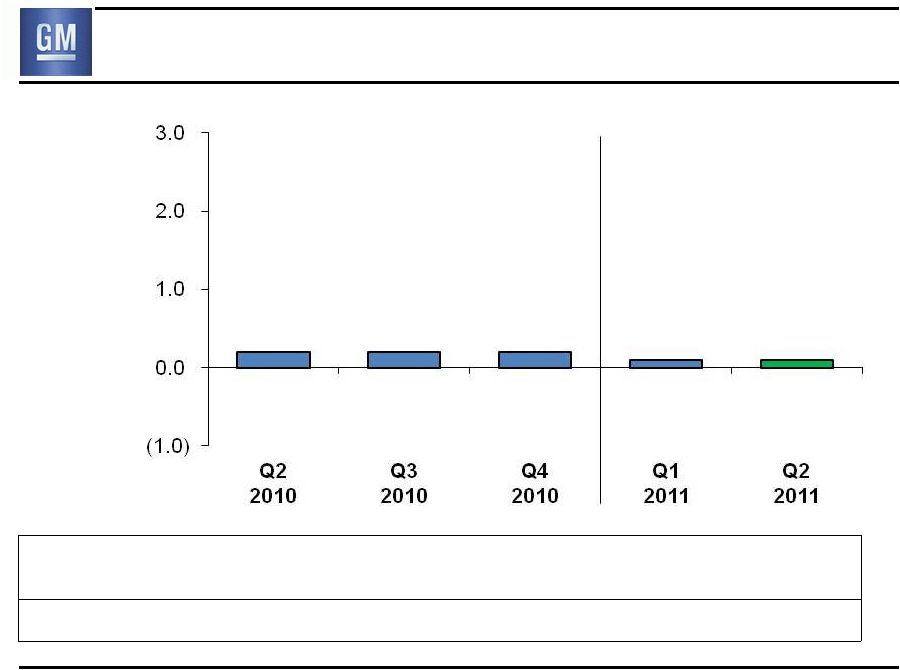
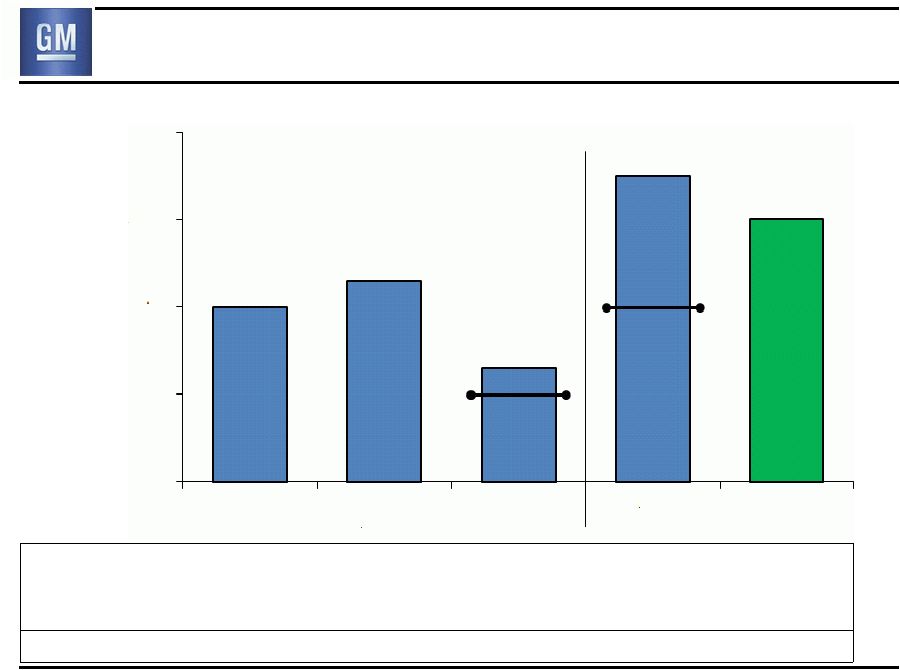 Earnings Before Interest & Taxes
($B)
Revenue ($B)
33.2
34.1
36.9
36.2
39.4
Oper Inc % Rev
5.7%
5.4%
0.6%
2.6%
6.2%
EBIT-Adj % Rev.
6.1%
6.7%
2.8%
5.6%
7.5%
Production (000’s)
2,257
2,104
2,269
2,327
2,400
1.0
EBIT-Adj.
2.0
EBIT-Adj.
Note: Starting Q4 2010 EBIT & EBIT-Adj. include GM Financial on an Earnings
Before Tax (EBT) basis 9
2.0
2.3
1.3
3.5
3.0
0.0
1.0
2.0
3.0
4.0
Q2
2010
Q3
2010
Q4
2010
Q1
2011
Q2
2011 |
 Consolidated EBIT –
Q2 2010 vs. Q2 2011
Q2 2010
EBIT ($B)
Q2 2011
EBIT ($B)
$1.0B Improvement
EBIT
EBIT-Adj.
Less Special
Items
EBIT-Adj.
EBIT
Plus Special
Items
0.6
1.0
(0.4)
(0.2)
Volume /
Mix
Price
Cost
Other
0.0
2.0
2.0
3.0
0.0
3.0
10 |
 GMNA
Deliveries (000’s) GMNA Share
18.7%
17.7%
18.5%
18.3%
19.1%
U.S. Share
19.4%
18.3%
19.1%
19.0%
20.0%
716
660
685
684
11
784
0
450
900
Q2 2010
Q3 2010
Q4 2010
Q1 2011
Q2 2011 |
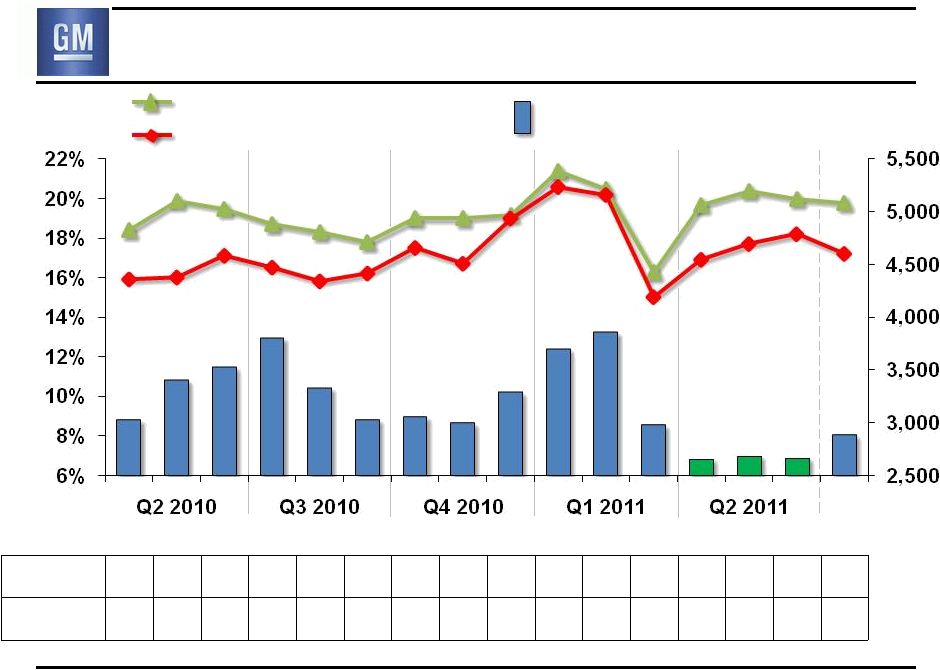 Key
GMNA Performance Indicators Avg. U.S. Retail Incentive as % of ATP
GM %
9.9
11.2
11.7
12.6
10.7
9.6
9.6
9.4
10.4
12.6
13.2
9.8
8.9
9.1
8.9
9.5
GM vs. Ind.
(GM % / Ind. %)
0.95
1.03
1.10
1.12
1.01
0.95
1.02
0.97
1.00
1.26
1.23
0.96
1.00
1.10
1.01
0.98
Share
$/Unit
U.S. Retail Share
U.S. Total Share
Avg. GM U.S. Retail
Incentive
Note: Incentive & ATP Information Based on J.D. Power and Associates
Power Information Network data Jul
2011
est.
12 |
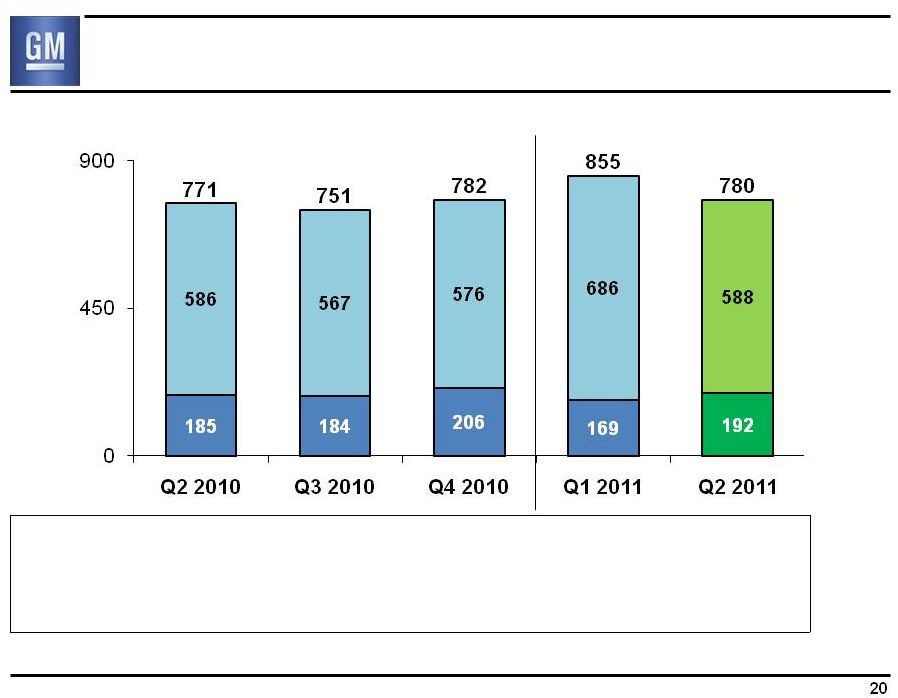
 GMNA
Earnings Before Interest & Taxes ($B)
Revenue ($B)
20.3
21.5
22.0
22.1
23.1
EBIT-Adj % Rev
7.9%
9.9%
3.4%
5.7%
9.7%
Production
(000’s)
731
707
703
786
824
U.S. Dealer Inv (000’s) 438
478
511
574
605
1.6
2.1
0.8
2.9
13
2.2
(1.0)
0.0
1.0
2.0
3.0
Q2
2010
Q3
2010
Q4
2010
Q1
2011
Q2
2011
1.3
EBIT-Adj. |
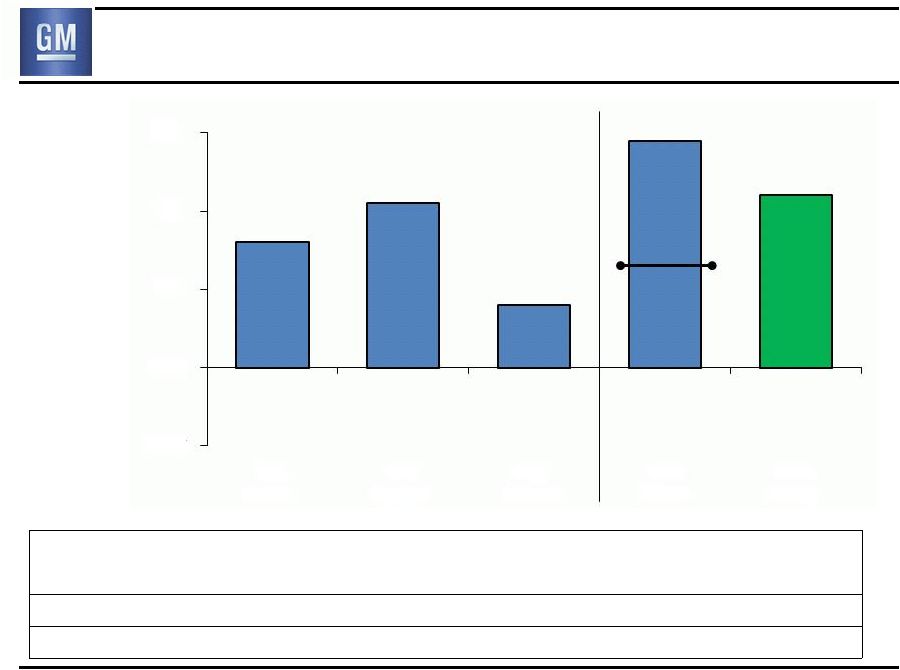
 GMNA
EBIT – Q2 2010 vs. Q2 2011
Q2 2010
EBIT ($B)
Q2 2011
EBIT ($B)
$0.6B Improvement
EBIT
EBIT-Adj.
Less Special
Items
EBIT-Adj.
EBIT
Plus Special
Items
0.3
0.8
(0.2)
(0.3)
Volume /
Mix
Price
Cost
Other
0.0
1.6
1.6
2.2
0.0
2.2
14 |
 Info
Item: U.S. Full-size Pickup Dealer Stock 15
U.S. Dealer Stock
Units (000’s)
Days Supply
December 2010
June 2011
July 2011
December 2011 Objective
159
219
209
~200
70
122
115
~90
5 Plant
Capacity
1,300
Normal
3 Plant
Capacity
~780
2012
3 Plant
Capacity
~640
U.S. Sales
(000’s)
U.S. Country of
Sale Capacity*
(000’s)
GM U.S. F/S
Pickup Sales
GM U.S. Country Of Sale
F/S Pickup Capacity
* Capacity on three-shift basis |
 16
EBIT-Adj.
(prior period)
Volume
Mix
Price
Cost
C$
NML
Other
EBIT-Adj.
(current period)
$1.6B
(Q2 2010)
0.1
0.2
0.6
0.0
(0.4)
0.0
$2.1B
(Q3 2010)
$2.1B
(Q3 2010)
0.4
(0.9)
(0.3)
(0.5)
0.0
0.0
$0.8B
(Q4 2010)
$0.8B
(Q4 2010)
0.2
0.1
(0.1)
0.2
0.0
0.1
$1.3B
(Q1 2011)
$1.3B
(Q1 2011)
0.0
0.2
0.6
0.0
0.2
(0.1)
$2.2B
(Q2 2011)
$1.6B
(Q2 2010)
0.6
(0.3)
0.8
(0.2)
(0.2)
(0.1)
$2.2B
(Q2 2011)
Info Item: GMNA EBIT-Adj (Sequential & Y-o-Y)
($B)
Note: Results may not foot due to rounding |
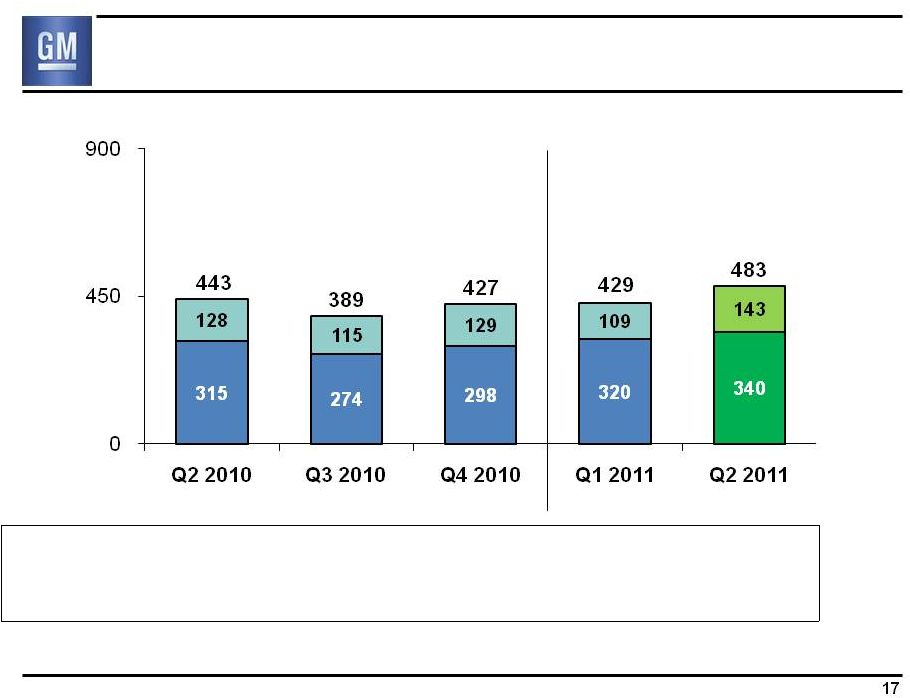 GME Deliveries
(000’s)
GME Share
8.8%
8.9%
9.0%
8.5%
9.1%
Germany Share
8.0%
8.5%
9.0%
8.2%
8.9%
U.K. Share
13.8%
12.6%
12.4%
12.6%
13.3%
Chevrolet
GME Excl.
Chevrolet
GME deliveries and market share include unit sales of Chevrolets
produced by GMIO and delivered to customers in GME.
Revenue and associated costs of these unit sales are reported by
GMIO
17 |
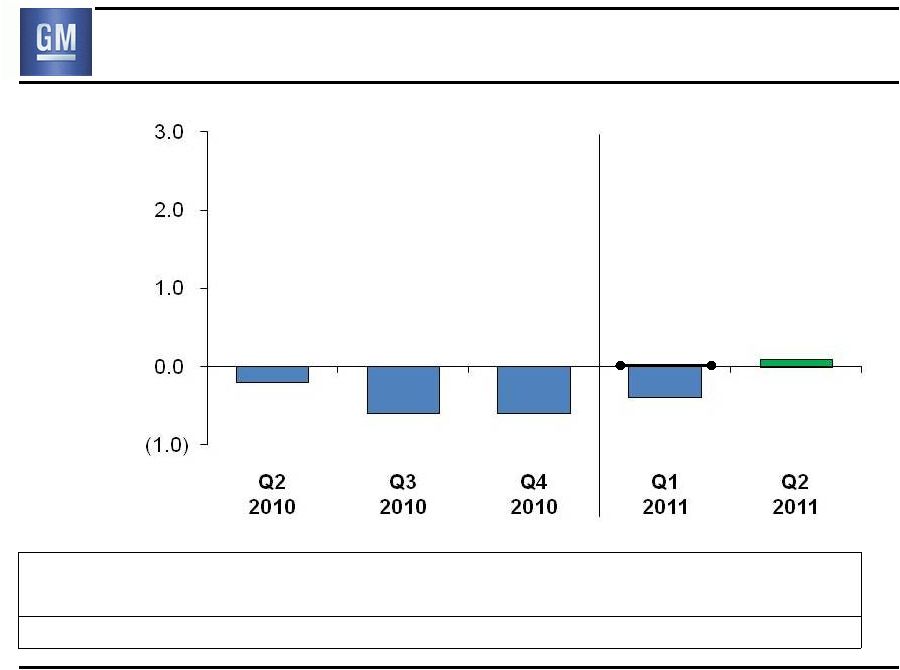 GME
Earnings Before Interest & Taxes ($B)
Revenue ($B)
6.0
5.7
6.9
6.9
7.5
EBIT-Adj % Rev
(2.6)%
(9.9)%
(9.2)%
0.1%
1.4%
Production (000’s)
331
286
313
344
326
(0.2)
(0.6)
(0.6)
(0.4)
0.0
EBIT-Adj.
18
0.1 |
 GME
EBIT – Q2 2010 vs. Q2 2011
Q2 2010
EBIT ($B)
Q2 2011
EBIT ($B)
$0.3B Improvement
EBIT
EBIT-Adj.
Less Special
Items
EBIT-Adj.
EBIT
Plus Special
Items
Volume /
Mix
Price
Cost
Other
0.2
0.0
0.2
(0.1)
0.0
0.0
(0.2)
(0.2)
0.1
0.1
19 |
 GMIO
Deliveries (000’s)
GMIO Share
8.9%
8.7%
8.6%
9.2%
9.6%
China Share
13.1%
13.6%
11.6%
13.6%
13.3%
India Share
4.0%
3.0%
3.4%
3.1%
3.4%
China
GMIO Excl.
China
20 |
 GMIO
Earnings Before Interest & Taxes Revenue ($B)
EBIT margin from
consolidated operations*
Total China JV NI/Rev**
5.3
3.7%
12.6%
5.1
4.5%
11.9%
6.1
2.0%
7.7%
5.4
3.0%
12.0%
6.6
3.4%
11.1%
Consolidated Prod. (000’s)
Joint Venture Prod. (000’s)
Total Production (000’s)
268
697
965
235
631
866
265
747
1,012
257
709
966
310
693
1,003
21
* Excludes equity income and non-controlling interest adjustment. See
supplementary schedule S9 for additional details. ** Revenue not consolidated
in GM results, pro-rata share of earnings reported as equity inc. |
 EBIT
EBIT-Adj.
Less Special
Items
EBIT-Adj.
EBIT
Plus Special
Items
Volume /
Mix
Price
Cost
Other
Q2 2010
EBIT ($B)
Q2 2011
EBIT ($B)
$0.1B Improvement
0.1
(0.2)
0.1
0.1
0.0
0.0
0.5
0.5
0.6
0.6
GMIO EBIT –
Q2 2010 vs. Q2 2011
22 |
 GMSA
Deliveries (000’s)
GMSA Share
19.5%
19.8%
19.6%
18.7%
19.2%
Brazil Share
18.4%
18.3%
18.4%
17.3%
17.6%
Brazil
GMSA Other
23 |
 GMSA
Earnings Before Interest & Taxes ($B)
Revenue ($B)
3.6
4.0
4.5
3.9
4.4
EBIT-Adj % Rev
5.4%
4.1%
4.4%
2.3%
1.3%
Production (000’s)
230
245
241
231
247
0.2
0.2
0.2
0.1
0.1
24 |
 GMSA
EBIT – Q2 2010 vs. Q2 2011
Q2 2010
EBIT ($B)
Q2 2011
EBIT ($B)
$0.1B Reduction
EBIT
0.0
(0.2)
0.0
0.1
EBIT
EBIT-Adj.
Less Special
Items
EBIT-Adj.
Plus Special
Items
Volume /
Mix
Price
Cost
Other
0.2
0.2
0.0
0.1
0.0
0.1
25 |
 Automotive Free Cash Flow
($B)
Q2 2010
Q2 2011
Net Income to Common Stockholders
1.3
2.5
Add-back Non-Controlling Interests, Preferred Dividends &
undistributed earnings allocated to Series B
0.3
0.5
Deduct Non-Auto (GM Financial)
n/a
(0.2)
Automotive Net Income
1.6
2.9
Depreciation / Amortization
1.7
1.6
Working Capital
0.0
0.1
Pension / OPEB –
Cash in Excess of Expense
(0.2)
(0.4)
Other
0.7
0.7
Automotive Net Cash Provided/(Used)
Operating Activities
3.8
5.0
Capital Expenditures
(1.0)
(1.2)
Automotive Free Cash Flow
2.8
3.8
Note: Results may not foot due to rounding
26 |
 Key
Automotive Balance Sheet Items ($B)
Jun. 30
2010
Mar. 31
2011
Jun. 30
2011
Cash & marketable securities*
32.5
30.6
33.8
Available Credit Facilities
1.1
5.9
5.9
Available Liquidity*
33.6
36.5
39.7
Key Obligations:
Debt
8.2
5.0
4.7
Series A Preferred Stock
7.0
5.5
5.5
U.S. Pension Underfunded Status**
15.8
11.2
10.8
Unfunded OPEB
9.3
10.0
10.0
* Includes Canadian HC Trust restricted cash
** Excludes U.S. non-qualified plan PBO of ~$0.9 billion
*** Excludes ~$2B stock contribution completed 1/13/11 that will be counted as
a plan asset starting in July 2011 ***
27
*** |
 GM
Financial Q2
2010
Q2
2011
Industry Avg. (Excl. GM)
Q2
2010
Q2
2011
GM Sales Penetrations
U.S. Subprime (<=620)
4.9%
6.8%
4.2%
5.1%
U.S. Lease
6.5%
13.3%
20.9%
21.2%
Canada Lease
2.7%
8.4%
15.8%
19.0%
GM / GMF Linkage
GM as % of GMF Originations
(GM New / GMF Loan & Lease)
14.0%
38.0%
GMF as % of GM U.S. S/P & Lease
11.1%
18.1%
GMF Performance
GMF Credit Losses
(annualized net charge-offs as % avg. receivables)
4.5%
2.4%
EBT ($M)
139*
144
28
GM Sales Penetrations based on JD Power PIN
* GM acquired GMF in Oct. 2010, prior to this GMF was an independent entity and not
consolidated into GM results. Q2 2010 does not reflect purchase accounting
and is not directly comparable to Q2 2011 |
 Second Quarter Summary
•
Solid second quarter results
-
Continued success in the marketplace
-
Improved GMNA margins
-
Continued progress in Europe
•
Good progress, but more to do
-
Flawless execution of H2 production launches
-
Focus on cost containment
-
Leverage global growth
•
Based on current industry outlook, expect H2 2011
EBIT-Adj. to be modestly lower than H1, and full-year
2011 EBIT-Adj. to show solid improvement over 2010
29 |
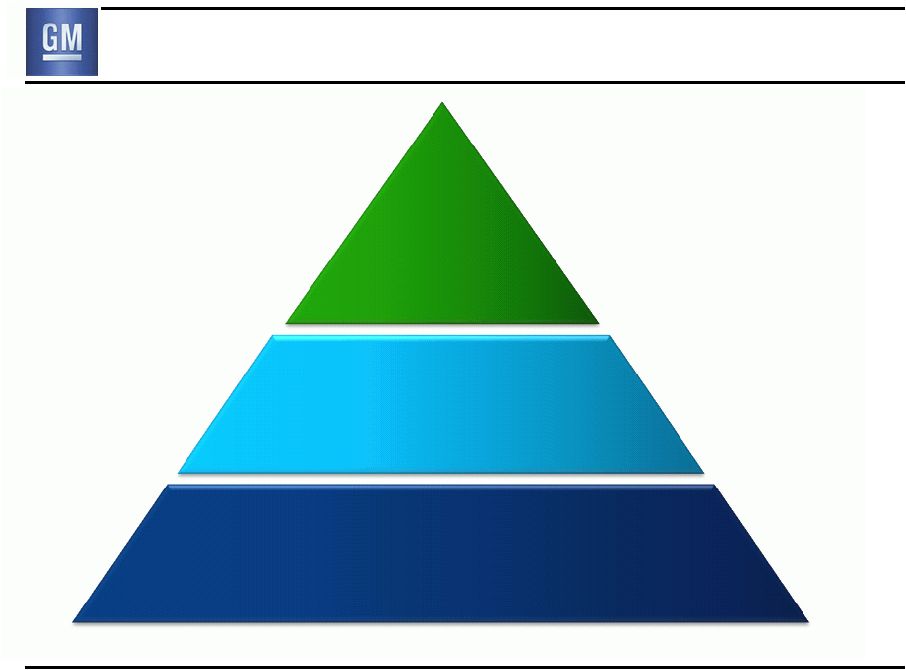 New
GM 30
New
Business
Model
Significantly Lower Risk Profile
Leverage
to Global Growth |
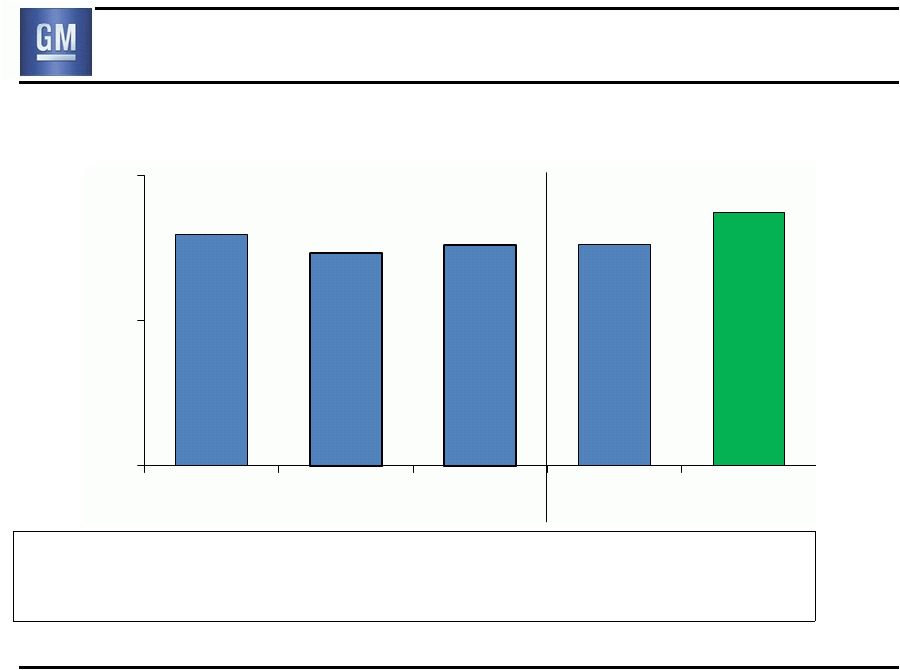
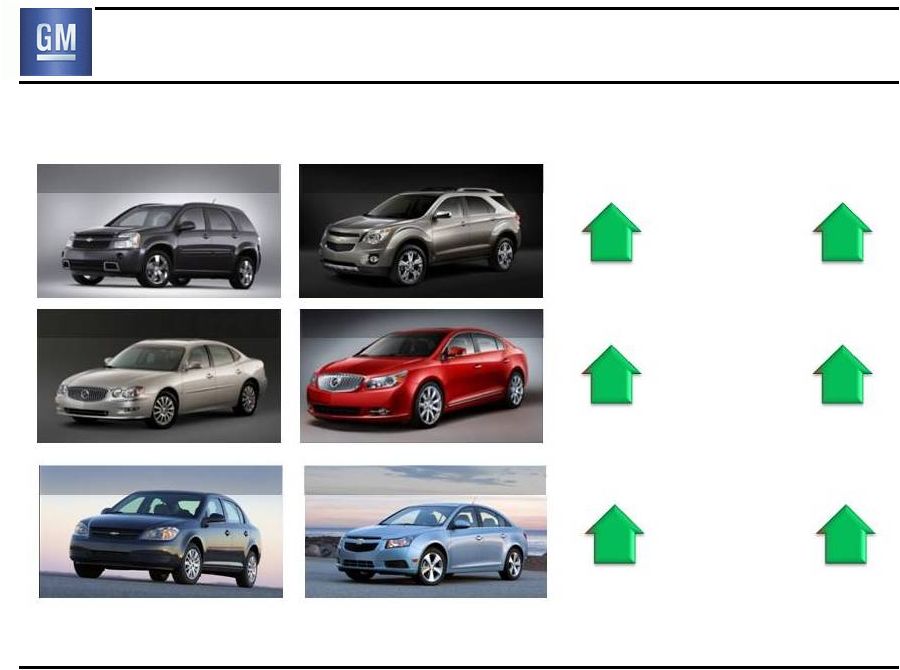 Success in Marketplace
Segment
Retail Market
Share
14.6%
+ $3,800
49%
15.5%
+ $7,000
45%
Average
Transaction
Price (ATP)
36 month
Residual
Value
4.7%
31%
Prior
Chevrolet Equinox, Q2 2009
Buick LaCrosse, Q2 2009
5.3%
31%
Current
Chevrolet Equinox, Q2 2011
Buick LaCrosse, Q2 2011
12.5%
+ $4,200
6.2%
Chevrolet Cobalt, Q2 2010
Chevrolet Cruze, Q2 2011
48%
41%
31
Residual value based on ALG 36 mo. May/June |
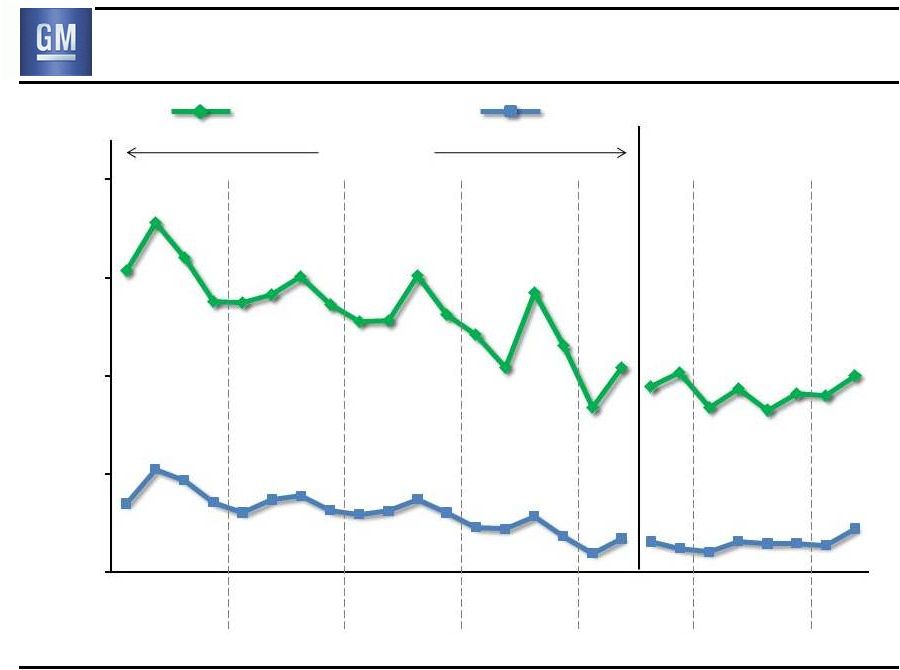 32
2005
2006
2007
2008
2009
2010
2011
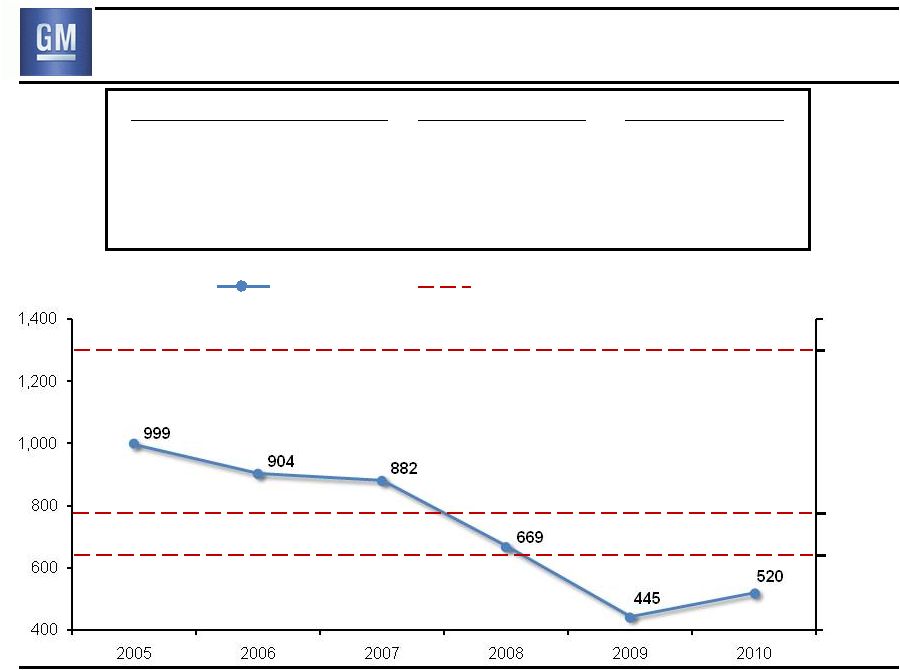
Success in Marketplace
GM Total U.S.
Share
GM Global Share
New GM
10%
15%
20%
25%
30%
Old GM |
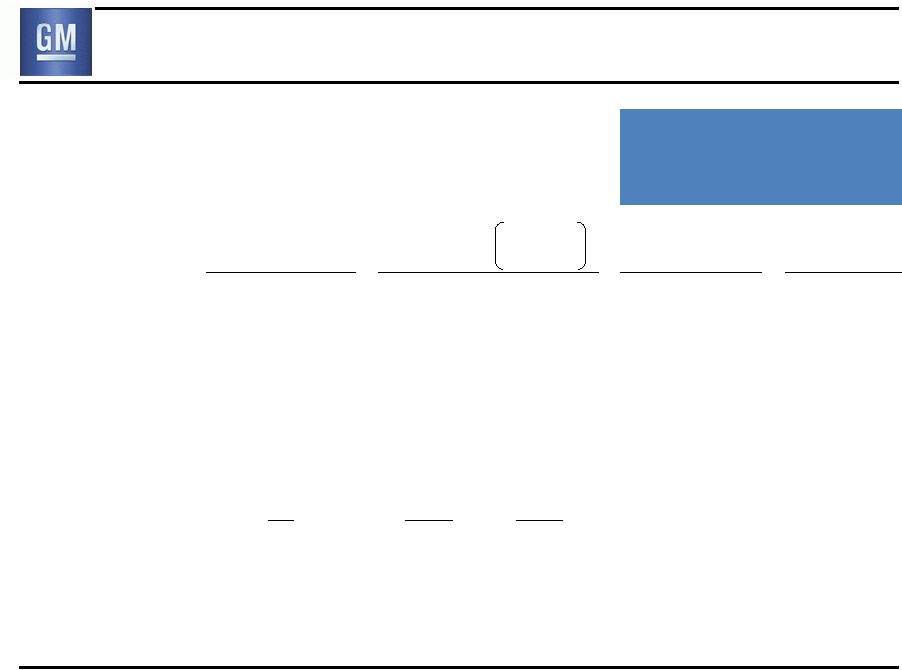 Leverage Global Growth
Industry
Volume
2010*
(Millions)
5 YR Industry
Growth
2010-2015E*
2011 H1 GM
2011 H1 GM
Performance
Performance
(Millions)
% Global
Growth
Market
Position**
Market
Share**
BRIC
-
China
25
17
+ 12
+ 8
50%
33%
1
1
12%
>13%
North America
14
+ 6
25%
1
19%
Western Europe
14
+ 2
8%
5
8%
All Other
19
+ 4
17%
3
8%
72
+ 24
100%
* 2010 industry volume & 5 YR projected growth based on IHS Automotive car and
light truck sales forecast July 2011 ** GM market position and share based on GM
internal data and includes sales by joint ventures on a total vehicle basis
33 |
 Significantly Lower Risk Profile
34
•
Profitable in all regions, Q2 2011
•
H1 GMNA EBIT-Adj. $3.5B, US
SAAR 12.8M
•
H1 GME EBIT-Adj. $0.1B, +$0.9B
vs. 2010
•
$39.7B Automotive Liquidity
•
$4.7B Automotive Debt
•
$10.8B underfunded status of U.S.
qualified pension plans
Break-
Even at
Bottom of
Cycle
Fortress
Balance Sheet |
 New
GM 35
New
Business
Model
Significantly Lower Risk Profile
Leverage
to Global Growth |
 General Motors Company
Select Supplemental Financial Information |
 EBIT
Walk to Net Income to Common Stockholders S1
($B)
Q2
2010
Q2
2011
GMNA
1.6
2.2
GME
(0.2)
0.1
GMIO
0.5
0.6
GMSA
0.2
0.1
Corp & Elims
(0.1)
(0.2)
GMF
n/a
0.1
Total EBIT
2.0
3.0
Interest Expense / (Income)
0.1
0.0
Income Tax Expense / (Benefit)
0.4
(0.1)
Net Income to Stockholders
1.5
3.0
Undistributed earnings allocated to Series B (Basic)
n/a
0.3
Dividends on Preferred Stock
0.2
0.2
Net Income to Common Stockholders
1.3
2.5
Note: Starting Q4 2010 EBIT includes GM Financial on an Earnings
Before Tax (EBT) basis
Note: Results may not foot due to rounding |
 Reconciliation of Q2 2011 EBIT-Adj.
($B)
Q2
2010
Q2
2011
Net Income to Common Stockholders
1.3
2.5
Add Back:
Undistributed earnings allocated to Series B (Basic)
n/a
0.3
Dividends on Preferred Stock
0.2
0.2
Interest Expense / (Income)
0.1
0.0
Income Tax Expense / (Benefit)
0.4
(0.1)
Earnings Before Interest & Taxes (EBIT)
2.0
3.0
Less Special Items:
None
0.0
0.0
Total Special Items
0.0
0.0
EBIT –
Adj.
2.0
3.0
Note: Results may not foot due to rounding
S2
Note: Starting Q4 2010 EBIT includes GM Financial on an Earnings
Before Tax (EBT) basis |
 Q2
2011 Special Items ($B)
Q2
2010
Q2
2011
Total GMNA
0.0
0.0
Total GME
0.0
0.0
Total GMIO
0.0
0.0
Total GMSA
0.0
0.0
Total Corp.
0.0
0.0
Total Special Items
0.0
0.0
S3 |
 Restructuring (not included in special items)
($B)
Q1
2010
Q2
2010
Q3
2010
Q4
2010
Q1
2011
Q2
2011
GMNA –
Dealer Related
0.0
0.0
0.0
0.0
0.0
0.0
GMNA –
Non-Dealer
Related
0.1
0.0
0.1
0.2
0.0
0.0
Total GMNA
0.1
0.0
0.1
0.2
0.0
0.0
Total GME
(0.3)
(0.2)
(0.1)
(0.1)
0.0
(0.1)
Total GMIO
0.0
0.0
0.0
0.0
0.0
0.0
Total GMSA
0.0
0.0
0.0
0.0
0.0
0.0
Total
(0.2)
(0.2)
(0.1)
0.1
(0.1)
(0.1)
S4
Note: Results may not foot due to rounding |
 Operating Income Walk to EBIT-
Adj
($B)
Q2
2010
Q3
2010
Q4
2010
Q1
2011
Q2
2011
Operating Income
1.9
1.8
0.2
0.9
2.5
Equity Income
0.4
0.4
0.3
2.1
0.4
Non-Controlling Interests
(0.1)
(0.1)
(0.1)
0.0
0.0
Non-Operating Income/(Expense)
(0.2)
0.1
0.9
0.5
0.2
Earnings Before Interest & Taxes
(EBIT)
2.0
2.3
1.3
3.5
3.0
Less Special Items
0.0
0.0
0.3
1.5
0.0
EBIT-
Adj.
2.0
2.3
1.0
2.0
3.0
Note: Starting Q4 2010 EBIT & EBIT-Adj. include GM Financial on an
Earnings Before Tax (EBT) basis S5
Note: Results may not foot due to rounding |
 Reconciliation of Automotive Free Cash Flow
($B)
Q2
2010
Q2
2011
Net cash provided by operating activities
3.8
5.1
Less net cash provided by operating activities-GM Financial
n/a
0.1
Automotive Net Cash Provided/(Used)
Operating Activities
3.8
5.0
Capital expenditures
(1.0)
(1.2)
Automotive Free Cash Flow
2.8
3.8
S6
Note: Results may not foot due to rounding |
 GM
Financial – Key Metrics
($M)
Q2 2011
Memo:
Q2 2010**
Earnings Before Tax
144
139
Total Originations
1,522
906
GM new vehicles as % of total
38.0%
14.0%
Finance Receivables
9,110
8,734
Delinquencies (>30 days)*
6.1%
8.9%
Annualized net charge-offs as % of
avg. receivables
2.4%
4.5%
S7
* Excludes finance receivables in repossession
** GM acquired GMF in Oct. 2010, prior to this GMF was an independent entity and not consolidated into
GM results. Q2 2010 does not reflect purchase accounting and is not directly
comparable to Q2 2011 |
 Info
Item: GMNA – C$ Net Monetary Liability
GMNA CAD NML Translational Impact
Q1
2010
Q2
2010
Q3
2010
Q4
2010
CY
2010
Q1
2011
Q2
2011
Non-Cash EBIT Impact ($B)
$(0.2)
$0.2
$(0.2)
$(0.2)
$(0.4)
$(0.2)
$0.0
Period
End
FX
(CAD
per
USD)
Inc/(Dec) vs. Prior Period
1.0164
(0.0323)
1.0491
0.0327
1.0269
(0.0222)
0.9980
(0.0289)
0.9980
(0.
0507) 0.9713
(0.0267)
0.9730
0.0017
•
GM Canada balance sheet includes ~CAD $7B Net Monetary Liability
(NML) position, primarily pension, OPEB and accrued liabilities
•
USD value of NML will vary due to difference in period end to period end FX
•
Since GM Canada is USD functional, translation exchange realized
as non-
cash charge recorded to GMNA P&L
S8 |
 Calculation of EBIT-Adj. as a Percent of Revenue
($B)
Q2
2010
%
Q3
2010
%
Q4
2010
%
Q1
2011
%
Q2
2011
%
Consolidated
Revenue
33.2
34.1
36.9
36.2
39.4
Operating Income
1.9
5.7%
1.8
5.4%
0.2
0.6%
0.9
2.6%
2.5
6.2%
EBIT-Adj.
2.0
6.1%
2.3
6.7%
1.0
2.8%
2.0
5.6%
3.0
7.5%
GMIO
Revenue
5.3
5.1
6.1
5.4
6.6
Operating Income
0.3
5.2%
0.1
2.5%
0.1
1.1%
0.1
1.8%
0.2
2.3%
Non-Operating Income (Expense)
(0.1)
0.1
0.1
0.0
0.1
Plus Special Items *
0.0
0.0
0.0
0.1
0.0
EBIT from consolidated operations
0.2
3.7%
0.2
4.5%
0.1
2.0%
0.2
3.0%
0.2
3.4%
Note: EBIT-Adj. includes GMF on an Earnings Before Tax (EBT) basis;
Results may not foot due to rounding
* Q1 2011 includes $67 million charge recorded as a special item
S9 |