Attached files
| file | filename |
|---|---|
| 8-K - FORM 8-K - PUBLIC SERVICE ELECTRIC & GAS CO | d8k.htm |
| EX-99 - PRESS RELEASE DATED AUGUST 3, 2011 - PUBLIC SERVICE ELECTRIC & GAS CO | dex99.htm |
 Public Service Enterprise Group
PSEG Earnings Conference Call
2
nd
Quarter 2011
August 3, 2011
EXHIBIT 99.1 |
| 1
Forward-Looking Statement
Readers are cautioned that statements contained in this presentation about our and our subsidiaries'
future performance, including future revenues, earnings, strategies, prospects, consequences and
all other statements that are not purely historical, are forward-looking statements for purposes of the safe harbor provisions
under The Private Securities Litigation Reform Act of 1995. When used herein, the words
“anticipate”, “intend”, “estimate”, “believe”, “expect”, “plan”, “should”,
“hypothetical”, “potential”, “forecast”, “project”, variations
of such words and similar expressions are intended to identify forward-looking statements. Although we
believe that our expectations are based on reasonable assumptions, they are subject to risks and
uncertainties and we can give no assurance they will be achieved. The results or
developments projected or predicted in these statements may differ materially from what may actually occur. Factors which could cause results or
events to differ from current expectations include, but are not limited to:
• adverse changes in energy industry law, policies and regulation, including market structures
and a potential shift away from competitive markets toward subsidized market mechanisms,
transmission planning and cost allocation rules, including rules regarding how transmission is planned and who is
permitted to build transmission in the future, and reliability standards,
• any inability of our transmission and distribution businesses to obtain adequate and timely
rate relief and regulatory approvals from federal and state regulators,
• changes in federal and state environmental regulations that could increase our costs or limit
operations of our generating units, • changes in nuclear regulation and/or general
developments in the nuclear power industry, including various impacts from any accidents or incidents
experienced at our facilities or by others in the industry that could limit operations of our nuclear
generating units, • actions or activities at one of our nuclear units located on a
multi-unit site that might adversely affect our ability to continue to operate that unit or other
units located at the same site,
• any inability to balance our energy obligations, available supply and trading risks,
• any deterioration in our credit quality, or the credit quality of our counterparties,
• availability of capital and credit at commercially reasonable terms and conditions and our
ability to meet cash needs, • any inability to realize anticipated tax benefits or retain
tax credits, • changes in the cost of, or interruption in the supply of, fuel and other
commodities necessary to the operation of our generating units, • delays in receipt of
necessary permits and approvals for our construction and development activities, • delays
or unforeseen cost escalations in our construction and development activities, • adverse
changes in the demand for or price of the capacity and energy that we sell into wholesale electricity markets,
• increase in competition in energy markets in which we compete,
• challenges associated with recruitment and/or retention of a qualified workforce,
• adverse performance of our decommissioning and defined benefit plan trust fund investments and
changes in discount rates and funding requirements, and
• changes in technology and customer usage patterns.
For further information, please refer to our Annual Report on Form 10-K, including Item 1A. Risk
Factors, and subsequent reports on Form 10-Q and Form 8-K filed with the Securities and
Exchange Commission. These documents address in further detail our business, industry issues and other factors that could cause actual
results to differ materially from those indicated in this presentation. In addition, any
forward-looking statements included herein represent our estimates only as of today and
should not be relied upon as representing our estimates as of any subsequent date. While we may elect to update forward-looking statements from time to
time, we specifically disclaim any obligation to do so, even if our internal estimates change, unless
otherwise required by applicable securities laws. |
| 2
GAAP Disclaimer
PSEG presents Operating Earnings in addition to its Net Income reported in
accordance with accounting principles generally accepted in the United
States (GAAP). Operating Earnings is a non-GAAP financial measure that
differs from Net Income because it excludes gains or losses associated with
Nuclear Decommissioning Trust (NDT) and Mark-to-Market (MTM)
accounting and other material one-time items. PSEG presents Operating
Earnings because management believes that it is appropriate for investors
to consider results excluding these items in addition to the results reported
in accordance with GAAP. PSEG believes that the non-GAAP financial
measure of Operating Earnings provides a consistent and comparable
measure of performance of its businesses to help shareholders understand
performance trends.
This information is not
intended to be viewed as an
alternative to GAAP information. The last two slides in this presentation
include a list of items excluded from Income from Continuing Operations to
reconcile to Operating Earnings, with a reference to that slide included on
each of the slides where the non-GAAP information appears.
|
 PSEG
2011 Q2 Review
Ralph Izzo
Chairman, President and Chief Executive Officer |
 4
Q2 2011 Earnings Summary
$ millions (except EPS)
2011
2010
Operating Earnings
$ 301
$ 321
Reconciling Items, Net of Tax
19
(99)
Income from Continuing Operations
$ 320
$ 222
Discontinued Operations
3
2
Net Income
$ 323
$ 224
EPS from Operating Earnings*
$ 0.59
$ 0.63
Quarter ended June
30
* See page 34 for Items excluded from Income from Continuing Operations to
reconcile to Operating Earnings. |
 5
First Half 2011 Earnings Summary
$ millions (except EPS)
2011
2010
Operating Earnings
$ 732
$ 760
Reconciling Items, Net of Tax
50
(40)
Income from Continuing Operations
$ 782
$ 720
Discontinued Operations
67
(5)
Net Income
$ 849
$ 715
EPS from Operating Earnings*
$ 1.44
$ 1.50
Six months ended June
30 * See
page 34 for Items excluded from Income from Continuing Operations to reconcile to Operating Earnings. |
 6
PSEG –
Q2 2011
Focused on operational excellence
PSE&G focused on meeting reliability
Power’s generation volumes declined 6% in the quarter
Power continues to optimize fuel flexibility
Foundation laid for the future
PSEG Nuclear received 20-year operating license extension for
Hope Creek and Salem Generating Stations
Completed sales of both Texas generating plants
Investments for the future
BPU approved $368 million of energy efficiency and capital
infrastructure programs for PSE&G
Received incentive rate treatment for 3 transmission projects at
FERC
EPA released CSAPR; Final HAPs/MACT rule expected in November
Financing position
Fitch affirmed the credit ratings of PSEG, Power and PSE&G –
Rating Outlook is Stable
Focused on building a financially strong, environmentally friendly energy
business |
 7
PSEG Capital Expenditures 2011-2013
($ Millions)
FROM
TO
PSE&G
$4,575
$5,245
PSEG Power
$1,495
$1,495
PSEG Energy Holdings
$570
$40
Other
$70
$70
Total
$6,710
$6,850
Updated capital spending program continues focus on growth investments
in distribution and transmission
*Estimate
+2.1%
PSEG Capital Expenditures
2011-2013* |
 8
2009 Operating Earnings*
2010 Operating Earnings*
2011 Guidance
$2.50 -
$2.75E
PSEG –
Maintaining 2011 Guidance
$3.09
* See page 35 for Items excluded from Income from Continuing Operations to
reconcile to Operating Earnings.
$3.12 |
 PSEG
2011 Q2 Operating Company Review
Caroline Dorsa
Executive Vice President and Chief Financial Officer |
 10
Q2 Operating Earnings by Subsidiary
Operating Earnings
Earnings per Share
$ millions (except EPS)
2011
2010
2011
2010
PSEG Power
$ 186
$ 229
$ 0.36
$ 0.45
PSE&G
105
75
0.21
0.15
PSEG Energy Holdings
5
12
0.01
0.02
Enterprise
5
5
0.01
0.01
Operating Earnings*
$ 301
$ 321
$ 0.59
$ 0.63
Quarter ended June 30
* See page 34 for Items excluded from Income from Continuing Operations to
reconcile to Operating Earnings. |
 11
$0.59
(0.01)
0.06
(0.09)
$0.63
0.00
0.25
0.50
0.75
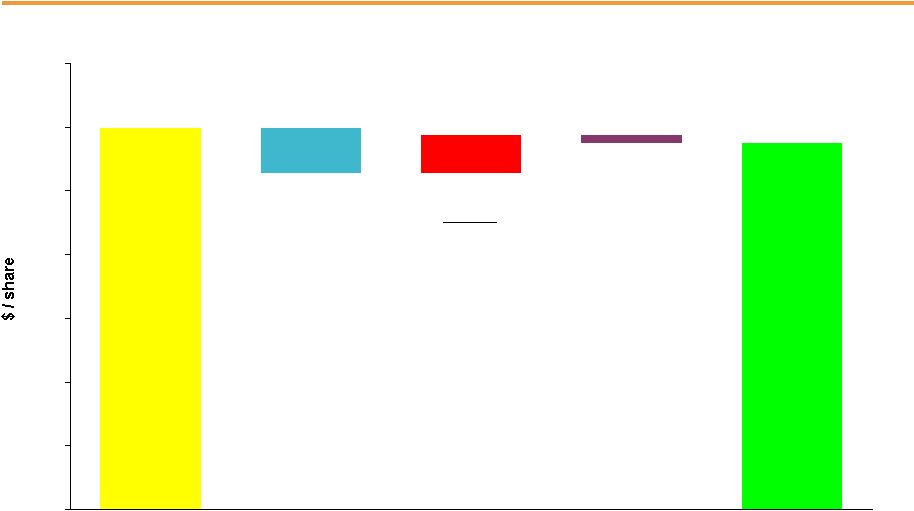
PSEG EPS Reconciliation –
Q2 2011 versus Q2 2010
Q2 2011
operating
earnings*
Q2 2010
operating
earnings*
Lower Pricing (0.05)
Lower Volume
& Weather (0.02)
Migration (0.01)
Trading & Other 0.02
D&A (0.02)
O&M (0.01)
PSEG Power
Margins:
Rate Relief 0.01
Transmission 0.01
Renewables
& Cap Stimulus 0.02
O&M 0.03
Weather & Volume
0.01
D&A (0.01)
Other (0.01)
PSE&G
PSEG Energy
Holdings
Absence of
2010 Tax
Benefits for
Solar & Other
Projects (0.02)
Other 0.01
•See page 34 for Items excluded from Income from Continuing Operations to
reconcile to Operating Earnings. |
 12
First Half Operating Earnings by Subsidiary
Operating Earnings
Earnings per Share
$ millions (except EPS)
2011
2010
2011
2010
PSEG Power
$ 452
$ 541
$ 0.89
$ 1.07
PSE&G
268
192
0.53
0.38
PSEG Energy Holdings
2
19
-
0.03
Enterprise
10
8
0.02
0.02
Operating Earnings*
$ 732
$ 760
$ 1.44
$ 1.50
Six months ended June 30
•See page 34 for Items excluded from Income from Continuing Operations to
reconcile to Operating Earnings. |
 13
$1.44
(0.03)
0.15
(0.18)
$1.50
0.00
0.25
0.50
0.75
1.00
1.25
1.50
1.75
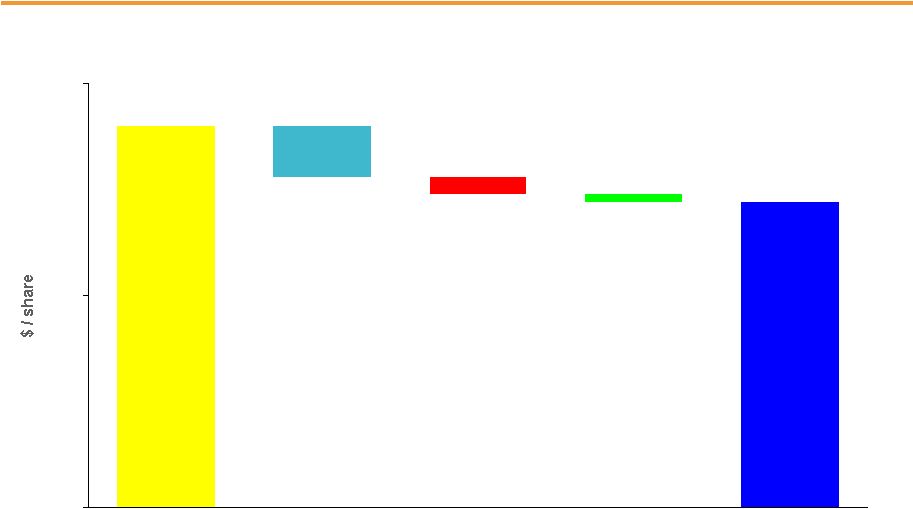
PSEG EPS Reconciliation –
YTD 2011 versus YTD 2010
YTD 2011
operating
earnings*
YTD 2010
operating
earnings*
Lower Pricing
(0.05)
Lower Volume &
Weather (0.02)
Migration (0.02)
O&M (0.04)
D&A and Interest
(0.05)
PSEG Power
Margins:
Rate Relief 0.04
Transmission 0.02
Renewables
& Cap Stimulus 0.03
O&M 0.07
Weather
& Volume 0.02
D&A (0.02)
Other (0.01)
PSE&G
PSEG Energy
Holdings
Absence of
2010 Tax
Benefits for
Solar & Other
Projects (0.02)
ES&P
Investment
Write-off (0.01)
* See page 34 for Items excluded from Income from Continuing Operations to
reconcile to Operating Earnings. |
 PSEG
Power 2011 Q2 Review |
 15
PSEG Power –
Q2 2011 EPS Summary
$ millions (except EPS)
Q2 2011
Q2 2010
Variance
Operating Revenues
$ 1,285 $ 1,264
$ 21
Operating Earnings
186
229
(43)
NDT Funds/Mark to Market
Related Activity, Net of Tax
19
(27)
46
Income from Continuing Operations
205
202
3
Discontinued Operations
3
2
1
Net Income
208
204
4
EPS from Operating Earnings*
$ 0.36
$ 0.45
($ 0.09)
* See page 34 for Items excluded from Income from Continuing Operations to
reconcile to Operating Earnings. |
 16
$0.45
(0.06)
(0.02)
(0.01)
$0.36
0.00
0.25
0.50
Lower Pricing
(0.05)
Lower Volume &
Weather (0.02)
Migration (0.01)
Trading & Other
0.02
PSEG Power EPS Reconciliation –
Q2 2011 versus Q2 2010
Q2 2011
operating
earnings*
Q2 2010
operating
earnings*
* See page 34 for Items excluded from Income from Continuing Operations to
reconcile to Operating Earnings. O&M
Higher
Depreciation
for BET
Lower IDC
Offset |
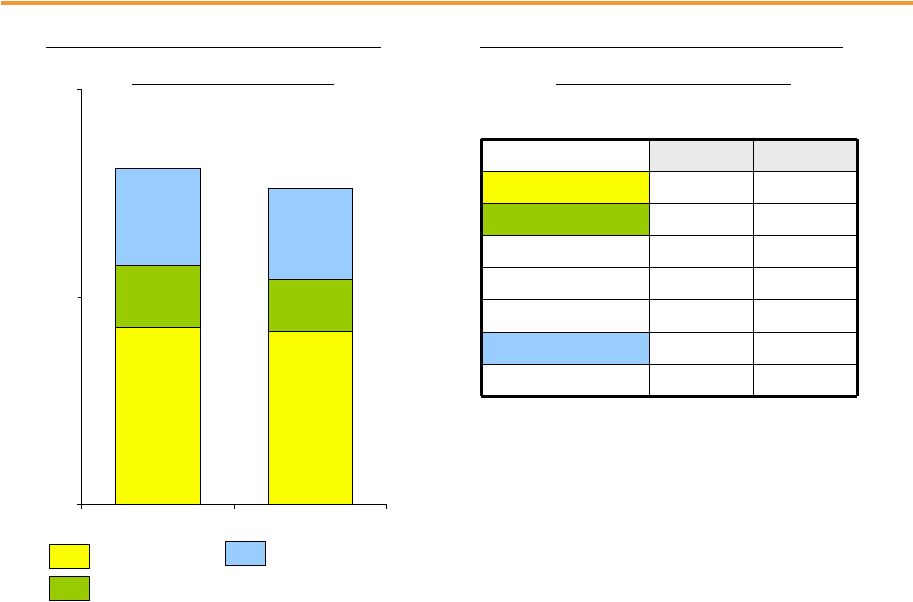 17
PSEG Power –
Generation Measures
7,487
7,307
2,595
2,191
4,090
3,824
0
8,750
17,500
2010
2011
Quarter ended June 30
Total Nuclear
Total Coal*
Oil & Natural Gas
–
excluding
Texas
* Includes figures for Pumped Storage
PSEG Power –
Generation (GWh)
14,172
13,322
PSEG Power –
Capacity Factors (%)
2010
2011
Nuclear
95.0%
94.6%
Coal
NJ
42%
31%
PA
83%
80%
CT
35%
15%
Combined
Cycle
PJM and NY
52%
53%
Six months ended June 30 |
 18
PSEG Power –
Fuel Costs
Quarter ended June 30
($ millions)
2010
2011
Coal
99
83
Oil & Gas*
168
155
Total Fossil
267
238
Nuclear
41
44
Total Fuel Costs
308
282
Total Generation
(GWh)
14,172
13,322
$ / MWh
21.73
21.17
PSEG Power –
Fuel Costs
* Excludes Texas |
 19
PSEG Power –
Gross Margin Performance
$0
$25
$50
$75
2010
2011
$51
$49
Quarter ended June 30
Margins influenced by lower pricing and volumes
Regional Performance
Region
Q2 Gross
Margin ($M)
Q2 Performance
PJM
$622
Q2 contribution to gross margin
declined, reflecting lower volumes,
capacity prices, and BGS/hedge
pricing which occurred in the
quarter. Migration volumes are
less than forecast, and impact on
margin has abated with recent
market price improvement.
New
England
$27
Fuel cost management offset
flat year-over-year pricing and
lower volumes.
New York
$9
Lower volumes and pricing.
PSEG Power Gross Margin ($/MWh)*
* Excludes Texas
Decrease in generation output balanced with fuel switching at PJM
oil and gas units and slight reduction at nuclear. |
 20
Hedging Update…
…
our strategy is to hedge our base load generation long term.
Contracted Energy*
* Hedge
percentages
and
prices
as
of
July
2011
for
the
August
2011
and
forward
time
frame.
Revenues
of
full
requirement
load
deals
based
on
contract
price,
including
renewable
energy
credits,
ancillary,
and
transmission
components
but
excluding
capacity.
Hedges
include
positions
with
MTM
accounting
treatment
and
options.
2011
2012
2013
Aug - Dec
Volume TWh
14
36
36
Base Load
% Hedged
100%
75%-80%
35%-40%
(Nuclear and Base Load Coal)
Price $/MWh
$68
$64
$63
Volume TWh
9
20
21
Intermediate Coal, Combined
% Hedged
30%-35%
Cycle, Peaking
Price $/MWh
$68
Volume TWh
23
56
57
Total
% Hedged
70%-75%
45%-50%
20%-25%
Price $/MWh
$68
$64
$63 |
 21
PSEG Power –
Q2 Operating Highlights
Q2 output declined by 6%
Q2 nuclear capacity factor at 90%
Coal dispatch affected by higher cost structure
Combined cycle units captured market opportunities
Operations
Regulatory and Market
Environment
Hope Creek and Salem received 20-year Operating License Extensions
from the NRC
Market prices for energy improved in Q2
May RPM auction results continue to support locational value of assets
New Jersey BPU currently investigating the need for additional capacity subsidies
|
 PSE&G
2011 Q2 Review |
 23
PSE&G –
Q2 2011 Earnings Summary
$ millions (except EPS)
Q2 2011
Q2 2010
Variance
Operating Revenues
$ 1,571
$ 1,536
$ 35
Operating Expenses
Energy Costs
815
917
(102)
Operation & Maintenance
304
343
(39)
Depreciation & Amortization
172
177
(5)
Taxes Other than Income Taxes
28
28
-
Total Operating Expenses
1,319
1,465
(146)
Operating Earnings
105
75
30
EPS from Operating Earnings*
$ 0.21
$ 0.15
$ 0.06
* See page 34 for Items excluded from Income from Continuing Operations to
reconcile to Operating Earnings. |
 24
$0.15
0.04
0.03
0.01
(0.02)
$0.21
0.00
0.05
0.10
0.15
0.20
0.25
`
PSE&G EPS Reconciliation –
Q2 2011
versus Q2 2010
Q2 2011
operating
earnings*
Q2 2010
operating
earnings*
Weather
& Volume
* See page 34 for Items excluded from Income from Continuing Operations to
reconcile to Operating Earnings. O&M
Margins:
Rate Relief 0.01
Transmission 0.01
Renewables
& Cap Stimulus 0.02
D&A (0.01)
Other (0.01) |
 25
PSE&G –
Monthly Weather Data
1,325
3,459
403
208
1,333
3,954
158
737
2,918
0
500
1,000
1,500
2,000
2,500
3,000
3,500
4,000
4,500
April
May
June
2011
2010
Normal
2011
vs.
2010
vs.
Normal
PSE&G
Monthly
Temperature
Humidity
Index
(THI)
-5.6% Q2 2011 vs. Q2 2010
+ 36% Q2 2011 vs. Normal |
 26
PSE&G Capital Expenditures 2011-2013
($ Millions)
FROM
TO
Transmission
$2,735
$2,920
Distribution
$1,295
$1,685
Renewables/EMP
$545
$640
Total
$4,575
$5,245
Capital program provides growth in rate base of 11-12% from 2010
Transmission investment represents over 50% of planned capex over
2011-2013 Supportive regulatory treatment
*Estimate
+15%
PSE&G Capital Expenditures
2011-2013* |
 27
PSE&G –
Q2 Operating Highlights
NJBPU approved $368 million of energy efficiency and capital infrastructure
programs for PSE&G
Received incentive rate treatment for 3 transmission projects at
FERC
Energy Master Plan Draft Released -
Public hearings
PSE&G has increased its capital budget by $670 million over 2011-2013
Rate base growth over the 2010-2013 period projected to be 11.5% CAGR
Operations
Regulatory and Market
Environment
Financial
Economic indicators have stalled
Focused on maintaining reliability |
 PSEG
Energy Holdings 2011 Q2 Review |
 29
PSEG Energy Holdings –
Q2 2011 Earnings Summary
$ millions (except EPS)
Q2 2011
Q2 2010
Variance
Operating Revenues
$ 21
$ 20
$ 1
Income from Continuing Operations /
Net Income / Operating Earnings
$ 5
$ 12
($ 7)
EPS from Operating Earnings*
$ 0.01
$ 0.02
($ 0.01)
* See page 34 for Items excluded from Income from Continuing Operations to
reconcile to Operating Earnings. |
 30
$0.01
0.01
(0.02)
$0.02
0.00
0.01
0.02
0.03
0.04
PSEG Energy Holdings EPS Reconciliation –
Q2 2011 versus
Q2 2010
Q2 2011
operating
earnings*
Q2 2010
operating
earnings*
Other
* See page 34 for Items excluded from Income from Continuing Operations to
reconcile to Operating Earnings. Absence of Q2 2010
Tax Benefits for
Solar and Other
Projects |
 PSEG |
 32
PSEG 2011 Operating Earnings Guidance -
By Subsidiary
$ millions (except EPS)
2011E
2010A
PSEG Power
$ 765 –
$ 855
$ 1,091
PSE&G
$ 495 –
$ 520
$ 430
PSEG Energy Holdings
$ 0 –
$ 5
$ 49
Enterprise
$ 5 –
$ 15
$ 14
Operating Earnings*
$ 1,265 –
$ 1,395
$ 1,584
Earnings per Share
$ 2.50 –
$ 2.75
$ 3.12
* See page 35 for Items excluded from Income from Continuing Operations to
reconcile to Operating Earnings. |
 33
PSEG Liquidity as of June 30, 2011
Expiration
Total
Available
Company
Facility
Date
Facility
Usage
Liquidity
($Millions)
PSE&G
5-year Credit Facility
Apr-16
$600
$298
$302
5-Year Credit Facility (Power)
Dec-12
$1,600
1
$170
$1,430
5-Year Credit Facility (Power)
Apr-16
$1,000
$0
$1,000
5-Year Bilateral - Credit Suisse (Power)
Sep-15
$100
$100
$0
5-year Credit Facility (PSEG)
Dec-12
$500
2
$14
$486
5-year Credit Facility (PSEG)
Apr-16
$500
$0
$500
Total
$4,300
$3,718
$92
PSE&G ST Investment
$0
Total Liquidity Available
$3,810
Total Parent / Power Liquidity
$3,508
1
Power Facility reduced by $75 million in 12/2011
2
PSEG Facility reduced by $23 million in 12/2011
PSEG /
Power
PSEG Money Pool ST Investment |
 34
Items Excluded from Income from Continuing Operations
to Reconcile to Operating Earnings
Please see Page 2 for an explanation of PSEG’s use of Operating Earnings as a
non-GAAP financial measure and how it differs from Net Income.
Pro-forma Adjustments, net of tax
2011
2010
2011
2010
Earnings
Impact
($
Millions)
Gain (Loss) on Nuclear Decommissioning Trust (NDT)
Fund Related Activity (PSEG Power)
15
$
10
$
42
$
20
$
Gain (Loss) on Mark-to-Market (MTM) (PSEG Power)
4
(37)
8
12
Market Transition Charge Refund (PSE&G)
-
(72)
-
(72)
Total Pro-forma adjustments
19
$
(99)
$
50
$
(40)
$
Fully Diluted Average Shares Outstanding (in Millions)
507
507
507
507
Per
Share
Impact
(Diluted)
Gain (Loss) on NDT Fund Related Activity (PSEG Power)
0.03
$
0.02
$
0.08
$
0.04
$
Gain (Loss) on MTM (PSEG Power)
0.01
(0.07)
0.02
0.02
Market Transition Charge Refund (PSE&G)
-
(0.14)
-
(0.14)
Total Pro-forma adjustments
0.04
$
(0.19)
$
0.10
$
(0.08)
$
PUBLIC SERVICE ENTERPRISE GROUP INCORPORATED
Reconciling
Items
Excluded
from
Continuing
Operations
to
Compute
Operating
Earnings
(Unaudited)
For the Three Months Ended
For the Six Months Ended
June 30,
June 30, |
 35
Items Excluded from Income from Continuing Operations to Reconcile
to Operating Earnings
Please see Page 2 for an explanation of PSEG’s use of Operating Earnings as a
non-GAAP financial measure and how it differs from Net Income.
Pro-forma Adjustments, net of tax
2010
2009
Earnings Impact ($ Millions)
Gain (Loss) on Nuclear Decommissioning Trust (NDT)
Fund Related Activity (PSEG Power)
46
$
9
$
Gain (Loss) on Mark-to-Market (MTM) (PSEG Power)
(1)
(11)
Net Reversal of Lease Transaction Reserves (Energy Holdings)
-
29
Market Transition Charge Refund (PSE&G)
(72)
-
Total Pro-forma adjustments
(27)
$
27
$
Fully Diluted Average Shares Outstanding (in Millions)
507
507
Per Share Impact (Diluted)
Gain (Loss) on NDT Fund Related Activity (PSEG Power)
0.09
$
0.02
$
Gain (Loss) on MTM (PSEG Power)
-
(0.02)
Net Reversal of Lease Transaction Reserves (Energy Holdings)
-
0.05
Market Transition Charge Refund (PSE&G)
(0.14)
-
Total Pro-forma adjustments
(0.05)
$
0.05
$
December 31,
PUBLIC SERVICE ENTERPRISE GROUP INCORPORATED
Reconciling Items Excluded from Continuing Operations to Compute Operating Earnings
(Unaudited)
For the Twelve Months Ended |