Attached files
| file | filename |
|---|---|
| 8-K - FORM 8-K - Mastercard Inc | d8k.htm |
| EX-99.1 - PRESS RELEASE - Mastercard Inc | dex991.htm |
Exhibit 99.2
Exhibit 99.2
MasterCard Incorporated Second-Quarter 2011 Financial Results Conference Call
August 3, 2011
Business Update
• Operational Overview
• Economic Update
• U.S. Debit Regulation
• Business Highlights
2
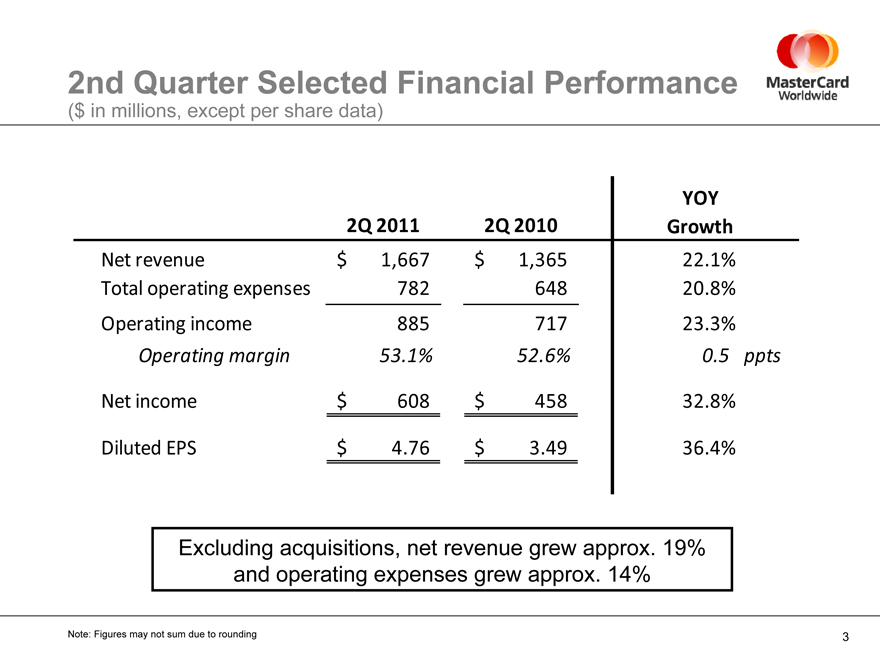
2nd Quarter Selected Financial Performance
($ in millions, except per share data)
2Q 2011 2Q 2010 YOY Growth
Net revenue $ 1,667 $ 1,365 22.1%
Total operating expenses 782 648 20.8%
Operating income 885 717 23.3%
Operating margin 53.1% 52.6% 0.5 ppts
Net income $ 608 $ 458 32.8%
Diluted EPS $ 4.76 $ 3.49 36.4%
Excluding acquisitions, net revenue grew approx. 19% and operating expenses grew approx. 14%
Note: Figures may not sum due to rounding
3
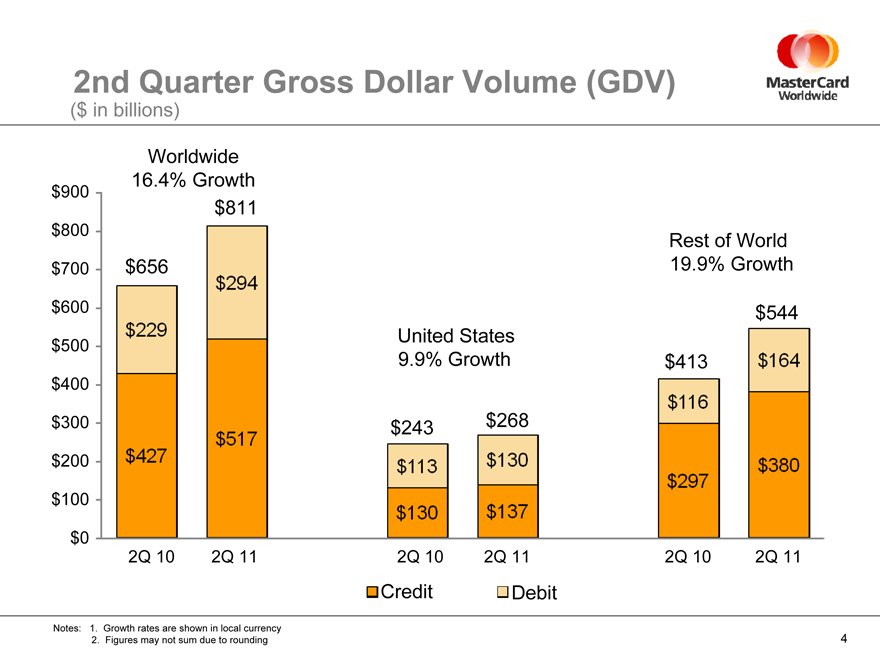
2nd Quarter Gross Dollar Volume (GDV)
($ in billions)
$900
$800 $700 $600
$500 $400 $300
$200
$100
$0
Worldwide 16.4% Growth
$656
$229
$427
$811 $294 $517
United States 9.9% Growth
$243
$113
$130
$268
$130
$137
Rest of World 19.9% Growth
$413
$116
$297
$544
$164
$380
2Q 10 2Q 11 2Q 10 2Q 11 2Q 10 2Q 11
Credit Debit
Notes: 1. Growth rates are shown in local currency
2. Figures may not sum due to rounding
4
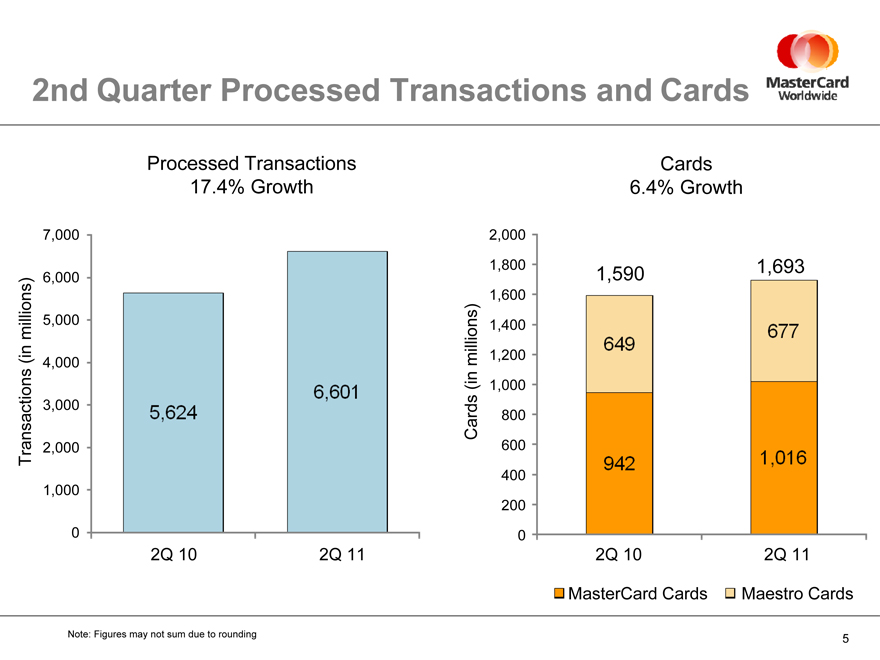
2nd Quarter Processed Transactions and Cards
Transactions (in millions)
7,000 6,000 5,000 4,000 3,000 2,000 1,000 0
Processed Transactions
17.4% Growth
5,624
6,601
2Q 10 2Q 11
Cards (in millions)
2,000 1,800 1,600 1,400 1,200 1,000 800 600 400 200 0
Cards 6.4% Growth
1,590 649 942
1,693
677
1,016
2Q 10 2Q 11
MasterCard Cards Maestro Cards
Note: Figures may not sum due to rounding
5
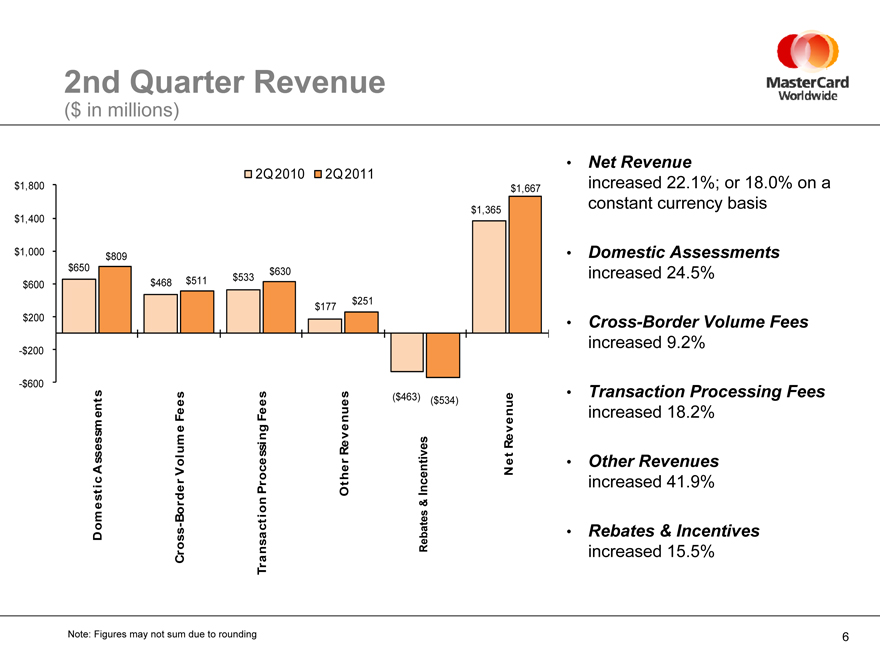
2nd Quarter Revenue ($ in millions)
$1,800 $1,400 $1,000 $600 $200 -$200 -$600
2Q 2010 2Q 2011
Domestic Assessments
Cross-Border Volume Fees
Transaction Processing Fees
Other Revenues
Rebates & Incentives
Net Revenues
$650 $809 $468 $511 $533 $630 $177 $251 ($463) ($534) $1,365 $1,667
• Net Revenue increased 22.1%; or 18.0% on a constant currency basis
Domestic Assessments increased 24.5%
Cross-Border Volume Fees increased 9.2%
Transaction Processing Fees increased 18.2%
Other Revenues increased 41.9%
Rebates & Incentives increased 15.5%
Note: Figures may not sum due to rounding
6
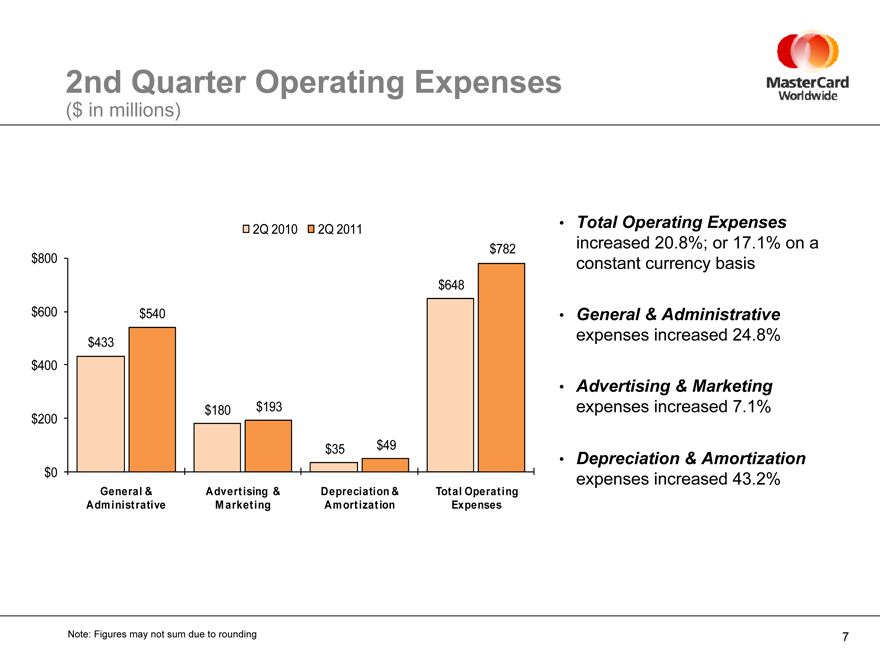
2nd Quarter Operating Expenses ($ in millions)
2Q 2010
2Q 2011
$800
$600
$400
$200
$0
$433
$540
$180
$193
$35
$49
$648
$782
General &
Administrative
Advertising &
Marketing
Depreciation &
Amortization
Total Operating
Expenses
Total Operating Expenses increased 20.8%; or 17.1% on a constant currency basis
General & Administrative expenses increased 24.8%
Advertising & Marketing expenses increased 7.1%
Depreciation & Amortization expenses increased 43.2%
Note: Figures may not sum due to rounding
7
2nd Quarter Cash Flow Statement and Balance Sheet Highlights
Cash flow from operations of $538 million
Cash, cash equivalents and other liquid investments of $3.6 billion
Share Repurchase Activity
2Q11: approx. 1.5 million shares (cost of $387 million)
3Q11 through July 28: 77,700 shares (cost of $24 million)
Remaining authorization: $935 million
8
Thoughts for the Future
Business update through July 28
Thoughts for 2011
Net Revenue
Total Operating Expenses
Tax Rate
Long-term financial objectives
9

MasterCard
Worldwide
The Heart of CommerceTM
10