Attached files
| file | filename |
|---|---|
| 8-K - FORM 8-K - Forestar Group Inc. | d83943e8vk.htm |
| EX-99.1 - EX-99.1 - Forestar Group Inc. | d83943exv99w1.htm |
Exhibit 99.2

| SECOND QUARTER 2011 FINANCIAL RESULTS AUGUST 3, 2011 1 |

| FORWARD LOOKING STATEMENTS This presentation contains "forward-looking statements" within the meaning of the federal securities laws. These statements reflect management's current views with respect to future events and are subject to risk and uncertainties. We note that a variety of factors and uncertainties could cause our actual results to differ significantly from the results discussed in the forward-looking statements. Factors and uncertainties that might cause such differences include, but are not limited to: general economic, market, or business conditions; the opportunities (or lack thereof) that may be presented to us and that we may pursue; fluctuations in costs and expenses including development costs; demand for new housing, including impacts from mortgage credit availability; lengthy and uncertain entitlement processes; cyclicality of our businesses; accuracy of accounting assumptions; competitive actions by other companies; changes in laws or regulations; and other factors, many of which are beyond our control. Except as required by law, we expressly disclaim any obligation to publicly revise any forward- looking statements contained in this presentation to reflect the occurrence of events after the date of this presentation. 2 |

| SECOND QUARTER 2011 RESULTS AND KEY PERFORMANCE INDICATORS STRATEGY AND EXECUTION HAS FORESTAR WELL POSITIONED 3 |

| POISED FOR MARKET RECOVERY 31,000 acres put in play in Louisiana & Texas 2,500 acres leased, 28,500 acres in exploration agreements Acquired loan secured by 900 acre project in Houston Initiated construction of multifamily project in Austin 283 residential lots sold, up 32% vs. Q1 2011 Almost 1,500 lots under contract Entitled 1,068 acre mixed-use project near Atlanta, GA Definitive agreement for sale of 50k acres for $75 million Sold 780 acres for $2.5 million - $3,300 per acre MINERAL S MIXED- USE SINGLE- FAMILY ENTITLEMEN T TIMBERLAND 4 |

| SECOND QUARTER 2011 FINANCIAL RESULTS ($ in Millions, except per share data) 2nd Qtr 2011 2nd Qtr 2010 1st Qtr 2011 Net Income (Loss) ($3.9) ($3.3) ($2.5) Earnings (Loss) Per Share ($0.11) ($0.09) ($0.07) Note: 2nd Qtr 2011 weighted average basic shares outstanding were 35.4 million 2nd Qtr. 2011 results include $2.7 million of pre-tax expenses ($1.6 million after-tax) related to withdrawn private debt offerings 5 |

| SEGMENT EARNINGS ($ in Millions) 2nd Qtr 2011 2nd Qtr 2010 1st Qtr 2011 Real Estate $1.0 $2.4 $2.6 Mineral Resources 3.1 4.3 5.6 Fiber Resources 0.7 1.1 0.6 Total $4.8 $7.8 $8.8 2nd Qtr. 2011 real estate segment results include $2.5 million in undeveloped land sales compared with $8.2 million in 2nd Qtr. 2010 and $6.1 million in 1st Qtr. 2011 2nd Qtr. 2011 real estate segment results include a $1.3 million benefit associated with reallocation of a previously recognized loss from us to a noncontrolling interest venture partner 1st Qtr. 2011 mineral resources segment earnings include over $1.7 million in lease bonus revenues associated with leasing almost 4,900 net mineral acres and $1.6 million in revenues associated with a seismic exploration agreement on over 31,100 net mineral acres in Louisiana 6 |

| TEXAS REAL ESTATE MARKETS AMONG THE HEALTHIEST Texas Real Estate Market Conditions Texas forecasted job growth 2x national average Texas house prices didn't get overheated Minimal supply constraints & limited equity withdrawal Housing inventory low and balanced with low sales velocity Texas named #1 state for businesses Taxes, regulation & tort reform Quality of living and workforce Texas U.S. Avg. Job Growth (June 2011 vs. June 2010) 220k jobs 242k jobs Unemployment 8.2% 9.2% New Home Inventory 8.2 Mos 9.5 Mos Delinquency 2.80% 3.58% Foreclosures 1.89% 4.52% Texas real estate markets poised to benefit from housing recovery Real Estate Investment in Texas Markets $443 million; 52 projects Over 70% of total real estate investment Dallas Houston San Antonio Austin Gulf Coast 7 Sources: MoodysEconomy.com, National Association of Realtors, Mortgage Bankers Association |

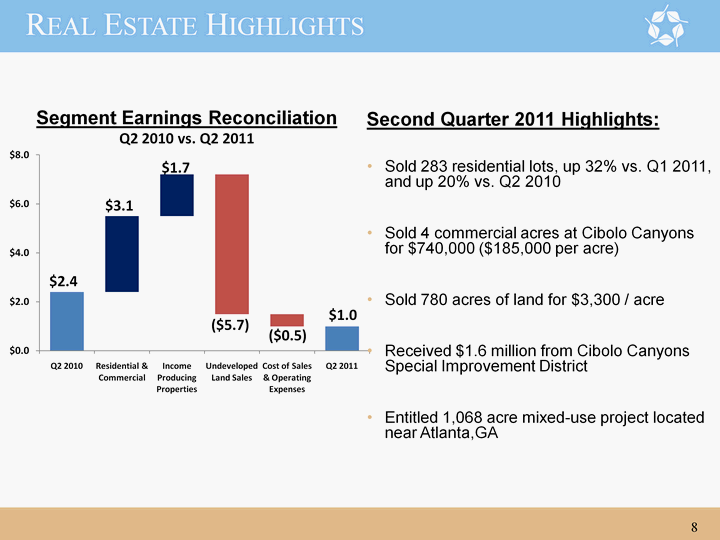
| REAL ESTATE HIGHLIGHTS Second Quarter 2011 Highlights: Sold 283 residential lots, up 32% vs. Q1 2011, and up 20% vs. Q2 2010 Sold 4 commercial acres at Cibolo Canyons for $740,000 ($185,000 per acre) Sold 780 acres of land for $3,300 / acre Received $1.6 million from Cibolo Canyons Special Improvement District Entitled 1,068 acre mixed-use project located near Atlanta, GA Segment Earnings Reconciliation Q2 2010 vs. Q2 2011 8 |

| REAL ESTATE SEGMENT RESULTS 2nd Qtr 2011 2nd Qtr 2010 1st Qtr 2011 Residential Lot Sales * Lots Sold 283 235 214 Average Price / Lot $52,400 $50,300 $48,200 Gross Profit / Lot $20,600 $15,500 $18,500 Commercial Tract Sales * Acres Sold 4.0 14.6 20.0 Average Price / Acre $185,300 $58,800 $152,500 Land Sales * Acres Sold 780 1,470 2,630 Average Price / Acre $3,300 $5,600 $2,300 Segment Revenues ($ mm) $19.6 $21.5 $21.1 Segment Earnings ($ mm) $1.0 $2.4 $2.6 * Includes 100% of venture activity Residential Lot Sales and Margin Q2 2010 - Q2 2011 Residential Lots Under Contract Q2 2010 - Q2 2011 9 |

| SIGNIFICANT VALUE CREATION THROUGH ENTITLEMENT WITH MINIMAL CAPITAL INVESTMENT Entitlements 1,068 total acres 1,591 Single-family lots 954 Housing units* 133k sq.ft. Commercial Previous zoning only allowed development of 300 residential lots Located near Atlanta MSA Site Plan Burt Creek * Housing units include multifamily, condo, townhome and independent living Locator Map 10 Atlanta |

| STRATEGIC AND DISCIPLINED INVESTMENT IN OUR BUSINESS Houston, Texas Houston, TX MSA Solid market fundamentals: 7.1 months of supply - New Home 7.9 months of supply - Existing Home Foreclosure Inv. - 1.2% of mortgages Positive Job Growth 54,300 jobs created since Q2 2010 Increased housing affordability Campus Acquisition: Acquired non-performing bank loan for $21mm Secured by a first lien on 900 acres - Discovery at Spring Trails community Master-planned, mixed-use development in Houston, Texas MSA near The Woodlands Previous owner investment - $49mm Equity $17mm Debt $32mm Real Estate: 1st and 2nd move-up housing - $170k - $400k 6 active builders in project 900 acres remaining 2,043 remaining lots (including 90 developed lots) 19 commercial acres 11 |

| Timberland Sale 50,000 acres $1,500 per acre Location: Alabama - 15,000 acres Georgia - 35,000 acres Forestar reservations: Mineral rights 1,000 acres of mitigation participation rights Expected to close in 3rd Qtr. EXECUTING OUR NEAR-TERM STRATEGIC INITIATIVES Timberland Sales Activity 12 |

| MAXIMIZING SHAREHOLDER VALUE 13 |

| RECOGNIZING AND CREATING VALUE THROUGH MULTIFAMILY Financing (60 - 70% LTV) Multifamily business model is to leverage our own investment and existing sites with capital from our partners to create and realize value Multifamily Development Ribelin Ranch - Austin, Texas Insert Site Map Units 289 units Total Investment* $30.5 million Forestar Land Basis: $4.5 million 14 Equity Investment * (10 - 20%) Equity Investment (80 - 90%) $ * Will include Forestar's land basis |

| FIBER RESOURCES HIGHLIGHTS Segment Earnings Reconciliation Q2 2010 vs. Q2 2011 Second Quarter 2011 Highlights: Sold 83,000 tons of fiber About 98% of land available leased for recreational purposes 15 |

| FIBER RESOURCES SEGMENT RESULTS 2nd Qtr 2011 2nd Qtr 2010 1st Qtr 2011 Fiber Sales Pulpwood Tons Sold 70,700 95,600 65,600 Average Pulpwood Price / Ton $9.22 $10.89 $9.18 Sawtimber Tons Sold 12,700 23,800 15,500 Average Sawtimber Price / Ton $15.69 $20.36 $16.98 Total Tons Sold 83,400 119,400 81,100 Average Price / Ton $10.21 $12.78 $10.67 Recreational Leases Average Acres Leased 197,400 212,600 200,000 Average Lease Rate / Acre $8.96 $8.16 $8.91 Segment Revenues ($ mm) $1.3 $2.0 $1.4 Segment Earnings ($ mm) $0.7 $1.1 $0.6 Recreational Leases Q2 2010 - Q2 2011 Fiber Sales Q2 2010 - Q2 2011 16 |

| MINERAL RESOURCES HIGHLIGHTS Segment Earnings Reconciliation Q2 2010 vs. Q2 2011 Second Quarter 2011 Highlights: Executed exploration agreements on 28,500 net mineral acres in Louisiana Leased over 2,500 net mineral acres in Louisiana and Texas Five new oil and gas wells completed by exploration and production lessees 501 active wells, up 19 wells vs. Q2 2010 17 * Includes water resources expenses associated with central Texas groundwater leases |

| MINERAL RESOURCES SEGMENT RESULTS Forestar's Share of Oil & Gas Production Q2 2010 - Q2 2011 Leasing, Seismic and Exploration Agreements Q2 2010 - Q2 2011 2nd Qtr 2011 2nd Qtr 2010 1st Qtr 2011 Leasing Activity Net Acres Leased 2,532 - 4,900 Avg. Bonus / Acre $187 - $343 Royalties* Natural Gas Produced (MMCF) 373.5 508.5 466.8 Average Price / MCF $3.92 $4.63 $3.72 Oil Produced (Barrels) 27,900 30,500 32,000 Average Price / Barrel $102.23 $74.78 $82.49 Total MMcfe 540.9 691.4 658.6 Average Price / MMcfe $7.98 $6.70 $6.64 Segment Revenues ($ mm) $4.6 $4.6 $7.3 Segment Earnings ($ mm) $3.1 $4.3 $5.6 Wells Completed 5 8 2 Active Wells * (end of period) 501 482 496 * Includes our share of ventures Note: Wells owned and operated by third party lessees / operators 18 |

| EAST TEXAS DRILLING ACTIVITY Note: Wells owned by third-party lessee / operator Acres Leased Available for Lease Held by Production Haynesville Well Permits Haynesville Drilling Activity Producing Bssr-Hysv Wells Waiting on Completion Forestar Royalty Interest Q2 2011 Bossier-Haynesville Activity In East Texas*: 31 rigs in the area (all drilling Bossier- Haynesville wells) 47 wells drilled 61 wells waiting on completion Note: Shaded area represents the total area of Bossier-Haynesville formation activity * East Texas area includes Shelby, Sabine, San Augustine, Nacogdoches & Angelina counties Kodiak 1H - Crimson Expl. 8.82 MMCFD on 15/64 Ck West Spoon GU 1H Chesapeake Operating Waiting on Completion Bengal 1H - Crimson Expl. 4.20 MMCFD on 18/64 Ck Sunrise GU 1H EOG Resources 12.16 MMCFD on 18/64 Ck Teal Unit 1H EOG Resources Waiting on Completion Zap Minerals 1H EOG Resources Waiting on Completion BSI Unit A-47 2H EnCana Oil and Gas Currently Drilling H Nelson 1H Goodrich Petroleum 12.38 MMCFD on 14/64 Ck Forestar 1 Leor Exploration Waiting on Completion 19 |

| LOUISIANA MINERALS ACTIVITY Note: Wells owned by third-party lessee / operator Leasing: 2,500 acres leased (including Texas) $187 / acre Exploration Agreements: 28,500 net mineral acres Q2 2011 Activity Acres Leased Q2 2011 Acres Leased Prior to Q1 Available for Lease Held by Production Seismic Option Exploration Agreements Almost 67,000 net mineral acres "put in play" during 2011 in Louisiana and Texas * 20 Significant Operators - Louisiana Significant Operators - Louisiana Significant Operators - Louisiana * Includes leases, seismic and exploration agreements |

| GREATEST VALUE FROM EVERY ACRE 21 Placed almost 67,000 net mineral acres in play in Louisiana and Texas Entitled 1,068 acre project near Atlanta, GA MSA Entered into definitive agreement to sell 50k acres of timberland for $75 million Disciplined acquisition of non-performing bank loan secured by real estate located in strategic market Developing multifamily platform - initiated construction of project in Austin Positioning Forestar's water interests to provide sustainable solutions for future water needs of central Texas and the I-35 growth corridor Poised and well positioned despite difficult market conditions |

| 22 |
