| SECURITIES AND EXCHANGE COMMISSION | |||
| Washington, D.C. 20549 | |||
| _________________________ | |||
| FORM 8-K | |||
| CURRENT REPORT | |||
| Pursuant to Section 13 or 15(d) of the | |||
| Securities Exchange Act of 1934 | |||
| Date of Report: August 1, 2011 | |||
| (Date of earliest event reported) | |||
| PRINCIPAL FINANCIAL GROUP, INC. | |||
| (Exact name of registrant as specified in its charter) | |||
| Delaware | 1-16725 | 42-1520346 | |
| (State or other jurisdiction | (Commission file number) | (I.R.S. Employer | |
| of incorporation) | Identification Number) | ||
| 711 High Street, Des Moines, Iowa 50392 | |||
| (Address of principal executive offices) | |||
| (515) 247-5111 | |||
| (Registrant’s telephone number, including area code) | |||
| Check the appropriate box below if the Form 8-K filing is intended to simultaneously satisfy the filing obligation of the | |||
| registrant under any of the following provisions: | |||
| [ ] | Written communications pursuant to Rule 425 under the Securities Act (17 CFR 230.425) | ||
| [ ] | Soliciting material pursuant to Rule 14a-12 under the Exchange Act (17 CFR 240.14a-12) | ||
| [ ] | Pre-commencement communications pursuant to Rule 14d-2(b) under the Exchange Act (17 CFR | ||
| 240.14d-2(b)) | |||
| [ ] | Pre-commencement communications pursuant to Rule 13e-4(c) under the Exchange Act (17 CFR | ||
| 240.13e-4(c)) | |||
| _______________________ | |||
| Page 2 | |
| Item 2.02. Results of Operations and Financial Condition | |
| On August 1, 2011, Principal Financial Group, Inc. publicly announced information regarding its | |
| results of operations and financial condition for the quarter ended June 30, 2011. The text of the | |
| announcement is included herewith as Exhibit 99. | |
| Item 9.01 Financial Statements and Exhibits | |
| 99 Second Quarter 2011 Earnings Release | |
| SIGNATURE | |
| Pursuant to the requirements of the Securities Exchange Act of 1934, the registrant has duly | |
| caused this report to be signed on its behalf by the undersigned thereunto duly authorized. | |
| PRINCIPAL FINANCIAL GROUP, INC. | |
| By: ___/s/ Terrance J. Lillis | |
| Name: Terrance J. Lillis | |
| Title: Senior Vice President and Chief Financial | |
| Officer | |
| Date: August 2, 2011 | |
| Page 3 | ||
| EXHIBIT 99 | ||
| Release: On receipt, August 1, 2011 | ||
| Media contact: Susan Houser, 515-248-2268, houser.susan@principal.com | ||
| Investor contact: John Egan, 515-235-9500, egan.john@principal.com | ||
| Principal Financial Group, Inc. Announces Second Quarter 2011 Results | ||
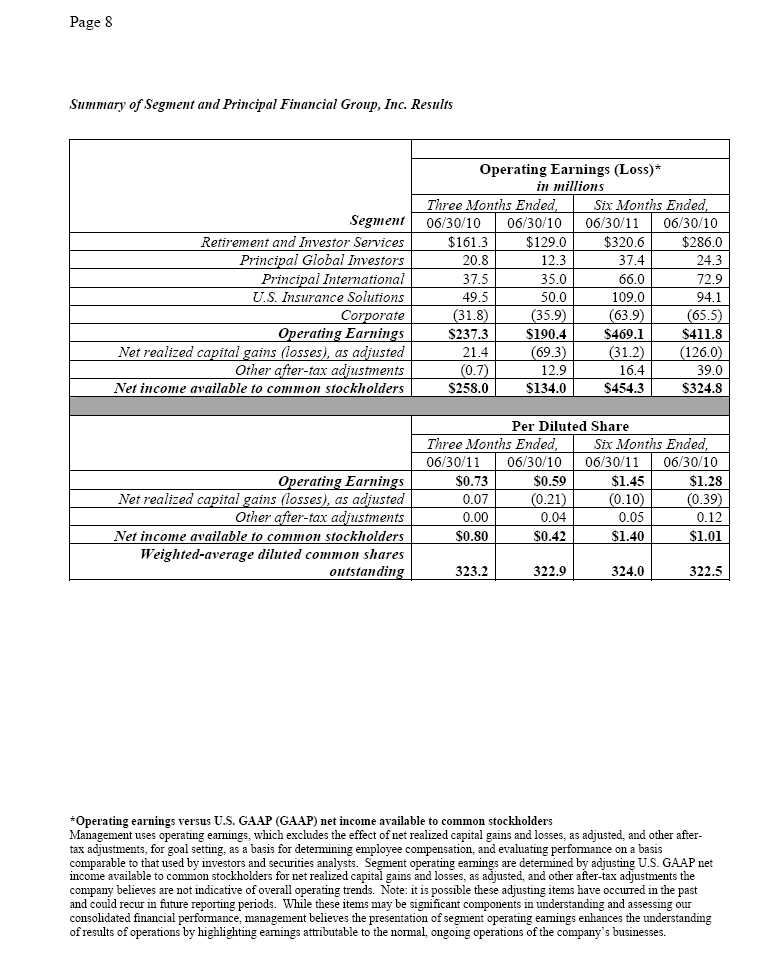
| • | Second quarter 2011 operating earnings1 of $237 million, an increase of 25 percent over second | |
| quarter 2010; net income available to common shareholders of $258 million, an increase of 93 | ||
| percent over second quarter 2010. | ||
| • | Year-to-date operating earnings of $469 million, an increase of 14 percent over the same period | |
| in 2010; year-to-date net income available to common shareholders of $454 million, an increase | ||
| of 40 percent over the same period in 2010. | ||
| • | Record assets under management of $335.8 billion at the end of second quarter 2011, an | |
| increase of 18 percent compared to second quarter 2010. | ||
| (Des Moines, Iowa) – Principal Financial Group, Inc. (NYSE: PFG) today announced results for second quarter | ||
| 2011. The company reported operating earnings of $237.3 million for second quarter 2011, compared to $190.4 | ||
| million for second quarter 2010. Operating earnings per diluted share (EPS) were $0.73 for second quarter | ||
| 2011, compared to $0.59 for second quarter 2010. The company reported net income available to common | ||
| stockholders of $258.0 million, or $0.80 per diluted share for second quarter 2011, compared to $134.0 million, | ||
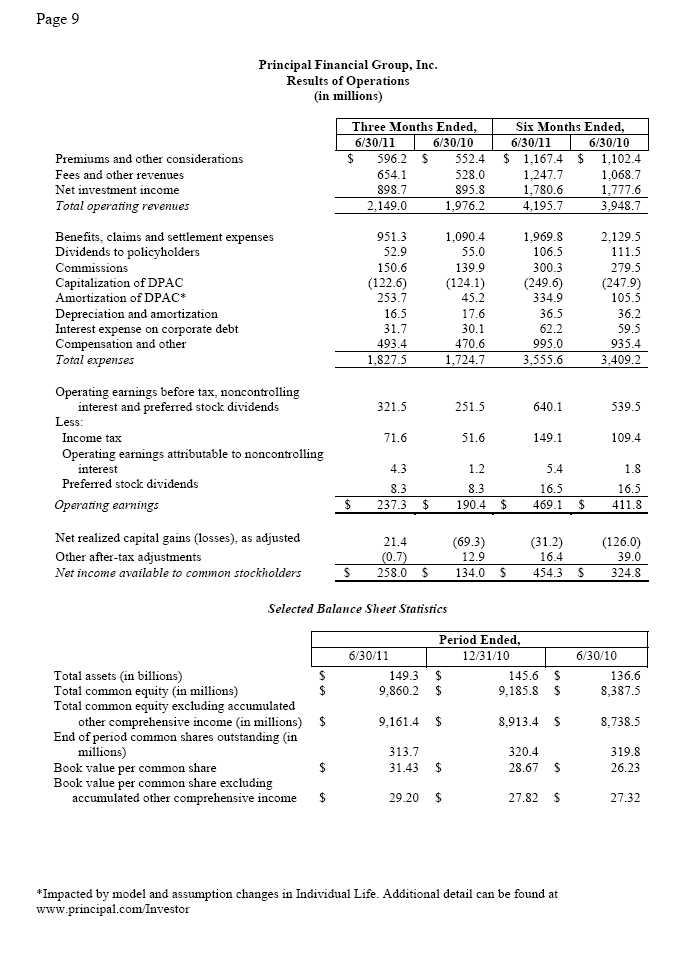
| or $0.42 per diluted share for second quarter 2010. Operating revenues for second quarter 2011 were $2,149.0 | ||
| million compared to $1,976.2 million for the same period last year. | ||
| “The Principal® saw very positive results in the second quarter, contributing to a strong first half of | ||
| 2011. We ended the quarter once again with record assets under management for the total company as well as | ||
| in Principal International, and record account values in Retirement and Investor Services,” said Larry D. | ||
| Zimpleman, chairman, president and chief executive officer of Principal Financial Group, Inc. “Despite an | ||
| economic recovery that remains fragile, we continue to see strong growth and increasing earnings from our | ||
| businesses.” | ||
| “Additionally, our strong financial position allows us to invest in our businesses for future growth | ||
| and to also return capital to shareholders.” said Zimpleman. “Since the beginning of the year, we’ve agreed to | ||
| invest in future growth with the acquisitions of HSBC’s Mexican mandatory retirement business and in | ||
| majority stakes in two London-based asset managers: Finisterre Capital and Origin Asset Management. We | ||
| also returned capital to shareholders, completing our $250 million share repurchase authorization. We are | ||
| putting capital to work in ways that are accretive to earnings both in the short term and long term; are | ||
| meaningful to our strategy; and are beneficial to our shareholders. As our hybrid business model continues to | ||
| generate increasing amounts of free cash flow, we are on track to surpass our $700 million estimate for capital | ||
| deployment on acquisitions and share repurchase in 2011 and we’ll continue to work closely with our Board | ||
| to be prudent in our deployment of excess capital.” | ||
| _______________________ | ||
| 1 Use of non-GAAP financial measures is discussed in this release after Segment Highlights | ||
| Page 4 | |
| “Second quarter results demonstrate our strong operational leverage, with total company operating | |
| earnings up 25 percent over the year ago quarter on a 15 percent increase in average assets under management,” | |
| said Terry Lillis, senior vice president and chief financial officer. “In addition, we saw the best quarter of net | |
| income since before the financial crisis. On a year-to-date basis, net income is up 40 percent, or $130 million. Book | |
| value per share was another record this quarter and our excess capital position improved to $2.1 billion, even after | |
| buying back 7.7 million shares in the quarter. These metrics demonstrate our financial strength and flexibility, | |
| which will serve us well through the rest of the year and into 2012.” | |
| Key Highlights for the Second Quarter | |
| • | Strong sales in the company’s three key U.S. Retirement and Investor Services products in the second |
| quarter, with $1.7 billion for Full Service Accumulation, $2.6 billion for Principal Funds and $460 | |
| million for Individual Annuities. In addition, Principal Global Investors was awarded $2.7 billion in new | |
| mandates. | |
| • | Net cash flows of $1.8 billion for Principal International, $990 million for Full Service Accumulation, $530 |
| million for Principal Funds and $400 million for unaffiliated assets for Principal Global Investors. | |
| • | Record total company assets under management of $335.8 billion, including a record $53.0 billion of assets |
| under management for Principal International. | |
| • | Strong capital position with an estimated risk based capital ratio of 445 percent at quarter end and |
| approximately $2.1 billion of excess capital.2 | |
| • | Principal Financial Group bought back 7.7 million shares of common stock in the second quarter at an |
| average share price of $29.90. The remainder of the $250 million authorization was completed in the first | |
| week of July, bringing the year-to-date total number of shares repurchased to 8.4 million. | |
| • | Book value per share, excluding AOCI3 increased to a record high of $29.20, up 7 percent over second |
| quarter 2010. | |
| • | Operating Return on Average Equity excluding AOCI of 10.1%. |
| Net Income | |
| Net income available to common stockholders of $258.0 million for second quarter 2011 reflects net realized | |
| capital gains of $21.4 million, which include: | |
| • | $46.0 million of gains from the partial sale of our interest in an investment, |
| • | $28.4 million of losses related to credit gains and losses on sales and permanent impairments of fixed |
| maturity securities, including $23.1 million of losses on commercial mortgage backed securities, and | |
| • | $2.8 million of losses on commercial mortgage whole loans. |
| Segment Highlights | |
| Retirement and Investor Services | |
| Segment operating earnings for second quarter 2011 were $161.3 million, compared to $129.0 million | |
| for the same period in 2010. Full Service Accumulation earnings increased 22 percent from the year ago quarter | |
| to $83.0 million, reflecting an 18 percent increase in average account values. Principal Funds earnings increased | |
| 28 percent from a year ago to $13.2 million, primarily due to a 24 percent increase in average account values. | |
| Individual Annuities earnings were $30.6 million compared to $22.6 million for second quarter 2010. The | |
| positive variance reflects record account values. The accumulation businesses4 had record account values of | |
| $169.3 billion at June 30, 2011. | |
| ____________________ | |
| 2 Excess capital includes cash at the holding company and capital at the life company above that needed to maintain a | |
| 350 percent NAIC risk based capital ratio for the life company. | |
| 3 Accumulated Other Comprehensive Income | |
| 4 Full Service Accumulation, Principal Funds, Individual Annuities and Bank and Trust Services | |
| Page 5 |
| Operating revenues for second quarter 2011 were $1,044.1 million compared to $1,021.3 million |
| for the same period in 2010, primarily due to higher revenues for the accumulation businesses, which |
| improved $60.0 million, or 8 percent, from a year ago quarter. This was partially offset by a $35 million |
| decline in revenues in the Investment Only business. |
| Segment assets under management were $183.6 billion as of June 30, 2011, compared to $157.9 |
| billion as of June 30, 2010. |
| Principal Global Investors |
| Segment operating earnings for second quarter 2011 were $20.8 million, compared to $12.3 million in |
| the prior year quarter, primarily due to an increase in assets under management and additional operating |
| leverage. |
| Operating revenues for second quarter were $136.3 million, compared to $114.3 million for the same |
| period in 2010, primarily due to higher management and transaction fees. |
| Unaffiliated assets under management were $79.5 billion as of June 30, 2011, compared to $71.2 |
| billion as of June 30, 2010. |
| Principal International |
| Segment operating earnings were $37.5 million in second quarter 2011, compared to $35.0 million |
| in the prior year quarter. The improvement was primarily due to an increase in assets under management and a |
| $1.7 million after-tax benefit from gains on the sale of bonds in our Brazilian joint venture. Second quarter 2010 |
| results included two months of a higher economic interest in our Brazilian joint venture. Adjusting for the |
| mentioned gains and the change in ownership, year over year earnings grew in line with the 38 percent growth |
| in average assets under management. |
| Operating revenues were $227.4 million for second quarter 2011, compared to $188.2 million for the |
| same period in 2010, primarily due to growth in assets under management. |
| Segment assets under management were a record $53.0 billion as of June 30, 2011, up from $38.1 |
| billion as of June 30, 2010. This includes a record $5.9 billion of net cash flows over the trailing twelve |
| months, or 15 percent of beginning of period assets under management. Reported assets under management |
| do not include an additional $7.2 billion of assets managed by our Chinese joint venture. |
| U.S. Insurance Solutions |
| Segment operating earnings for second quarter 2011 were $49.5 million, compared to $50.0 million |
| for the same period in 2010. Specialty Benefits earnings were $25.9 million in second quarter 2011, up from |
| $24.0 million for the same period in 2010, driven by membership growth and stable loss ratio results. |
| Individual Life earnings were $23.6 million in the second quarter, compared to $26.0 million in second |
| quarter 2010. This reflects a $4 million shortfall for model and assumption changes and $3 million shortfall due to |
| unfavorable mortality experience in second quarter 2011.We believe the run rate for Individual Life remains at $31 to |
| $33 million per quarter. |
| Page 6 |
| Segment operating revenues for second quarter 2011 were $781.1 million compared to $687.3 million |
| for the same period a year ago, primarily due to significantly higher business owner and executive life |
| insurance sales and positive trends in both sales and lapses in Specialty Benefits. |
| Corporate |
| Operating losses for second quarter 2011 were $31.8 million compared to operating losses of $35.9 |
| million in second quarter 2010. |
| Forward looking and cautionary statements |
| This press release contains forward-looking statements, including, without limitation, statements as to |
| operating earnings, net income available to common stockholders, net cash flows, realized and unrealized |
| gains and losses, capital and liquidity positions, sales and earnings trends, and management's beliefs, |
| expectations, goals and opinions. The company does not undertake to update these statements, which are |
| based on a number of assumptions concerning future conditions that may ultimately prove to be inaccurate. |
| Future events and their effects on the company may not be those anticipated, and actual results may differ |
| materially from the results anticipated in these forward-looking statements. The risks, uncertainties and |
| factors that could cause or contribute to such material differences are discussed in the company's annual report |
| on Form 10-K for the year ended Dec. 31, 2010, and in the company’s quarterly report on Form 10-Q for the |
| quarter ended March 31, 2011, filed by the company with the Securities and Exchange Commission, as |
| updated or supplemented from time to time in subsequent filings. These risks and uncertainties include, |
| without limitation: adverse capital and credit market conditions may significantly affect the company’s ability |
| to meet liquidity needs, access to capital and cost of capital; continued difficult conditions in the global capital |
| markets and the economy generally; continued volatility or further declines in the equity markets; changes in |
| interest rates or credit spreads; the company’s investment portfolio is subject to several risks that may diminish |
| the value of its invested assets and the investment returns credited to customers; the company’s valuation of |
| securities may include methodologies, estimations and assumptions that are subject to differing interpretations; |
| the determination of the amount of allowances and impairments taken on the company’s investments requires |
| estimations and assumptions that are subject to differing interpretations; gross unrealized losses may be realized |
| or result in future impairments; competition from companies that may have greater financial resources, broader |
| arrays of products, higher ratings and stronger financial performance; a downgrade in the company’s financial |
| strength or credit ratings; inability to attract and retain sales representatives and develop new distribution |
| sources; international business risks; the company’s actual experience could differ significantly from its pricing |
| and reserving assumptions; the company’s ability to pay stockholder dividends and meet its obligations may be |
| constrained by the limitations on dividends or distributions Iowa insurance laws impose on Principal Life; the |
| pattern of amortizing the company’s DPAC and other actuarial balances on its universal life-type insurance |
| contracts, participating life insurance policies and certain investment contracts may change; the company may |
| need to fund deficiencies in its “Closed Block” assets that support participating ordinary life insurance policies |
| that had a dividend scale in force at the time of Principal Life’s 1998 conversion into a stock life insurance |
| company; the company’s reinsurers could default on their obligations or increase their rates; risks arising from |
| acquisitions of businesses; changes in laws, regulations or accounting standards; a computer system failure or |
| security breach could disrupt the company’s business, and damage its reputation; results of litigation and |
| regulatory investigations; from time to time the company may become subject to tax audits, tax litigation or |
| similar proceedings, and as a result it may owe additional taxes, interest and penalties in amounts that may be |
| material; fluctuations in foreign currency exchange rates; and applicable laws and the company’s stockholder |
| rights plan, certificate of incorporation and by-laws may discourage takeovers and business combinations that |
| some stockholders might consider in their best interests. |
| Use of Non-GAAP Financial Measures |
| The company uses a number of non-GAAP financial measures that management believes are useful to |
| investors because they illustrate the performance of normal, ongoing operations, which is important in |
| understanding and evaluating the company’s financial condition and results of operations. They are not, |
| however, a substitute for U.S. GAAP financial measures. Therefore, the company has provided |
| reconciliations of the non-GAAP measures to the most directly comparable U.S. GAAP measure at the end |
| Page 7 | |
| of the release. The company adjusts U.S. GAAP measures for items not directly related to ongoing operations. | |
| However, it is possible these adjusting items have occurred in the past and could recur in the future reporting | |
| periods. Management also uses non-GAAP measures for goal setting, as a basis for determining employee | |
| and senior management awards and compensation, and evaluating performance on a basis comparable to | |
| that used by investors and securities analysts. | |
| Earnings Conference Call | |
| On Tuesday, August 2, 2011 at 10:00 a.m. (ET), Chairman, President and Chief Executive Officer Larry | |
| Zimpleman and Senior Vice President and Chief Financial Officer Terry Lillis will lead a discussion of | |
| results, asset quality and capital adequacy during a live conference call, which can be accessed as follows: | |
| • | Via live Internet webcast. Please go to www.principal.com/investor at least 10-15 minutes prior to the |
| start of the call to register, and to download and install any necessary audio software. | |
| • | Via telephone by dialing 800-374-1609 (U.S. and Canadian callers) or 706-643-7701 (International |
| callers) approximately 10 minutes prior to the start of the call. The access code is 79538107. | |
| • | Replay of the earnings call via telephone is available by dialing 800-642-1687 (U.S. and Canadian |
| callers) or 706-645-9291 (International callers). The access code is 79538107. This replay will be | |
| available approximately two hours after the completion of the live earnings call through the end of day | |
| August 9, 2011. | |
| • | Replay of the earnings call via webcast as well as a transcript of the call will be available after the call at: |
| www.principal.com/investor. | |
| The company's financial supplement and additional investment portfolio detail for second quarter 2011 is | |
| currently available at www.principal.com/investor, and may be referred to during the call. | |
| About the Principal Financial Group | |
| The Principal Financial Group® (The Principal ® )5 is a leader in offering businesses, individuals and | |
| institutional clients a wide range of financial products and services, including retirement and investment | |
| services, insurance, and banking through its diverse family of financial services companies. A member of the | |
| Fortune 500, the Principal Financial Group has $335.8 billion in assets under management6 and serves some | |
| 16.5 million customers worldwide from offices in Asia, Australia, Europe, Latin America and the United | |
| States. Principal Financial Group, Inc. is traded on the New York Stock Exchange under the ticker symbol | |
| PFG. For more information, visit www.principal.com. | |
| ### | |
| 5 “The Principal Financial Group” and “The Principal” are registered service marks of Principal Financial Services, | |
| Inc., a member of the Principal Financial Group. | |
| 6 As of June 30, 2011 | |