Attached files
| file | filename |
|---|---|
| EX-99.3 - EX-99.3 - HEALTHCARE TRUST OF AMERICA, INC. | p18985exv99w3.htm |
| EX-99.1 - EX-99.1 - HEALTHCARE TRUST OF AMERICA, INC. | p18985exv99w1.htm |
| 8-K - FORM 8-K - HEALTHCARE TRUST OF AMERICA, INC. | p18985e8vk.htm |
Exhibit 99.2
SUPPLEMENTAL FINANCIAL INFORMATION: FIRST QUARTER 2011
Partnering with Healthcare Systems and Physicians
Contact Us
Healthcare Trust of America, Inc.
16435 North Scottsdale Road, Suite 320
Scottsdale, AZ 85254
Telephone: (480) 998-3478
Fax: (480) 991-0755
Email: info@htareit.com
Website: www.htareit.com
SUPPLEMENTAL FINANCIAL INFORMATION: FIRST QUARTER 2011
Table of Contents
CORPORATE
3 | Senior Management, Board of Directors and Other Information
4 | HTA Corporate Profile
6 | Healthcare Sector Strengths & Fundamentals
7 | Featured Key Market — Arizona
8 | Featured Key Market — South Carolina
9 | Featured Key Market — Texas
10 | Achievements as a Self-Managed REIT
11 | HTA Overview as of March 31, 2011
INVESTMENT
12 | HTA Acquisition Timeline
13 | Gross Investment Activity
FINANCIAL
14 | Condensed Consolidated Statements of Operations
15 | Condensed Consolidated Balance Sheets
16 | Consolidated Funds from Operations, Modified Funds from Operations, Normalized Funds from
Operations and Adjusted Funds from Operations
17 | Reconciliation of Net Income to Net Operating Income, EBITDA and Debt Ratios
18 | Covenant Requirements
19 | Schedule of Consolidated Debt
PORTFOLIO
20 | Portfolio Summary
23 | Medical Office Building Summary
24 | Healthcare System Relationships and Quality Tenants
25 | Glossary / Definitions
SUPPLEMENTAL FINANCIAL INFORMATION: FIRST QUARTER 2011
| 3 Company Information Senior Management Scott D. Peters Kellie S. Pruitt Mark D. Engstrom Chairman, Chief Executive Officer, Chief Financial Officer, Executive Vice President & President Secretary and Treasurer Acquisitions Amanda L. Houghton, CFA Katherine E. Black, CPA Senior Vice President Controller and Asset Management & Finance Assistant Secretary Sean D. Leahy Dawna H. Powell Brendan R. Magee Vice President Vice President Vice President Regional Asset Management Regional Asset Management Regional Asset Management Board of Directors Scott D. Peters W. Brad Blair, II Maurice J. DeWald Chairman, Chief Executive Officer, Director and Chairman of Director and Chairman of & President Investment Committee Audit Committee Warren D. Fix Larry L. Mathis Gary T. Wescombe Director and Chairman of Director and Chairman of Director and Chairman of Nominating and Corporate Risk Management Committee Compensation Committee Governance Committee Other Information Corporate Headquarters Midwest Regional Office Southeast Regional Office 16435 North Scottsdale Road, Suite 320 201 N. Pennsylvania Parkway, Suite 201 3690 Bohicket Rd., Suite 2- D Scottsdale, AZ 85254 Indianapolis, IN 46280 Johns Island, SC 29455 (480) 998- 3478 Forward-Looking Statements This supplemental information contains certain forward-looking statements with respect to HTA. Forward-looking statements are statements that are not descriptions of historical facts and include statements regarding management’s intentions, beliefs, expectations, plans or predictions of the future, within the meaning of Section 27A of the Securities Act of 1933, as amended, and Section 21E of the Securities Exchange Act of 1934, as amended. Because such statements include risks, uncertainties and contingencies, actual results may differ materially from those expressed or implied by such forward-looking statements. These risks, uncertainties and contingencies include, but are not limited to, the following: uncertainties relating to changes in general economic and real estate conditions; uncertainties relating to the implementation of recent healthcare legislation; uncertainties regarding changes in the healthcare industry; the uncertainties relating to the implementation of HTA’s real estate investment strategy; and other risk factors as outlined in HTA’s periodic reports, as filed with the Securities and Exchange Commission. SUPPLEMENTAL FINANCIAL INFORMATION: FIRST QUARTER 2011 |
HTA Corporate Profile
Data as of:
March 31, 2011
Investment Concentration:
Distribution Rate:
7.25%
Top 5 Tenants (based on gross GLA) 18%
Gross Real Estate Assets:
$2.30 billion
Top 5 States (based on gross GLA) 52%
Gross Leasable Area:
11,107,000 square feet
Weighted Average Shares
Outstanding (basic and diluted):
215 million
Healthcare Trust of America, Inc., or HTA, was incorporated on April 20, 2006. HTA is a
fully integrated, self-administered, and self-managed real estate investment trust, or REIT. HTA’s
internal management team employs a hands-on approach to its operations. HTA has over 50 employees
focused on acquiring, owning and operating high-quality medical office buildings that are
predominantly located on the campuses of nationally recognized healthcare systems in U.S. major
metropolitan areas. HTA is a full-service real estate company with acquisitions and asset
management services performed in-house, with certain monitored services provided by third parties
at market rates. Since its formation in 2006, HTA has made 78 portfolio acquisitions valued at
$2.3 billion based on purchase price, which includes 242 buildings and two other real
estate-related assets. HTA’s portfolio totals 11.1 million square feet and includes 218 medical
office buildings, ten hospitals, nine skilled nursing and assisted living facilities and five
healthcare-related office buildings located in 25 states.
Partnering with Healthcare Systems & Physicians. Through management’s experience and our
portfolio acquisitions, we have developed extensive long-term relationships with healthcare
systems, physician groups, developers, lenders, brokers and other real estate professionals. In
2010, over 50% of our acquisitions were identified and made available to us through off-market
sources where there was no formal sales process. We believe these strong relationships with our
hospital systems and physician tenants drive incremental demand for our medical office building
(“MOB”) space, increased tenant retention rates and provide us with further investment
opportunities.
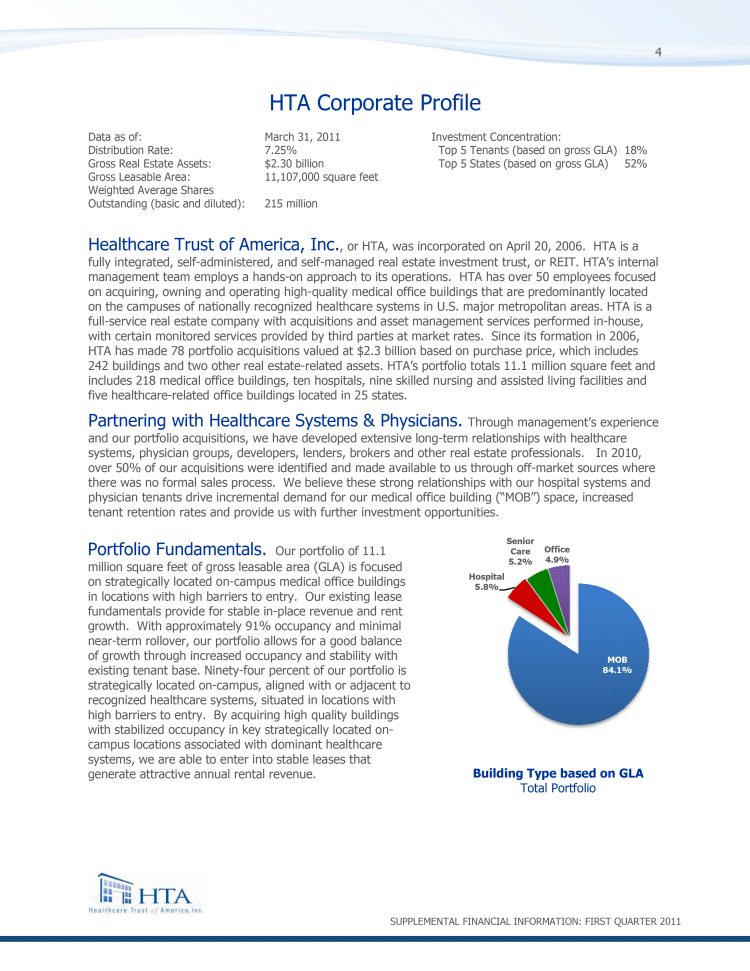
Portfolio Fundamentals. Our portfolio of 11.1 million square feet of gross leasable
area (GLA) is focused on strategically located on-campus medical office buildings in locations with
high barriers to entry. Our existing lease fundamentals provide for stable in-place revenue and
rent growth. With approximately 91% occupancy and minimal near-term rollover, our portfolio allows
for a good balance of growth through increased occupancy and stability with existing tenant base.
Ninety-four percent of our portfolio is strategically located on-campus, aligned with or adjacent
to recognized healthcare systems, situated in locations with high barriers to entry. By acquiring
high quality buildings with stabilized occupancy in key strategically located on-campus locations
associated with dominant healthcare systems, we are able to enter into stable leases that generate
attractive annual rental revenue.
SUPPLEMENTAL FINANCIAL INFORMATION: FIRST QUARTER 2011
HTA Corporate Profile, continued
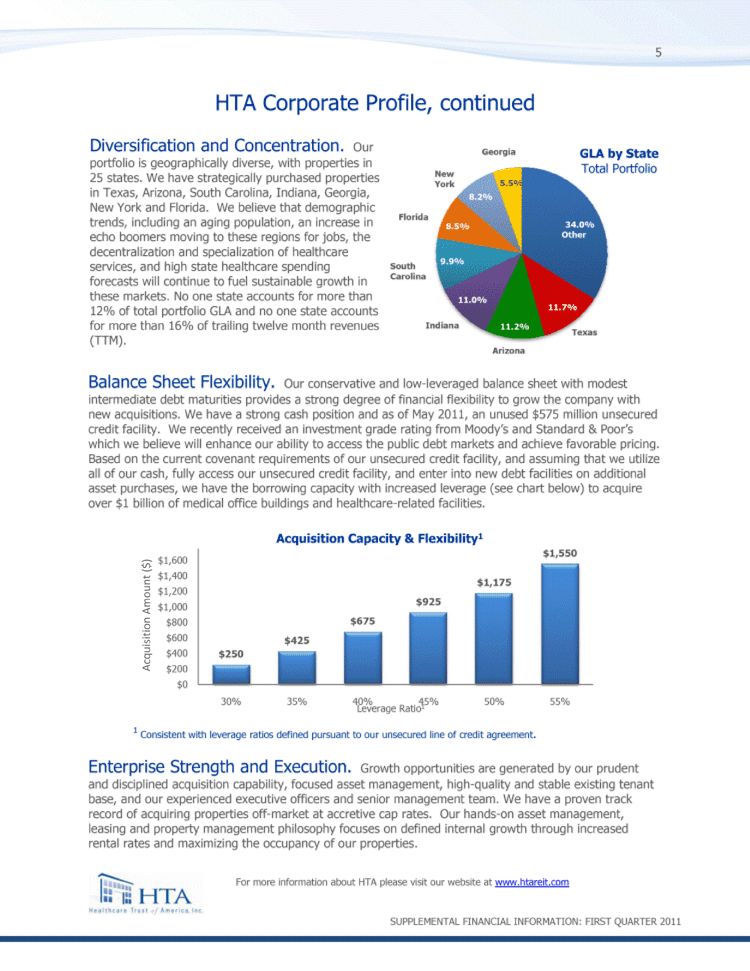
Diversification and Concentration. Our portfolio is geographically diverse, with
properties in 25 states. We have strategically purchased properties in Texas, Arizona, South
Carolina, Indiana, Georgia, New York and Florida. We believe that demographic trends, including an
aging population, an increase in echo boomers moving to these regions for jobs, the
decentralization and specialization of healthcare services, and high state healthcare spending
forecasts will continue to fuel sustainable growth in these markets. No one state accounts for more
than 12% of total portfolio GLA and no one state accounts for more than 16% of trailing twelve
month revenues (TTM).
Balance Sheet Flexibility. Our conservative and low-leveraged balance sheet with
modest intermediate debt maturities provides a strong degree of financial flexibility to grow the
company with new acquisitions. We have a strong cash position and as of May 2011, an unused $575
million unsecured credit facility. We recently received an investment grade rating from Moody’s
and Standard & Poor’s which we believe will enhance our ability to access the public debt markets
and achieve favorable pricing. Based on the current covenant requirements of our unsecured credit
facility, and assuming that we utilize all of our cash, fully access our unsecured credit facility,
and enter into new debt facilities on additional asset purchases, we have the borrowing capacity
with increased leverage (see chart below) to acquire over $1 billion of medical office buildings
and healthcare-related facilities.
1 Consistent with leverage ratios defined pursuant to our
unsecured line of credit agreement.
Enterprise Strength and Execution. Growth opportunities are generated by our
prudent and disciplined acquisition capability, focused asset management, high-quality and stable
existing tenant base, and our experienced executive officers and senior management team. We have a
proven track record of acquiring properties off-market at accretive cap rates. Our hands-on asset
management, leasing and property management philosophy focuses on defined internal growth through
increased rental rates and maximizing the occupancy of our properties.
For more information about HTA please visit our website at www.htareit.com
SUPPLEMENTAL FINANCIAL INFORMATION: FIRST QUARTER 2011
Healthcare Sector Strengths & Fundamentals
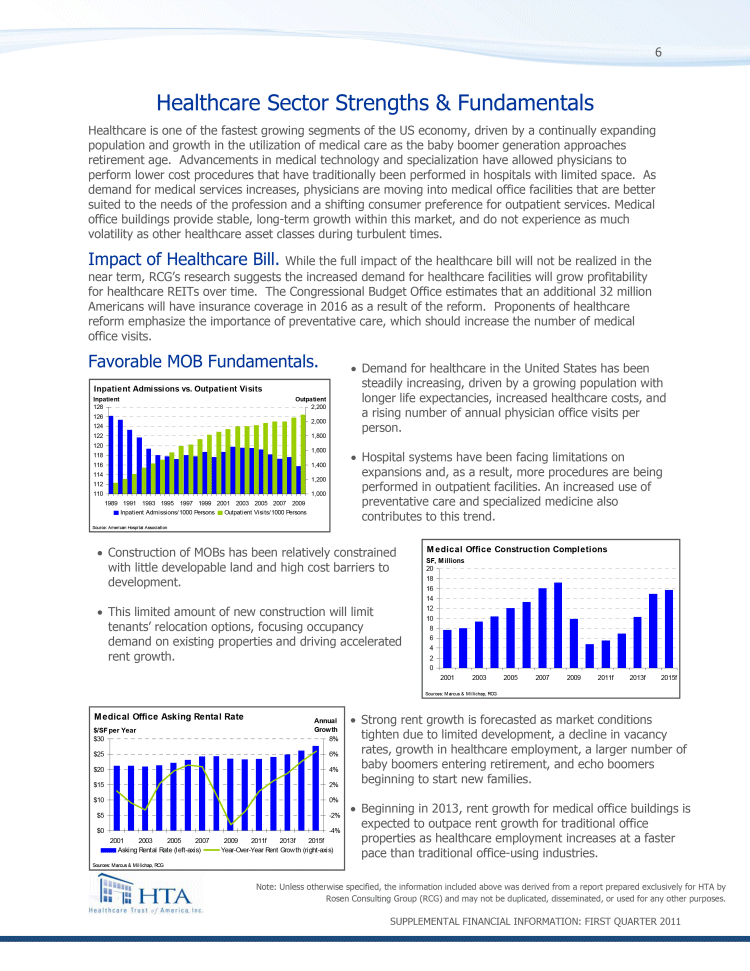
Healthcare is one of the fastest growing segments of the US economy, driven by a continually
expanding population and growth in the utilization of medical care as the baby boomer generation
approaches retirement age. Advancements in medical technology and specialization have allowed
physicians to perform lower cost procedures that have traditionally been performed in hospitals
with limited space. As demand for medical services increases, physicians are moving into medical
office facilities that are better suited to the needs of the profession and a shifting consumer
preference for outpatient services. Medical office buildings provide stable, long-term growth
within this market, and do not experience as much volatility as other healthcare asset classes
during turbulent times.
Impact of Healthcare Bill. While the full impact of the healthcare bill will not be
realized in the near term, RCG’s research suggests the increased demand for healthcare facilities
will grow profitability for healthcare REITs over time. The Congressional Budget Office estimates
that an additional 32 million Americans will have insurance coverage in 2016 as a result of the
reform. Proponents of healthcare reform emphasize the importance of preventative care, which
should increase the number of medical office visits.
Favorable MOB Fundamentals.
• Demand for healthcare in the United States has been steadily increasing, driven by a
growing population with longer life expectancies, increased healthcare costs, and a rising
number of annual physician office visits per person.
Hospital systems have been facing limitations on expansions and, as a result, more
procedures are being performed in outpatient facilities. An increased use of preventative care
and specialized medicine also contributes to this trend.
Construction of MOBs has been relatively constrained with little developable land and high
cost barriers to development.
This limited amount of new construction will limit tenants’ relocation options, focusing
occupancy demand on existing properties and driving accelerated rent growth.
Strong rent growth is forecasted as market conditions tighten due to limited development, a
decline in vacancy rates, growth in healthcare employment, a larger number of baby boomers
entering retirement, and echo boomers beginning to start new families.
Beginning in 2013, rent growth for medical office buildings is expected to outpace rent
growth for traditional office properties as healthcare employment increases at a faster pace
than traditional office-using industries.
Note: Unless otherwise specified, the information included above was derived from a report
prepared exclusively for HTA by
Rosen Consulting Group (RCG) and may not be duplicated,
disseminated, or used for any other purposes.
SUPPLEMENTAL FINANCIAL INFORMATION: FIRST QUARTER 2011
| 7 Featured Key Market — Arizona Arizona at a glance Phoenix is the sixth largest city in the US according to the US Census Bureau. Arizona was ranked #1 in the country for its workforce by CNBC.com based on the education level of its workforce and its number of available workers. Arizona has a current estimated population of 6.4 million and is the 14th most populous state in the US. Estrella Medical Center, Phoenix AZ Arizona Portfolio Acquired December, 2010 Our Arizona portfolio currently includes 36 buildings located in the greater Phoenix metro area and Tucson. Our portfolio is comprised of approximately 1.2 million square feet of GLA with a total investment of $233,070,000 based on purchase price. Our presence in the Arizona market dates back to 2007, the year in which we began acquiring assets. The largest tenant in our Arizona portfolio, Banner Health (Fitch AA-) occupies approximately 16% of our total Arizona portfolio. Our entire Arizona portfolio is strategically located on-campus or aligned with recognized healthcare systems, situated in locations with high barriers to entry. Arizona Market With a warm climate, low cost of living, and existing senior- Arizona Healthcare Spending Billions Annual Growth friendly infrastructure, Arizona’s reputation as a retirement $30 20% destination is unlikely to change. As a result, the number of 18% $25 16% Arizona residents aged 65 years and over is projected to $20 14% 12% increase by more than 1.4 million, or 157%, during the next $15 10% 20 years. This rapid growth of the elderly population, whose 8% $10 6% utilization of and spending on healthcare services outpaces $5 4% every other age group, will drive the need for medical office 2% $0 0% space in Arizona through the long term. 1980 1982 1984 1986 1988 1990 1992 1994 1996 1998 2000 2002 2004 Total Healthcare Spending (left-axis) Annual Growth (right-axis) In Arizona, the number of outpatient visits per person per Source: U.S. Centers for Medicare & Medicaid Services year increased to 1.2 in 2008 from a recent low of 0.9 in 2004. A higher number of visits per person coupled with a rising population compounded the growth in demand for physician services in Arizona, leading to higher demand for medical office space. With more people using medical services more often, the amount of spending on healthcare in Arizona increased Arizona in the News accordingly. Even during the most recent recession, June 17, 2011, The Phoenix Business Journal the healthcare industry continued to expand in reported that Phoenix-area hospitals are looking to Arizona. Rapid growth in the demand for medical hire 4,000 positions. services should continue to spur hiring in the Arizona July 11, 2011, Forbes ranked Phoenix as the ninth healthcare industry, particularly in physician offices, city best positioned to grow and prosper in the which should drive demand for medical office space. coming decade. Note: Unless otherwise specified, the information included above was derived from a report prepared exclusively for HTA by Rosen Consulting Group (RCG) and may not be duplicated, disseminated, or used for any other purposes. SUPPLEMENTAL FINANCIAL INFORMATION: FIRST QUARTER 2011 |
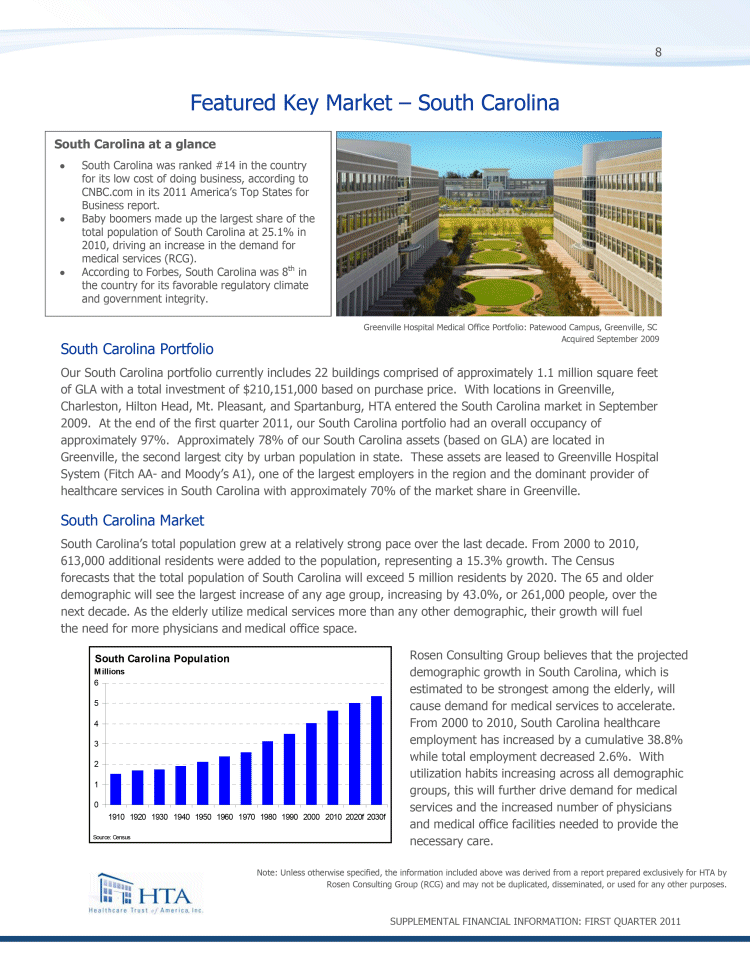
Featured Key Market — South Carolina
South Carolina at a glance
South Carolina was ranked #14 in the country for its low cost of doing business,
according to CNBC.com in its 2011 America’s Top States for Business report.
Baby boomers made up the largest share of the total population of South Carolina at 25.1%
in 2010, driving an increase in the demand for medical services (RCG).
According to Forbes, South Carolina was 8th in the country for its favorable regulatory
climate and government integrity.
Greenville Hospital Medical Office Portfolio: Patewood Campus, Greenville, SC Acquired September 2009
South Carolina Portfolio
Our South Carolina portfolio currently includes 22 buildings comprised of approximately 1.1
million square feet of GLA with a total investment of $210,151,000 based on purchase price. With
locations in Greenville, Charleston, Hilton Head, Mt. Pleasant, and Spartanburg, HTA entered the
South Carolina market in September 2009. At the end of the first quarter 2011, our South Carolina
portfolio had an overall occupancy of approximately 97%. Approximately 78% of our South Carolina
assets (based on GLA) are located in Greenville, the second largest city by urban population in
state. These assets are leased to Greenville Hospital System (Fitch AA- and Moody’s A1), one of
the largest employers in the region and the dominant provider of healthcare services in South
Carolina with approximately 70% of the market share in Greenville.
South Carolina Market
South Carolina’s total population grew at a relatively strong pace over the last decade. From
2000 to 2010, 613,000 additional residents were added to the population, representing a 15.3%
growth. The Census forecasts that the total population of South Carolina will exceed 5 million
residents by 2020. The 65 and older demographic will see the largest increase of any age group,
increasing by 43.0%, or 261,000 people, over the next decade. As the elderly utilize medical
services more than any other demographic, their growth will fuel the need for more physicians
and medical office space.
Rosen Consulting Group believes that the projected demographic growth in South Carolina, which
is estimated to be strongest among the elderly, will cause demand for medical services to
accelerate. From 2000 to 2010, South Carolina healthcare employment has increased by a cumulative
38.8% while total employment decreased 2.6%. With utilization habits increasing across all
demographic groups, this will further drive demand for medical services and the increased number of
physicians and medical office facilities needed to provide the necessary care.
Note: Unless otherwise specified, the information included above was derived from a report prepared exclusively for HTA by
Rosen Consulting Group (RCG) and may not be duplicated, disseminated, or used for any other purposes. SUPPLEMENTAL FINANCIAL INFORMATION: FIRST QUARTER 2011
Rosen Consulting Group (RCG) and may not be duplicated, disseminated, or used for any other purposes. SUPPLEMENTAL FINANCIAL INFORMATION: FIRST QUARTER 2011
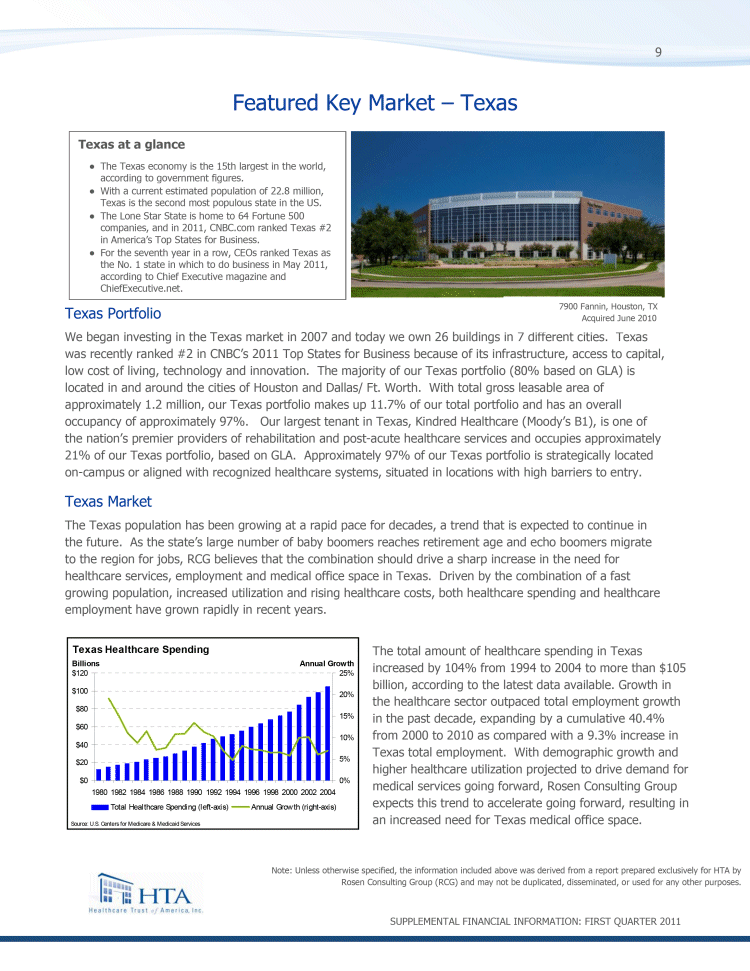
Featured Key Market — Texas
Texas at a glance
The Texas economy is the 15th largest in the world, according to government
figures.
With a current estimated population of 22.8 million, Texas is the second most
populous state in the US.
The Lone Star State is home to 64 Fortune 500 companies, and in 2011, CNBC.com
ranked Texas #2 in America’s Top States for Business.
For the seventh year in a row, CEOs ranked Texas as the No. 1 state in which to do business in May 2011, according to
Chief Executive magazine and ChiefExecutive.net.
7900 Fannin, Houston, TX Acquired June 2010
Texas Portfolio
We began investing in the Texas market in 2007 and today we own 26 buildings in 7 different
cities. Texas was recently ranked #2 in CNBC’s 2011 Top States for Business because of its
infrastructure, access to capital, low cost of living, technology and innovation. The majority of
our Texas portfolio (80% based on GLA) is located in and around the cities of Houston and Dallas/
Ft. Worth. With total gross leasable area of approximately 1.2 million, our Texas portfolio makes
up 11.7% of our total portfolio and has an overall occupancy of approximately 97%. Our largest
tenant in Texas, Kindred Healthcare (Moody’s B1), is one of the nation’s premier providers of
rehabilitation and post-acute healthcare services and occupies approximately 21% of our Texas
portfolio, based on GLA. Approximately 97% of our Texas portfolio is strategically located
on-campus or aligned with recognized healthcare systems, situated in locations with high barriers
to entry.
Texas Market
The Texas population has been growing at a rapid pace for decades, a trend that is expected to
continue in the future. As the state’s large number of baby boomers reaches retirement age and
echo boomers migrate to the region for jobs, RCG believes that the combination should drive a sharp
increase in the need for healthcare services, employment and medical office space in Texas. Driven
by the combination of a fast growing population, increased utilization and rising healthcare costs,
both healthcare spending and healthcare employment have grown rapidly in recent years.
The total amount of healthcare spending in Texas increased by 104% from 1994 to 2004 to more than
$105 billion, according to the latest data available. Growth in the healthcare sector outpaced
total employment growth in the past decade, expanding by a cumulative 40.4% from 2000 to 2010 as
compared with a 9.3% increase in Texas total employment. With demographic growth and higher
healthcare utilization projected to drive demand for medical services going forward, Rosen
Consulting Group expects this trend to accelerate going forward, resulting in an increased need for
Texas medical office space.
Note: Unless otherwise specified, the information included above was derived from a report prepared exclusively for HTA by
Rosen Consulting Group (RCG) and may not be duplicated, disseminated, or used for any other purposes.
SUPPLEMENTAL FINANCIAL INFORMATION: FIRST QUARTER 2011
| 10 Achievements as a Self-Managed REIT March 2011 — HTA reached $2.3bn in real estate assets. November 2010 — Entered into $275 3/31/2011 YTD Equity million unsecured Raise = $215,649,000 September 2009 — credit facility led by JP Third-party Morgan, Wells Fargo, property and Deutsche Bank. management services 2011 July 2011 — commenced on Achieved August 2009 — multi-tenant investment grade Healthcare Trust buildings. rating from of America Moody’s and established (name Standard & Poor’s. change). 12/31/2010 YTD Equity Raise = $611,509,000 May 2011 — Increased unsecured credit facility to $575 million. 2010 Lenders include JP Morgan, Wells Fargo, Deutsche Bank, US Bank, July 2009 — Fifth Third Bank, Capital One Bank, Transitioned asset Regions, Compass, Bank of Nova management, Scotia, Union Bank, and Sumitomo accounting and treasury October 2010 — Mitsui Banking Corporation. functions in-house Bought out limited partner interest of February 2009 former advisor. 2011 — 12/31/2009 YTD Equity Closed $2.2 November 2008 — Raise = $630,689,000 billion follow-Transitioned to 12/31/2008 YTD Equity Raise = $526,352,000 on offering. self-management. Reduction in fees. March 2010 — Closed initial offering, 2008 launched follow-on December 2010 — offering of $2.2 Stockholders approved billion. Realty Capital an 18-month phased-Securities utilized as in liquidity program HTA’s 3rd party based upon a listing. January 2009 dealer manager. — Established corporate offices in August 2009 —Scottsdale, AZ. Transitioned all transfer agent and shareholder services to DST Systems. Operational events Events related to our equity offering Financial events SUPPLEMENTAL FINANCIAL INFORMATION: FIRST QUARTER 2011 |
| 11 HTA Overview as of March 31, 2011 Gross real estate assets ($bn) $2.30 Total invested real estate related assets ($bn) $1.87 Total real estate related portfolios / buildings 78 / 242 Total GLA 11.1mm Total debt to invested real estate related asset ratio 39.0% Financial leverage (based on gross real estate assets) 31.6% Debt/LTM EBITDA 5.5x Weighted average fixed interest rate on portfolio 6.02% Weighted average variable interest rate on portfolio 2.42% Cash on hand ($mm) $207.4 QTD Total revenues ($mm) $70.1 QTD NOI ($mm) $47.0 QTD EBITDA ($mm) $38.7 QTD Funds from operations (FFO) ($mm) $28.8 QTD Modified funds from operations (MFFO) ($mm) $29.9 QTD Normalized funds from operations (Normalized FFO) ($mm) $28.1 QTD Adjusted funds from operations (AFFO) ($mm) $21.7 Total equity raised since inception ($bn) $2.2 Distribution rate on $10/share 7.25% Average remaining lease term for all buildings (years) 6.9 Average remaining lease term for single-tenant buildings (years) (34.5% of total portfolio GLA) 8.7 Average remaining lease term for multi-tenant buildings (years) (65.5% of total portfolio GLA) 5.7 Weighted average age of properties based on GLA (years) 17 Occupancy 91% Investment Grade Tenants (based on leased GLA) 36% March 2011 On v. Off Campus Single v. Multi-Tenant GLA Based on GLA Total Portfolio 6% On-Campus / Health System Single Aligned 34.5% Off-Campus / Multi 94% Not Aligned 65.5% SUPPLEMENTAL FINANCIAL INFORMATION: FIRST QUARTER 2011 |
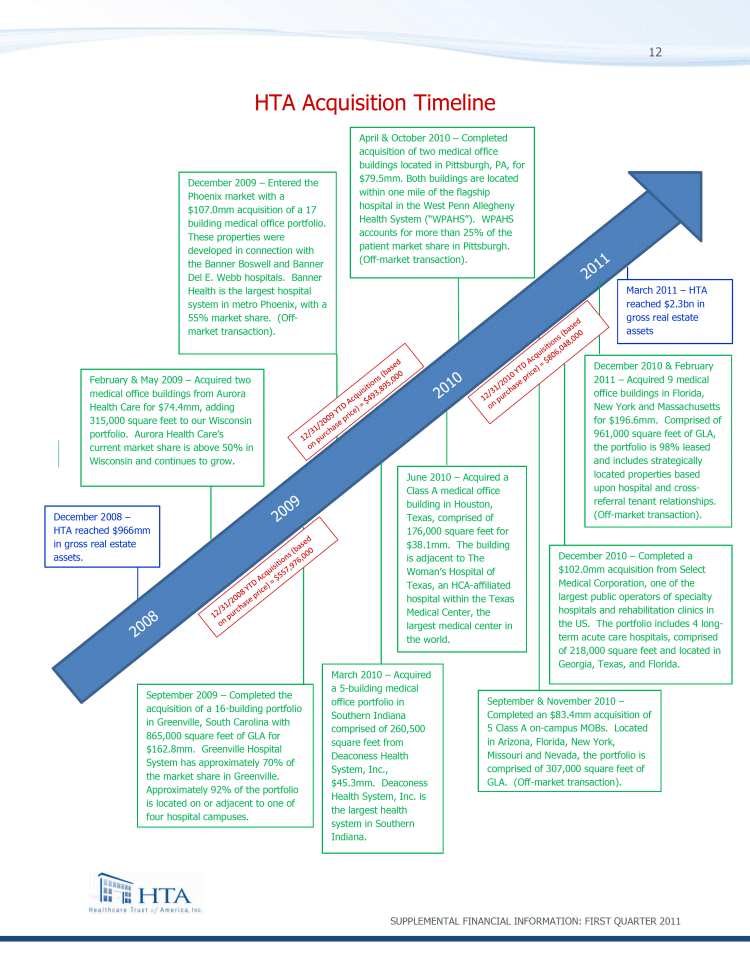
12 HTA Acquisition Timeline April & October 2010 — Completed acquisition of two
medical office buildings located in Pittsburgh, PA, for December 2009 — Entered the $79.5mm.
Both buildings are located Phoenix market with a within one mile of the flagship $107.0mm
acquisition of a 17 hospital in the West Penn Allegheny building medical office portfolio.
Health System (“WPAHS”). WPAHS These properties were accounts for more than 25% of the developed
in connection with patient market share in Pittsburgh. 2011 the Banner Boswell and Banner
(Off-market transaction). Del E. Webb hospitals. Banner Health is the largest hospital March
2011 — HTA system in metro Phoenix, with reached $2.3bn in a 55% market share. (Off- gross real
estate market transaction). assets 12/31/2010 YTD Acquisitions (based 2010 on purchase price) =
$806,048,000 December 2010 & February February & May 2009 — Acquired two 2011 — Acquired 9
medical medical office buildings from Aurora 12/31/2009 YTD Acquisitions (based office buildings
in Florida, Health Care for $74.4mm, adding on purchase price) = $493,895,000 New York and
Massachusetts 315,000 square feet to our Wisconsin for $196.6mm. Comprised of portfolio. Aurora
Health Care’s 961,000 square feet of GLA, current market share is above 50% in the portfolio is
98% leased Wisconsin and continues to grow. and includes strategically June 2010 — Acquired a
located properties based Class A medical office upon hospital and cross-2009 referral tenant
relationships. building in Houston, December 2008 — Texas, comprised of (Off-market
transaction). HTA reached 176,000 square feet for $966mm in gross real $38.1mm. The building
estate assets. is adjacent to The December 2010 — Completed a 12/31/2008 YTD Acquisitions (based
Woman’s Hospital of $102.0mm acquisition from Select on purchase price) = $557,976,000 Texas, an
HCA-affiliated Medical Corporation, one of the hospital within the Texas largest public operators
of specialty 2008 Medical Center, the hospitals and rehabilitation clinics in largest medical
center in the US. The portfolio includes 4 the world. long-term acute care hospitals, comprised
of 218,000 square feet and located in Georgia, Texas, and March 2010 — Acquired Florida. a
5-building medical September 2009 — Completed the office portfolio in acquisition of a 16-building
portfolio September & November 2010 —Southern Indiana in Greenville, South Carolina with
Completed an $83.4mm acquisition of comprised of 260,500 865,000 square feet of GLA for 5 Class A
on-campus MOBs. Located square feet from $162.8mm. Greenville Hospital in Arizona, Florida, New
York, Deaconess Health System has approximately 70% of Missouri and Nevada, the portfolio is
System, Inc., the market share in Greenville. comprised of 307,000 square feet of $45.3mm.
Deaconess Approximately 92% of the portfolio GLA. (Off-market transaction). Health System, Inc.
is is located on or adjacent to one of the largest health four hospital campuses. system in
Southern Indiana. SUPPLEMENTAL FINANCIAL INFORMATION: FIRST QUARTER 2011
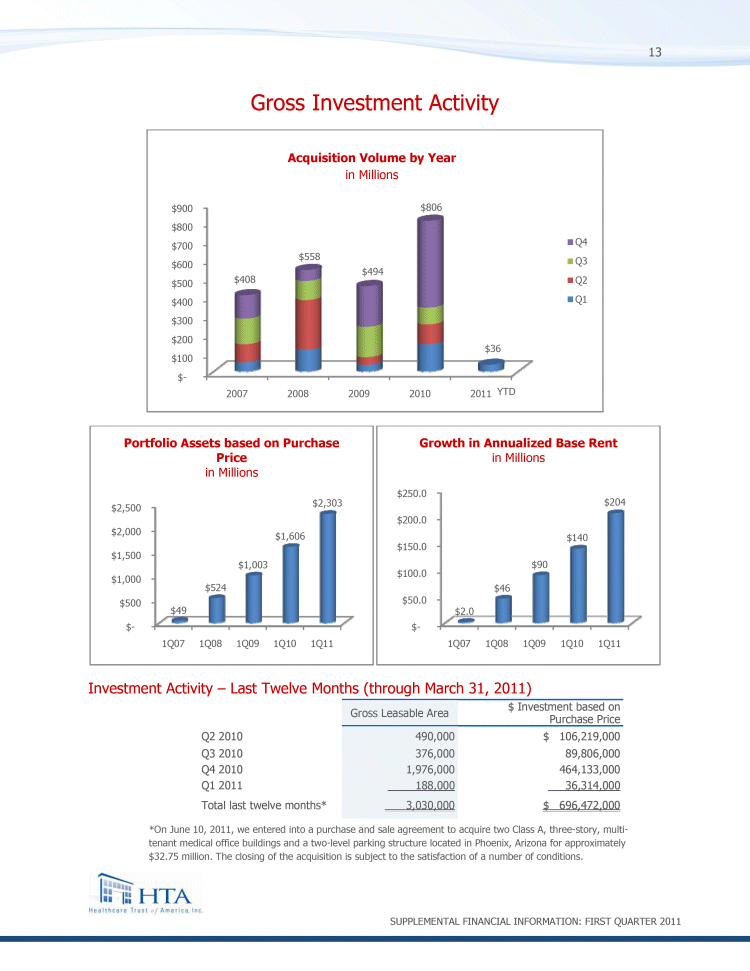
13 Gross Investment Activity Acquisition Volume by Year in Millions $900 $806 $800 $700 Q4
$558 Q3 $600 $494 $500 $408 Q2 $400 Q1 $300 $200 $36 $100 $-2007 2008 2009 2010 2011 YTD
Portfolio Assets based on Purchase Growth in Annualized Base Rent Price in Millions in Millions
$250.0 $2,303 $204 $2,500 $200.0 $2,000 $1,606 $140 $150.0 $1,500 $1,003 $90 $100.0 $1,000 $524 $46
$500 $50.0 $49 $2.0 $- $-1Q07 1Q08 1Q09 1Q10 1Q11 1Q07 1Q08 1Q09 1Q10 1Q11 Investment Activity —
Last Twelve Months (through March 31, 2011) $ Investment based on Gross Leasable Area Purchase
Price Q2 2010 490,000 $106,219,000 Q3 2010 376,000 89,806,000 Q4 2010 1,976,000 464,133,000 Q1
2011 188,000 36,314,000 Total last twelve months* 3,030,000 $696,472,000 *On June 10, 2011, we
entered into a purchase and sale agreement to acquire two Class A, three-story, multi-tenant
medical office buildings and a two-level parking structure located in Phoenix, Arizona for
approximately $32.75 million. The closing of the acquisition is subject to the satisfaction of a
number of conditions. SUPPLEMENTAL FINANCIAL INFORMATION: FIRST QUARTER 2011
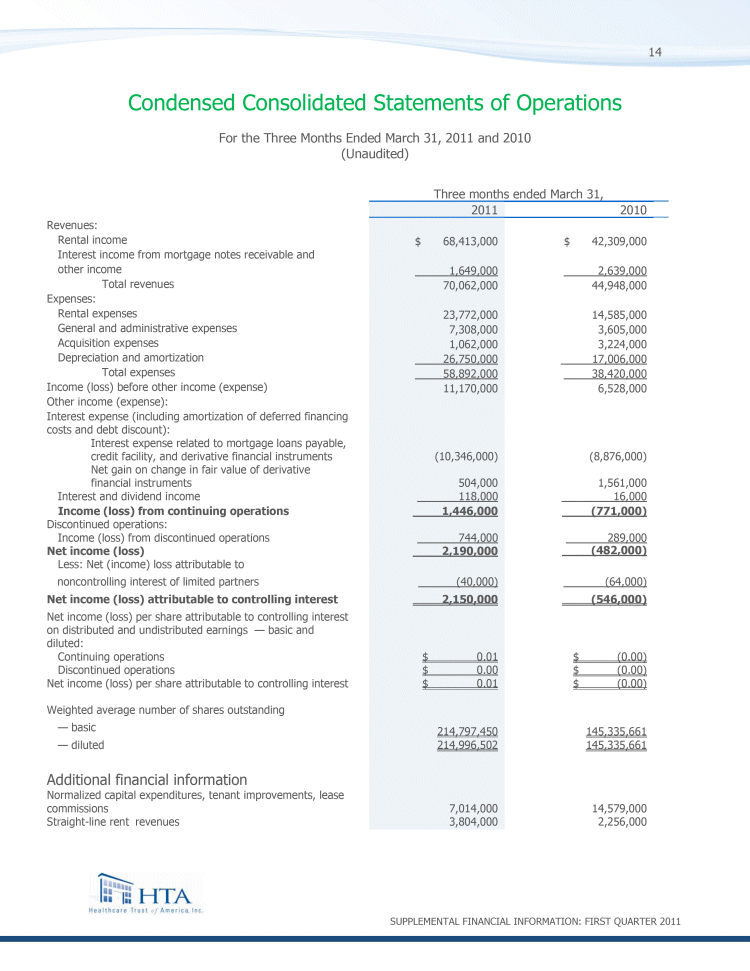
Condensed Consolidated Statements of Operations
For the Three Months Ended March 31, 2011 and 2010
(Unaudited)
Three months ended March 31,
2011
2010
Revenues:
Rental income
$68,413,000
$42,309,000
Interest income from mortgage notes receivable and
other income
1,649,000
2,639,000
Total revenues
70,062,000
44,948,000
Expenses:
Rental expenses
23,772,000
14,585,000
General and administrative expenses
7,308,000
3,605,000
Acquisition expenses
1,062,000
3,224,000
Depreciation and amortization
26,750,000
17,006,000
Total expenses
58,892,000
38,420,000
Income (loss) before other income (expense)
11,170,000
6,528,000
Other income (expense):
Interest expense (including amortization of deferred financing
costs and debt discount):
Interest expense related to mortgage loans payable,
credit facility, and derivative financial
instruments
(10,346,000
)
(8,876,000
)
Net gain on change in fair value of derivative
financial instruments
504,000
1,561,000
Interest and dividend income
118,000
16,000
Income (loss) from continuing operations
1,446,000
(771,000
)
Discontinued operations:
Income (loss) from discontinued operations
744,000
289,000
Net income (loss)
2,190,000
(482,000
)
Less: Net (income) loss attributable to
noncontrolling interest of limited partners
(40,000
)
(64,000
)
Net income (loss) attributable to controlling interest
2,150,000
(546,000
)
Net income (loss) per share attributable to controlling
interest on distributed and undistributed earnings — basic
and diluted:
Continuing operations
$0.01
$(0.00
)
Discontinued operations
$0.00
$(0.00
)
Net income (loss) per share attributable to controlling interest
$0.01
$(0.00
)
Weighted average number of shares outstanding
— basic
214,797,450
145,335,661
— diluted
214,996,502
145,335,661
Additional financial information
Normalized capital expenditures, tenant improvements, lease
commissions
7,014,000
14,579,000
Straight-line rent revenues
3,804,000
2,256,000
SUPPLEMENTAL FINANCIAL INFORMATION: FIRST QUARTER 2011
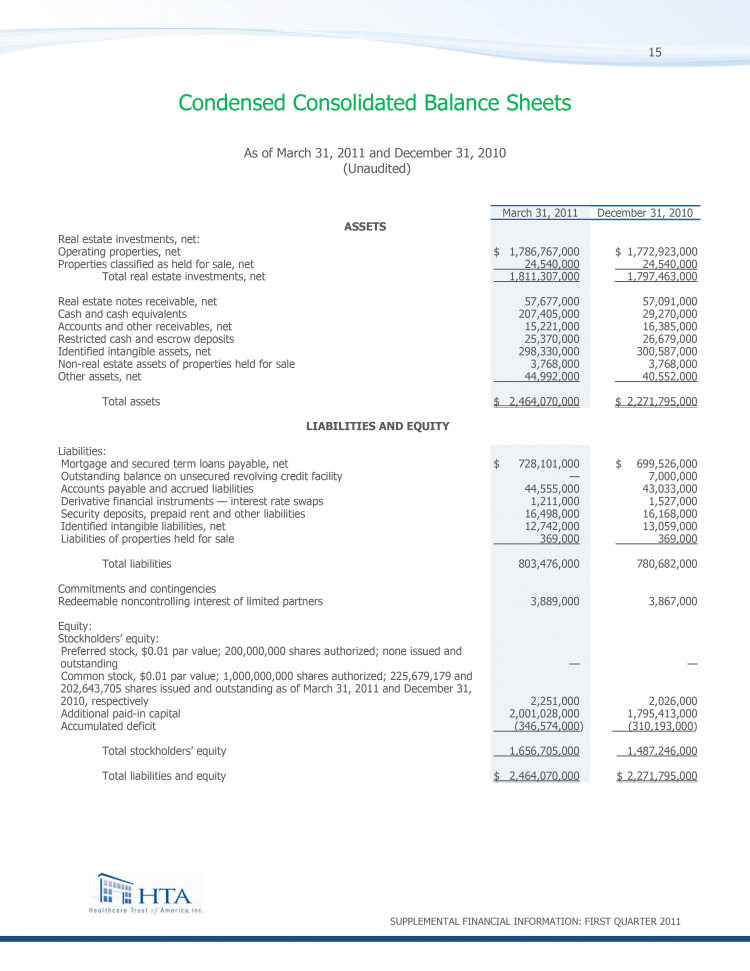
Condensed Consolidated Balance Sheets
As of March 31, 2011 and December 31, 2010
(Unaudited)
March 31, 2011December 31, 2010
ASSETS
Real estate investments, net:
Operating properties, net
$
1,786,767,000
$
1,772,923,000
Properties classified as held for sale, net
24,540,000
24,540,000
Total real estate investments, net
1,811,307,000
1,797,463,000
Real estate notes receivable, net
57,677,000
57,091,000
Cash and cash equivalents
207,405,000
29,270,000
Accounts and other receivables, net
15,221,000
16,385,000
Restricted cash and escrow deposits
25,370,000
26,679,000
Identified intangible assets, net
298,330,000
300,587,000
Non-real estate assets of properties held for sale
3,768,000
3,768,000
Other assets, net
44,992,000
40,552,000
Total assets
$
2,464,070,000
$
2,271,795,000
LIABILITIES AND EQUITY
Liabilities:
Mortgage and secured term loans payable, net
$
728,101,000
$
699,526,000
Outstanding balance on unsecured revolving credit facility
—
7,000,000
Accounts payable and accrued liabilities
44,555,000
43,033,000
Derivative financial instruments — interest rate swaps
1,211,000
1,527,000
Security deposits, prepaid rent and other liabilities
16,498,000
16,168,000
Identified intangible liabilities, net
12,742,000
13,059,000
Liabilities of properties held for sale
369,000
369,000
Total liabilities
803,476,000
780,682,000
Commitments and contingencies
Redeemable noncontrolling interest of limited partners
3,889,000
3,867,000
Equity:
Stockholders’ equity:
Preferred stock, $0.01 par value; 200,000,000 shares authorized; none issued and outstanding
—
—
Common stock, $0.01 par value; 1,000,000,000 shares authorized; 225,679,179 and 202,643,705
shares issued and outstanding as of March 31, 2011 and December 31, 2010, respectively
2,251,000
2,026,000
Additional paid-in capital
2,001,028,000
1,795,413,000
Accumulated deficit
(346,574,000
)
(310,193,000
)
Total stockholders’ equity
1,656,705,000
1,487,246,000
Total liabilities and equity
$
2,464,070,000
$
2,271,795,000
SUPPLEMENTAL FINANCIAL INFORMATION: FIRST QUARTER 2011
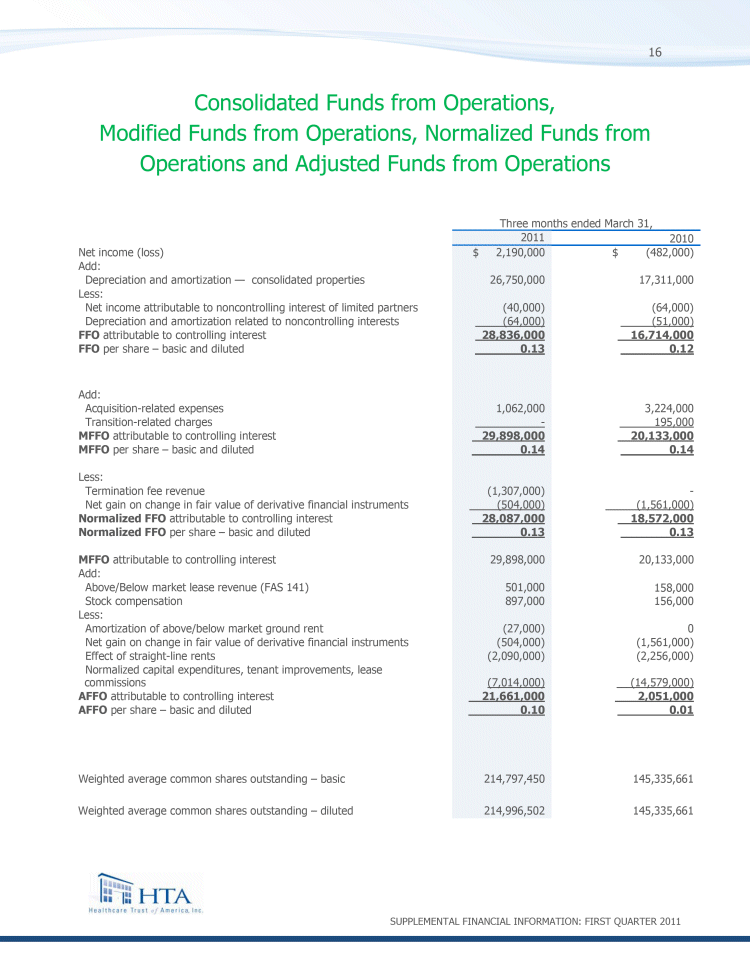
Consolidated Funds from Operations,
Modified Funds from Operations, Normalized Funds from
Operations and Adjusted Funds from Operations
Three months ended March 31,
2011
2010
Net income (loss)
$
2,190,000
$
(482,000
)
Add:
Depreciation and amortization — consolidated properties
26,750,000
17,311,000
Less:
Net income attributable to noncontrolling interest of limited partners
(40,000
)
(64,000
)
Depreciation and amortization related to noncontrolling interests
(64,000
)
(51,000
)
FFO attributable to controlling interest
28,836,000
16,714,000
FFO per share — basic and diluted
0.13
0.12
Add:
Acquisition-related expenses
1,062,000
3,224,000
Transition-related charges
—
195,000
MFFO attributable to controlling interest
29,898,000
20,133,000
MFFO per share — basic and diluted
0.14
0.14
Less:
Termination fee revenue
(1,307,000
)
—
Net gain on change in fair value of derivative financial instruments
(504,000
)
(1,561,000
)
Normalized FFO attributable to controlling interest
28,087,000
18,572,000
Normalized FFO per share — basic and diluted
0.13
0.13
MFFO attributable to controlling interest
29,898,000
20,133,000
Add:
Above/Below market lease revenue (FAS 141)
501,000
158,000
Stock compensation
897,000
156,000
Less:
Amortization of above/below market ground rent
(27,000
)
0
Net gain on change in fair value of derivative financial instruments
(504,000
)
(1,561,000
)
Effect of straight-line rents
(2,090,000
)
(2,256,000
)
Normalized capital expenditures, tenant improvements, lease commissions
(7,014,000
)
(14,579,000
)
AFFO attributable to controlling interest
21,661,000
2,051,000
AFFO per share — basic and diluted
0.10
0.01
Weighted average common shares outstanding — basic
214,797,450
145,335,661
Weighted average common shares outstanding — diluted
214,996,502
145,335,661
SUPPLEMENTAL FINANCIAL INFORMATION: FIRST QUARTER 2011
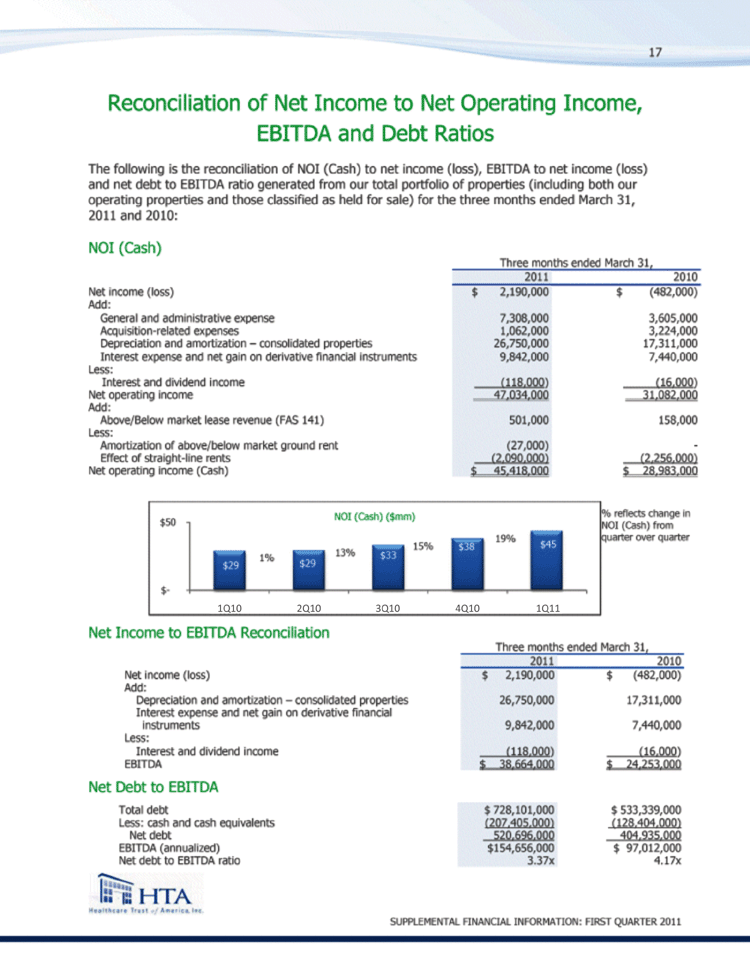
Reconciliation of Net Income to Net Operating Income,
EBITDA and Debt Ratios
The following is the reconciliation of NOI (Cash) to net income (loss), EBITDA to net income
(loss) and net debt to EBITDA ratio generated from our total portfolio of properties (including
both our operating properties and those classified as held for sale) for the three months ended
March 31, 2011 and 2010:
NOI (Cash)
Three months ended March 31,
2011
2010
Net income (loss)
$
2,190,000
$
(482,000
)
Add:
General and administrative expense
7,308,000
3,605,000
Acquisition-related expenses
1,062,000
3,224,000
Depreciation and amortization — consolidated properties
26,750,000
17,311,000
Interest expense and net gain on derivative financial instruments
9,842,000
7,440,000
Less:
Interest and dividend income
(118,000
)
(16,000
)
Net operating income
47,034,000
31,082,000
Add:
Above/Below market lease revenue (FAS 141)
501,000
158,000
Less:
Amortization of above/below market ground rent
(27,000
)
—
Effect of straight-line rents
(2,090,000
)
(2,256,000
)
Net operating income (Cash)
$
45,418,000
$
28,983,000
Net Income to EBITDA Reconciliation
Three months ended March 31,
2011
2010
Net income (loss)
$
2,190,000
$
(482,000
)
Add:
Depreciation and amortization — consolidated properties
26,750,000
17,311,000
Interest expense and net gain on derivative financial instruments
9,842,000
7,440,000
Less:
Interest and dividend income
(118,000
)
(16,000
)
EBITDA
$
38,664,000
$
24,253,000
Net Debt to EBITDA
Total debt
$
728,101,000
$
533,339,000
Less: cash and cash equivalents
(207,405,000
)
(128,404,000
)
Net debt
520,696,000
404,935,000
EBITDA (annualized)
$
154,656,000
$
97,012,000
Net debt to EBITDA ratio
3.37
x
4.17
x
SUPPLEMENTAL FINANCIAL INFORMATION: FIRST QUARTER 2011
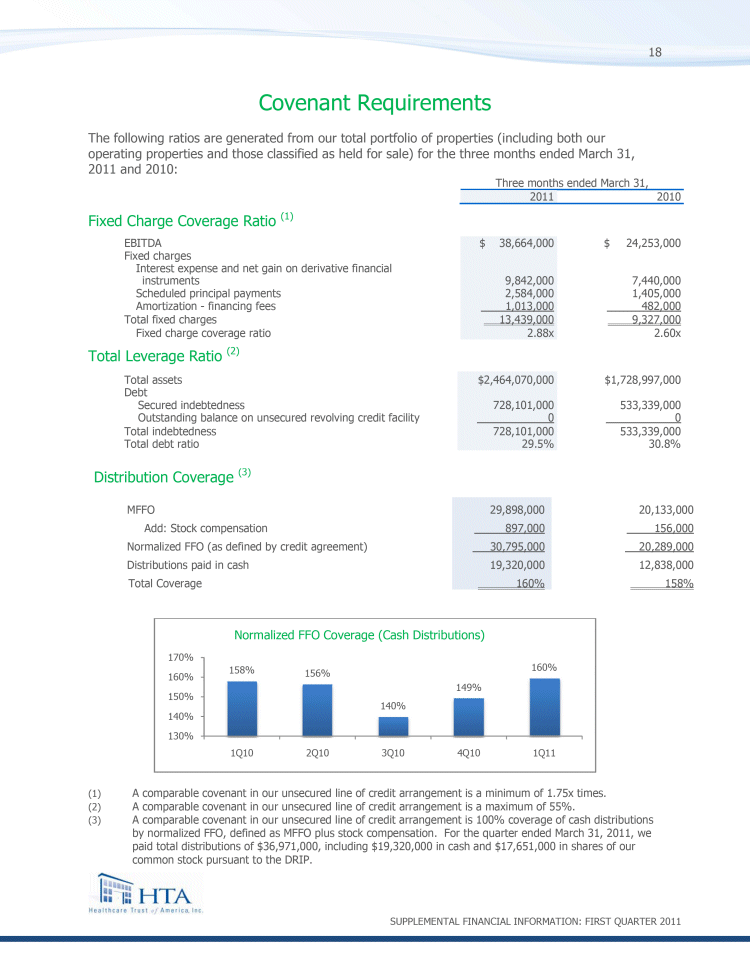
Covenant Requirements
The following ratios are generated from our total portfolio of properties (including both
our operating properties and those classified as held for sale) for the three months ended March
31, 2011 and 2010:
Three months ended March 31,
2011
2010
Fixed Charge Coverage Ratio (1)
EBITDA
$
38,664,000
$
24,253,000
Fixed charges
Interest expense and net gain on derivative financial instruments
9,842,000
7,440,000
Scheduled principal payments
2,584,000
1,405,000
Amortization — financing fees
1,013,000
482,000
Total fixed charges
13,439,000
9,327,000
Fixed charge coverage ratio
2.88
x
2.60
x
Total Leverage Ratio (2)
Total assets
$
2,464,070,000
$
1,728,997,000
Debt
Secured indebtedness
728,101,000
533,339,000
Outstanding balance on unsecured revolving credit facility
0
0
Total indebtedness
728,101,000
533,339,000
Total debt ratio
29.5
%
30.8
%
Distribution Coverage (3)
MFFO
29,898,000
20,133,000
Add: Stock compensation
897,000
156,000
Normalized FFO (as defined by credit agreement)
30,795,000
20,289,000
Distributions paid in cash
19,320,000
12,838,000
Total Coverage
160
%
158
%
(1)
A comparable covenant in our unsecured line of credit arrangement is a minimum of 1.75x
times.
(2)
A comparable covenant in our unsecured line of credit arrangement is a maximum of 55%.
(3)
A comparable covenant in our unsecured line of credit arrangement is 100% coverage
of cash distributions by normalized FFO, defined as MFFO plus stock compensation. For the
quarter ended March 31, 2011, we paid total distributions of $36,971,000, including $19,320,000 in cash
and $17,651,000 in shares of our common stock pursuant to the DRIP.
SUPPLEMENTAL FINANCIAL INFORMATION: FIRST QUARTER 2011
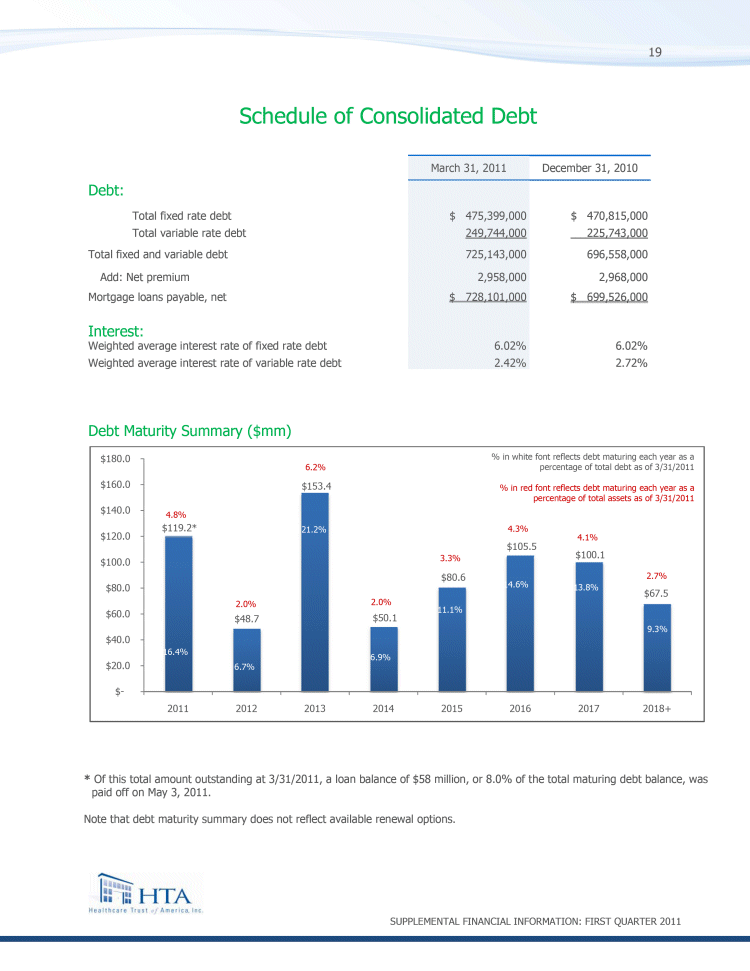
19 Schedule of Consolidated Debt March 31, 2011 December 31, 2010 Debt: Total fixed
rate debt $475,399,000 $470,815,000 Total variable rate debt 249,744,000 225,743,000 Total
fixed and variable debt 725,143,000 696,558,000 Add: Net premium 2,958,000 2,968,000 Mortgage loans
payable, net $728,101,000 $699,526,000 Interest: Weighted average interest rate of fixed rate
debt 6.02% 6.02% Weighted average interest rate of variable rate debt 2.42% 2.72% Debt Maturity
Summary ($mm) $180.0% in white font reflects debt maturing each year as a 6.2% percentage of
total debt as of 3/31/2011 8.7% * $160.0 $153.4% in red font reflects debt maturing each year as
a percentage of total assets as of 3/31/2011 $140.0 4.8% $119.2* 21.2% 4.3% $120.0 4.1% $105.5 3.3%
$100.1 $100.0 $80.6 2.7% $80.0 14.6% 13.8% $67.5 2.0% 2.0% $60.0 11.1% $48.7 $50.1 9.3% $40.0 16.4%
6.9% $20.0 6.7% $- 2011 2012 2013 2014 2015 2016 2017 2018+ * Of this total amount outstanding at
3/31/2011, a loan balance of $58 million, or 8.0% of the total maturing debt balance, was paid off
on May 3, 2011. Note that debt maturity summary does not reflect available renewal options.
SUPPLEMENTAL FINANCIAL INFORMATION: FIRST QUARTER 2011
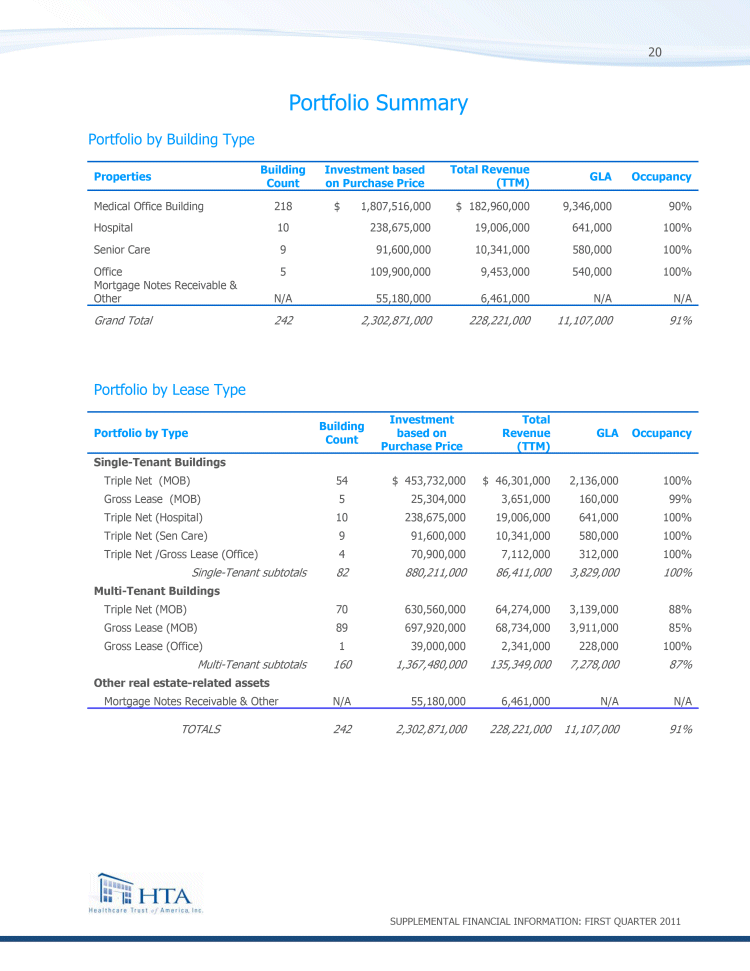
Portfolio Summary
Portfolio by Building Type
Building
Investment based on
Total Revenue
Properties
Count
Purchase Price
(TTM)
GLA
Occupancy
Medical Office Building
$218
1,807,516,000
$182,960,000
9,346,000
90%
Hospital
10
238,675,000
19,006,000
641,000
100%
Senior Care
9
91,600,000
10,341,000
580,000
100%
Office
5
109,900,000
9,453,000
540,000
100%
Mortgage Notes
Receivable & Other
N/A
55,180,000
6,461,000
N/A
N/A
Grand Total
242
2,302,871,000
228,221,000
11,107,000
91%
Portfolio by Lease Type
Investment
Total
Building
based on
Revenue
Portfolio by Type
Count
Purchase Price
(TTM)
GLA
Occupancy
Single-Tenant Buildings
Triple Net (MOB)
54
$453,732,000
$46,301,000
2,136,000
100%
Gross Lease (MOB)
5
25,304,000
3,651,000
160,000
99%
Triple Net (Hospital)
10
238,675,000
19,006,000
641,000
100%
Triple Net (Sen Care)
9
91,600,000
10,341,000
580,000
100%
Triple Net /Gross Lease (Office)
4
70,900,000
7,112,000
312,000
100%
Single-Tenant subtotals
82
880,211,000
86,411,000
3,829,000
100%
Multi-Tenant Buildings
Triple Net (MOB)
70
630,560,000
64,274,000
3,139,000
88%
Gross Lease (MOB)
89
697,920,000
68,734,000
3,911,000
85%
Gross Lease (Office)
1
39,000,000
2,341,000
228,000
100%
Multi-Tenant subtotals
160
1,367,480,000
135,349,000
7,278,000
87
%
Other real estate-related assets
Mortgage Notes Receivable & Other
N/A
55,180,000
6,461,000
N/A
N/A
TOTALS
242
2,302,871,000
228,221,000
11,107,000
91%
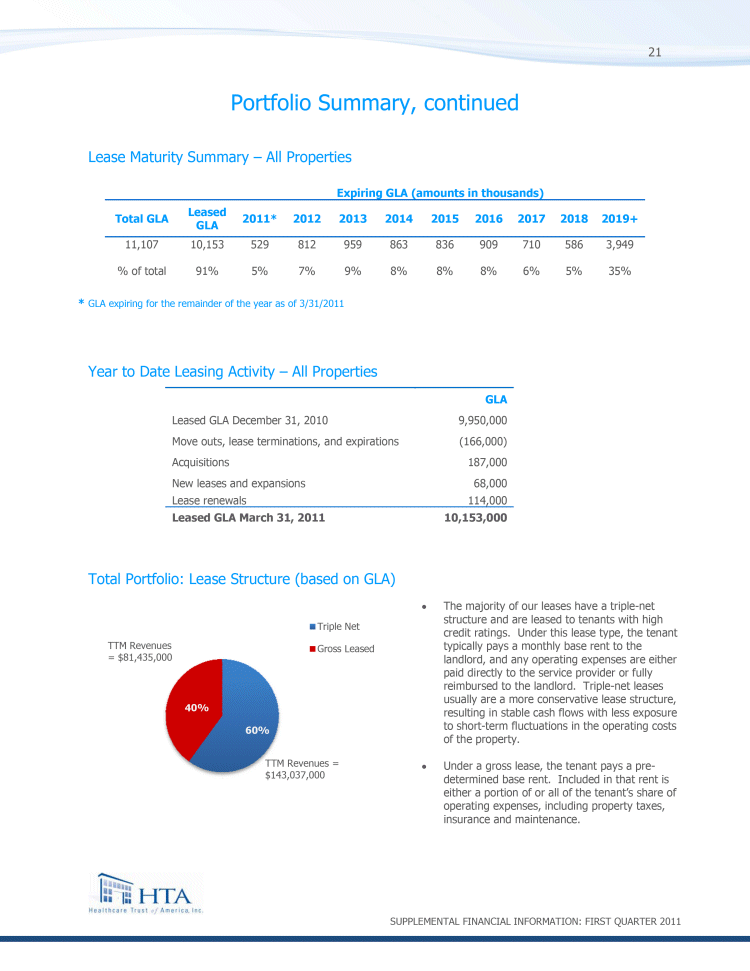
Portfolio Summary, continued
Lease Maturity Summary — All Properties
Expiring GLA (amounts in thousands)
Total GLA
Leased GLA
2011*
2012
2013
2014
2015
2016
2017
2018
2019+
11,107
10,153
529
812
959
863
836
909
710
586
3,949
% of total
91%
5%
7%
9%
8%
8%
8%
6%
5%
35%
* GLA expiring for the remainder of the year as of 3/31/2011
Year to Date Leasing Activity — All Properties
GLA
Leased GLA December 31, 2010
9,950,000
Move outs, lease terminations, and expirations
(166,000)
Acquisitions
187,000
New leases and expansions
68,000
Lease renewals
114,000
Leased GLA March 31, 2011
10,153,000
Total Portfolio: Lease Structure (based on GLA)
The majority of our leases have a triple-net structure and are leased to tenants
with high credit ratings. Under this lease type, the tenant typically pays a monthly base
rent to the landlord, and any operating expenses are either paid directly to the service
provider or fully reimbursed to the landlord. Triple-net leases usually are a more
conservative lease structure, resulting in stable cash flows with less exposure to
short-term fluctuations in the operating costs of the property.
Under a gross lease, the tenant pays a pre-determined base rent. Included in that rent
is either a portion of or all of the tenant’s share of operating expenses, including
property taxes, insurance and maintenance.
SUPPLEMENTAL FINANCIAL INFORMATION: FIRST QUARTER 2011
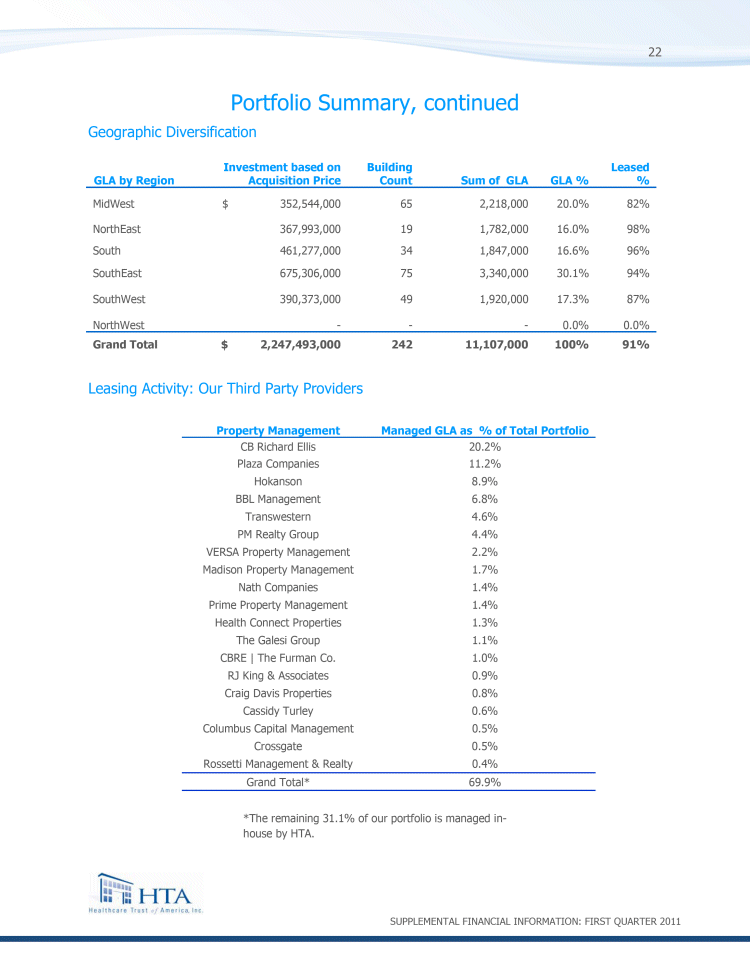
Portfolio Summary, continued
Geographic Diversification
Investment based on
GLA by Region
Acquisition Price
Building Count
Sum of GLA
GLA %
Leased %
MidWest
$352,544,000
65
2,218,000
20.0%
82%
NorthEast
367,993,000
19
1,782,000
16.0%
98%
South
461,277,000
34
1,847,000
16.6%
96%
SouthEast
675,306,000
75
3,340,000
30.1%
94%
SouthWest
390,373,000
49
1,920,000
17.3%
87%
NorthWest
—
—
—
0.0%
0.0%
Grand Total
$2,247,493,000
242
11,107,000
100%
91%
Leasing Activity: Our Third Party Providers
Property Management
Managed GLA as % of Total Portfolio
CB Richard Ellis
20.2%
Plaza Companies
11.2%
Hokanson
8.9%
BBL Management
6.8%
Transwestern
4.6%
PM Realty Group
4.4%
VERSA Property Management
2.2%
Madison Property Management
1.7%
Nath Companies
1.4%
Prime Property Management
1.4%
Health Connect Properties
1.3%
The Galesi Group
1.1%
CBRE The Furman Co.
1.0%
RJ King & Associates
0.9%
Craig Davis Properties
0.8%
Cassidy Turley
0.6%
Columbus Capital Management
0.5%
Crossgate
0.5%
Rossetti Management & Realty
0.4%
Grand Total*
69.9%
* The remaining 31.1% of our portfolio is managed in-house by HTA.
SUPPLEMENTAL FINANCIAL INFORMATION: FIRST QUARTER 2011
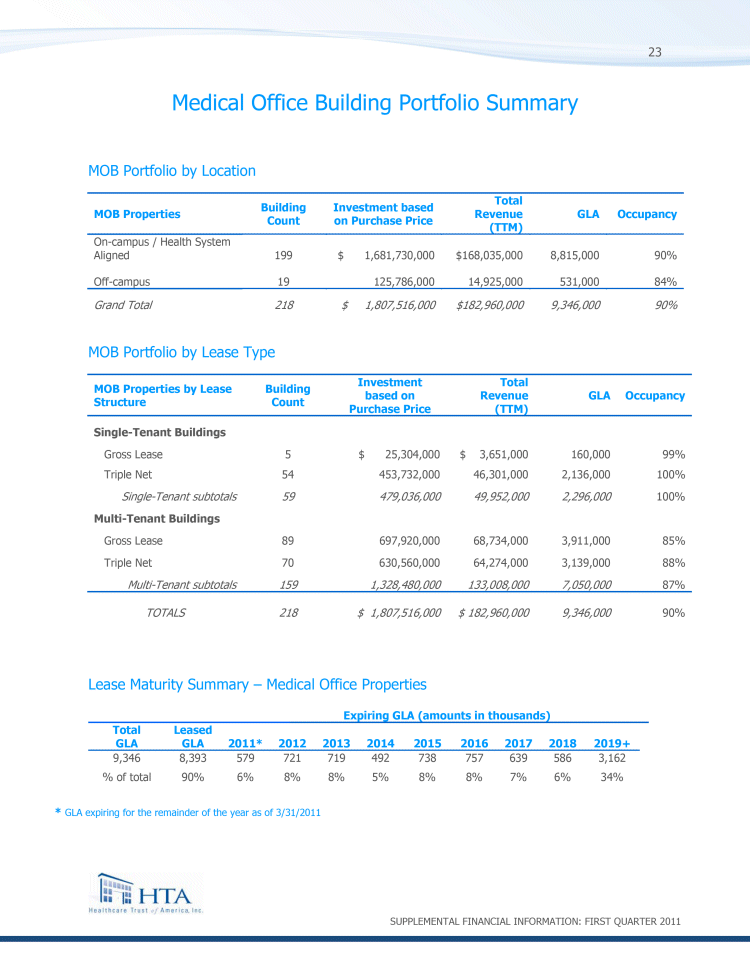
Medical Office Building Portfolio Summary
MOB Portfolio by Location
Total
Building
Investment based
Revenue
MOB Properties
Count
on Purchase Price
(TTM)
GLA
Occupancy
On-campus / Health
System Aligned
199
$1,681,730,000
$168,035,000
8,815,000
90%
Off-campus
19
125,786,000
14,925,000
531,000
84%
Grand Total
218
$1,807,516,000
$182,960,000
9,346,000
90%
MOB Portfolio by Lease Type
Investment
Total
MOB Properties by Lease
Building
based on
Revenue
Structure
Count
Purchase Price
(TTM)
GLA
Occupancy
Single-Tenant Buildings
Gross Lease
5
$25,304,000
$3,651,000
160,000
99%
Triple Net
54
453,732,000
46,301,000
2,136,000
100%
Single-Tenant subtotals
59
479,036,000
49,952,000
2,296,000
100%
Multi-Tenant Buildings
Gross Lease
89
697,920,000
68,734,000
3,911,000
85%
Triple Net
70
630,560,000
64,274,000
3,139,000
88%
Multi-Tenant subtotals
159
1,328,480,000
133,008,000
7,050,000
87%
TOTALS
218
$1,807,516,000
$182,960,000
9,346,000
90%
Lease Maturity Summary — Medical Office Properties
Expiring GLA (amounts in thousands)
Total
Leased
GLA
GLA
2011*
2012
2013
2014
2015
2016
2017
2018
2019+
9,346
8,393
579
721
719
492
738
757
639
586
3,162
% of total
90%
6%
8%
8%
5%
8%
8%
7%
6%
34%
* GLA expiring for the remainder of the year as of 3/31/2011
SUPPLEMENTAL FINANCIAL INFORMATION: FIRST QUARTER 2011
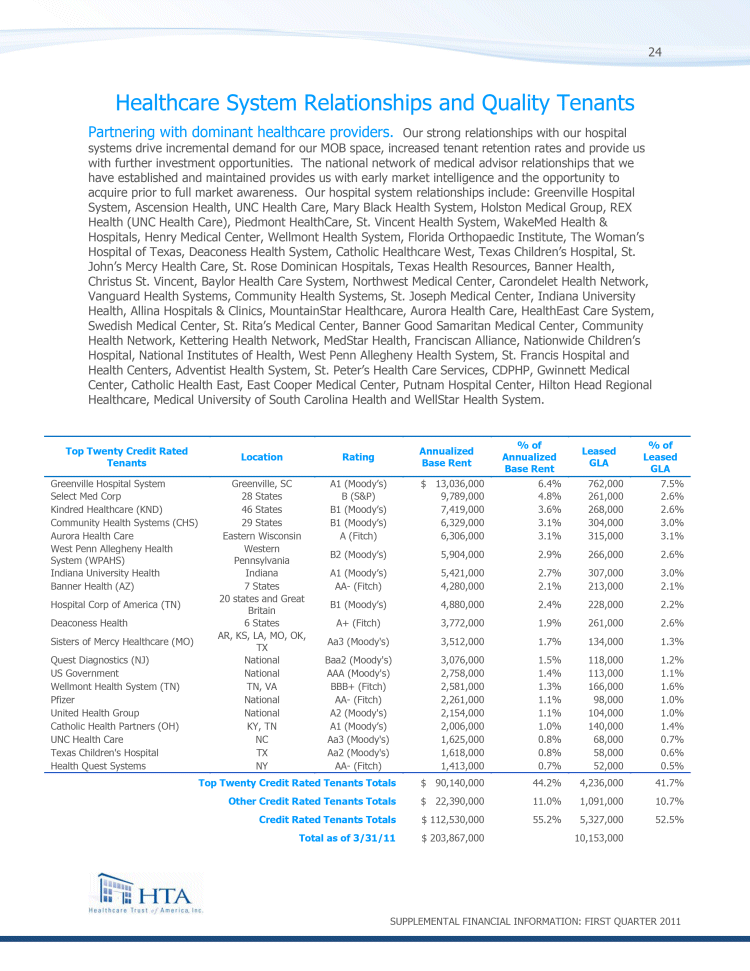
Healthcare System Relationships and Quality Tenants
Partnering with dominant healthcare providers. Our strong relationships with our
hospital systems drive incremental demand for our MOB space, increased tenant retention rates and
provide us with further investment opportunities. The national network of medical advisor
relationships that we have established and maintained provides us with early market intelligence
and the opportunity to acquire prior to full market awareness. Our hospital system relationships
include: Greenville Hospital System, Ascension Health, UNC Health Care, Mary Black Health System,
Holston Medical Group, REX Health (UNC Health Care), Piedmont HealthCare, St. Vincent Health
System, WakeMed Health & Hospitals, Henry Medical Center, Wellmont Health System, Florida
Orthopaedic Institute, The Woman’s Hospital of Texas, Deaconess Health System, Catholic Healthcare
West, Texas Children’s Hospital, St. John’s Mercy Health Care, St. Rose Dominican Hospitals, Texas
Health Resources, Banner Health, Christus St. Vincent, Baylor Health Care System, Northwest Medical
Center, Carondelet Health Network, Vanguard Health Systems, Community Health Systems, St. Joseph
Medical Center, Indiana University Health, Allina Hospitals & Clinics, MountainStar Healthcare,
Aurora Health Care, HealthEast Care System, Swedish Medical Center, St. Rita’s Medical Center,
Banner Good Samaritan Medical Center, Community Health Network, Kettering Health Network, MedStar
Health, Franciscan Alliance, Nationwide Children’s Hospital, National Institutes of Health, West
Penn Allegheny Health System, St. Francis Hospital and Health Centers, Adventist Health System, St.
Peter’s Health Care Services, CDPHP, Gwinnett Medical Center, Catholic Health East, East Cooper
Medical Center, Putnam Hospital Center, Hilton Head Regional Healthcare, Medical University of
South Carolina Health and WellStar Health System.
% of
% of
Top Twenty Credit Rated
Annualized
Annualized
Leased
Leased
Tenants
Location
Rating
Base Rent
Base Rent
GLA
GLA
Greenville Hospital System
Greenville, SC
A1 (Moody’s)
$13,036,000
6.4%
762,000
7.5%
Select Med Corp
28 States
B (S&P)
9,789,000
4.8%
261,000
2.6%
Kindred Healthcare (KND)
46 States
B1 (Moody’s)
7,419,000
3.6%
268,000
2.6%
Community Health Systems (CHS)
29 States
B1 (Moody’s)
6,329,000
3.1%
304,000
3.0%
Aurora Health Care
Eastern Wisconsin
A (Fitch)
6,306,000
3.1%
315,000
3.1%
West Penn Allegheny Health
System (WPAHS)
Western Pennsylvania
B2 (Moody’s)
5,904,000
2.9%
266,000
2.6%
Indiana University Health
Indiana
A1 (Moody’s)
5,421,000
2.7%
307,000
3.0%
Banner Health (AZ)
7 States
AA- (Fitch)
4,280,000
2.1%
213,000
2.1%
Hospital Corp of America (TN)
20 states and Great Britain
B1 (Moody’s)
4,880,000
2.4%
228,000
2.2%
Deaconess Health
6 States
A+ (Fitch)
3,772,000
1.9%
261,000
2.6%
Sisters of Mercy Healthcare (MO)
AR, KS, LA, MO, OK, TX
Aa3 (Moody’s)
3,512,000
1.7%
134,000
1.3%
Quest Diagnostics (NJ)
National
Baa2 (Moody’s)
3,076,000
1.5%
118,000
1.2%
US Government
National
AAA (Moody’s)
2,758,000
1.4%
113,000
1.1%
Wellmont Health System (TN)
TN, VA
BBB+ (Fitch)
2,581,000
1.3%
166,000
1.6%
Pfizer
National
AA- (Fitch)
2,261,000
1.1%
98,000
1.0%
United Health Group
National
A2 (Moody’s)
2,154,000
1.1%
104,000
1.0%
Catholic Health Partners (OH)
KY, TN
A1 (Moody’s)
2,006,000
1.0%
140,000
1.4%
UNC Health Care
NC
Aa3 (Moody’s)
1,625,000
0.8%
68,000
0.7%
Texas Children’s Hospital
TX
Aa2 (Moody’s)
1,618,000
0.8%
58,000
0.6%
Health Quest Systems
NY
AA- (Fitch)
1,413,000
0.7%
52,000
0.5%
Top Twenty Credit Rated Tenants Totals
$90,140,000
44.2%
4,236,000
41.7%
Other Credit Rated Tenants Totals
$22,390,000
11.0%
1,091,000
10.7%
Credit Rated Tenants Totals
$112,530,000
55.2%
5,327,000
52.5%
Total as of 3/31/11
$203,867,000
10,153,000
SUPPLEMENTAL FINANCIAL INFORMATION: FIRST QUARTER 2011
Glossary/Definitions
Acquisition-related expenses: Prior to 2009, acquisition-related
expenses were capitalized and have historically been added back to FFO over time through
depreciation; however, beginning in 2009, acquisition-related expenses related to business
combinations are expensed. These acquisition-related expenses have been and will continue
to be funded from the proceeds of our offerings and our debt and not from operations. We
believe by excluding expensed acquisition-related expenses, MFFO provides useful
supplemental information that is comparable for our real estate investments.
Adjusted Funds from Operations (AFFO): AFFO is calculated by
deducting from MFFO non-incremental capital expenditures, tenant improvements, leasing
commissions, amortization of below market ground rent and adding back non-cash items
including stock compensation expense and adjusting for gains/losses on change in fair value
of derivative financial instruments, the effect of straight-line rents and above/below
market lease revenues.
AFFO should not be considered as an alternative to net income (loss) or to cash flows from
operating activities and is not intended to be used as a liquidity measure indicative of
cash flow available to fund our cash needs, including our ability to make distributions.
AFFO should be reviewed in connection with other GAAP measurements.
Annualized Base Rent: Based on contractual base rent from leases in
effect as of the end of each year and does not reflect tenant concessions. Excludes notes
receivable.
Assets Held For Sale: Assets and liabilities of properties sold or to be sold
are classified as held for sale, to the extent not sold, on the Company’s Condensed
Consolidated Balance Sheets, and the results of operations of such properties are included
in discontinued operations on the Company’s Condensed Consolidated Statements of Operations
for all periods presented. Properties classified as held for sale at March 31, 2011 and
December 31, 2010 include four buildings within our Senior Care 1 portfolio, which is a
portfolio consisting of six total buildings located in various cities throughout Texas and
California. Pursuant to a master lease agreement in effect at the time of our purchase of
this portfolio, the lessee of the four buildings within the portfolio that are located in
Texas was afforded the option to purchase these buildings at the June 30, 2011 anniversary
of the first five years of the ten year lease term. On December 31, 2010, the lessee opened
escrow with a deposit of 5% of the minimum repurchase price and provided us with timely
notice, as required by the agreement, of its intent to exercise this option. As a result of
these actions, in accordance with ASC 360-10-45-9, Property, Plant, and Equipment — Overall
— Other Presentation Matters — Long Lived Assets Classified as Held for Sale, we determined
that these four buildings met the criteria for held for sale designation as of December 31,
2010 and continue to meet such criteria as of March 31, 2011. We have therefore separately
presented the assets and liabilities of these buildings on our interim condensed
consolidated balance sheet.
Capital Expenditures, Tenant Improvements, Leasing Commissions: Represents
amounts paid in cash for 1) recurring and non-recurring capital expenditures required to
maintain and re-tenant our properties, 2) second generation tenant improvements, and 3)
leasing commissions paid to third party leasing agents to secure new tenants.
Distribution Rate: Based on original share price of $10 per share.
Distributions are aggregated and paid monthly. It is our intent to continue to pay
distributions. However, the amount of distributions we pay to our stockholders is
determined by our board of directors, at its discretion,
SUPPLEMENTAL FINANCIAL INFORMATION: FIRST QUARTER 2011
and is dependent on a number of factors, including funds available for the payment of
distributions, our financial condition, capital expenditure requirements and annual
distribution requirements needed to maintain our status as a REIT under the Internal Revenue
Code, as well as any liquidity alternative we may pursue in the future. Our board of
directors may reduce its distribution rate and we cannot guarantee the amount of
distributions paid in the future, if any.
EBITDA: Earnings before interest, taxes, depreciation, and amortization. The
real estate industry uses EBITDA, a non-GAAP financial measure, as a measure of both
operating performance and liquidity.
Financial Leverage: Total debt divided by gross real estate assets (based on
acquisition price and includes two real estate notes receivable).
Fixed Charges: Interest expense and net gain on derivative financial
instruments, scheduled principal payments, and amortization — financing fees. We use fixed
charges to measure our interest payments on outstanding debt for purposes of presenting
fixed charge coverage.
Funds from Operations: We define FFO, a non-GAAP measure, as net income or loss
computed in accordance with GAAP, excluding gains or losses from sales of property but
including asset impairment write downs, plus depreciation and amortization, and after
adjustments for unconsolidated partnerships and joint ventures. Adjustments for
unconsolidated partnerships and joint ventures are calculated to reflect FFO.
FFO should not be considered as an alternative to net income (loss) or to cash flows from
operating activities and is not intended to be used as a liquidity measure indicative of
cash flow available to fund our cash needs, including our ability to make distributions. FFO
should be reviewed in connection with other GAAP measurements. For more information on FFO,
please see our Quarterly Report on Form 10-Q for the quarter ended March 31, 2011 as filed
with the Securities and Exchange Commission.
Gross Leasable Area (GLA): Gross leasable area (in square feet).
Gross Lease:
Full Service Gross (FSG): Under this type of lease, the tenant
pays a pre-determined base rent and operating expenses are typically paid by the
Landlord in year 1. In subsequent years, the tenant is responsible for their
proportionate share of operating expense increases over the base year.
Modified Gross (MG): Similar to a FSG lease, however the
tenant pays a pre-determined base rent and some of the operating expenses are
typically paid by the tenant instead of the Landlord (i.e. electrical or
janitorial).
Gross real estate assets: Based on acquisition price and includes two real
estate notes receivable.
Modified Funds from Operations: We use modified funds from operations, or MFFO,
which excludes from FFO transition charges and acquisition-related expenses, to further
evaluate how our portfolio might perform after our acquisition stage is complete and the
sustainability of our dividend in the future. MFFO should not be considered as an
alternative to net income (loss) or to cash flows from operating activities and is not
intended to be used as a liquidity measure indicative of cash flow available to fund our
cash needs, including our ability to make distributions. MFFO should be reviewed in
connection with other GAAP measurements.
SUPPLEMENTAL FINANCIAL INFORMATION: FIRST QUARTER 2011
Our calculation of MFFO may have limitations as an analytical tool because it reflects the
costs unique to our transition to a self-management model, which may be different from that
of other healthcare REITs. Additionally, MFFO reflects features of our ownership interests
in our medical office buildings and healthcare-related facilities that are unique to us.
Companies that are considered to be in our industry may not have similar ownership
structures; and therefore those companies may not calculate MFFO in the same manner that we
do, or at all, limiting its usefulness as a comparative measure. We compensate for these
limitations by relying primarily on our GAAP and FFO results and using our MFFO as a
supplemental measure.
MFFO should be reviewed in connection with other GAAP measurements. For more information on
MFFO, please see our Quarterly Report on Form 10-Q for the quarter ended March 31, 2011 as
filed with the Securities and Exchange Commission.
Mortgage Notes Receivable and Other: We have acquired two other real estate
assets including five notes receivable for an aggregate purchase price of $52,135,000.
These assets also include ground leases. Please refer to our Form 10-Q for the quarter
ended March 31, 2011 as filed with the Securities and Exchange Commission for more
information.
Net Operating Income (NOI): NOI is a non-GAAP financial measure that is defined
as net income (loss), computed in accordance with GAAP, generated from our total portfolio
of properties (including both our operating properties and those classified as held for
sale as of March 31, 2011) before interest expense, general and administrative expenses,
depreciation, amortization, acquisition-related expenses, and interest and dividend income.
We believe that NOI provides an accurate measure of the operating performance of our
operating assets because NOI excludes certain items that are not associated with management
of the properties. Additionally, we believe that NOI is a widely accepted measure of
comparative operating performance in the real estate community. However, our use of the
term NOI may not be comparable to that of other real estate companies as they may have
different methodologies for computing this amount.
Net Operating Income (NOI) (Cash): NOI (Cash) is a non-GAAP financial measure
that is defined as NOI excluding GAAP revenue items including straight line rent and
adjustments recorded to reflect above and below market leases in accordance with FAS 141.
We believe that NOI (Cash) provides an accurate measure of the operating performance of our
operating assets because NOI (Cash) excludes certain items that are not associated with
management of the properties. Additionally, we believe that NOI (Cash) is a widely accepted
measure of comparative operating performance in the real estate community. However, our use
of the term NOI (Cash) may not be comparable to that of other real estate companies as they
may have different methodologies for computing this amount.
Normalized Funds from Operations: Normalized FFO is calculated by
deducting from MFFO termination fee revenue and adjusting for gains/losses on change in
fair value of derivative financial instruments. Our internal definition of Normalized FFO
differs from the definition per our unsecured line of credit agreement, defined as MFFO
plus stock compensation.
Normalized FFO should not be considered as an alternative to net income (loss) or to cash
flows from operating activities and is not intended to be used as a liquidity measure
indicative of cash flow available to fund our cash needs, including our ability to make
distributions. Normalized FFO should be reviewed in connection with other GAAP measurements.
SUPPLEMENTAL FINANCIAL INFORMATION: FIRST QUARTER 2011
Occupancy: Occupancy represents the percentage of total gross leasable area
that is leased and occupied, including month-to-month leases, as of the date reported.
Occupancy is based on leases in place and in effect.
Off-Campus: A building or portfolio that is not located on or in close
proximity to key hospital based-campuses and is not aligned with recognized healthcare
systems.
On-Campus / Health System Aligned: A building or portfolio that is either (1)
located on or in close proximity to key hospital-based campuses or (2) aligned with
recognized healthcare systems. Approximately 94% of our medical office portfolio includes
buildings are considered to be on-campus or health system aligned.
Total equity raised since inception: Excludes share issuance from Distribution
Reinvestment Plan (DRIP)
Total Revenue (TTM): Total revenue for the trailing twelve months
Transition-related charges: FFO includes certain charges related to the cost of
our transition to self-management. These items include, but are not limited to, additional
legal expenses, system conversion costs (including updates to certain estimate development
procedures) and non-recurring employment costs. Because MFFO excludes such costs,
management believes MFFO provides useful supplemental information by focusing on the
changes in our fundamental operations that will be comparable rather than on such
transition charges. We do not believe such costs will recur now that our transition to a
self-management infrastructure is complete.
Triple Net (NNN): Under this lease, the tenant pays a monthly lump sum base
rent as well as the property taxes, the property insurance, and the maintenance.
SUPPLEMENTAL FINANCIAL INFORMATION: FIRST QUARTER 2011
