Attached files
| file | filename |
|---|---|
| 8-K - 8-K - Brookfield Property REIT Inc. | a11-23389_18k.htm |
| EX-99.1 - EX-99.1 - Brookfield Property REIT Inc. | a11-23389_1ex99d1.htm |
Exhibit 99.2
|
|
Information Package: Rouse Properties, Inc. Planned Distribution to Stockholders August 1, 2011 |
|
|
Forward Looking Statements This presentation contains forward-looking statements. These statements relate to future events or to future financial performance and involve known and unknown risks, uncertainties, and other factors that may cause actual results, levels of activity, performance, or achievements to materially differ from any results, levels of activity, performance, or achievements expressed or implied by these forward-looking statements. The words “possible,” “propose,” “might,” “could,” “would,” “projects,” “plan,” “forecasts,” “anticipates,” “expect,” “intend,” “believe,” “seek,” or “may,” the negative of these terms and other comparable terminology, are intended to identify forward-looking statements, but are not the exclusive means of identifying them. Actual results may differ materially from the results suggested by these forward-looking statements, for a number of reasons, including, but not limited to, our ability to refinance, extend, restructure or repay near and intermediate term debt, our substantial level of indebtedness, our ability to raise capital through equity issuances, asset sales or the incurrence of new debt, retail and credit market conditions, impairments, the Rouse Properties, Inc.’s (“Rouse”) liquidity demands, and retail and economic conditions. Readers are referred to the documents filed by General Growth Properties, Inc. ( "GGP") and documents filed from time to time by Rouse with the Securities and Exchange Commission (the "SEC"), which further identify the important risk factors which could cause actual results to differ materially from the forward-looking statements in this presentation. Except as may be required by law, neither GGP nor Rouse undertake any obligation to update or revise any forward-looking statements to reflect events or circumstances occurring after the date of this presentation. 1 |
|
|
Table of Contents Topic Slide Transaction Overview 3 Process 4 Rationale for Divestiture of Rouse 5 Rationale for Divestiture through Spin-Off 6 Rouse Business Strategy 7 Rouse Investment Merits 8 Rouse Portfolio Highlights 9 Indicative Rouse Balance Sheet / Debt Profile 11 Rouse Property Listing 12 2 |
|
|
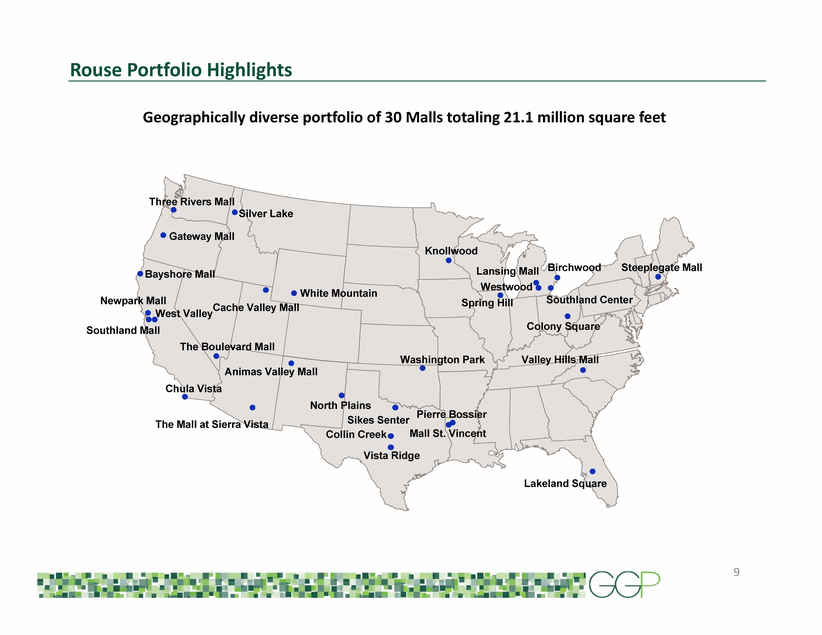
Transaction Overview . General Growth Properties, Inc. ("GGP") today announced a plan to distribute a 21.1 million square foot, 30-mall portfolio (the “Rouse Portfolio” or “Rouse”), to GGP stockholders in order to efficiently achieve its strategic objective to focus its operating and development expertise primarily on its core mall portfolio. . The Rouse Portfolio, which currently constitutes approximately 7% of GGP’s NOI, was identified through a comprehensive review process that focused on differentiating GGP’s current portfolio based on a blend of key quantitative and qualitative considerations, including: 1) Asset management focus, human capital requirements 2) Capital structure and capital needs 3) Geographic location 4) Sales productivity 5) Tenant mix . Beyond the above considerations, the overarching objective for a spin-off is to ensure that Rouse has a portfolio of the scale, quality, performance and growth potential to effectively compete and thrive. 3 |
|
|
Process . GGP plans to transfer the Rouse Portfolio to a recently formed entity, Rouse Properties, Inc., which is expected to qualify as a Real Estate Investment Trust and is expected to file for listing on the NYSE. . GGP plans to spin-off Rouse Properties, Inc. to holders of GGP common stock as a taxable special dividend to be comprised of common stock of Rouse Properties, Inc. . The distribution is expected to be made on a pro rata basis to holders of GGP common stock as of the dividend record date. . This special dividend is anticipated to be declared during the fourth quarter of 2011. . The distribution will be subject to the Securities and Exchange Commission’s reviewing and declaring effective Rouse’s Form 10 registration statement, which the Company expects to file during the month of August. The distribution is also subject to the satisfaction of a number of other conditions, including those relating to third party consents. . As such, we cannot be certain that the distribution will occur, or proceed in the manner or amount as currently anticipated. The portfolio of properties and associated indebtedness is subject to change. . Should this special dividend be distributed in the structure and timeframe as currently anticipated, it is expected to satisfy a portion of GGP's 2011 REIT taxable income distribution requirement. 4 |
|
|
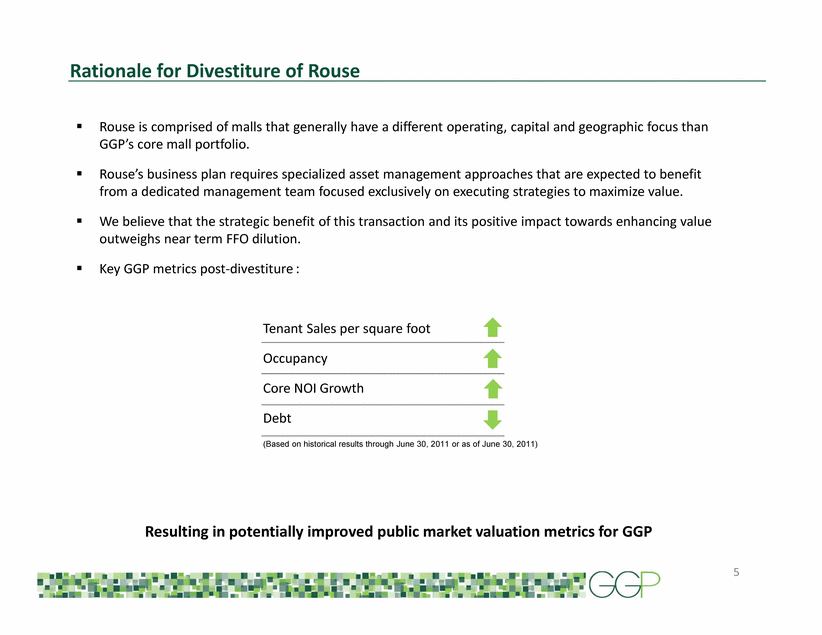
Rationale for Divestiture of Rouse . Rouse is comprised of malls that generally have a different operating, capital and geographic focus than GGP’s core mall portfolio. . Rouse’s business plan requires specialized asset management approaches that are expected to benefit from a dedicated management team focused exclusively on executing strategies to maximize value. . We believe that the strategic benefit of this transaction and its positive impact towards enhancing value outweighs near term FFO dilution. . Key GGP metrics post-divestiture : Tenant Sales per square foot Occupancy Core NOI Growth Debt (Based on historical results through June 30, 2011 or as of June 30, 2011) Resulting in potentially improved public market valuation metrics for GGP 5 |
|
|
Rationale for Divestiture Through Spin-Off Key advantages of a spin-off transaction versus alternative divestiture options: . Enables GGP stockholders to participate in Rouse’s significant growth potential coming off of a performance trough . Highly efficient from the standpoint of being a single transaction as well as an identifiable process and timeframe . Significantly greater certainty of execution 6 |
|
|
Rouse Business Strategy With a nationally diversified mall portfolio totaling 21.1 million square feet, Rouse will immediately be among the largest mall owners focused on a ‘B’ mall strategy. Value Creation Strategies: . Redevelop, reposition and refresh properties; sequence capital investments with leasing . Aggressively pursue lease-up of vacant space . Convert temporary tenants to permanent tenants . Evaluate external growth opportunities as appropriate Intensely focus on all opportunities to capture embedded growth, prudently invest to increase NAV, position Rouse to be a leading player in its segment 7 |
|
|
Rouse Investment Merits . Large and diversified portfolio . Significant embedded opportunities to drive growth . Highly accretive repositioning and redevelopment opportunities . Highly experienced operating team; long history of managing Rouse within GGP . Sized for growth: smaller base from which to ‘move the needle’ . Legacy issues limiting performance are now addressed . Dividend represents attractive basis from which to participate in growth opportunity . Strong key investor sponsorship with deep roots in the real estate industry 8 |
|
|
Rouse Portfolio Highlights Geographically diverse portfolio of 30 Malls totaling 21.1 million square feet 9 Chula Vista Bayshore Mall Animas Valley Mall Three Rivers Mall The Boulevard Mall White Mountain The Mall at Sierra Vista Gateway Mall Washington Park North Plains Valley Hills Mall Lakeland Square Cache Valley Mall Mall St. Vincent Knollwood Spring Hill Steeplegate Mall Westwood Birchwood Colony Square Pierre Bossier Lansing Mall Southland Center West Valley Silver Lake Newpark Mall Southland Mall Collin Creek Vista Ridge Sikes Senter |
|
|
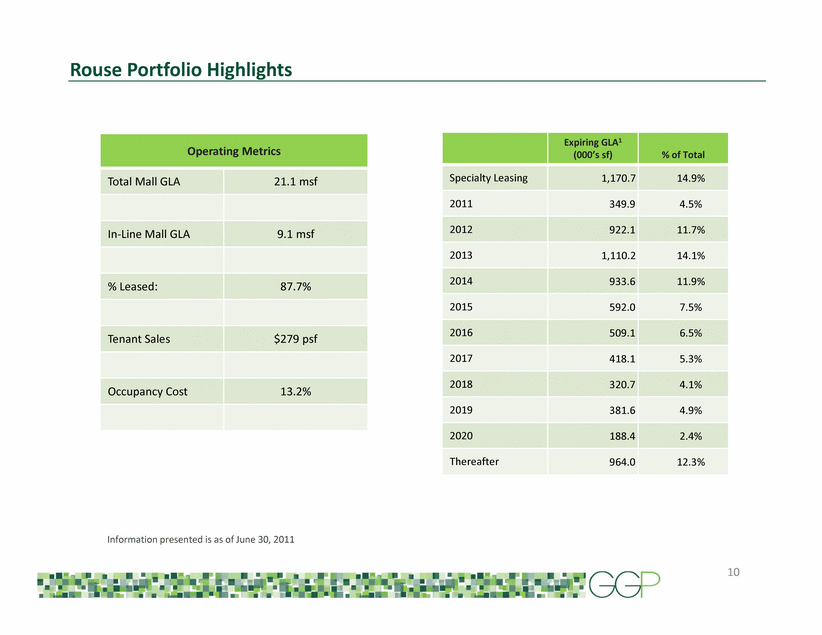
Rouse Portfolio Highlights Operating Metrics Total Mall GLA 21.1 msf In-Line Mall GLA 9.1 msf % Leased: 87.7% Tenant Sales $279 psf Occupancy Cost 13.2% Expiring GLA1 (000’s sf) % of Total Specialty Leasing 1,170.7 14.9% 2011 349.9 4.5% 2012 922.1 11.7% 2013 1,110.2 14.1% 2014 933.6 11.9% 2015 592.0 7.5% 2016 509.1 6.5% 2017 418.1 5.3% 2018 320.7 4.1% 2019 381.6 4.9% 2020 188.4 2.4% Thereafter 964.0 12.3% 10 Information presented is as of June 30, 2011 |
|
|
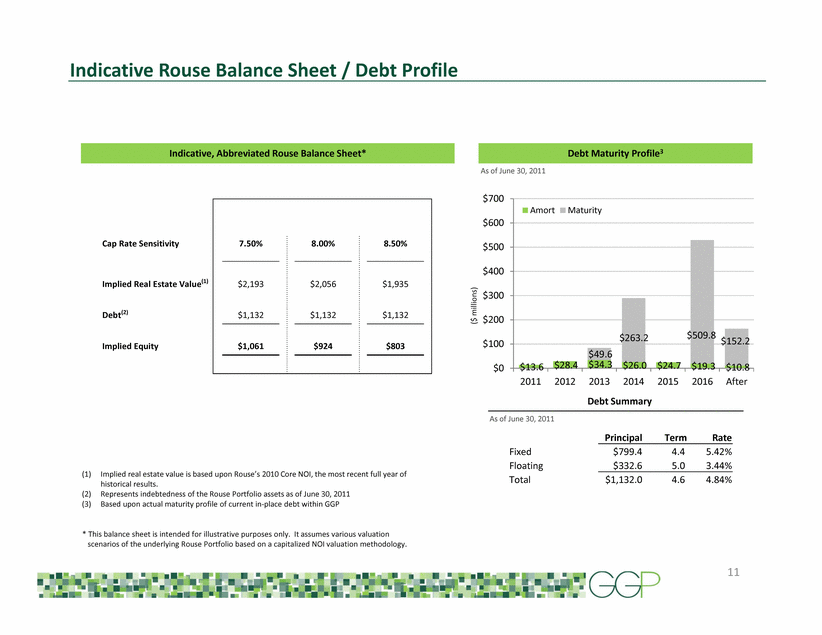
Indicative Rouse Balance Sheet / Debt Profile Principal Term Rate Fixed $799.4 4.4 5.42% Floating $332.6 5.0 3.44% Total $1,132.0 4.6 4.84% Debt Maturity Profile3 ($ millions) 11 As of June 30, 2011 Debt Summary * This balance sheet is intended for illustrative purposes only. It assumes various valuation scenarios of the underlying Rouse Portfolio based on a capitalized NOI valuation methodology. Indicative, Abbreviated Rouse Balance Sheet* (1) Implied real estate value is based upon Rouse’s 2010 Core NOI, the most recent full year of historical results. (2) Represents indebtedness of the Rouse Portfolio assets as of June 30, 2011 (3) Based upon actual maturity profile of current in-place debt within GGP As of June 30, 2011 $13.6 $28.4 $34.3 $26.0 $24.7 $19.3 $10.8 $49.6 $263.2 $509.8 $152.2 $0 $100 $200 $300 $400 $500 $600 $700 2011 2012 2013 2014 2015 2016 After Amort Maturity Cap Rate Sensitivity 7.50% 8.00% 8.50% Implied Real Estate Value(1) $2,193 $2,056 $1,935 Debt(2) $1,132 $1,132 $1,132 Implied Equity $1,061 $924 $803 |
|
|
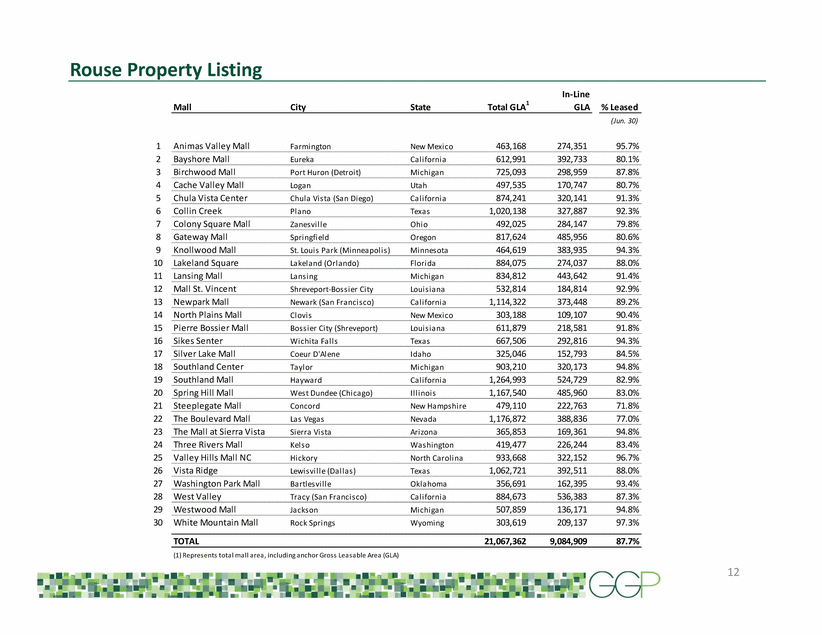
Rouse Property Listing 12 Mall City State Total GLA1 In-Line GLA % Leased (Jun. 30) 1 Animas Valley Mall Farmington New Mexico 463,168 274,351 95.7% 2 Bayshore Mall Eureka California 612,991 392,733 80.1% 3 Birchwood Mall Port Huron (Detroit) Michigan 725,093 298,959 87.8% 4 Cache Valley Mall Logan Utah 497,535 170,747 80.7% 5 Chula Vista Center Chula Vista (San Diego) California 874,241 320,141 91.3% 6 Collin Creek Plano Texas 1,020,138 327,887 92.3% 7 Colony Square Mall Zanesville Ohio 492,025 284,147 79.8% 8 Gateway Mall Springfield Oregon 817,624 485,956 80.6% 9 Knollwood Mall St. Louis Park (Minneapolis) Minnesota 464,619 383,935 94.3% 10 Lakeland Square Lakeland (Orlando) Florida 884,075 274,037 88.0% 11 Lansing Mall Lansing Michigan 834,812 443,642 91.4% 12 Mall St. Vincent Shreveport-Bossier City Louisiana 532,814 184,814 92.9% 13 Newpark Mall Newark (San Francisco) California 1,114,322 373,448 89.2% 14 North Plains Mall Clovis New Mexico 303,188 109,107 90.4% 15 Pierre Bossier Mall Bossier City (Shreveport) Louisiana 611,879 218,581 91.8% 16 Sikes Senter Wichita Falls Texas 667,506 292,816 94.3% 17 Silver Lake Mall Coeur D'Alene Idaho 325,046 152,793 84.5% 18 Southland Center Taylor Michigan 903,210 320,173 94.8% 19 Southland Mall Hayward California 1,264,993 524,729 82.9% 20 Spring Hill Mall West Dundee (Chicago) Illinois 1,167,540 485,960 83.0% 21 Steeplegate Mall Concord New Hampshire 479,110 222,763 71.8% 22 The Boulevard Mall Las Vegas Nevada 1,176,872 388,836 77.0% 23 The Mall at Sierra Vista Sierra Vista Arizona 365,853 169,361 94.8% 24 Three Rivers Mall Kelso Washington 419,477 226,244 83.4% 25 Valley Hills Mall NC Hickory North Carolina 933,668 322,152 96.7% 26 Vista Ridge Lewisville (Dallas) Texas 1,062,721 392,511 88.0% 27 Washington Park Mall Bartlesville Oklahoma 356,691 162,395 93.4% 28 West Valley Tracy (San Francisco) California 884,673 536,383 87.3% 29 Westwood Mall Jackson Michigan 507,859 136,171 94.8% 30 White Mountain Mall Rock Springs Wyoming 303,619 209,137 97.3% TOTAL 21,067,362 9,084,909 87.7% (1) Represents total mall area, including anchor Gross Leasable Area (GLA) |

