Attached files
| file | filename |
|---|---|
| 8-K - FIRST COMMUNITY BANKSHARES INC /VA/ | v230472_8k.htm |
KBW Community Bank Investor Conference August 2‐ 3, 2011 www.fcbinc.com

Forward -Looking Disclosures This presentation may include forward -looking statements . These forward -looking statements are based on current expectations that involve risks, uncertainties and assumptions . Should one or more of these risks or uncertainties materialize or should underlying assumptions prove incorrect, actual results may differ materially . These risks include: changes in business or other market conditions; the timely development, production and acceptance of new products and services; the challenge of managing asset/liability levels; the management of credit risk and interest rate risk; the difficulty of keeping expense growth at modest levels while increasing revenues; and other risks detailed from time to time in the Company’s Securities and Exchange Commission reports, including but not limited to the Annual Report on Form 10-K for the most recent year ended. Pursuant to the Private Securities Litigation Reform Act of 1995, the Company does not undertake to update forward -looking statements contained within this presentation . 2

First Community Bancshares Overview 3

Overview A $2.2 billion VA, WV, NC and TN branch franchise -Nasdaq Global Select -Russell 3000 $892 million Wealth Management Division -$451 million Trust Operation -$441 million RIA (Investment Planning Consultants) Four-state franchise with solid market share in legacy markets True retail franchise generating low cost core deposits -Over 117,250 customer accounts -Q2 2011 average cost of funds of 1.17% - Average cost of deposits of just 0.80% at June 30, 2011 4
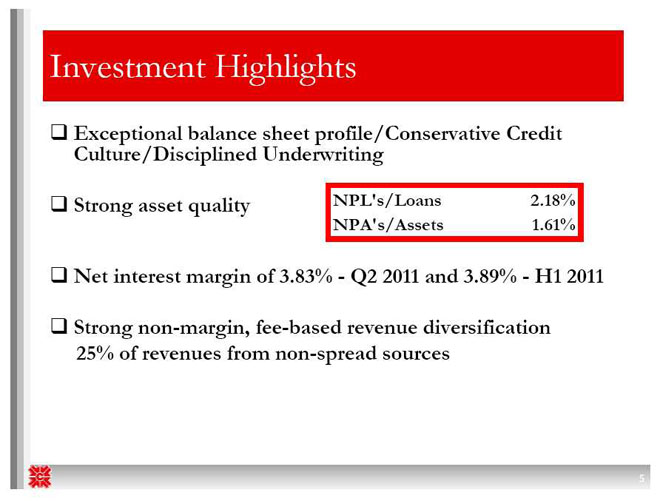
Investment Highlights Exceptional balance sheet profile/Conservative Credit Culture/Disciplined Underwriting Strong asset quality NPL's/Loans 2.18% NPA's/Assets 1.61% Net interest margin of 3.83% - Q2 2011 and 3.89% - H1 2011 Strong non-margin, fee-based revenue diversification 25% of revenues from non-spread sources 5

Current Franchise: Branch Map 64 locations in WV, VA, NC, TN Legacy Markets Mix of urban growth and stable legacy markets Growth targets in NC Piedmont/Triad & Richmond VA Possible additions in East TN and WV Deposit breakout: - West Virginia $922 million - Virginia $290 million - North Carolina $309 million - Tennessee $59 million 6

Current Franchise : Growth Markets Mooresville & Richmond Winston Lake Norman Johnson City Deposits $ 80 million $111 million $102 million $60 million MSA 1.2 million .48 million .7 million .51 million Population Key Altria RJ Reynolds Lowes Eastman Employers Dominion Hanes Brands Ingersoll Rand Epic Tech Capital One Wake Forest Nascar Medical Center VCU Baptist Hosp. Charlotte ETSU Commuters Veterans Hosp. 7

Current Franchise Overview: Market Demographics and Position Legacy Markets Growth Markets Number of Branches 36 18 Total Deposits $1.1 billion $450 million Market Ranks #1 or #2 in six markets NM Five Year Projected Flat 8.58% Population Change Five Year Projected Avg. 10.0% 13.4% Household Income Increase Deposit data as of June 30, 2010 Source: FDIC, SNL Financial 8
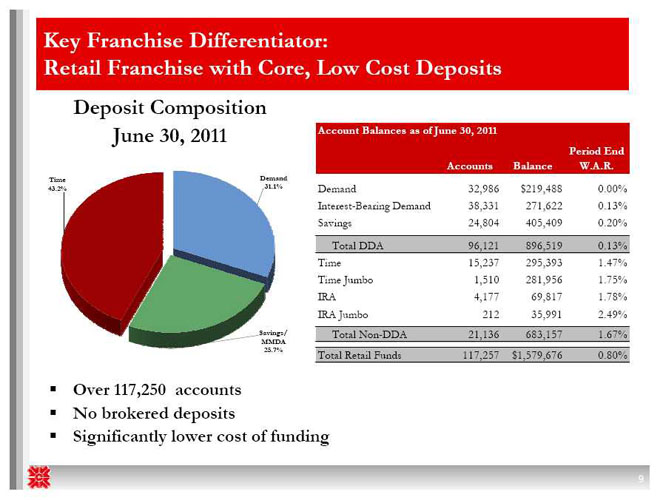
Key Franchise Differentiator: Retail Franchise with Core, Low Cost Deposits Deposit Composition June 30, 2011 Account Balances as of June 30, 2011 Period End Accounts Balance W.A.R. Time Demand 43.2% 31.1% Demand 32,986 $219,488 0.00% Interest-Bearing Demand 38,331 271,622 0.13% Savings 24,804 405,409 0.20% Total DDA 96,121 896,519 0.13% Time 15,237 295,393 1.47% Time Jumbo 1,510 281,956 1.75% IRA 4,177 69,817 1.78% IRA Jumbo 212 35,991 2.49% Savings/ Total Non-DDA 21,136 683,157 1.67% MMDA 25.7% Total Retail Funds 117,257 $1,579,676 0.80% Over 117,250 accounts No brokered deposits Significantly lower cost of funding 9
Strategic Priorities Substantial growth opportunity Continue diversification of revenues Targeted strategic bank acquisitions Acquisition of small insurance agencies Fill in primary markets Populate primary markets Attractive price levels Achieve greater integration with FDIC-assisted transactions bank services Possible larger transactions Build wealth management organically Primary and secondary markets Build premier financial services firm Build presence in mid-Atlantic region large bank capabilities Capitalize on in-market transactions community bank feel Connect regional presence Enhance marketing capabilities Brand unification Re-positioning “Community of Experts” 10
Strategic Update Raised $19 million growth Capital Converted to Virginia state-chartered, Federal Reserve member bank Re-aligned GreenPoint Insurance Effected significant “cost saves” 11
FDIC Opportunities Objectives – One or more transactions within our primary or secondary markets – Lead growth / improve market presence – Accretion to EPS Planning and Process – Developed integration plan using internal and external resources – Participated in multiple due diligence sessions and submitted two non-winning bids Five-state field of opportunity – Able to cast a wide net for strategic and fill-in acquisitions 12
FDIC Opportunities Why will we be successful? – Strong partner, appealing philosophy & culture – Well-suited geographically – History as an integrator – Completed 25 deals in 27 years – Two healthy bank transactions in the last 27 months – High number of emerging opportunities 13
Loan Portfolio: Diversified Portfolio with Strong Loan Quality Loan Composition at June 30, 2011 • Strong loan quality • NPLs / Loans at June 30, 2011, Consumer Construction - Land Loans commercial Development of 2.18% (Includes TDR’s) 4.8% 2.0% 0.3% Other Land • Geographically diversified portfolio Owner- Loans occupied 1.7% across the region Construction Commercial 1.3% • Highly Granular: & Industrial 7.9% • Avg Comm Loan $170 thousand Multi-family • Avg Retail Loan $36 thousand Residential 5.7% • Top 10 loans in portfolio represent less than 4.63% of total portfolio Non-farm, • Stable residential real estate portfolio Family Non- Residential residential (49% of total loans) in markets with Mortgage 24.2% limited price increases through the 41.2% Home Equity Agricultural Lines Farmland 0.1% expansion cycle 8.0% 2.7% • Limited C&D exposure (5.9% as compared to over 16.0% for peers) Financial data as of June 30, 2011 14
Asset Quality Ratios Non -Performing Loans / Total Loans Net Charge -Offs / Average Loans 6.00% 1.97% 5.23% 2.00% FCBC Peer 4.87% 5.00% 4.53% 1.80% 1.60% FCBC Peer 1.49% 4.00% 3.63% 1.40% 1.20% 1.12% 1.10% 3.00% 1.00% 0.90% 0.90% 2.18% 2.06% 1.94% 0.80% 0.70% 2.00% 1.39% 1.49% 0.60% 0.45% 0.47% 0.99% 1.00% 0.40% 0.30% 0.35% 0.19% 0.26% 0.20% 0.12% 0.00% 0.00% 2007 2008 2009 2010 Q1 11 Q2 11 2007 2008 2009 2010 Q1 11 Q2 11 Reserves / Non -Performing Loans Reserves / Total Loans 450 405 2.40% 400 FCBC Peer FCBC Peer 2.25% 2.18% 2.20% 2.15% 350 300 281 2.00% 1.92% 1.93% 1.88% 1.90% 250 1.80% 1.73% 200 138 1.60% 150 116 1.40% 99 99 1.37% 92 1.40% 88 100 57 48 44 45 1.19% 50 1.20% 1.05% - 1.00% 2007 2008 2009 2010 Q1 11 Q2 11 2007 2008 2009 2010 Q1 11 Q2 11 Peers include publicly traded banks with assets between $1 and $4 billion in NC, SC, East TN, VA, and WV (BNCN, CBKN, CFNL, CHCO, CWBS, EVBS, FBNC, FFCH, FNBN, FSGI, GRNB, HMPR, NBBC, PEBK, PFBI, SCBT, SCMF, SMMF, STEL, TOWN, UBSH, VCBI, YAVY) Source: SNL Financial and Company filings through July 29, 2011 15
Summary of 2Q 2011 Earnings Three Months Ended Six Months Ended June 30, June 30, 2011 2010 Change 2011 2010 Change Net Interest Income $ 17,754 $ 18,542 -4.2% $ 36,029 $ 37,161 -3.0% Provision for Loan Losses 3,079 3,596 -14.4% 4,691 7,261 -35.4% Net Interest Income (after provision) 14,675 14,946 -1.8% 31,338 29,900 4.8% Net Impairment Losses - (185) NM (527) (185) NM Other Income 11,363 9,089 25.0% 21,389 17,667 21.1% Total Noninterest Income 11,363 8,904 27.6% 20,862 17,482 19.3% Salaries and employee benefits 8,685 8,487 2.3% 17,814 16,456 8.3% FDIC costs 414 710 -41.7% 1,292 1,411 -8.4% Other Noninterest Expense 8,639 7,401 16.7% 16,695 14,803 12.8% Total Noninterest Expense 17,738 16,598 6.9% 35,801 32,670 9.6% Tax Expense 2,572 2,121 21.3% 4,920 4,303 14.3% Net Income 5,728 5,131 11.6% 11,479 10,409 10.3% Dividends on Preferred Stock 131 - 131 -Net Income Available to Common Shareholders 5,597 5,131 9.1% 11,348 10,409 9.0% EPS (diluted) $ 0.31 $ 0.29 6.9% $ 0.63 $ 0.59 6.8% 16
Balance Sheet Summary June 30, December 31, 2011 2010 Change Cash & Securities $ 584,701 $ 596,890 -2.04% Total Loans 1,374,864 1,390,900 -1.15% Allowance for Loan Losses 26,482 26,482 0.00% Total Loans (net) 1,348,382 1,364,418 -1.18% Other 273,317 282,930 -3.40% Total Assets 2,206,400 2,244,238 -1.69% Noninterest Bearing Deposits 219,488 205,151 6.99% Interest Bearing Deposits 1,360,188 1,415,804 -3.93% Total Deposits 1,579,676 1,620,955 -2.55% Short-term Borrowings 137,778 140,894 -2.21% Long-term Borrowings 166,179 191,193 -13.08% Other 20,563 21,318 -3.54% Equity 302,204 269,878 11.98% Total Liabilities & Equity 2,206,400 2,244,238 -1.69% Short and long term borrowings have decreased 8.5% since year end 2010 Stockholders’ equity has grown 12.0% 17
Financial Performance Highlights: Efficiency, Cost of Funds, Net Interest Margin 75% 72.92% FCBC 72.23% Peer 70% 66.49% Efficiency 65.58% 65.88% 65% 62.20% 61.90% 62.27% 59.23% 59.21% 59.03% 60% 55% 51.40% 50% Cost of Funds 2007 2008 2009 2010 Q1 11 Q2 11 Net Interest Margin 3.46% 3.50% 4.25% FCBC Peer 3.25% 3.14% 4.06% FCBC Peer 3.00% 2.85% 4.00% 3.96% 3.88% 3.90% 2.75% 3.83% 3.80% 3.79% 2.46% 3.74% 3.72% 2.50% 3.75% 3.65% 3.61% 2.25% 2.08% 1.97% 2.00% 3.50% 3.38% 1.75% 1.60% 1.50% 1.50% 1.30%1.31% 1.29% 3.25% 1.25% 1.17% 1.00% 3.00% 2007 2008 2009 2010 Q1 11 Q2 11 2007 2008 2009 2010 Q1 11 Q2 11 Peers include publicly traded banks with assets between $1 and $4 billion in NC, SC, East TN, VA, and WV (BNCN, CBKN, CFNL, CHCO, CWBS, EVBS, FBNC, FFCH, FNBN, FSGI, GRNB, HMPR, NBBC, PEBK, PFBI, SCBT, SCMF, SMMF, STEL, TOWN, UBSH, VCBI, YAVY) 18 Source: SNL Financial and Company filings through July 29, 2011
Recent Preferred Capital Offering $18.921 million offering closed May 20, 2011 Non-cumulative convertible preferred 6% dividend rate $1,000 liquidation value convertible into 69 shares of common stock – total of 1.31 million shares Friends and family Callable after three years Mandatory convert after five years Increased if-converted TBV per share by $0.25 19

Attractive Valuations Using a comparable peer group of high -performing banks in the southeast, FCBC is an attractively priced name Peer group consists of $2 - $5 billion banks in SE with TCE > 6% and NPA’s <5% Price/ Price/ Leverage TCE/ NPA's/ Reserves/ 2011 Est 2012 Est Ratio TA ROAA ROAE NIM Efficiency Assets Loans EPS EPS Comparable Peer Group 10.6 9.3 0.7 6.4 3.9 63.3 2.0 1.6 14.9 12.4 FCBC 11.0 10.1 1.0 7.9 3.9 59.0 1.6 1.9 12.5 11.0 FCBC shows strong returns and asset quality measures versus the group, but trades at a significant discount to peer forward EPS pricing . Comparable peer group consists of ABCB, CARE, CFNL, CHCO, CSFL, FBNC, HOMB, OZRK, PNFP, RNST, SCBT, SFNC, STBZ, STEL, TOWN . Pricing as of July 29, 2011. Source SNL. 20
Why buy FCBC? A $2.21 billion VA, WV, NC and TN branch franchise – Robust market share in legacy markets and attractive expansion into growth markets Positioned as regional consolidator – Growth plan via strategic and opportunistic FDIC-assisted deals True retail franchise generating low cost core deposits – Over 117,250 customer accounts Exceptional loan quality – Low NPLs / Loans of 2.18% at June 30, 2011* – NPA’s to total assets of 1.61% at June 30, 2011 * * Includes restructured loans 21

Why buy FCBC? Strong pre-tax, pre-provision core income Resilient net interest margin of 3.89% for 1H 2011 Strong non-margin, fee-based revenue diversification Strong dividend yield at 3.2% Positioned to emerge as one of the strongest players in the region and build one of the best franchises in the Mid-Atlantic Attractive valuation on forward earnings potential 22

Supplemental Information 23
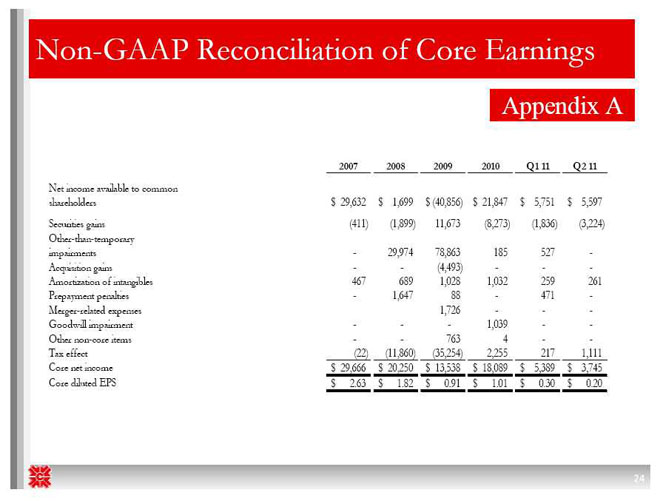
Non -GAAP Reconciliation of Core Earnings Appendix A 2007 2008 2009 2010 Q1 11 Q2 11 Net income available to common shareholders $ 29,632 $ 1,699 $ (40,856) $ 21,847 $ 5,751 $ 5,597 Securities gains (411) (1,899) 11,673 (8,273) (1,836) (3,224) Other-than-temporary impairments - 29,974 78,863 185 527 -Acquisition gains - - (4,493) - - -Amortization of intangibles 467 689 1,028 1,032 259 261 Prepayment penalties - 1,647 88 - 471 -Merger-related expenses 1,726 - - -Goodwill impairment - - - 1,039 - -Other non-core items - - 763 4 - -Tax effect (22) (11,860) (35,254) 2,255 217 1,111 Core net income $ 29,666 $ 20,250 $ 13,538 $ 18,089 $ 5,389 $ 3,745 Core diluted EPS $ 2.63 $ 1.82 $ 0.91 $ 1.01 $ 0.30 $ 0.20 24

Commercial Real Estate Portfolio Appendix B Legacy WV/ NC Eastern (In Thousands) SWVA SC VA TN Other Total Shopping Center $ 7,951 $ 8,043 $ 316 $ 3,432 $ - $ 19,742 Retail Stand Alone 40,743 24,868 13,567 3,786 2,393 85,357 Office -- Medical 5,846 9,873 318 770 - 16,807 Office -- Professional 23,937 22,866 24,787 4,242 655 76,487 Industrial 11,471 16,872 7,546 2,956 537 39,382 Healthcare 2,641 - 377 - - 3,018 Hotel 7,453 10,328 5,005 - - 22,786 Church 5,932 5,997 550 353 1,458 14,290 Other 30,902 24,273 6,460 3,725 194 65,554 Total $ 136,876 $ 123,120 $ 58,926 $ 19,264 $ 5,237 $ 343,423 (Excludes multi-family) The Company has 1,184 CRE Loans with an average balance of $280 thousand; the remaining average term of the portfolio is 47 months and 24% of the loans are floating rate The CRE loan book is geographically diversified with the three largest market areas being: Legacy 40%, NC/SC 36% and Eastern VA 17% The top 10 CRE loans represent 14% of the CRE portfolio Financial data as of June 30, 2011 25

Non -accrual Loans by State Appendix C West North Virginia Virginia Carolina Tennessee Other Total (In thousands) Commercial & Industrial $ 51 $ 618 $ 3,563 $ 288 $ - $ 4,520 Real Estate - Construction 420 888 1,246 - - 2,554 Real Estate - Commercial 226 3,864 3,354 403 - 7,847 Real Estate - Residential 1,738 978 4,164 182 - 7,062 Consumer 6 20 28 - - 54 Total $ 2,441 $ 6,368 $ 12,355 $ 873 $ - $ 22,037 Financial data as of June 30, 2011 26

Contact Information First Community Bancshares, Inc. NASDAQ: FCBC One Community Place Bluefield, VA 24605 For More Information Contact: David D. Brown Chief Financial Officer First Community Bancshares, Inc. (276) 326-9000 27