Attached files
| file | filename |
|---|---|
| 8-K - FORM 8-K - BBX CAPITAL CORP | d8k.htm |
Exhibit 99.1

BankAtlantic Bancorp Reports Profit of $23 Million
For the Second Quarter, 2011
-BankAtlantic Achieves Tier 1/Core Capital Ratio of 8.24%,
Exceeding Regulatory Capital Requirements-
FORT LAUDERDALE, Florida — July 27, 2011 — BankAtlantic Bancorp, Inc. (NYSE: BBX) today reported net income of $23.4 million, or $0.35 per diluted share, for the quarter ended June 30, 2011, compared to a net loss of ($51.3) million, or ($1.02) per diluted share, for the quarter ended June 30, 2010. Its banking subsidiary, BankAtlantic, had net income of $31.0 million for the second quarter of 2011, compared to a net loss of ($39.9) million for the second quarter of 2010. Included in the results for the second quarter of 2011 was a gain of $38.7 million associated with the June 2011 sale of BankAtlantic’s Tampa branch network.
BankAtlantic Bancorp’s Chairman and Chief Executive Officer, Alan B. Levan, commented, “Our results this quarter reflect the strong operating metrics at BankAtlantic, the gain on the Tampa deposit and branch sale, and what we believe is the improved economic environment in Florida. During the second quarter of 2011, provisions and charge offs continued to decline, and fewer loans migrated to default status. Deposits continue to be strong, leverage is low, and nonperforming assets are down. And importantly, BankAtlantic’s regulatory capital ratios, which have been generally stable and in excess of all regulatory well-capitalized standards since the downturn began in 2006, improved significantly during the second quarter of 2011 to levels not only in excess of all regulatory requirements, but higher than the ratios were before the onset of the economic downturn .
“We believe our continued focus on the fundamentals of Capital, Credit and Core Earnings, combined with the growing optimism for the Florida economy, will continue to yield a brighter outlook for BankAtlantic.
Highlights of the BankAtlantic Operating Segment
| • | “BankAtlantic exceeded all of its regulatory capital requirements at June 30, 2011, with a Tier 1/Core Capital Ratio of 8.24% and a Total Risk Based Capital Ratio of 14.52%. |
1
| • | “BankAtlantic completed the sale of its 19 Tampa branches and related deposits to PNC Bank, N.A., part of the PNC Financial Services Group Inc. (NYSE: PNC), in June 2011, and recorded a gain of $38.7 million. |
| • | “Credit metrics reflected overall improvement, with reductions in nonaccrual loans and nonperforming assets, improvement in early stage delinquencies to the lowest level in three years, lower net charge offs as compared to the last two quarters (and lower than eight of the last ten quarters), and a continued slowing pace of new nonaccrual loans and real estate valuation declines. Reflecting these improved credit metrics, the provision for loan losses for the second quarter of 2011 was $10.2 million, the lowest loan provision in over three years for BankAtlantic. |
| • | “Core operating earnings (1) have remained solid. For the second quarter of 2011, core operating earnings were $11.7 million, improved from both the prior quarter and the second quarter of 2010, and the net interest margin remained stable at 3.30%. |
“BankAtlantic’s deposit funding sources, the foundation of its franchise, remain strong, with customer deposits representing 99% of BankAtlantic’s funding at June 30, 2011. Core (2) and total deposits at June 30, 2011 totaled $2.6 billion and $3.4 billion, respectively, with a cost of core and total deposits of 0.22% and 0.41%, respectively, for the second quarter 2011, compared to the publicly traded Florida Bank and Thrift median cost of deposits of 1.08% as of March 31, 2011. Further, BankAtlantic had no outstanding borrowings from the FHLB at June 30, 2011. BankAtlantic’s total cost of funds for the second quarter of 2011 continued to decline to 0.57%, from 0.62% for the fourth quarter of 2010.
| (1) | Pre-tax core operating earnings is a non-GAAP measure that we use to refer to pre-tax earnings before gain on sale of Tampa branches, provision for loan losses, tax certificate provisions, debt redemption costs, gains/losses on sales of real estate, and impairments, restructuring and exit activities. A reconciliation of loss from bank operations before income taxes to pre-tax core operating earnings is included in BankAtlantic Bancorp’s Second Quarter, 2011 Supplemental Financials available at www.BankAtlanticBancorp.com. To view the financial data, access the “Investor Relations” section and click on the “Quarterly Financials or Supplemental Financials” navigation links. |
| (2) | Core deposits is a term that we use to refer to Demand, NOW and Savings accounts. A reconciliation of core deposits to total deposits is included in BankAtlantic Bancorp’s Second Quarter, 2011 Supplemental Financials available at www.BankAtlanticBancorp.com. To view the financial data, access the “Investor Relations” section and click on the “Quarterly Financials or Supplemental Financials” navigation links. |
2
| • | “Available liquidity, which includes cash, unpledged securities and unused FHLB borrowing capacity remained robust at June 30, 2011, at 35.0% of deposits. |
“As we have previously disclosed, we believe that BankAtlantic’s loan losses peaked in 2009 and that the trends continue to support our optimism that we are on the path toward recovery. These trends, from the beginning of the recession through the current quarter, are reflected in the Supplemental Graphs which should be viewed in conjunction with the Supplemental Financials on our BankAtlantic Bancorp’s Investor Relations website.
Supplemental graphs for BankAtlantic (bank only) are provided as a means to illustrate many of the metrics described above. To view the supplemental graphs, please visit our website at www.BankAtlanticBancorp.com, access the “Investor Relations” section and click on the “Supplemental Graphs” navigation link.
Additional detailed financial data for BankAtlantic (bank only), the Parent- BankAtlantic Bancorp, and consolidated BankAtlantic Bancorp are available at www.BankAtlanticBancorp.com. To view the financial data, access the “Investor Relations” section and click on the “Quarterly Financials or Supplemental Financials” navigation links.
BANKATLANTIC PERFORMANCE
CAPITAL:
BankAtlantic’s Chief Executive Officer, Jarett S. Levan, commented, “As noted previously, BankAtlantic’s capital exceeded all regulatory capital requirements applicable to it at June 30, 2011 with a Tier 1/Core Capital Ratio of 8.24% and a Total Risk Based Capital Ratio of 14.52%, having increased from March 31, 2011 ratios of 5.97% and 11.76%, respectively. The increase in capital ratios in the second quarter of 2011 was the result of the impact of the Tampa branch sale (both the net gain and the related reduction in assets), a $20 million capital contribution from BankAtlantic Bancorp, improved operating performance and lower tangible asset balances at BankAtlantic. Throughout the last several difficult years for the U.S. and Florida economy, BankAtlantic’s capital ratios never fell below applicable regulatory requirements. Historical capital ratios at BankAtlantic were:
| 12/2006 | 12/2007 | 12/2008 | 12/2009 | 12/2010 | 6/2011 | |||||||||||||||||||
| Tier 1/Core |
7.55 | % | 6.94 | % | 6.80 | % | 7.58 | % | 6.22 | % | 8.24 | % | ||||||||||||
| Tier 1 Risk-Based |
10.50 | % | 9.85 | % | 9.80 | % | 10.63 | % | 9.68 | % | 12.38 | % | ||||||||||||
| Total Risk-Based |
12.08 | % | 11.63 | % | 11.63 | % | 12.56 | % | 11.72 | % | 14.52 | % | ||||||||||||
3
CREDIT:
“When we compare the current 2011 quarter with the past two years, we are encouraged by what we believe are improvements in recent credit trends, including improvements in our delinquencies, nonperforming loan trends and provisions for credit losses.
| • | “Delinquencies excluding non-accrual loans and matured loans in the process of renewal were $27.8 million or 0.99% of total loans at June 30, 2011, as compared to $55.7 million or 1.86% of total loans at March 31, 2011, and $43.4 million or 1.23% of total loans at June 30, 2010. These early stage delinquency balances for total delinquencies excluding non-accrual loans at June 30, 2011 were the lowest levels in three years, the lowest levels in two years for the Consumer portfolio and the lowest level in eleven quarters for the Residential Real Estate portfolio. We are particularly encouraged by the delinquency trends in these homogenous portfolios. |
| • | “Total non-accrual loans were $316.6 million at June 30, 2011, reflecting a decrease of $46.0 million or 13% as compared to March 31, 2011, and a decrease of $45.5 million or 13% as compared to June 30, 2010. Total new non-accrual loans in the second quarter of 2011 totaled $33.1 million as compared to $44.7 million in the first quarter of 2011 and $100.7 million in the second quarter of 2010. |
| • | “The declines in non-accrual loans in the second quarter of 2011 were primarily due to a reduction of $48.9 million of commercial real estate non-accrual loans, reflecting two loan sales at book value (proceeds of $10.1 million), charge offs of $13.5 million, migration to real estate owned of $15.4 million, new non-accruals of $12.2 million, and loan paydowns including two totaling $5.5 million of non-accrual loans that were continuing to pay under the terms of their loan agreements. |
| • | “New non-accrual commercial real estate loans in the second quarter of 2011 totaled $12.2 million (of which $6.9 million continued to be current) as compared to $17.2 million in the first quarter of 2011 and $73.3 million in the second quarter of 2010. |
| • | “At June 30, 2011, approximately $91.4 million of commercial real estate and commercial business non-accrual loans (representing 44% of those categories’ non-accrual loans and 28.9% of total non-accrual loans) were impaired but continued to be current and paying under the terms of their loan agreements. |
| • | “Net charge-offs were $26.6 million in the second quarter of 2011, compared to $27.8 million in the first quarter of 2011 and $32.5 million in the second quarter of 2010. |
4
| • | “BankAtlantic’s allowance for loan losses was $137.9 million at June 30, 2011. The allowance coverage to total loans was 4.92% at June 30, 2011, compared to 5.20% at March 31, 2011 and 5.08% at June 30, 2010. |
| • | “The provision for loan losses in the second quarter of 2011 was $10.2 million compared to $27.8 million in the first quarter of 2011 and $43.6 million in the second quarter of 2010. The lower provision in the second quarter of 2011 is reflective of the overall improvement in credit trends (particularly in the homogenous portfolios) and the net reversal of $12.6 million of specific reserves due to charge-offs, loan paydowns and sales, the net reduction of impairment charges on existing impaired loans, and fewer new loans impaired during the quarter. |
CORE EARNINGS:
| • | Results of Operations — “BankAtlantic’s net income was $31.0 million for the second quarter of 2011, compared to a net loss of ($39.9) million for the second quarter of 2010. |
| • | “Pretax core operating earnings for the second quarter of 2011 were $11.7 million, compared to $9.1 million for the second quarter of 2010. Gain on sale of Tampa branches and deposits, loan loss and tax certificate provisions, debt redemption costs, loss on real estate sold and impairment, restructuring and exit activity expenses, which are not included in pre-tax core operating earnings, were $19.3 million for the second quarter of 2011 versus ($48.9) million for the second quarter of 2010. The individual components of earnings are described more fully below. |
| • | “BankAtlantic completed the sale of its 19 Tampa branches and related deposits to PNC Bank, N.A. (“PNC”) in June 2011. The transaction, which included the assumption by PNC of $324.3 million in deposits and resulted in a net reduction of assets for BankAtlantic of $285.1 million (no loans were sold in this transaction), resulted in a gain of $38.7 million. The impact of the net gain and the reduction of assets increased BankAtlantic’s Tier 1/Core capital ratio by approximately 152 basis points. We were pleased with the deposit premium associated with this transaction, and we believe that it reflects the high quality of the deposits not only in Tampa but throughout the BankAtlantic network. |
DEPOSITS: “BankAtlantic’s core and total deposits at June 30, 2011 were $2.6 billion and $3.4 billion, respectively.
5
| • | “During the second quarter of 2011: |
| • | Core deposits (excluding those associated with the Tampa branches) decreased slightly by $64.7 million from March 31, 2011, reflecting typical seasonality in BankAtlantic’s deposits. |
| • | Total deposits (excluding those associated with the Tampa branches) decreased by $187.7 million from March 31, 2011, reflecting primarily a decline in higher-cost certificates of deposit. |
“In addition, the average cost of core deposits and total deposits for the second quarter of 2011 was 0.22% and 0.41%, respectively; brokered deposit balances were minimal at $9.17 million, or 0.3% of total deposits; and non-CD balances represented approximately $3.0 billion, or 87% of total deposits.
Net Interest Income and Margin — “Net interest income for the second quarter of 2011 was $33.0 million, compared to $37.0 million for the second quarter of 2010. The reduction in the current quarter net interest income versus the prior year quarter reflected the impact of decreases in earning assets and increases in cash and lower-yielding investments.
| • | “Net interest margin during the second quarter of 2011 was 3.30% as compared to 3.49% during the second quarter of 2010. |
| • | “Net interest spread during the second quarter of 2011 was 3.16% as compared to 3.30% during the second quarter of 2010. |
| • | “The cost of interest bearing liabilities during the second quarter of 2011 was 0.57%, an improvement from 0.78% in the second quarter of 2010. |
| • | “The yield on total loans (including nonperforming loans) during the second quarter of 2011 was 4.51%, increased from 4.44% in the second quarter of 2010. |
| • | “Investments averaged $1.1 billion during the second quarter of 2011 with a yield of 1.54%, as compared to an average of $648.8 million during the second quarter of 2010 with a yield of 2.12%. The yield was impacted negatively due to average invested excess cash of $551.8 million during the second quarter of 2011 earning an average yield of 30 basis points. This compares to $254.7 million in average invested excess cash during the second quarter of 2010 earning an average yield of 22 basis points. The June 2011 sale of the Tampa branches was funded entirely by cash, decreasing the excess cash balances at June 30, 2011 to $297.9 million. Even after completion of the Tampa branch sale, available liquidity at June 30, 2011 remained significant at 35.0% of deposits. |
| • | “Other average balance sheet activity impacting net interest income included: |
| • | “Average earning assets of $3.99 billion for the second quarter of 2011 were $251.9 million less than average earning assets for the second quarter of 2010, reflecting a decline in average loans of $649.5 million due primarily to routine paydowns and net charge-offs, offset by the increase in average investments discussed above primarily from cash inflows. |
6
| • | “Nonperforming assets decreased by $20.1 million from June 30, 2010 to June 30, 2011. |
Non-interest income — “Total non-interest income for the second quarter of 2011 was $60.1 million, or $21.4 million excluding the $38.7 million gain on the sale of the Tampa branches. This was down from non-interest income of $26.3 million in the second quarter of 2010, primarily reflecting declines in service charges relating to lower levels of customer non-sufficient funds activity.
Non-interest expense — “Total non-interest expenses were $51.9 million in the second quarter of 2011 compared to $59.5 million in the second quarter of 2010. Core expenses (3) were $42.7 million in the second quarter of 2011, compared to core expenses of $54.2 million in the second quarter of 2010, reflecting a $5 million decrease in employee compensation and benefits due to lower staffing levels, a $3.7 million decrease in professional fees due to a refund of $3.3 million in legal costs from insurers in the second quarter of 2011 as compared to a $1.4 million reimbursement in the second quarter of 2010, and a $2.3 million decrease in occupancy and equipment expense. The core operating efficiency ratio in the second quarter of 2011 was 78.6%, improved from 85.7% in the second quarter of 2010.
“Expenses not included in ‘core expenses’ consisted of the following:
| • | “Impairment, restructuring and exit activities of $7.4 million in the second quarter of 2011, versus charges of $2.2 million in the second quarter of 2010. The charges in the second quarter of 2011 included: |
| • | Charges totaling $6.2 million related to write-downs of real estate owned. |
| • | Net recovery of ($0.3) million of restructuring charges, primarily related to favorable lease terminations on unused leased property sites. |
| • | Lower of cost or market adjustments on loans held for sale of $1.5 million. |
| (3) | Core expense is a non-GAAP measure that we use to refer to total non-interest expenses excluding tax certificate provisions, debt redemption costs, gains/losses on sales of real estate, impairments, restructuring and exit activities. A reconciliation of total expense to core expense is included in BankAtlantic Bancorp’s Second Quarter, 2011 Supplemental Financials available at www.BankAtlanticBancorp.com. To view the financial data, access the “Investor Relations” section and click on the “Quarterly Financials or Supplemental Financials” navigation links. |
7
| • | “Tax certificate provision of $1.0 million in the second quarter of 2011, versus $2.1 million in the second quarter of 2010. |
| • | “Gain on sale of real estate of $0.4 million in the second quarter of 2011, versus a loss of ($0.9) million in the second quarter of 2010. |
| • | “Costs associated with debt redemption of $1.1 million in the second quarter of 2011. |
“We were very pleased with the response from customers relating to our recently launched products, services and initiatives including seamless mobility using BankAtlantic’s Mobile Banking Application for the Android, our iPhone, iPad and iPod Touch app, Mobile Web and Text Message Banking. Further, we were pleased to announce that BankAtlantic is the most active community bank lender in the South Florida District of the Small Business Administration (the “SBA”) based on loan units approved. Additionally, BankAtlantic is the fourth most active SBA overall lender (as of May 31, 2011) in the SBA’s South Florida District based on loan units approved, and has occupied that position for the entire fiscal year.”
BANKATLANTIC BANCORP (Parent Company only):
Alan B. Levan further commented, “BankAtlantic Bancorp’s (Parent Company only) net loss was ($7.6) million for the second quarter of 2011, compared to a net loss of ($11.4) million for the second quarter of 2010. The second quarter of 2011 included loan provisions of $0.5 million as compared to loan provisions of $4.9 million in the second quarter of 2010. Additionally, the net loss in the second quarter of 2011 included a $1.5 million impairment charge relating to an investment held by BankAtlantic Bancorp.
“During the second quarter of 2011, BankAtlantic Bancorp completed a rights offering for Class A Common Stock, receiving approximately $11.3 million in proceeds, and issuing an aggregate of approximately 15.1 million shares of its Class A Common Stock to participating shareholders, increasing total outstanding Class A and Class B Common Shares of BankAtlantic Bancorp to 78,133,720 shares as of June 30, 2011. BankAtlantic Bancorp used the funds from the offering as part of its $20 million capital contribution to BankAtlantic in June 2011.
“In the fourth quarter of 2008, BankAtlantic Bancorp and BankAtlantic recorded a full valuation allowance against its net deferred tax asset, and have continued to maintain a full valuation allowance against this asset on the balance sheet and in its capital calculations. Accordingly, although we recorded net income for the second quarter of 2011, the net tax provision for the quarter is zero. At June 30, 2011,
8
the total Federal and State deferred tax asset balance, before netting the full valuation allowance, was $195.1 million, with $145.1 million related to BankAtlantic and $50.0 million related to BankAtlantic Bancorp (Parent only). The deferred tax asset valuation allowance will remain in place until it is determined that the asset would more likely than not be realized as a result of future income. In other words, at such time as we are able to demonstrate sustainable future income, part or all of the valuation allowances at BankAtlantic and BankAtlantic Bancorp would be reversed through the tax provision into net income and book value.
“Additionally, as first announced in the first quarter of 2009, we continue to defer the regularly scheduled interest payments on the outstanding junior subordinated debentures relating to all of our trust preferred securities, which is permitted under the terms of the securities for up to another 10 consecutive quarterly periods. Total deferred interest amounted to $35.4 million at June 30, 2011.
Asset Workout Subsidiary – “The loans and real estate owned held by BankAtlantic Bancorp’s workout subsidiary at June 30, 2011 included real estate owned of $8.6 million, performing loans of $2.6 million and non-accrual loans of $9.4 million. Charge-offs of $21.0 million have previously been taken on these non-accrual loans, and no reserves are currently maintained related to these loans.
REGULATORY AND LEGAL MATTERS:
“As previously disclosed, on February 23, 2011, BankAtlantic Bancorp and BankAtlantic each entered into agreements (“Orders”) with the Office of Thrift Supervision (the “OTS”), agreeing to continue to take actions to strengthen their financial condition and operations, including requiring BankAtlantic to meet by June 30, 2011 and maintain a Tier 1/Core capital ratio of 8% and a Total Risk Based capital ratio of 14%. As reported herein, BankAtlantic exceeded these capital requirements at June 30, 2011, and both BankAtlantic and BankAtlantic Bancorp are in full compliance with the Orders.
“Additionally, as previously disclosed, BankAtlantic Bancorp recently received positive resolutions in two shareholder suits. In re BankAtlantic Bancorp, Inc. Securities Litigation, on April 25, 2011, the United States District Court for the Southern District of Florida granted defendants’ post-trial motion for judgment as a matter of law and vacated the prior jury verdict, resulting in a judgment in favor of all defendants and claims. The plaintiffs are appealing the Court’s order setting aside the jury verdict. In D.W. Hugo vs. BankAtlantic Bancorp, etal, on July 13, 2011, the United States District Court for the Southern District of Florida granted final approval of the settlement, whereby the parties have exchanged releases and neither the individual defendants nor the Company will make any monetary payments.”
- - -
9
Additional detailed financial data for BankAtlantic (bank only), the Parent- BankAtlantic Bancorp, and consolidated BankAtlantic Bancorp are available at www.BankAtlanticBancorp.com
To view the financial data, access the “Investor Relations” section and click on the “Quarterly Financials or Supplemental Financials” navigation links. Additionally, BankAtlantic’s financial information is provided quarterly to the OCC through Thrift Financial Reports, available to the public through the OCC and FDIC websites.
Additionally, copies of BankAtlantic Bancorp’s second quarter, 2011 financial results press release and financial data are available upon request via fax, email, or postal service mail. To request a copy, contact BankAtlantic Bancorp’s Investor Relations department using the contact information listed below.
About BankAtlantic Bancorp:
BankAtlantic Bancorp (NYSE: BBX) is a bank holding company and the parent company of BankAtlantic.
About BankAtlantic:
BankAtlantic, Florida’s Most Convenient Bank, is one of the largest financial institutions headquartered in Florida. Via its broad network of community branches and conveniently located ATMs, BankAtlantic provides a full line of personal, small business and commercial banking products and services. BankAtlantic is open 7 days a week and offers extended weekday hours, Online Banking & Bill Pay, a 7-Day Customer Service Center, Change Exchange coin counters, as well as retail and business checking accounts. Member FDIC.
For further information, please visit our websites:
www.BankAtlanticBancorp.com
www.BankAtlantic.com
To receive future BankAtlantic Bancorp news releases or announcements directly via Email, please click on the Email Broadcast Sign Up button on our website: www.BankAtlanticBancorp.com.
BankAtlantic Bancorp, Inc. Contact Info:
Leo Hinkley, Investor and Corporate Communications Officer: 954- 940-5300
InvestorRelations@BankAtlanticBancorp.com
Sharon Lyn, V.P., Investor and Corporate Communications: 954-940-6383
CorpComm@BankAtlanticBancorp.com
BankAtlantic Media Contact:
Caren Berg, Boardroom Communications
(954) 370-8999
cberg@boardroompr.com
# # #
Except for historical information contained herein, the matters discussed in this press release contain forward-looking statements within the meaning of Section 27A of the Securities Act of 1933, as amended (the “Securities Act”), and Section 21E of the Securities Exchange Act of 1934, as amended (the
10
“Exchange Act”), that involve substantial risks and uncertainties. Actual results, performance, or achievements could differ materially from those contemplated, expressed, or implied by the forward-looking statements contained herein. These forward-looking statements are based largely on the expectations of BankAtlantic Bancorp, Inc. (“the Company”) and are subject to a number of risks and uncertainties that are subject to change based on factors which are, in many instances, beyond the Company’s control. These include, but are not limited to, risks and uncertainties associated with: the impact of economic, competitive and other factors affecting the Company and its operations, markets, products and services, including the impact of the changing regulatory environment, a continued or deepening recession, continued decreases in real estate values, and increased unemployment or sustained high unemployment rates on our business generally, BankAtlantic’s regulatory capital ratios, the ability of our borrowers to service their obligations and of our customers to maintain account balances and the value of collateral securing our loans; credit risks and loan losses, and the related sufficiency of the allowance for loan losses, including the impact of the economy and real estate market values on the credit quality of our loans (including those held in the asset workout subsidiary of the Company); the risk that loan losses have not peaked and risks of additional charge-offs, impairments and required increases in our allowance for loan losses; the impact of regulatory proceedings and litigation including but not limited to proceedings and litigation relating to overdraft fees and tax certificates; risks associated with maintaining compliance with the Cease and Desist Orders entered into by the Company and BankAtlantic with the Office of Thrift Supervision, including risks that BankAtlantic will not maintain required capital levels, that compliance will adversely impact operations, and that failing to comply with regulatory mandates will result in the imposition of additional regulatory requirements and/or fines; changes in interest rates and the effects of, and changes in, trade, monetary and fiscal policies and laws including their impact on the bank’s net interest margin; adverse conditions in the stock market, the public debt market and other financial and credit markets and the impact of such conditions on our activities and our ability to raise capital; we may raise additional capital and such capital may be highly dilutive to BankAtlantic Bancorp’s shareholders or may not be available; and the risks associated with the impact of periodic valuation testing of goodwill, deferred tax assets and other assets. Past performance and perceived trends may not be indicative of future results. In addition to the risks and factors identified above, reference is also made to other risks and factors detailed in reports filed by the Company with the Securities and Exchange Commission, including the Company’s Annual Report on Form 10-K for the year ended December 31, 2010, and the Quarterly Report on Form 10-Q for the quarter ended March 31, 2011. The Company cautions that the foregoing factors are not exclusive.
11

Supplemental Financial Information
Second Quarter 2011
Release Date: July 27, 2011
This information is preliminary, unaudited and based on data available at the time of the release.
| Table of Contents |
Page | |||
| Consolidated BankAtlantic Bancorp, Inc. and Subsidiaries |
||||
| Summary of Selected Financial Data (unaudited) |
2 | |||
| Consolidated Statement of Financial Condition (unaudited) |
3 | |||
| Consolidated Statements of Operations (unaudited) |
4 | |||
| Consolidated Average Balance Sheet (unaudited) |
5 | |||
| Nonperforming Assets and Credit Quality Statistics |
6 | |||
| Reconciliation of GAAP Financial Measures to Non-GAAP Measures |
7 | |||
| BankAtlantic (Bank Operations Business Segment) |
||||
| Summary of Selected Financial Data (unaudited) |
8 | |||
| Condensed Statements of Operations (unaudited) |
9 | |||
| Condensed Statements of Financial Condition (unaudited) |
10 | |||
| Quarterly Average Balance Sheet – Yield/Rate Analysis |
11 | |||
| Year-to-Date Average Balance Sheet – Yield/Rate Analysis |
12 | |||
| Allowance for Loan Loss and Credit Quality |
13 | |||
| Delinquencies, Excluding Non-Accrual Loans, at Period-End |
14 | |||
| Loan Provision and Allowance for Loan Losses by Portfolio |
14 | |||
| Reconciliation of GAAP Financial Measures to Non-GAAP Measures |
15 | |||
| Parent Company Business Segment |
||||
| Condensed Statements of Operations (unaudited) |
16 | |||
| Condensed Statements of Financial Condition (unaudited) |
16 | |||
| Allowance for Loan Loss and Credit Quality |
16 | |||
1
BankAtlantic Bancorp, Inc. and Subsidiaries
Summary of Selected Financial Data (unaudited)
| For the Three Months Ended | For
the Six Months Ended |
|||||||||||||||||||||||||||||||
| 6/30/2011 | 3/31/2011 | 12/31/2010 | 9/30/2010 | 6/30/2010 | 6/30/2011 | 6/30/2010 | ||||||||||||||||||||||||||
| Earnings (in thousands): |
||||||||||||||||||||||||||||||||
| Net income (loss) from continuing operations |
$ | 23,401 | (22,887 | ) | (45,795 | ) | (25,184 | ) | (51,250 | ) | 514 | (71,771 | ) | |||||||||||||||||||
| Net income (loss) |
$ | 23,401 | (22,887 | ) | (46,295 | ) | (25,184 | ) | (51,250 | ) | 514 | (71,771 | ) | |||||||||||||||||||
| Net income (loss) attributable to BankAtlantic Bancorp |
$ | 23,111 | (23,182 | ) | (46,554 | ) | (25,409 | ) | (51,489 | ) | (71 | ) | (72,218 | ) | ||||||||||||||||||
| Pre-tax core operating earnings — Non-GAAP |
(note 1 | ) | $ | 5,295 | 7,210 | 4,269 | 7,871 | 3,927 | 12,505 | 15,030 | ||||||||||||||||||||||
| Average Common Shares Outstanding (in thousands): |
||||||||||||||||||||||||||||||||
| Basic |
65,297 | 62,724 | 62,571 | 60,784 | 50,679 | 64,017 | 50,010 | |||||||||||||||||||||||||
| Diluted |
65,297 | 62,724 | 62,571 | 60,784 | 50,679 | 64,017 | 50,010 | |||||||||||||||||||||||||
| Key Performance Ratios |
||||||||||||||||||||||||||||||||
| Basic and diluted income (loss) |
||||||||||||||||||||||||||||||||
| per share from continuing operations |
(note 2 | ) | $ | 0.35 | (0.37 | ) | (0.74 | ) | (0.42 | ) | (1.02 | ) | (0.00 | ) | (1.44 | ) | ||||||||||||||||
| Basic and diluted income (loss) per share |
(note 2 | ) | $ | 0.35 | (0.37 | ) | (0.74 | ) | (0.42 | ) | (1.02 | ) | (0.00 | ) | (1.44 | ) | ||||||||||||||||
| Return on average tangible assets from continuing operations |
(note 3 | ) | % | 2.18 | (2.02 | ) | (4.06 | ) | (2.22 | ) | (4.46 | ) | 0.02 | (3.08 | ) | |||||||||||||||||
| Return on average tangible equity from continuing operations |
(note 3 | ) | % | (4,557.16 | ) | (1,152.71 | ) | (356.19 | ) | (138.75 | ) | (193.89 | ) | 35.24 | (123.20 | ) | ||||||||||||||||
| Average Balance Sheet Data (in millions): |
||||||||||||||||||||||||||||||||
| Assets |
$ | 4,317 | 4,550 | 4,530 | 4,548 | 4,616 | 4,433 | 4,680 | ||||||||||||||||||||||||
| Tangible assets — Non-GAAP |
(note 3 | ) | $ | 4,303 | 4,536 | 4,515 | 4,533 | 4,600 | 4,419 | 4,664 | ||||||||||||||||||||||
| Loans, gross |
$ | 2,956 | 3,123 | 3,360 | 3,513 | 3,627 | 3,039 | 3,713 | ||||||||||||||||||||||||
| Investments |
$ | 1,046 | 1,118 | 883 | 748 | 648 | 1,082 | 626 | ||||||||||||||||||||||||
| Deposits and escrows |
$ | 3,859 | 3,980 | 3,900 | 3,931 | 4,080 | 3,919 | 4,047 | ||||||||||||||||||||||||
| Equity |
$ | 6 | 16 | 63 | 85 | 118 | 11 | 130 | ||||||||||||||||||||||||
| Tangible equity — Non-GAAP |
(note 3 | ) | $ | (2 | ) | 8 | 51 | 73 | 106 | 3 | 117 | |||||||||||||||||||||
| Period End ($ in thousands) |
||||||||||||||||||||||||||||||||
| Total loans, net |
$ | 2,673,136 | 2,821,429 | 3,018,179 | 3,239,542 | 3,387,725 | ||||||||||||||||||||||||||
| Total assets |
$ | 3,863,864 | 4,470,629 | 4,509,433 | 4,527,736 | 4,655,600 | ||||||||||||||||||||||||||
| Total equity |
$ | 26,235 | (8,729 | ) | 14,744 | 64,082 | 77,466 | |||||||||||||||||||||||||
| Class A common shares outstanding |
77,158,495 | 61,979,071 | 61,595,321 | 61,595,321 | 52,946,126 | |||||||||||||||||||||||||||
| Class B common shares outstanding |
975,225 | 975,225 | 975,225 | 975,225 | 975,225 | |||||||||||||||||||||||||||
| Book value per share |
$ | 0.34 | (0.14 | ) | 0.24 | 1.02 | 1.44 | |||||||||||||||||||||||||
| Tangible book value per share — Non-GAAP |
(note 4 | ) | $ | 0.24 | (0.26 | ) | 0.10 | 0.84 | 1.20 | |||||||||||||||||||||||
| High stock price for the quarter |
$ | 1.03 | 1.33 | 1.59 | 1.85 | 3.28 | ||||||||||||||||||||||||||
| Low stock price for the quarter |
$ | 0.69 | 0.82 | 0.60 | 0.75 | 1.35 | ||||||||||||||||||||||||||
| Closing stock price |
$ | 0.95 | 0.92 | 1.15 | 0.80 | 1.40 | ||||||||||||||||||||||||||
Notes:
| (1) | Pre-tax core operating earnings excludes the gain on sale of Tampa branches, provision for loan losses, cost associated with debt redemption, provision for tax certificates, gains/losses on sales of real estate and impairments, restructuring and exit activities. Pre-tax core operating earnings is a non-GAAP measure. |
See page 7 for a reconciliation of non-GAAP measures to GAAP financial measures.
| (2) | Diluted and basic loss per share are the same for all periods presented. |
| (3) | Average tangible assets is defined as average total assets less average goodwill and core deposit intangibles. |
Average tangible equity is defined as average total equity less average goodwill, core deposit intangibles and other comprehensive income. Average tangible assets and average tangible equity are non-GAAP measures. See page 7 for a reconciliation of non-GAAP measures to GAAP financial measures.
| (4) | Tangible book value per share is defined as equity less accumulated other comprehensive loss, goodwill and core deposit intangibles divided by the number of common shares outstanding. Tangible book value per share is a non-GAAP measure. |
See page 7 for a reconciliation of non-GAAP measures to GAAP financial measures.
2
BankAtlantic Bancorp, Inc. and Subsidiaries
Consolidated Statements of Financial Condition (unaudited)
| (in thousands) | June 30, 2011 |
December 31, 2010 |
||||||
| ASSETS |
||||||||
| Cash and due from depository institutions |
$ | 112,300 | 97,930 | |||||
| Interest bearing deposits at federal reserve and other banks |
318,437 | 455,538 | ||||||
| Securities available for sale and derivatives (at fair value) |
316,517 | 424,391 | ||||||
| Investment securities (approximate fair value: $0 and $1,500) |
— | 1,500 | ||||||
| Tax certificates, net of allowance of $8,526 and $8,811 |
66,211 | 89,789 | ||||||
| Loans receivable, net of allowance for loan losses of $137,868 and $162,139 |
2,673,136 | 3,018,179 | ||||||
| Loans held for sale (at lower of cost or fair value) |
43,136 | 29,765 | ||||||
| Federal Home Loan Bank stock, at cost which approximates fair value |
31,614 | 43,557 | ||||||
| Real estate held for sale |
5,084 | 5,436 | ||||||
| Real estate owned |
79,704 | 74,488 | ||||||
| Office properties and equipment, net |
145,239 | 151,414 | ||||||
| Goodwill and other intangible assets |
13,965 | 14,569 | ||||||
| Assets held for sale |
1,768 | 37,334 | ||||||
| Other assets |
56,753 | 65,543 | ||||||
| Total assets |
$ | 3,863,864 | 4,509,433 | |||||
| LIABILITIES AND EQUITY |
||||||||
| Liabilities: |
||||||||
| Deposits |
||||||||
| Demand |
$ | 884,209 | 792,260 | |||||
| Savings |
447,706 | 418,304 | ||||||
| NOW |
1,239,130 | 1,370,568 | ||||||
| Money market |
399,195 | 354,282 | ||||||
| Certificates of deposit |
454,279 | 616,454 | ||||||
| Deposits held for sale |
— | 341,146 | ||||||
| Total deposits |
3,424,519 | 3,893,014 | ||||||
| Advances from FHLB |
— | 170,000 | ||||||
| Securities sold under agreements to repurchase |
— | 21,524 | ||||||
| Short term borrowings |
1,020 | 1,240 | ||||||
| Subordinated debentures |
22,000 | 22,000 | ||||||
| Junior subordinated debentures |
329,643 | 322,385 | ||||||
| Liabilities held for sale |
— | 87 | ||||||
| Other liabilities |
60,447 | 64,440 | ||||||
| Total liabilities |
3,837,629 | 4,494,690 | ||||||
| Equity: |
||||||||
| Common stock |
782 | 626 | ||||||
| Additional paid-in capital |
328,958 | 317,362 | ||||||
| Accumulated deficit |
(297,686 | ) | (297,615 | ) | ||||
| Accumulated other comprehensive loss |
(6,346 | ) | (6,088 | ) | ||||
| Total BankAtlantic Bancorp stockholders’ equity |
25,708 | 14,285 | ||||||
| Noncontrolling interests |
527 | 458 | ||||||
| Total equity |
26,235 | 14,743 | ||||||
| Total liabilities and equity |
$ | 3,863,864 | 4,509,433 | |||||
3
BankAtlantic Bancorp, Inc. and Subsidiaries
Consolidated Statements of Operations (unaudited)
| For the Three Months Ended | For the Six Months Ended |
|||||||||||||||||||||||||||
| (in thousands) | 6/30/2011 | 3/31/2011 | 12/31/2010 | 9/30/2010 | 6/30/2010 | 6/30/2011 | 6/30/2010 | |||||||||||||||||||||
| INTEREST INCOME: |
||||||||||||||||||||||||||||
| Interest and fees on loans |
$ | 33,241 | 34,910 | 36,106 | 38,356 | 39,898 | 68,151 | 81,532 | ||||||||||||||||||||
| Interest on securities available for sale |
2,374 | 2,597 | 2,815 | 2,847 | 2,714 | 4,971 | 6,359 | |||||||||||||||||||||
| Interest on tax certificates |
1,043 | 1,410 | 1,544 | 2,837 | 514 | 2,453 | 2,870 | |||||||||||||||||||||
| Interest and dividends on investments |
622 | 588 | 299 | 367 | 223 | 1,210 | 376 | |||||||||||||||||||||
| Total interest income |
37,280 | 39,505 | 40,764 | 44,407 | 43,349 | 76,785 | 91,137 | |||||||||||||||||||||
| INTEREST EXPENSE: |
||||||||||||||||||||||||||||
| Interest on deposits |
3,975 | 4,367 | 4,556 | 4,877 | 6,021 | 8,342 | 13,078 | |||||||||||||||||||||
| Interest on advances from FHLB |
38 | 115 | 144 | 106 | 1 | 153 | 959 | |||||||||||||||||||||
| Interest on short-term borrowed funds |
3 | 6 | 7 | 8 | 7 | 9 | 15 | |||||||||||||||||||||
| Interest on debentures |
4,080 | 4,008 | 4,007 | 4,107 | 3,891 | 8,088 | 7,682 | |||||||||||||||||||||
| Total interest expense |
8,096 | 8,496 | 8,714 | 9,098 | 9,920 | 16,592 | 21,734 | |||||||||||||||||||||
| NET INTEREST INCOME |
29,184 | 31,009 | 32,050 | 35,309 | 33,429 | 60,193 | 69,403 | |||||||||||||||||||||
| Provision for loan losses |
10,709 | 27,812 | 40,643 | 24,410 | 48,553 | 38,521 | 79,308 | |||||||||||||||||||||
| NET INTEREST INCOME AFTER PROVISION |
18,475 | 3,197 | (8,593 | ) | 10,899 | (15,124 | ) | 21,672 | (9,905 | ) | ||||||||||||||||||
| NON-INTEREST INCOME: |
||||||||||||||||||||||||||||
| Service charges on deposits |
11,226 | 12,032 | 14,080 | 15,214 | 15,502 | 23,258 | 30,550 | |||||||||||||||||||||
| Other service charges and fees |
6,886 | 7,191 | 7,528 | 7,495 | 7,739 | 14,077 | 15,117 | |||||||||||||||||||||
| Securities activities, net |
(1,500 | ) | (24 | ) | (34 | ) | (552 | ) | 312 | (1,524 | ) | 3,450 | ||||||||||||||||
| Gain on sale of Tampa branches |
38,656 | — | — | — | — | 38,656 | — | |||||||||||||||||||||
| Other |
3,742 | 4,008 | 3,091 | 5,204 | 2,970 | 7,750 | 5,870 | |||||||||||||||||||||
| Total non-interest income |
59,010 | 23,207 | 24,665 | 27,361 | 26,523 | 82,217 | 54,987 | |||||||||||||||||||||
| NON-INTEREST EXPENSE: |
||||||||||||||||||||||||||||
| Employee compensation and benefits |
19,731 | 19,290 | 19,868 | 23,549 | 25,155 | 39,021 | 50,533 | |||||||||||||||||||||
| Occupancy and equipment |
11,488 | 12,585 | 12,999 | 13,263 | 13,745 | 24,073 | 27,327 | |||||||||||||||||||||
| Advertising and business promotion |
1,523 | 1,695 | 2,389 | 2,026 | 2,239 | 3,218 | 4,183 | |||||||||||||||||||||
| Professional fees |
1,295 | 3,359 | 6,518 | 6,209 | 4,824 | 4,654 | 7,711 | |||||||||||||||||||||
| Check losses |
663 | 299 | 705 | 763 | 521 | 962 | 953 | |||||||||||||||||||||
| Supplies and postage |
955 | 902 | 1,052 | 983 | 921 | 1,857 | 1,919 | |||||||||||||||||||||
| Telecommunication |
446 | 575 | 635 | 702 | 662 | 1,021 | 1,196 | |||||||||||||||||||||
| Cost associated with debt redemption |
1,115 | 10 | — | — | 53 | 1,125 | 60 | |||||||||||||||||||||
| Provision for tax certificates |
1,021 | 779 | 800 | 885 | 2,134 | 1,800 | 2,867 | |||||||||||||||||||||
| (Gain) loss on sale of real estate |
(378 | ) | (453 | ) | 663 | (442 | ) | 1,490 | (831 | ) | 1,386 | |||||||||||||||||
| Impairment, restructuring and exit activities |
8,083 | 1,948 | 10,219 | 8,165 | 2,947 | 10,031 | 3,090 | |||||||||||||||||||||
| Other |
8,142 | 8,301 | 8,280 | 7,304 | 7,958 | 16,443 | 15,538 | |||||||||||||||||||||
| Total non-interest expense |
54,084 | 49,290 | 64,128 | 63,407 | 62,649 | 103,374 | 116,763 | |||||||||||||||||||||
| Income (loss) from continuing operations before income taxes |
23,401 | (22,886 | ) | (48,056 | ) | (25,147 | ) | (51,250 | ) | 515 | (71,681 | ) | ||||||||||||||||
| Provision (benefit) for income taxes |
— | 1 | (2,261 | ) | 37 | — | 1 | 90 | ||||||||||||||||||||
| Income (loss) from continuing operations |
23,401 | (22,887 | ) | (45,795 | ) | (25,184 | ) | (51,250 | ) | 514 | (71,771 | ) | ||||||||||||||||
| Discontinued operations |
— | — | (500 | ) | — | — | — | — | ||||||||||||||||||||
| Net income (loss) |
23,401 | (22,887 | ) | (46,295 | ) | (25,184 | ) | (51,250 | ) | 514 | (71,771 | ) | ||||||||||||||||
| Less: net income attributable to noncontrolling interest |
(290 | ) | (295 | ) | (259 | ) | (225 | ) | (239 | ) | (585 | ) | (447 | ) | ||||||||||||||
| Net income (loss) attributable to BankAtlantic Bancorp |
$ | 23,111 | (23,182 | ) | (46,554 | ) | (25,409 | ) | (51,489 | ) | (71 | ) | (72,218 | ) | ||||||||||||||
4
BankAtlantic Bancorp, Inc. and Subsidiaries
Consolidated Average Balance Sheet (unaudited)
| For the Three Months Ended | ||||||||||||||||||||||||
| (in thousands except percentages and per share data) | 6/30/2011 | 3/31/2011 | 12/31/2010 | 9/30/2010 | 6/30/2010 | |||||||||||||||||||
| Loans: |
||||||||||||||||||||||||
| Residential real estate |
$ | 1,093,487 | 1,175,875 | 1,270,095 | 1,356,748 | 1,433,322 | ||||||||||||||||||
| Commercial real estate |
834,114 | 891,043 | 1,010,148 | 1,061,918 | 1,079,760 | |||||||||||||||||||
| Consumer |
605,062 | 620,986 | 635,564 | 653,631 | 670,173 | |||||||||||||||||||
| Commercial business |
125,116 | 134,452 | 139,485 | 133,841 | 135,689 | |||||||||||||||||||
| Small business |
298,338 | 300,931 | 304,406 | 306,927 | 308,254 | |||||||||||||||||||
| Total Loans |
2,956,117 | 3,123,287 | 3,359,698 | 3,513,065 | 3,627,198 | |||||||||||||||||||
| Investments |
1,046,442 | 1,117,901 | 882,974 | 748,299 | 648,462 | |||||||||||||||||||
| Total interest earning assets |
4,002,559 | 4,241,188 | 4,242,672 | 4,261,364 | 4,275,660 | |||||||||||||||||||
| Goodwill and core deposit intangibles |
14,125 | 14,411 | 14,718 | 15,028 | 15,353 | |||||||||||||||||||
| Other non-interest earning assets |
300,615 | 294,489 | 272,805 | 271,950 | 324,727 | |||||||||||||||||||
| Total assets |
$ | 4,317,299 | 4,550,088 | 4,530,195 | 4,548,342 | 4,615,740 | ||||||||||||||||||
| Tangible assets — Non-GAAP |
(note 3 | ) | $ | 4,303,174 | 4,535,677 | 4,515,477 | 4,533,314 | 4,600,387 | ||||||||||||||||
| Deposits: |
||||||||||||||||||||||||
| Demand deposits |
$ | 952,411 | 944,956 | 924,035 | 907,294 | 916,131 | ||||||||||||||||||
| Savings |
478,628 | 468,673 | 448,942 | 444,981 | 445,686 | |||||||||||||||||||
| NOW |
1,412,720 | 1,519,105 | 1,476,258 | 1,484,558 | 1,525,475 | |||||||||||||||||||
| Money market |
408,653 | 389,155 | 406,781 | 404,406 | 386,712 | |||||||||||||||||||
| Certificates of deposit |
606,292 | 658,051 | 644,124 | 689,664 | 805,656 | |||||||||||||||||||
| Total deposits |
3,858,704 | 3,979,940 | 3,900,140 | 3,930,903 | 4,079,660 | |||||||||||||||||||
| Short-term borrowed funds |
10,868 | 19,191 | 18,099 | 26,187 | 25,528 | |||||||||||||||||||
| FHLB advances |
42,747 | 134,833 | 149,130 | 106,685 | 1,264 | |||||||||||||||||||
| Debentures |
348,540 | 344,971 | 341,409 | 340,230 | 334,507 | |||||||||||||||||||
| Total borrowings |
402,155 | 498,995 | 508,638 | 473,102 | 361,299 | |||||||||||||||||||
| Other liabilities |
50,635 | 55,040 | 58,015 | 59,207 | 57,152 | |||||||||||||||||||
| Total liabilities |
4,311,494 | 4,533,975 | 4,466,793 | 4,463,212 | 4,498,111 | |||||||||||||||||||
| Equity |
5,805 | 16,113 | 63,402 | 85,130 | 117,629 | |||||||||||||||||||
| Total liabilities and equity |
$ | 4,317,299 | 4,550,088 | 4,530,195 | 4,548,342 | 4,615,740 | ||||||||||||||||||
| Other comprehensive loss in equity |
(6,266 | ) | (6,240 | ) | (2,743 | ) | (2,499 | ) | (3,454 | ) | ||||||||||||||
| Tangible equity — Non-GAAP |
(note 3 | ) | $ | (2,054 | ) | 7,942 | 51,427 | 72,601 | 105,730 | |||||||||||||||
| Net Interest Margin |
2.92 | % | 2.92 | % | 3.03 | % | 3.32 | % | 3.13 | % | ||||||||||||||
5
Consolidated BankAtlantic Bancorp, Inc. and Subsidiaries
Nonperforming Assets and Credit Quality Statistics
| (in thousands) | As of | |||||||||||||||||||
| 6/30/2011 | 3/31/2011 | 12/31/2010 | 9/30/2010 | 6/30/2010 | ||||||||||||||||
| Nonaccrual loans: |
||||||||||||||||||||
| BankAtlantic |
$ | 316,633 | 362,604 | 370,959 | 404,087 | 362,126 | ||||||||||||||
| Parent- Work out Sub |
9,360 | 11,360 | 14,508 | 19,916 | 24,358 | |||||||||||||||
| Consolidated nonaccrual loans |
$ | 325,993 | 373,964 | 385,467 | 424,003 | 386,484 | ||||||||||||||
| Quarter-to-Date Net Charge-offs: |
||||||||||||||||||||
| BankAtlantic |
$ | (26,564 | ) | (27,823 | ) | (57,688 | ) | (21,887 | ) | (32,547 | ) | |||||||||
| Parent- Work out Sub |
(1,329 | ) | 4 | (3,741 | ) | (4,438 | ) | (5,741 | ) | |||||||||||
| Consolidated charge-offs |
$ | (27,893 | ) | (27,819 | ) | (61,429 | ) | (26,325 | ) | (38,288 | ) | |||||||||
| Quarter-to-date Loan Provision: |
||||||||||||||||||||
| BankAtlantic |
$ | 10,195 | 27,832 | 40,144 | 23,012 | 43,634 | ||||||||||||||
| Parent- Work out Sub |
515 | (20 | ) | 498 | 1,398 | 4,919 | ||||||||||||||
| Consolidated loan provision |
$ | 10,710 | 27,812 | 40,642 | 24,410 | 48,553 | ||||||||||||||
| Allowance for Loan Loss: |
||||||||||||||||||||
| BankAtlantic |
$ | 137,868 | 154,237 | 161,309 | 181,760 | 180,635 | ||||||||||||||
| Parent- Work out Sub |
— | 814 | 830 | 4,187 | 7,227 | |||||||||||||||
| Consolidated allowance for loan loss |
$ | 137,868 | 155,051 | 162,139 | 185,947 | 187,862 | ||||||||||||||
| Nonperforming Assets: |
||||||||||||||||||||
| BankAtlantic |
$ | 390,449 | 432,316 | 438,923 | 464,865 | 410,542 | ||||||||||||||
| Parent- Work out Sub |
18,004 | 20,195 | 24,668 | 29,682 | 34,190 | |||||||||||||||
| Consolidated nonperforming assets |
$ | 408,453 | 452,511 | 463,591 | 494,547 | 444,732 | ||||||||||||||
| Consolidated Credit Quality Statistics |
||||||||||||||||||||
| Allowance for loan losses to total loans |
% | 4.90 | 5.21 | 5.10 | 5.43 | 5.25 | ||||||||||||||
| Allowance to nonaccrual loans |
% | 42.29 | 41.46 | 42.06 | 43.86 | 48.61 | ||||||||||||||
| Provision to average loans |
% | 1.45 | 3.56 | 4.84 | 2.78 | 5.35 | ||||||||||||||
| Nonaccrual loans, gross to total assets |
% | 8.44 | 8.36 | 8.55 | 9.36 | 8.30 | ||||||||||||||
| Nonperforming assets, gross to total assets |
% | 10.57 | 10.12 | 10.28 | 10.92 | 9.55 | ||||||||||||||
6
BankAtlantic Bancorp, Inc. and Subsidiaries
Reconciliation of GAAP Financial Measures to Non-GAAP Measures
Management uses non-GAAP financial measures to supplement its GAAP financial information and to provide additional useful measures in the evaluation of the Company’s operating results and any related trends that may be affecting the Company’s business. Management uses pre-tax core operating earnings to measure the Company’s ongoing financial performance excluding items that are not currently controllable by management. Management uses book value per share and tangible book value per share to enable investors to compare these measures to the quoted market price of the Company’s Class A common stock and to other companies in the industry. The return on average tangible equity and average tangible assets is used by management to measure the Company’s effectiveness in its use of capital and assets, respectively, and to allow for comparison to other companies in the industry. These disclosures should not be viewed as a substitute for operating results determined in accordance with GAAP, nor are they necessarily comparable to non-GAAP performance measures that may be presented by other companies.
| Reconciliation of loss from continuing operations before income taxes to pre-tax core operating earnings |
||||||||||||||||||||||||||||
| For the Three Months Ended | For the Six Months Ended |
|||||||||||||||||||||||||||
| (in thousands) | 6/30/2011 | 3/31/2011 | 12/31/2010 | 9/30/2010 | 6/30/2010 | 6/30/2011 | 6/30/2010 | |||||||||||||||||||||
| Income (loss) from continuing operations before income taxes |
$ | 23,401 | (22,886 | ) | (48,056 | ) | (25,147 | ) | (51,250 | ) | 515 | (71,681 | ) | |||||||||||||||
| Gain on sale of Tampa branches |
$ | (38,656 | ) | — | — | — | — | (38,656 | ) | — | ||||||||||||||||||
| Costs associated with debt redemption |
1,115 | 10 | — | — | 53 | 1,125 | 60 | |||||||||||||||||||||
| Provision for tax certificates |
1,021 | 779 | 800 | 885 | 2,134 | 1,800 | 2,867 | |||||||||||||||||||||
| Loss (gain) on sale of real estate |
(378 | ) | (453 | ) | 663 | (442 | ) | 1,490 | (831 | ) | 1,386 | |||||||||||||||||
| Impairment, restructuring and exit activities |
8,083 | 1,948 | 10,219 | 8,165 | 2,947 | 10,031 | 3,090 | |||||||||||||||||||||
| Provision for loan losses |
10,709 | 27,812 | 40,643 | 24,410 | 48,553 | 38,521 | 79,308 | |||||||||||||||||||||
| Non-GAAP pre-tax core operating earnings |
$ | 5,295 | 7,210 | 4,269 | 7,871 | 3,927 | 12,505 | 15,030 | ||||||||||||||||||||
| Reconciliation of equity to tangible book value per share |
||||||||||||||||||||
| As of | ||||||||||||||||||||
| (in thousands) | 6/30/2011 | 3/31/2011 | 12/31/2010 | 9/30/2010 | 6/30/2010 | |||||||||||||||
| Equity |
$ | 26,235 | (8,729 | ) | 14,744 | 64,082 | 77,466 | |||||||||||||
| Goodwill and core deposit intangibles |
(13,965 | ) | (14,260 | ) | (14,569 | ) | (14,877 | ) | (15,186 | ) | ||||||||||
| Other comprehensive loss |
6,346 | 6,807 | 6,088 | 3,207 | 2,320 | |||||||||||||||
| Tangible book value |
$ | 18,616 | (16,182 | ) | 6,263 | 52,412 | 64,600 | |||||||||||||
| Common shares outstanding, period end |
78,133,720 | 62,954,296 | 62,570,546 | 62,570,546 | 53,921,351 | |||||||||||||||
| Book value per share |
$ | 0.34 | (0.14 | ) | 0.24 | 1.02 | 1.44 | |||||||||||||
| Tangible book value per share — Non-GAAP |
$ | 0.24 | (0.26 | ) | 0.10 | 0.84 | 1.20 | |||||||||||||
| Reconciliation of return on average assets and average equity to return on average tangible assets and average tangible equity | ||||||||||||||||||||||||||||
| For the Three Months Ended | For the Six Months Ended |
|||||||||||||||||||||||||||
| (in thousands) | 6/30/2011 | 3/31/2011 | 12/31/2010 | 9/30/2010 | 6/30/2010 | 6/30/2011 | 6/30/2010 | |||||||||||||||||||||
| Net income (loss) from continuing operations |
$ | 23,401 | (22,887 | ) | (45,795 | ) | (25,184 | ) | (51,250 | ) | 514 | (71,771 | ) | |||||||||||||||
| Average total assets |
4,317,299 | 4,550,088 | 4,530,195 | 4,548,342 | 4,615,740 | 4,433,050 | 4,679,522 | |||||||||||||||||||||
| Average goodwill and core deposit intangibles |
(14,125 | ) | (14,411 | ) | (14,718 | ) | (15,028 | ) | (15,353 | ) | (14,267 | ) | (15,501 | ) | ||||||||||||||
| Average tangible assets |
4,303,174 | 4,535,677 | 4,515,477 | 4,533,314 | 4,600,387 | 4,418,783 | 4,664,021 | |||||||||||||||||||||
| Average equity |
5,805 | 16,113 | 63,402 | 85,130 | 117,629 | 10,931 | 129,859 | |||||||||||||||||||||
| Average goodwill and core deposit intangibles |
(14,125 | ) | (14,411 | ) | (14,718 | ) | (15,028 | ) | (15,353 | ) | (14,267 | ) | (15,501 | ) | ||||||||||||||
| Other comprehensive loss |
6,266 | 6,240 | 2,743 | 2,499 | 3,454 | 6,253 | 2,157 | |||||||||||||||||||||
| Average tangible equity |
$ | (2,054 | ) | 7,942 | 51,427 | 72,601 | 105,730 | 2,917 | 116,515 | |||||||||||||||||||
| Return on average assets from continuing operations |
2.17 | % | -2.01 | % | -4.04 | % | -2.21 | % | -4.44 | % | 0.02 | % | -3.07 | % | ||||||||||||||
| Return on average tangible assets from continuing operations — Non-GAAP |
2.18 | % | -2.02 | % | -4.06 | % | -2.22 | % | -4.46 | % | 0.02 | % | -3.08 | % | ||||||||||||||
| Return on average equity from continuing operations |
1612.47 | % | -568.16 | % | -288.92 | % | -118.33 | % | -174.28 | % | 9.40 | % | -110.54 | % | ||||||||||||||
| Return on average tangible equity from continuing operations — Non-GAAP |
-4557.16 | % | -1152.71 | % | -356.19 | % | -138.75 | % | -193.89 | % | 35.24 | % | -123.20 | % | ||||||||||||||
7
BankAtlantic (Bank Operations Business Segment)
Summary of Selected Financial Data (unaudited)
| (in thousands except percentages) | For the Three Months Ended | For the Six Months Ended |
||||||||||||||||||||||||||
| 6/30/2011 | 3/31/2011 | 12/31/2010 | 9/30/2010 | 6/30/2010 | 6/30/2011 | 6/30/2010 | ||||||||||||||||||||||
| Statistics: |
||||||||||||||||||||||||||||
| Average interest earning assets |
$ | 3,988,628 | 4,224,423 | 4,220,720 | 4,234,115 | 4,240,545 | 4,105,875 | 4,297,659 | ||||||||||||||||||||
| Average interest bearing liabilities |
$ | 2,986,328 | 3,221,899 | 3,177,611 | 3,189,179 | 3,220,458 | 3,103,464 | 3,301,666 | ||||||||||||||||||||
| Period end borrowings to deposits and borrowings |
% | 0.67 | 2.15 | 5.50 | 5.76 | 4.13 | 0.67 | 4.13 | ||||||||||||||||||||
| Efficiency ratio |
% | 55.76 | 80.10 | 105.60 | 91.87 | 94.05 | 65.07 | 85.68 | ||||||||||||||||||||
| Yield on interest earning assets |
% | 3.73 | 3.73 | 3.86 | 4.19 | 4.08 | 3.73 | 4.23 | ||||||||||||||||||||
| Cost of interest-bearing liabilities |
% | 0.57 | 0.59 | 0.62 | 0.65 | 0.78 | 0.58 | 0.89 | ||||||||||||||||||||
| Interest spread |
% | 3.16 | 3.14 | 3.24 | 3.54 | 3.30 | 3.15 | 3.35 | ||||||||||||||||||||
| Net interest margin |
% | 3.30 | 3.28 | 3.40 | 3.70 | 3.49 | 3.29 | 3.55 | ||||||||||||||||||||
| Net income (loss) |
$ | 30,677 | (16,665 | ) | (41,502 | ) | (17,894 | ) | (40,109 | ) | 14,012 | (57,446 | ) | |||||||||||||||
| Non-GAAP Measures (Note 1) |
||||||||||||||||||||||||||||
| Average tangible assets |
$ | 4,258,843 | 4,495,637 | 4,473,959 | 4,489,189 | 4,544,611 | 4,376,587 | 4,606,253 | ||||||||||||||||||||
| Average tangible equity |
$ | 277,639 | 282,135 | 319,982 | 338,712 | 356,572 | 279,875 | 361,726 | ||||||||||||||||||||
| Pre-tax core operating earnings |
$ | 11,657 | 11,575 | 8,323 | 13,922 | 9,078 | 23,232 | 24,852 | ||||||||||||||||||||
| Core operating efficiency ratio |
% | 78.57 | 79.91 | 86.12 | 78.95 | 85.65 | 79.26 | 81.03 | ||||||||||||||||||||
| Return on average tangible assets |
% | 2.91 | (1.46 | ) | (3.69 | ) | (1.57 | ) | (3.51 | ) | 0.67 | (2.47 | ) | |||||||||||||||
| Return on average tangible equity |
% | 44.61 | (23.21 | ) | (51.56 | ) | (20.87 | ) | (44.73 | ) | 10.43 | (31.52 | ) | |||||||||||||||
| Tangible capital to tangible assets |
% | 8.06 | 5.80 | 6.12 | 7.08 | 7.29 | ||||||||||||||||||||||
| Earning assets repricing at period end: |
||||||||||||||||||||||||||||
| Percent of earning assets that have fixed rates |
% | 45 | 46 | 45 | 45 | 47 | ||||||||||||||||||||||
| Percent of earning assets that have variable rates |
% | 55 | 54 | 55 | 55 | 53 | ||||||||||||||||||||||
| Regulatory capital ratios and statistics at period end |
||||||||||||||||||||||||||||
| Total risk-based capital |
% | 14.52 | 11.76 | 11.72 | 12.59 | 12.86 | ||||||||||||||||||||||
| Tier I risk-based capital |
% | 12.38 | 9.68 | 9.68 | 10.59 | 10.87 | ||||||||||||||||||||||
| Core capital |
% | 8.24 | 5.97 | 6.22 | 7.17 | 7.36 | ||||||||||||||||||||||
| Risk-weighted assets |
$ | 2,535,552 | 2,713,638 | 2,855,415 | 3,021,862 | 3,104,341 | ||||||||||||||||||||||
| Adjusted total assets |
$ | 3,807,960 | 4,401,218 | 4,444,797 | 4,459,875 | 4,584,519 | ||||||||||||||||||||||
Note 1
See page 15 for a reconciliation of non-GAAP measures to GAAP financial measures.
8
BankAtlantic (Bank Operations Business Segment)
Condensed Statements of Operations (unaudited)
| For the Three Months Ended | For the Six Months Ended |
|||||||||||||||||||||||||||
| (in thousands) | 6/30/2011 | 3/31/2011 | 12/31/2010 | 9/30/2010 | 6/30/2010 | 6/30/2011 | 6/30/2010 | |||||||||||||||||||||
| Net interest income |
$ | 32,977 | 34,704 | 35,766 | 39,101 | 37,008 | 67,681 | 76,467 | ||||||||||||||||||||
| Provision for loan losses |
10,195 | 27,832 | 40,145 | 23,012 | 43,634 | 38,027 | 75,668 | |||||||||||||||||||||
| Net interest income after provision for loan losses |
22,782 | 6,872 | (4,379 | ) | 16,089 | (6,626 | ) | 29,654 | 799 | |||||||||||||||||||
| Non-interest income |
||||||||||||||||||||||||||||
| Service charges on deposits |
11,226 | 12,032 | 14,080 | 15,214 | 15,502 | 23,258 | 30,550 | |||||||||||||||||||||
| Other service charges and fees |
6,886 | 7,191 | 7,528 | 7,495 | 7,739 | 14,077 | 15,117 | |||||||||||||||||||||
| Securities activities, net |
— | (24 | ) | (34 | ) | (543 | ) | 309 | (24 | ) | 3,441 | |||||||||||||||||
| Gain on sale of Tampa branches |
38,656 | — | — | — | — | 38,656 | — | |||||||||||||||||||||
| Other non-interest income |
3,306 | 3,714 | 2,625 | 4,869 | 2,721 | 7,020 | 5,420 | |||||||||||||||||||||
| Total non-interest income |
60,074 | 22,913 | 24,199 | 27,035 | 26,271 | 82,987 | 54,528 | |||||||||||||||||||||
| Non-interest expense |
||||||||||||||||||||||||||||
| Employee compensation and benefits |
19,218 | 18,763 | 20,028 | 22,475 | 24,254 | 37,981 | 48,628 | |||||||||||||||||||||
| Occupancy and equipment |
11,488 | 12,585 | 12,996 | 13,263 | 13,745 | 24,073 | 27,326 | |||||||||||||||||||||
| Advertising and business promotion |
1,435 | 1,669 | 2,333 | 1,917 | 2,121 | 3,104 | 4,055 | |||||||||||||||||||||
| Professional fees |
530 | 2,981 | 5,638 | 4,942 | 4,220 | 3,511 | 6,785 | |||||||||||||||||||||
| Check losses |
663 | 299 | 705 | 763 | 521 | 962 | 953 | |||||||||||||||||||||
| Supplies and postage |
879 | 870 | 1,024 | 929 | 895 | 1,749 | 1,860 | |||||||||||||||||||||
| Telecommunication |
444 | 572 | 632 | 697 | 655 | 1,016 | 1,184 | |||||||||||||||||||||
| Cost associated with debt redemption |
1,115 | 10 | — | — | 53 | 1,125 | 60 | |||||||||||||||||||||
| Provision for tax certificates |
1,021 | 779 | 800 | 885 | 2,134 | 1,800 | 2,867 | |||||||||||||||||||||
| (Gain) loss on sale of real estate |
(362 | ) | (278 | ) | 663 | (442 | ) | 880 | (640 | ) | 776 | |||||||||||||||||
| Impairment, restructuring and exit activities |
7,377 | (399 | ) | 10,219 | 8,099 | 2,247 | 6,978 | 2,390 | ||||||||||||||||||||
| Other |
8,081 | 8,303 | 8,286 | 7,228 | 7,790 | 16,384 | 15,352 | |||||||||||||||||||||
| Total non-interest expense |
51,889 | 46,154 | 63,324 | 60,756 | 59,515 | 98,043 | 112,236 | |||||||||||||||||||||
| Income (loss) from bank operations business segment before income taxes |
30,967 | (16,369 | ) | (43,504 | ) | (17,632 | ) | (39,870 | ) | 14,598 | (56,909 | ) | ||||||||||||||||
| Provision (benefit) for income taxes |
— | 1 | (2,261 | ) | 37 | — | 1 | 90 | ||||||||||||||||||||
| Net income (loss) from bank operations business segment |
30,967 | (16,370 | ) | (41,243 | ) | (17,669 | ) | (39,870 | ) | 14,597 | (56,999 | ) | ||||||||||||||||
| Less: net income attributable to noncontrolling interest |
(290 | ) | (295 | ) | (259 | ) | (225 | ) | (239 | ) | (585 | ) | (447 | ) | ||||||||||||||
| Net income (loss) attributable to BankAtlantic |
$ | 30,677 | (16,665 | ) | (41,502 | ) | (17,894 | ) | (40,109 | ) | 14,012 | (57,446 | ) | |||||||||||||||
9
BankAtlantic (Bank Operations Business Segment)
Condensed Statements of Financial Condition (unaudited)
| As of | ||||||||||||||||||||
| (in thousands) | 6/30/2011 | 3/31/2011 | 12/31/2010 | 9/30/2010 | 6/30/2010 | |||||||||||||||
| ASSETS |
||||||||||||||||||||
| Cash and interest bearing deposits in other banks |
$ | 430,544 | 749,355 | 552,913 | 337,105 | 454,245 | ||||||||||||||
| Loans receivable, net |
2,665,731 | 2,813,097 | 3,009,771 | 3,218,097 | 3,361,772 | |||||||||||||||
| Loans held for sale (lower of cost or fair value) |
38,567 | 44,542 | 21,704 | 2,839 | 5,861 | |||||||||||||||
| Investment securities |
66,211 | 77,837 | 89,814 | 104,776 | 140,369 | |||||||||||||||
| Available for sale securities |
316,508 | 376,034 | 424,360 | 446,591 | 275,065 | |||||||||||||||
| FHLB stock |
31,614 | 43,557 | 43,557 | 45,259 | 48,751 | |||||||||||||||
| Goodwill |
13,081 | 13,081 | 13,081 | 13,081 | 13,081 | |||||||||||||||
| Core deposit intangible asset |
884 | 1,179 | 1,488 | 1,796 | 2,105 | |||||||||||||||
| Assets held for sale |
1,768 | 36,909 | 37,333 | 37,209 | — | |||||||||||||||
| Other assets |
266,563 | 268,975 | 275,147 | 278,723 | 310,033 | |||||||||||||||
| Total assets |
$ | 3,831,471 | 4,424,566 | 4,469,168 | 4,485,476 | 4,611,282 | ||||||||||||||
| LIABILITIES AND EQUITY |
||||||||||||||||||||
| Deposits |
||||||||||||||||||||
| Demand |
$ | 887,856 | 879,820 | 792,260 | 809,830 | 902,486 | ||||||||||||||
| Savings |
447,706 | 452,533 | 418,304 | 411,612 | 442,142 | |||||||||||||||
| NOW |
1,239,130 | 1,307,041 | 1,370,568 | 1,288,792 | 1,496,369 | |||||||||||||||
| Money market |
399,195 | 366,968 | 354,282 | 386,091 | 397,313 | |||||||||||||||
| Certificates of deposit |
454,279 | 609,538 | 616,454 | 601,956 | 749,948 | |||||||||||||||
| Deposits held for sale |
— | 390,432 | 341,146 | 339,360 | — | |||||||||||||||
| Total deposits |
3,428,166 | 4,006,332 | 3,893,014 | 3,837,641 | 3,988,258 | |||||||||||||||
| Advances from Federal Home Loan Bank |
— | 45,000 | 170,000 | 180,000 | 115,000 | |||||||||||||||
| Short term borrowings |
1,020 | 20,909 | 34,435 | 32,666 | 34,685 | |||||||||||||||
| Subordinated debentures |
22,000 | 22,000 | 22,000 | 22,000 | 22,000 | |||||||||||||||
| Liabilities held for sale |
— | 79 | 87 | 100 | — | |||||||||||||||
| Other liabilities |
58,768 | 60,178 | 62,526 | 81,452 | 100,904 | |||||||||||||||
| Total liabilities |
3,509,954 | 4,154,498 | 4,182,062 | 4,153,859 | 4,260,847 | |||||||||||||||
| Equity |
321,517 | 270,068 | 287,106 | 331,617 | 350,435 | |||||||||||||||
| Total liabilities and equity |
$ | 3,831,471 | 4,424,566 | 4,469,168 | 4,485,476 | 4,611,282 | ||||||||||||||
10
BankAtlantic (Bank Operations Business Segment)
Average Balance Sheet — Yield / Rate Analysis
| For the Three Months Ended | ||||||||||||||||||||||||
| June 30, 2011 | June 30, 2010 | |||||||||||||||||||||||
| (in thousands) | Average Balance |
Revenue/ Expense |
Yield/ Rate |
Average Balance |
Revenue/ Expense |
Yield/ Rate |
||||||||||||||||||
| Loans: |
||||||||||||||||||||||||
| Residential real estate |
$ | 1,093,487 | 12,956 | 4.74 | % | $ | 1,433,322 | 17,807 | 4.97 | % | ||||||||||||||
| Commercial real estate |
821,710 | 8,613 | 4.19 | 1,045,831 | 10,275 | 3.93 | ||||||||||||||||||
| Consumer |
605,062 | 4,493 | 2.97 | 670,173 | 4,829 | 2.88 | ||||||||||||||||||
| Commercial business |
123,599 | 2,496 | 8.08 | 134,153 | 2,108 | 6.29 | ||||||||||||||||||
| Small business |
298,338 | 4,626 | 6.20 | 308,254 | 4,820 | 6.25 | ||||||||||||||||||
| Total loans |
2,942,196 | 33,184 | 4.51 | 3,591,733 | 39,839 | 4.44 | ||||||||||||||||||
| Investments |
1,046,432 | 4,037 | 1.54 | 648,812 | 3,432 | 2.12 | ||||||||||||||||||
| Total interest earning assets |
3,988,628 | 37,221 | 3.73 | % | 4,240,545 | 43,271 | 4.08 | % | ||||||||||||||||
| Goodwill and core deposit intangibles |
14,125 | 15,353 | ||||||||||||||||||||||
| Other non-interest earning assets |
270,215 | 304,066 | ||||||||||||||||||||||
| Total Assets |
$ | 4,272,968 | $ | 4,559,964 | ||||||||||||||||||||
| Deposits: |
||||||||||||||||||||||||
| Savings |
$ | 478,628 | 258 | 0.22 | % | $ | 445,686 | 271 | 0.24 | % | ||||||||||||||
| NOW |
1,412,720 | 1,295 | 0.37 | 1,525,475 | 1,786 | 0.47 | ||||||||||||||||||
| Money market |
408,653 | 526 | 0.52 | 386,712 | 630 | 0.65 | ||||||||||||||||||
| Certificates of deposit |
606,291 | 1,896 | 1.25 | 805,656 | 3,334 | 1.66 | ||||||||||||||||||
| Total interest bearing deposits |
2,906,292 | 3,975 | 0.55 | 3,163,529 | 6,021 | 0.76 | ||||||||||||||||||
| Short-term borrowed funds |
15,289 | 5 | 0.13 | 33,665 | 10 | 0.12 | ||||||||||||||||||
| Advances from FHLB |
42,747 | 38 | 0.36 | 1,264 | 1 | 0.32 | ||||||||||||||||||
| Subordinated debentures and bonds payable |
22,000 | 226 | 4.12 | 22,000 | 231 | 4.21 | ||||||||||||||||||
| Total interest bearing liabilities |
2,986,328 | 4,244 | 0.57 | 3,220,458 | 6,263 | 0.78 | ||||||||||||||||||
| Demand deposits |
952,444 | 916,105 | ||||||||||||||||||||||
| Non-interest bearing other liabilities |
48,698 | 54,929 | ||||||||||||||||||||||
| Total Liabilities |
3,987,470 | 4,191,492 | ||||||||||||||||||||||
| Equity |
285,498 | 368,472 | ||||||||||||||||||||||
| Total liabilities and equity |
$ | 4,272,968 | $ | 4,559,964 | ||||||||||||||||||||
| Net interest income/net interest spread |
32,977 | 3.16 | % | 37,008 | 3.30 | % | ||||||||||||||||||
| Margin |
||||||||||||||||||||||||
| Interest income/interest earning assets |
3.73 | % | 4.08 | % | ||||||||||||||||||||
| Interest expense/interest earning assets |
0.43 | 0.59 | ||||||||||||||||||||||
| Net interest margin |
3.30 | % | 3.49 | % | ||||||||||||||||||||
11
BankAtlantic (Bank Operations Business Segment)
Average Balance Sheet — Yield / Rate Analysis
| For the Six Months Ended | ||||||||||||||||||||||||
| June 30, 2011 | June 30, 2010 | |||||||||||||||||||||||
| (in thousands) | Average Balance |
Revenue/ Expense |
Yield/ Rate |
Average Balance |
Revenue/ Expense |
Yield/ Rate |
||||||||||||||||||
| Loans: |
||||||||||||||||||||||||
| Residential real estate |
$ | 1,134,454 | 26,850 | 4.73 | % | $ | 1,473,091 | 36,708 | 4.98 | % | ||||||||||||||
| Commercial real estate |
848,618 | 18,114 | 4.27 | 1,074,047 | 21,118 | 3.93 | ||||||||||||||||||
| Consumer |
612,980 | 9,020 | 2.94 | 679,123 | 9,729 | 2.87 | ||||||||||||||||||
| Commercial business |
128,232 | 4,747 | 7.40 | 136,219 | 4,199 | 6.17 | ||||||||||||||||||
| Small business |
299,627 | 9,313 | 6.22 | 308,898 | 9,663 | 6.26 | ||||||||||||||||||
| Total loans |
3,023,911 | 68,044 | 4.50 | 3,671,378 | 81,417 | 4.44 | ||||||||||||||||||
| Investments |
1,081,964 | 8,597 | 1.59 | 626,281 | 9,569 | 3.06 | ||||||||||||||||||
| Total interest earning assets |
4,105,875 | 76,641 | 3.73 | % | 4,297,659 | 90,986 | 4.23 | % | ||||||||||||||||
| Goodwill and core deposit intangibles |
14,267 | 15,501 | ||||||||||||||||||||||
| Other non-interest earning assets |
270,712 | 308,594 | ||||||||||||||||||||||
| Total Assets |
$ | 4,390,854 | $ | 4,621,754 | ||||||||||||||||||||
| Deposits: |
||||||||||||||||||||||||
| Savings |
$ | 473,678 | 530 | 0.23 | % | $ | 435,517 | 604 | 0.28 | % | ||||||||||||||
| NOW |
1,465,619 | 2,807 | 0.39 | 1,496,450 | 4,004 | 0.54 | ||||||||||||||||||
| Money market |
398,958 | 968 | 0.49 | 373,664 | 1,259 | 0.68 | ||||||||||||||||||
| Certificates of deposit |
632,028 | 4,036 | 1.29 | 850,615 | 7,211 | 1.71 | ||||||||||||||||||
| Total deposits |
2,970,283 | 8,341 | 0.57 | 3,156,246 | 13,078 | 0.84 | ||||||||||||||||||
| Short-term borrowed funds |
22,645 | 15 | 0.13 | 36,505 | 23 | 0.13 | ||||||||||||||||||
| Advances from FHLB |
88,536 | 153 | 0.35 | 86,663 | 959 | 2.23 | ||||||||||||||||||
| Long-term debt |
22,000 | 451 | 4.13 | 22,252 | 459 | 4.16 | ||||||||||||||||||
| Total interest bearing liabilities |
3,103,464 | 8,960 | 0.58 | 3,301,666 | 14,519 | 0.89 | ||||||||||||||||||
| Demand deposits |
948,717 | 890,391 | ||||||||||||||||||||||
| Non-interest bearing other liabilities |
50,784 | 54,626 | ||||||||||||||||||||||
| Total Liabilities |
4,102,965 | 4,246,683 | ||||||||||||||||||||||
| Stockholder’s equity |
287,889 | 375,071 | ||||||||||||||||||||||
| Total liabilities and stockholder’s equity |
$ | 4,390,854 | $ | 4,621,754 | ||||||||||||||||||||
| Net interest income/net interest spread |
67,681 | 3.15 | % | 76,467 | 3.35 | % | ||||||||||||||||||
| Margin |
||||||||||||||||||||||||
| Interest income/interest earning assets |
3.73 | % | 4.23 | % | ||||||||||||||||||||
| Interest expense/interest earning assets |
0.44 | 0.68 | ||||||||||||||||||||||
| Net interest margin |
3.29 | % | 3.55 | % | ||||||||||||||||||||
12
BankAtlantic (Bank Operations Business Segment)
Allowance for Loan Loss and Credit Quality
| (in thousands) | For the Three Months Ended | For the Six Months Ended |
||||||||||||||||||||||||||
| 6/30/2011 | 3/31/2011 | 12/31/2010 | 9/30/2010 | 6/30/2010 | 6/30/2011 | 6/30/2010 | ||||||||||||||||||||||
| Allowance for Loan Losses |
||||||||||||||||||||||||||||
| Beginning balance |
$ | 154,237 | 161,309 | 181,760 | 180,635 | 169,548 | 161,309 | 173,588 | ||||||||||||||||||||
| Charge-offs: |
||||||||||||||||||||||||||||
| Residential real estate |
(5,767 | ) | (8,011 | ) | (4,272 | ) | (4,619 | ) | (5,233 | ) | (13,778 | ) | (9,414 | ) | ||||||||||||||
| Commercial real estate |
(13,546 | ) | (11,277 | ) | (44,979 | ) | (5,969 | ) | (14,146 | ) | (24,823 | ) | (35,478 | ) | ||||||||||||||
| Commercial business |
(124 | ) | (464 | ) | (996 | ) | — | — | (588 | ) | — | |||||||||||||||||
| Consumer |
(6,379 | ) | (7,814 | ) | (7,009 | ) | (9,881 | ) | (11,822 | ) | (14,193 | ) | (22,593 | ) | ||||||||||||||
| Small business |
(2,010 | ) | (2,611 | ) | (2,409 | ) | (2,402 | ) | (2,225 | ) | (4,621 | ) | (3,062 | ) | ||||||||||||||
| Total charge-offs |
(27,826 | ) | (30,177 | ) | (59,665 | ) | (22,871 | ) | (33,426 | ) | (58,003 | ) | (70,547 | ) | ||||||||||||||
| Recoveries: |
||||||||||||||||||||||||||||
| Residential real estate |
435 | 131 | 284 | 383 | 435 | 566 | 499 | |||||||||||||||||||||
| Commercial real estate |
75 | 714 | 1,210 | — | 65 | 789 | 127 | |||||||||||||||||||||
| Commercial business |
57 | 791 | 57 | — | 1 | 848 | 659 | |||||||||||||||||||||
| Consumer |
492 | 408 | 300 | 294 | 254 | 900 | 448 | |||||||||||||||||||||
| Small business |
203 | 310 | 126 | 307 | 124 | 513 | 193 | |||||||||||||||||||||
| Total recoveries |
1,262 | 2,354 | 1,977 | 984 | 879 | 3,616 | 1,926 | |||||||||||||||||||||
| Net charge-offs |
(26,564 | ) | (27,823 | ) | (57,688 | ) | (21,887 | ) | (32,547 | ) | (54,387 | ) | (68,621 | ) | ||||||||||||||
| Transfer to held for sale |
— | (7,081 | ) | (2,907 | ) | — | — | (7,081 | ) | — | ||||||||||||||||||
| Provision for loan losses |
10,195 | 27,832 | 40,144 | 23,012 | 43,634 | 38,027 | 75,668 | |||||||||||||||||||||
| Ending balance |
$ | 137,868 | 154,237 | 161,309 | 181,760 | 180,635 | 137,868 | 180,635 | ||||||||||||||||||||
| As of | ||||||||||||||||||||
| 6/30/2011 | 3/31/2011 | 12/31/2010 | 9/30/2010 | 6/30/2010 | ||||||||||||||||
| Credit Quality |
||||||||||||||||||||
| Nonaccrual loans |
||||||||||||||||||||
| Commercial real estate |
$ | 190,909 | 239,798 | 243,299 | 275,057 | 230,007 | ||||||||||||||
| Consumer |
14,614 | 13,231 | 14,120 | 13,282 | 13,818 | |||||||||||||||
| Small business |
11,990 | 12,172 | 10,879 | 10,995 | 12,248 | |||||||||||||||
| Residential real estate |
82,022 | 81,555 | 86,538 | 87,563 | 83,894 | |||||||||||||||
| Commercial business |
17,098 | 15,848 | 16,123 | 17,190 | 22,159 | |||||||||||||||
| Total Nonaccrual loans |
316,633 | 362,604 | 370,959 | 404,087 | 362,126 | |||||||||||||||
| Nonaccrual tax certificates |
2,756 | 3,402 | 3,636 | 2,761 | 2,836 | |||||||||||||||
| Real estate owned |
71,060 | 66,310 | 64,328 | 58,017 | 45,492 | |||||||||||||||
| Other repossessed assets |
— | — | — | — | 88 | |||||||||||||||
| Total nonperforming assets |
$ | 390,449 | 432,316 | 438,923 | 464,865 | 410,542 | ||||||||||||||
| Allowance for loan losses to total loans |
% | 4.92 | 5.20 | 5.08 | 5.34 | 5.08 | ||||||||||||||
| Allowance to nonaccrual loans |
% | 43.54 | 42.54 | 43.48 | 44.98 | 49.88 | ||||||||||||||
| Provision to average loans |
% | 1.39 | 3.58 | 4.81 | 2.64 | 4.86 | ||||||||||||||
| Annualized net charge-offs to average loans |
% | 3.61 | 3.58 | 6.91 | 2.51 | 3.62 | ||||||||||||||
| Nonaccrual loans to total assets |
% | 8.26 | 8.20 | 8.30 | 9.01 | 7.85 | ||||||||||||||
| Nonperforming assets to total assets |
% | 10.19 | 9.77 | 9.82 | 10.36 | 8.90 | ||||||||||||||
13
BankAtlantic (Bank Operations Business Segment)
Delinquencies, Excluding Non-Accrual Loans, at Period-End
| ($ in thousands) | 6/30/2011 | 3/31/2011 | 12/31/2010 | 9/30/2010 | 6/30/2010 | |||||||||||||||
| Commercial real estate |
$ | — | 1,400 | 31 | 14,317 | 7,537 | ||||||||||||||
| Consumer |
9,230 | 12,025 | 12,405 | 12,004 | 13,181 | |||||||||||||||
| Small business |
2,210 | 2,200 | 2,712 | 2,927 | 4,182 | |||||||||||||||
| Residential real estate |
16,060 | 20,528 | 23,053 | 17,946 | 18,472 | |||||||||||||||
| Commercial business |
338 | 19,552 | *** | — | — | — | ||||||||||||||
| Total BankAtlantic |
$ | 27,838 | 55,705 | 38,201 | 47,194 | 43,372 | ||||||||||||||
| 6/30/2011 | 3/31/2011 | 12/31/2010 | 9/30/2010 | 6/30/2010 | ||||||||||||||||
| Commercial real estate |
% | — | * | 0.17 | * | 0.00 | * | 1.43 | * | 0.72 | * | |||||||||
| Consumer |
% | 1.57 | 2.00 | 2.01 | 1.90 | 2.04 | ||||||||||||||
| Small business |
% | 0.75 | 0.74 | 0.89 | 0.96 | 1.35 | ||||||||||||||
| Residential real estate |
% | 1.51 | ** | 1.83 | ** | 1.88 | ** | 1.37 | ** | 1.32 | ** | |||||||||
| Commercial business |
% | 0.28 | 15.36 | *** | — | — | — | |||||||||||||
| Total BankAtlantic |
% | 0.99 | 1.86 | 1.20 | 1.39 | 1.23 | ||||||||||||||
| * | Excludes $0, $0, $0, $12.0 million and $1.2 million of Commercial Real Estate loans at June 30, 2011, March 31, 2011, December 31, 2010, September 30, 2010 and June 30, 2010, respectively, which had matured and had been approved for renewal or forbearance but were not fully documented at period end. Including these loans, Commercial Real Estate delinquencies were 2.63% and .83% and total BankAtlantic delinquencies would have been 1.75% and 1.26% at September 30, 2010 and June 30, 2010, respectively. |
| ** | Includes $973.4 million, $1.0 billion, $1.1 billion, $1.2 billion and $1.3 billion of purchased residential loans with delinquencies excluding non-accrual loans of 1.41%. 1.58%, 1.77%, 1.19% and 1.09% as of June 30, 2011, March 31, 2011, December 31, 2010, September 30, 2010 and June 30, 2010, respectively. |
| *** | Amount represents a loan relationship that is 59 days past due as to maturity and is in the process of renewal. |
BankAtlantic (Bank Operations Business Segment)
Loan Provision & Allowance for Loan Losses
| ($ in thousands) | 2Q 2011 Loan Provision |
Allowance for Loan Losses |
% of Reserves to Total Loans |
|||||||||
| Commercial real estate |
$ | 3,422 | 68,279 | 8.98 | % | |||||||
| Consumer |
3,375 | 24,998 | 4.27 | |||||||||
| Small business |
1,535 | 9,853 | 3.34 | |||||||||
| Residential real estate |
1,487 | 23,721 | 2.23 | |||||||||
| Commercial business |
376 | 11,017 | 9.25 | |||||||||
| Total BankAtlantic |
$ | 10,195 | 137,868 | 4.92 | % | |||||||
14
BankAtlantic (Bank Operations Business Segment)
Reconciliation of GAAP Financial Measures to Non-GAAP Measures
Management uses non-GAAP financial measures to supplement its GAAP financial information and to provide additional useful measures in the evaluation of BankAtlantic’s operating results and any related trends that may be affecting BankAtlantic’s business. Management uses pre-tax core operating earnings to measure BankAtlantic’s ongoing financial performance excluding items that are not currently controllable by management. Management uses core expenses to measure expense reduction trends excluding items that are not currently controllable by management. The core operating efficiency ratio is used by management to measure the costs expended to generate a dollar of revenues excluding items that are not currently controllable by management. The return on average tangible equity and average tangible assets is used by management to measure BankAtlantic’s effectiveness in its use of capital and assets, respectively, and to allow for comparison to other companies in the industry. The tangible equity to tangible asset ratio is used by management to evaluate capital adequacy trends and to allow for comparison to other companies in the industry. Management uses the core deposit measure to assess trends relating to its lower cost deposit categories, which management believes may generally be more indicative of relationship deposits. These disclosures should not be viewed as a substitute for operating results determined in accordance with GAAP, nor are they necessarily comparable to non-GAAP performance measures that may be presented by other companies.
Reconciliation of income (loss) from bank operations business segment before income taxes to pre-tax core operating earnings
| For the Three Months Ended | For the Six Months Ended |
|||||||||||||||||||||||||||
| (in thousands) | 6/30/2011 | 3/31/2011 | 12/31/2010 | 9/30/2010 | 6/30/2010 | 6/30/2011 | 6/30/2010 | |||||||||||||||||||||
| Income (loss) from bank operations business segment before income taxes |
$ | 30,967 | (16,369 | ) | (43,504 | ) | (17,632 | ) | (39,870 | ) | 14,598 | (56,909 | ) | |||||||||||||||
| Gain on sale of Tampa branches |
(38,656 | ) | — | — | — | — | (38,656 | ) | — | |||||||||||||||||||
| Costs associated with debt redemption |
1,115 | 10 | — | — | 53 | 1,125 | 60 | |||||||||||||||||||||
| Provision for tax certificates |
1,021 | 779 | 800 | 885 | 2,134 | 1,800 | 2,867 | |||||||||||||||||||||
| Loss (gain) on sale of real estate |
(362 | ) | (278 | ) | 663 | (442 | ) | 880 | (640 | ) | 776 | |||||||||||||||||
| Impairment, restructuring and exit activities |
7,377 | (399 | ) | 10,219 | 8,099 | 2,247 | 6,978 | 2,390 | ||||||||||||||||||||
| Provision for loan losses |
10,195 | 27,832 | 40,145 | 23,012 | 43,634 | 38,027 | 75,668 | |||||||||||||||||||||
| Non-GAAP pre-tax core operating earnings |
$ | 11,657 | 11,575 | 8,323 | 13,922 | 9,078 | 23,232 | 24,852 | ||||||||||||||||||||
Reconciliation of non-interest expense to core expenses and calculation of core operating efficiency ratio
| For the Three Months Ended | For the Six Months Ended |
|||||||||||||||||||||||||||
| ($ in thousands) | 6/30/2011 | 3/31/2011 | 12/31/2010 | 9/30/2010 | 6/30/2010 | 6/30/2011 | 6/30/2010 | |||||||||||||||||||||
| Non-interest expense |
$ | 51,889 | 46,154 | 63,324 | 60,756 | 59,515 | 98,043 | 112,236 | ||||||||||||||||||||
| Costs associated with debt redemption |
(1,115 | ) | (10 | ) | — | — | (53 | ) | (1,125 | ) | (60 | ) | ||||||||||||||||
| Provision for tax certificates |
(1,021 | ) | (779 | ) | (800 | ) | (885 | ) | (2,134 | ) | (1,800 | ) | (2,867 | ) | ||||||||||||||
| Gain (loss) on sale of real estate |
362 | 278 | (663 | ) | 442 | (880 | ) | 640 | (776 | ) | ||||||||||||||||||
| Impairment, restructuring and exit activities |
(7,377 | ) | 399 | (10,219 | ) | (8,099 | ) | (2,247 | ) | (6,978 | ) | (2,390 | ) | |||||||||||||||
| FDIC special assessment |
— | — | — | — | — | — | — | |||||||||||||||||||||
| Core expenses |
$ | 42,738 | 46,042 | 51,642 | 52,214 | 54,201 | 88,780 | 106,143 | ||||||||||||||||||||
| Net interest income |
32,977 | 34,704 | 35,766 | 39,101 | 37,008 | 67,681 | 76,467 | |||||||||||||||||||||
| Non-interest income |
60,074 | 22,913 | 24,199 | 27,035 | 26,271 | 82,987 | 54,528 | |||||||||||||||||||||
| Gain on sale of Tampa branches |
(38,656 | ) | — | — | — | — | (38,656 | ) | — | |||||||||||||||||||
| Core non-interest income |
21,418 | 22,913 | 24,199 | 27,035 | 26,271 | 44,331 | 54,528 | |||||||||||||||||||||
| Total revenues |
$ | 54,395 | $ | 57,617 | $ | 59,965 | $ | 66,136 | $ | 63,279 | $ | 112,012 | $ | 130,995 | ||||||||||||||
| Non-GAAP core operating efficiency ratio |
78.57 | % | 79.91 | % | 86.12 | % | 78.95 | % | 85.65 | % | 79.26 | % | 81.03 | % | ||||||||||||||
Reconciliation of return on average assets and average equity to return on average tangible assets and average tangible equity
| For the Three Months Ended | For the Six Months Ended |
|||||||||||||||||||||||||||
| ($ in thousands) | 6/30/2011 | 3/31/2011 | 12/31/2010 | 9/30/2010 | 6/30/2010 | 6/30/2011 | 6/30/2010 | |||||||||||||||||||||
| Net income (loss) from bank operations business segment |
$ | 30,967 | (16,370 | ) | (41,243 | ) | (17,669 | ) | (39,870 | ) | 14,597 | (56,999 | ) | |||||||||||||||
| Average total assets |
4,272,968 | 4,510,048 | 4,488,677 | 4,504,217 | 4,559,964 | 4,390,854 | 4,621,754 | |||||||||||||||||||||
| Average goodwill and core deposit intangibles |
(14,125 | ) | (14,411 | ) | (14,718 | ) | (15,028 | ) | (15,353 | ) | (14,267 | ) | (15,501 | ) | ||||||||||||||
| Average tangible assets |
4,258,843 | 4,495,637 | 4,473,959 | 4,489,189 | 4,544,611 | 4,376,587 | 4,606,253 | |||||||||||||||||||||
| Average equity |
285,498 | 290,307 | 331,957 | 351,241 | 368,472 | 287,889 | 375,071 | |||||||||||||||||||||
| Average goodwill and core deposit intangibles |
(14,125 | ) | (14,411 | ) | (14,718 | ) | (15,028 | ) | (15,353 | ) | (14,267 | ) | (15,501 | ) | ||||||||||||||
| Other comprehensive loss |
6,266 | 6,239 | 2,743 | 2,499 | 3,453 | 6,253 | 2,156 | |||||||||||||||||||||
| Average tangible equity |
$ | 277,639 | 282,135 | 319,982 | 338,712 | 356,572 | 279,875 | 361,726 | ||||||||||||||||||||
| Return on average assets from continuing operations |
2.90 | % | -1.45 | % | -3.68 | % | -1.57 | % | -3.50 | % | 0.66 | % | -2.47 | % | ||||||||||||||
| Return on average tangible assets from continuing operations—Non-GAAP |
2.91 | % | -1.46 | % | -3.69 | % | -1.57 | % | -3.51 | % | 0.67 | % | -2.47 | % | ||||||||||||||
| Return on average equity from continuing operations |
43.39 | % | -22.56 | % | -49.70 | % | -20.12 | % | -43.28 | % | 10.14 | % | -30.39 | % | ||||||||||||||
| Return on average tangible equity from continuing operations—Non-GAAP |
44.61 | % | -23.21 | % | -51.56 | % | -20.87 | % | -44.73 | % | 10.43 | % | -31.52 | % | ||||||||||||||
Reconciliation of equity to total tangible capital; Total assets to total tangible assets; The calculation of tangible capital to tangible assets
| As of | ||||||||||||||||||||
| ($ in thousands) | 6/30/2011 | 3/31/2011 | 12/31/2010 | 9/30/2010 | 6/30/2010 | |||||||||||||||
| Equity |
$ | 321,517 | 270,068 | 287,106 | 331,617 | 350,435 | ||||||||||||||
| Goodwill and core deposit intangibles |
(13,965 | ) | (14,260 | ) | (14,569 | ) | (14,877 | ) | (15,186 | ) | ||||||||||
| Total tangible capital |
307,552 | 255,808 | 272,537 | 316,740 | 335,249 | |||||||||||||||
| Total assets |
3,831,471 | 4,424,566 | 4,469,168 | 4,485,476 | 4,611,282 | |||||||||||||||
| Goodwill and core deposit intangibles |
(13,965 | ) | (14,260 | ) | (14,569 | ) | (14,877 | ) | (15,186 | ) | ||||||||||
| Total tangible assets |
$ | 3,817,506 | $ | 4,410,306 | $ | 4,454,599 | $ | 4,470,599 | $ | 4,596,096 | ||||||||||
| Non-GAAP tangible capital to tangible assets |
8.06 | % | 5.80 | % | 6.12 | % | 7.08 | % | 7.29 | % | ||||||||||
Reconciliation of total deposits to core deposits
| As of | ||||||||||||||||||||
| (in thousands) | 6/30/2011 | 3/31/2011 | 12/31/2010 | 9/30/2010 | 6/30/2010 | |||||||||||||||
| Total deposits |
$ | 3,428,166 | 4,006,332 | 3,893,014 | 3,837,641 | 3,988,258 | ||||||||||||||
| Non-core deposits held for sale |
— | (75,813 | ) | (75,010 | ) | (78,088 | ) | — | ||||||||||||
| Money market |
(399,195 | ) | (366,968 | ) | (354,282 | ) | (386,091 | ) | (397,313 | ) | ||||||||||
| Certificates of deposit |
(454,279 | ) | (609,538 | ) | (616,454 | ) | (601,956 | ) | (749,948 | ) | ||||||||||
| Core deposits |
2,574,692 | 2,954,013 | 2,847,268 | 2,771,506 | 2,840,997 | |||||||||||||||
15
Parent Company Business Segment
Condensed Statements of Operations (unaudited)
| For the Three Months Ended | For the Six Months Ended |
|||||||||||||||||||||||||||
| (in thousands) | 6/30/2011 | 3/31/2011 | 12/31/2010 | 9/30/2010 | 6/30/2010 | 6/30/2011 | 6/30/2010 | |||||||||||||||||||||
| Net interest expense |
$ | (3,794 | ) | (3,695 | ) | (3,716 | ) | (3,792 | ) | (3,579 | ) | (7,489 | ) | (7,064 | ) | |||||||||||||
| Provision (recovery) for loan losses |
515 | (20 | ) | 498 | 1,398 | 4,919 | 495 | 3,640 | ||||||||||||||||||||
| Net interest expense after provision for loan losses |
(4,309 | ) | (3,675 | ) | (4,214 | ) | (5,190 | ) | (8,498 | ) | (7,984 | ) | (10,704 | ) | ||||||||||||||
| Non-interest income |
||||||||||||||||||||||||||||
| Income from unconsolidated subsidiaries |
432 | 381 | 335 | 293 | 237 | 813 | 426 | |||||||||||||||||||||
| Securities activities, net |
(1,500 | ) | — | — | (9 | ) | 3 | (1,500 | ) | 9 | ||||||||||||||||||
| Other |
317 | 209 | 431 | 292 | 271 | 526 | 534 | |||||||||||||||||||||
| Non-interest income |
(751 | ) | 590 | 766 | 576 | 511 | (161 | ) | 969 | |||||||||||||||||||
| Non-interest expense |
||||||||||||||||||||||||||||
| Employee compensation and benefits |
512 | 527 | (160 | ) | 1,074 | 901 | 1,039 | 1,905 | ||||||||||||||||||||
| Advertising and business promotion |
88 | 26 | 56 | 109 | 118 | 114 | 128 | |||||||||||||||||||||
| Professional fees |
765 | 378 | 881 | 1,267 | 604 | 1,143 | 926 | |||||||||||||||||||||
| (Gain)/loss on sale of real estate |
(16 | ) | (175 | ) | — | — | 610 | (191 | ) | 610 | ||||||||||||||||||
| Impairment of real estate owned |
706 | 2,347 | — | 66 | 700 | 3,053 | 700 | |||||||||||||||||||||
| Other |
451 | 329 | 328 | 385 | 460 | 780 | 768 | |||||||||||||||||||||
| Non-interest expense |
2,506 | 3,432 | 1,105 | 2,901 | 3,393 | 5,938 | 5,037 | |||||||||||||||||||||
| Loss from parent company activities before income taxes |
(7,566 | ) | (6,517 | ) | (4,553 | ) | (7,515 | ) | (11,380 | ) | (14,083 | ) | (14,772 | ) | ||||||||||||||
| Provision (benefit) for income taxes |
— | — | — | — | — | — | — | |||||||||||||||||||||
| Net loss from parent company business segment |
$ | (7,566 | ) | (6,517 | ) | (4,553 | ) | (7,515 | ) | (11,380 | ) | (14,083 | ) | (14,772 | ) | |||||||||||||
Parent Company Business Segment
Condensed Statements of Financial Condition — Unaudited
| As of | ||||||||||||||||||||
| (in thousands) | 6/30/2011 | 3/31/2011 | 12/31/2010 | 9/30/2010 | 6/30/2010 | |||||||||||||||
| ASSETS |
||||||||||||||||||||
| Cash |
$ | 3,839 | 13,112 | 12,226 | 12,240 | 8,395 | ||||||||||||||
| Securities |
9 | 1,508 | 1,507 | 1,508 | 1,508 | |||||||||||||||
| Investment in subsidiaries |
341,498 | 291,616 | 313,319 | 359,368 | 379,776 | |||||||||||||||
| Investment in unconsolidated subsidiaries |
11,174 | 10,742 | 10,361 | 10,027 | 9,733 | |||||||||||||||
| Other assets |
188 | 882 | 945 | 1,635 | 2,430 | |||||||||||||||
| Total assets |
$ | 356,708 | 317,860 | 338,358 | 384,778 | 401,842 | ||||||||||||||
| LIABILITIES AND STOCKHOLDERS’ EQUITY |
||||||||||||||||||||
| Subordinated debentures and notes payable |
$ | 329,643 | 325,974 | 322,385 | 318,802 | 315,160 | ||||||||||||||
| Other liabilities |
1,357 | 1,123 | 1,687 | 2,314 | 9,632 | |||||||||||||||
| Total liabilities |
331,000 | 327,097 | 324,072 | 321,116 | 324,792 | |||||||||||||||
| Stockholders’ equity |
25,708 | (9,237 | ) | 14,286 | 63,662 | 77,050 | ||||||||||||||
| Total liabilities and stockholders’ equity |
$ | 356,708 | 317,860 | 338,358 | 384,778 | 401,842 | ||||||||||||||
Parent Company Business Segment
Allowance for Loan Loss and Credit Quality
| Parent Company and Work-out Subsidiary (in thousands) |
For the Three Months Ended | For the Six Months Ended |
||||||||||||||||||||||||||
| 6/30/2011 | 3/31/2011 | 12/31/2010 | 9/30/2010 | 6/30/2010 | 6/30/2011 | 6/30/2010 | ||||||||||||||||||||||
| Allowance for Loan Losses |
||||||||||||||||||||||||||||
| Beginning balance |
$ | 814 | 830 | 4,187 | 7,227 | 8,049 | 830 | 13,630 | ||||||||||||||||||||
| Net charge-offs |
(1,329 | ) | 4 | (3,741 | ) | (4,438 | ) | (5,741 | ) | (1,325 | ) | (10,043 | ) | |||||||||||||||
| Transfer to held for sale |
— | — | (114 | ) | — | — | — | — | ||||||||||||||||||||
| Provision (recovery) for loan losses |
515 | (20 | ) | 498 | 1,398 | 4,919 | 495 | 3,640 | ||||||||||||||||||||
| Ending balance |
$ | — | 814 | 830 | 4,187 | 7,227 | — | 7,227 | ||||||||||||||||||||
| As of | ||||||||||||||||||||
| 6/30/2011 | 3/31/2011 | 12/31/2010 | 9/30/2010 | 6/30/2010 | ||||||||||||||||
| Credit Quality |
||||||||||||||||||||
| Total Loans — gross |
$ | 11,974 | 14,058 | 17,300 | 22,793 | 27,319 | ||||||||||||||
| Nonaccrual loans |
$ | 9,360 | 11,360 | 14,508 | 19,916 | 24,358 | ||||||||||||||
| Specific reserves |
— | (814 | ) | (830 | ) | (4,187 | ) | (7,227 | ) | |||||||||||
| Nonaccrual loans, net |
$ | 9,360 | 10,546 | 13,678 | 15,729 | 17,131 | ||||||||||||||
| Real estate owned |
8,644 | 8,835 | 10,160 | 9,766 | 9,832 | |||||||||||||||
| Total nonperforming assets |
$ | 18,004 | 19,381 | 23,838 | 25,495 | 26,963 | ||||||||||||||
16

BankAtlantic (Bank Operations Business Segment)
Supplemental Graphs
Second Quarter 2011
Release Date: July 27, 2011
This information is preliminary, unaudited and based on data available at the time of the release.
BANKATLANTIC (BANK ONLY)
SUPPLEMENTAL GRAPHS
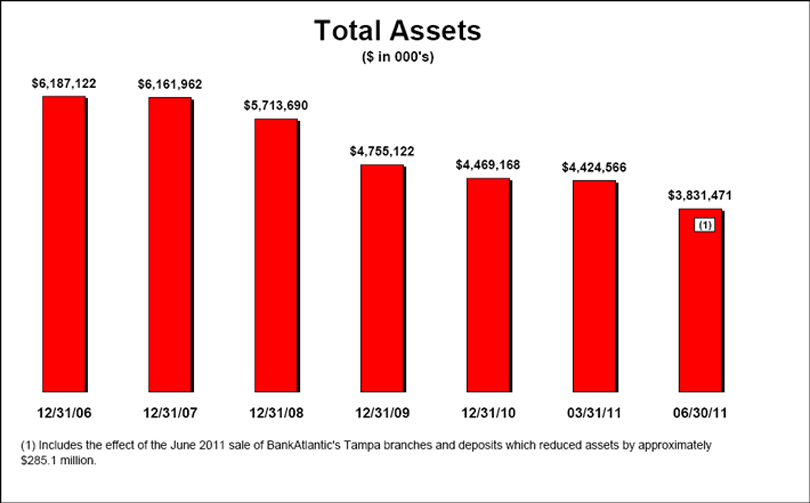
1
BANKATLANTIC (BANK ONLY)
SUPPLEMENTAL GRAPHS
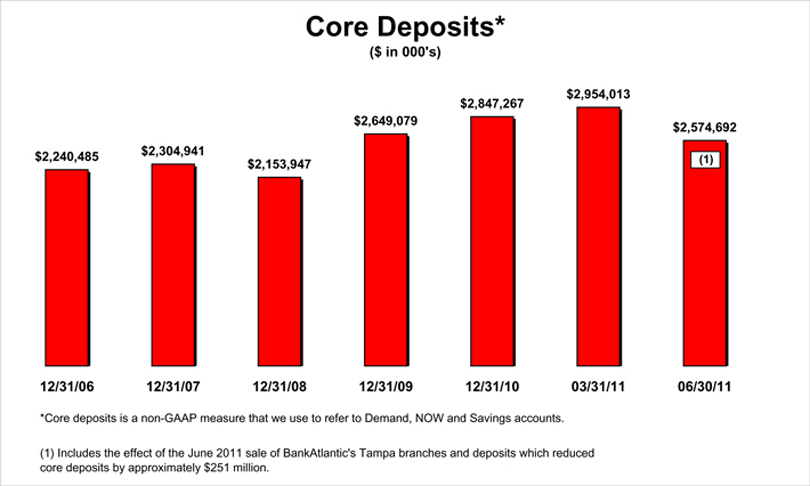
2
BANKATLANTIC (BANK ONLY)
SUPPLEMENTAL GRAPHS
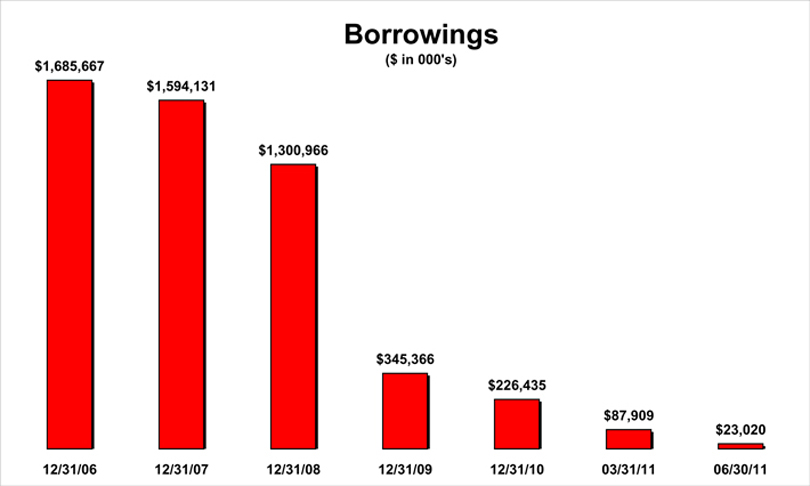
3
BANKATLANTIC (BANK ONLY)
SUPPLEMENTAL GRAPHS
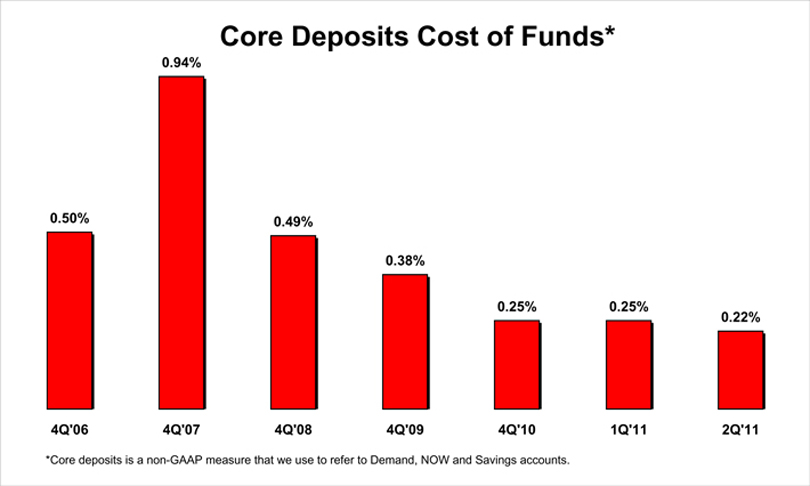
4
BANKATLANTIC (BANK ONLY)
SUPPLEMENTAL GRAPHS
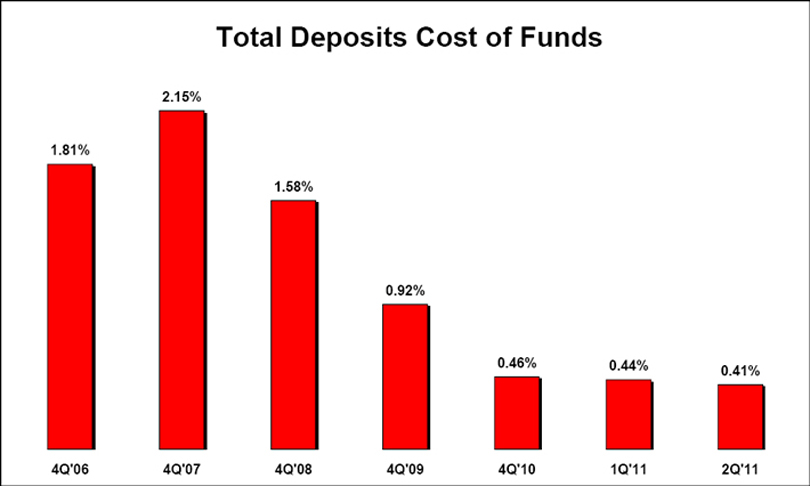
5
BANKATLANTIC (BANK ONLY)
SUPPLEMENTAL GRAPHS
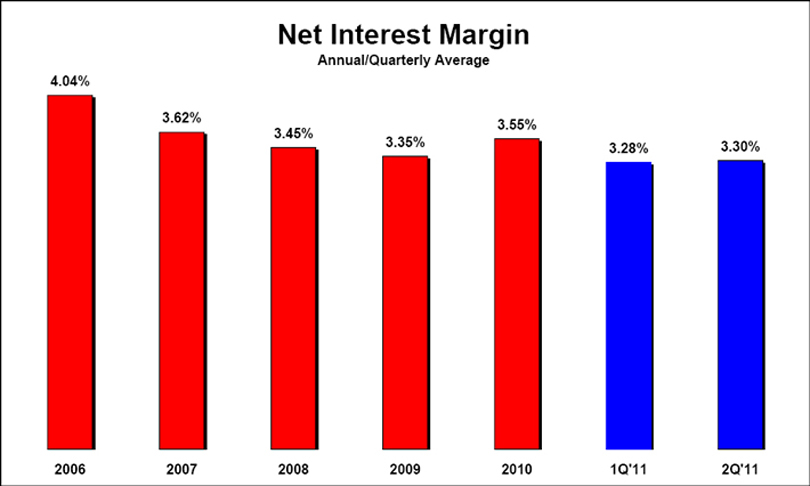
6
BANKATLANTIC (BANK ONLY)
SUPPLEMENTAL GRAPHS
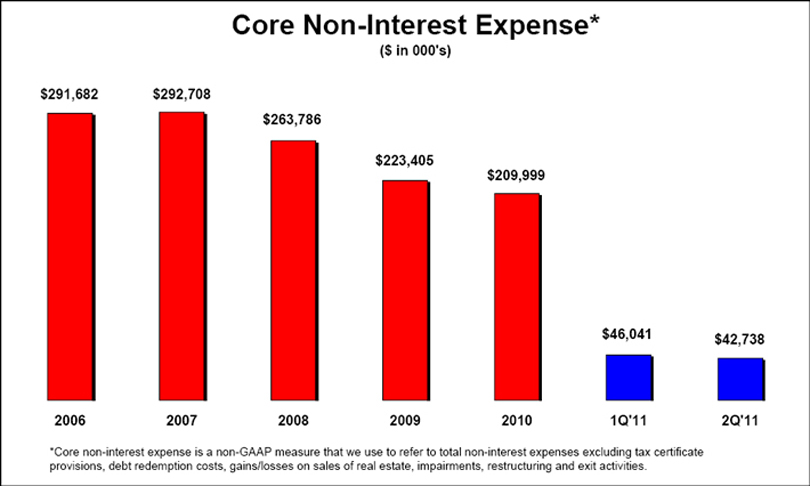
7
BANKATLANTIC (BANK ONLY)
SUPPLEMENTAL GRAPHS
\
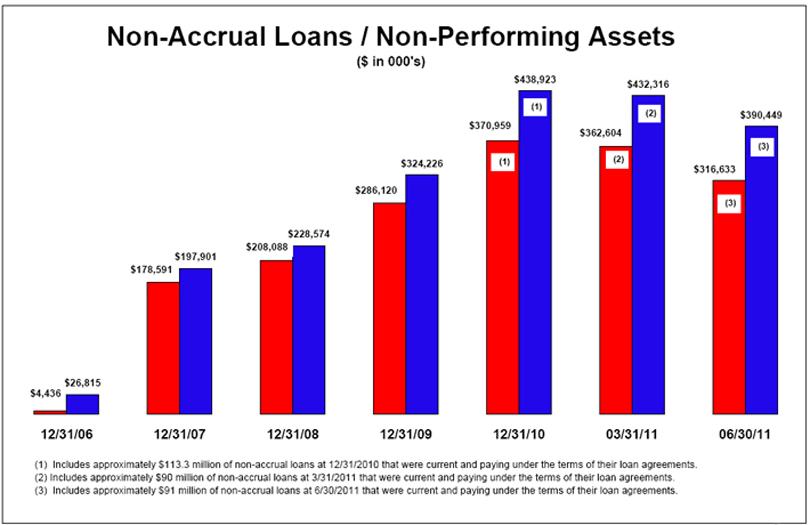
8
BANKATLANTIC (BANK ONLY)
SUPPLEMENTAL GRAPHS
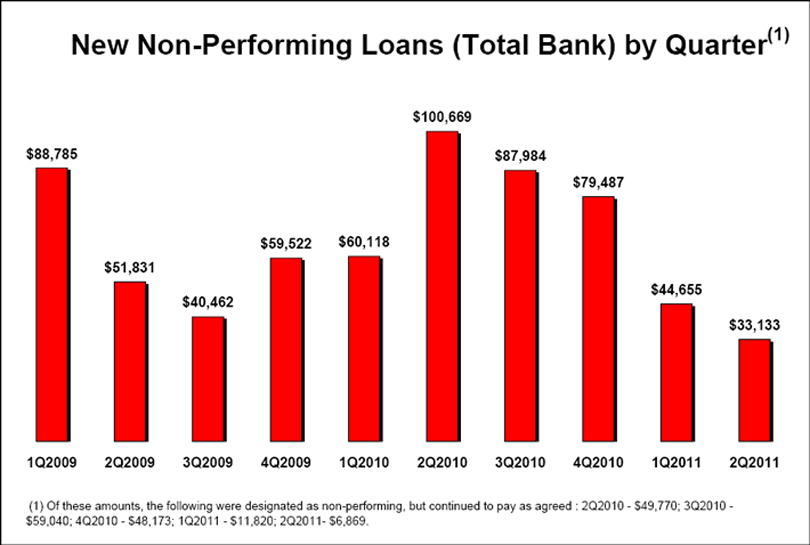
9
BANKATLANTIC (BANK ONLY)
SUPPLEMENTAL GRAPHS
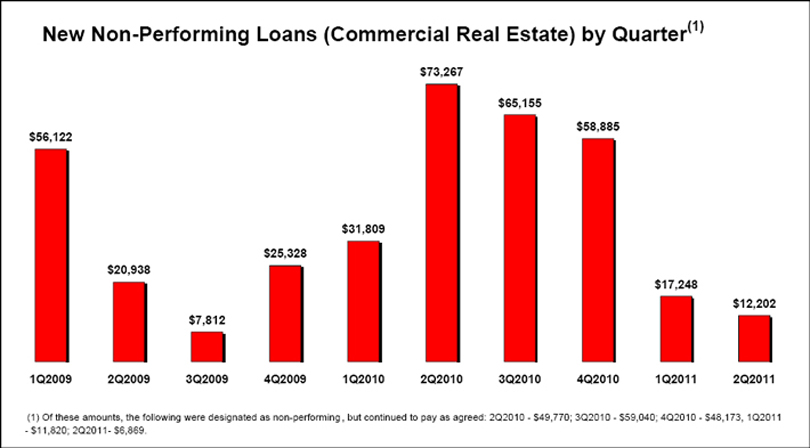
|
10
BANKATLANTIC (BANK ONLY)
SUPPLEMENTAL GRAPHS
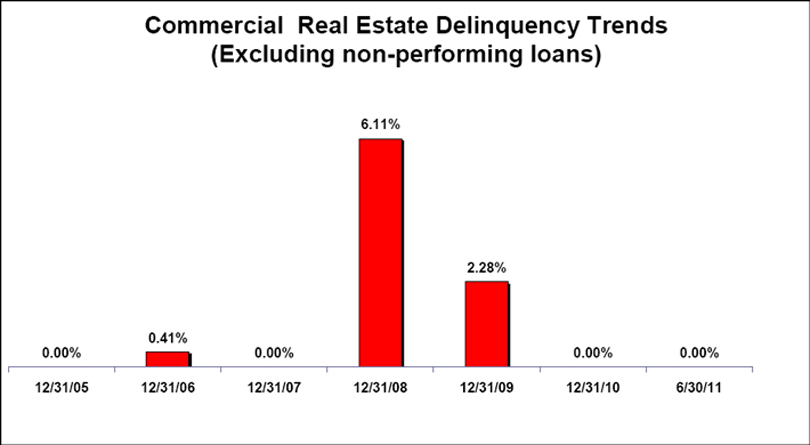
|
11
BANKATLANTIC (BANK ONLY)
SUPPLEMENTAL GRAPHS
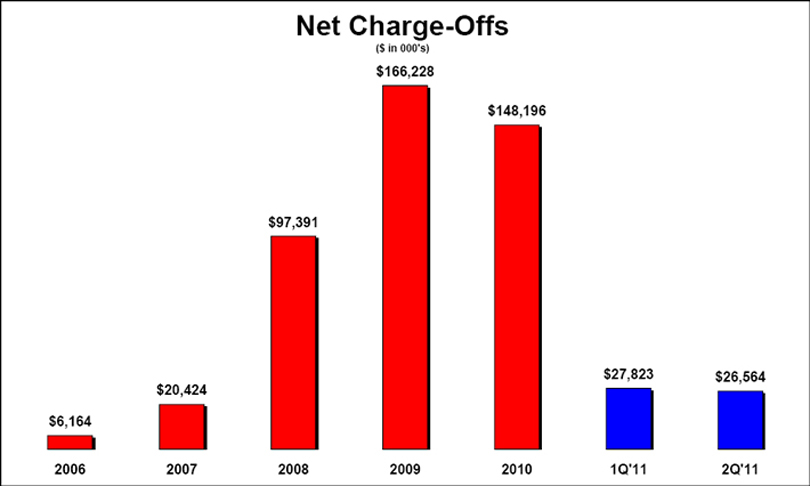
|
12
BANKATLANTIC (BANK ONLY)
SUPPLEMENTAL GRAPHS
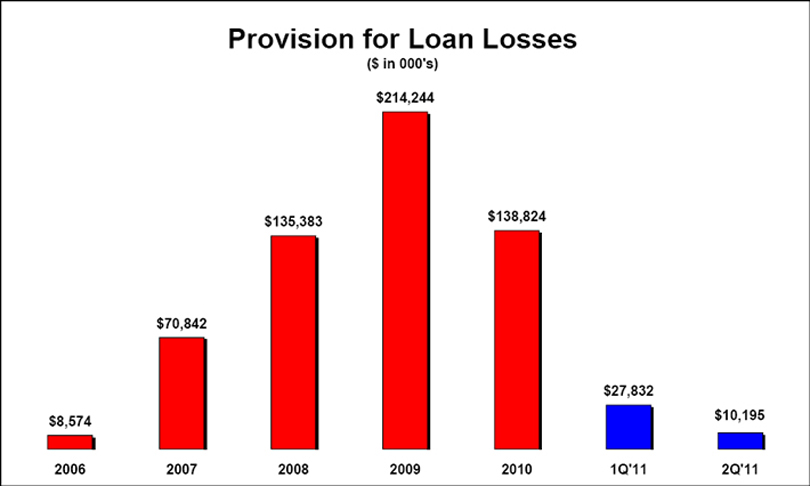
|
13
BANKATLANTIC (BANK ONLY)
SUPPLEMENTAL GRAPHS
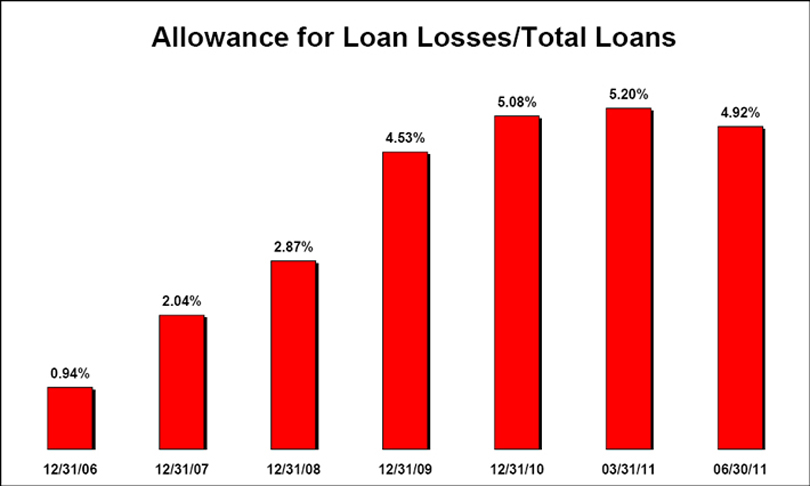
|
14
BANKATLANTIC (BANK ONLY)
SUPPLEMENTAL GRAPHS
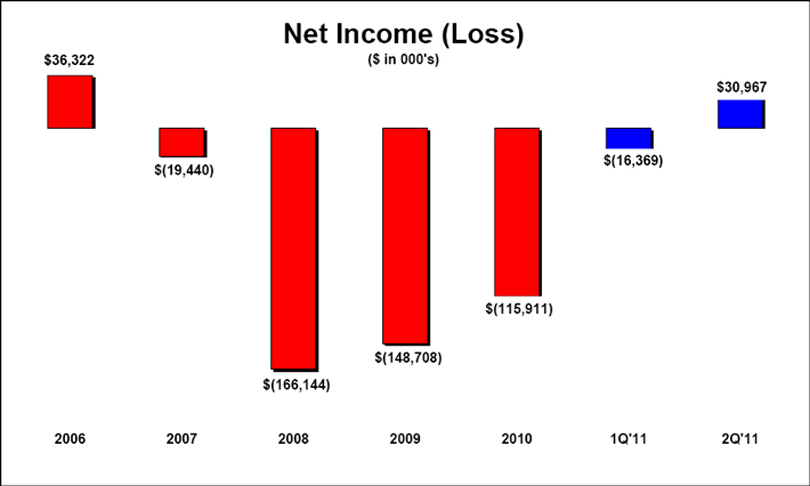
|
15
BANKATLANTIC (BANK ONLY)
SUPPLEMENTAL GRAPHS
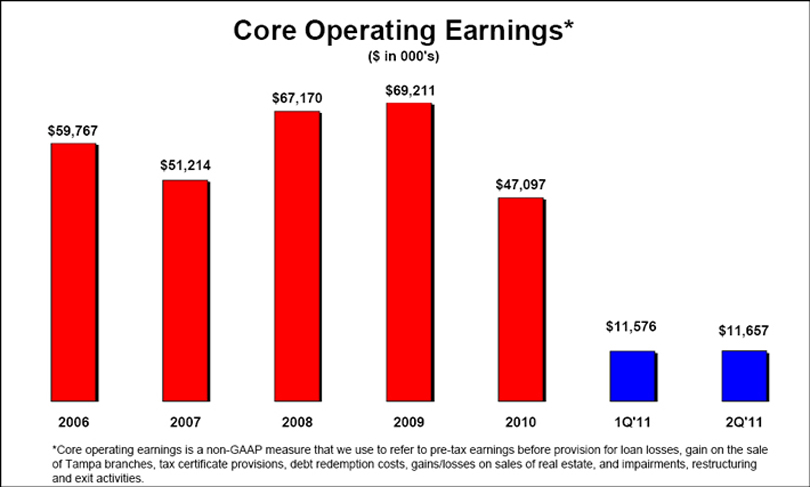
|
16
BANKATLANTIC (BANK ONLY)
SUPPLEMENTAL GRAPHS
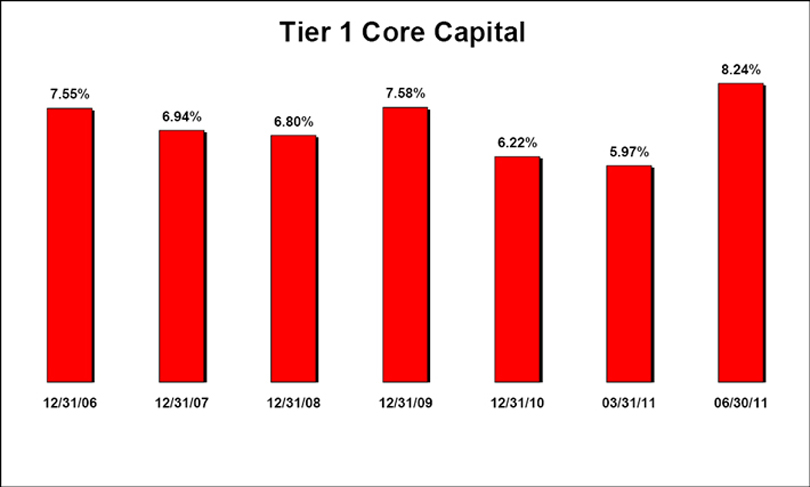
|
17
BANKATLANTIC (BANK ONLY)
SUPPLEMENTAL GRAPHS
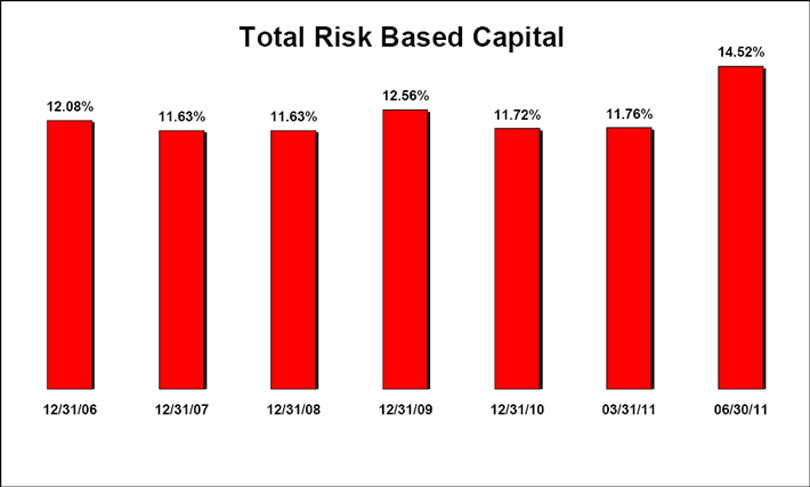
|
18