Attached files
| file | filename |
|---|---|
| 8-K - HINES REIT Q1 2011 PRESENTATION - HINES REAL ESTATE INVESTMENT TRUST INC | hreitq12011presentation.htm |
Exhibit 99.1

Hines Real Estate Investments, Inc., Member FINRA/SIPC, is the Dealer Manager. 6/11
Hines Real Estate Investment Trust, Inc. (Hines REIT) is closed to new investors.
Hines REIT Update
As of March 31, 2011

Jeffrey C. Hines and Gerald D. Hines
Hines History
Gerald D. Hines founded Hines Interests Limited
Partnership (Hines)1 upon a single premise: buildings
of superior quality and architectural merit backed by
responsive, professional management attract better
tenants; command higher rents; and retain their value
longer despite the ups and downs of real estate cycles.
He also imbued the organization with a constant quest
for excellence and an adherence to the highest tenets
of ethical behavior. This foundation, coupled with the
firm’s sound financial policies, has fueled Hines’
growth from a one-person endeavor to a fully
integrated, international real estate firm of
approximately 3,200 employees.
2
1Hines REIT Investors do not receive an interest in Hines or its affiliates. The performance and experience of Hines may not be
indicative of future results for Hines REIT.
indicative of future results for Hines REIT.

Ownership & Structure of Hines1
3
1All data as of December 31, 2010
LEADERSHIP
Name
Tenure w/Hines
(yrs)
Gerald D. Hines
54
Jeffrey C. Hines
29
C. Hastings Johnson
33
Charles M. Baughn
26
James C. Buie, Jr.
30
Mark A. Cover
27
Christopher D. Hughes
24
E. Staman Ogilvie
37
Thomas D. Owens
38
C. Kevin Shannahan
28
Michael J. G. Topham
35
Jerrold P. Lea
30
|
TENURE OF HINES
EXECUTIVES
|
||
|
TITLE
|
NO. OF
EMPLOYEES |
AVG.
TENURE (YEARS) |
|
EVP
|
10
|
31
|
|
SVP
|
43
|
22
|
|
VP
|
125
|
16
|
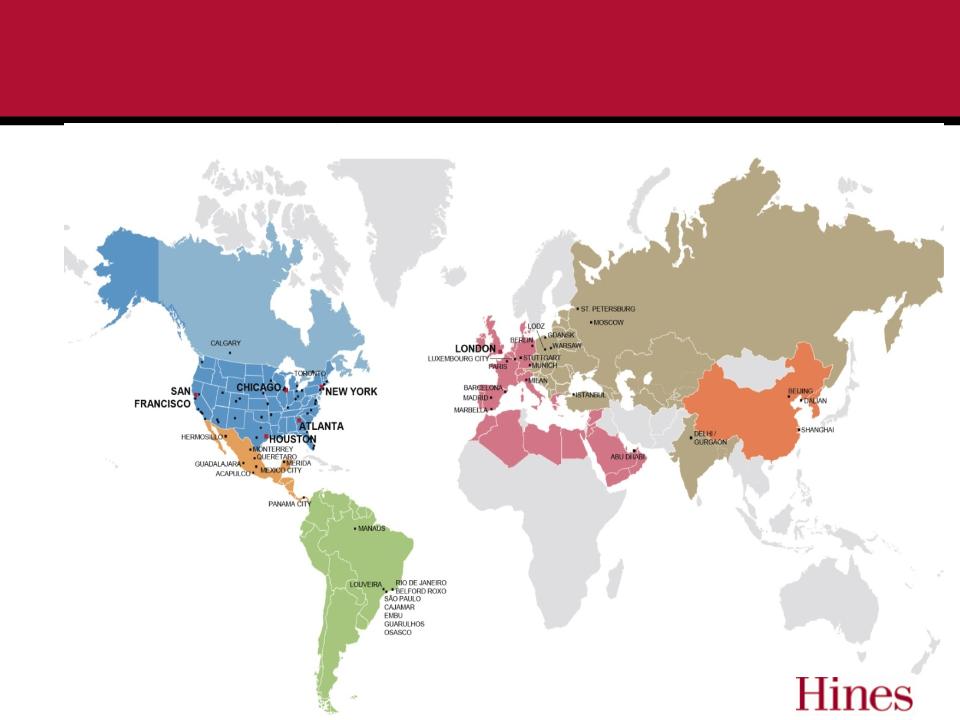
Hines Worldwide Operations
§ Approximately 3,200
employees worldwide
employees worldwide
§ Operations in 66 U.S. cities
and 17 countries worldwide
and 17 countries worldwide
§ Local market knowledge
and expertise
and expertise
4
4

Superior Property Management
5
TENANT SATISFACTION
TENANT RETENTION
HIGHER OCCUPANCY
PROPERTY
OUTPERFORMANCE
OUTPERFORMANCE
|
TENURED HINES PROPERTY MANAGEMENT AND LEASING PERSONNEL
|
|
|
|
AVERAGE HINES
U.S. TENURE (YRS)1
|
|
Property Managers
|
9+
|
|
Assistant Property Managers
|
4+
|
|
Chief Engineers and Engineering Managers
|
12+
|
|
Assistant Chief Engineers
|
7+
|
|
Building Engineers / Maintenance Technicians / Apprentice Engineers
|
5+
|
|
Marketing / Leasing Managers
|
6+
|
1Average Hines U.S. Tenures as of 12/31/2010.
Broker-Dealer Use Only. This material may not be quoted, reproduced nor shown to members of the public, nor used as sales
material for public use. Hines Real Estate Investments, Inc., Member FINRA, SIPC
material for public use. Hines Real Estate Investments, Inc., Member FINRA, SIPC

Hines REIT Portfolio*
* As of March 31, 2011
6
Corporate Headquarters
Williams Tower
Houston, Texas
Houston, Texas
One North Wacker
Chicago, Illinois
Atrium on Bay
Toronto, Ontario
Toronto, Ontario

Hines REIT Portfolio Summary
(as of March 31, 2011)
(as of March 31, 2011)
§ Holds a diversified portfolio of commercial real estate assets including:
– Primarily institutional-quality office properties
– Grocery-Anchored Retail
– Mixed-Use office
– Industrial
§ Invests through direct acquisitions and joint ventures
§ As of 3/31/11 owns directly or indirectly 59 properties:
– Over 29 million square feet
– Portfolio 89% leased, 4% above the national average
– Both domestic and international holdings:
§ 57 domestic assets totaling approximately 27.5 million square feet
§ 2 international assets totaling in excess of 1.7 million square feet
– Total real estate assets of $3.7 billion acquired
– Minimal near term rollover with an average annual lease roll of 8.81% through 2015
– Current leverage 58%
– Current refinancing exposure is approximately $286 million in 2011 and 2012 and represents
approximately 18.5% of the fund’s total debt.
approximately 18.5% of the fund’s total debt.
§ Proceeds raised in excess of $2.5 billion
§ Approximately 58,000 shareholders
§ Total shareholder distributions since inception: $511.5 million
§ Delivered annualized distributions at a rate of 5.0% - 6.35% (based on $10.08 share price) since inception
in November 2004 through June 30, 2011*
in November 2004 through June 30, 2011*
*On May 24, 2011, as required by FINRA Regulatory Notice 09-09, the board of directors of Hines REIT established an estimated
per-share value of Hines REIT’s common stock of $7.78 per share. Based upon that estimated valuation, the annualized
distribution rate is 6.5%
per-share value of Hines REIT’s common stock of $7.78 per share. Based upon that estimated valuation, the annualized
distribution rate is 6.5%
7

Hines REIT Portfolio
(as of March 31, 2011)
(as of March 31, 2011)
8
San Diego
Houston
Chicago
San Francisco
Seattle
Atlanta
Los Angeles
Richmond
Sacramento
Charlotte
Dallas
Miami
East Bay
Toronto
Minneapolis
Phoenix
Kansas City
Denver
Orlando
San Antonio
Memphis
New York
Washington, D.C.
Raleigh
Rio de Janeiro
Chase Tower
Dallas, TX
1,252,019 Square Feet
Acquired 11/07
88% leased
Minneapolis Office/Flex
Portfolio
Portfolio
Minneapolis, MN
767,859 Square Feet
Acquired 9/07
86% leased
Williams Tower
Houston, TX
1,479,764 Square Feet
Acquired 05/08
87% leased
2555 Grand Blvd
Kansas City, MO
595,607 Square Feet
Acquired 2/08
100% leased
4050/4055 Corporate
Drive
Drive
Dallas, TX
643,429 Square Feet
Acquired 05/08
100% leased
Citymark
Dallas, TX
219,117 Square Feet
Acquired 8/05
84% leased
321 North Clark
Chicago, IL
888,837 Square Feet
Acquired 4/06
75% leased
Three Huntington
Quadrangle
Quadrangle
Long Island, NY
407,912 Square Feet
Acquired 7/07
52% leased
Airport Corporate
Center
Miami, FL
1,018,428 Square Feet
Acquired 1/06
83% leased

Hines REIT Portfolio
(as of March 31, 2011)
(as of March 31, 2011)
9
San Diego
Houston
Chicago
San Francisco
Seattle
Atlanta
Los Angeles
Richmond
Sacramento
Charlotte
Dallas
Miami
East Bay
Toronto
Minneapolis
Phoenix
Kansas City
Denver
Orlando
San Antonio
Memphis
New York
Washington, D.C.
Raleigh
Rio de Janeiro
Denver Industrial
Denver, CO
484,737 Square Feet
Acquired 12/08
84% leased
5th & Bell
Seattle, WA
197,135 Square Feet
Acquired 6/07
91% leased
Seattle Design Center
Redmond, WA
390,684 Square Feet
Acquired 6/07
74% leased
Daytona-Hart Portfolio
Redmond, WA
711,974 Square Feet
Acquired 12/06, 1/07
100% leased (Daytona)
85% leased (Laguna)
1900/2000 Alameda
San Mateo, CA
254,145 Square Feet
Acquired 6/05
91% leased
1515 S Street
Sacramento, CA
349,740 Square Feet
Acquired 11/05
99% leased
3400 Data Drive
Sacramento, CA
149,703 Square Feet
Acquired 11/06
100% leased
2100 Powell
Emeryville, CA
344,433 Square Feet
Acquired 12/06
100% leased
One Wilshire
Los Angeles, CA
661,553 Square Feet
Acquired 8/07
95% leased

Hines REIT Portfolio
(as of March 31, 2011)
(as of March 31, 2011)
10
Distribution Park Rio
Rio de Janeiro, Brazil
693,115 Square Feet
Acquired 07/07
100% leased
50%1
San Diego
Houston
Chicago
San Francisco
Seattle
Atlanta
Los Angeles
Richmond
Sacramento
Charlotte
Dallas
Miami
East Bay
Toronto
Minneapolis
Phoenix
Kansas City
Denver
Orlando
San Antonio
Memphis
New York
Washington, D.C.
Raleigh
Rio de Janeiro
Weingarten Retail
Portfolio
Portfolio
Various locations
1,497,298 Square Feet
Acquired 11/08 - 3/09
93% leased
70%1
Raytheon/DirecTV
El Segundo, CA
550,579 Square Feet
Acquired 3/08
100% leased
1Italicized percentage numbers represent Hines REIT’s effective ownership in each property listed.
2Atrium on Bay was sold on June 1, 2011 for $344.8 million CAD ($353 million based on the exchange rate in effect on the date of sale)
Atrium on Bay2
Toronto, Ontario
1,077,496 Square Feet
Acquired 02/07
98% leased

Hines US Core Office Fund Portfolio
(as of March 31, 2011)1
(as of March 31, 2011)1
11
San Francisco
Houston
Chicago
Seattle
Atlanta
San Diego
Los Angeles
New York
Richmond
Charlotte
Phoenix
Sacramento
Washington D.C.
499 Park Ave
New York, NY
291,515 Square Feet
Acquired 8/03
94% leased
11%2
425 Lexington Ave
New York, NY
700,034 Square Feet
Acquired 8/03
100% leased
11%2
Riverfront Plaza
Richmond, VA
951,616 Square Feet
Acquired 11/06
97% leased
22%2
Charlotte Plaza
Charlotte, NC
625,026 Square Feet
Acquired 6/07
89% leased
22%2
Carillon
Charlotte, NC
472,222 Square Feet
Acquired 7/07
85% leased
22%2
1200 19th Street
Washington D.C.
337,486 Square Feet
Acquired 8/03
83% leased
11%2
1As of March 31, 2011, Hines REIT owned a 26.8% interest in the Hines US Core Office Fund.
2Italicized percentage numbers represent Hines REIT’s effective ownership in each property listed.

Hines US Core Office Fund Portfolio
(as of March 31, 2011)1
(as of March 31, 2011)1
12
One Shell Plaza
Houston, TX
1,230,395 Square Feet
Acquired 5/04
99% leased
11%2
Two Shell Plaza
Houston, TX
565,573 Square Feet
Acquired 5/04
97% leased
11%2
One Atlantic Center
Atlanta, GA
1,100,312 Square Feet
Acquired 7/06
90% leased
22%2
Three First National
Chicago, IL
1,423,515 Square Feet
Acquired 3/05
92% leased
18%2
One North Wacker
Chicago, IL
1,373,754 Square Feet
Acquired 3/08
94% leased
22%2
Renaissance
Square
Square
Phoenix, AZ
965,508 Square Feet
Acquired 12/07
83% leased
22%2
333 West Wacker
Chicago, IL
855,056 Square Feet
Acquired 4/06
75% leased
18%2
101 Second Street
San Francisco, CA
388,370 Square Feet
Acquired 9/04
83% leased
22%2
The KPMG Building
San Francisco, CA
379,328 Square Feet
Acquired 9/04
88% leased
22%2
Golden Eagle Plaza
San Diego, CA
449,180 Square Feet
Acquired 8/05
95% leased
22%2
Warner Center
Los Angeles, CA
808,274 Square Feet
Acquired 10/06
89% leased
18%2
720 Olive Way
Seattle, WA
300,710 Square Feet
Acquired 1/06
84% leased
18%2
Douglas Boulevard
Sacramento, CA
884,320 Square Feet
Acquired 05/07
62% leased
18%2
Wells Fargo Center
Sacramento, CA
502,365 Square Feet
Acquired 05/07
96% leased
18%2
1As of March 31, 2011, Hines REIT owned a 26.8% interest in the Hines US Core Office Fund.
2Italicized percentage numbers represent Hines REIT’s effective ownership in each property listed.

Hines REIT Portfolio Summary
Geographical Diversification
Geographical Diversification
13
REGIONAL MIX1
% OF TOTAL PORTFOLIO—BASED ON ESTIMATED AGGREGATE VALUE
1Weighted by Hines REIT’s effective ownership as of 3/31/11
CITY MIX1
% OF TOTAL PORTFOLIO—BASED ON ESTIMATED AGGREGATE VALUE
San Francisco
Houston
Chicago
Seattle
Atlanta
San Diego
Los Angeles
Washington, DC
New York
Dallas
Sacramento
Miami
Richmond
East Bay
Toronto
Charlotte
Minneapolis
Phoenix
Kansas City
San Antonio
Orlando
Memphis
Denver
ASSET CLASS MIX1
% OF TOTAL PORTFOLIO—BASED ON ESTIMATED AGGREGATE VALUE

Hines REIT Lease Rollover and Tenant Industry
14
ROLLOVER1 (Portfolio occupancy was 89%)
% OF TOTAL LEASABLE SQUARE FEET IN PORTFOLIO
TENANT CREDIT QUALITY1
% OF TOTAL PORTFOLIO—BASED ON SQUARE FOOTAGE
TENANT INDUSTRY MIX1
% OF TOTAL PORTFOLIO—BASED ON SQUARE FOOTAGE
1Weighted by Hines REIT’s effective ownership as of 3/31/11
2Other represents all of the tenant industry mix categories that have less than 1% of the total portfolio
2
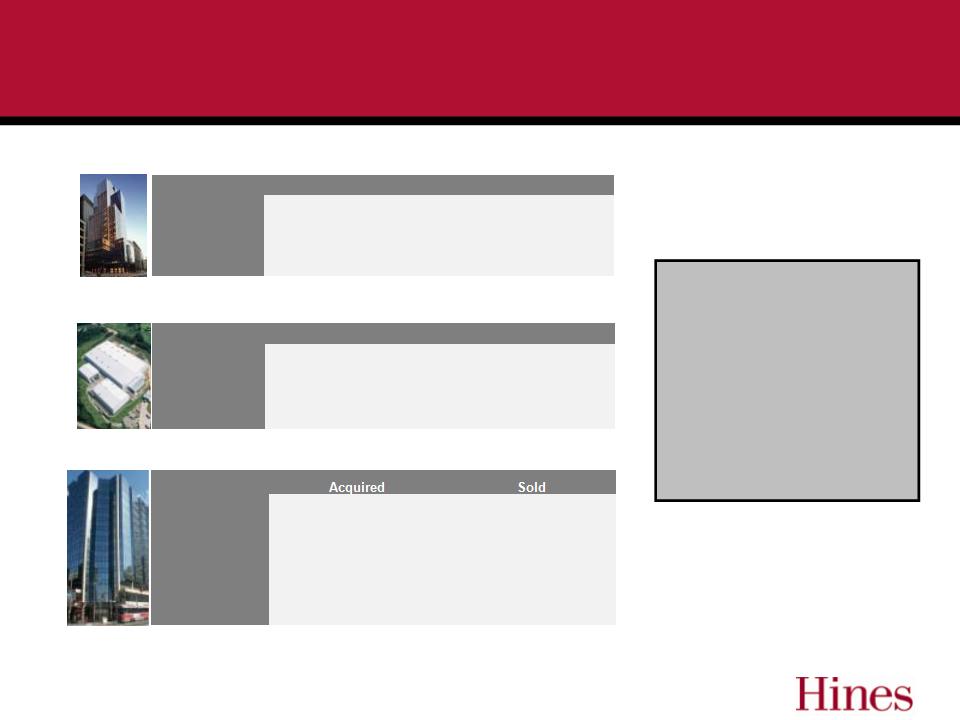
Hines REIT Strategic Dispositions
(1) Hines REIT owned an 11.67% effective ownership interest in this property prior to its sale. The REIT’s economic gain is
based
based
on its effective ownership interest prior to the sale.
15
|
|
Acquired
|
Sold
|
|
Date
|
Dec-08
|
Jan-2010 & April-2010
|
|
Price
|
$115M
|
$141M
|
|
Exchange Rate
|
2.35BRL/$USD
|
1.81BRL & 1.76BRL/$USD
|
|
Gain
|
REIT Economic gain of $11.8M
|
|
|
|
Acquired
|
Sold
|
|
Date
|
Feb-04
|
May-10
|
|
Price
|
$91.6M
|
$193M
|
|
Lease %
|
76%
|
94%
|
|
Gain
|
Economic gain of $79M (REIT economic gain of $9.6M)
(1) |
|
Since the closing of Hines REIT in
December 2009, the firm has
evaluated opportunities for
targeted asset sales.
December 2009, the firm has
evaluated opportunities for
targeted asset sales.
The proceeds from these sales
continue to support the overall
objectives of deleveraging the
portfolio, managing liquidity,
funding capital expenditures and
leasing costs, and maximizing
shareholder distributions.
continue to support the overall
objectives of deleveraging the
portfolio, managing liquidity,
funding capital expenditures and
leasing costs, and maximizing
shareholder distributions.
Araucaria, Elouveira and Vinhedo
600 Lexington(1)
Atrium on Bay
|
|
Acquired
|
Sold
|
|
Date
|
Feb-07
|
June-11
|
|
Price
|
$250M CAD
$215M USD
|
$344.8M CAD
$353M USD
|
|
Exchange Rate
|
$CAD/$0.861USD
|
$CAD/$1.023USD
|
|
Lease %
|
86%
|
98%
|
|
Gain
|
Net sales proceeds of $128.7M (USD)
|
|
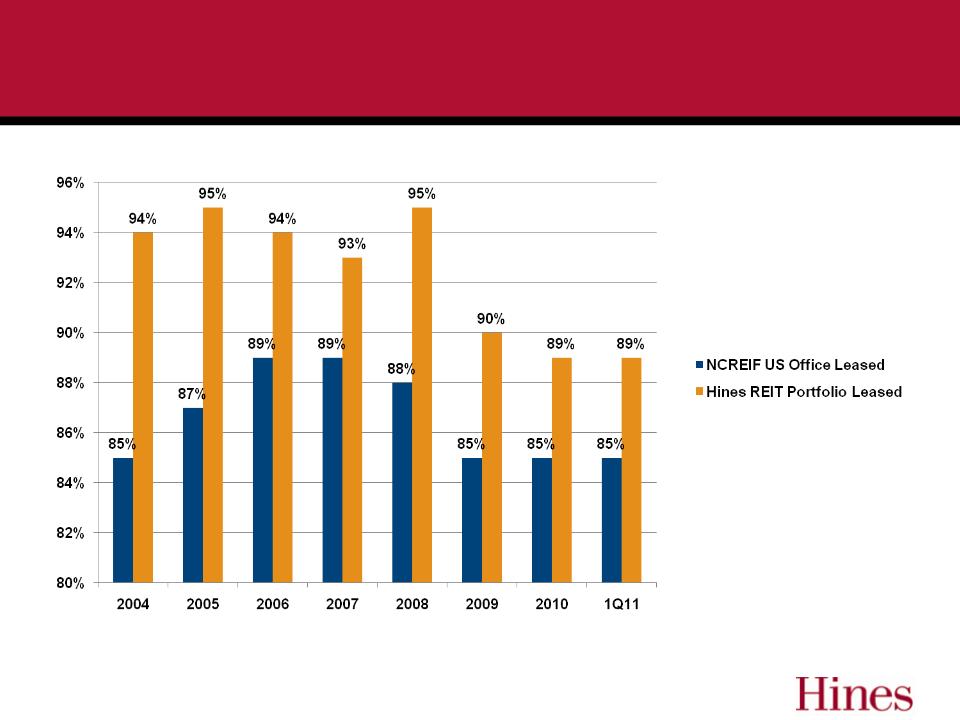
Hines REIT - Tracking Occupancy
Source: NCREIF
16

Finding Success in Challenging Markets
Q1 2011
Q1 2011
§ Houston, TX - Williams Tower
– Williams Companies, an integrated natural gas company, renewed 265,000 Square
Feet (SF) for 10 years
Feet (SF) for 10 years
§ Atlanta, GA - One Atlantic Center
– National law firm Alston + Bird renewed 365,000 SF for 17 years
§ Sacramento, CA - Wells Fargo Center
– Wells Fargo Bank (subsidiary of NYSE: WFC), a nationwide, diversified, community-
based financial services company with $1.2 trillion in assets, executed a 45,000 SF
lease extension for five years
based financial services company with $1.2 trillion in assets, executed a 45,000 SF
lease extension for five years
§ Richmond, VA - Riverfront Plaza
– Morgan Stanley Smith Barney, a premier global wealth management firm, executed
a 23,000 SF lease for 11 years
a 23,000 SF lease for 11 years
17

Finding Success in Challenging Markets
Q1 2011
Q1 2011
§ Los Angeles, CA - Warner Center
– HealthNetInc. (NYSE: HNT), a managed care organization, executed a 334,000 SF
lease renewal for 10 years
lease renewal for 10 years
§ Roseville, CA - Douglas Boulevard
– Intel-GE Care Innovations, a firm that creates technology-based solutions that give
people confidence to live independently, executed a 19,000 SF lease
people confidence to live independently, executed a 19,000 SF lease
§ Los Angeles, CA - One Wilshire
– Executed three leases for a total of 13,000 SF
18
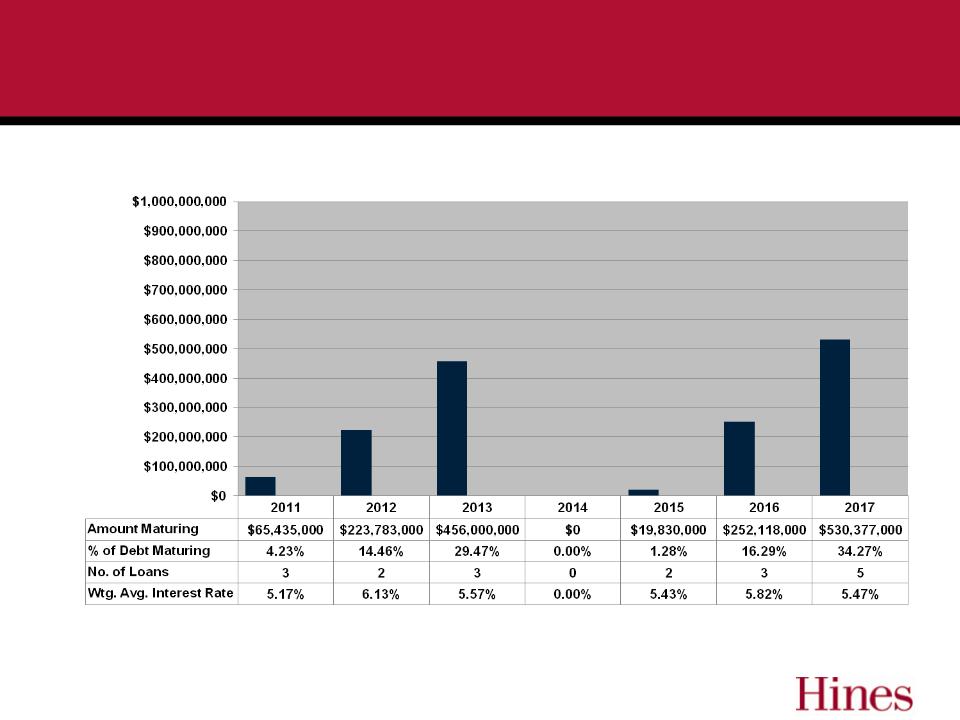
Hines REIT Debt Maturity Chart
($ in millions as of March 31, 2011)
($ in millions as of March 31, 2011)
19
Portfolio Weighted Average Interest Rate 5.64%
Hines REIT is contractually obligated to make principal payments on its outstanding notes payable for the period of April 1, 2011 through December
31, 2011, for each of the years ending December 31, 2012 through December 31, 2015 and for the period thereafter (in thousands): $$66,945,
$224,638, $457,480, $3,820, $22,833 and $771,827.
31, 2011, for each of the years ending December 31, 2012 through December 31, 2015 and for the period thereafter (in thousands): $$66,945,
$224,638, $457,480, $3,820, $22,833 and $771,827.
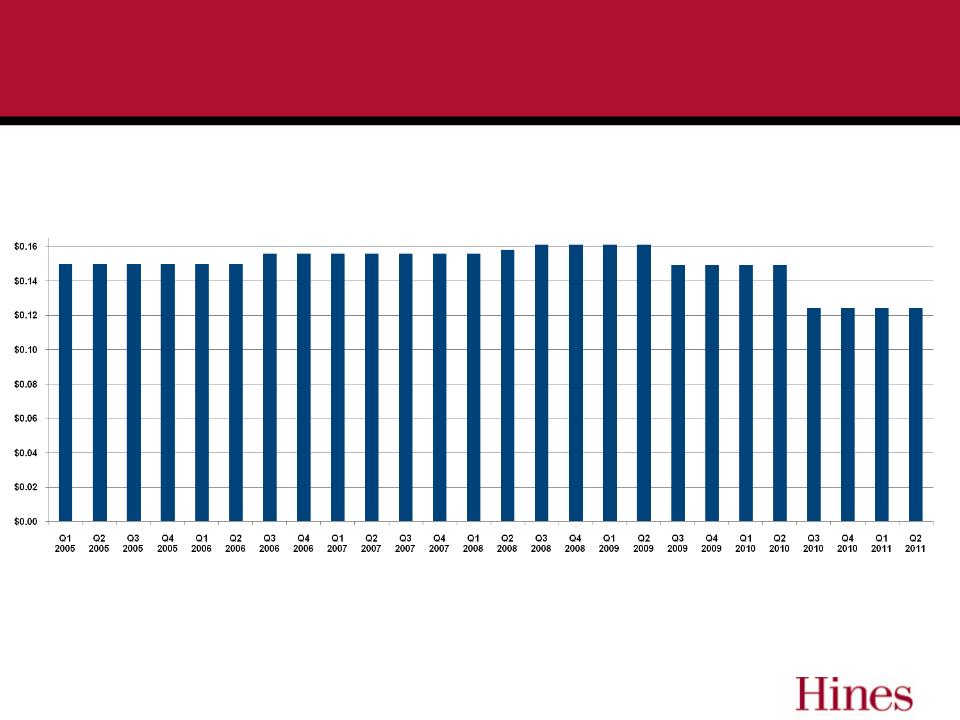
Distribution History -
Cents Per Share Paid Quarterly
Cents Per Share Paid Quarterly
20
Relatively Stable Distribution

Modified Funds From Operations
§ Modified Funds From Operations (“MFFO”) is a non-
GAAP supplemental earnings-based performance
measure used to evaluate REIT operating performance.
GAAP supplemental earnings-based performance
measure used to evaluate REIT operating performance.
§ MFFO was derived by making certain adjustments to
Funds From Operations, which was originally defined by
NAREIT in 1991 and last modified in 2002.
Funds From Operations, which was originally defined by
NAREIT in 1991 and last modified in 2002.
§ Currently the IPA and certain issuers are working through
an agreed upon definition of MFFO with the SEC and
other regulators.
an agreed upon definition of MFFO with the SEC and
other regulators.
21
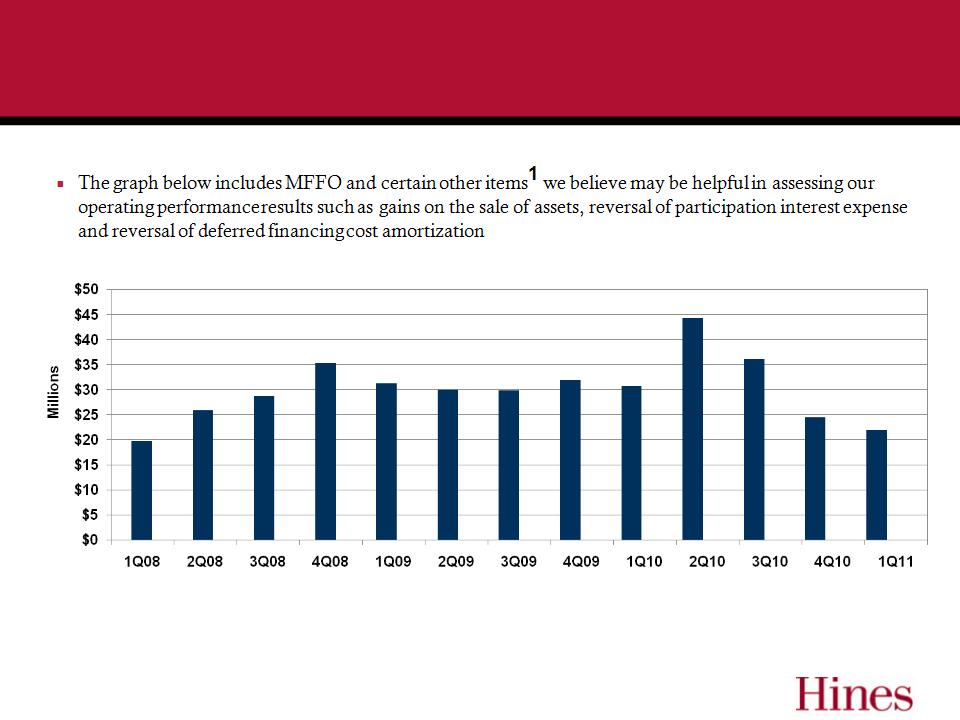
Evaluating Operating Performance
22
§ MFFO is used by Senior Management and the Board of Directors to evaluate operating performance
1Includes IPA-defined MFFO and gains on asset sales, as well as adjustments to reverse participation interest expense and deferred financing cost
amortization. Deferred financing costs are amortized into interest expense over the terms of the related obligations. Hines REIT records a liability in its balance
sheet related to the interests (Participation Interest) owned by Hines’ subsidiaries. This liability is based on its estimated settlement value, which is measured at
fair value based on the Company's redemption price in place as of each balance sheet date. Periodic increases in the Participation Interest, as well as
adjustments required to record this liability at fair value, are included in asset management and acquisition fees in the Company's statements of operations.

Appendix 1: Evaluating Operating Performance
Funds from Operations and Modified Funds from Operations
§ Funds from Operations (“FFO”) is a non-GAAP financial performance measure defined by the National Association of Real Estate Investment Trusts
(“NAREIT”) widely recognized by investors and analysts as one measure of operating performance of a real estate company. FFO excludes items such as real
estate depreciation and amortization and gains and losses on the sale of real estate assets. Depreciation and amortization, as applied in accordance with
GAAP, implicitly assumes that the value of real estate assets diminishes predictably over time. Since real estate values have historically risen or fallen with
market conditions, it is management’s view, and we believe the view of many industry investors and analysts, that the presentation of operating results for real
estate companies by using the historical cost accounting alone is insufficient. In addition, FFO excludes gains and losses from the sale of real estate, which we
believe provides management and investors with a helpful additional measure of the historical performance of our real estate portfolio, as it allows for
comparisons, year to year, that reflect the impact on operations from trends in items such as occupancy rates, rental rates, operating costs, general and
administrative expenses and interest costs.
§ In addition to FFO, management uses modified funds from operations (“MFFO”) as defined by the Investment Program Association (“IPA”) as a non-GAAP
supplemental financial performance measure, to evaluate our operating performance. MFFO includes funds generated by the operations of our real estate
investments and funds used in our corporate-level operations. MFFO is based on FFO, but includes certain additional adjustments which we believe are
appropriate due to changes in the accounting and reporting rules under GAAP that have been put into effect since the establishment of NAREIT’s definition of
FFO. These changes have prompted a significant increase in the magnitude of non-cash and non-operating items included in FFO, as defined. Such items
include amortization of out-of-market lease intangible assets and liabilities and certain tenant incentives, the effects of straight-line rent revenue recognition, fair
value adjustments to derivative instruments that we have not designated as hedging instruments for accounting purposes, non-cash impairment charges and
certain other items as described in the footnotes below. We believe that MFFO more closely reflects the overall impact on the performance of our real estate
investments of occupancy rates, rental rates, property operating costs, as well as corporate-level general and administrative expenses and interest costs,
which is not immediately apparent from net income (loss).
§ As such, we believe FFO and MFFO, in addition to net income (loss) and cash flows from operating activities as defined by GAAP, are meaningful
supplemental performance measures and are useful to investors in understanding how our management evaluates our ongoing operating performance.
However, FFO and MFFO should not be considered as alternatives to net income (loss) or to cash flows from operating activities and are not intended to be
used as liquidity measures indicative of cash flow available to fund our cash needs. Additionally, please see the limitations listed below associated with the use
of MFFO as compared to net income (loss):
– MFFO excludes gains (losses) related to changes in estimated values of our interest rate swaps. Although we expect to hold these instruments to
maturity, if we were to settle these instruments currently, it would have an impact on our operations.
maturity, if we were to settle these instruments currently, it would have an impact on our operations.
– MFFO excludes impairment charges related to long-lived assets that have been written down to current market valuations. Although these losses are
included in the calculation of net income (loss), we have excluded them from MFFO because we believe doing so more appropriately presents the
operating performance of our real estate investments on a comparative basis.
included in the calculation of net income (loss), we have excluded them from MFFO because we believe doing so more appropriately presents the
operating performance of our real estate investments on a comparative basis.
– MFFO excludes acquisition fees payable to our Advisor. Although these amounts reduce net income, we fund such costs with proceeds from our public
offerings and acquisition-related indebtedness and do not consider these fees in the evaluation of our operating performance and determining MFFO.
offerings and acquisition-related indebtedness and do not consider these fees in the evaluation of our operating performance and determining MFFO.
23

Appendix 1: Evaluating Operating Performance
24
|
1)
|
Represents the depreciation and amortization of various real estate assets. Historical cost accounting for real estate assets in accordance with GAAP implicitly
assumes that the value of real estate assets diminishes predictably over time. Since real estate values have historically risen or fallen with market conditions, we believe that such depreciation and amortization may be of limited relevance in evaluating current operating performance and, as such, these items are excluded from our determination of FFO. This amount includes $1.1 million, $1.1 million, $1.9 million and approximately $67,000 of depreciation and amortization related to discontinued operations for the three months ended March 31, 2011 and the years ended December 31, 2010, 2009 and 2008, respectively. |
|
2)
|
Represents the gain on disposition of certain real estate investments. Although this gain is included in the calculation of net income (loss), we have excluded it from
FFO because we believe doing so more appropriately presents the operating performance of our real estate investments on a comparative basis. |
|
3)
|
Includes adjustments to equity in earnings (losses) of unconsolidated entities, net, similar to those described in Notes 1, 2 and 7 for our unconsolidated entities, which
are necessary to convert our share of income (loss) from unconsolidated entities to FFO and MFFO. |
|
|
2011-Q1
|
2010-Q4
|
2010-Q3
|
2010-Q2
|
2010-Q1
|
2009-Q4
|
2009-Q3
|
2009-Q2
|
2009-Q1
|
2008-Q4
|
2008-Q3
|
2008-Q2
|
2008-Q1
|
|
|
|
|
|
|
|
|
|
|
|
|
|
|
|
|
Net Income (Loss)
|
$(9,282,000) |
$14,276,000 |
$(28,302,000) |
$(8,419,000) |
$(12,938,000) |
$5,120,000 |
$(25,789,000) |
$23,549,000 |
$3,805,000 |
$(104,212,818) |
$(23,780,066) |
$8,836,804 |
$(43,186,923) |
|
Add (deduct) NAREIT defined
adjustments: |
|
|
|
|
|
|
|
|
|
|
|
|
|
|
Depreciation and amortization(1)
|
25,680,000 |
27,157,263 |
28,379,702 |
27,371,787 |
28,875,107 |
31,423,724 |
31,859,012 |
31,009,829 |
31,778,589 |
32,312,877 |
32,888,148 |
32,215,784 |
25,381,478 |
|
Gain on sale of real estate(2)
|
- |
(25,098) |
- |
(18,310,535) |
(4,226,561) |
- |
- |
- |
(612,000) |
|
|
|
|
|
Adjustments to equity in earnings
(losses) of unconsolidated subsidiaries(3) |
8,863,000 |
9,027,651 |
9,306,047 |
(2,714,681) |
10,585,753 |
9,464,294 |
9,526,393 |
9,846,055 |
10,432,052 |
14,307,417 |
9,702,314 |
10,090,246 |
9,400,774 |
|
Income (loss) to minority interests (4)
|
(1,003,000) |
(1,926,908) |
(372,449) |
72,218 |
(747,212) |
(1,460,735) |
(484,670) |
(1,941,983) |
(1,316,404) |
1,519,282 |
(483,589) |
(1,294,098) |
204,838 |
|
NAREIT Defined FFO
|
24,258,000 |
48,508,908 |
9,011,299 |
(2,000,211) |
21,549,088 |
44,547,282 |
15,111,735 |
62,462,901 |
44,087,237 |
(56,073,242) |
18,326,807 |
49,848,737 |
(8,199,833) |
|
|
|
|
|
|
|
|
|
|
|
|
|
|
|
|
Add (deduct) our MFFO adjustments
|
|
|
|
|
|
|
|
|
|
|
|
|
|
|
(Gain) loss on derivative
instruments (5) |
(5,196,000) |
(27,144,111) |
15,441,318 |
24,373,854 |
5,853,592 |
(14,207,567) |
11,700,747 |
(35,894,682) |
(10,895,939) |
74,685,772 |
10,529,600 |
(26,780,236) |
27,444,828 |
|
Impairment on land parcel(6)
|
- |
- |
810,536 |
- |
- |
- |
3,412,163 |
- |
- |
- |
- |
- |
- |
|
Other non-cash components of
revenues and expenses(7) |
(2,173,000) |
(3,752,457) |
(4,647,523) |
(1,708,545) |
(3,172,038) |
(4,183,574) |
(4,905,616) |
(3,980,490) |
(5,395,288) |
(1,993,712) |
(3,647,595) |
(4,549,551) |
(4,939,235) |
|
Acquisition fees(8)
|
- |
- |
- |
- |
- |
- |
- |
1 |
1,159,901 |
8,123,377 |
- |
1,571,500 |
1,446,500 |
|
Adjustments to equity in earnings
(losses) of unconsolidated subsidiaries(3) |
87,000 |
510,142 |
141,937 |
135,871 |
401,010 |
378,327 |
382,385 |
456,725 |
489,747 |
1,626,108 |
141,836 |
28,020 |
(27,138) |
|
Income (loss) to minority interests(4)
|
289,000 |
1,160,107 |
(398,864) |
(797,763) |
(102,989) |
560,123 |
(328,692) |
1,188,682 |
418,952 |
(2,177,781) |
(180,351) |
752,360 |
(583,750) |
|
MFFO
|
$17,265,000 |
$19,282,590 |
$20,358,702 |
$20,003,206 |
$24,528,663 |
$27,094,592 |
$25,372,722 |
$24,233,136 |
$29,864,610 |
$24,190,522 |
$25,170,297 |
$20,870,829
|
$15,141,372 |

Appendix 1: Evaluating Operating Performance
25
|
4)
|
Includes income attributable to noncontrolling interests and all adjustments to eliminate the noncontrolling interests’ share of the adjustments to convert our net
income (loss) to FFO and MFFO. |
|
5)
|
Represents components of net income (loss) related to the estimated changes in the values of our interest rate swap derivatives. We have excluded these changes in
value from our evaluation of our operating performance and MFFO because we expect to hold the underlying instruments to their maturity and accordingly the interim gains or losses will remain unrealized. |
|
6)
|
Represents impairment charges recorded in the third quarters of 2010 and 2009 in accordance with GAAP. Although such charges are included in the calculation of net
income (loss), we have excluded them from MFFO because we believe doing so more appropriately presents the operating performance of our real estate investments on a comparative basis. |
|
7)
|
Includes the following components of revenues and expenses that we do not consider in evaluating our operating performance and determining MFFO for the three
months ended March 31, 2011 and the years ended December 31, 2010, 2009 and 2008 (in thousands): |
|
a)
|
Represents the adjustments to rental revenue as required by GAAP to recognize minimum lease payments on a straight-line basis over the
respective lease terms. We have excluded these adjustments from our evaluation of the operating performance of the Company and in determining MFFO because we believe that the rent that is billable during the current period is a more relevant measure of the Company’s operating performance for such period. |
|
b)
|
Represents the amortization of lease incentives and out-of-market leases. As stated in Note 1 on the previous slide, historical cost accounting
for real estate assets in accordance with GAAP implicitly assumes that the value of real estate assets diminishes predictably over time. Since
real estate values have historically risen or fallen with market conditions, we believe that such amortization may be of limited relevance in evaluating current operating performance and, as such, these items are excluded from our determination of MFFO. |
|
|
2011-Q1
|
2010-Q4
|
2010-Q3
|
2010-Q2
|
2010-Q1
|
2009-Q4
|
2009-Q3
|
2009-Q2
|
2009-Q1
|
2008-Q4
|
2008-Q3
|
2008-Q2
|
2008-Q1
|
|
Other components of revenues and
expenses |
|
|
|
|
|
|
|
|
|
|
|
|
|
|
Straight Line Rent Adjustments
|
$(2,350,000)
|
(2,662,719)
|
(2,933,835)
|
(723,687)
|
(1,977,490)
|
(1,552,355)
|
(2,633,424)
|
(1,831,787)
|
(3,417,929)
|
(3,566,572)
|
(4,243,951)
|
(4,652,920)
|
(3,925,028)
|
|
Amortization of Lease Incentives
|
2,815,000
|
2,442,658
|
2,237,208
|
1,957,599
|
1,787,982
|
1,468,973
|
1,301,896
|
1,264,734
|
1,270,470
|
1,471,652
|
1,076,880
|
896,599
|
773,271
|
|
Out-of-market Lease Amortization
|
(2,849,000)
|
(3,695,643)
|
(4,164,311)
|
(3,155,884)
|
(3,196,281)
|
(3,706,270)
|
(3,788,830)
|
(3,627,862)
|
(3,625,008)
|
(437,983)
|
(765,096)
|
(1,078,418)
|
(2,054,596)
|
|
Amortization of Deferred Financing Costs
|
0
|
0
|
0
|
0
|
0
|
0
|
0
|
0
|
0
|
0
|
0
|
0
|
0
|
|
Other Non-cash Components
|
211,000
|
163,247
|
213,415
|
213,427
|
213,750
|
(393,921)
|
214,741
|
214,425
|
377,180
|
539,191
|
284,572
|
285,188
|
267,118
|
|
Other components of revenues and
expenses |
$(2,173,000)
|
(3,752,457)
|
(4,647,523)
|
(1,708,545)
|
(3,172,038)
|
(4,183,574)
|
(4,905,616)
|
(3,980,490)
|
(5,395,288)
|
(1,993,712)
|
(3,647,595)
|
(4,549,551)
|
(4,939,235)
|

Appendix 1: Evaluating Operating Performance
26
|
|
|
|
8) Represents acquisition expenses and acquisition fees paid to our Advisor that are expensed in our consolidated statements of operations. We fund
such costs with proceeds from our offering and acquisition-related indebtedness, and therefore do not consider these expenses in evaluating our
operating performance and determining MFFO.
such costs with proceeds from our offering and acquisition-related indebtedness, and therefore do not consider these expenses in evaluating our
operating performance and determining MFFO.
Set forth below is additional information relating to certain items excluded from the analysis above which may be helpful in assessing our operating
results:
results:
• Pursuant to the terms of the Grocery Anchored Portfolio joint venture agreement, for the three months ended March 31, 2011, we received
distributions of approximately $670,000 and for the years ended December 31, 2010, 2009 and 2008, we received distributions of
approximately $1.1 million, $1.7 million and $161,000 in excess of our pro-rata share of the joint venture’s MFFO, respectively.
distributions of approximately $670,000 and for the years ended December 31, 2010, 2009 and 2008, we received distributions of
approximately $1.1 million, $1.7 million and $161,000 in excess of our pro-rata share of the joint venture’s MFFO, respectively.
• On January 22, 2010, we sold Distribution Park Araucaria, an industrial property located in Curitiba, Brazil, which we acquired in December
2008 for $33.0 million. Net proceeds from the sale after deducting transaction costs, fees and taxes were $34.6 million.
2008 for $33.0 million. Net proceeds from the sale after deducting transaction costs, fees and taxes were $34.6 million.
• On April 22, 2010, we sold Distributions Park Elouveira and Vinhedo, two industrial properties located in Sao Paulo, Brazil, which we
acquired in December 2008 for $83.1 million. Net proceeds from the sale after deducting transaction costs, fees and taxes were $93.3 million.
acquired in December 2008 for $83.1 million. Net proceeds from the sale after deducting transaction costs, fees and taxes were $93.3 million.
• On May 22, 2010, the Core Fund sold 600 Lexington, an office property located in New York, New York, which it acquired in February 2004.
The Core Fund’s total cost basis in 600 Lexington was approximately $103.8 million and the net proceeds from the sale after deducting
transaction costs, taxes and fees were approximately $185.9 million. Our effective ownership in this asset on the date of sale was 11.67%.
The Core Fund’s total cost basis in 600 Lexington was approximately $103.8 million and the net proceeds from the sale after deducting
transaction costs, taxes and fees were approximately $185.9 million. Our effective ownership in this asset on the date of sale was 11.67%.
• On September 14, 2010, we sold a land parcel located in Houston, Texas, which we acquired in connection with our purchase of Williams
Tower. The sales price of the land parcel was $12.8 million. Proceeds received after closing costs and fees were $11.8 million. We recorded
impairment charges of approximately $811,000 and $3.4 million for the years ended December 31, 2010 and 2009, respectively, which is
included in other losses in the accompanying condensed consolidated statements of operations but have been excluded from MFFO. See
Note 6.
• We received $4.0 million in net proceeds from our sale of the Williams Tower waterwall and park in December 2008.
• We received $1.2 million in net proceeds from our sale of land owned in connection with the Laguna Buildings in December 2009.
• Amortization of deferred financing costs was $709,000, $2.8 million, $2.8 million and $1.7 million for the three months ended March 31, 2011
and for the years ended December 31, 2010, 2009 and 2008, respectively, and was deducted in determining MFFO.
and for the years ended December 31, 2010, 2009 and 2008, respectively, and was deducted in determining MFFO.
• A portion of our acquisition and asset management fees are paid in equity through the Participation Interest. For the three months ended
March 31, 2011, this amount was $3.9 million. For the years ended December 31, 2010, 2009 and 2008, these amounts were $15.5 million,
$12.4 million and $18.6 million, respectively.
March 31, 2011, this amount was $3.9 million. For the years ended December 31, 2010, 2009 and 2008, these amounts were $15.5 million,
$12.4 million and $18.6 million, respectively.
• We received master lease payments of $1.2 million and $7.0 million for the years ended December 31, 2009 and 2008, respectively. These
leases were entered into in conjunction with certain asset acquisitions.
leases were entered into in conjunction with certain asset acquisitions.
• We incurred organizational and offering expenses of $3.7 million as of December 31, 2008. These expenses are paid to our Advisor and
expensed in our consolidated statement of operations.
expensed in our consolidated statement of operations.
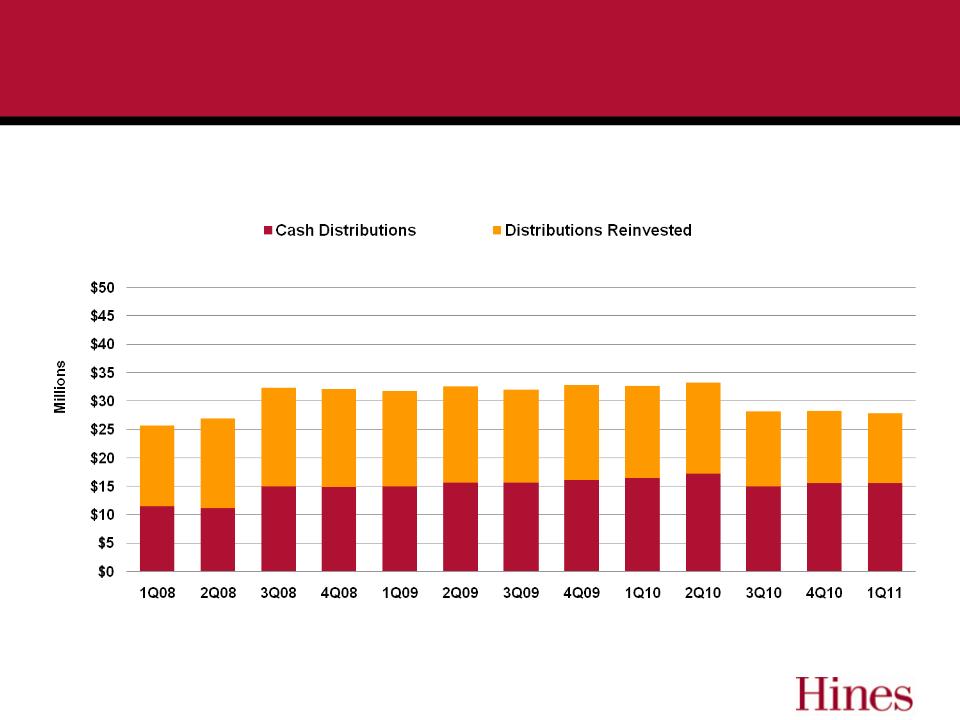
Distribution History - Quarterly in Dollars
27
We funded our cash distributions with cash flows from operating activities, distributions received from our unconsolidated investments,
proceeds from the sales of our real estate investments and cash generated during prior periods, which had cash flows from operating activities
and distributions received from our unconsolidated investments in excess of distributions.
proceeds from the sales of our real estate investments and cash generated during prior periods, which had cash flows from operating activities
and distributions received from our unconsolidated investments in excess of distributions.

Hines REIT Repricing Discussion
§ FINRA Regulatory Notice 09-09 requires publishing estimated share value 18
months after closing of the offering (June 30, 2011 for Hines REIT). The new
share value was $7.78 based upon this most recent estimated share
valuation .
months after closing of the offering (June 30, 2011 for Hines REIT). The new
share value was $7.78 based upon this most recent estimated share
valuation .
§ The estimated share value was determined based primarily on:
– Valuations of substantially all of our real estate investments by
independent third parties;
independent third parties;
– Internal valuations of our real estate investments by the Company’s
management using methodologies that are commonly used in the
commercial real estate industry (including discounted cash flow analyses
and reviews of current, historical and projected capitalization rates for
properties comparable to those owned by the Company);
management using methodologies that are commonly used in the
commercial real estate industry (including discounted cash flow analyses
and reviews of current, historical and projected capitalization rates for
properties comparable to those owned by the Company);
– Valuations of our notes payable by an independent third party; and
– The estimated values of other assets and liabilities determined by
management as of March 31, 2011.
management as of March 31, 2011.
28

Hines REIT Exit Strategy
§ Overall goal is to maximize returns to investors
§ Exit strategy may include the targeted sale of
individual or groups of assets
individual or groups of assets
§ May also consider a sale, merger or listing on a
national exchange
national exchange
§ Will continue to identify opportunities for strategic
asset sales
asset sales
29

Current Priorities & Focus
§ Our Near-Term Priorities Consist of:
– Leasing of Existing Assets in Our Portfolio
– Strategic Asset Sales
– Managing Liquidity & Maximizing Distributions to Shareholders
§ Our Long-Term Priorities Consist of:
– Evaluating Potential Exit Strategies
– Managing Our Debt Maturities
§ These Priorities are Designed to Assist Us in Meeting Our
Primary Objective of Maximizing Shareholder Returns
over the Long Term
Primary Objective of Maximizing Shareholder Returns
over the Long Term
30

“Hines began as a one-man operation in 1957
with the sole focus of delivering better quality
services and products to tenants and investors.
More than half a century later, with 3,200
professionals working on four continents, our
philosophy has not wavered and our
commitment to excellence in the built
environment is stronger than ever.”
with the sole focus of delivering better quality
services and products to tenants and investors.
More than half a century later, with 3,200
professionals working on four continents, our
philosophy has not wavered and our
commitment to excellence in the built
environment is stronger than ever.”
31
Gerald D. Hines

Thank You