Attached files
| file | filename |
|---|---|
| 8-K - JULY 28, 2011 8-K - Federal Home Loan Bank of Chicago | a20112qmemberletter8k.htm |
EXHIBIT 99.1
July 28, 2011
To Our Members:
This letter will update you on the Federal Home Loan Bank of Chicago's financial results for the second quarter of 2011. While the results discussed here are preliminary and unaudited, we are pleased to report that we had our seventh consecutive profitable quarter and continued to build our retained earnings. Based on these results, we announced our dividend payment of 0.10% per share (annualized) earlier this week. We expect to file our second quarter 2011 report (Form 10-Q) with the Securities and Exchange Commission next month. You will be able to access it through our website, www.fhlbc.com, or the SEC's reporting website, www.sec.gov/edgar.
Focused on our member shareholders and the long-term financial strength of the cooperative, our ongoing goals are to:
• | Provide our members with short-term liquidity and long-term funding as integral components of their business strategies; |
• | Generate consistent, profitable results while extending the benefits of our funding advantage to our members; |
• | Maintain an appropriate dividend; |
• | Stabilize our capital base through a capital stock conversion; |
• | Build retained earnings; |
• | Simplify the business model and operations of the Bank; and |
• | Restore full liquidity to our stock. |
Second Quarter 2011 Financial Highlights
• | We recorded net income of $41 million for the second quarter of 2011 compared to net income |
of $116 million for the second quarter of 2010, a quarter that was characterized by hedging gains and higher-than-usual advance prepayment fees. Net interest income of $127 million was 32% lower than net interest income of $188 million in the second quarter of 2010 due to lower levels of advances and Mortgage Partnership Finance® (MPF®) loans held in portfolio, and the absence of significant advance prepayment fees. Credit-related other-than-temporary-impairment (OTTI) charges of $23 million offset a portion of the net interest income. We may experience additional credit-related OTTI charges in the future.
• | Advances outstanding at June 30, 2011, were $17.3 billion, 3% lower than the previous quarter-end level of $17.9 billion and 8% lower than the year-end 2010 level of $18.9 billion. As is the case for many of the Home Loan Banks across the System, our lower advance levels reflect reduced overall levels of lending, deposit-rich balance sheets across our membership, and members' efforts to strengthen capital. In addition, several larger members involved in mergers have paid down advances over the last several quarters. |
1
• | MPF loans held in portfolio at June 30, 2011, declined $2.2 billion (12%) to $16.1 billion from $18.3 billion at December 31, 2010. These reductions are a direct result of our 2008 decision not to add MPF loans to our balance sheet. MPF Xtra® loan volume was $336 million during the second quarter of 2011 and $7.6 billion from the inception of the program through June 30, 2011. |
• | Total investment securities of $39.2 billion at June 30, 2011, roughly equaled the $39.0 billion portfolio at December 31, 2010. However, as previously stated, the largest portion of the investment portfolio was acquired to create an income bridge to transition the primary business of the Bank to advances. We expect this portfolio to decline over time as we are no longer purchasing most asset classes and are positioning the balance sheet for reductions associated with the eventual repurchases and redemptions of capital stock required to normalize our relationships with our members. |
• | As a result of our net income during the first half of 2011, our retained earnings grew $66 million to $1.16 billion at June 30, 2011. |
• | While nearly 200 members have registered to access down payment and closing cost assistance for their homebuying customers through the Downpayment Plus® (DPP®) Program, more than $7 million is still available for 2011. Illinois members should contact the Illinois League of Financial Institutions (www.ilfi.org) and Wisconsin members should contact the Wisconsin Partnership for Housing Development (www.wphd-dpp.org), the administrators of the DPP Program. |
• | We remain in compliance with all of our regulatory capital requirements. |
Income Statement: Foundation for Consistent Net Interest Income and Profitability
Net interest income for the second quarter of 2011 of $127 million is in line with net interest income levels over recent quarters, excluding the impact of higher-than-usual levels of advance prepayment fees. Net income for the quarter was $41 million. We believe consistent net interest income, including investment income and income from future growth in the advances portfolio, combined with close attention to non-interest expenses and lower sensitivity to market movements, will be the bases for a successful business model focused on advances.
Credit-related OTTI charges of $23 million in the second quarter of 2011 compared favorably with OTTI charges of $27 million in the second quarter of 2010. However, while we carefully analyze the impact of OTTI charges quarterly, we cannot predict the level of any future charges, which depend on many factors.
We recognized losses of $4 million on derivatives and hedging activities for the second quarter of 2011, compared to gains of $29 million in the second quarter of 2010. Gains and losses on derivatives and hedging activities are largely market-driven. As long as the MPF portfolio remains a relatively large component of the overall balance sheet, we anticipate fluctuations in gains or losses from derivatives and hedging activities from quarter to quarter and year to year.
2
We are actively managing the components of non-interest expenses that we control. Excluding Office of Finance and Federal Housing Finance Agency expenses, non-interest expenses were $26 million during the second quarter of 2011, compared to $25 million for the second quarter of 2010. The main driver of the increase was an increase in Real Estate Owned losses associated with the MPF Program. As we have stated previously, we expect that the Bank's sensitivity to market rate movements will decline, and that the variability of income due to gains and losses on derivatives and hedging activities will moderate over time.
Balance Sheet: Reduction in Total Assets
Total assets at June 30, 2011, were $77.1 billion, down 8% from $84.1 billion at December 31, 2010. The smaller balance sheet reflects reductions in advances, the MPF loan portfolio, and short-term investments. Advances at June 30, 2011, were $17.3 billion, down from $18.9 billion at year-end 2010. Several factors continue to contribute to lower levels of advances, including demand in members' markets, relatively high deposits on members' balance sheets, and members' efforts to strengthen capital ratios. In addition, we have experienced several significant paydowns over the past year resulting from member mergers and resolutions. Finally, we believe that some members view us more in terms of emergency funding than daily or short-term funding. We are having conversations with members individually to point out the benefits of borrowing through the Bank and have initiated several projects that are designed to raise the profile of the Bank as a core provider of members' funding.
Total MPF loans held in portfolio were $16.1 billion at the end of the second quarter of 2011, a reduction of $2.2 billion (12%) from December 31, 2010. We increased our MPF loan loss allowance from $33 million at December 31, 2010, to $39 million, reflecting an increase in our nonperforming and impaired MPF Loan amounts. Despite the increase in the MPF loan loss allowance, MPF loans continue to have lower delinquency rates than the national average for conventional conforming mortgage loans.
The MPF Xtra product has proven to be popular with our members, as well as the members of the Federal Home Loan Banks of Boston, Des Moines, and Pittsburgh. Since the inception of the program in late 2008, 289 participating financial institutions System-wide have funded $7.6 billion in loans. We anticipate offering a servicing-released option under the MPF Xtra product later this year.
Retained earnings totaled $1.16 billion at the end of the second quarter of 2011. The level of retained earnings is an important indicator of the improving financial strength of the Bank.
Summary
In response to significant progress in the remediation of the Bank and the demonstration of the value and reliability of FHLBank funding to our members during times of extreme financial crisis and credit distress, our members have reinforced the importance of this institution to them and their communities in Illinois and Wisconsin. Our role as a locally owned cooperative that has access to the advantaged funding of a GSE is more important today than ever before. And, our role is not just that of a critical source of back-up liquidity though we have, at times, been the only funding alternative for members facing severe challenges. We are a funding partner providing asset/liability and risk management
support to members of all sizes.
3
As your FHLBank, we have expanded collateral capacity and streamlined collateral pledging processes for nearly 350 members who have executed our new advances agreement. In response to feedback from some of our members and some of your trade associations, we clarified several provisions of the new agreement and better articulated the business choices available to our members regarding the agreement.
Early next year we plan to roll out the first phase of our enhanced member website, with more timely, flexible reporting to make it easier for members to track their transactions with the Bank. And, the second phase, available in late 2012, will include the ability for members to take down advances and execute other business transactions with the Bank online.
Finally, we continue to work with our regulator to gain approval for our submitted capital stock plan. As soon as we receive approval, we will provide information on the structure and timing of a capital stock conversion with you.
Please refer to the attached Condensed Statements of Income and Statements of Condition and the discussion of the market value of the Bank's equity, level of retained earnings, and the spread of return on average regulatory capital to three-month Libor that follows.
As always, we welcome your comments and questions and look forward to working more closely with you during the rest of 2011.
Best regards,
Matt Feldman
President and CEO
This letter contains forward-looking statements which are based upon our current expectations and speak only as of the date hereof. These statements may use forward-looking terms, such as “anticipates,” “believes,” “expects,” “could,” “plans,” “estimates,” “may,” “should,” “will,” or their negatives or other variations on these terms. We caution that, by their nature, forward-looking statements involve risk or uncertainty, that actual results could differ materially from those expressed or implied in these forward-looking statements, and that actual events could affect the extent to which a particular objective, projection, estimate, or prediction is realized. These forward-looking statements involve risks and uncertainties including, but not limited to, instability in the credit and debt markets, economic conditions (including effects on, among other things, mortgage-backed securities), changes in mortgage interest rates and prepayment speeds on mortgage assets, our ability to successfully transition to a new business model and to pay future dividends and the risk factors set forth in our periodic filings with the Securities and Exchange Commission, which are available on our website at www.fhlbc.com. We assume no obligation to update any forward-looking statements made in this letter. The financial results discussed in this letter are preliminary and unaudited. “Mortgage Partnership Finance,” “MPF,” “MPF Xtra,” “Downpayment Plus,” and “DPP” are registered trademarks of the Federal Home Loan Bank of Chicago.
4
Condensed Statements of Income | ||||||||||||||||||||||
(Dollars in millions) | ||||||||||||||||||||||
(Preliminary and Unaudited) | ||||||||||||||||||||||
For the three months ended June 30, | For the six months ended June 30, | |||||||||||||||||||||
2011 | 2010 | Change | 2011 | 2010 | Change | |||||||||||||||||
Interest income | $ | 569 | $ | 710 | (20 | )% | $ | 1,155 | $ | 1,382 | (16 | )% | ||||||||||
Interest expense | 439 | 517 | (15 | )% | 900 | 1,047 | (14 | )% | ||||||||||||||
Provision for credit losses | 3 | 5 | (40 | )% | 9 | 11 | (18 | )% | ||||||||||||||
Net interest income | 127 | 188 | (32 | )% | 246 | 324 | (24 | )% | ||||||||||||||
Other-than-temporary impairment (credit loss) | (23 | ) | (27 | ) | 15 | % | (43 | ) | (71 | ) | 39 | % | ||||||||||
Other non-interest gain (loss) | (20 | ) | 23 | 187 | % | (47 | ) | (39 | ) | (21 | )% | |||||||||||
Non-interest expense | 29 | 26 | 12 | % | 65 | 54 | 20 | % | ||||||||||||||
Assessments | 14 | 42 | (67 | )% | 24 | 43 | (44 | )% | ||||||||||||||
Net income | $ | 41 | $ | 116 | (65 | )% | $ | 67 | $ | 117 | (43 | )% | ||||||||||
Net yield on interest-earning assets | 0.65 | % | 0.88 | % | (0.23 | )% | 0.62 | % | 0.77 | % | (0.15 | )% | ||||||||||
Condensed Statements of Condition | |||||||||||
(Dollars in millions) | |||||||||||
(Preliminary and Unaudited) | |||||||||||
As of: | June 30, 2011 | December 31, 2010 | Change | ||||||||
Cash and due from banks | $ | 2,743 | $ | 282 | 873 | % | |||||
Federal Funds sold and securities purchased under agreement to resell | 1,374 | 7,243 | (81 | )% | |||||||
Investment securities | 39,186 | 38,996 | — | % | |||||||
Advances | 17,315 | 18,901 | (8 | )% | |||||||
MPF Loans held in portfolio, net | 16,075 | 18,294 | (12 | )% | |||||||
Other | 385 | 400 | (4 | )% | |||||||
Total assets | $ | 77,078 | $ | 84,116 | (8 | )% | |||||
Consolidated obligation discount notes | $ | 16,619 | $ | 18,421 | (10 | )% | |||||
Consolidated obligation bonds | 52,535 | 57,849 | (9 | )% | |||||||
Subordinated notes | 1,000 | 1,000 | — | % | |||||||
Other | 3,703 | 3,897 | (5 | )% | |||||||
Total liabilities | 73,857 | 81,167 | (9 | )% | |||||||
Capital stock | 2,352 | 2,333 | 1 | % | |||||||
Retained earnings | 1,165 | 1,099 | 6 | % | |||||||
Accumulated other comprehensive income (loss) | (296 | ) | (483 | ) | 39 | % | |||||
Total capital | 3,221 | 2,949 | 9 | % | |||||||
Total liabilities and capital | $ | 77,078 | $ | 84,116 | (8 | )% | |||||
Regulatory capital stock plus Designated Amount of subordinated notes (minimum required $3,600) | $ | 3,685 | $ | 3,863 | (5 | )% | |||||
Regulatory capital to assets ratio (minimum required 4.76%) | 6.29 | % | 5.90 | % | 0.39 | % | |||||
5
Remediation Dashboard
In order to provide our members with greater clarity as we work to transition the Bank, we regularly monitor our ratio of Market Value to Book Value, the level of our Retained Earnings, and our Spread of the Return of Average Regulatory Capital to Three-Month Libor. Together, these metrics provide a view of our progress in restructuring our business model and our balance sheet to fortify the financial strength of the Bank.
Ratio of Market Value to Book Value
The market value of the Bank continues to be positively impacted by our previous restructuring of the balance sheet and the increase in value of investment securities. The ratio of market value to book value improved from 85% at June 30, 2010, to 95% at June 30, 2011. This improvement reflects our efforts to remediate the Bank, which we believe will lead us to restore full liquidity to our stock in the future, subject to the approval of our regulator.

6
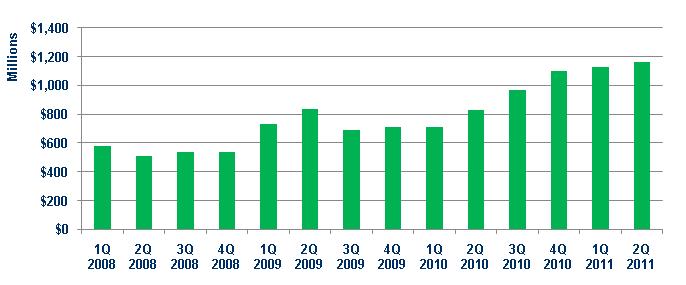
Retained Earnings
The growth of retained earnings is a key element in the Bank's plan to improve its financial strength and stability. Retained earnings at June 30, 2011, were $1.16 billion compared to $825 million at June 30, 2010.
Spread of Return on Average Regulatory Capital to Three-Month Libor
Over time, we have seen substantial variability in the spread of our return on average regulatory capital (which excludes subordinated notes) relative to three-month Libor. This measure is driven in large part by fluctuating gains and losses on derivatives and hedging activities and continuing OTTI charges. Our goal is to reduce the variability in this measure over time.

7