Attached files
| file | filename |
|---|---|
| 8-K - FORM 8-K - JONES LANG LASALLE INC | d8k.htm |
| EX-99.1 - PRESS RELEASE - JONES LANG LASALLE INC | dex991.htm |
 Supplemental Information
Second Quarter
Earnings Call
2011
EXHIBIT 99.2 |
 Market & Financial Overview |
 Capital
Value growth slowing
Capital Value
growth
accelerating
Capital Value
bottoming out
Capital Value
falling
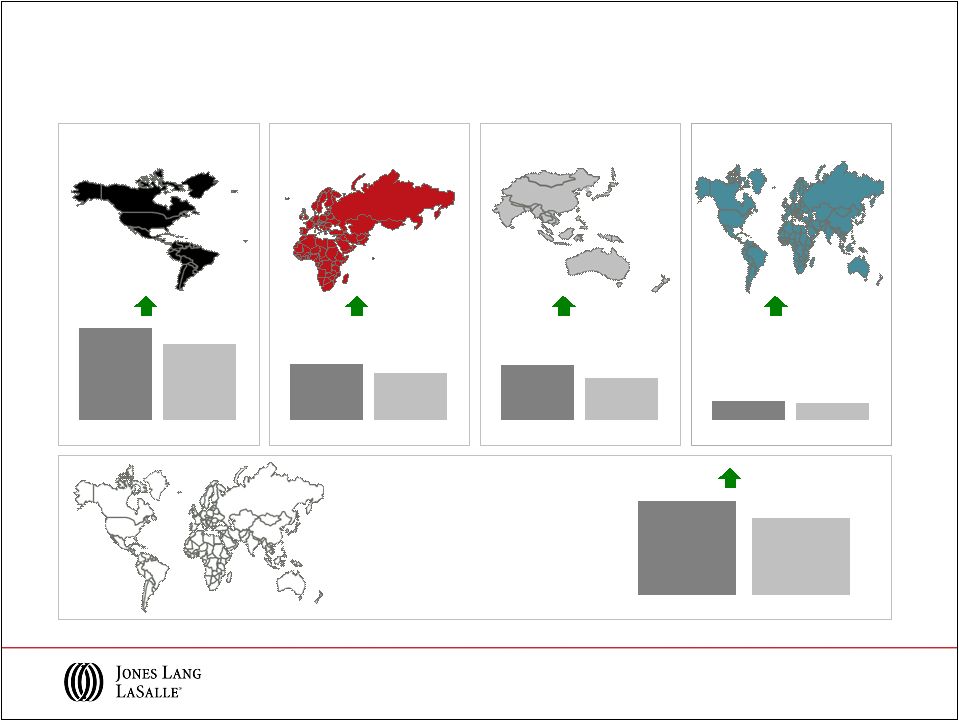
Capital Values
Q2 2011
As of Q2 2011
The
Jones
Lang
LaSalle
Property
Clocks
SM
Capital Value
growth slowing
Capital Value
growth
accelerating
Capital Value
bottoming out
Capital Value
falling
Q2 2010
Americas
EMEA
Asia Pacific
London
Washington DC
Toronto,
Seoul,
Singapore
Beijing
Hong Kong
Detroit,
Madrid
Atlanta,
Dallas,
Amsterdam
Brussels,
Stockholm
Mumbai,
Tokyo
Shanghai
Milan,
Sydney
New York, Sao Paulo
Moscow
Chicago, San Francisco
Berlin, Paris
Frankfurt
Atlanta, Dallas
Chicago, Toronto
Beijing
Sao Paulo, Washington DC
Amsterdam
New
York, Moscow
Singapore
San Francisco
Detroit
Berlin, Stockholm
Shanghai
Hong Kong
Brussels,
Seoul
Madrid,
Tokyo
Paris,
Sydney
Mumbai
London
Frankfurt, Milan
3 |
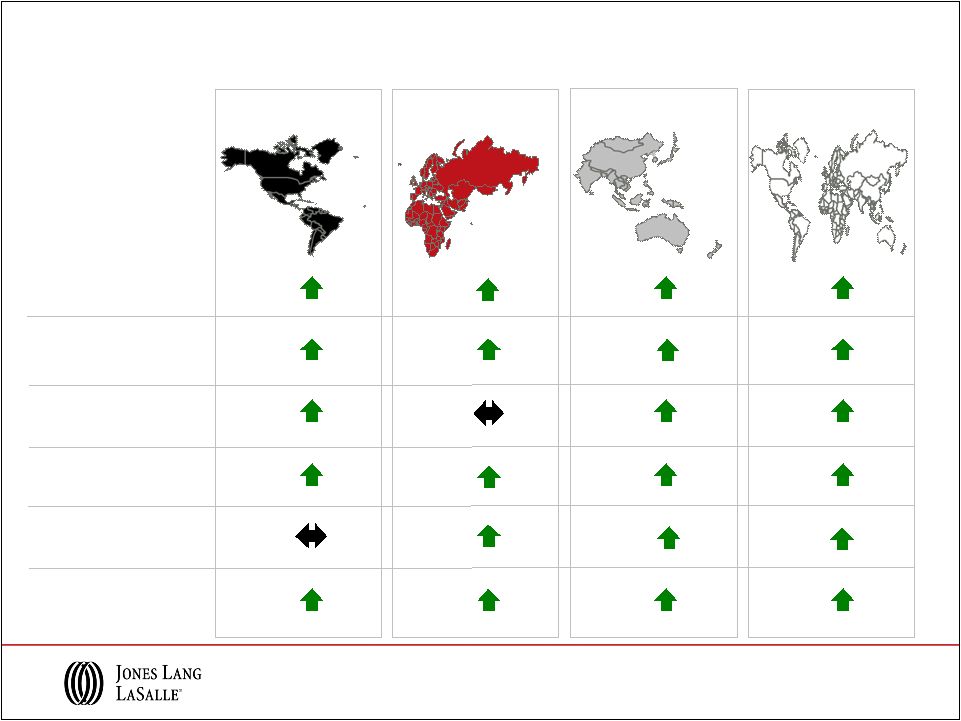
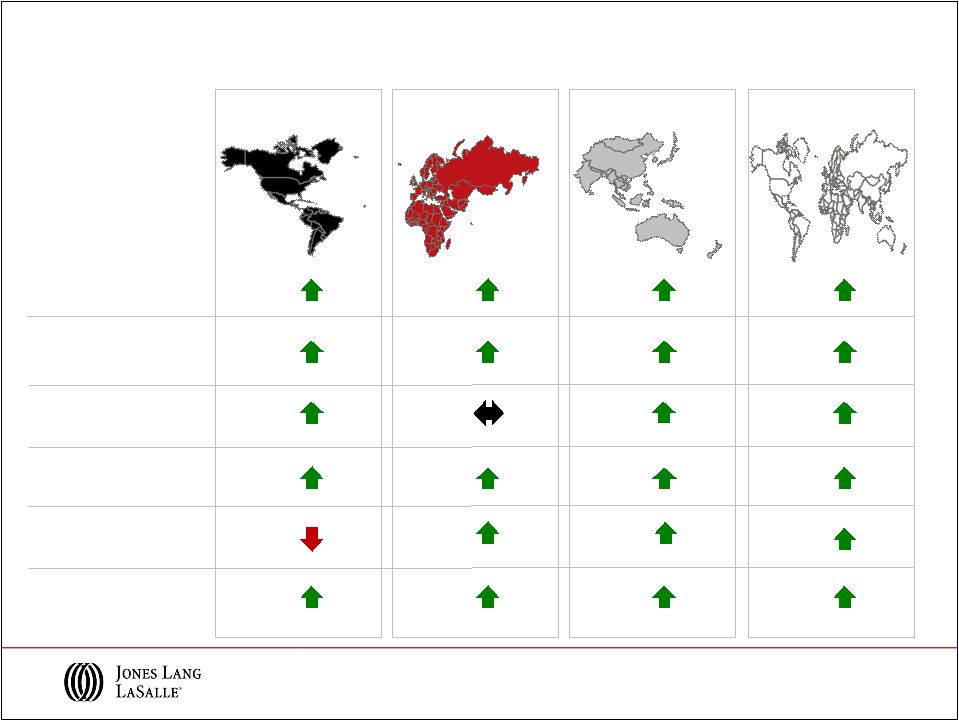
 Leasing Market Fundamentals
Q2 2011
As of Q2 2011
The
Jones
Lang
LaSalle
Property
Clocks
SM
Rental Value
growth slowing
Rental Value
growth
accelerating
Rental Values
bottoming out
Rental Values
falling
Q2 2010
Rental Value
growth slowing
Rental Value
growth
accelerating
Rental Values
bottoming out
Rental Values
falling
Americas
EMEA
Asia Pacific
Paris, Beijing
Hong
Kong
Sao Paulo
Shanghai
Washington DC
Dallas, Toronto
Rome,
Seoul
Detroit
Atlanta, Chicago
Los Angeles
New York
Stockholm, Tokyo
Brussels, Frankfurt, Milan
Berlin, Moscow
Mumbai, Sydney
London,
Singapore
Mexico City
Madrid
Dubai
Johannesburg
Amsterdam,
San Francisco
Dubai
Dallas
Frankfurt, Milan
Johannesburg
Detroit
San Francisco
New York, Beijing
Washington DC
Atlanta, Chicago
Rome, Tokyo
Los Angeles, Brussels
Sao Paulo,
Moscow
Mumbai
Mexico City
Hong Kong
Singapore
Shanghai
Sydney,
Berlin, Paris
Seoul
London
Madrid
Amsterdam
Stockholm
Toronto
4 |
 Q2 Selected Business Wins and Expansions
5
–
Apollo Group
–
8.5M sf
–
Pinchal
&
Company
portfolio
–
$240M
–
Bella
Vista
at
Hilltop,
Richmond
CA
–
$140M
–
Morgans
and
Royalton
Hotels,
New
York
–
$140M
–
Skadden
Arps,
Washington
DC
–
400K
sf
Americas
EMEA
Asia Pacific
–
Doosan Power Systems Limited
–
2.5M sf
–
Suomi Life Assurance, Helsinki
–
€122M
–
Mubarak Al Hassawi Medical City, UAE
–
€175M
–
Businesspark Kienberg, Berlin
–
1.1M sf
–
Magelan
Shopping
Centre,
Ukraine
–
1M
sf
–
DIISR,
Australia
–
1M
sf
–
Northland
Centre,
Melbourne
–
481M
–
Mafatlal
Industries,
Mumbai
–
$136M
–
Ayers Rock Resort, Australia
–
$325M
–
Waterfront
Place/Eagle
Street
Pier,
Brisbane
–
$248M
–
Morgan
Stanley,
Tokyo
–
350K
sf
–
Credit Suisse, Singapore
–
300K sf
–
Rialto
Complex,
Melbourne
–
904K
sf
–
Aviva Tower, London
–
£288M
–
Piccadilly
Estates,
London
–
£130M
–
Wells Fargo, Chicago
–
293K sf
–
Twitter, San Francisco
–
215K sf |
 Financial Information |
 7
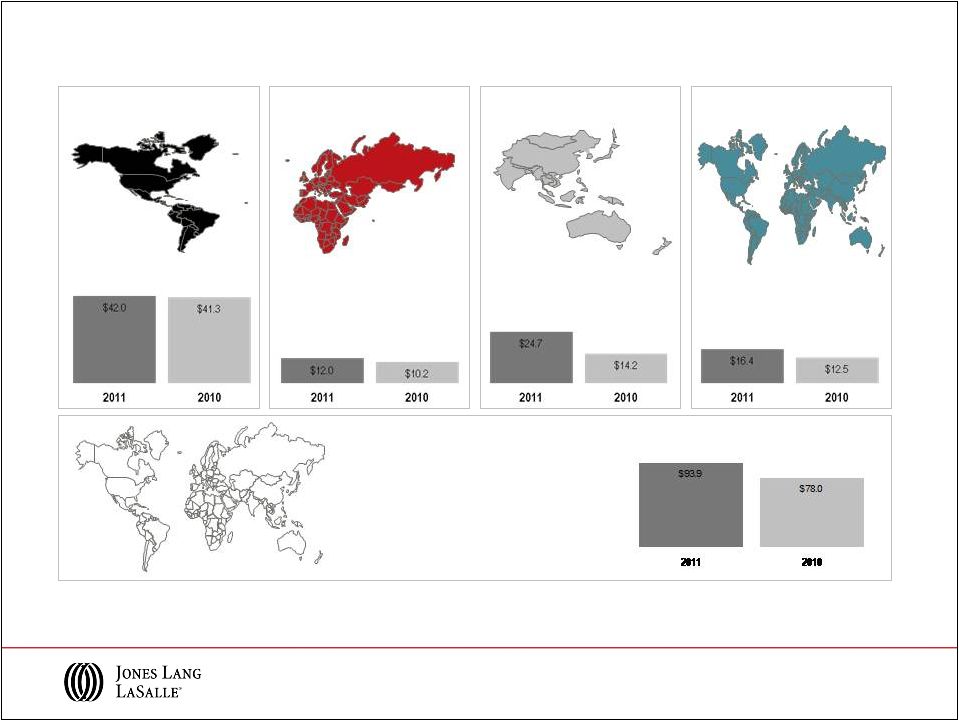
Q2 2011 Revenue Performance
Note: Equity earnings (losses) of $4.2M and ($2.8M) in 2011 and 2010, respectively,
are included in segment results, however, are excluded from Consolidated
totals. Americas
EMEA
Asia Pacific
Consolidated
($ in millions, % change in USD)
LIM
18%
28%
39%
21%
24% |
 Asia
Pacific 8
Q2 2011 Real Estate Services Revenue
Americas
EMEA
Leasing
Capital Markets &
Hotels
Property & Facility
Management
Project &
Development Services
Advisory, Consulting
& Other
Total RES
Operating Revenue
$171.7
$31.7
$74.2
$40.8
$28.0
$346.4
13%
122%
19%
6%
(3%)
17%
$60.5
$38.1
$34.4
$46.2
$39.0
$218.2
29%
19%
(2%)
67%
34%
28%
$49.2
$33.8
$88.8
$20.2
$22.4
$214.4
36%
95%
25%
37%
44%
39%
$281.4
$103.6
$197.4
$107.2
$89.4
$779.0
20%
63%
17%
33%
25%
Total RES
Revenue
21%
Note: Segment and Consolidated Real Estate Services (“RES”) operating
revenue exclude Equity earnings (losses). ($ in millions; % change in USD )
|
 9
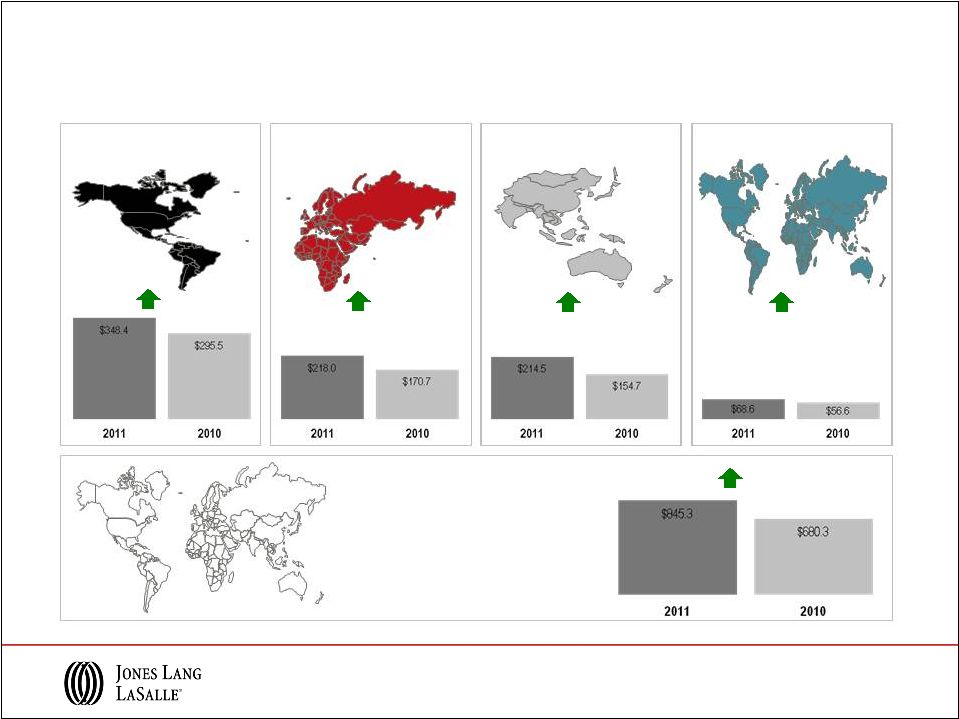
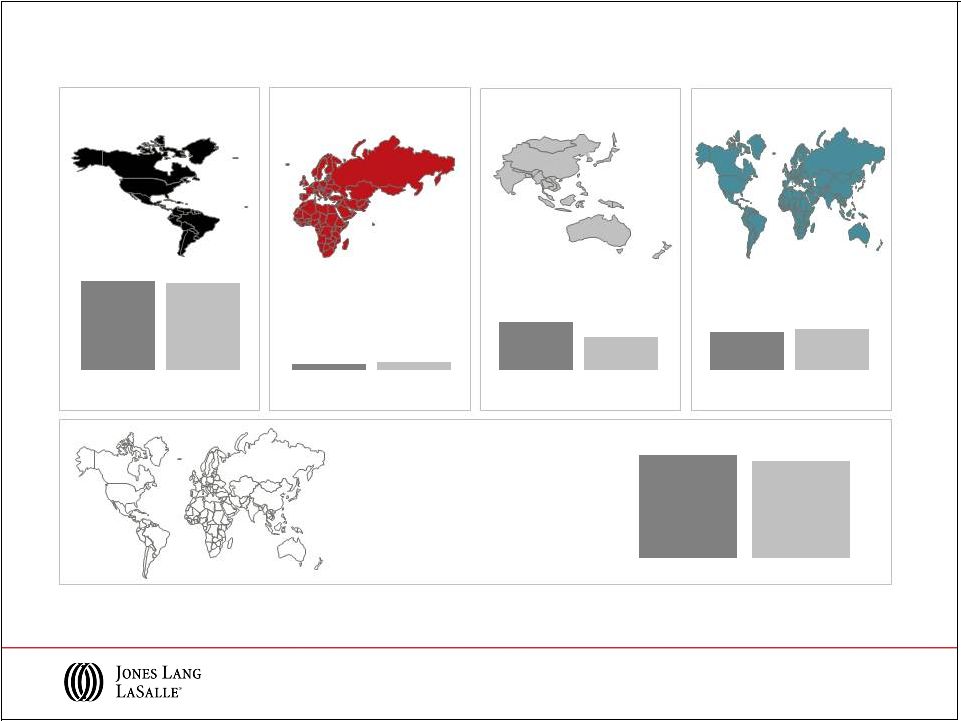
YTD 2011 Revenue Performance
Note: Equity earnings (losses) of $2.1M and ($8.9M) in 2011 and 2010, respectively,
are included in segment results, however, are excluded from Consolidated
totals. Americas
EMEA
Asia Pacific
LIM
$636.5
$523.9
2011
2010
Consolidated
$1,533.2
$1,261.0
2011
2010
22%
($ in millions; % change in USD )
$386.1
$322.2
2011
2010
$379.9
$290.3
2011
2010
$132.8
$115.7
2011
2010
21%
20%
31%
15% |
 Asia
Pacific 10
YTD 2011 Real Estate Services Revenue
($ in millions; % change in USD )
Americas
EMEA
Leasing
Capital Markets &
Hotels
Property & Facility
Management
Project &
Development Services
Advisory, Consulting
& Other
Total RES
Operating Revenue
$314.8
$51.5
$141.0
$78.0
$48.6
$633.9
22%
116%
17%
11%
(6%)
21%
$97.6
$66.7
$70.3
$84.6
$67.2
$386.4
14%
15%
1%
58%
22%
20%
$78.8
$51.5
$172.5
$38.3
$38.7
$379.8
28%
52%
24%
51%
26%
31%
$491.2
$169.7
$383.8
$200.9
$154.5
$1,400.1
21%
46%
17%
35%
12%
23%
Total RES
Revenue
Note: Segment and Consolidated Real Estate Services (“RES”) operating
revenue exclude Equity earnings (losses). |
 •
$2.3 billion of net new capital commitments in Q2 2011, primarily in
Public Securities
•
$3.8 billion of net new capital commitments raised YTD 2011
•
Announced acquisition of Trinity Funds Management, an Australian
property fund manager with ~$690 million of assets under management
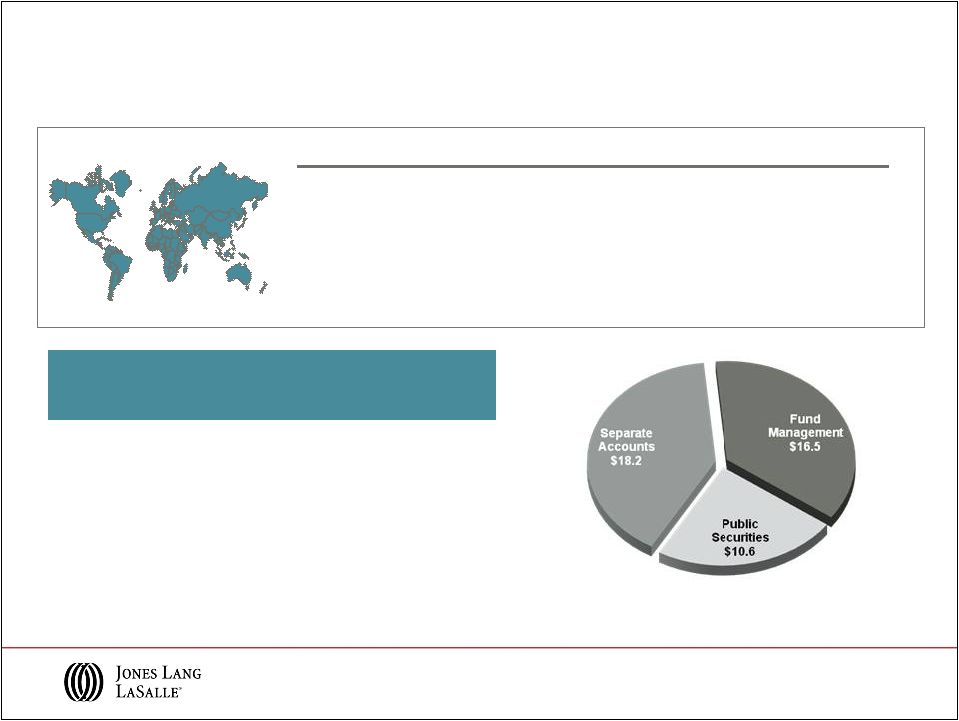
2011 YTD Highlights
Product
Assets Under
Management
($ in billions)
Average
Performance
Private Equity
U.K.
$12.2
Above benchmark
Continental Europe
$4.4
Return: >1x equity
North America
$10.5
Above benchmark
Asia Pacific
$7.6
Return: >1x equity
Public Securities
$10.6
Above benchmark
Total Q2 2011 AUM
$45.3 B
AUM by Fund type
Note: AUM data reported on a one-quarter lag
($ in billions)
11
A premier global investment manager
LaSalle Investment Management |
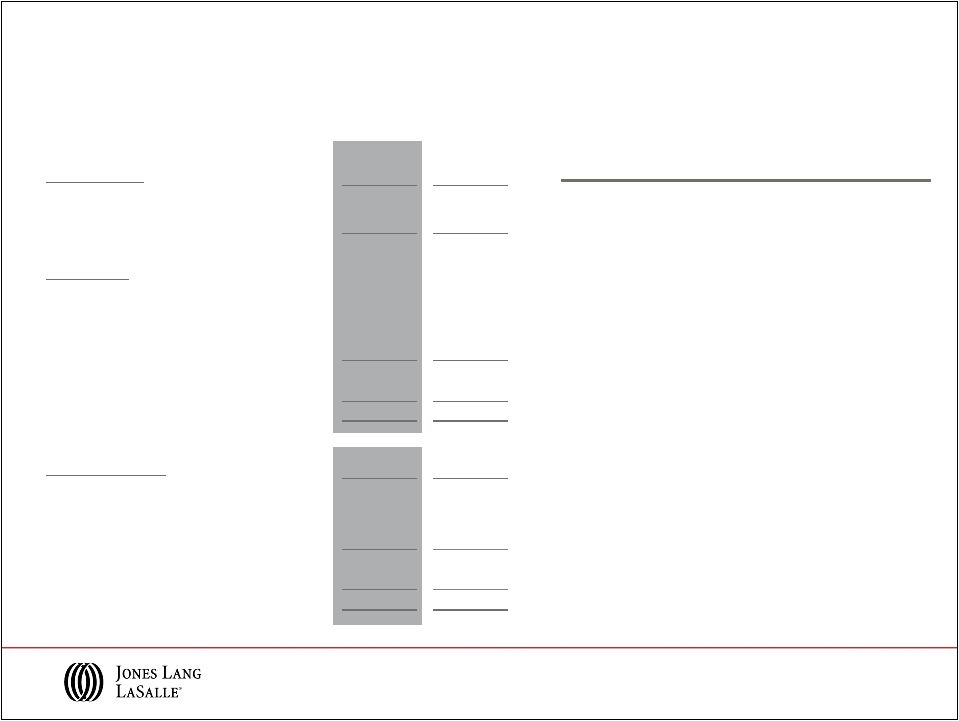 Solid Cash Flows and Balance Sheet Position
•
Funded King Sturge acquisition on
May 31, 2011
-
Total Purchase Price of ~$319 million;
$160 million paid upfront with
remainder paid over five years
•
Amended $1.1 billion credit facility
-
Pricing reset to LIBOR + 1.625%
-
Maturity extended to June 2016
-
EBITDA add backs for acquisition
related expenses
•
Investment grade ratings:
Standard & Poor’s:
BBB-
(Outlook: Stable)
Moody’s Investor Services:
Baa2
(Outlook:
Stable)
Cash Flows
Q2 2011
YTD
Q2 2010
YTD
Cash from Earnings
$123
$120
Working Capital
(259)
(200)
Cash used in Operations
($136)
($80)
Primary Uses
Capital Expenses
(1)
(36)
(14)
Acquisitions & Deferred Payment Obligations
(235)
(33)
Co-Investment
-
(11)
Dividends
(7)
(4)
Net Cash Outflows
($278)
($62)
Net Share Activity & Other Financing
(6)
(5)
Net Bank Debt (Borrowings) / Repayments
($420)
($147)
Balance Sheet
Q2 2011
Q2 2010
Cash
$96
$55
Short Term Borrowings
45
64
Credit Facility
444
268
Net Bank Debt
$393
$277
Deferred Business Obligations
439
371
Total Net Debt
$832
$648
($ in millions)
(1)
Year-to-date capital expenditures for June 30, 2011 and 2010, net of tenant
improvement allowances received, were $34 million and $12 million,
respectively. Q2 2011 Highlights
12 |
 Appendix |
 14
Q2 2011 Adjusted EBITDA* Performance
Americas
EMEA
Asia Pacific
LIM
Consolidated
* Refer
to
slide
16
for
Reconciliation
of
GAAP
Net
Income
to
adjusted
EBITDA
for
the
three
months
ended
June
30,
2011,
and
2010,
for
details
relative
to
these
adjusted
EBITDA
calculations. Segment EBITDA is calculated by adding the segment’s Depreciation
and amortization to its reported Operating income, which excludes Restructuring and
acquisition charges. Consolidated adjusted EBITDA is the sum of the EBITDA of the four
segments less net income attributable to non-controlling interests and dividends on
unvested common stock.
($ in millions) |
 15
YTD 2011 Adjusted EBITDA* Performance
Americas
EMEA
Asia Pacific
LIM
$60.6
$59.3
2011
2010
Consolidated
$122.2
$115.0
2011
2010
* Refer to slide 16 for Reconciliation of GAAP Net Income to adjusted EBITDA for the
six months ended June 30, 2011, and 2010, for details relative to these adjusted EBITDA
calculations. Segment EBITDA is calculated by adding the segment’s Depreciation
and amortization to its reported Operating income, which excludes Restructuring and acquisition
charges. Consolidated adjusted EBITDA is the sum of the EBITDA of the four segments
less net income attributable to non-controlling interest and, dividends on unvested
common stock.
($ in millions)
$3.8
$5.3
2011
2010
$33.1
$22.8
2011
2010
$26.0
$28.1
2011
2010 |
 16
($ in millions)
Reconciliation of GAAP Net Income to Adjusted EBITDA
Three Months Ended
June 30,
Six Months Ended
June 30,
2011
2010
2011
2010
Net income attributable to common
shareholders
$43.9
$31.8
$45.3
$32.0
Add:
Interest expense, net of interest income
9.6
12.9
17.5
24.3
Provision for income taxes
15.0
9.6
15.6
9.7
Depreciation and amortization
19.3
17.5
37.7
35.2
EBITDA
$ 87.8
$ 71.8
$ 116.1
$ 101.2
Restructuring and acquisition charges
6.1
4.0
6.1
5.1
Non-cash co-investment charges
-
2.2
-
8.7
Adjusted EBITDA
$ 93.9
$ 78.0
$ 122.2
$ 115.0
|
 17
($ in millions)
Reconciliation of GAAP Net Income to Adjusted Net Income
Three Months Ended
June 30,
Six Months Ended
June 30,
2011
2010
2011
2010
GAAP Net income attributable to common
shareholders
$ 43.9
$ 31.8
$ 45.3
$ 32.0
Shares (in 000s)
44,473
44,250
44,391
44,085
GAAP earnings per share
$ 0.99
$ 0.72
$ 1.02
$ 0.73
GAAP Net income attributable to common
shareholders
$ 43.9
$ 31.8
$ 45.3
$ 32.0
Restructuring and acquisition charges, net
4.6
3.1
4.6
3.9
Intangible amortization, net
1.2
-
1.2
-
Non-cash co-investment charges, net
-
1.7
-
6.7
Adjusted net income
$ 49.7
$ 36.6
$ 51.1
$ 42.6
Shares (in 000s)
44,473
44,250
44,391
44,085
Adjusted earnings per share
$ 1.12
$ 0.83
$ 1.15
$ 0.97 |
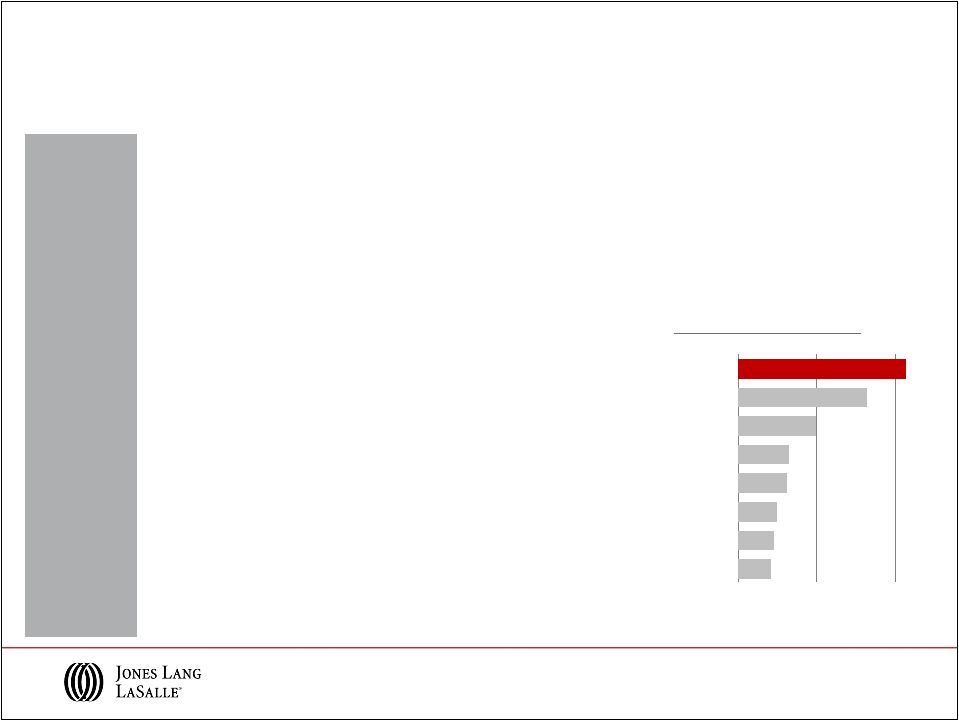 •
Strengthens JLL’s leading position in both the UK and EMEA markets
-
London
is
a
mature
and
highly
transparent
market;
#1
destination
of
international
capital
the
last
two years
•
Complementary service offerings; each firm brings important strengths
-
Clients benefit from powerful combined Capital
Markets team with access to JLL’s global platform
-
Depth and scale added to services including
industrial, global logistics, and retail
-
King Sturge’s Advisory and Property Management
businesses complement JLL and increase
EMEA’s resiliency to economic cycles
-
King Sturge's strong high-end London residential
platform gains access to JLL's market leading
Asian network
Source: PropertyEU Research, PropertyEU Magazine May 2011
Based on European investment transactions in excess of €20 million in 2010.
Strategic
Rationale
-
King Sturge was Property Week’s U.K. Investment Agency of the Year; Jones Lang
LaSalle was Property Week’s U.K. Office Agent of the Year
4.2
4.6
4.9
6.2
6.4
9.8
16.4
21.4
€ 0
€ 10
€ 20
Jones Lang LaSalle /
King Sturge
CB Richard Ellis
Cushman & Wakefield
Savills
Catela Property Group
Colliers International
BNP Paribas
DTZ
European Investment Volume
(€
in billions)
18
Local and Regional Services
King Sturge secures market leadership |
 •
JLL and King Sturge merged operations on May 31, 2011
•
Purchase price £197 million ($319 million) with a five-year deferred payment
structure •
Operating margins, ex-transaction related charges, strongly accretive to the
higher end of JLL EMEA’s medium-term Operating Income Margin target of
8-10% Transaction
Highlights
Note: Assumes GBP/USD conversion rate of 1.62
King Sturge
Overview
•
King Sturge is a market-leading London-based mixed property services
business -
Over 85 partners and approximately 1,600 employees, over 1,300 U.K. based
•
Client focused, strong team ethic and highly respected in the market
•
Annual revenue approximately £160 million ($259 million)
-
U.K. revenue over 85%
19
King Sturge Overview
A merger of equals in EMEA
Total Forecast
Q2 2011
Approximate Timing
Integration Expense
$25 million
$3 million
Majority in the first 12 months
Retention Cost
$25 million
$3 million
2/3 in the first twelve months;
1/3 in the following twelve months
Intangible Amortization
$32 million
$2 million
$15 million in the first 12 months;
$2 million/ year thereafter
Anticipated
Transaction
Costs |