Attached files
| file | filename |
|---|---|
| 8-K - CURRENT REPORT ON FORM 8-K - PACCAR INC | d8k.htm |

|
PACCAR Inc Public Affairs Department P.O. Box 1518 Bellevue, WA 98009 |
| Contact: | Robin Easton (425) 468-7676
|
FOR IMMEDIATE RELEASE
PACCAR Announces Increased Second Quarter Revenues and Earnings
July 26, 2011, Bellevue, Washington – “PACCAR reported improved revenues and net income for the second quarter of 2011,” said Mark Pigott, chairman and chief executive officer. “PACCAR’s results reflect the benefits of stronger truck sales in North America and Europe and an improvement in aftermarket parts sales and financial services worldwide. Strong worldwide truck industry demand and a robust increase in truck build rates have created challenges for some suppliers. PACCAR is working closely with its suppliers to increase their production capacity in the next several months,” Pigott added.
“PACCAR’s excellent balance sheet, including $2.85 billion in manufacturing cash and marketable securities, and positive operating cash flow have enabled ongoing investments which extend PACCAR’s geographic footprint, enhance operating efficiency and support the development of innovative new products. These investments will contribute to the company’s long-term growth,” said Pigott. “I am very proud of our 22,000 employees who have delivered excellent results to our shareholders as the industry rebounds from the recession.”
PACCAR earned $239.7 million ($0.65 per diluted share) for the second quarter of 2011 compared to $99.6 million ($0.27 per diluted share) earned in the second quarter last year. Second quarter net sales and financial services revenues were $3.96 billion, compared to $2.46 billion reported in 2010. Net sales and financial services revenues for the first six months of 2011 were $7.24 billion, up 54 percent compared to $4.69 billion last year. For the first six months of 2011, PACCAR reported net income of $433.0 million ($1.18 per diluted share), more than double the $167.9 million ($0.46 per diluted share) in 2010.
PACCAR Increases Quarterly Dividend
PACCAR announced on July 11, 2011, that it increased its regular quarterly dividend by 50 percent, to eighteen cents ($.18) per share from twelve cents ($.12), for shareholders of record on August 18, 2011. The increased dividend will be paid September 6, 2011.
Global Truck Markets
DAF achieved a market share of 15.3 percent in the above 15-tonne market in the first half of 2011. “DAF’s medium-term market share goal is 20 percent. Over the last two years, DAF has been the market share leader in the European tractor market as fleets recognize DAF’s quality leadership, low operating costs and excellent resale value,” said Harrie Schippers, DAF president. “Our estimate for 2011 industry sales in the above 15-tonne truck market in Europe is 230,000-250,000 units.”
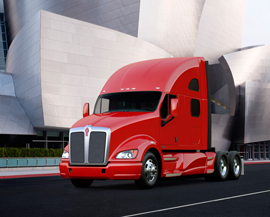
The Kenworth T700 Earned the ATD Heavy Duty
Commercial Truck of the Year Award in 2011
“Class 8 industry retail sales in the U.S. and Canada are expected to be in the range of 180,000-200,000 vehicles in 2011. We have lowered the range due to the uneven economic recovery and supplier capacity constraints, especially tires and chassis components. The good news is that industry suppliers are investing in their facilities to meet increased market demands. Our customers are benefiting from higher freight tonnage and improved fleet utilization rates, resulting in strong growth of our aftermarket parts sales,” said Dan Sobic, PACCAR executive vice president. “For the first half of 2011, PACCAR achieved a Class 8 retail market share in the U.S. and Canada of 26.7 percent, an increase from the 24.1 percent achieved for the year 2010.”
Financial Highlights – Second Quarter 2011
Highlights of PACCAR’s financial results for the second quarter of 2011 include:
| • | Consolidated sales and revenues of $3.96 billion. |
| • | Net income of $239.7 million. |
| • | Manufacturing cash and marketable securities of $2.85 billion. |
| • | Record stockholders’ equity of $5.91 billion. |
| • | Cash generated from operations of $332.7 million. |
| • | Financial Services pretax income of $56.9 million. |
| • | Research and development expenses of $77.5 million. |
| • | $2.0 billion of bank credit facilities renewed. |
Financial Highlights – First Half 2011
Financial highlights for the first six months of 2011 include:
| • | Consolidated sales and revenues of $7.24 billion. |
| • | Net income of $433.0 million. |
| • | Cash generated from operations of $792.0 million. |
| • | Financial Services pretax income of $107.2 million. |
| • | Research and development expenses of $145.9 million. |
| • | Medium-term note (MTN) issuances of $482 million. |
| • | Capital investments of $193 million. |
Global Business Opportunities
“PACCAR launched the DAF CF range in the Andean region of South America in the first half of 2011. The model range will be further enhanced by the introduction of the DAF LF range in the second half of the year. In addition, we are nearing selection of a site in Brazil for a DAF assembly facility. The South American truck markets are growing and will provide excellent long-term opportunities for PACCAR,” said Bob Christensen, PACCAR executive vice president.

DAF XF105 in Moscow, Russia
In May, DAF Trucks opened a new marketing and sales office in Moscow to enhance DAF’s growth in the Russian market. The DAF subsidiary will focus on marketing and sales activities as well as the further expansion of the DAF dealer network. DAF’s expansion in Russia will complement the sales of Kenworth trucks, which have been sold there for over 30 years.
Environmental Leadership
“PACCAR is a leader in the development of environmentally friendly technologies,” said Bob Christensen, PACCAR executive vice president. “All PACCAR manufacturing facilities have earned the prestigious ISO 14001 environmental certification. This distinction recognizes that the facilities have implemented rigorous energy-saving measures and innovative design features. Many PACCAR facilities in the U.S. and Europe have also successfully achieved ‘zero waste to land-fill’ status.”
Other positive environmental initiatives include:
| • | Peterbilt recently received an order for 200 Model 367 liquefied natural gas (LNG) vehicles. |
| • | The DAF LF hybrid began production in late 2010, resulting in good demand from customers in the Netherlands, U.K., Germany, France, Belgium and the Czech Republic. |
| • | For the third consecutive year, Kenworth’s manufacturing plant in Renton, Washington, received a Best Workplace for Recycling and Waste Reduction Award from King County. The award recognizes Kenworth’s outstanding efforts to reduce, reuse and recycle. |
Capital Investments, Product Development and Industry Recognition
PACCAR’s excellent long-term profits, strong balance sheet, and intense focus on quality, technology and productivity have enabled the company to invest $3.9 billion in capital projects, innovative products and new technologies during the past decade. Capital investments of $400-$500 million and R&D expenses of $275-$300 million are targeted in 2011 for new products and enhancing manufacturing operating efficiency. “Kenworth, Peterbilt and DAF are investing in new industry-leading products and services to enable our customers to achieve excellent results in their businesses,” said Ron Armstrong, PACCAR president.
Peterbilt Motors Company earned the highest ranking in customer satisfaction in the J.D. Power and Associates 2011 Heavy Duty Truck Customer Satisfaction StudySM* in the vocational segment. “Peterbilt’s vocational vehicles consistently exceed customer expectations in a wide variety of configurations and applications,” said Bill Jackson, Peterbilt general manager. “We are proud that Peterbilt’s superior customer satisfaction is reflected in the J.D. Power and Associates 2011 Study as customers rated Peterbilt’s vocational vehicles as the best in the industry.”
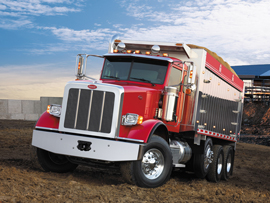
Peterbilt Model 367 Dump Truck
Kenworth Truck Company achieved the highest ranking in customer satisfaction among Class 8 truck owners in the Heavy Duty Dealer Service Segment, according to the recently released J.D. Power and Associates 2011 Heavy Duty Truck Customer Satisfaction StudySM*. “Kenworth is honored to receive the prestigious Heavy Duty Dealer Service Award from J.D. Power and
Associates,” said Gary Moore, Kenworth general manager. “Kenworth employees and dealers are committed to providing the highest quality service and The World’s Best trucks to customers.”
DAF Trucks was recently honored as one of the top 100 “Apprenticeship Employers” in the United Kingdom. DAF Trucks received the accolade for its highly-acclaimed National Dealer Apprentice Program, the largest program in the U.K. specializing in heavy-duty commercial vehicle repair and maintenance skills.
Financial Services Companies Achieve Good Results
PACCAR Financial Services (PFS) has a portfolio of 137,000 trucks and trailers, with total assets of $8.69 billion. PacLease, a major full-service truck leasing company in North America with a fleet of over 30,000 vehicles, is included in this segment. During the second quarter and first half of 2011, PFS profit increased due to better finance margins and reduced credit losses.
Second quarter pretax income improved to $56.9 million compared to $34.0 million earned in the second quarter of 2010. The provision for credit losses was $11.0 million in the second quarter compared to $17.4 million in the second quarter of 2010. Second quarter revenues were $258.0 million compared to $239.3 million in the same quarter of 2010. For the six-month period, pretax income was $107.2 million compared to $62.1 million in 2010. First-half revenues were $499.0 million, compared with $485.7 million for the same period a year ago. “Higher freight volumes have led to improved used truck prices worldwide, with values up 10-15 percent compared to a year ago. Our customers’ improved profitability has resulted in lower past-dues and credit losses compared to last year,” said Todd Hubbard, president, PACCAR Financial.
“PACCAR’s strong balance sheet, complemented by its A+/A1 credit ratings, enables PFS to offer competitive retail financing to Kenworth, Peterbilt and DAF dealers and customers,” said Bob Bengston, PACCAR vice president. “Strong credit quality, good margins and excellent portfolio management are generating improved earnings,” Bengston added. “We continue to enjoy excellent access to the commercial paper, medium-term note and syndicated loan markets, allowing PFS to profitably support the sale of PACCAR trucks in 20 countries on three continents.”
PACCAR is a global technology leader in the design, manufacture and customer support of high-quality light-, medium-, and heavy-duty trucks under the Kenworth, Peterbilt and DAF nameplates. PACCAR also designs and manufactures advanced diesel engines, provides financial services and information technology and distributes truck parts related to its principal business.
PACCAR will hold a conference call with securities analysts to discuss second quarter earnings on July 26, 2011, at 9:00 a.m. Pacific time. Interested parties may listen to the call by selecting “Live Webcast” at PACCAR’s homepage. The Webcast will be available on a recorded basis through August 5, 2011. PACCAR shares are listed on NASDAQ Global Select Market, symbol PCAR, and its homepage can be found at www.paccar.com.
This release contains “forward-looking statements” within the meaning of the Private Securities Litigation Reform Act. These statements are based on management’s current expectations and are subject to uncertainty and changes in circumstances. Actual results may differ materially from those included in these statements due to a variety of factors. More information about these factors is contained in PACCAR’s filings with the Securities and Exchange Commission.
| * | J.D. Power and Associates 2011 Heavy Duty Truck Studysm. Study was based on 1,651 responses from principal maintainers of heavy-duty trucks. For more information please go to www.jdpower.com. |
# # #
PACCAR Inc
SUMMARY INCOME STATEMENTS
(in millions except per share amounts)
| Three Months Ended June 30 |
Six Months Ended June 30 |
|||||||||||||||
| 2011 | 2010 | 2011 | 2010 | |||||||||||||
| Truck and Other: |
||||||||||||||||
| Net sales and revenues |
$ | 3,702.7 | $ | 2,224.8 | $ | 6,745.3 | $ | 4,209.1 | ||||||||
| Cost of sales and revenues |
3,231.1 | 1,954.9 | 5,863.4 | 3,722.7 | ||||||||||||
| Research and development |
77.5 | 58.4 | 145.9 | 113.2 | ||||||||||||
| Selling, general and administrative |
108.6 | 97.3 | 218.5 | 191.4 | ||||||||||||
| Interest and other (income) expense, net |
(.9 | ) | 3.9 | 3.1 | 8.1 | |||||||||||
| Truck and Other Income Before Income Taxes |
286.4 | 110.3 | 514.4 | 173.7 | ||||||||||||
| Financial Services: |
||||||||||||||||
| Revenues |
258.0 | 239.3 | 499.0 | 485.7 | ||||||||||||
| Interest and other |
165.5 | 165.4 | 322.5 | 343.8 | ||||||||||||
| Selling, general and administrative |
24.6 | 22.5 | 47.8 | 44.0 | ||||||||||||
| Provision for losses on receivables |
11.0 | 17.4 | 21.5 | 35.8 | ||||||||||||
| Financial Services Income Before Income Taxes |
56.9 | 34.0 | 107.2 | 62.1 | ||||||||||||
| Investment income |
9.9 | 4.3 | 17.9 | 8.8 | ||||||||||||
| Total Income Before Income Taxes |
353.2 | 148.6 | 639.5 | 244.6 | ||||||||||||
| Income taxes |
113.5 | 49.0 | 206.5 | 76.7 | ||||||||||||
| Net Income |
$ | 239.7 | $ | 99.6 | $ | 433.0 | $ | 167.9 | ||||||||
| Net Income Per Share: |
||||||||||||||||
| Basic |
$ | .66 | $ | .27 | $ | 1.18 | $ | .46 | ||||||||
| Diluted |
$ | .65 | $ | .27 | $ | 1.18 | $ | .46 | ||||||||
| Weighted Average Shares Outstanding: |
||||||||||||||||
| Basic |
365.9 | 364.9 | 365.8 | 364.7 | ||||||||||||
| Diluted |
367.2 | 366.0 | 367.2 | 365.9 | ||||||||||||
| Dividends declared per share |
$ | .12 | $ | .09 | $ | .24 | $ | .18 | ||||||||
PACCAR Inc
CONDENSED BALANCE SHEETS
(in millions)
| June 30 2011 |
December 31 2010 |
|||||||
| ASSETS |
||||||||
| Truck and Other: |
||||||||
| Cash and marketable debt securities |
$ | 2,853.4 | $ | 2,432.5 | ||||
| Trade and other receivables, net |
971.4 | 610.4 | ||||||
| Inventories |
742.7 | 534.0 | ||||||
| Property, plant, and equipment, net |
1,818.9 | 1,673.7 | ||||||
| Equipment on operating lease and other |
1,225.8 | 1,105.3 | ||||||
| Financial Services Assets |
8,688.8 | 7,878.2 | ||||||
| $ | 16,301.0 | $ | 14,234.1 | |||||
| LIABILITIES AND STOCKHOLDERS’ EQUITY |
||||||||
| Truck and Other: |
||||||||
| Accounts payable, deferred revenues and other |
$ | 3,553.0 | $ | 2,634.1 | ||||
| Long-term debt |
150.0 | 150.0 | ||||||
| Financial Services Liabilities |
6,684.0 | 6,092.2 | ||||||
| STOCKHOLDERS’ EQUITY |
5,914.0 | 5,357.8 | ||||||
| $ | 16,301.0 | $ | 14,234.1 | |||||
| Common Shares Outstanding |
365.5 | 365.3 | ||||||
GEOGRAPHIC REVENUE DATA
| Three Months Ended | Six Months Ended | |||||||||||||||
| June 30 | June 30 | |||||||||||||||
| 2011 | 2010 | 2011 | 2010 | |||||||||||||
| United States and Canada |
$ | 2,077.7 | $ | 1,216.4 | $ | 3,666.4 | $ | 2,367.8 | ||||||||
| Europe |
1,313.3 | 794.4 | 2,492.3 | 1,562.5 | ||||||||||||
| Other |
569.7 | 453.3 | 1,085.6 | 764.5 | ||||||||||||
| $ | 3,960.7 | $ | 2,464.1 | $ | 7,244.3 | $ | 4,694.8 | |||||||||
PACCAR Inc
CONDENSED CASH FLOW STATEMENTS
(in millions)
| Six Months Ended June 30 |
2011 | 2010 | ||||||
| OPERATING ACTIVITIES: |
||||||||
| Net income |
$ | 433.0 | $ | 167.9 | ||||
| Depreciation and amortization: |
||||||||
| Property, plant and equipment |
97.2 | 93.7 | ||||||
| Equipment on operating leases and other |
234.2 | 223.1 | ||||||
| Net (increase) decrease in wholesale receivables on new trucks |
(210.3 | ) | 77.4 | |||||
| Net decrease in sales-type finance leases and dealer direct loans on new trucks |
19.7 | 88.3 | ||||||
| All other operating activities |
218.2 | 149.1 | ||||||
|
|
|
|
|
|||||
| Net Cash Provided by Operating Activities |
792.0 | 799.5 | ||||||
| INVESTING ACTIVITIES: |
||||||||
| Acquisition of property, plant and equipment |
(117.5 | ) | (47.8 | ) | ||||
| Acquisition of equipment for operating leases |
(718.0 | ) | (327.5 | ) | ||||
| Net (increase) decrease in financial services receivables |
(165.6 | ) | 237.1 | |||||
| Net increase in marketable securities |
(565.9 | ) | (77.4 | ) | ||||
| All other investing activities |
165.1 | 202.6 | ||||||
|
|
|
|
|
|||||
| Net Cash Used in Investing Activities |
(1,401.9 | ) | (13.0 | ) | ||||
| FINANCING ACTIVITIES: |
||||||||
| Cash dividends paid |
(87.7 | ) | (65.5 | ) | ||||
| Stock compensation transactions |
4.4 | 7.6 | ||||||
| Net increase (decrease) in debt |
446.0 | (616.4 | ) | |||||
|
|
|
|
|
|||||
| Net Cash Provided by (Used in) Financing Activities |
362.7 | (674.3 | ) | |||||
| Effect of exchange rate changes on cash |
79.0 | (126.1 | ) | |||||
|
|
|
|
|
|||||
| Net Decrease in Cash and Cash Equivalents |
(168.2 | ) | (13.9 | ) | ||||
| Cash and cash equivalents at beginning of period |
2,040.8 | 1,912.0 | ||||||
|
|
|
|
|
|||||
| Cash and cash equivalents at end of period |
$ | 1,872.6 | $ | 1,898.1 | ||||
|
|
|
|
|
|||||