Attached files
| file | filename |
|---|---|
| 8-K - 8-K - CATERPILLAR INC | a11-20592_18k.htm |
| EX-99.2 - EX-99.2 - CATERPILLAR INC | a11-20592_1ex99d2.htm |
EXHIBIT 99.1
Caterpillar Inc.
2Q 2011 Earnings Release
July 22, 2011
FOR IMMEDIATE RELEASE
Caterpillar Second-Quarter Sales and Revenues up 37 Percent; 2011 Outlook Improves for
Sales and Revenues and Profit Excluding Bucyrus-related Impacts
Second-quarter Profit Per Share up 58 percent at $1.72 excluding Bucyrus-related impacts
and up 39 percent at $1.52 including Bucyrus-related impacts
PEORIA, Ill.— With continuing improvement in demand around the world, Caterpillar Inc. (NYSE: CAT) today reported second-quarter 2011 profit per share of $1.72 excluding $204 million of expense related to the acquisition of Bucyrus, a 58-percent improvement from $1.09 in the second quarter of 2010. Including the impact of Bucyrus, profit per share was $1.52, up 39 percent from the second quarter of 2010. Profit was $1.015 billion in the second quarter of 2011, an increase of 44 percent from $707 million in the second quarter of 2010. Sales and revenues of $14.230 billion were up 37 percent from $10.409 billion a year ago.
“Customer demand around the world continues to improve, and our sales and revenues reached an all-time record in the second quarter. Our employees, dealers and suppliers should feel great about the way they’re responding to the increase in customer demand,” said Chairman and Chief Executive Officer Doug Oberhelman.
“We’re currently focused on four big themes linked to our corporate strategy. The first is executing the Cat business model and improving value for our customers. We’re doing that in a number of ways—improving quality, executing the Caterpillar Production System and the development of new products and solutions—such as our new range of products for Tier 4 emissions. The second theme is increasing capacity and production levels to satisfy the demand we see today and what’s down the road as the global economy continues to improve over the next few years. We’ve announced many significant investments in the United States and around the world over the past year and are expecting capital expenditures of about $3 billion in 2011. Demand growth and our investments through the end of June have resulted in more than 27,000 additional people in our global workforce since the beginning of 2010. We expect to continue hiring in 2011, including at our brand new U.S. facilities in Texas, Indiana, North Carolina and Ohio,” Oberhelman said.
(more)
“The third important theme is our focus on costs. There are certainly cost pressures in our business—freight and material costs are up, and our investments in R&D and capacity are driving increases. That said, we’re serious about improving the value of our products and services to customers and delivering great returns to stockholders, and that means we must stay focused on controlling costs. It’s a major priority, and it will continue. The disaster in Japan had a $200 million negative impact on second-quarter sales, was negative on costs and efficiency and lowered operating profit nearly $60 million. However, the negative impacts from Japan are now behind us,” Oberhelman added.
“Our fourth major theme is integrating and delivering the value we expect from our recent acquisitions of EMD and Bucyrus. We completed our historic acquisition of Bucyrus on July 8, 2011, and are pleased to welcome 10,000 new employees to Caterpillar. The acquisition of Bucyrus was driven by the robust long-term growth opportunities expected in mining. The acquisition, combined with our aggressive product development, significant capacity expansion plans and the strength of our dealer network positions us with the industry’s broadest range of surface and underground mining products and solutions to serve mining customers around the world. We are thrilled that Bucyrus is now Caterpillar,” Oberhelman added.
Outlook
Because we have completed the Bucyrus acquisition, our outlook includes an estimate of Bucyrus-related impacts. However, to provide a more consistent comparison with 2010 and our previous outlook, we are also providing our 2011 outlook excluding the impact of Bucyrus. Excluding the impact of Bucyrus, we are raising expectations for 2011. We expect sales and revenues in a range of $54 to $56 billion and profit per share of $6.75 to $7.25. That is an improvement from our previous outlook of $52 to $54 billion of sales and revenues and profit per share of $6.25 to $6.75.
Our 2011 financial results will include about a half year of Bucyrus results and most of the up-front and integration costs related to the acquisition. We expect that Bucyrus will add about $2 billion of sales in 2011 and negatively impact full-year profit by about $0.50 per share. In total, including Bucyrus, we expect sales and revenues in a range of $56 to $58 billion and profit per share of $6.25 to $6.75.
“While the economic recovery in the United States continues to be weaker than many expected, we’re forecasting continued moderate economic expansion. That, coupled with stronger growth in the developing world, is driving higher sales for Caterpillar. There’s been quite a bit of concern in the media over the past few months centered on China. While we’ve seen some softening of growth in China, dealer deliveries to end users were up in the second quarter of 2011 compared with the second quarter of last year and grew at a faster rate than the overall industry in China. In our view, China is doing a good job of balancing growth and inflation, and our expectations for China remain positive. That said, we can’t lose sight of the significant growth that’s going on
around the world outside the United States and China. Economic activity and our business in Latin America, the Middle East, Africa, CIS and greater Asia are robust,” Oberhelman added.
“While we expect moderate U.S. economic growth, we believe a lack of confidence in the business climate is the major impediment to a stronger recovery and job creation. Lack of clarity on a U.S. deficit reduction plan, trade policy, regulation, much needed tax reform and the absence of a long-term plan to improve the country’s deteriorating infrastructure do not create an environment that provides our customers with the confidence to invest. We’re confident that as a country we’ll eventually get it right, and we’re positioning Caterpillar to be ready when we do. The scale of investment in our existing businesses coupled with our recent acquisitions put us in a unique position for growth and leadership as we drive forward to meet our 2015 goals,” Oberhelman said.
Notes:
· Glossary of terms is included on pages 22-23; First occurrence of terms shown in bold italics.
· Information on non-GAAP financial measures is included on page 24.
For more than 85 years, Caterpillar Inc. has been making sustainable progress possible and driving positive change on every continent. With 2010 sales and revenues of $42.588 billion, Caterpillar is the world’s leading manufacturer of construction and mining equipment, diesel and natural gas engines, industrial gas turbines and diesel-electric locomotives. The company also is a leading services provider through Caterpillar Financial Services, Caterpillar Remanufacturing Services, Caterpillar Logistics Services and Progress Rail Services. More information is available at: http://www.caterpillar.com.
Caterpillar contact: Jim Dugan, Corporate Public Affairs, (309) 494-4100 (Office) or (309) 360-7311 (Mobile)
FORWARD-LOOKING STATEMENTS
Certain statements in this release relate to future events and expectations and are forward-looking statements within the meaning of the Private Securities Litigation Reform Act of 1995. These statements are subject to known and unknown factors that may cause Caterpillar’s actual results to be different from those expressed or implied in the forward-looking statements. Words such as “believe,” “estimate,” “will be,” “will,” “would,” “expect,” “anticipate,” “plan,” “project,” “intend,” “could,” “should” or other similar words or expressions often identify forward-looking statements. All statements other than statements of historical fact are forward-looking statements, including, without limitation, statements regarding our outlook, projections, forecasts or trend descriptions. These statements do not guarantee future performance, and Caterpillar does not undertake to update its forward-looking statements.
It is important to note that Caterpillar’s actual results may differ materially from those described or implied in its forward-looking statements based on a number of factors, including, but not limited to: (i) global economic conditions and economic conditions in the industries and markets Caterpillar serves; (ii) government monetary or fiscal policies and government spending on infrastructure; (iii) commodity or component price increases and/or limited availability of raw materials and component products, including steel; (iv) Caterpillar’s and its customers’, dealers’ and suppliers’ ability to access and manage liquidity; (v) political and economic risks associated with our global operations, including changes in laws, regulations or government policies, currency restrictions, restrictions on repatriation of earnings, burdensome tariffs or quotas, national and international conflict, including terrorist acts and political and economic instability or civil unrest in the countries in which Caterpillar operates; (vi) Caterpillar’s and Cat Financial’s ability to maintain their respective credit ratings, material increases in either company’s cost of borrowing or an inability of either company to access capital markets; (vii) financial condition and credit worthiness of Cat Financial’s customers; (viii) inability to realize expected benefits from acquisitions and divestitures, including the acquisition of Bucyrus International, Inc.; (ix) international trade and investment policies, such as import quotas, capital controls or tariffs; (x) the possibility that Caterpillar’s introduction of Tier 4 emissions compliant machines and engines is not successful; (xi) market acceptance of Caterpillar’s products and services; (xii) effects of changes in the competitive environment, which may include decreased market share, lack of acceptance of price increases, and/or negative changes to our geographic and product mix of sales; (xiii) union disputes or other employee relations issues; (xiv) Caterpillar’s ability to successfully implement the Caterpillar Production System or other productivity initiatives; (xv) adverse changes in sourcing practices of our dealers or original equipment manufacturers; (xvi) compliance costs associated with environmental laws and regulations; (xvii) alleged or actual violations of trade or anti-corruption laws and regulations; (xviii) additional tax expense or exposure; (xix) currency fluctuations, particularly increases and decreases in the U.S. dollar against other currencies; (xx) failure of Caterpillar or Cat Financial to comply with financial covenants in their respective credit facilities; (xxi) increased funding obligations under our pension plans; (xxii) significant legal proceedings, claims, lawsuits or investigations; (xxiii) imposition of operational restrictions or compliance requirements if carbon emissions legislation and/or regulations are adopted; (xxiv) changes in accounting standards or adoption of new accounting standards; (xxv) adverse effects of natural disasters; and (xxvi) other factors described in more detail under “Item 1A. Risk Factors” in Part I of our Form 10-K filed with the SEC on February 22, 2011 for the year ended December 31, 2010. This filing is available on our website at www.caterpillar.com/secfilings.
Key Points
Second Quarter 2011
(Dollars in millions except per share data)
|
|
|
Second Quarter |
|
Second Quarter |
|
$ Change |
|
% Change |
| |||
|
Machinery and Power Systems Sales |
|
$ |
13,535 |
|
$ |
9,723 |
|
$ |
3,812 |
|
39 |
% |
|
Financial Products Revenues |
|
695 |
|
686 |
|
9 |
|
1 |
% | |||
|
Total Sales and Revenues |
|
$ |
14,230 |
|
$ |
10,409 |
|
$ |
3,821 |
|
37 |
% |
|
|
|
|
|
|
|
|
|
|
| |||
|
Profit |
|
$ |
1,015 |
|
$ |
707 |
|
$ |
308 |
|
44 |
% |
|
Profit per common share - diluted |
|
$ |
1.52 |
|
$ |
1.09 |
|
$ |
0.43 |
|
39 |
% |
|
|
|
|
|
|
|
|
|
|
| |||
|
Excluding Bucyrus Acquisition Costs |
|
|
|
|
|
|
|
|
| |||
|
Profit per common share - diluted |
|
$ |
1.72 |
|
$ |
1.09 |
|
$ |
0.63 |
|
58 |
% |
· Second-quarter sales and revenues of $14.230 billion were an all-time record, up 37 percent from the second quarter of 2010. The improvement is a result of continued economic growth and improvement from the low levels of machine demand in the second quarter of 2010.
· On the 37-percent increase in sales and revenues, operating profit increased 64 percent.
· Profit per share was $1.52 in the second quarter of 2011, or $1.72 per share excluding Bucyrus acquisition costs.
· Machinery and Power Systems operating cash flow was $4.111 billion in the first half of 2011, compared with $2.525 billion in the first half of 2010.
· Machinery and Power Systems debt-to-capital ratio was 42.6 percent at the end of the second quarter of 2011, compared with 34.8 percent at year-end 2010. The increase was the result of debt issued to complete the acquisition of Bucyrus.
2011 Outlook
· Caterpillar is raising its 2011 outlook for both sales and revenues and profit excluding the Bucyrus acquisition.
· The 2011 sales and revenues outlook excluding Bucyrus is now expected to be in the range of $54 to $56 billion. The previous outlook was for sales and revenues to be in the range of $52 to $54 billion.
· We expect Bucyrus will add $2 billion in sales in 2011. Including Bucyrus, 2011 sales and revenues are expected to be $56 to $58 billion.
· The revised 2011 profit outlook excluding Bucyrus is a range of $6.75 to $7.25 per share. The previous profit outlook was a range of $6.25 to $6.75 per share. The increase is primarily due to higher sales volume.
· We expect Bucyrus will have a negative profit impact of $0.50 per share in 2011. The 2011 profit outlook including Bucyrus is a range of $6.25 to $6.75 per share.
CONSOLIDATED RESULTS
Consolidated Sales and Revenues
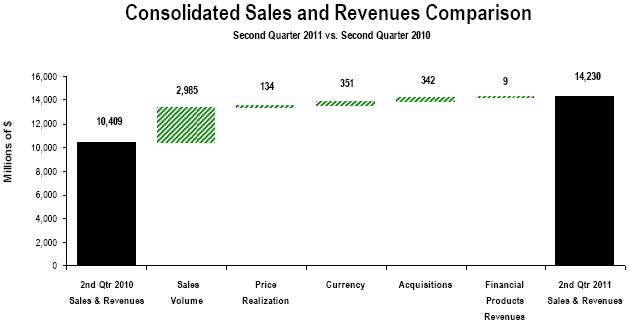
The chart above graphically illustrates reasons for the change in Consolidated Sales and Revenues between the second quarter of 2010 (at left) and the second quarter of 2011 (at right). Items favorably impacting sales and revenues appear as upward stair steps with the corresponding dollar amounts above each bar, while items negatively impacting sales and revenues appear as downward stair steps with dollar amounts reflected in parentheses above each bar. The bar entitled Sales Volume includes the sales impact of divestitures. Caterpillar management utilizes these charts internally to visually communicate with the company’s Board of Directors and employees.
Sales and Revenues
Total sales and revenues were $14.230 billion in the second quarter of 2011, an increase of $3.821 billion, or 37 percent, from the second quarter of 2010.
The improvement was largely a result of $2.985 billion higher sales volume. While sales for new equipment and after-market parts improved, the most significant increase was for new equipment. Price realization improved $134 million, and currency impacts added $351 million. EMD, which was acquired in the third quarter of 2010, added $342 million in sales. Financial Products revenues improved slightly.
The improvement in sales volume occurred across the world in all geographic regions and in nearly all segments. The volume increase was primarily the result of higher deliveries to end users. Dealer inventory levels were up about $300 million during the quarter, while they were about flat during the second quarter of 2010.
The improvement in sales volume was partially offset by the impact of the Japan disaster as sporadic disruptions at many of our facilities and suppliers around the world negatively impacted sales by about $200 million.
Growth in the global economy increased both demand for commodities and commodity prices and was positive for mining in all regions of the world.
Construction activity continued to grow in the developing countries. In developed countries, despite a continued weak level of construction activity, sales increased as a result of customers upgrading machine fleets and replacing some older equipment and dealers refreshing some equipment in their rental fleets.
Power Systems sales increased as a result of worldwide economic growth, strong demand for electric power, energy prices at levels that encourage continued investment and increased demand from industrial engine customers that manufacture agricultural and construction equipment.
Consolidated Operating Profit
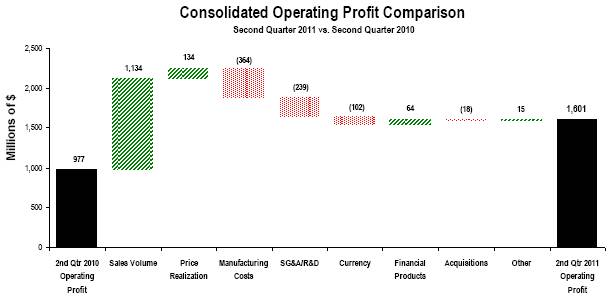
The chart above graphically illustrates reasons for the change in Consolidated Operating Profit between the second quarter of 2010 (at left) and the second quarter of 2011 (at right). Items favorably impacting operating profit appear as upward stair steps with the corresponding dollar amounts above each bar, while items negatively impacting operating profit appear as downward stair steps with dollar amounts reflected in parentheses above each bar. Caterpillar management utilizes these charts internally to visually communicate with the company’s Board of Directors and employees. The bar entitled Other includes the operating profit impact of divestitures and consolidating adjustments and Machinery and Power Systems other operating (income) expenses.
Operating profit for the second quarter of 2011 was $1.601 billion compared with $977 million for the second quarter of 2010. The improvement was primarily the result of higher sales volume and better price realization. The improvements were partially offset by higher manufacturing costs and selling, general and administrative (SG&A) and research and development (R&D) expenses. The Japan disaster negatively impacted operating profit by nearly $60 million, primarily due to factory and supply chain disruptions.
Manufacturing costs were up $364 million, primarily due to higher period costs related to increased production volume, wage and benefit cost increases and higher incentive compensation. Freight costs were higher and material costs increased, primarily due to higher steel costs. Continued improvements in variable labor efficiencies partially offset these factors.
SG&A and R&D expenses increased by $239 million, primarily due to higher costs to support product programs, higher volume, wage and benefit inflation and higher incentive compensation.
Currency had a $102 million unfavorable impact on operating profit as the benefit from $351 million on sales was more than offset by a negative $453 million impact on costs.
Financial Products’ operating profit improved by $64 million.
Operating profit was negatively impacted by $31 million of Bucyrus acquisition costs, while the acquisition of EMD added $13 million to operating profit.
Other Profit/Loss Items
· Interest expense excluding Financial Products increased $9 million from the second quarter of 2010 due to debt issued to complete the acquisition of Bucyrus.
· Other income/expense was expense of $161 million compared with income of $50 million in the second quarter of 2010. The unfavorable change was primarily a result of losses on interest rate swaps put in place in anticipation of issuing debt for the acquisition of Bucyrus and costs for the bridge financing facility related to the Bucyrus acquisition. Net currency exchange gains and losses also had a negative impact.
· The provision for income taxes reflects an estimated annual tax rate of 29 percent for both the second quarter of 2011 and 2010, excluding a net benefit of $72 million in the second quarter of 2011 and $65 million in the second quarter of 2010. The benefit in the second quarter of 2011 was due to planned repatriation of non-U.S. earnings with available foreign tax credits in excess of the U.S. tax liability offset by an increase in prior year tax reserves.
· Equity in profit/loss of unconsolidated affiliated companies negatively impacted profit by $6 million compared to the second quarter of 2010. The change was primarily related to NC2 Global LLC, our joint venture with Navistar.
· Profit/loss attributable to noncontrolling interests improved profit by $19 million from the second quarter of 2010. This change was due to lower Caterpillar Japan Ltd. (Cat Japan) profit, partially driven by the impact of the earthquake and tsunami. We own two-thirds of Cat Japan, meaning one-third of its profits or losses are attributable to our partner, Mitsubishi Heavy Industries, Ltd.
Global Workforce
Caterpillar worldwide full-time employment was 108,175 at the end of the second quarter of 2011 compared with 97,487 at the end of the second quarter of 2010, an increase of 10,688 full-time employees. In addition, we increased the flexible workforce by 8,122 for a total increase in the global workforce of 18,810.
We increased our workforce primarily to support higher sales volume across all geographic regions. In addition, acquisitions, primarily EMD, added 3,079 people, while the sale of Carter Machinery in the first quarter of 2011 reduced the workforce by 1,157 people.
|
|
|
June 30 |
| ||||
|
|
|
2011 |
|
2010 |
|
Change |
|
|
Full-time employment |
|
108,175 |
|
97,487 |
|
10,688 |
|
|
Flexible workforce |
|
24,064 |
|
15,942 |
|
8,122 |
|
|
Total |
|
132,239 |
|
113,429 |
|
18,810 |
|
|
|
|
|
|
|
|
|
|
|
Summary of change |
|
|
|
|
|
|
|
|
U.S. workforce additions |
|
|
|
|
|
6,039 |
|
|
Non-U.S. workforce additions |
|
|
|
|
|
10,849 |
|
|
Total additions |
|
|
|
|
|
16,888 |
|
|
|
|
|
|
|
|
|
|
|
Acquisitions/divestitures net |
|
|
|
|
|
1,922 |
|
|
Total |
|
|
|
|
|
18,810 |
|
We closed the acquisition of Bucyrus after the end of the second quarter, and, as a result, the approximately 10,000 additional employees are not included in the global workforce summary above.
SEGMENT RESULTS
Sales and Revenues by Geographic Region
|
|
|
|
|
|
|
|
|
|
|
|
|
|
|
|
|
|
|
|
|
|
|
|
|
|
|
|
|
(Millions of dollars) |
|
Total |
|
% |
|
North |
|
% |
|
Latin |
|
% |
|
EAME |
|
% |
|
Asia/ |
|
% |
| |||||
|
Second Quarter 2011 |
|
|
|
|
|
|
|
|
|
|
|
|
|
|
|
|
|
|
|
|
| |||||
|
Construction Industries(1) |
|
$ |
4,941 |
|
46 |
% |
$ |
1,385 |
|
46 |
% |
$ |
755 |
|
41 |
% |
$ |
1,334 |
|
64 |
% |
$ |
1,467 |
|
34 |
% |
|
Resource Industries(2) |
|
3,206 |
|
53 |
% |
1,026 |
|
46 |
% |
626 |
|
21 |
% |
703 |
|
89 |
% |
851 |
|
70 |
% | |||||
|
Power Systems(3) |
|
4,918 |
|
32 |
% |
1,976 |
|
24 |
% |
647 |
|
46 |
% |
1,329 |
|
36 |
% |
966 |
|
34 |
% | |||||
|
All Other Segments (4) |
|
475 |
|
(10 |
)% |
206 |
|
(31 |
)% |
25 |
|
(24 |
)% |
160 |
|
12 |
% |
84 |
|
56 |
% | |||||
|
Corporate Items and Eliminations |
|
(5 |
) |
|
|
(5 |
) |
|
|
— |
|
|
|
— |
|
|
|
— |
|
|
| |||||
|
Machinery & Power Systems Sales |
|
$ |
13,535 |
|
39 |
% |
$ |
4,588 |
|
30 |
% |
$ |
2,053 |
|
35 |
% |
$ |
3,526 |
|
53 |
% |
$ |
3,368 |
|
42 |
% |
|
|
|
|
|
|
|
|
|
|
|
|
|
|
|
|
|
|
|
|
|
|
| |||||
|
Financial Products Segment |
|
764 |
|
3 |
% |
432 |
|
(5 |
)% |
90 |
|
22 |
% |
111 |
|
4 |
% |
131 |
|
20 |
% | |||||
|
Corporate Items and Eliminations |
|
(69 |
) |
|
|
(49 |
) |
|
|
(6 |
) |
|
|
(6 |
) |
|
|
(8 |
) |
|
| |||||
|
Financial Products Revenues |
|
$ |
695 |
|
1 |
% |
$ |
383 |
|
(5 |
)% |
$ |
84 |
|
18 |
% |
$ |
105 |
|
(2 |
)% |
$ |
123 |
|
16 |
% |
|
|
|
|
|
|
|
|
|
|
|
|
|
|
|
|
|
|
|
|
|
|
| |||||
|
Consolidated Sales and Revenues |
|
$ |
14,230 |
|
37 |
% |
$ |
4,971 |
|
26 |
% |
$ |
2,137 |
|
34 |
% |
$ |
3,631 |
|
51 |
% |
$ |
3,491 |
|
41 |
% |
|
|
|
|
|
|
|
|
|
|
|
|
|
|
|
|
|
|
|
|
|
|
| |||||
|
Second Quarter 2010 |
|
|
|
|
|
|
|
|
|
|
|
|
|
|
|
|
|
|
|
|
| |||||
|
Construction Industries (1) |
|
$ |
3,391 |
|
|
|
$ |
947 |
|
|
|
$ |
534 |
|
|
|
$ |
813 |
|
|
|
$ |
1,097 |
|
|
|
|
Resource Industries(2) |
|
2,095 |
|
|
|
705 |
|
|
|
516 |
|
|
|
372 |
|
|
|
502 |
|
|
| |||||
|
Power Systems(3) |
|
3,736 |
|
|
|
1,596 |
|
|
|
444 |
|
|
|
975 |
|
|
|
721 |
|
|
| |||||
|
All Other Segments(4) |
|
529 |
|
|
|
299 |
|
|
|
33 |
|
|
|
143 |
|
|
|
54 |
|
|
| |||||
|
Corporate Items and Eliminations |
|
(28 |
) |
|
|
(10 |
) |
|
|
(8 |
) |
|
|
(5 |
) |
|
|
(5 |
) |
|
| |||||
|
Machinery & Power Systems Sales |
|
$ |
9,723 |
|
|
|
$ |
3,537 |
|
|
|
$ |
1,519 |
|
|
|
$ |
2,298 |
|
|
|
$ |
2,369 |
|
|
|
|
|
|
|
|
|
|
|
|
|
|
|
|
|
|
|
|
|
|
|
|
|
| |||||
|
Financial Products Segment |
|
744 |
|
|
|
454 |
|
|
|
74 |
|
|
|
107 |
|
|
|
109 |
|
|
| |||||
|
Corporate Items and Eliminations |
|
(58 |
) |
|
|
(52 |
) |
|
|
(3 |
) |
|
|
— |
|
|
|
(3 |
) |
|
| |||||
|
Financial Products Revenues |
|
$ |
686 |
|
|
|
$ |
402 |
|
|
|
$ |
71 |
|
|
|
$ |
107 |
|
|
|
$ |
106 |
|
|
|
|
|
|
|
|
|
|
|
|
|
|
|
|
|
|
|
|
|
|
|
|
|
| |||||
|
Consolidated Sales and Revenues |
|
$ |
10,409 |
|
|
|
$ |
3,939 |
|
|
|
$ |
1,590 |
|
|
|
$ |
2,405 |
|
|
|
$ |
2,475 |
|
|
|
|
(1) |
Does not include inter-segment sales of $124 million and $142 million in second-quarter 2011 and second-quarter 2010, respectively. |
|
(2) |
Does not include inter-segment sales of $284 million and $192 million in second-quarter 2011 and second-quarter 2010, respectively. |
|
(3) |
Does not include inter-segment sales of $541 million and $388 million in second-quarter 2011 and second-quarter 2010, respectively. |
|
(4) |
Does not include inter-segment sales of $839 million and $691 million in second-quarter 2011 and second-quarter 2010, respectively. |
Sales and Revenues by Segment
|
(Millions of dollars) |
|
Second |
|
Sales |
|
Price |
|
Currency |
|
Acquisitions |
|
Other |
|
Second |
|
$ Change |
|
% |
| ||||||||
|
Construction Industries |
|
$ |
3,391 |
|
$ |
1,342 |
|
$ |
24 |
|
$ |
184 |
|
$ |
— |
|
$ |
— |
|
$ |
4,941 |
|
$ |
1,550 |
|
46 |
% |
|
Resource Industries |
|
2,095 |
|
992 |
|
70 |
|
49 |
|
— |
|
— |
|
3,206 |
|
1,111 |
|
53 |
% | ||||||||
|
Power Systems |
|
3,736 |
|
697 |
|
42 |
|
101 |
|
342 |
|
— |
|
4,918 |
|
1,182 |
|
32 |
% | ||||||||
|
All Other Segments |
|
529 |
|
(78 |
) |
7 |
|
17 |
|
— |
|
— |
|
475 |
|
(54 |
) |
(10 |
)% | ||||||||
|
Corporate Items and Eliminations |
|
(28 |
) |
32 |
|
(9 |
) |
— |
|
— |
|
— |
|
(5 |
) |
23 |
|
|
| ||||||||
|
Machinery & Power Systems Sales |
|
$ |
9,723 |
|
$ |
2,985 |
|
$ |
134 |
|
$ |
351 |
|
$ |
342 |
|
$ |
— |
|
$ |
13,535 |
|
$ |
3,812 |
|
39 |
% |
|
|
|
|
|
|
|
|
|
|
|
|
|
|
|
|
|
|
|
|
| ||||||||
|
Financial Products Segment |
|
744 |
|
— |
|
— |
|
— |
|
— |
|
20 |
|
764 |
|
20 |
|
3 |
% | ||||||||
|
Corporate Items and Eliminations |
|
(58 |
) |
— |
|
— |
|
— |
|
— |
|
(11 |
) |
(69 |
) |
(11 |
) |
|
| ||||||||
|
Financial Products Revenues |
|
$ |
686 |
|
$ |
— |
|
$ |
— |
|
$ |
— |
|
$ |
— |
|
$ |
9 |
|
$ |
695 |
|
$ |
9 |
|
1 |
% |
|
|
|
|
|
|
|
|
|
|
|
|
|
|
|
|
|
|
|
|
| ||||||||
|
Consolidated Sales and Revenues |
|
$ |
10,409 |
|
$ |
2,985 |
|
$ |
134 |
|
$ |
351 |
|
$ |
342 |
|
$ |
9 |
|
$ |
14,230 |
|
$ |
3,821 |
|
37 |
% |
Operating Profit by Segment
|
(Millions of dollars) |
|
Second Quarter |
|
Second Quarter |
|
$ |
|
% |
| |||
|
Construction Industries |
|
$ |
482 |
|
$ |
218 |
|
$ |
264 |
|
121 |
% |
|
Resource Industries |
|
796 |
|
418 |
|
378 |
|
90 |
% | |||
|
Power Systems |
|
736 |
|
594 |
|
142 |
|
24 |
% | |||
|
All Other Segments |
|
122 |
|
195 |
|
(73 |
) |
(37 |
)% | |||
|
Corporate Items and Eliminations |
|
(623 |
) |
(486 |
) |
(137 |
) |
|
| |||
|
Machinery & Power Systems |
|
$ |
1,513 |
|
$ |
939 |
|
$ |
574 |
|
61 |
% |
|
Financial Products Segment |
|
172 |
|
110 |
|
62 |
|
56 |
% | |||
|
Corporate Items and Eliminations |
|
(16 |
) |
(18 |
) |
2 |
|
|
| |||
|
Financial Products |
|
$ |
156 |
|
$ |
92 |
|
$ |
64 |
|
70 |
% |
|
Consolidating Adjustments |
|
(68 |
) |
(54 |
) |
(14 |
) |
|
| |||
|
Consolidated Operating Profit |
|
$ |
1,601 |
|
$ |
977 |
|
$ |
624 |
|
64 |
% |
Construction Industries
Construction Industries’ sales were $4.941 billion in the second quarter of 2011, an increase of $1.550 billion, or 46 percent, from the second quarter of 2010. The improvement in sales was a result of significantly higher sales volume in all geographic regions and across all major products. The disaster in Japan negatively impacted sales by $200 million and operating profit by nearly $60 million. In addition to volume, sales were higher as a result of currency impacts from a weaker U.S. dollar.
Continuing economic growth in most developing countries resulted in higher sales overall, and new machine sales were above or near record levels across much of the developing world. While demand for product was strong, the supply of many excavator models, which are key products for construction across the world, is limited by our capacity.
In most developed countries, sales increased significantly despite relatively weak construction activity. The improvement in sales was largely driven by the need for customers to upgrade machine fleets and replace older equipment and dealers refreshing some equipment in their rental fleets. Despite the increase from a year ago, sales of new machines to customers in developed countries remain weak and below previous peak levels. The size of rental fleets increased slightly from post-recession lows, but the average age remained near the historical high.
Construction Industries’ profit was $482 million in the second quarter of 2011 compared with $218 million in the second quarter of 2010. The increase in profit was primarily due to higher sales volume, which included the impact of an unfavorable mix of products. The benefit from higher sales was partially offset by increased manufacturing costs, primarily due to higher period costs related to higher production volume and several capacity expansion programs around the world, and higher R&D expense.
Resource Industries
Resource Industries’ sales were $3.206 billion in the second quarter of 2011, an increase of $1.111 billion, or 53 percent, from the second quarter of 2010. The sales growth was driven primarily by higher sales volume with price realization and currency having a relatively small impact.
Growth in the global economy increased demand for commodities and commodity prices. Metals prices were up nearly 30 percent, and most thermal coal prices increased more than 20 percent. As a result, worldwide mining production continued at a high level. Mining customers are increasing their investment, which is driving significant demand for our large mining products and higher parts sales.
Resource Industries’ profit was $796 million in the second quarter of 2011 compared with $418 million in the second quarter of 2010. The profit improvement was primarily due to higher sales volume and improved price realization. This improvement was partially offset by higher manufacturing costs, increased R&D expense and Bucyrus acquisition costs.
Power Systems
Power Systems’ sales were $4.918 billion in the second quarter of 2011, an increase of $1.182 billion, or 32 percent, from the second quarter of 2010. Sales were up in all geographic regions from the low levels of the second quarter of 2010. Most of the improvement was a result of higher sales volume and the acquisition of EMD. Sales for electric power, industrial and petroleum applications all improved, while sales of marine engines were about flat.
Electric power has continued to improve as a result of worldwide economic growth. Sales of industrial engines to customers that manufacture agricultural and construction equipment have improved significantly. Strong demand for energy at price levels that encourage continued investment have resulted in higher demand for engines for petroleum applications.
Power Systems’ profit was $736 million in the second quarter of 2011 compared with $594 million in second quarter of 2010. The improvement was primarily due to higher sales volume, which includes the impact of an unfavorable mix of products, and improved price realization. The improvements were partially offset by higher period manufacturing costs, increased freight costs and higher warranty and R&D expense.
The acquisition of EMD added sales of $342 million and profit of $18 million.
Financial Products Segment
Financial Products’ revenues were $764 million, an increase of $20 million, or 3 percent, from the second quarter of 2010. The increase was primarily due to the impact from higher average earning assets and from returned or repossessed equipment, partially offset by an unfavorable impact from lower interest rates on new and existing finance receivables and a decrease in Cat Insurance revenues.
Financial Products’ profit was $172 million in the second quarter of 2011, compared with $110 million in the second quarter of 2010. The increase was primarily due to a $21 million favorable impact from higher net yield on average earning assets, a $20 million decrease in provision expense at Cat Financial and an $11 million favorable change from returned or repossessed equipment. These increases were partially offset by an increase in SG&A expenses (excluding provision expense at Cat Financial).
At the end of the second quarter of 2011, past dues at Cat Financial were 3.73 percent, a decrease from 3.94 percent at the end of the first quarter of 2011, 3.87 percent at the end of 2010 and 5.33 percent at the end of the second quarter of 2010. The decrease in past dues reflects the continued improvement in the global economy. Write-offs, net of recoveries, were $29 million for the second quarter of 2011, down from $52 million in the second quarter of 2010, and were the lowest since the third quarter of 2008.
As of June 30, 2011, Cat Financial’s allowance for credit losses totaled $382 million or 1.52 percent of net finance receivables, compared with $363 million or 1.57 percent of net finance receivables at year-end 2010. The allowance for credit losses as of June 30, 2010, was $383 million, which was 1.70 percent of net finance receivables.
Corporate Items and Eliminations
Expense for corporate items and eliminations was $639 million in the second quarter of 2011, an increase of $135 million from the second quarter of 2010. Corporate items and eliminations include corporate-level expenses, timing differences as some expenses are reported in segment results on a cash basis, retirement benefit costs other than service cost and inter-segment eliminations.
The change was primarily due to higher corporate-level expenses and increased retirement benefit costs not allocated to segments.
Outlook
Economic Outlook
Sovereign debt problems, political change in the Middle East, the earthquake and tsunami in Japan and higher oil prices contributed to slower than expected economic growth in the first half of 2011. Those factors heighten concern about the future pace of economic recovery. Although the recovery is slower than expected, particularly in developed economies, we anticipate further growth in the second half of 2011. We expect the world economy will grow 3.5 percent in 2011, down from 3.9 percent in 2010.
Key points related to our economic outlook include:
· Many economies have not fully recovered from the recession and are operating below potential. This idle capacity should keep inflation below the 2008 high.
· Low inflation and high unemployment will likely encourage most central banks to remain cautious about raising interest rates.
· We anticipate that demand for commodities will increase in the second half, keeping prices high enough to encourage producers to expand production and capital investments. We expect major mining companies will increase capital spending more than 50 percent in 2011. Our outlook assumes that copper will average $4.35 per pound this year; West Texas Intermediate oil, $96 per barrel; and Central Appalachian coal, $77 per ton.
· Recoveries in the developing economies have been faster than those in developed economies, and inflation is higher than some central banks’ targets. We expect that interest rates in many of these countries will increase further in the second half, but few will exceed 2008 highs. Economic growth in developing countries should average about 6.3 percent in 2011, down from 7.1 percent in 2010.
· Policy tightening in the Asia/Pacific region should slow economic growth from 8.4 percent in 2010 to 7.2 percent in 2011. That rate of growth, higher than in any other region, should allow construction and commodity demand to continue increasing.
· China’s efforts to combat inflation should slow economic growth. We expect growth in 2011 to be more than 9 percent, compared with 10.3 percent in 2010. We expect signs that both growth and inflation are moderating will prompt the Chinese government to relax policies, possibly before the end of 2011. We believe the government will encourage more investment in infrastructure and affordable housing.
· South American countries, led by Brazil, raised interest rates, and we expect additional increases before the end of 2011. However, rates will likely remain below 2008 highs, and the regional economy should grow more than 4.5 percent in 2011. Our outlook assumes continued growth in construction spending and mining production.
· Both Africa/Middle East and CIS were slower to recover than the other developing regions, so inflation remains largely under control. Central banks have not raised interest rates much, and both regions are benefiting from higher commodity prices. We expect economic growth of about 4.5 percent in Africa/Middle East and about 5.5 percent in CIS. Both construction spending and mining activity should improve.
· The major developed economies have had weak recoveries, and the frequent discord in developing economic policies offers little hope for improvement in the short term. However, forward-looking economic indicators suggest downturns are unlikely this year. Our outlook assumes developed economies will grow 2 percent in 2011, down from 2.5 percent in 2010. Construction remains weak, and only scattered improvements in activity are likely this year.
· The U.S. Federal Reserve completed its program of Treasury bond purchases at the end of June, with much of the money created staying on deposit with the U.S. Federal Reserve. Fed policy did result in some increases in deposits held by consumers and businesses, and those increases should benefit economic growth in the second half of 2011.
· Our outlook assumes the U.S. economy will grow 2.5 percent in 2011, down from 2.9 percent in 2010. We expect housing starts of more than 600,000 units, not much above the 2009 level of 554,000 units. Nonresidential construction is expected to decline.
· We expect that the poor performance of the U.S. economy will force the U.S. Federal Reserve to keep the Federal Funds rate below 25 basis points through at least the end of 2011. The central bank indicated it would continue buying sufficient Treasuries to stabilize its holdings, but more aggressive actions to improve economic growth are unlikely this year.
· Our outlook assumes the European economy will grow 2.2 percent in 2011, up from 1.7 percent in 2010. We expect Eurozone countries facing government debt problems will experience slow growth or declines this year, but they account for less than 25 percent of the European economy.
· The European Central Bank raised interest rates twice this year, and at least one more rate increase is likely before the end of 2011. This policy tightening will slow Eurozone growth in the last half of 2011 and could worsen the ongoing debt crisis. However, we expect some continued improvement in construction activity.
· The earthquake and tsunami in Japan caused a sharp drop in output in the first half of the year. However, reconstruction and the increased liquidity provided by the Bank of Japan should produce a strong recovery in the second half of 2011. As a result of declines in the first half of 2011, we expect economic growth of 0.3 percent in Japan in 2011, down from 4 percent in 2010.
Economic Risks
We believe the major risks to our economic outlook are in the developed economies of the United States, Eurozone and Japan:
· Growth rates have been sluggish during the current recovery, ranging from 2 percent in the Eurozone to 2.8 percent in the United States. Productivity gains accounted for nearly all the growth.
· As a result, recoveries have not created enough new jobs to replace those lost during the downturn or to provide opportunities for new entrants into labor forces. Employment remains below pre-recession peaks in the Eurozone, Japan and the United States.
· Weak economic growth and high unemployment in developed countries have kept construction depressed. Construction activity in 2011 remains down sharply from pre-recession peaks, ranging from down 10 percent in the Eurozone to down about 40 percent in the United States.
· The Eurozone is tightening economic policies, and policy tightening is under discussion in the United States. We believe that premature policy tightening risks a continuing weak recovery and would raise the risk of triggering another recession. That would likely result in excessive unemployment, the potential of lower construction spending and a further diminishing of the role of developed countries in the world economy.
2011 Sales and Revenues and Profit Outlook
Because we completed the Bucyrus acquisition in July, our outlook includes an estimate of Bucyrus-related impacts. However, to provide a more consistent comparison with 2010 and our previous outlook, we are also providing our 2011 outlook excluding the impact of Bucyrus.
2011 Sales and Revenues Outlook
Despite moderating expectations for economic growth, our business continues to improve, and we have increased the outlook for sales and revenues.
Excluding Bucyrus, we expect sales and revenues will be in a range from $54 to $56 billion in 2011. That is an increase from our previous outlook of $52 to $54 billion.
We are forecasting that Bucyrus will add about $2 billion to sales in 2011, and including Bucyrus, our sales and revenues outlook is a range of $56 to $58 billion.
2011 Profit Outlook — Excluding the Impact of the Bucyrus Acquisition
Excluding the impact of Bucyrus, we raised the profit outlook range for 2011 to $6.75 to $7.25 per share. That is an increase from our prior outlook of $6.25 to $6.75 per share. The improvement in the profit outlook is primarily a result of the increase in the outlook for sales and revenues.
2011 Profit Outlook — Including the Impact of the Bucyrus Acquisition
We expect the impact of the Bucyrus acquisition will be about $0.50 per share negative to profit in 2011. Including the impact of Bucyrus, the full-year profit outlook range for 2011 is $6.25 to $6.75 per share.
The factors driving the Bucyrus impact include:
· Interest rate swaps—in anticipation of significant borrowing needs to fund the Bucyrus acquisition we entered into interest rate swap contracts in late 2010 and early 2011 to mitigate the risk of increasing interest rates. Over the past six months interest rates did not increase, they declined, resulting in about $150 million in losses on the swap contracts. While negative to 2011, over the life of the debt, the losses will be more than offset by lower interest expense than previously expected, as the debt was issued at historically low rates.
· Impact of inventory step-up—the inventory step-up to bring the acquired Bucyrus inventory to its fair value is expected to have a negative impact on profit of about $250 million.
· Acquisition and integration costs—integration-related expenses, severance costs, costs for a bridge financing facility, legal costs and advisory fees are expected to be about $300 million in 2011.
· Expected operating profit from Bucyrus, net of about $150 million of incremental amortization of intangible assets, is expected to be about $300 million during the second half of 2011.
· Incremental interest expense as a result of the debt issued to acquire Bucyrus is about $80 million.
QUESTIONS AND ANSWERS
Bucyrus
Q1: How did you fund the acquisition?
A: We funded the Bucyrus acquisition with cash and $4.5 billion of term debt issued on May 24, 2011, at historically low levels. The term debt was a combination of floating rate notes ($1.25 billion) and fixed rate notes ($3.25 billion) with maturities ranging from 18 months to 30 years. These were the lowest coupons for the company for at least the last 25 years.
Relative to the funding there are three very positive points:
· Because of strong cash flow over the past few quarters we had more cash available to use for the acquisition.
· Our cash position enabled us to complete the acquisition without the need to issue new equity, and that eliminates the profit-per-share dilution we were expecting when we announced the deal in November 2010.
· Ongoing interest expense will be less than we expected last November because of the historically low interest rates on the debt issued for the acquisition.
However, we incurred losses on interest rate swap contracts related to the funding of Bucyrus:
· In late 2010 and early 2011, we became concerned that long-term interest rates were trending up. With the need to fund the Bucyrus acquisition around mid-year, we decided to enter into interest rate swap contracts to protect what we believed were attractive rates at the time. After increasing for a short time, long-term rates declined later in the first quarter and continued down in the second quarter. As a result, we incurred losses on the swap contracts. The negative impact in 2011 was about $150 million — mainly in the second quarter. While negative to 2011, over the life of the debt, the losses will be more than offset by lower interest expense than previously expected, as the debt was issued at historically low rates.
Q2: You reported second-quarter results including and excluding the impact of Bucyrus. Since the deal did not close until July, what was the impact in the second quarter?
A: Costs in the second quarter of 2011 related to the Bucyrus acquisition were $204 million. Of the total, the most significant item was the loss on interest rate swap contracts. In addition, we had costs for a bridge financing facility, advisory and legal costs and about a month of interest expense on the debt we issued on May 24, 2011.
Bucyrus Acquisition Costs
(Millions of dollars)
|
|
|
2011 |
| ||||
|
|
|
Second |
|
First Half |
| ||
|
SG&A |
|
|
|
|
| ||
|
Acquisition-related costs |
|
$ |
(31 |
) |
$ |
(35 |
) |
|
Total operating costs |
|
(31 |
) |
(35 |
) | ||
|
Operating profit |
|
(31 |
) |
(35 |
) | ||
|
|
|
|
|
|
| ||
|
Interest expense excluding Financial Products |
|
(11 |
) |
(11 |
) | ||
|
|
|
|
|
|
| ||
|
Other income (expense) items |
|
|
|
|
| ||
|
Loss on interest rate swaps |
|
(124 |
) |
(149 |
) | ||
|
Bridge financing |
|
(38 |
) |
(54 |
) | ||
|
Other income (expense) |
|
(162 |
) |
(203 |
) | ||
|
|
|
|
|
|
| ||
|
Total Acquisition Costs Impact |
|
$ |
(204 |
) |
$ |
(249 |
) |
Q3: In your Outlook for 2011, Bucyrus is expected to have a negative impact on your results this year. Can you provide more detail on what makes up the negative impact?
A: The factors driving the Bucyrus impact include:
· The loss on the interest rate swaps in the first half of the year was about $150 million (see question 1 above).
· Acquisition and integration costs—integration-related expenses, severance costs, costs for a bridge financing facility, legal costs and advisory fees are expected to be about $300 million in 2011.
· Inventory step-up to bring the acquired Bucyrus inventory to its fair value—a negative impact on profit of about $250 million.
· Incremental interest expense in 2011 as a result of the debt issued to acquire Bucyrus is expected to be about $80 million.
· Expected operating results from Bucyrus, net of about $150 million of incremental amortization of intangible assets, is expected to be about $300 million positive during the second half of 2011.
· Of the total negative profit-per-share impact of $0.50, about half is already in actual results for the first
half of the year and about half will be in the second half of 2011.
Q4: In November of 2010, when you announced the acquisition of Bucyrus, you said you expected the acquisition to be accretive to profit over the first 12 months excluding about $0.50 per share of up-front and deal-related costs. Can you comment on how your financial expectations have changed now that it has closed?
A: The answer is mixed. On one hand, the prospects for mining in general have continued to strengthen and the “base business” looks better, and we are more confident of the long-term synergy benefits. As a result of our strong cash flow, we have additional benefits related to the funding—we did not need to issue new equity and will not have the additional PPS dilution we expected. In addition, the interest costs on the debt we issued are lower than we originally expected.
However, on the downside, some of the up-front costs are higher. The most significant negative impact is losses on the interest rate swaps that we put in place to protect what we thought at the time were very attractive long-term rates. In addition, the negative impact we expect related to the inventory step-up in 2011 has increased.
In terms of the impact on 2011, we did not provide an estimate in November of 2010. Instead, we provided a high-level estimate of the first 12 months. We did that because we were uncertain when the transaction would close. As it turns out, Bucyrus will be included in Caterpillar results for about half of 2011, so we will only have the benefit of about half a year of Bucyrus operating results. Unfortunately, the vast majority of the up-front and deal-related costs will be this year—that is why the impact on 2011 is negative.
Q5: In your press release announcing the Bucyrus closing, you said that you were entering discussions with Cat dealers to sell them the Bucyrus distribution businesses. Can you quantify what that impact will be and how the discussions are progressing?
A: We are discussing the Bucyrus distribution businesses with Cat dealers that have mining activity in their territories, and we intend to sell these businesses to those dealers. Since we have recently started the discussions with dealers, it is too early to provide any details.
It is also too early to discuss the timing or impact that it may have on our results going forward. For that reason, our estimate of the impact of the Bucyrus acquisition on 2011 profit does not assume any impact from selling distribution businesses to dealers.
Other
Q6: Can you provide an update on the impact the crisis in Japan had on your second-quarter results?
A: The resilience of our employees, suppliers and dealers has been impressive as they worked to bring operations back to pre-disaster levels. That said, the disaster did have a negative impact on the second quarter—about $200 million on sales and $60 million on operating profit. Operations are now back to, or above, pre-crisis levels, and we do not expect ongoing negative effects. In fact, it is likely that some of the negative impact in the second quarter will be partially offset later in the year.
Q7: Is there an update on the timing of the closing of the MWM Holding GmbH (MWM) acquisition?
A: We expect the MWM acquisition to close before year-end 2011.
Q8: Can you comment on your plans for your external logistics business?
A: We have received significant interest from around the world and would expect to make a decision on the future of our external logistics business by the end of the third quarter of 2011.
Q9: Can you comment on new machine inventories held by your dealers and your expectations for the full-year 2011?
A: During the second quarter of 2011 dealers reported new machine inventory increases of about $300 million from the end of the first quarter of 2011. All geographic regions increased except North America. In the second quarter of 2010 dealers held inventory about flat with the end of the first quarter of 2010.
We expect dealers will add more inventory in the second half of 2011, but less than in the first half of 2011.
Q10: Can you comment on your order backlog?
A: The order backlog was $21.9 billion as of June 30, 2011, a new record. The backlog is $7.0 billion higher than June of 2010 and $3.2 billion higher than year-end 2010. This does not include any backlog related to Bucyrus.
Q11: Can you comment on expense related to your short-term incentive compensation plans in the second quarter and your expectation for the full-year 2011?
A: Short-term incentive compensation expense is directly related to financial and operational performance. As a result of increasing our outlook for 2011, we have increased our estimate of short-term incentive compensation. At the end of the first quarter, we expected $880 million of expense in 2011 and have increased that to about $1.050 billion. Expense in the second quarter of 2011 was $305 million, which was $85 million higher than the $220 million from the first quarter of 2011. Expense in the first half of 2011 was $525 million—half of the total year estimate of $1.050 billion.
Short-term incentive compensation in the second quarter of 2011 was $95 million higher than the $210 million from the second quarter of 2010.
Q12: Your incremental operating profit pull through was good in the first quarter. It was lower in the second quarter. Can you comment on what happened?
A: Incremental operating profit vs. 2010 did decline from the first to the second quarter. However, to better understand the operational impacts, it is appropriate to adjust for acquisitions, and in this quarter it is also useful to consider currency impacts. The table below starts with our reported sales and revenues and reported operating profit and adjusts for the acquisition of EMD, impacts related to the Bucyrus acquisition and the impacts of currency on sales and operating profit.
Currency translation rate changes from the second quarter of 2010 benefited second-quarter 2011 sales $351 million, but were negative to operating costs $453 million, and as a result, operating profit was negatively impacted by $102 million.
After adjusting for those items, the incremental profit rate was approximately 24 percent.
(Millions of dollars)
|
|
|
Second Quarter |
|
Second Quarter |
|
|
| |||
|
|
|
2011 |
|
2010 |
|
$ Change |
| |||
|
Sales and Revenues |
|
$ |
14,230 |
|
$ |
10,409 |
|
$ |
3,821 |
|
|
Less EMD Sales |
|
(342 |
) |
— |
|
(342 |
) | |||
|
Sales and Revenues excluding EMD |
|
13,888 |
|
10,409 |
|
3,479 |
| |||
|
|
|
|
|
|
|
|
| |||
|
Less Sales Currency Impact |
|
(351 |
) |
— |
|
(351 |
) | |||
|
Sales and Revenues excluding EMD & Currency Impact |
|
$ |
13,537 |
|
$ |
10,409 |
|
$ |
3,128 |
|
|
|
|
|
|
|
|
|
| |||
|
Operating Profit |
|
$ |
1,601 |
|
$ |
977 |
|
$ |
624 |
|
|
Less EMD Operating Profit |
|
(13 |
) |
|
— |
|
(13 |
) | ||
|
Add Bucyrus Acquisition Costs |
|
31 |
|
— |
|
31 |
| |||
|
Operating Profit excluding EMD & Bucyrus Acquisition Costs |
|
1,619 |
|
977 |
|
|
642 |
| ||
|
|
|
|
|
|
|
|
| |||
|
Add Operating Profit Currency Impact |
|
102 |
|
— |
|
102 |
| |||
|
Operating Profit excluding EMD, Bucyrus Acquisition Costs & Currency Impacts |
|
$ |
1,721 |
|
$ |
977 |
|
$ |
744 |
|
|
|
|
|
|
|
|
|
| |||
|
Incremental Margin Rate excluding EMD & Bucyrus Acquisition Costs |
|
18 |
% | |||||||
|
|
|
|
|
|
|
|
| |||
|
Incremental Margin Rate excluding EMD, Bucyrus Acquisition Costs & Currency Impacts |
|
24 |
% | |||||||
Q13: We have seen reports that Cat Financial has been accessing capital in a variety of countries. Can you comment on Cat Financial’s access to global capital markets?
A: Cat Financial continued to experience favorable liquidity conditions and market access across all key global funding markets during the second quarter of 2011. Commercial Paper (CP) market liquidity and pricing continued to be very favorable, with $2.9 billion in CP balances outstanding at quarter-end supported by a $5.73 billion revolving credit facility. During the second quarter of 2011, Cat Financial issued term debt in four global markets, including $966 million in the United States, EUR 690 million in Eurozone, MXN 850 million in Mexico and AUD 130 million in Australia. To maintain a strong liquidity position, Cat Financial held cash balances at the end of the second quarter of 2011 totaling $1.2 billion. In addition, in July 2011, Cat Financial issued RMB 2.3 billion in medium-term notes in Hong Kong to fund our financing operations in China.
GLOSSARY OF TERMS
|
1. |
All Other Segments — Primarily includes activities such as: the remanufacturing of Cat engines and components and remanufacturing services for other companies as well as the product management, development, manufacturing, marketing and product support of undercarriage, specialty products, hardened bar stock components and ground engaging tools primarily for Caterpillar products; logistics services for Caterpillar and other companies; the product management, development, marketing, sales and product support of on-highway vocational trucks for North America (U.S. & Canada only); the 50/50 joint venture with Navistar (NC2) which develops, manufactures and distributes on-highway trucks outside North America and India; and distribution services responsible for dealer development and administration, dealer portfolio management and ensuring the most efficient and effective distribution of machines, engines and parts. |
|
|
|
|
2. |
Bucyrus Acquisition Costs — These costs relate to losses on interest rate swaps put in place in anticipation of issuing debt for the acquisition, costs for a bridge financing facility, advisory and legal costs and interest expense on new debt. |
|
|
|
|
3. |
Caterpillar Japan Ltd. (Cat Japan) — A Caterpillar subsidiary formerly known as Shin Caterpillar Mitsubishi Ltd. (SCM). SCM was a 50/50 joint venture between Caterpillar and Mitsubishi Heavy Industries Ltd. (MHI) until SCM redeemed one half of MHI’s shares on August 1, 2008. Caterpillar now owns 67 percent of the renamed entity. We began consolidating Cat Japan in the fourth quarter of 2008. |
|
|
|
|
4. |
Consolidating Adjustments — Eliminations of transactions between Machinery and Power Systems and Financial Products. |
|
|
|
|
5. |
Construction Industries — A segment responsible for small and core construction machines. Responsibility includes business strategy, product design, product management and development, manufacturing, marketing, and sales and product support. The product portfolio includes backhoe loaders, small wheel loaders, small track-type tractors, skid steer loaders, multi-terrain loaders, mini excavators, compact wheel loaders, select work tools, small, medium and large track excavators, wheel excavators, medium wheel loaders, medium track-type tractors, track-type loaders, motor graders and pipe layers. In addition, Construction Industries has responsibility for Power Systems and components in Japan and an integrated manufacturing cost center that supports Machinery and Power Systems businesses. |
|
|
|
|
6. |
Currency — With respect to sales and revenues, currency represents the translation impact on sales resulting from changes in foreign currency exchange rates versus the U.S. dollar. With respect to operating profit, currency represents the net translation impact on sales and operating costs resulting from changes in foreign currency exchange rates versus the U.S. dollar. Currency includes the impact on sales and operating profit for the Machinery and Power Systems lines of business only; currency impacts on Financial Products revenues and operating profit are included in the Financial Products portions of the respective analyses. With respect to other income/expense, currency represents the effects of forward and option contracts entered into by the company to reduce the risk of fluctuations in exchange rates and the net effect of changes in foreign currency exchange rates on our foreign currency assets and liabilities for consolidated results. |
|
|
|
|
7. |
Debt-to-Capital Ratio — A key measure of financial strength used by both management and our credit rating agencies. The metric is a ratio of Machinery and Power Systems debt (short-term borrowings plus long-term debt) and redeemable noncontrolling interest to the sum of Machinery and Power Systems debt, redeemable noncontrolling interest and stockholders’ equity. |
|
|
|
|
8. |
EAME — A geographic region including Europe, Africa, the Middle East and the Commonwealth of Independent States (CIS). |
|
|
|
|
9. |
Earning Assets — Assets consisting primarily of total finance receivables net of unearned income, plus equipment on operating leases, less accumulated depreciation at Cat Financial. |
|
10. |
Financial Products Segment — Provides financing to customers and dealers for the purchase and lease of Caterpillar and other equipment, as well as some financing for Caterpillar sales to dealers. Financing plans include operating and finance leases, installment sale contracts, working capital loans and wholesale financing plans. The division also provides various forms of insurance to customers and dealers to help support the purchase and lease of our equipment. |
|
|
|
|
11. |
Latin America — Geographic region including Central and South American countries and Mexico. |
|
|
|
|
12. |
Machinery and Power Systems (M&PS) — Represents the aggregate total of Construction Industries, Resource Industries, Power Systems, and All Other segments and related corporate items and eliminations. |
|
|
|
|
13. |
Machinery and Power Systems Other Operating (Income) Expenses — Comprised primarily of gains/losses on disposal of long-lived assets, long-lived asset impairment charges, pension curtailment charges and employee redundancy costs. |
|
|
|
|
14. |
Manufacturing Costs — Manufacturing costs exclude the impacts of currency and represent the volume-adjusted change for variable costs and the absolute dollar change for period manufacturing costs. Variable manufacturing costs are defined as having a direct relationship with the volume of production. This includes material costs, direct labor and other costs that vary directly with production volume such as freight, power to operate machines and supplies that are consumed in the manufacturing process. Period manufacturing costs support production but are defined as generally not having a direct relationship to short-term changes in volume. Examples include machinery and equipment repair, depreciation on manufacturing assets, facility support, procurement, factory scheduling, manufacturing planning and operations management. |
|
|
|
|
15. |
Power Systems — A segment responsible for the product management, development, manufacturing, marketing, sales and product support of reciprocating engine powered generator sets, integrated systems used in the electric power generation industry, reciprocating engines and integrated systems and solutions for the marine and petroleum industries; reciprocating engines supplied to the industrial industry as well as Caterpillar machinery; the product management, development, manufacturing, marketing, sales and product support of turbines and turbine-related services; the development, manufacturing, remanufacturing, maintenance, leasing and service of diesel-electric locomotives and components and other rail-related products and services. |
|
|
|
|
16. |
Price Realization — The impact of net price changes excluding currency and new product introductions. Consolidated price realization includes the impact of changes in the relative weighting of sales between geographic regions. |
|
|
|
|
17. |
Resource Industries — A segment responsible for business strategy, product design, product management and development, manufacturing, marketing and sales and product support for large track-type tractors, large mining trucks, underground mining equipment, tunnel boring equipment, large wheel loaders, quarry and construction trucks, articulated trucks, wheel tractor scrapers, wheel dozers, compactors, select work tools, forestry products, paving products, machinery components and electronics and control systems. In addition, Resource Industries manages areas that provide services to other parts of the company, including integrated manufacturing, research and development and coordination of the Caterpillar Production System. Bucyrus will become a part of Resource Industries, and Bucyrus acquisition costs impacting operating profit are included in this segment. |
|
|
|
|
18. |
Sales Volume — With respect to sales and revenues, sales volume represents the impact of changes in the quantities sold for Machinery and Power Systems as well as the incremental revenue impact of new product introductions, including emissions-related product updates. With respect to operating profit, sales volume represents the impact of changes in the quantities sold for Machinery and Power Systems combined with product mix as well as the net operating profit impact of new product introductions, including emissions-related product updates. Product mix represents the net operating profit impact of changes in the relative weighting of Machinery and Power Systems sales with respect to total sales. |
NON-GAAP FINANCIAL MEASURES
The following definition is provided for “non-GAAP financial measures” in connection with Regulation G issued by the Securities and Exchange Commission. This non-GAAP financial measure has no standardized meaning prescribed by U.S. GAAP and therefore is unlikely to be comparable to the calculation of similar measures for other companies. Management does not intend this item to be considered in isolation or substituted for the related GAAP measure.
Bucyrus-Related Sales and Profit-Per-Share Impacts
During the second quarter of 2011, we incurred Bucyrus acquisition costs of $204 million, or $0.20 per share. These costs were related to losses on interest rate swaps put in place in anticipation of issuing debt for the acquisition, costs for a bridge financing facility, advisory and legal costs and interest expense on new debt. Our 2011 outlook for Bucyrus related sales is $2 billion, and profit is expected to be negatively impacted by $0.50 per share. The expected profit impact is primarily related to a full year of acquisition costs (including expense incurred through the first six months of 2011), inventory step-up, amortization of intangible assets and integration costs, partially offset by operating profit from ongoing operations. We believe it is important to separately quantify the sales and revenues and profit per share impacts in order for our 2011 actual results and 2011 outlook to be meaningful to our readers. Reconciliation of sales and revenues and profit per share excluding Bucyrus impacts to the most directly comparable GAAP measure, is as follows:
|
(Dollars in billions except per share data) |
|
Second Quarter |
|
2011 Outlook |
| ||
|
Sales and Revenues |
|
$ |
14.230 |
|
$ |
56 – 58 |
|
|
Bucyrus Sales impact |
|
$ |
— |
|
$ |
2 |
|
|
Sales and Revenues excluding Bucyrus |
|
$ |
14.230 |
|
$ |
54 – 56 |
|
|
|
|
|
|
|
| ||
|
Profit per share |
|
$ |
1.52 |
|
$ |
6.25 – 6.75 |
|
|
Profit per share Bucyrus impact |
|
$ |
0.20 |
|
$ |
0.50 |
|
|
Profit per share excluding Bucyrus |
|
$ |
1.72 |
|
$ |
6.75 – 7.25 |
|
|
|
|
|
|
|
|
|
|
Machinery and Power Systems
Caterpillar defines Machinery and Power Systems as it is presented in the supplemental data as Caterpillar Inc. and its subsidiaries with Financial Products accounted for on the equity basis. Machinery and Power Systems information relates to the design, manufacture and marketing of our products. Financial Products information relates to the financing to customers and dealers for the purchase and lease of Caterpillar and other equipment. The nature of these businesses is different, especially with regard to the financial position and cash flow items. Caterpillar management utilizes this presentation internally to highlight these differences. We also believe this presentation will assist readers in understanding our business. Pages 29-34 reconcile Machinery and Power Systems with Financial Products on the equity basis to Caterpillar Inc. consolidated financial information.
Caterpillar’s latest financial results and outlook are also available via:
Telephone:
(800) 228-7717 (Inside the United States and Canada)
(858) 244-2080 (Outside the United States and Canada)
Internet:
http://www.caterpillar.com/investor
http://www.caterpillar.com/irwebcast (live broadcast/replays of quarterly conference call)
Caterpillar contact:
Jim Dugan
Corporate Public Affairs
(309) 494-4100 (Office) or (309) 360-7311 (Mobile)
mail to:Dugan_Jim@cat.com
Caterpillar Inc.
Condensed Consolidated Statement of Results of Operations
(Unaudited)
(Dollars in millions except per share data)
|
|
|
Three Months Ended |
|
Six Months Ended |
| ||||||||
|
|
|
June 30, |
|
June 30, |
| ||||||||
|
|
|
2011 |
|
2010 |
|
2011 |
|
2010 |
| ||||
|
Sales and revenues: |
|
|
|
|
|
|
|
|
| ||||
|
Sales of Machinery and Power Systems |
|
$ |
13,535 |
|
$ |
9,723 |
|
$ |
25,812 |
|
$ |
17,274 |
|
|
Revenues of Financial Products |
|
695 |
|
686 |
|
1,367 |
|
1,373 |
| ||||
|
Total sales and revenues |
|
14,230 |
|
10,409 |
|
27,179 |
|
18,647 |
| ||||
|
|
|
|
|
|
|
|
|
|
| ||||
|
Operating costs: |
|
|
|
|
|
|
|
|
| ||||
|
Cost of goods sold |
|
10,303 |
|
7,372 |
|
19,360 |
|
13,266 |
| ||||
|
Selling, general and administrative expenses |
|
1,257 |
|
1,059 |
|
2,356 |
|
1,991 |
| ||||
|
Research and development expenses |
|
584 |
|
450 |
|
1,109 |
|
852 |
| ||||
|
Interest expense of Financial Products |
|
209 |
|
234 |
|
412 |
|
467 |
| ||||
|
Other operating (income) expenses |
|
276 |
|
317 |
|
508 |
|
586 |
| ||||
|
Total operating costs |
|
12,629 |
|
9,432 |
|
23,745 |
|
17,162 |
| ||||
|
|
|
|
|
|
|
|
|
|
| ||||
|
Operating profit |
|
1,601 |
|
977 |
|
3,434 |
|
1,485 |
| ||||
|
|
|
|
|
|
|
|
|
|
| ||||
|
Interest expense excluding Financial Products |
|
90 |
|
81 |
|
177 |
|
183 |
| ||||
|
Other income (expense) |
|
(161 |
) |
50 |
|
(144 |
) |
113 |
| ||||
|
|
|
|
|
|
|
|
|
|
| ||||
|
Consolidated profit before taxes |
|
1,350 |
|
946 |
|
3,113 |
|
1,415 |
| ||||
|
|
|
|
|
|
|
|
|
|
| ||||
|
Provision (benefit) for income taxes |
|
318 |
|
209 |
|
830 |
|
440 |
| ||||
|
Profit of consolidated companies |
|
1,032 |
|
737 |
|
2,283 |
|
975 |
| ||||
|
|
|
|
|
|
|
|
|
|
| ||||
|
Equity in profit (loss) of unconsolidated affiliated companies |
|
(10 |
) |
(4 |
) |
(18 |
) |
(6 |
) | ||||
|
|
|
|
|
|
|
|
|
|
| ||||
|
Profit of consolidated and affiliated companies |
|
1,022 |
|
733 |
|
2,265 |
|
969 |
| ||||
|
|
|
|
|
|
|
|
|
|
| ||||
|
Less: Profit (loss) attributable to noncontrolling interests |
|
7 |
|
26 |
|
25 |
|
29 |
| ||||
|
|
|
|
|
|
|
|
|
|
| ||||
|
Profit (1) |
|
$ |
1,015 |
|
$ |
707 |
|
$ |
2,240 |
|
$ |
940 |
|
|
|
|
|
|
|
|
|
|
|
| ||||
|
Profit per common share |
|
$ |
1.57 |
|
$ |
1.12 |
|
$ |
3.48 |
|
$ |
1.50 |
|
|
|
|
|
|
|
|
|
|
|
| ||||
|
Profit per common share — diluted (2) |
|
$ |
1.52 |
|
$ |
1.09 |
|
$ |
3.36 |
|
$ |
1.46 |
|
|
|
|
|
|
|
|
|
|
|
| ||||
|
Weighted average common shares outstanding (millions) |
|
|
|
|
|
|
|
|
| ||||
|
- Basic |
|
645.5 |
|
629.8 |
|
643.3 |
|
628.1 |
| ||||
|
- Diluted (2) |
|
667.2 |
|
647.0 |
|
666.0 |
|
645.2 |
| ||||
|
|
|
|
|
|
|
|
|
|
| ||||
|
Cash dividends declared per common share |
|
$ |
0.90 |
|
$ |
0.86 |
|
$ |
0.90 |
|
$ |
0.86 |
|
|
(1) |
Profit attributable to common stockholders. |
|
(2) |
Diluted by assumed exercise of stock-based compensation awards using the treasury stock method. |
Caterpillar Inc.
Condensed Consolidated Statement of Financial Position
(Unaudited)
(Millions of dollars)
|
|
|
June 30, |
|
December 31, |
| ||
|
|
|
2011 |
|
2010 |
| ||
|
Assets |
|
|
|
|
| ||
|
Current assets: |
|
|
|
|
| ||
|
Cash and short-term investments |
|
$ |
10,715 |
|
$ |
3,592 |
|
|
Receivables - trade and other |
|
8,916 |
|
8,494 |
| ||
|
Receivables - finance |
|
8,117 |
|
8,298 |
| ||
|
Deferred and refundable income taxes |
|
979 |
|
931 |
| ||
|
Prepaid expenses and other current assets |
|
669 |
|
908 |
| ||
|
Inventories |
|
11,359 |
|
9,587 |
| ||
|
Total current assets |
|
40,755 |
|
31,810 |
| ||
|
|
|
|
|
|
| ||
|
Property, plant and equipment — net |
|
12,430 |
|
12,539 |
| ||
|
Long-term receivables - trade and other |
|
1,023 |
|
793 |
| ||
|
Long-term receivables - finance |
|
11,941 |
|
11,264 |
| ||
|
Investments in unconsolidated affiliated companies |
|
123 |
|
164 |
| ||
|
Noncurrent deferred and refundable income taxes |
|
2,387 |
|
2,493 |
| ||
|
Intangible assets |
|
775 |
|
805 |
| ||
|
Goodwill |
|
2,610 |
|
2,614 |
| ||
|
Other assets |
|
1,567 |
|
1,538 |
| ||
|
Total assets |
|
$ |
73,611 |
|
$ |
64,020 |
|
|
|
|
|
|
|
| ||
|
Liabilities |
|
|
|
|
| ||
|
Current liabilities: |
|
|
|
|
| ||
|
Short-term borrowings: |
|
|
|
|
| ||
|
— Machinery and Power Systems |
|
$ |
310 |
|
$ |
204 |
|
|
— Financial Products |
|
4,058 |
|
3,852 |
| ||
|
Accounts payable |
|
6,858 |
|
5,856 |
| ||
|
Accrued expenses |
|
2,850 |
|
2,880 |
| ||
|
Accrued wages, salaries and employee benefits |
|
1,597 |
|
1,670 |
| ||
|
Customer advances |
|
1,823 |
|
1,831 |
| ||
|
Dividends payable |
|
297 |
|
281 |
| ||
|
Other current liabilities |
|
1,629 |
|
1,521 |
| ||
|
Long-term debt due within one year: |
|
|
|
|
| ||
|
— Machinery and Power Systems |
|
197 |
|
495 |
| ||
|
— Financial Products |
|
3,891 |
|
3,430 |
| ||
|
Total current liabilities |
|
23,510 |
|
22,020 |
| ||
|
|
|
|
|
|
| ||
|
Long-term debt due after one year: |
|
|
|
|
| ||
|
— Machinery and Power Systems |
|
8,913 |
|
4,505 |
| ||
|
— Financial Products |
|
17,013 |
|
15,932 |
| ||
|
Liability for postemployment benefits |
|
7,438 |
|
7,584 |
| ||
|
Other liabilities |
|
2,841 |
|
2,654 |
| ||
|
Total liabilities |
|
59,715 |
|
52,695 |
| ||
|
|
|
|
|
|
| ||
|
Redeemable noncontrolling interest |
|
460 |
|
461 |
| ||
|
|
|
|
|
|
| ||
|
Stockholders’ equity |
|
|
|
|
| ||
|
Common stock |
|
4,165 |
|
3,888 |
| ||
|
Treasury stock |
|
(10,311 |
) |
(10,397 |
) | ||
|
Profit employed in the business |
|
23,081 |
|
21,384 |
| ||
|
Accumulated other comprehensive income (loss) |
|
(3,544 |
) |
(4,051 |
) | ||
|
Noncontrolling interests |
|
45 |
|
40 |
| ||
|
Total stockholders’ equity |
|
13,436 |
|
10,864 |
| ||
|
Total liabilities, redeemable noncontrolling interest and stockholders’ equity |
|
$ |
73,611 |
|
$ |
64,020 |
|
Caterpillar Inc.
Condensed Consolidated Statement of Cash Flow
(Unaudited)
(Millions of dollars)
|
|
|
Six Months Ended |
| ||||
|
|
|
June 30, |
| ||||
|
|
|
2011 |
|
2010 |
| ||
|
Cash flow from operating activities: |
|
|
|
|
| ||
|
Profit of consolidated and affiliated companies |
|
$ |
2,265 |
|
$ |
969 |
|
|
Adjustments for non-cash items: |
|
|
|
|
| ||
|
Depreciation and amortization |
|
1,174 |
|
1,116 |
| ||
|
Other |
|
337 |
|
176 |
| ||
|
Changes in assets and liabilities, net of acquisitions and divestitures: |
|
|
|
|
| ||
|
Receivables – trade and other |
|
45 |
|
(1,096 |
) | ||
|
Inventories |
|
(1,850 |
) |
(1,020 |
) | ||
|
Accounts payable |
|
1,056 |
|
1,319 |
| ||
|
Accrued expenses |
|
(41 |
) |
(91 |
) | ||
|
Accrued wages, salaries and employee benefits |
|
(91 |
) |
413 |
| ||
|
Customer advances |
|
14 |
|
171 |
| ||
|
Other assets – net |
|
28 |
|
288 |
| ||
|
Other liabilities – net |
|
357 |
|
(334 |
) | ||
|
Net cash provided by (used for) operating activities |
|
3,294 |
|
1,911 |
| ||
|
Cash flow from investing activities: |
|
|
|
|
| ||
|
Capital expenditures – excluding equipment leased to others |
|
(924 |
) |
(652 |
) | ||
|
Expenditures for equipment leased to others |
|
(580 |
) |
(372 |
) | ||
|
Proceeds from disposals of leased assets and property, plant and equipment |
|
621 |
|
755 |
| ||
|
Additions to finance receivables |
|
(4,294 |
) |
(4,017 |
) | ||
|
Collections of finance receivables |
|
3,981 |
|
4,161 |
| ||
|
Proceeds from sale of finance receivables |
|
104 |
|
5 |
| ||
|
Investments and acquisitions (net of cash acquired) |
|
(68 |
) |
(170 |
) | ||
|
Proceeds from sale of businesses and investments (net of cash sold) |
|
21 |
|
— |
| ||
|
Proceeds from sale of available-for-sale securities |
|
122 |
|
90 |
| ||
|
Investments in available-for-sale securities |
|
(131 |
) |
(81 |
) | ||
|
Other – net |
|
(38 |
) |
6 |
| ||
|
Net cash provided by (used for) investing activities |
|
(1,186 |
) |
(275 |
) | ||
|
Cash flow from financing activities: |
|
|
|
|
| ||
|
Dividends paid |
|
(565 |
) |
(527 |
) | ||
|
Distribution to noncontrolling interests |
|
(2 |
) |
— |
| ||
|
Common stock issued, including treasury shares reissued |
|
96 |
|
84 |
| ||
|
Excess tax benefit from stock-based compensation |
|
159 |
|
39 |
| ||
|
Acquisitions of noncontrolling interests |
|
— |
|
(26 |
) | ||
|
Proceeds from debt issued (original maturities greater than three months) |
|
10,948 |
|
4,251 |
| ||
|
Payments on debt (original maturities greater than three months) |
|
(5,744 |
) |
(6,471 |
) | ||
|
Short-term borrowings - net (original maturities three months or less) |
|
36 |
|
(136 |
) | ||
|
Net cash provided by (used for) financing activities |
|
4,928 |
|
(2,786 |
) | ||
|
Effect of exchange rate changes on cash |
|
87 |
|
(120 |
) | ||
|
Increase (decrease) in cash and short-term investments |
|
7,123 |
|
(1,270 |
) | ||
|
Cash and short-term investments at beginning of period |
|
3,592 |
|
4,867 |
| ||
|
Cash and short-term investments at end of period |
|
$ |
10,715 |
|
$ |
3,597 |
|
All short-term investments, which consist primarily of highly liquid investments with original maturities of three months or less, are considered to be cash equivalents.
Caterpillar Inc.
Supplemental Data for Results of Operations
For The Three Months Ended June 30, 2011
(Unaudited)
(Millions of dollars)
|
|
|
|
|
Supplemental Consolidating Data |
| ||||||||
|
|
|
Consolidated |
|
Machinery |
|
Financial |
|
Consolidating |
| ||||
|
Sales and revenues: |
|
|
|
|
|
|
|
|
| ||||
|
Sales of Machinery and Power Systems |
|
$ |
13,535 |
|
$ |
13,535 |
|
$ |
— |
|
$ |
— |
|
|
Revenues of Financial Products |
|
695 |
|
— |
|
777 |
|
(82 |
)(2) | ||||
|
Total sales and revenues |
|
14,230 |
|
13,535 |
|
777 |
|
(82 |
) | ||||
|
|
|
|
|
|
|
|
|
|
| ||||
|
Operating costs: |
|
|
|
|
|
|
|
|
| ||||
|
Cost of goods sold |
|
10,303 |
|
10,303 |
|
— |
|
— |
| ||||
|
Selling, general and administrative expenses |
|
1,257 |
|
1,121 |
|
141 |
|
(5 |
)(3) | ||||
|
Research and development expenses |
|
584 |
|
584 |
|
— |
|
— |
| ||||
|
Interest expense of Financial Products |
|
209 |
|
— |
|
209 |
|
— |
(4) | ||||
|
Other operating (income) expenses |
|
276 |
|
14 |
|
271 |
|
(9 |
)(3) | ||||
|
Total operating costs |
|
12,629 |
|
12,022 |
|
621 |
|
(14 |
) | ||||
|
|
|
|
|
|
|
|
|
|
| ||||
|
Operating profit |
|
1,601 |
|
1,513 |
|
156 |
|
(68 |
) | ||||
|
|
|
|
|
|
|
|
|
|
| ||||
|
Interest expense excluding Financial Products |
|
90 |
|
101 |
|
— |
|
(11 |
)(4) | ||||
|
Other income (expense) |
|
(161 |
) |
(235 |
) |
17 |
|
57 |
(5) | ||||
|
|
|
|
|
|
|
|
|
|
| ||||
|
Consolidated profit before taxes |
|
1,350 |
|
1,177 |
|
173 |
|
— |
| ||||
|
|
|
|
|
|
|
|
|
|
| ||||
|
Provision for income taxes |
|
318 |
|
273 |
|
45 |
|
— |
| ||||
|
Profit of consolidated companies |
|
1,032 |
|
904 |
|
128 |
|
— |
| ||||
|
|
|
|
|
|
|
|
|
|
| ||||
|
Equity in profit (loss) of unconsolidated affiliated companies |
|
(10 |
) |
(10 |
) |
— |
|
— |
| ||||
|
Equity in profit of Financial Products’ subsidiaries |
|
— |
|
123 |
|
— |
|
(123 |
)(6) | ||||
|
|
|
|
|
|
|
|
|
|
| ||||
|
Profit of consolidated and affiliated companies |
|
1,022 |
|
1,017 |
|
128 |
|
(123 |
) | ||||
|
|
|
|
|
|
|
|
|
|
| ||||
|
Less: Profit (loss) attributable to noncontrolling interests |
|
7 |
|
2 |
|
5 |
|
— |
| ||||
|
|
|
|
|
|
|
|
|
|
| ||||
|
Profit (7) |
|
$ |
1,015 |
|
$ |
1,015 |
|
$ |
123 |
|
$ |
(123 |
) |
|
(1) |
Represents Caterpillar Inc. and its subsidiaries with Financial Products accounted for on the equity basis. |
|
(2) |
Elimination of Financial Products’ revenues earned from Machinery and Power Systems. |
|
(3) |
Elimination of net expenses recorded by Machinery and Power Systems paid to Financial Products. |
|
(4) |
Elimination of interest expense recorded between Financial Products and Machinery and Power Systems. |
|
(5) |
Elimination of discount recorded by Machinery and Power Systems on receivables sold to Financial Products and of interest earned between Machinery and Power Systems and Financial Products. |
|
(6) |
Elimination of Financial Products’ profit due to equity method of accounting. |
|
(7) |
Profit attributable to common stockholders. |
Caterpillar Inc.
Supplemental Data for Results of Operations
For The Three Months Ended June 30, 2010
(Unaudited)
(Millions of dollars)
|
|
|
|
|
Supplemental Consolidating Data |
| ||||||||
|
|
|
Consolidated |
|
Machinery |
|
Financial |
|
Consolidating |
| ||||
|
Sales and revenues: |
|
|
|
|
|
|
|
|
| ||||
|
Sales of Machinery and Power Systems |
|
$ |
9,723 |
|
$ |
9,723 |
|
$ |
— |
|
$ |
— |
|
|
Revenues of Financial Products |
|
686 |
|
— |
|
753 |
|
(67 |
)(2) | ||||
|
Total sales and revenues |
|
10,409 |
|
9,723 |
|
753 |
|
(67 |
) | ||||
|
|
|
|
|
|
|
|
|
|
| ||||
|
Operating costs: |
|
|
|
|
|
|
|
|
| ||||
|
Cost of goods sold |
|
7,372 |
|
7,372 |
|
— |
|
— |
| ||||
|
Selling, general and administrative expenses |
|
1,059 |
|
918 |
|
145 |
|
(4 |
)(3) | ||||
|
Research and development expenses |
|
450 |
|
450 |
|
— |
|
— |
| ||||
|
Interest expense of Financial Products |
|
234 |
|
— |
|
234 |
|
— |
(4) | ||||
|
Other operating (income) expenses |
|
317 |
|
44 |
|
282 |
|
(9 |
)(3) | ||||
|
Total operating costs |
|
9,432 |
|
8,784 |
|
661 |
|
(13 |
) | ||||
|
|
|
|
|
|
|
|
|
|
| ||||
|
Operating profit |
|
977 |
|
939 |
|
92 |
|
(54 |
) | ||||
|
|
|
|
|
|
|
|
|
|
| ||||
|
Interest expense excluding Financial Products |
|
81 |
|
102 |
|
— |
|
(21 |
)(4) | ||||
|
Other income (expense) |
|
50 |
|
— |
|
17 |
|
33 |
(5) | ||||
|
|
|
|
|
|
|
|
|
|
| ||||
|
Consolidated profit before taxes |
|
946 |
|
837 |
|
109 |
|
— |
| ||||
|
|
|
|
|
|
|
|
|
|
| ||||
|
Provision for income taxes |
|
209 |
|
193 |
|
16 |
|
— |
| ||||
|
Profit of consolidated companies |
|
737 |
|
644 |
|
93 |
|
— |
| ||||
|
|
|
|
|
|
|
|
|
|
| ||||
|
Equity in profit (loss) of unconsolidated affiliated companies |
|
(4 |
) |
(4 |
) |
— |
|
— |
| ||||
|
Equity in profit of Financial Products’ subsidiaries |
|
— |
|
90 |
|
— |
|
(90 |
)(6) | ||||
|
|
|
|
|
|
|
|
|
|
| ||||
|
Profit of consolidated and affiliated companies |
|
733 |
|
730 |
|
93 |
|
(90 |
) | ||||
|
|
|
|
|
|
|
|
|
|
| ||||
|
Less: Profit (loss) attributable to noncontrolling interests |
|
26 |
|
23 |
|
3 |
|
— |
| ||||
|
|
|
|
|
|
|
|
|
|
| ||||
|
Profit (7) |
|
$ |
707 |
|
$ |
707 |
|
$ |
90 |
|
$ |
(90 |
) |
|
(1) |
Represents Caterpillar Inc. and its subsidiaries with Financial Products accounted for on the equity basis. |
|
(2) |
Elimination of Financial Products’ revenues earned from Machinery and Power Systems. |
|
(3) |
Elimination of net expenses recorded by Machinery and Power Systems paid to Financial Products. |
|
(4) |
Elimination of interest expense recorded between Financial Products and Machinery and Power Systems. |
|
(5) |
Elimination of discount recorded by Machinery and Power Systems on receivables sold to Financial Products and of interest earned between Machinery and Power Systems and Financial Products. |
|
(6) |
Elimination of Financial Products’ profit due to equity method of accounting. |
|
(7) |
Profit attributable to common stockholders. |
Caterpillar Inc.
Supplemental Data for Results of Operations
For The Six Months Ended June 30, 2011
(Unaudited)
(Millions of dollars)
|
|
|
|
|
Supplemental Consolidating Data |
| ||||||||
|
|
|
Consolidated |
|
Machinery |
|
Financial |
|
Consolidating |
| ||||
|
Sales and revenues: |
|
|
|
|
|
|
|
|
| ||||
|
Sales of Machinery and Power Systems |
|
$ |
25,812 |
|
$ |
25,812 |
|
$ |
— |
|
$ |
— |
|
|
Revenues of Financial Products |
|
1,367 |
|
— |
|
1,517 |
|
(150 |
)(2) | ||||
|
Total sales and revenues |
|
27,179 |
|
25,812 |
|
1,517 |
|
(150 |
) | ||||
|
|
|
|
|
|
|
|
|
|
| ||||
|
Operating costs: |
|
|
|
|
|
|
|
|
| ||||
|
Cost of goods sold |
|
19,360 |
|
19,360 |
|
— |
|
— |
| ||||
|
Selling, general and administrative expenses |
|
2,356 |
|
2,070 |
|
293 |
|
(7 |
)(3) | ||||
|
Research and development expenses |
|
1,109 |
|
1,109 |
|
— |
|
— |
| ||||
|
Interest expense of Financial Products |
|
412 |
|
— |
|
413 |
|
(1 |
)(4) | ||||
|
Other operating (income) expenses |
|
508 |
|
(1 |
) |
529 |
|
(20 |
)(3) | ||||
|
Total operating costs |
|
23,745 |
|
22,538 |
|
1,235 |
|
(28 |
) | ||||
|
|
|
|
|
|
|
|
|
|
| ||||
|
Operating profit |
|
3,434 |
|
3,274 |
|
282 |
|
(122 |
) | ||||
|
|
|
|
|
|
|
|
|
|
| ||||
|
Interest expense excluding Financial Products |
|
177 |
|
198 |
|
— |
|
(21 |
)(4) | ||||
|
Other income (expense) |
|
(144 |
) |
(274 |
) |
29 |
|
101 |
(5) | ||||
|
|
|
|
|
|
|
|
|
|
| ||||
|
Consolidated profit before taxes |
|
3,113 |
|
2,802 |
|
311 |
|
— |
| ||||
|
|
|
|
|
|
|
|
|
|
| ||||
|
Provision for income taxes |
|
830 |
|
747 |
|
83 |
|
— |
| ||||
|
Profit of consolidated companies |
|
2,283 |
|
2,055 |
|
228 |
|
— |
| ||||
|
|
|
|
|
|
|
|
|
|
| ||||
|
Equity in profit (loss) of unconsolidated affiliated companies |
|
(18 |
) |
(18 |
) |
— |
|
— |
| ||||
|
Equity in profit of Financial Products’ subsidiaries |
|
— |
|
220 |
|
— |
|
(220 |
)(6) | ||||
|
|
|
|
|
|
|
|
|
|
| ||||
|
Profit of consolidated and affiliated companies |
|
2,265 |
|
2,257 |
|
228 |
|
(220 |
) | ||||
|
|
|
|
|
|
|
|
|
|
| ||||
|
Less: Profit (loss) attributable to noncontrolling interests |
|
25 |
|
17 |
|
8 |
|
— |
| ||||
|
|
|
|
|
|
|
|
|
|
| ||||
|
Profit (7) |
|
$ |
2,240 |
|
$ |
2,240 |
|
$ |
220 |
|
$ |
(220 |
) |
|
(1) |
Represents Caterpillar Inc. and its subsidiaries with Financial Products accounted for on the equity basis. |
|
(2) |
Elimination of Financial Products’ revenues earned from Machinery and Power Systems. |
|
(3) |
Elimination of net expenses recorded by Machinery and Power Systems paid to Financial Products. |
|
(4) |
Elimination of interest expense recorded between Financial Products and Machinery and Power Systems. |
|
(5) |
Elimination of discount recorded by Machinery and Power Systems on receivables sold to Financial Products and of interest earned between Machinery and Power Systems and Financial Products. |
|
(6) |
Elimination of Financial Products’ profit due to equity method of accounting. |
|
(7) |
Profit attributable to common stockholders. |
Caterpillar Inc.
Supplemental Data for Results of Operations
For The Six Months Ended June 30, 2010
(Unaudited)
(Millions of dollars)
|
|
|
|
|
Supplemental Consolidating Data |
| ||||||||
|
|
|
Consolidated |
|
Machinery |
|
Financial |
|
Consolidating |
| ||||
|
Sales and revenues: |
|
|
|
|
|
|
|
|
| ||||
|
Sales of Machinery and Power Systems |
|
$ |
17,274 |
|
$ |
17,274 |
|
$ |
— |
|
$ |
— |
|
|
Revenues of Financial Products |
|
1,373 |
|
— |
|
1,499 |
|
(126 |
)(2) | ||||
|
Total sales and revenues |
|
18,647 |
|
17,274 |
|
1,499 |
|
(126 |
) | ||||
|
|
|
|
|
|
|
|
|
|
| ||||
|
Operating costs: |
|
|
|
|
|
|
|
|
| ||||
|
Cost of goods sold |
|
13,266 |
|
13,266 |
|
— |
|
— |
| ||||
|
Selling, general and administrative expenses |
|
1,991 |
|
1,716 |
|
289 |
|
(14 |
)(3) | ||||
|
Research and development expenses |
|
852 |
|
852 |
|
— |
|
— |
| ||||
|
Interest expense of Financial Products |
|
467 |
|
— |
|
468 |
|
(1 |
)(4) | ||||
|
Other operating (income) expenses |
|
586 |
|
43 |
|
553 |
|
(10 |
)(3) | ||||
|
Total operating costs |
|
17,162 |
|
15,877 |
|
1,310 |
|
(25 |
) | ||||
|
|
|
|
|
|
|
|
|
|
| ||||
|
Operating profit |
|
1,485 |
|
1,397 |
|
189 |
|
(101 |
) | ||||
|
|
|
|
|
|
|
|
|
|
| ||||
|
Interest expense excluding Financial Products |
|
183 |
|
224 |
|
— |
|
(41 |
)(4) | ||||
|
Other income (expense) |
|
113 |
|
23 |
|
30 |
|
60 |
(5) | ||||
|
|
|
|
|
|
|
|
|
|
| ||||
|
Consolidated profit before taxes |
|
1,415 |
|
1,196 |
|
219 |
|
— |
| ||||
|
|
|
|
|
|
|
|
|
|
| ||||
|
Provision (benefit) for income taxes |
|
440 |
|
395 |
|
45 |
|
— |
| ||||
|
Profit of consolidated companies |
|
975 |
|
801 |
|
174 |
|
— |
| ||||
|
|
|
|
|
|
|
|
|
|
| ||||
|
Equity in profit (loss) of unconsolidated affiliated companies |
|
(6 |
) |
(6 |
) |
— |
|
— |
| ||||
|
Equity in profit of Financial Products’ subsidiaries |
|
— |
|
169 |
|
— |
|
(169 |
)(6) | ||||
|
|
|
|
|
|
|
|
|
|
| ||||
|
Profit of consolidated and affiliated companies |
|
969 |
|
964 |
|
174 |
|
(169 |
) | ||||
|
|
|
|
|
|
|
|
|
|
| ||||
|
Less: Profit (loss) attributable to noncontrolling interests |
|
29 |
|
24 |
|
5 |
|
— |
| ||||
|
|
|
|
|
|
|
|
|
|
| ||||
|
Profit (7) |
|
$ |
940 |
|
$ |
940 |
|
$ |
169 |
|
$ |
(169 |
) |
|
(1) |
Represents Caterpillar Inc. and its subsidiaries with Financial Products accounted for on the equity basis. |
|
(2) |
Elimination of Financial Products’ revenues earned from Machinery and Power Systems. |
|
(3) |
Elimination of net expenses recorded by Machinery and Power Systems paid to Financial Products. |
|
(4) |
Elimination of interest expense recorded between Financial Products and Machinery and Power Systems. |
|
(5) |
Elimination of discount recorded by Machinery and Power Systems on receivables sold to Financial Products and of interest earned between Machinery and Power Systems and Financial Products. |
|
(6) |
Elimination of Financial Products’ profit due to equity method of accounting. |
|
(7) |
Profit attributable to common stockholders. |
Caterpillar Inc.
Supplemental Data for Cash Flow
For The Six Months Ended June 30, 2011
(Unaudited)
(Millions of dollars)
|
|
|
|
|
Supplemental Consolidating Data |
| ||||||||
|
|
|
Consolidated |
|
Machinery |
|
Financial |
|
Consolidating |
| ||||
|
Cash flow from operating activities: |
|
|
|
|
|
|
|
|
| ||||
|
Profit of consolidated and affiliated companies |
|
$ |
2,265 |
|
$ |
2,257 |
|
$ |
228 |
|
$ |
(220 |
)(2) |
|
Adjustments for non-cash items: |
|
|
|
|
|
|
|
|
| ||||
|
Depreciation and amortization |
|
1,174 |
|
810 |
|
364 |
|
— |
| ||||
|
Other |
|
337 |
|
308 |
|
(63 |
) |
92 |
(4) | ||||
|
Financial Products’ dividend in excess of profit |
|
— |
|
80 |
|
— |
|
(80 |
)(3) | ||||
|
Changes in assets and liabilities, net of acquisitions and divestitures: |
|
|
|
|
|
|
|
|
| ||||
|
Receivables - trade and other |
|
45 |
|
1,159 |
|
17 |
|
(1,131 |
)(4),(5) | ||||
|
Inventories |
|
(1,850 |
) |
(1,850 |
) |
— |
|
— |
| ||||
|
Accounts payable |
|
1,056 |
|
1,083 |
|
12 |
|
(39 |
)(4) | ||||
|
Accrued expenses |
|
(41 |
) |
(12 |
) |
(28 |
) |
(1 |
)(4) | ||||
|
Accrued wages, salaries and employee benefits |
|
(91 |
) |
(88 |
) |
(3 |
) |
— |
| ||||
|
Customer advances |
|
14 |
|
14 |
|
— |
|
— |
| ||||
|
Other assets - net |
|
28 |
|
89 |
|
61 |
|
(122 |
)(4) | ||||
|
Other liabilities - net |
|
357 |
|
261 |
|
(25 |
) |
121 |
(4) | ||||
|
Net cash provided by (used for) operating activities |
|
3,294 |
|
4,111 |
|
563 |
|
(1,380 |
) | ||||
|
Cash flow from investing activities: |
|
|
|
|
|
|
|
|
| ||||
|
Capital expenditures - excluding equipment leased to others |
|
(924 |
) |
(921 |
) |
(3 |
) |
— |
| ||||
|
Expenditures for equipment leased to others |
|
(580 |
) |
(54 |
) |
(571 |
) |
45 |
(4) | ||||
|
Proceeds from disposals of leased assets and property, plant and equipment |
|
621 |
|
72 |
|
601 |
|
(52 |
)(4) | ||||
|
Additions to finance receivables |
|
(4,294 |
) |
— |
|
(22,361 |
) |
18,067 |
(5),(8) | ||||
|
Collections of finance receivables |
|
3,981 |
|
— |
|
20,579 |
|
(16,598 |
)(5) | ||||
|
Proceeds from sale of finance receivables |
|
104 |
|
— |
|
104 |
|
— |
| ||||
|
Net intercompany borrowings |
|
— |
|
600 |
|
62 |
|
(662 |
)(6) | ||||
|
Investments and acquisitions (net of cash acquired) |
|
(68 |
) |
(68 |
) |
— |
|
— |
| ||||
|
Proceeds from sale of businesses and investments (net of cash sold) |
|
21 |
|
392 |
|
11 |
|
(382 |
)(8) | ||||
|
Proceeds from sale of available-for-sale securities |
|
122 |
|
6 |
|
116 |
|
— |
| ||||
|
Investments in available-for-sale securities |
|
(131 |
) |
(7 |
) |
(124 |
) |
— |
| ||||
|
Other - net |
|
(38 |
) |
(114 |
) |
76 |
|
— |
| ||||
|
Net cash provided by (used for) investing activities |
|
(1,186 |
) |
(94 |
) |
(1,510 |
) |
418 |
| ||||
|
Cash flow from financing activities: |
|
|
|
|
|
|
|
|
| ||||
|
Dividends paid |
|
(565 |
) |
(565 |
) |
(300 |
) |
300 |
(7) | ||||
|
Distribution to noncontrolling interests |
|
(2 |
) |
(2 |
) |
— |
|
— |
| ||||
|
Common stock issued, including treasury shares reissued |
|
96 |
|
96 |
|
— |
|
— |
| ||||
|
Excess tax benefit from stock-based compensation |
|
159 |
|
159 |
|
— |
|
— |
| ||||
|
Net intercompany borrowings |
|
— |
|
(62 |
) |
(600 |
) |
662 |
(6) | ||||
|
Proceeds from debt issued (original maturities greater than three months) |
|
10,948 |
|
4,530 |
|
6,418 |
|
— |
| ||||
|
Payments on debt (original maturities greater than three months) |
|
(5,744 |
) |
(487 |
) |
(5,257 |
) |
— |
| ||||
|
Short-term borrowings - net (original maturities three months or less) |
|
36 |
|
(69 |
) |
105 |
|
— |
| ||||
|
Net cash provided by (used for) financing activities |
|
4,928 |
|
3,600 |
|
366 |
|
962 |
| ||||
|
Effect of exchange rate changes on cash |
|
87 |
|
14 |
|
73 |
|
— |
| ||||
|
Increase (decrease) in cash and short-term investments |
|
7,123 |
|
7,631 |
|
(508 |
) |
— |
| ||||
|
Cash and short-term investments at beginning of period |
|
3,592 |
|
1,825 |
|
1,767 |
|
— |
| ||||
|
Cash and short-term investments at end of period |
|
$ |
10,715 |
|
$ |
9,456 |
|
$ |
1,259 |
|
$ |
— |
|
|
(1) |
Represents Caterpillar Inc. and its subsidiaries with Financial Products accounted for on the equity basis. |
|
(2) |
Elimination of Financial Products’ profit after tax due to equity method of accounting. |
|
(3) |
Elimination of Financial Products’ dividend to Machinery and Power Systems in excess of Financial Products’ profit. |
|
(4) |
Elimination of non-cash adjustments and changes in assets and liabilities related to consolidated reporting. |
|
(5) |
Reclassification of Cat Financial’s cash flow activity from investing to operating for receivables that arose from the sale of inventory. |
|
(6) |
Elimination of net proceeds and payments to/from Machinery and Power Systems and Financial Products. |
|
(7) |
Elimination of dividend from Financial Products to Machinery and Power Systems. |
|
(8) |
Elimination of proceeds received from Financial Products related to Machinery and Power Systems’ sale of Carter Machinery. |
Caterpillar Inc.
Supplemental Data for Cash Flow
For The Six Months Ended June 30, 2010
(Unaudited)
(Millions of dollars)
|
|
|
|
|
Supplemental Consolidating Data |
| ||||||||
|
|
|
Consolidated |
|
Machinery |
|
Financial |
|
Consolidating |
| ||||
|
Cash flow from operating activities: |
|
|
|
|
|
|
|
|
| ||||
|
Profit of consolidated and affiliated companies |
|
$ |
969 |
|
$ |
964 |
|
$ |
174 |
|
$ |
(169 |
)(2) |
|
Adjustments for non-cash items: |
|
|
|
|
|
|
|
|
| ||||
|
Depreciation and amortization |
|
1,116 |
|
750 |
|
366 |
|
— |
| ||||
|
Other |
|
176 |
|
201 |
|
(95 |
) |
70 |
(4) | ||||
|
Financial Products’ dividend in excess of profit |
|
— |
|
431 |
|
— |
|
(431 |
)(3) | ||||
|
Changes in assets and liabilities, net of acquisitions and divestitures: |
|
|
|
|
|
|
|
|
| ||||
|
Receivables - trade and other |
|
(1,096 |
) |
(701 |
) |
64 |
|
(459 |
)(4),(5) | ||||
|
Inventories |
|
(1,020 |
) |
(1,018 |
) |
— |
|
(2 |
)(4) | ||||
|
Accounts payable |
|
1,319 |
|
1,321 |
|
(9 |
) |
7 |
(4) | ||||
|
Accrued expenses |
|
(91 |
) |
(12 |
) |
(93 |
) |
14 |
(4) | ||||
|
Accrued wages, salaries and employee benefits |
|
413 |
|
402 |
|
11 |
|
— |
| ||||
|
Customer advances |
|
171 |
|
171 |
|
— |
|
— |
| ||||
|
Other assets - net |
|
288 |
|
142 |
|
8 |
|
138 |
(4) | ||||
|
Other liabilities - net |
|
(334 |
) |
(126 |
) |
(56 |
) |
(152 |
)(4) | ||||
|
Net cash provided by (used for) operating activities |
|
1,911 |
|
2,525 |
|
370 |
|
(984 |
) | ||||
|
Cash flow from investing activities: |
|
|
|
|
|
|
|
|
| ||||
|
Capital expenditures - excluding equipment leased to others |
|
(652 |
) |
(660 |
) |
(1 |
) |
9 |
(4) | ||||
|
Expenditures for equipment leased to others |
|
(372 |
) |
— |
|
(397 |
) |
25 |
(4) | ||||
|
Proceeds from disposals of leased assets and property, plant and equipment |
|
755 |
|
47 |
|
724 |
|
(16 |
)(4) | ||||
|
Additions to finance receivables |
|
(4,017 |
) |
— |
|
(11,689 |
) |
7,672 |
(5) | ||||
|
Collections of finance receivables |
|
4,161 |
|
— |
|
11,467 |
|
(7,306 |
)(5) | ||||
|
Proceeds from sale of finance receivables |
|
5 |
|
— |
|
5 |
|
— |
| ||||
|
Net intercompany borrowings |
|
— |
|
(574 |
) |
286 |
|
288 |
(6) | ||||
|
Investments and acquisitions (net of cash acquired) |
|
(170 |
) |
(138 |
) |
(32 |
) |
— |
| ||||
|
Proceeds from sale of available-for-sale securities |
|
90 |
|
3 |
|
87 |
|
— |
| ||||
|
Investments in available-for-sale securities |
|
(81 |
) |
(1 |
) |
(80 |
) |
— |
| ||||
|
Other - net |
|
6 |
|
2 |
|
(16 |
) |
20 |
(7) | ||||
|
Net cash provided by (used for) investing activities |
|
(275 |
) |
(1,321 |
) |
354 |
|
692 |
| ||||
|
Cash flow from financing activities: |
|
|
|
|
|
|
|
|
| ||||
|
Dividends paid |
|
(527 |
) |
(527 |
) |
(600 |
) |
600 |
(8) | ||||
|
Common stock issued, including treasury shares reissued |
|
84 |
|
84 |
|
20 |
|
(20 |
)(7) | ||||
|
Excess tax benefit from stock-based compensation |
|
39 |
|
39 |
|
— |
|
— |
| ||||
|
Acquisitions of noncontrolling interests |
|
(26 |
) |
(26 |
) |
— |
|
— |
| ||||
|
Net intercompany borrowings |
|
— |
|
(286 |
) |
574 |
|
(288 |
)(6) | ||||
|
Proceeds from debt issued (original maturities greater than three months) |
|
4,251 |
|
126 |
|
4,125 |
|
— |
| ||||
|
Payments on debt (original maturities greater than three months) |
|
(6,471 |
) |
(889 |
) |
(5,582 |
) |
— |
| ||||
|
Short-term borrowings - net (original maturities three months or less) |
|
(136 |
) |
(30 |
) |
(106 |
) |
— |
| ||||
|
Net cash provided by (used for) financing activities |
|
(2,786 |
) |
(1,509 |
) |
(1,569 |
) |
292 |
| ||||
|
Effect of exchange rate changes on cash |
|
(120 |
) |
(34 |
) |
(86 |
) |
— |
| ||||
|
Increase (decrease) in cash and short-term investments |
|
(1,270 |
) |
(339 |
) |
(931 |
) |
— |
| ||||
|
Cash and short-term investments at beginning of period |
|
4,867 |
|
2,239 |
|
2,628 |
|
— |
| ||||
|
Cash and short-term investments at end of period |
|
$ |
3,597 |
|
$ |
1,900 |
|
$ |
1,697 |
|
$ |
— |
|
|
(1) |
Represents Caterpillar Inc. and its subsidiaries with Financial Products accounted for on the equity basis. |
|
(2) |
Elimination of Financial Products’ profit after tax due to equity method of accounting. |
|
(3) |
Elimination of Financial Products’ dividend to Machinery and Power Systems in excess of Financial Products’ profit. |
|
(4) |
Elimination of non-cash adjustments and changes in assets and liabilities related to consolidated reporting. |
|
(5) |
Reclassification of Cat Financial’s cash flow activity from investing to operating for receivables that arose from the sale of inventory. |
|
(6) |
Elimination of net proceeds and payments to/from Machinery and Power Systems and Financial Products. |
|
(7) |
Elimination of change in investment and common stock related to Financial Products. |
|
(8) |
Elimination of dividend from Financial Products to Machinery and Power Systems. |
#
Caterpillar Public Release