Attached files
| file | filename |
|---|---|
| 8-K - WESTERN ALLIANCE BANCORPORATION 8-K - WESTERN ALLIANCE BANCORPORATION | a6800614.htm |
| EX-99.1 - EXHIBIT 99.1 - WESTERN ALLIANCE BANCORPORATION | a6800614ex99-1.htm |
Exhibit 99.2
Robert Sarver Chairman & CEO Ken Vecchione President & COO Dale Gibbons Executive Vice President & CFO 2nd Quarter 2011 Earnings Call Western Alliance Bancorporation (NYSE: WAL) July 22, 2011
Forward-Looking Information This presentation contains forward-looking statements that relate to expectations, beliefs, projections, future plans and strategies, anticipated events or trends and similar expressions concerning matters that are not historical facts. The forward-looking statements contained herein reflect our current views about future events and financial performance and are subject to risks, uncertainties, assumptions and changes in circumstances that may cause our actual results to differ significantly from historical results and those expressed in any forward-looking statement. Some factors that could cause actual results to differ materially from historical or expected results include: factors listed in the Company’s annual report on Form 10-K as filed with the Securities and Exchange Commission; changes in general economic conditions, either nationally or locally in the areas in which we conduct or will conduct our business; inflation, interest rate, market and monetary fluctuations; increases in competitive pressures among financial institutions and businesses offering similar products and services; higher defaults on our loan portfolio than we expect; changes in management’s estimate of the adequacy of the allowance for loan losses; legislative or regulatory changes or changes in accounting principles, policies or guidelines; supervisory actions by regulatory agencies which may limit our ability to pursue certain growth opportunities; management’s estimates and projections of interest rates and interest rate policy; the execution of our business plan; and other factors affecting the financial services industry generally or the banking industry in particular. We do not intend and disclaim any duty or obligation to update or revise any industry information or forward-looking statements set forth in this presentation to reflect new information, future events or otherwise.
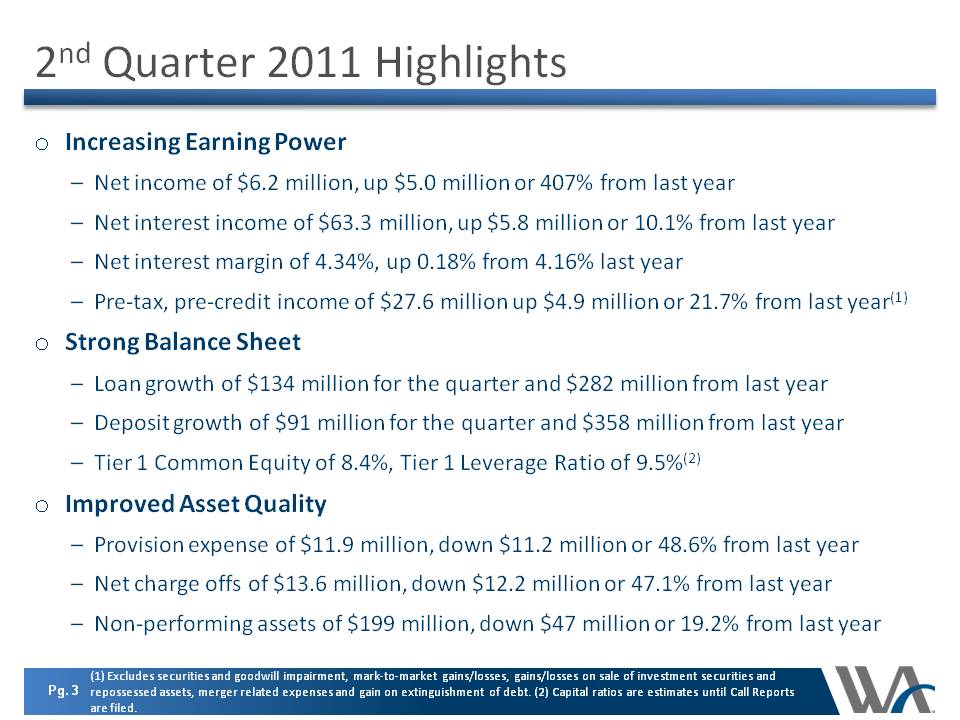
2nd Quarter 2011 Highlights Increasing Earning PowerNet income of $6.2 million, up $5.0 million or 407% from last yearNet interest income of $63.3 million, up $5.8 million or 10.1% from last yearNet interest margin of 4.34%, up 0.18% from 4.16% last yearPre-tax, pre-credit income of $27.6 million up $4.9 million or 21.7% from last year (1)Strong Balance SheetLoan growth of $134 million for the quarter and $282 million from last yearDeposit growth of $91 million for the quarter and $358 million from last yearTier 1 Common Equity of 8.4%, Tier 1 Leverage Ratio of 9.5% (2)Improved Asset QualityProvision expense of $11.9 million, down $11.2 million or 48.6% from last yearNet charge offs of $13.6 million, down $12.2 million or 47.1% from last yearNon-performing assets of $199 million, down $47 million or 19.2% from last year (1) Excludes securities and goodwill impairment, mark-to-market gains/losses, gains/losses on sale of investment securities and repossessed assets, merger related expenses and gain on extinguishment of debt. (2) Capital ratios are estimates until Call Reports are filed.
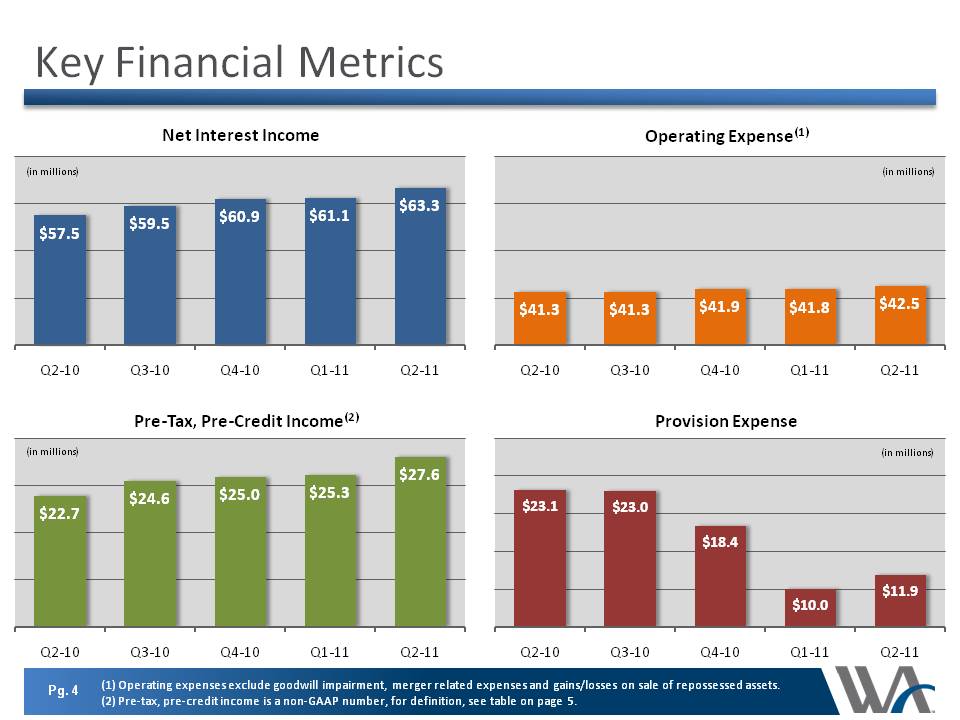
Key Financial Metrics (1) Operating expenses exclude goodwill impairment, merger related expenses and gains/losses on sale of repossessed assets. (2) Pre-tax, pre-credit income is a non-GAAP number, for definition, see table on page 5. (in millions) Net Interest Income $57.5 Q2-10 $59.5 Q3-10 $60.9 Q4-10 $61.1 Q1-11 $63.3 Q2-11 Operating Expense $41.3 $41.9 $41.8 $42.5 Pre-Tax, Pre-Credit Income $22.7 $24.6 $25.0 $25.3 $27.6 Provision Expense $23.1 $23.0 $18.4 $10.0 $11.9
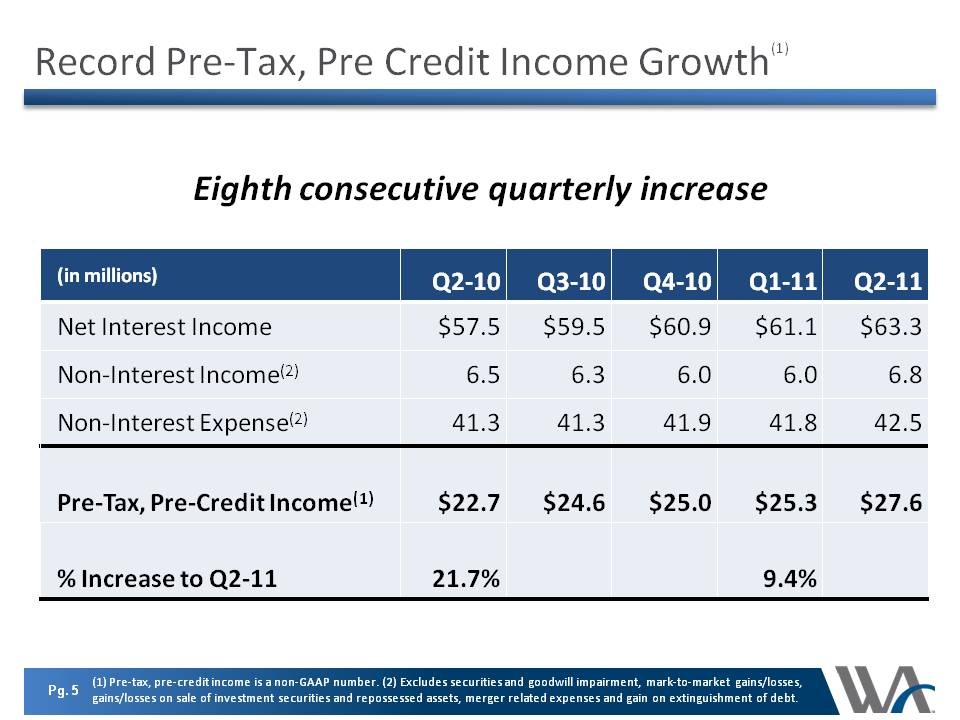
Record Pre-Tax, Pre Credit Income Growth(1) Eighth consecutive quarterly increase (1) Pre-tax, pre-credit income is a non-GAAP number. (2) Excludes securities and goodwill impairment, mark-to-market gains/losses, gains/losses on sale of investment securities and repossessed assets, merger related expenses and gain on extinguishment of debt. (in millions) Q2-10 Q3-10 Q4-10 Q1-11 Q2-11 Net interest income $57.5 $59.5 $60.9 $61.1 $63.3 Non-interest income 6.5 6.3 6.0 6.8 expense 41.3 41.9 41.8 42.5 Pre-tax pre-credit income 22.7 24.6 25.0 25.3 27.6 % increase for Q2-11 21.7% 9.4%
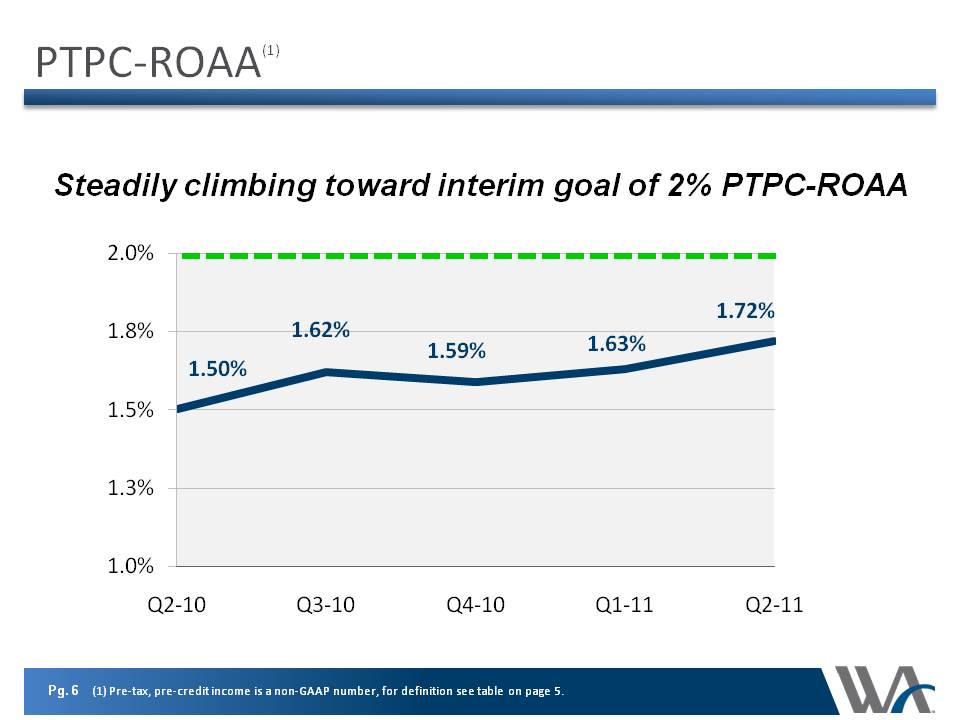
PTPC-ROAA(1) Steadily climbing toward interim goal of 2% PTPC-ROAA 2.0% 1.8% 1.5% 1.3% 1.0% Q2-10 Q3-10 Q4-10 Q1-11 Q2-11 1.50% 1.62% 1.59% 1.63% 1.72% (1) Pre-tax, pre-credit income is a non-GAAP number, for definition see table on page 5.
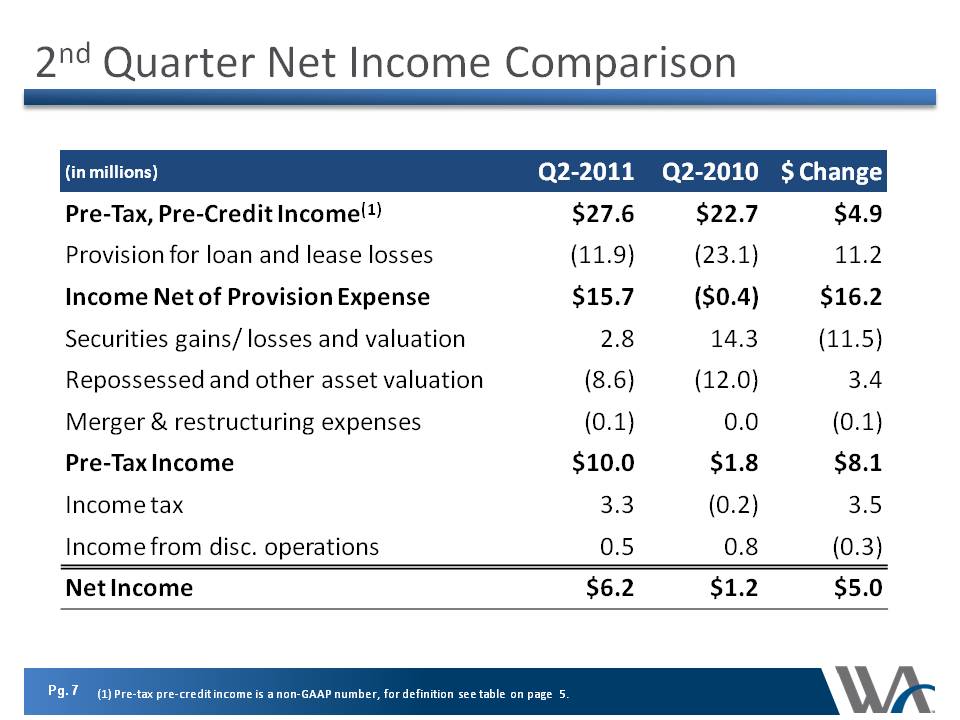
(in millions) 2nd Quarter Net Income Comparison Pre-Tax, Pre-Credit Income(1) Q2-2011 Q2-2010 $ Change Provision for loan and lease losses $27.6 $22.7 $4.9 Income Net of Provision Expense (11.9) (23.1) 11.2 $15.7 ($0.4) $16.2 Securities gains/ losses and valuation 2.8 14.3 (11.5) Repossessed and other asset valuation (8.6) (12.0) 3.4 Merger & restructuring expenses (0.1) 0.0 (0.1) Pre-Tax Income $10.0 $1.8 $8.1 Income tax 3.3 (0.2) 3.5 Income from disc. operations 0.5 0.8 (0.3) Net Income $6.2 $1.2 $5.0 Pre-tax pre-credit income is a non-GAAP number, for definition see table on page 5.
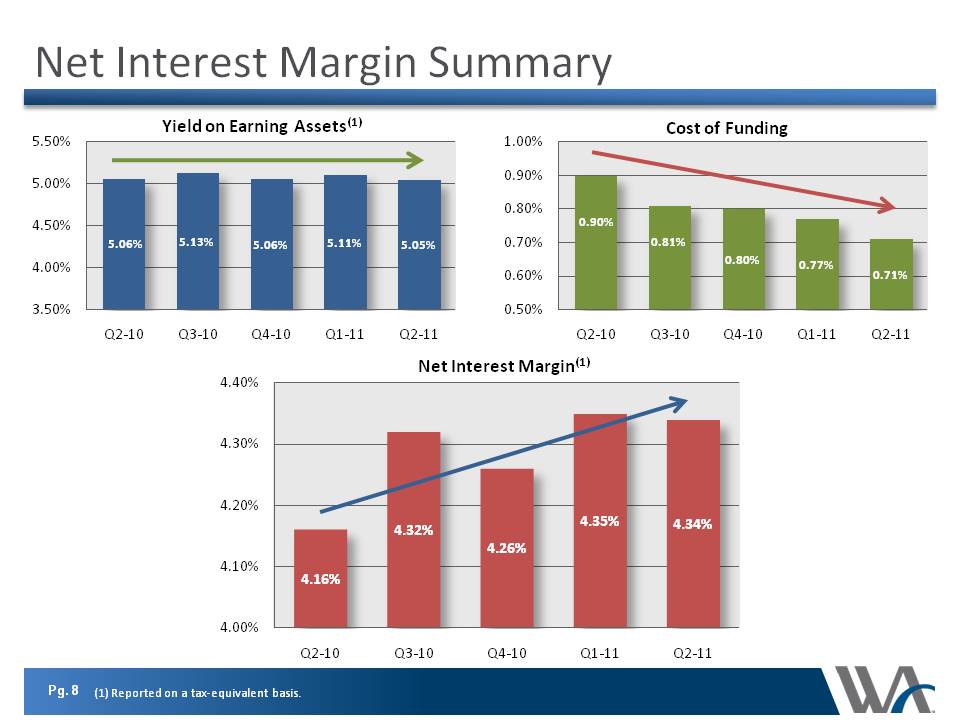
Net Interest Margin Summary Yield on earning assets (1) 5.50% 5.00% 4.50% 4.00% 3.50% 5.06% 5.13% 5.11% 5.05% Q2-10 Q3-10 Q4-10 Q1-11 Q2-11 Cost of funding 1.00% 0.90% 0.80% 0.70% 0.60% 0.50% 0.81% 0.77% 0.71% Net interest margin 4.40% 4.30% 4.20% 4.10% 4.16% 4.32% 4.26% 4.35% 4.34% Reported on a tax-equivalent basis.
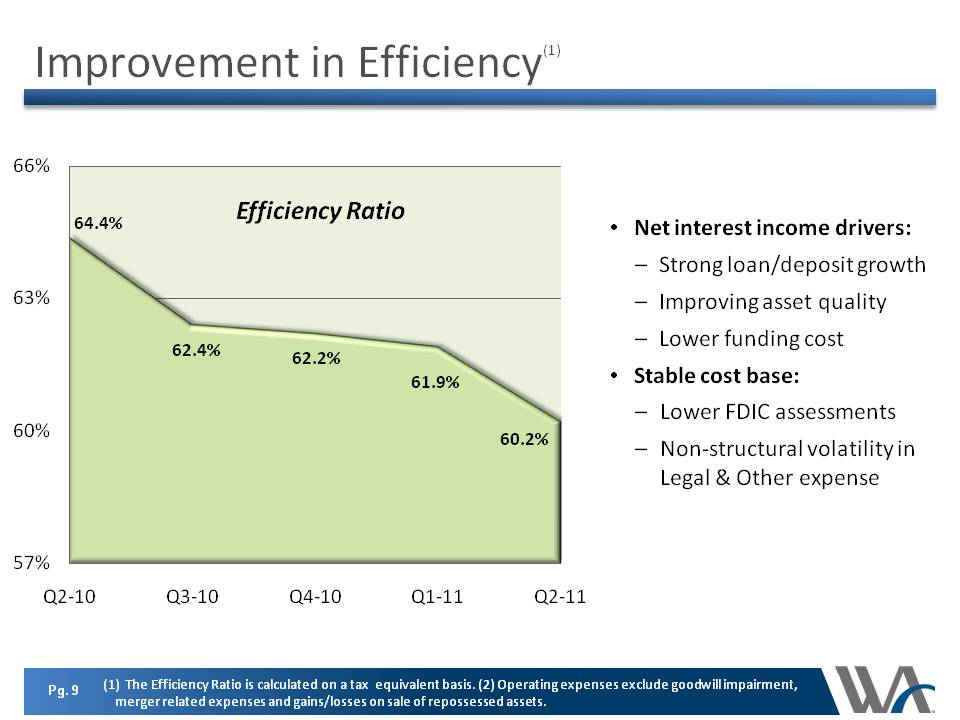
Improvement in Efficiency(1) Net interest income drivers: Strong loan/deposit growthImproving asset qualityLower funding costStable cost base:Lower FDIC assessmentsNon-structural volatility in Legal & Other expense efficiency ratio 66% 63% 60% 57% 64.4% 62.4% 62.2% 61.9% 60.2% Q2-10 Q3-10 Q4-10 Q1-11 Q2-11 (1) The Efficiency Ratio is calculated on a tax equivalent basis. (2) Operating expenses exclude goodwill impairment, merger related expenses and gains/losses on sale of repossessed assets.
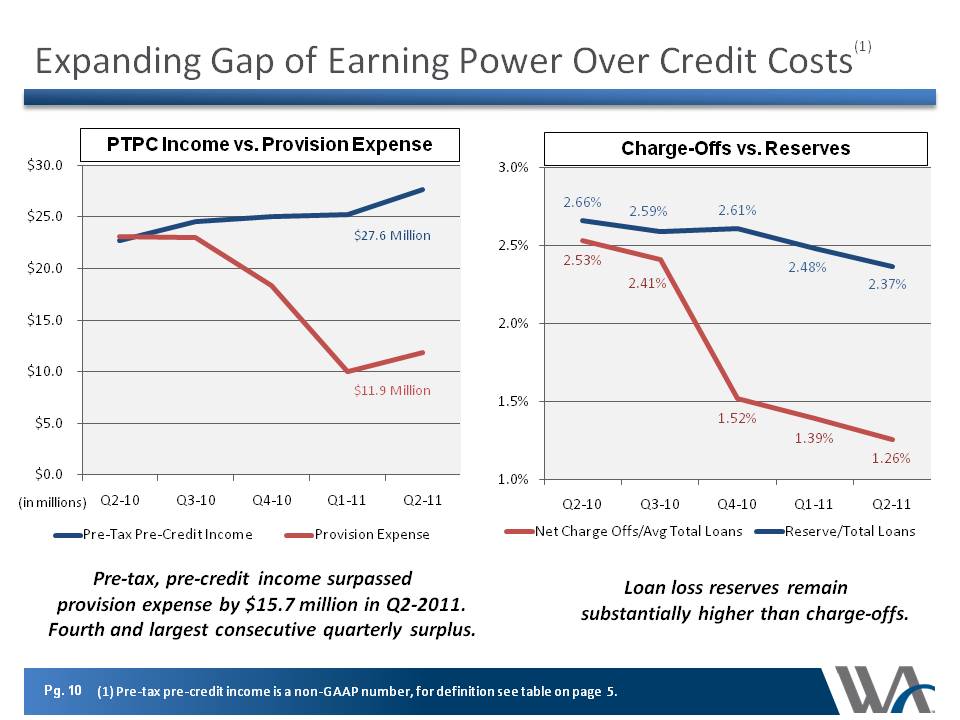
Expanding Gap of Earning Power Over Credit Costs(1) Pre-tax, pre-credit income surpassed provision expense by $15.7 million in Q2-2011. Fourth and largest consecutive quarterly surplus. (in millions) PTPC Income vs. Provision Expense $11.9 Million $27.6 Million Charge-Offs vs. Reserves Loan loss reserves remain substantially higher than charge-offs. $30.0 $25.0 $20.0 $15.0 $10.0 $5.0 $0.0 3.0% 2.5% 2.0% 1.5% 1.0% 2.66% 2.59% 2.61% 2.48% 2.37% 2.53% 2.41% 1.52% 1.39% 1.26% Q2-10 Q3-10 Q4-10 Q1-11 Q2-11 (1) (1) Pre-tax pre-credit income is a non-GAAP number, for definition see table on page 5.
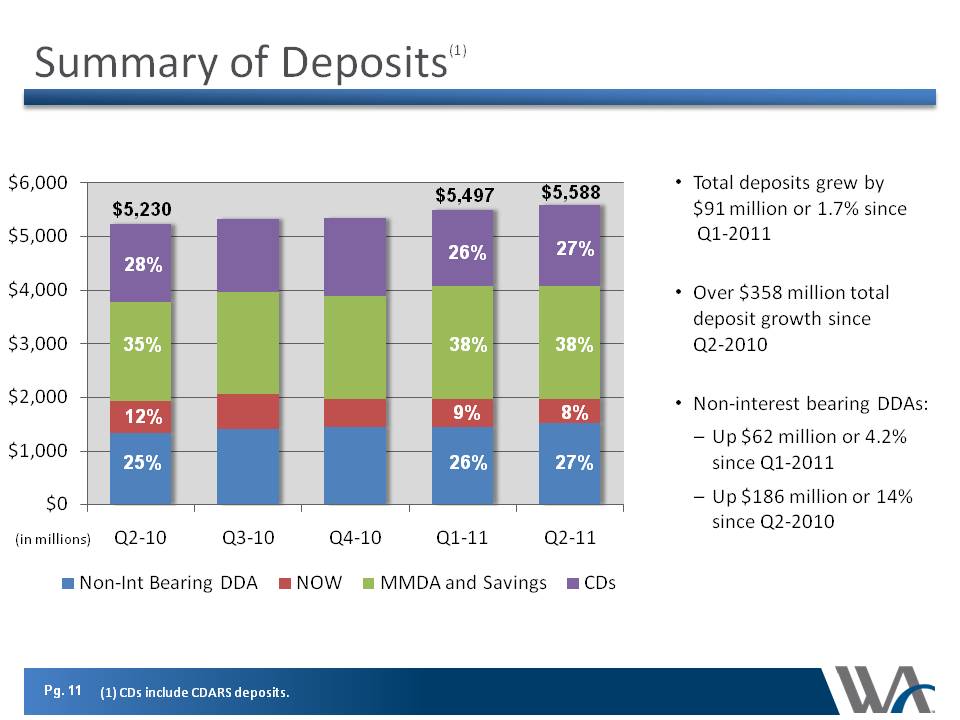
Summary of Deposits(1) 38% 27% 8% Total deposits grew by $91 million or 1.7% since Q1-2011 Over $358 million total deposit growth since Q2-2010 Non-interest bearing DDAs: Up $62 million or 4.2% since Q1-2011 Up $186 million or 14% since Q2-2010 27% $5,230 $5,497 $5,588 38% 26% 9% 26% 35% 28% 12% 25% (1) CDs include CDARS deposits.
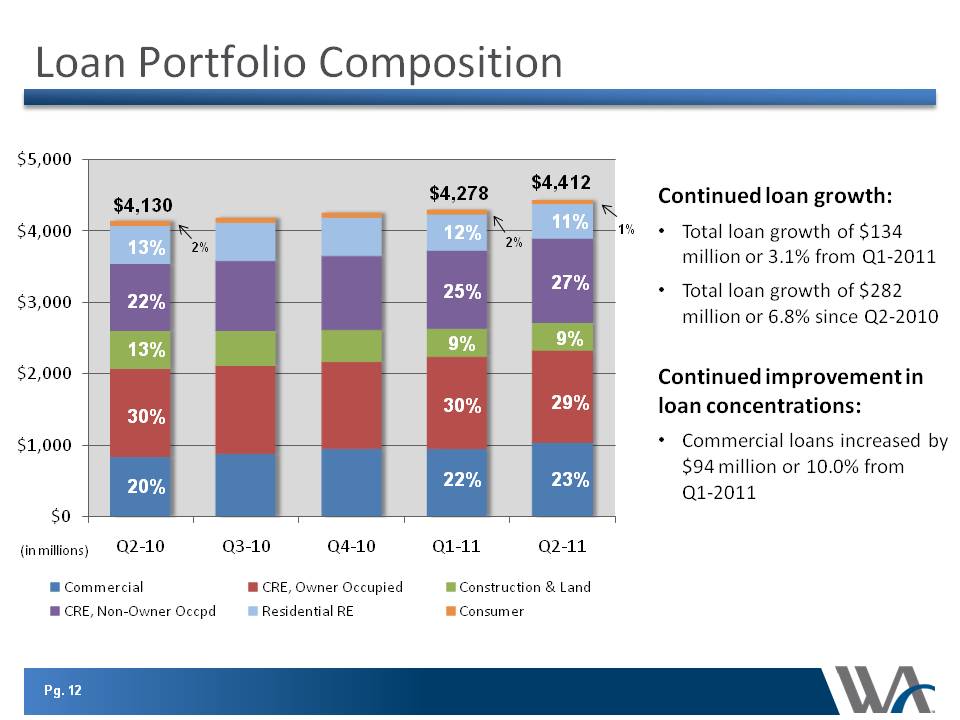
Loan Portfolio Composition (in millions) $4,130 30% 22% 13% 20% 13% 2% $4,278 30% 25% 22% 9% 12% 29% 27% 23% 9% 11% Continued loan growth: Total loan growth of $134 million or 3.1% from Q1-2011 Total loan growth of $282 million or 6.8% since Q2-2010 Continued improvement in loan concentrations: Commercial loans increased by $94 million or 10.0% from Q1-2011 $4,412 2%
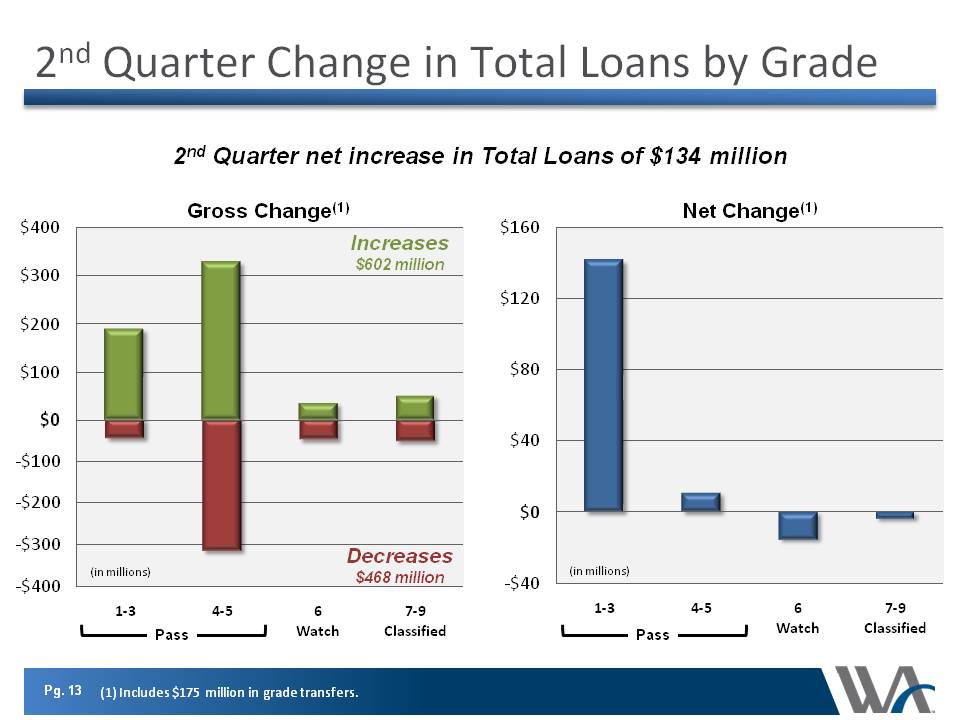
2nd Quarter Change in Total Loans by Grade (Gp:) Pass Increases $602 million Decreases $468 million 2nd Quarter net increase in Total Loans of $134 million (Gp:) Pass Gross Change(1) Net Change(1) $0 (in millions) (in millions)
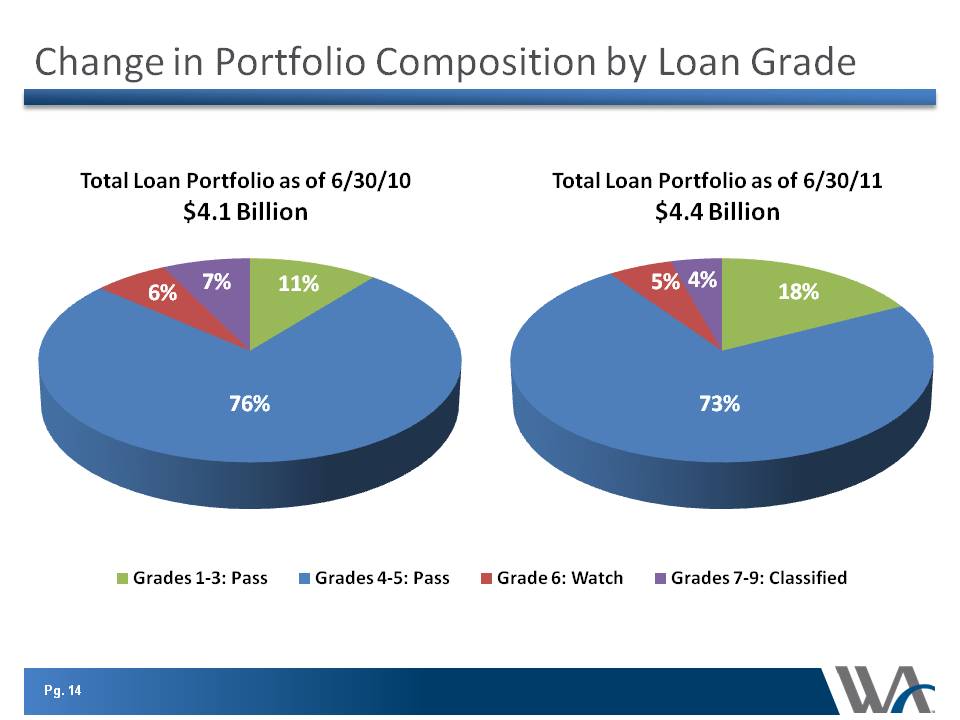
Change in Portfolio Composition by Loan Grade $1.3 Billion total loan portfolio as of 6/30/10 $4.1 billion 6/30/11 $4.4 billion 6% 7% 11% 76% 5% 4% 18% 73% Grades 1-3: pass 4-5 6 watch 7-9: classified
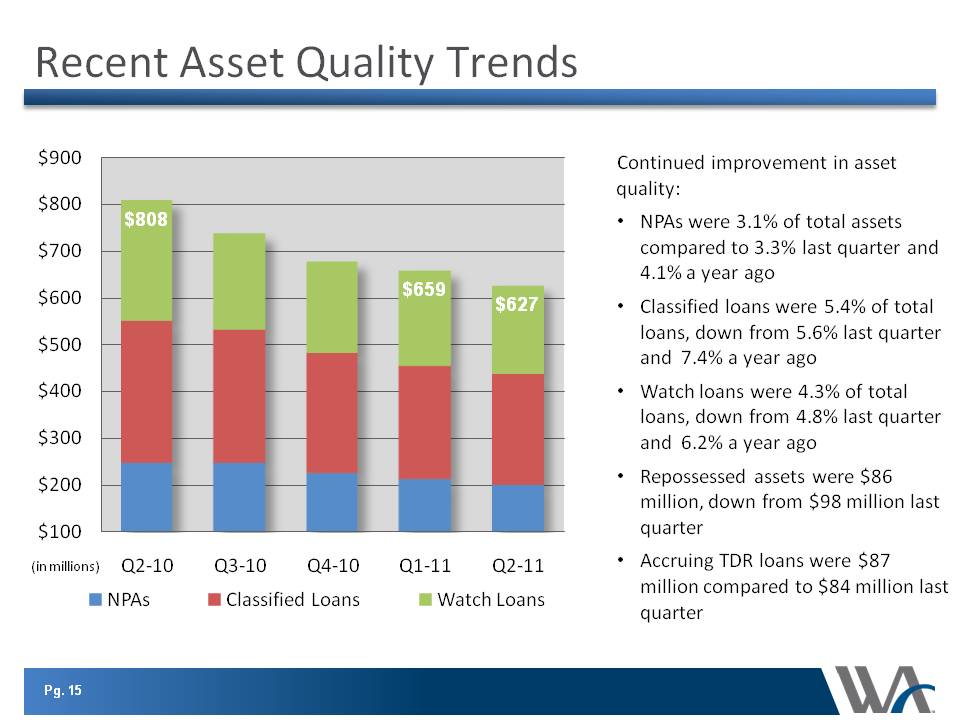
Recent Asset Quality Trends (in millions) Continued improvement in asset quality: NPAs were 3.1% of total assets compared to 3.3% last quarter and 4.1% a year ago Classified loans were 5.4% of total loans, down from 5.6% last quarter and 7.4% a year ago Watch loans were 4.3% of total loans, down from 4.8% last quarter and 6.2% a year ago Repossessed assets were $86 million, down from $98 million last quarter Accruing TDR loans were $87 million compared to $84 million last quarter $808 $627 $659
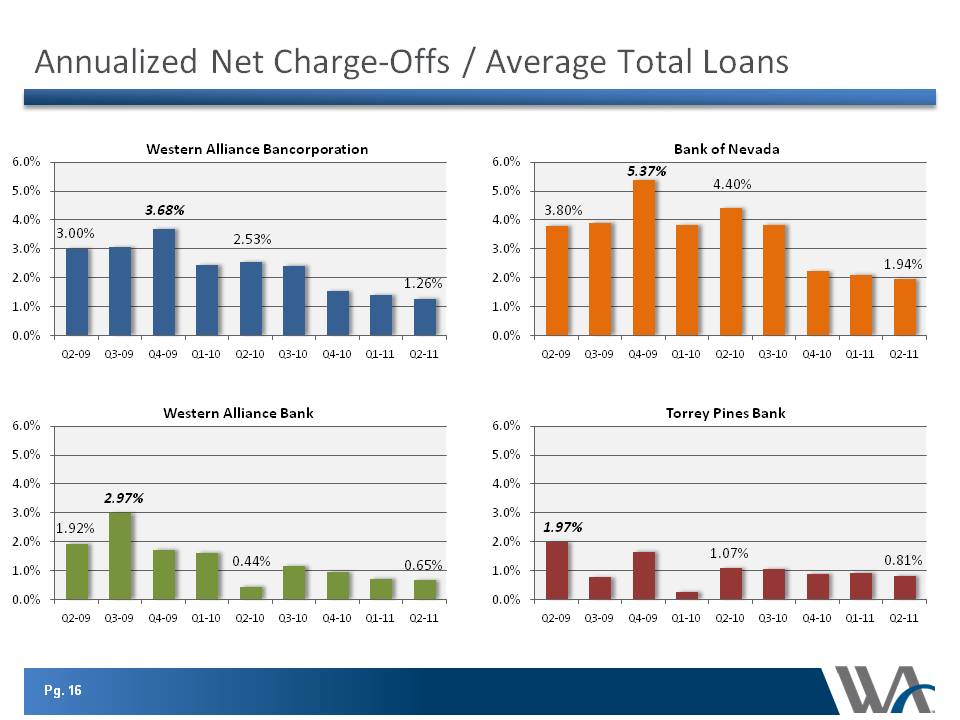
Annualized Net Charge-Offs / Average Total Loans Western Alliance Bancorporation Bank of Nevada Torrey Pines Bank 6.0% 5.0% 4.0% 3.0% 2.0% 1.0% 0.0% Q2-09 Q3-09 Q4-09 Q1-10 Q2-10 Q3-10 Q4-10 Q1-11 Q2-11 3.00% 3.68% 2.53% 1.26% 3.80% 5.37% 4.40% 1.94% 1.92% 2.97% 0.44% 0.65% 1.97% 1.07% 0.81%
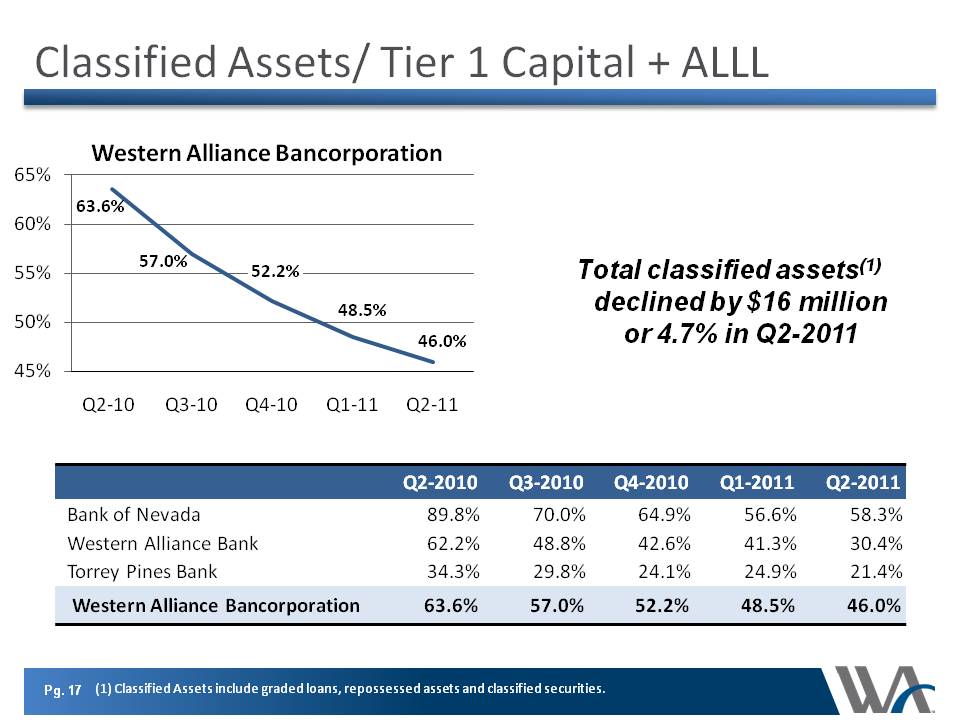
Classified Assets/ Tier 1 Capital + ALLL Total classified assets (1) declined by $16 million or 4.7% in Q2-2011 Western Alliance Bancorporation 65% 60% 55% 50% 45% Q2-10 Q3-10 Q4-10 Q1-11 Q2-11 63.6% 57.0% 52.2 48.5% 46.0% Bank of Nevada 89.8% 70.0% 64.9% 56.6% 58.3% Western Alliance 62.2% 48.8% 42.6% 41.3 30.4% Torrey Pines Bank 34.3% 29.8% 24.1% 24.9% 21.4% 63.6% 57.0 52.2% 48.5% 46.0%
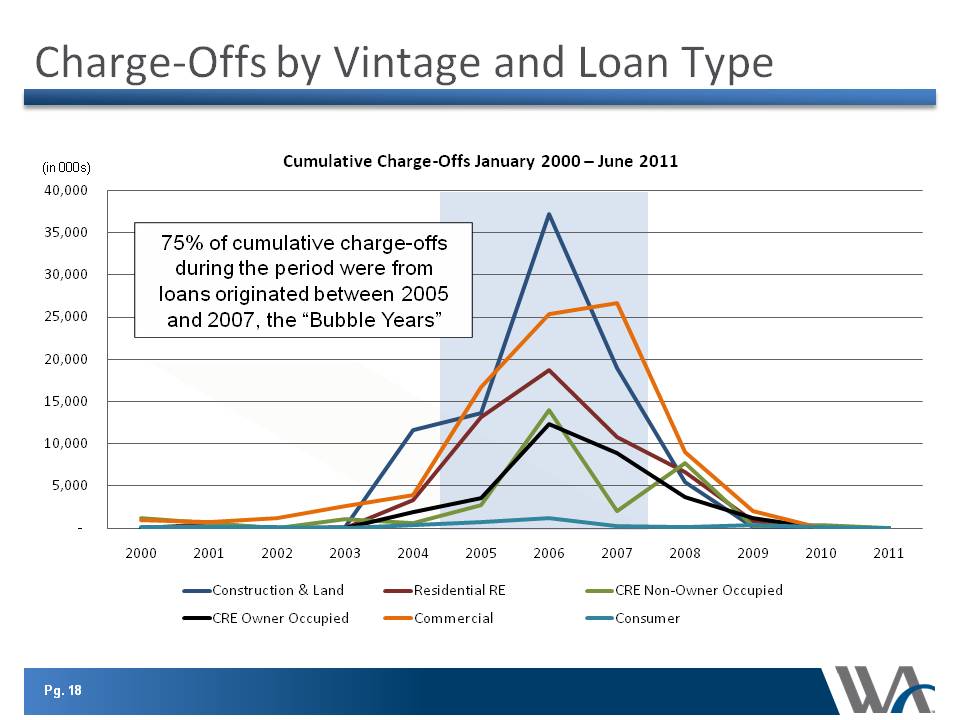
Charge-Offs by Vintage and Loan Type 75% of cumulative charge-offs during the period were from loans originated between 2005 and 2007, the “Bubble Years” (in 000s)
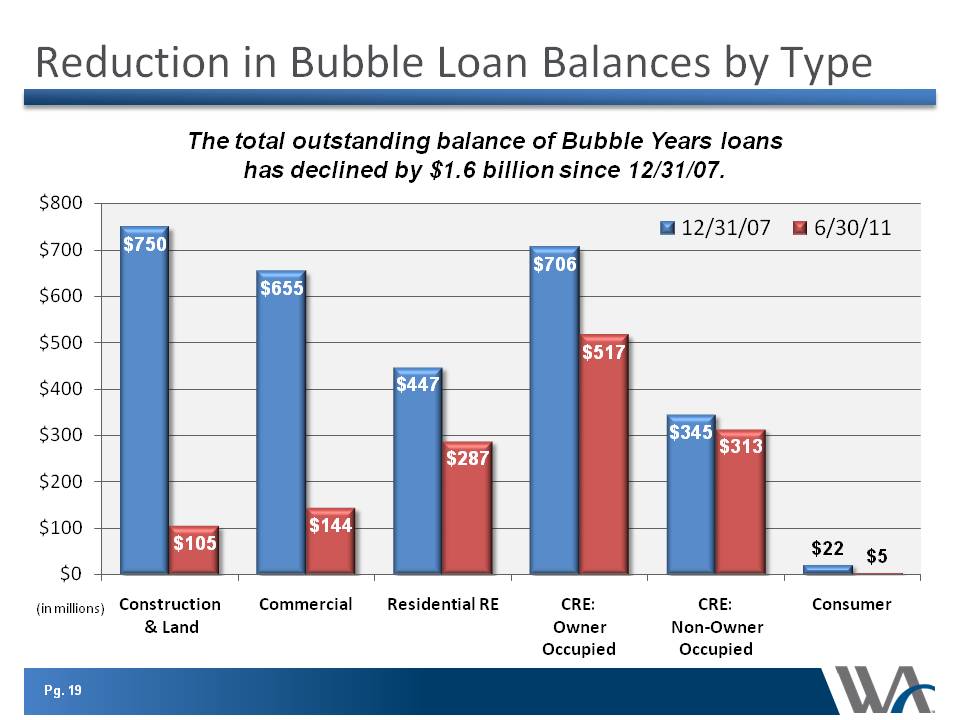
Reduction in Bubble Loan Balances by Type (in millions) The total outstanding balance of Bubble Years loans has declined by $1.6 billion since 12/31/07. Construction & land commercial residential RE CRE: owner occupied Non-owner consumer $800 $700 $600 $500 $400 $300 $200 $100 $0 $750 $105 $655 $144 $447 $287 $706 $517 $345 $313 $22 $5
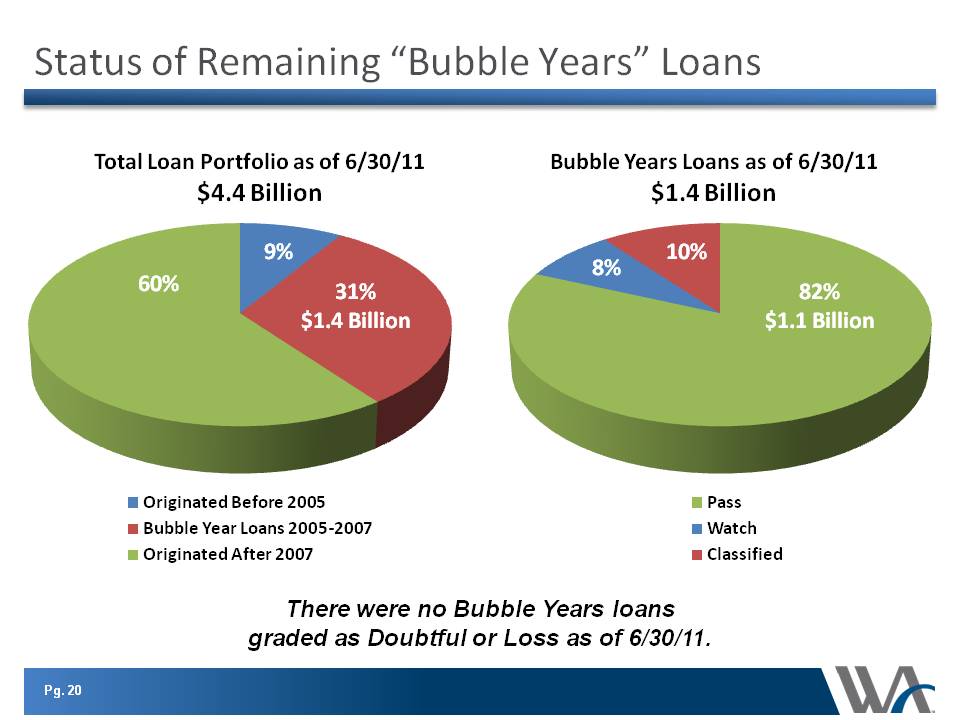
Status of Remaining “Bubble Years” Loans $1.3 Billion There were no Bubble Years loans graded as Doubtful or Loss as of 6/30/11. Total Loan Portfolio as of 6/30/11 $4.4 billion Bubble Years Loans as of 6/30/11 $1.4 billion 60% 9% 31% 8% 10% 82% originated before 2005 bubble years loans 2005-2007 after 2007 pass watch classified
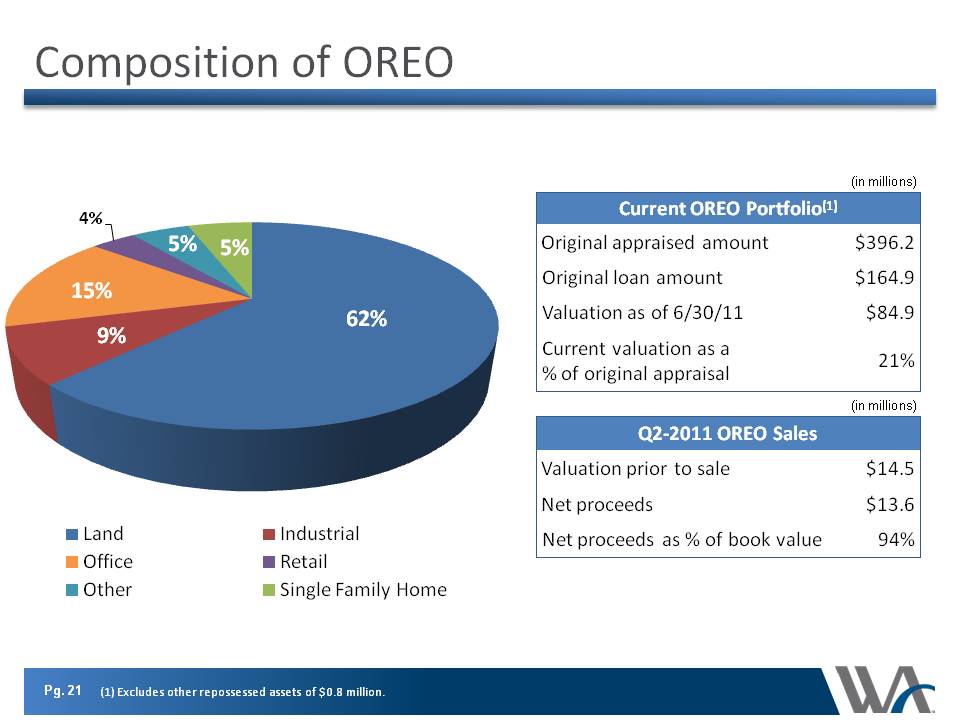
Composition of OREO (in millions) land office other industrial retail single family home 9% 15% 4% 5% 62% current oreo portfolio original appraised amount $396.2 loan $164.9 valuation as of 6/30/11 $84.9 current as a % of appraisal 21% Q2-2011 sales prior to sale $14.5 net proceeds $13.6 book value 94% (1) excludes other repossessed assets of $0.8 million.
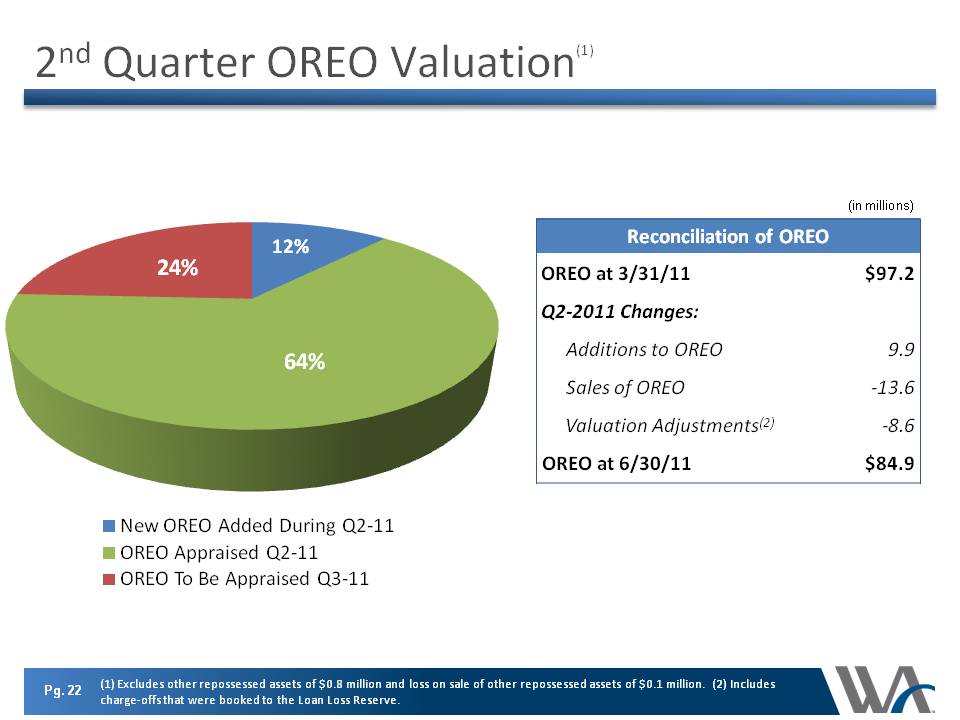
2nd Quarter OREO Valuation (1) (in millions) 24% 12% 64% new added during q2-11 appraised to be q3-11 reconciliation of at 3/31/11 $97.2 q2-2011 changes additions 9.9 sales -13.6 valuation adjustments -8.6 at 6/30/11 $84.9 Excludes other repossessed assets of $0.8 million and loss on sale of other repossessed assets of $0.1 million. (2) includes charge-offs that were booked to the loan loss reserve.
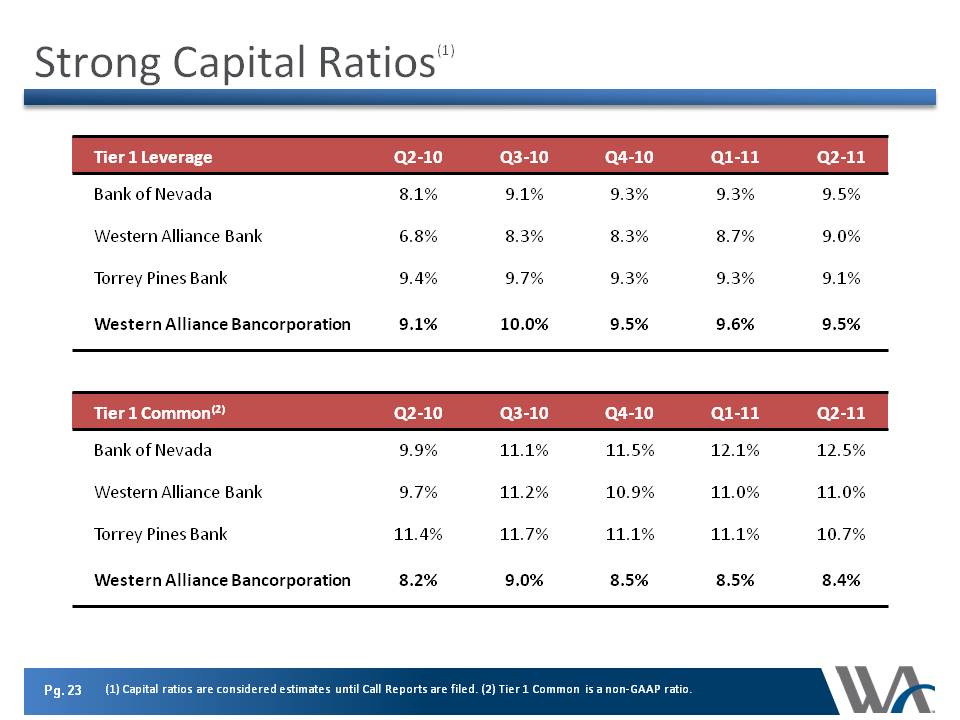
Strong Capital Ratios (1) Capital ratios are considered estimates until Call Reports are filed. (2) Tier 1 Common is a non-GAAP ratio. Tier 1 leverage Q2-10 Q3-10 Q4-10 Q1-11 Q2-11 bank of Nevada 8.1% 9.1% 9.3% 9.5% western alliance bank 6.8% 8.3% 8.7% 9.0% torrey pines bank 9.4% 9.7% bancorporation 10.0% 9.6% common 9.9% 11.1% 11.5% 12.1% 12.5% 11.2% 10.9% 11.0% 11.4% 11.7% 11.1% 10.7% 8.2% 9.0% 8.5% 8.4% capital ratios are considered estimates until call reports are filed. Tier 1 common is a non-gaap ratio.
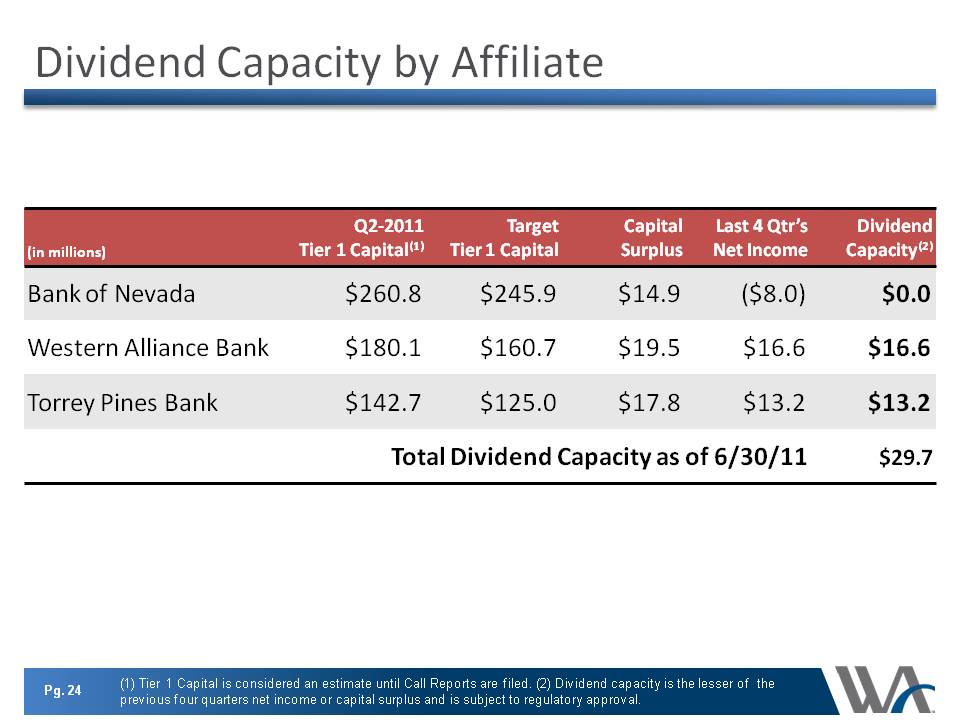
Dividend Capacity by Affiliate (1) Tier 1 Capital is considered an estimate until Call Reports are filed. (2) Dividend capacity is the lesser of the previous four quarters net income or capital surplus and is subject to regulatory approval.
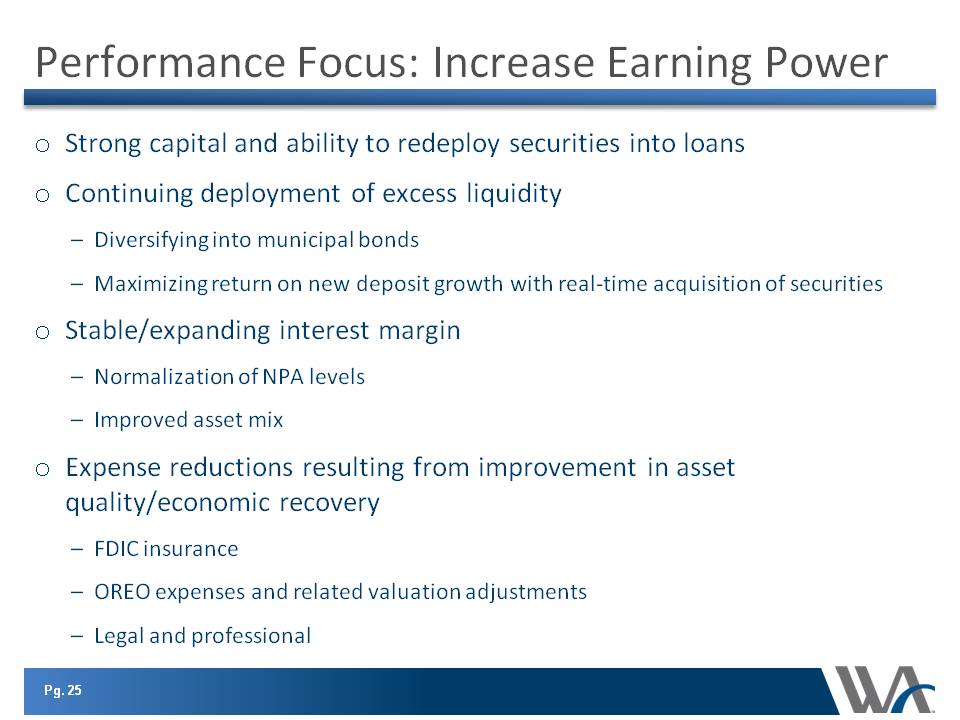
Performance Focus: Increase Earning Power Strong capital and ability to redeploy securities into loansContinuing deployment of excess liquidityDiversifying into municipal bondsMaximizing return on new deposit growth with real-time acquisition of securitiesStable/expanding interest marginNormalization of NPA levelsImproved asset mixExpense reductions resulting from improvement in asset quality/economic recoveryFDIC insuranceOREO expenses and related valuation adjustmentsLegal and professional
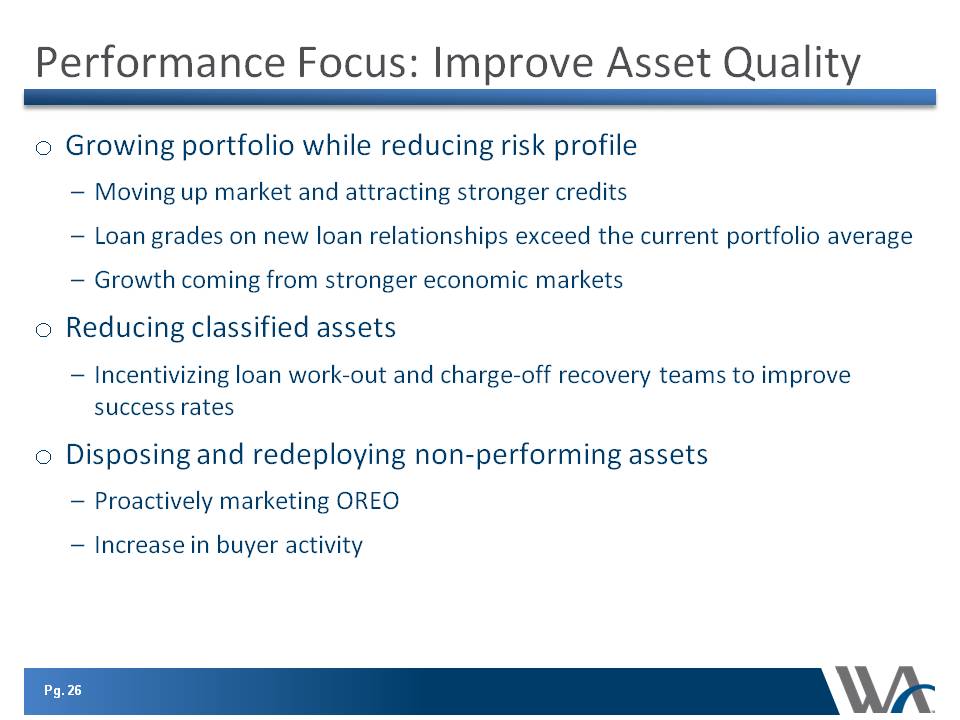
Performance Focus: Improve Asset Quality Growing portfolio while reducing risk profileMoving up market and attracting stronger creditsLoan grades on new loan relationships exceed the current portfolio averageGrowth coming from stronger economic marketsReducing classified assetsIncentivizing loan work-out and charge-off recovery teams to improve success ratesDisposing and redeploying non-performing assetsProactively marketing OREO Increase in buyer activity
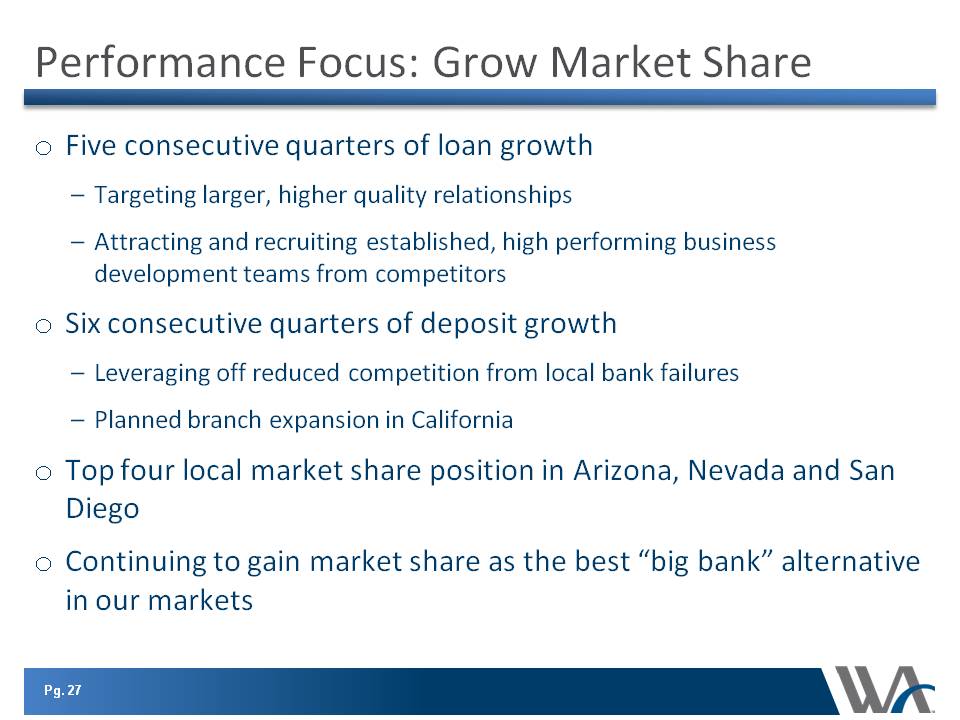
Performance Focus: Grow Market Share Five consecutive quarters of loan growth Targeting larger higher quality relationships Attracting and recruiting established, high performing business development teams from competitors Six consecutive quarters of deposit growth Leveraging off reduced competition from local bank failures Planned branch expansion in California Top four local market share position in Arizona, Nevada and San Diego Continuing to gain market share as the best “big bank” alternative in our markets