Attached files
| file | filename |
|---|---|
| EX-23.1 - CONSENT OF GRANT THORNTON LLP - Great White Energy Services, Inc. | dex231.htm |
Table of Contents
Index to Financial Statements
As filed with the Securities and Exchange Commission on July 19, 2011
Registration No. 333-172174
UNITED STATES
SECURITIES AND EXCHANGE COMMISSION
WASHINGTON, D.C. 20549
Amendment No. 5
to
FORM S-1
REGISTRATION STATEMENT
UNDER
THE SECURITIES ACT OF 1933
Great White Energy Services, Inc.
(Exact name of registrant as specified in its charter)
| Delaware | 1389 | 27-4397307 | ||
| (State or other jurisdiction of incorporation or organization) |
(Primary Standard Industrial Classification Code Number) |
(I.R.S. Employer Identification Number) |
14201 Caliber Drive
Suite 300
Oklahoma City, Oklahoma 73134
(405) 285-5812
(Address, including zip code, and telephone number, including area code, of registrant’s principal executive offices)
David W. Sparkman
Chief Financial Officer and Executive Vice President
Great White Energy Services, Inc.
14201 Caliber Drive
Suite 300
Oklahoma City, Oklahoma 73134
(405) 285-5812
(Name, address, including zip code, and telephone number, including area code, of agent for service)
Copy to:
| Seth R. Molay, P.C. | W. Mark Young | |
| Akin Gump Strauss Hauer & Feld LLP | Andrews Kurth LLP | |
| 1700 Pacific Avenue, Suite 4100 | 600 Travis, Suite 4200 | |
| Dallas, TX 75201 | Houston, TX 77002 | |
| (214) 969-4780 | (713) 220-4200 |
Approximate date of commencement of proposed sale to the public: As soon as practicable after this Registration Statement is declared effective.
If any securities being registered on this form are to be offered on a delayed or continuous basis pursuant to Rule 415 under the Securities Act of 1933, as amended (the “Securities Act”), check the following box. ¨
If this form is filed to register additional securities for an offering pursuant to Rule 462(b) under the Securities Act, check the following box and list the Securities Act registration statement number of the earlier effective registration statement for the same offering. ¨
If this form is a post-effective amendment filed pursuant to Rule 462(c) under the Securities Act, check the following box and list the Securities Act registration statement number of the earlier effective registration statement for the same offering. ¨
If this form is a post-effective amendment filed pursuant to Rule 462(d) under the Securities Act, check the following box and list the Securities Act registration statement number of the earlier effective registration statement for the same offering. ¨
Indicate by check mark whether the registrant is a large accelerated filer, an accelerated filer, a non-accelerated filer, or a smaller reporting company. See the definitions of “large accelerated filer,” “accelerated filer” and “smaller reporting company” in Rule 12b-2 of the Exchange Act. (Check one):
| Large accelerated filer | ¨ | Accelerated filer | ¨ | |||
| Non-accelerated filer | x (Do not check if a smaller reporting company) | Smaller reporting company | ¨ | |||
The Registrant hereby amends this Registration Statement on such date or dates as may be necessary to delay its effective date until the Registrant shall file a further amendment which specifically states that this Registration Statement shall thereafter become effective in accordance with Section 8(a) of the Securities Act or until this Registration Statement shall become effective on such date as the Commission, acting pursuant to said Section 8(a), may determine.
Table of Contents
Index to Financial Statements
The information in this prospectus is not complete and may be changed. We may not sell these securities until the registration statement filed with the Securities and Exchange Commission is effective. This prospectus is not an offer to sell these securities and it is not soliciting an offer to buy these securities in any state where the offer or sale is not permitted.
Subject to Completion, dated July 19, 2011.
PROSPECTUS
12,500,000 Shares

Great White Energy Services, Inc.
Common Stock
We are offering 1,250,000 shares of our common stock. This is our initial public offering and no public market currently exists for our common stock. The selling stockholders identified in this prospectus are offering, in the aggregate, an additional 11,250,000 shares of our common stock. We will not receive any of the proceeds from the sale of the shares by the selling stockholders.
We anticipate that the initial public offering price of our common stock will be between $19.00 and $21.00 per share. We have applied to have our common stock listed on The NASDAQ Global Market under the symbol “JAWS.”
The underwriters have an option to purchase an additional 1,875,000 shares of our common stock from the selling stockholders to cover any over-allotments.
Investing in our common stock involves a high degree of risk. Please read “Risk Factors” beginning on page 13.
| Per Share |
Total | |||||||
| Price to the public |
$ | $ | ||||||
| Underwriting discounts and commissions |
$ | $ | ||||||
| Proceeds to Great White Energy Services, Inc. (before expenses) |
$ | $ | ||||||
| Proceeds to the selling stockholders (before expenses) |
$ | $ | ||||||
Delivery of the shares of common stock is expected to be made on or about , 2011.
Neither the Securities and Exchange Commission nor any state securities commission has approved or disapproved these securities or determined if this prospectus is truthful or complete. Any representation to the contrary is a criminal offense.
Joint Book-Running Managers
| RAYMOND JAMES | JEFFERIES |
JOHNSON RICE & COMPANY L.L.C.
FEARNLEY FONDS
SIMMONS & COMPANY INTERNATIONAL
SUNTRUST ROBINSON HUMPHREY
The date of this prospectus is , 2011.
Table of Contents
Index to Financial Statements

Table of Contents
Index to Financial Statements
| 1 | ||||
| 13 | ||||
| 30 | ||||
| 31 | ||||
| 31 | ||||
| 32 | ||||
| 34 | ||||
| 36 | ||||
| MANAGEMENT’S DISCUSSION AND ANALYSIS OF FINANCIAL CONDITION AND RESULTS OF OPERATIONS |
39 | |||
| 54 | ||||
| 71 | ||||
| 91 | ||||
| 95 | ||||
| 97 | ||||
| 100 | ||||
| 102 | ||||
| 108 | ||||
| 110 | ||||
| 110 | ||||
| 110 | ||||
| 111 | ||||
| F-1 | ||||
Table of Contents
Index to Financial Statements
ABOUT THIS PROSPECTUS
You should rely only on the information contained in this prospectus. We have not, and the selling stockholders and the underwriters have not, authorized any other person to provide you with information different from that contained in this prospectus. If anyone provides you with different or inconsistent information, you should not rely on it. We, the selling stockholders and the underwriters are only offering to sell, and only seeking offers to buy, the common stock in jurisdictions where offers and sales are permitted.
The information contained in this prospectus is accurate and complete only as of the date of this prospectus, regardless of the time of delivery of this prospectus or of any sale of our common stock by us, the selling stockholders or the underwriters. Our business, financial condition, results of operations and prospectus may have changed since that date.
This prospectus includes market share and industry data and forecasts that we obtained from internal company surveys, publicly available information and industry publications and surveys. Our internal research and forecasts are based on management’s understanding of industry conditions, and such information has not been verified by independent sources. Industry publications and surveys generally state that the information contained therein has been obtained from sources believed to be reliable.
Unless the context otherwise requires, the information in the prospectus (other than in the historical financial statements) assumes that the underwriters will not exercise their over-allotment option.
Table of Contents
Index to Financial Statements
This summary contains basic information about us and the offering. Because it is a summary, it does not contain all the information that you should consider before investing in our common stock. You should read and carefully consider this entire prospectus before making an investment decision, especially the information presented under the heading “Risk Factors” beginning on page 13 and our combined financial statements and the accompanying notes included elsewhere in this prospectus. Please also read “Glossary of Oil and Natural Gas Terms” beginning on page 111 of this prospectus for definitions of certain terms that are commonly used in the oilfield services industry.
Great White Energy Services, Inc.
Overview
We are a diversified oilfield service company providing completion and production and horizontal and directional drilling services primarily in the U.S. onshore unconventional tight sands and shale oil and natural gas markets, commonly referred to as “unconventional resources.” These resources are called unconventional due to the different manner by which they are extracted as compared to the extraction of conventional resources. To extract unconventional resources, the wellbore is generally drilled to specific objectives within narrow parameters, often across long, horizontal intervals within narrow formations offering greater contact area with the producing formation. Typically, the well is then hydraulically fractured at multiple stages to optimize production. We use our equipment to drill and complete these horizontal wells.
We currently conduct our operations through two operating segments—completion and production services and horizontal and directional drilling services. We believe that our services are critical in increasing the ultimate recovery and present value of production streams for unconventional resources. Our complementary suite of drilling, completion and production related services provides us with the opportunity to cross sell our services and expand our customer base and geographic positioning.
Our 13 service centers are strategically located in Michigan, Oklahoma, Texas, West Virginia and Wyoming primarily to serve the following resource plays:
| • | the Bakken Shale in Montana and North Dakota; |
| • | the Cana Woodford Shale and the Cleveland Sand in Oklahoma; |
| • | the Eagle Ford Shale in South Texas; |
| • | the Fayetteville Shale in Arkansas; |
| • | the Granite Wash in Oklahoma and Texas; |
| • | the Cotton Valley and the Haynesville Shale in Northwest Louisiana and East Texas; |
| • | the Marcellus Shale in West Virginia and Pennsylvania; |
| • | the Marmaton and Mississippi Shales in Oklahoma and Texas; |
| • | the Niobrara formation in Wyoming; |
| • | the Permian Basin in West Texas; |
| • | the Trenton formation in Michigan; |
| • | the Utica Shale in Ohio and Pennsylvania; and |
| • | the Woodford Shale in Southeastern Oklahoma. |
1
Table of Contents
Index to Financial Statements
Our operational division heads have an average of over 30 years of oilfield services experience and bring valuable basin-level expertise and long-term customer relationships to our business. We provide our completion and production and horizontal and directional drilling services to a diversified range of both public and private independent producers as well as integrated major companies. Our top five customers for the year ended December 31, 2010, representing 36% of our revenue, were SandRidge Energy, Inc., Windsor Permian LLC, Chesapeake Energy Corp., Continental Resources, Inc. and East Resources, Inc. Our top five customers for the three months ended March 31, 2011, representing 46% of our revenue, were SandRidge Energy, Inc., Unit Petroleum Company, Windsor Permian LLC, EOG Resources, Inc. and Continental Resources, Inc.
We commenced our operations in December 2005 with the acquisition of the assets of Quantum Drilling Motors, L.L.C., which we refer to as Quantum. We have since grown through acquisitions and organically by focusing on the growing needs of producers in unconventional resource plays. We had $80.4 million in revenue, $25.9 million in Adjusted EBITDA and net income of $19.3 million for the three months ended March 31, 2011, $206.7 million in revenue, $45.9 million in Adjusted EBITDA and net income of $20.9 million for the year ended December 31, 2010, $98.6 million in revenue, $5.7 million in Adjusted EBITDA and a net loss of $18.5 million for the year ended December 31, 2009, and $208.6 million in revenue, $61.6 million in Adjusted EBITDA and net income of $21.1 million for the year ended December 31, 2008. For a definition of Adjusted EBITDA, a reconciliation of Adjusted EBITDA to net income (loss) and a discussion of Adjusted EBITDA as a performance measure, please see “Selected Historical Financial Data” on page 36 of this prospectus.
Our Services
Completion and Production Services
Our completion and production services segment provides pressure pumping services and pressure control services. Our pressure pumping services include hydraulic fracturing and acidizing services. These services are primarily used in optimizing hydrocarbon flow paths during the completion phase of unconventional wellbores. We began providing pressure pumping services in September 2006 with 18,200 horsepower acquired in the acquisition of Acid Inc. As of March 31, 2011, we had grown our pressure pumping business to 98,800 horsepower, consisting of 42 quintuplex pumps. Our quintuplex pumps allow us to execute multi-stage fracture stimulation jobs, which are typically required for production enhancement of unconventional wells. Currently, we provide pressure pumping services in the Cana Woodford and Mississippi Shales in Oklahoma, the Marmaton Shale in Oklahoma and Texas and the Permian Basin in West Texas. Our completion and production segment was started in July 2006 through the hiring of an experienced senior management team. Since then, this team has developed our pressure control services through organic growth.
Our pressure control services equipment is tailored to the unconventional resources market with the ability to operate under high pressures without having to delay or cease production during completion operations. Ceasing or suppressing production in the completion phase of an unconventional well could result in formation damage impacting the overall recovery of reserves. As of March 31, 2010, our pressure control services were provided through our fleet of eight coiled tubing units, 19 snubbing units, six wireline units, 14 nitrogen pumping units, nine fluid pumping units and various well control assets. Based on our anticipated delivery schedule, we expect to have 12 coiled tubing units, 24 snubbing units, six wireline units, 16 nitrogen pumping units and 15 fluid pumping units by the end of 2011. We provide our pressure control services in the Fayetteville Shale in Arkansas, the Cana Woodford and Woodford Shales and the Cleveland Sand in Oklahoma, the Granite Wash and Mississippi Shale in Oklahoma and Texas, the Haynesville Shale in Northwest Louisiana and East Texas, the Barnett Shale in East Texas, the Permian Basin in West Texas and the Eagle Ford Shale in South Texas.
Our completion and production segment generated approximately $60.5 million, or 75.2% of our total revenue, for the three months ended March 31, 2011, $135.9 million, or 65.7% of our total revenue, for the year
2
Table of Contents
Index to Financial Statements
ended December 31, 2010, $55.8 million, or 56.6% of our total revenue, for the year ended December 31, 2009 and $103.5 million, or 49.6% of our total revenue, for the year ended December 31, 2008.
Horizontal and Directional Drilling Services
Our horizontal and directional drilling equipment is designed for efficient drilling and production of oil and natural gas from unconventional resource plays. Our horizontal and directional drilling services allow our customers to drill wellbores to specific objectives within narrow location parameters. The evolution of unconventional resource reserve recovery has increased the need for the precise placement of the wellbore. Wellbores are often drilled sideways across long-lateral intervals within narrow formations as thin as ten feet. Our personnel are involved in all aspects of the well from the initial planning to the management and execution of the horizontal or directional drilling operation. Our horizontal and directional drilling equipment includes drilling motors, measurement while drilling, or MWD, kits and electromagnetic, or EM, kits. As of March 31, 2011, we owned 39 MWD kits and six EM kits used in horizontal, vertical and directional drilling applications, 392 motors, four dedicated wireline units and an inventory of parts and other equipment. In addition, at June 20, 2011 we employed 76 directional drillers with significant industry experience to implement our services. We perform our horizontal and directional drilling services in the Piceance Basin in Colorado, the Cotton Valley and the Haynesville Shale in Northwest Louisiana and East Texas, the Bakken Shale in North Dakota and Montana, the Williston Basin in North Dakota and South Dakota, the Utica Shale in Ohio and Pennsylvania, the Granite Wash in Oklahoma and Texas, the Woodford Shale in Oklahoma, the Huron and Marcellus Shales in West Virginia and Pennsylvania, the Permian Basin in West Texas, the Powder River Basin and the Niobrara formation in Wyoming and the Trenton formation in Michigan.
We commenced our horizontal and directional drilling operations with the acquisition of the assets of Quantum in December 2005. We subsequently acquired the membership units of Directional Drilling Contractors L.L.C. in August 2007, and have since grown this business segment organically. Our horizontal and directional drilling services segment generated approximately $19.9 million, or 24.8% of our total revenue, for the three months ended March 31, 2011, $70.9 million, or 34.3% of our total revenue, for the year ended December 31, 2010, $42.7 million, or 43.4% of our total revenue, for the year ended December 31, 2009 and $105.1 million, or 50.4% of our total revenue, for the year ended December 31, 2008.
Our Industry
We believe that the following trends in our industry should benefit our operations:
| • | Increased fracturing and other well stimulation services required for horizontal wells. Multiple stages of hydraulic fracturing are typically required to enhance hydrocarbon production in horizontal wells. Water, sand and other additives are used in the fracturing process. The fractures created in the formation are held open through the use of sand and other proppants such as resin-coated and ceramic particles. The scope of these services for a horizontal well is greater than for a conventional well. It has been reported in the industry that the average horsepower, length of the lateral and number of fracture stages has increased since 2008. The total size of the global hydraulic fracturing market, based on revenue, was estimated to be approximately $10.5 billion in 2009 and $18.0 billion in 2010, based on data from a 2011 report by Spears & Associates. Fracturing revenue increased by $7.5 billion in 2010 as compared to 2009 primarily due to increased drilling activity, higher oil prices and a greater proportion of horizontal wells relative to vertical wells. |
| • | Increased use of horizontal drilling to develop unconventional resource plays. According to the Baker Hughes rig count, the horizontal rig count on March 31, 2011 was 995, or 58% of the total U.S. onshore rig count. This compares to 650 horizontal rigs, equating to 34% of the total U.S. onshore rig count, in 2008, the previous peak of the horizontal rig count. For the twelve months ended March 31, 2011, horizontal rigs comprised on average 56% of the total U.S. onshore rig count. As a result of |
3
Table of Contents
Index to Financial Statements
| improvements in horizontal drilling and production-enhancement technologies, oil and natural gas companies are increasingly developing unconventional resources such as tight sands and shales. Successful and economic production of these unconventional resource plays frequently requires increased horizontal drilling, fracturing and stimulation services. Drilling related activity for unconventional resources is typically done on tighter acre-spacing and thus requires that more wells be drilled relative to conventional resources. We believe that all of these characteristics will drive the demand for our services. |
| • | New and emerging unconventional resource plays. In addition to the growth and development of existing unconventional resource plays such as the Barnett, Fayetteville, Haynesville, Marcellus and Woodford Shales, exploration and production companies continue to find new unconventional resources. These include oil and liquids-based shales in the Bakken, Cana Woodford, Eagle Ford, Granite Wash, Niobrara, Permian and Woodford resource plays. In certain cases, exploration and production companies have acquired vast acreage positions in these plays that require them to drill and produce hydrocarbons to hold the leased acreage. We believe these emerging resource plays will continue to drive demand for our services as they typically require the use of extended reach horizontal drilling, multiple stage fracture stimulation and high pressure completion capabilities. |
| • | Increased onshore focus from major integrated oil and natural gas companies. Major integrated exploration and production companies have increasingly been allocating capital and other resources to the U.S. onshore unconventional oil and natural gas tight sand and shale resource plays. Over the past two years, exploration and production companies such as ExxonMobil Corporation, BP p.l.c. and Chevron Corporation have made strategic acquisitions and/or formed joint ventures in unconventional resource plays. This onshore focus may intensify as regulatory scrutiny of offshore operations increases due to the blowout of BP p.l.c.’s Macondo well and the related oil spill in the Gulf of Mexico in 2010. |
| • | Need for additional drilling activity to maintain production levels. With the increased maturity of the onshore conventional and, in many cases, unconventional resource plays, oil and natural gas production may be characterized as having steeper initial decline curves. As a result, we believe that an increasing number of wells will need to be drilled to offset production declines. Given average decline rates and demand forecasts, we believe that the number of wells drilled is likely to continue to increase in coming years. Once a well has been drilled, it requires recurring production and completion services, which we believe will drive demand for our services. |
Our Strategy
Our strategy is to leverage our equipment and personnel to provide drilling, completion and production services in unconventional resource plays. These services optimize the ultimate recovery and present value of hydrocarbon reserves in the unconventional resource plays that we serve. We believe that our services provide cost efficiencies for our customers. Specifically, we intend to:
| • | Capitalize on the increased activity in the unconventional resource plays. Our equipment is tailored to provide drilling, completion and production services for unconventional wells and our operations are strategically located in major unconventional resource plays. We intend to continue capturing the anticipated growth in these markets and diversifying our operations across the different unconventional resource basins. Our core operations are focused in proven producing regions, primarily in the Bakken Shale in North Dakota and Montana, the Eagle Ford Shale in South Texas, the Fayetteville Shale in Arkansas, the Granite Wash in Oklahoma and Texas, the Cotton Valley and the Haynesville Shale in Northwest Louisiana and East Texas, the Marcellus Shale in West Virginia and Pennsylvania, the Marmaton and Mississippi Shales in Oklahoma and Texas, the Niobrara formation in Wyoming, the Permian Basin in West Texas, the Trenton formation in Michigan, the Utica Shale in Ohio and Pennsylvania and the Woodford Shale in Southeastern Oklahoma. We intend to continue to strategically |
4
Table of Contents
Index to Financial Statements
| deploy assets to these unconventional resource basins and will look to capture further growth in the emerging unconventional resource plays such as the Bakken, Cana Woodford, Eagle Ford and Niobrara. |
| • | Expand our completion and production services fleet. We have recently expanded and intend to continue to expand our fleet used to provide completion and production services. We acquired approximately $42.1 million of equipment during 2010 and currently expect to acquire approximately $88.1 million of equipment during 2011, including 18 quintuplex high-pressure pumps, six coiled tubing units, six snubbing units, seven fluid pumpers and two nitrogen units. |
| • | Leverage our broad range of services for unconventional wells. We offer a complementary suite of services relating to the drilling, completion and production of unconventional wells. Our completion and production segment provides production enhancement and completion services for unconventional wells and our horizontal and directional drilling segment assists in the drilling of these wells. These complementary services have provided us with opportunities to cross sell our services and expand our service offerings to existing customers, obtain new customers and expand our geographic presence. We intend to continue to expand our services in an effort to increase cross selling opportunities and create operational efficiencies for our customers. |
| • | Capitalize on organic growth opportunities. We intend to use our existing customer relationships, cross selling of services and operational track record to expand opportunistically to other geographic regions in which our customers have operations. In addition, we believe our reputation will allow us to successfully expand our customer base and geographic presence. |
| • | Expand through selected acquisitions. To complement our organic growth, we intend to pursue selected acquisitions that can meet our targeted returns on invested capital. We believe this strategy will facilitate the continued expansion of our customer base, geographic presence and service offerings. |
| • | Leverage our experienced operational management team and basin-level expertise. We seek to manage our business as close to our customer base as possible. Our operational division heads have an average of over 30 years of experience in the oilfield service business. These members of our management team have long-term customer relationships with our largest customers. We intend to leverage our operational management team’s basin-level expertise to deliver innovative, basin-specific services to our customers. |
Our Strengths
We believe that the following strengths position us well within our industry and will help us successfully execute our strategy:
| • | Quality equipment. Our service fleet is predominantly comprised of equipment that has been tailored to provide services for unconventional wells. Approximately 40% of our pressure pumping equipment has been built within the last year. Most of our pressure control equipment has been designed and built by us and is less than four years old. We believe that our equipment will allow us to provide a high level of service to our customers and capture future growth in the unconventional resource markets that we serve. |
| • | Experienced management and operating team. Our operational division heads have an extensive track record in the oilfield services business and an average of over 30 years of oilfield services experience. We believe their knowledge of our industry and business lines enhances our ability to provide a high level of customer service. In addition, our field managers have expertise in the geological basins in which they operate and understand the regional challenges that our customers face, which we believe strengthens our relationships with our customers. |
| • | Strategic geographic positioning. Currently, we operate 13 service centers to support our operations in major unconventional resource plays in the United States, including the Bakken Shale in North Dakota |
5
Table of Contents
Index to Financial Statements
| and Montana, the Cana Woodford Shale and the Cleveland Sand in Oklahoma, the Eagle Ford Shale in South Texas, the Fayetteville Shale in Arkansas, the Granite Wash in Oklahoma and Texas, the Cotton Valley and the Haynesville Shale in Northwest Louisiana and East Texas, the Marcellus Shale in West Virginia and Pennsylvania, the Niobrara formation in Wyoming, the Permian Basin in West Texas, the Trenton formation in Michigan, the Utica Shale in Ohio and Pennsylvania and the Woodford Shale in Southeastern Oklahoma. We expect to complete our fourteenth service center, located in Victoria, Texas, in the third quarter of 2011 to service our expanding activities in the Eagle Ford Shale. Our operations are focused in the growing oil and natural gas liquids resource plays, as well as natural gas resource plays. We believe our geographic positioning provides us with both a more stable revenue stream and access to the growth occurring in these unconventional resource plays. |
| • | Long-term, basin-level relationships with a stable customer base. Our operational division heads and field managers have formed long-term relationships with our customer base. We believe that these relationships will help provide us with a stable and growth-oriented client base in the unconventional shale markets that we serve. Our customers include large independent oil and natural gas exploration and production companies. Our top five customers for the year ended December 31, 2010, representing 36% of our revenue, were SandRidge Energy, Inc., Windsor Permian LLC, Chesapeake Energy Corp., Continental Resources, Inc. and East Resources, Inc. Our top five customers for the three months ended March 31, 2011, representing 46% of our revenue, were SandRidge Energy, Inc., Unit Petroleum Company, Windsor Permian LLC, EOG Resources, Inc. and Continental Resources, Inc. |
Risk Factors
Investing in our common stock involves risks that include the speculative nature of oil and natural gas operations, competition, volatile oil and natural gas prices and other material factors. You should read carefully the section of this prospectus entitled “Risk Factors” beginning on page 13 for an explanation of these risks before investing in our common stock. In particular, the following considerations may offset our competitive strengths or have a negative effect on our strategy, which could cause a decrease in the price of our common stock and a loss of all or part of your investment:
| • | We derive our revenues from companies in the oil and natural gas exploration and production industry, a historically cyclical industry with levels of activity that are significantly affected by the levels and volatility of oil and natural gas prices. |
| • | A material reduction in the levels of exploration and development activities in our market areas could affect our business. |
| • | We operate in a highly competitive industry in which price competition can be intense, which can force us to lower prices we charge for our services and, as a result, adversely affect our revenue and profitability. |
| • | We intend to grow our business and may be unable to secure equipment, raw materials (particularly sand and proppants) and crews to successfully execute our plans, and our hydraulic fracturing operations may be negatively impacted by shortages of water. |
| • | Competition for experienced oilfield service personnel is intense, and we face significant challenges in competing for crews and management with large and well-established competitors. |
| • | Our business depends upon our ability to obtain specialized equipment and parts from third party suppliers, and we may be vulnerable to delayed deliveries and future price increases. |
| • | Federal and state legislative and regulatory initiatives relating to hydraulic fracturing could result in increased costs and additional operating restrictions or delays. |
| • | If our operations continue to grow, we will need to implement additional processes and procedures to accommodate this growth. There can be no assurance that we will be able to do so. |
6
Table of Contents
Index to Financial Statements
For a discussion of other considerations that could negatively affect us, see “Risk Factors” beginning on page 13 and “Cautionary Note Regarding Forward-Looking Statements” on page 30.
Our Equity Sponsor
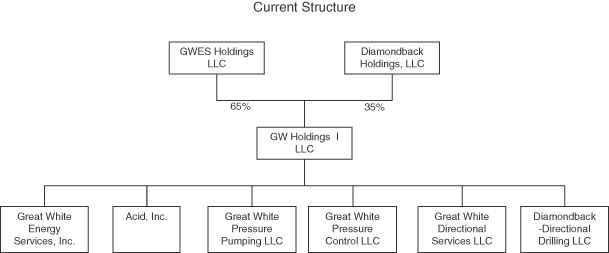
Our equity sponsor, Wexford Capital LP, or Wexford, is a Greenwich, Connecticut-based SEC registered investment advisor with over $6.0 billion under management as of December 31, 2010. Wexford has made public and private equity investments in many different sectors with particular expertise in the energy and natural resources sector. Immediately prior to this offering, Wexford beneficially owned all of our outstanding common stock through GWES Holdings LLC, which we refer to as GWES Holdings, and Diamondback Holdings, LLC, which we refer to as Diamondback Holdings. Upon completion of this offering, Wexford will beneficially own approximately 72.2% of our common stock (approximately 68.1% if the over-allotment option is exercised in full). As a result, Wexford will continue to be able to exercise control over all matters requiring stockholder approval, including the election of directors, changes to our organizational documents and significant corporate transactions. Prior to the closing of this offering, we will enter into an advisory services agreement with Wexford under which Wexford will provide the Company with financial and strategic advisory services related to our business. Also, we have entered into certain other agreements with Wexford. For a description of the advisory services agreement and other agreements with Wexford, see “Related Party Transactions” beginning on page 91. Although management believes that the terms of these related party agreements are reasonable, it is possible that we could have negotiated more favorable terms for such transactions with unrelated third parties. The existence of these related party agreements may give Wexford the ability to further influence and maintain control over many matters affecting us.
Our History
Great White Energy Services, Inc. was formed in December 2010 in Delaware and will not conduct any material business operations prior to the merger described below. We are currently a wholly-owned subsidiary of GW Holdings I LLC, which we refer to as GWH, and all of our assets and operations described in this prospectus are currently owned by GWH, which is an entity controlled by our equity sponsor, Wexford. Effective December 31, 2010, in transactions we refer to in this prospectus collectively as the “contribution,” GWES Holdings contributed to GWH its membership interests or common stock, as applicable, in three of its wholly-owned subsidiaries, Great White Pressure Control LLC, Great White Pressure Pumping LLC and Acid, Inc., and Diamondback Holdings contributed to GWH its membership interests in two of its wholly-owned subsidiaries, Great White Directional Services LLC (formerly Diamondback-Quantum LLC) and Diamondback-Directional Drilling LLC. Prior to the closing of this offering, we will merge with GWH and continue as the surviving corporation. In the merger, we will issue 28,456,554 shares of our common stock to GWES Holdings and 15,322,760 shares of our common stock to Diamondback Holdings. In this prospectus, we refer to Great White Pressure Control LLC, Great White Pressure Pumping LLC, Acid, Inc., Great White Directional Services LLC (formerly Diamondback-Quantum LLC) and Diamondback-Directional Drilling LLC as the contributed entities. As a result of the merger, the contributed entities will become our wholly-owned subsidiaries. Except as otherwise indicated or required by the context, all references in this prospectus to “Great White,” the “Company,” “we,” “us,” or “our” relate to Great White Energy Services, Inc. and its consolidated subsidiaries after giving effect to the contribution and the merger.
7
Table of Contents
Index to Financial Statements
The following organizational charts illustrate (a) our current organizational structure and (b) our organizational structure after giving effect to the merger described above and the offering:
![]()
Our Offices
Our principal executive offices are located at 14201 Caliber Drive, Suite 300, Oklahoma City, Oklahoma 73134, and our telephone number at that address is (405) 285-5812. Our website address is www.greatwhiteenergy.com. Information contained on our website does not constitute part of this prospectus.
8
Table of Contents
Index to Financial Statements
The Offering
| Common stock offered by us |
1,250,000 shares |
| Common stock offered by the selling stockholders |
11,250,000 shares (13,125,000 shares if the underwriters’ over-allotment option is exercised in full) |
| Common stock to be outstanding immediately after completion of this offering |
45,029,314 shares |
| Use of proceeds |
We will use all of the net proceeds of this offering to pay down outstanding borrowings under our revolving credit facility. Thereafter, we intend to use future borrowings under our revolving credit facility, together with cash flow from our operations and cash on hand, to fund our capital expenditures and for general corporate purposes. We will not receive any proceeds from the sale of shares by the selling stockholders. See “Use of Proceeds” on page 31 of this prospectus. |
| Conflict of interest |
An affiliate of SunTrust Robinson Humphrey, Inc., an underwriter of this offering, is the lender under our revolving credit facility. Since we will use the net proceeds of this offering to repay outstanding borrowings under our revolving credit facility, such affiliate will receive 5% or more of the net proceeds of this offering, not including underwriting compensation. As a result, this offering is being conducted in compliance with Rule 5121 of the Financial Industry Regulatory Authority, Inc., or FINRA. See “Underwriting—Conflict of Interest” on page 105 of this prospectus. |
| Dividend policy |
We currently anticipate that we will retain all future earnings, if any, to finance the growth and development of our business. We do not intend to pay cash dividends in the foreseeable future. |
| NASDAQ Global Market symbol |
“JAWS” |
Except as otherwise indicated, all information contained in this prospectus:
| • | assumes the underwriters do not exercise their over-allotment option; and |
| • | excludes 2,500,000 shares of common stock reserved for issuance under our equity incentive plan, including, based on an assumed public offering price of $20.00 per share (which is the midpoint of the range set forth on the cover of this prospectus): |
| • | 585,600 restricted stock units to be issued to certain employees following the closing of this offering under the terms of their employment agreements, which restricted stock units will not be subject to forfeiture and will have a settlement date that is 181 days after the closing of this offering; |
| • | 46,662 restricted stock units to be issued to our non-employee directors following the closing of this offering as part of their director compensation; and |
| • | options to purchase 935,819 shares of our common stock to be granted to our Chief Executive Officer following the closing of this offering under the terms of his employment agreement. |
9
Table of Contents
Index to Financial Statements
Summary Consolidated Financial Data
The following table sets forth our summary historical consolidated financial data as of the dates and for each of the periods indicated. The data as of December 31, 2010 and 2009 and for the years ended December 31, 2010, 2009 and 2008 are derived from our historical audited consolidated financial statements included elsewhere in this prospectus. The data as of and for the three months ended March 31, 2011 and 2010 are derived from our historical unaudited consolidated financial statements included elsewhere in this prospectus. The balance sheet data as of December 31, 2008 are derived from our audited balance sheet as of that date, which is not included in this prospectus. The unaudited pro forma financial data presented give effect to income taxes assuming that we operated as a taxable corporation throughout the periods presented. Operating results for the periods presented are not necessarily indicative of the results that may be expected for the entire year 2011 or any future periods. You should review this information together with “Management’s Discussion and Analysis of Financial Condition and Results of Operations,” “Selected Historical Financial Data” and our historical consolidated financial statements and related notes included elsewhere in this prospectus.
| Three Months Ended March 31, |
Year Ended December 31, | |||||||||||||||||||
| 2011 | 2010 | 2010 | 2009 | 2008 | ||||||||||||||||
| (in thousands, except per share data) |
||||||||||||||||||||
| Statement of Operations Data: |
||||||||||||||||||||
| Revenue: |
||||||||||||||||||||
| Completion and production services |
$ | 60,474 | $ | 21,321 | $ | 135,863 | $ | 55,841 | $ | 103,509 | ||||||||||
| Horizontal and directional drilling services |
19,890 | 14,521 | 70,867 | 42,732 | 105,106 | |||||||||||||||
| Total |
80,364 | 35,842 | 206,730 | 98,573 | 208,615 | |||||||||||||||
| Expenses: |
||||||||||||||||||||
| Cost of revenue, exclusive of depreciation, amortization and impairment: |
||||||||||||||||||||
| Completion and production services |
34,376 | 16,596 | 92,669 | 49,946 | 68,107 | |||||||||||||||
| Horizontal and directional drilling services |
15,213 | 11,403 | 53,098 | 32,801 | 63,507 | |||||||||||||||
| Selling, general and administrative |
4,908 | 3,371 | 15,102 | 10,332 | 15,896 | |||||||||||||||
| Depreciation and amortization |
6,554 | 5,450 | 23,419 | 22,367 | 20,673 | |||||||||||||||
| Impairment of goodwill and intangible assets |
— | — | — | — | 20,185 | |||||||||||||||
| Operating income (loss) |
19,313 | (978 | ) | 22,442 | (16,873 | ) | 20,247 | |||||||||||||
| Interest expense |
(29 | ) | (354 | ) | (1,346 | ) | (1,826 | ) | (2,110 | ) | ||||||||||
| Other income |
40 | 1 | 68 | 207 | 462 | |||||||||||||||
| Income (loss) before income taxes |
19,324 | (1,331 | ) | 21,164 | (18,492 | ) | 18,599 | |||||||||||||
| Provision (benefit) for income taxes |
33 | (33 | ) | 273 | 28 | (2,455 | ) | |||||||||||||
| Net income (loss) |
19,291 | (1,298 | ) | 20,891 | (18,520 | ) | 21,054 | |||||||||||||
| Income attributable to non-controlling interest in variable interest entities |
11 | 11 | 41 | 28 | 9 | |||||||||||||||
| Net income (loss) attributable to equity holders of the Company |
$19,280 | $ | (1,309 | ) | $ | 20,850 | $ | (18,548 | ) | $ | 21,045 | |||||||||
| Pro Forma C Corporation Data (unaudited):(1) |
||||||||||||||||||||
| Historical income (loss) before income taxes |
$19,324 | $ | (1,331 | ) | $ | 21,164 | $ | (18,492 | ) | $ | 18,599 | |||||||||
| Pro forma provision (benefit) for income taxes |
7,385 | (464 | ) | 8,160 | (6,928 | ) | 15,271 | |||||||||||||
| Pro forma net income (loss) |
$ | 11,939 | $ | (867 | ) | $ | 13,004 | $ | (11,564 | ) | $ | 3,328 | ||||||||
| Pro forma net income (loss) attributable to equity holders of the Company |
$ | 11,928 | $ | (878 | ) | $ | 12,963 | $ | (11,592 | ) | $ | 3,319 | ||||||||
| Pro forma income (loss) per common share—basic and diluted(2) |
$ | .27 | $ | .30 | ||||||||||||||||
| Weighted average pro forma shares outstanding—basic and diluted(2) |
43,779 | 43,779 | ||||||||||||||||||
10
Table of Contents
Index to Financial Statements
| Three Months Ended March 31, |
Year Ended December 31, | |||||||||||||||||||
| 2011 | 2010 | 2010 | 2009 | 2008 | ||||||||||||||||
| (in thousands) |
||||||||||||||||||||
| Other Financial Data: |
||||||||||||||||||||
| Adjusted EBITDA (unaudited)(3) |
$ | 25,907 | $ | 4,473 | $ | 45,929 | $ | 5,701 | $ | 61,567 | ||||||||||
| Cash flows provided by operating activities |
16,252 | 377 | 29,931 | 22,479 | 38,657 | |||||||||||||||
| Cash flows used in investing activities |
(21,055 | ) | (2,706 | ) | (48,253 | ) | (5,871 | ) | (24,245 | ) | ||||||||||
| Cash flows provided by (used in) financing activities |
16,739 | 4,551 | 24,825 | (15,749 | ) | (16,056 | ) | |||||||||||||
| Cash capital expenditures: |
||||||||||||||||||||
| Property and equipment |
(21,846 | ) | (3,490 | ) | (52,569 | ) | (9,455 | ) | (32,848 | ) | ||||||||||
| As of March 31, | As of December 31, | |||||||||||||||||||
| 2011 | 2010 | 2010 | 2009 | 2008 | ||||||||||||||||
| (in thousands) |
||||||||||||||||||||
| Balance Sheet Data: |
||||||||||||||||||||
| Total current assets |
$ | 79,672 | $ | 33,800 | $ | 54,066 | $ | 24,948 | $ | 45,364 | ||||||||||
| Total assets |
261,260 | 157,284 | 213,506 | 150,449 | 185,783 | |||||||||||||||
| Advances from Great White Energy Services LLC |
5,043 | |
10,334 |
|
638 | 10,464 | 9,948 | |||||||||||||
| Total current liabilities |
47,299 | 27,952 | 31,921 | 24,451 | 30,016 | |||||||||||||||
| Capital lease obligations, net of current portion |
6,252 | 6,519 | 6,457 | 6,614 | 6,481 | |||||||||||||||
| Long-term debt, net of current portion |
19,497 | — | 6,012 | |
— |
|
— | |||||||||||||
| Total liabilities |
74,054 | 35,901 | 45,552 | 32,572 | 38,213 | |||||||||||||||
| Non-controlling interest in variable interest entities |
611 | 679 | 639 | 668 | 690 | |||||||||||||||
| Total equity |
187,206 | 121,383 | 167,955 | 117,878 | 147,570 | |||||||||||||||
| (1) | Great White Energy Services, Inc. was formed as a Delaware corporation in December 2010 and will not conduct any material business operations prior to the merger described below. We are currently a wholly-owned subsidiary of GW Holdings I LLC, or GWH, and all of our assets and operations described in this prospectus are currently owned by GWH, which is an entity controlled by our equity sponsor, Wexford. Effective December 31, 2010, GWES Holdings LLC, which we refer to as GWES Holdings, contributed to GWH its membership interests or common stock, as applicable, in three of its wholly-owned subsidiaries, Great White Pressure Control LLC, Great White Pressure Pumping LLC and Acid, Inc., and Diamondback Holdings, LLC, which we refer to as Diamondback Holdings, contributed to GWH its membership interests in two of its wholly-owned subsidiaries, Great White Directional Services LLC (formerly Diamondback-Quantum LLC) and Diamondback-Directional Drilling LLC. In connection with its contribution to GWH, Diamondback Holdings extinguished all indebtedness owed to it by the contributed entities under a revolving credit agreement. See “Management’s Discussion and Analysis of Financial Condition and Results of Operations—Liquidity and Capital Resources—Credit Facilities.” Prior to the closing of this offering, we will merge with GWH and continue as the surviving corporation. In the merger, we will issue 28,456,554 shares of our common stock to GWES Holdings and 15,322,760 shares of our common stock to Diamondback Holdings. In this prospectus, Great White Pressure Control LLC, Great White Pressure Pumping LLC, Acid, Inc., Great White Directional Services LLC (formerly Diamondback-Quantum LLC) and Diamondback-Directional Drilling LLC are referred to as the contributed entities. As a result of the merger, the contributed entities will become our wholly-owned subsidiaries. Our historical consolidated financial statements were prepared on a consolidated basis and represent the consolidated assets, liabilities, revenues and expenses of GWH. See “Note A—Nature of Operations and Summary of Significant Accounting Policies” to our historical consolidated financial statements appearing elsewhere in this prospectus for additional information regarding the basis upon which our financial statements have been prepared. Each of the contributed entities other than Acid, Inc. was treated as a partnership for federal income tax purposes. As a result, essentially all of our taxable earnings and losses were passed through to Wexford, and we did not pay federal income taxes at the entity level. For comparative purposes, we have |
11
Table of Contents
Index to Financial Statements
| included a pro forma provision (benefit) for income taxes assuming we had been taxed as a C corporation in all periods prior to the merger. The unaudited pro forma data are presented for informational purposes only, and do not purport to project our results of operations for any future period or our financial position as of any future date. |
| (2) | The pro forma earnings per share data have been presented for the latest fiscal year and interim period and has been calculated as if the merger discussed in note 1 above had been consummated and the shares of common stock were issued to GWES Holdings and Diamondback Holdings in the merger at the beginning of such period. |
| (3) | For a definition of Adjusted EBITDA and reconciliation of Adjusted EBITDA to net income (loss) attributable to the equity holders of the Company, the most comparable measure calculated in accordance with U.S. Generally Accepted Accounting Principles, or GAAP, see “Selected Historical Financial Data” on page 36 of this prospectus. |
12
Table of Contents
Index to Financial Statements
An investment in our common stock involves a high degree of risk. The following is a description of material risks that are presently known to us. You should carefully consider these risks and all of the other information contained in this prospectus before deciding to invest in our common stock. Additional risks not presently known to us or which we currently consider immaterial also may adversely affect our company.
Risks Related to Our Business and Our Industry
Our business depends on the oil and natural gas industry and particularly on the level of exploration and production activity within the United States, which may be adversely impacted by industry conditions that are beyond our control.
We depend on our customers’ willingness and ability to make operating and capital expenditures to explore for, develop and produce oil and natural gas in the United States. If these expenditures decline, our business will suffer. Our customers’ willingness to explore, develop and produce depends largely upon prevailing industry conditions that are influenced by numerous factors over which we have no control, such as:
| • | the supply of and demand for oil and natural gas; |
| • | the level of prices, and expectations about future prices, of oil and natural gas; |
| • | the cost of exploring for, developing, producing and delivering oil and natural gas; |
| • | the expected decline rates of current production; |
| • | the discovery rates of new oil and natural gas reserves; |
| • | contractions in the credit market; |
| • | available pipeline and other transportation capacity; |
| • | weather conditions, including hurricanes that can affect oil and natural gas operations over a wide area and other natural disasters; |
| • | political instability in oil and natural gas producing countries; |
| • | governmental approvals and regulatory requirements and conditions; |
| • | the continued threat of terrorism and the impact of military and other action, including military action in the Middle East; |
| • | technical advances affecting energy consumption; |
| • | the price and availability of alternative fuels; |
| • | the ability of oil and natural gas producers to raise equity capital and debt financing; |
| • | merger and divestiture activity among oil and natural gas producers; and |
| • | domestic and worldwide economic conditions. |
Any of the above factors could impact the level of oil and natural gas exploration and production activity and could ultimately have a material adverse effect on our business, financial condition, results of operations and cash flows.
The cyclicality of the oil and natural gas industry in the United States may cause our operating results to fluctuate.
We derive our revenues from companies in the oil and natural gas exploration and production industry, a historically cyclical industry with levels of activity that are significantly affected by the levels and volatility of oil and natural gas prices. We may experience significant fluctuations in operating results as a result of the
13
Table of Contents
Index to Financial Statements
reactions of our customers to changes in oil and natural gas prices. For example, in 2009, declines in prices for oil and natural gas, combined with adverse changes in the capital and credit markets, caused many exploration and production companies to reduce their capital budgets and drilling activity. This resulted in a significant decline in demand for our services, had an adverse impact on our prices and utilization, and adversely affected our results of operations.
In addition, substantially all of the service revenue we earn is based upon a charge for a relatively short period of time (e.g., an hour, a day, a week) for the actual period of time the service is provided to our customers. By contracting services on a short-term basis, we are exposed to the risks of a rapid reduction in market prices and utilization, with resulting volatility in our revenues.
Our business is difficult to evaluate because we have a limited operating history.
We commenced operations in December 2005. All of our assets and operations described in this prospectus were acquired by us since that time. As a result, there is only limited historical financial and operating information available on which to base your evaluation of our performance.
We may have difficulty managing growth in our business, which could adversely affect our financial condition and results of operations.
The growth of our company in accordance with our business plan, if achieved, will place a significant strain on our financial, technical, operational and management resources. As we expand our activities through both organic growth and acquisitions, there will be additional demands on our financial, technical, operational and management resources. These demands may be increased as our geographic coverage expands. The failure to continue to upgrade our technical, administrative, operating and financial control systems or the occurrences of unexpected expansion difficulties, including the failure to recruit and retain experienced managers, engineers and other professionals in the oil and natural gas services industry, could have a material adverse effect on our business, financial condition and results of operations and our ability to timely execute our business plan.
If our intended expansion of our business is not successful, our financial condition, profitability and results of operations could be adversely affected, and we may not achieve increases in revenue and profitability that we hope to realize.
A key element of our business strategy involves the expansion of our services, geographic presence and customer base. These aspects of our strategy are subject to numerous risks and uncertainties, including:
| • | inability to retain or hire experienced crews and other personnel; |
| • | lack of customer demand for the services we intend to provide; |
| • | inability to secure necessary equipment, raw materials (particularly sand and other proppants) or technology to successfully execute our expansion plans; |
| • | shortages of water used in our hydraulic fracturing operations; |
| • | unanticipated delays that could limit or defer the provision of services by us and jeopardize our relationships with existing customers and adversely affect our ability to obtain new customers for such services; and |
| • | competition from new and existing services providers. |
Encountering any of these or any unforeseen problems in implementing our planned expansion could have a material adverse impact on our business, financial condition, results of operations and cash flows, and could prevent us from achieving the increases in revenues and profitability that we hope to realize.
14
Table of Contents
Index to Financial Statements
Our business depends upon our ability to obtain specialized equipment and parts from third party suppliers, and we may be vulnerable to delayed deliveries and future price increases.
We purchase specialized equipment and parts from third party suppliers and affiliates, including companies controlled by Wexford. Currently, there is a high demand for hydraulic fracturing, coiled tubing and other oil field services and extended lead times to obtain equipment needed to provide these services. Further, there are a limited number of suppliers that manufacture the equipment we use. Should our current suppliers be unable or unwilling to provide the necessary equipment and parts or otherwise fail to deliver the products timely and in the quantities required, any resulting delays in the provision of our services could have a material adverse effect on our business, financial condition, results of operations and cash flows. In addition, future price increases for this type of equipment and parts could negatively impact our ability to purchase new equipment to update or expand our existing fleet or to timely repair equipment in our existing fleet.
The loss of or interruption in operations of one or more of our key raw material suppliers and shortages of water could have a material adverse effect on our operations.
Our reliance on outside suppliers for some of the key raw materials we use in providing our services involves several risks, including limited control over the price, timely delivery and quality of such materials or equipment. We rely on a limited number of suppliers for certain raw materials, particularly sand and other proppants, which are critical for certain of our operations. In the past we have experienced a shortage of sand and if we were to again have a problem sourcing this or other raw materials or transporting these materials from these suppliers, our ability to provide services would be limited. We do not have commitments with our suppliers to ensure the continued supply of raw materials. Historically, we have placed orders with our suppliers that meet our expected raw material demands for short periods of time. Any changes in our suppliers could cause material delays in our operations and increase our costs. In addition, our suppliers may not be able to meet our future demands as to volume, quality or timeliness. Our inability to obtain timely delivery of key raw materials of acceptable quality or any significant increases in prices of such materials could result in material operational delays, increase our operating costs, limit our ability to service our customers’ wells or otherwise materially and adversely affect our business and operating results. Further, our hydraulic fracturing operations require significant amounts of water and may be negatively impacted by shortages of water, due to droughts or otherwise, in the areas in which we operate. Our fracturing operations in certain shales are more water intensive due to the peculiar geology of such shales, and competition for water in such shales is growing.
We rely on a few key employees whose absence or loss could adversely affect our business.
Many key responsibilities within our business have been assigned to a small number of key employees. Our key employees include John Jordan, our chief executive officer, Ronnie Roles, our senior vice president of pressure control services, William Hailey, senior vice president of pressure pumping services, and Danny Ward, senior vice president of directional drilling services. The loss of their services could adversely affect our business. Our key employees may voluntarily terminate their employment at any time. The loss of one or more of our key employees could have a material adverse impact on our business. Also, we do not maintain “key person” life insurance policies on any of our employees. As a result, we are not insured against any losses resulting from the death of our key employees.
If we are unable to employ a sufficient number of skilled and qualified workers, our capacity and profitability could be diminished and our growth potential could be impaired.
The delivery of our products and services requires skilled and qualified workers with specialized skills and experience who can perform physically demanding work. As a result of the volatility of the oilfield services industry and the demanding nature of the work, workers may choose to pursue employment in fields that offer a more desirable work environment at wage rates that are competitive. Our ability to be productive and profitable will depend upon our ability to employ and retain skilled workers. In addition, our ability to expand our
15
Table of Contents
Index to Financial Statements
operations depends in part on our ability to increase the size of our skilled labor force. The demand for skilled workers is high, and the supply is limited. As a result, competition for experienced oilfield service personnel is intense, and we face significant challenges in competing for crews and management with large and well-established competitors. A significant increase in the wages paid by competing employers could result in a reduction of our skilled labor force, increases in the wage rates that we must pay, or both. If either of these events were to occur, our capacity and profitability could be diminished and our growth potential could be impaired.
Unionization efforts could increase our costs or limit our flexibility.
Presently, none of our employees work under collective bargaining agreements. Unionization efforts have been made from time to time within our industry, to varying degrees of success. Any such unionization could increase our costs or limit our flexibility.
Advancements in technology could have a material adverse effect on our business, financial condition and results of operations and cash flows.
As new horizontal and directional drilling, pressure pumping, pressure control and other well service technologies develop, we may be placed at a competitive disadvantage, and competitive pressure may force us to implement new technologies at a substantial cost. We may not be able to successfully acquire or use new technologies. New technologies could render our current products and services obsolete or significantly reduce demand for our current products and services. As a result, new advancements in technology could have a material adverse effect on our business, financial condition and results of operations and cash flows.
Our operations require substantial capital and we may be unable to obtain needed capital or financing on satisfactory terms, which could limit our ability to grow.
The oilfield services industry is capital intensive. In conducting our business and operations, we make, and expect to continue to make, substantial capital expenditures. Our capital acquisitions were approximately $28.8 million for the three months ended March 31, 2011, $55.5 million for the year ended December 31, 2010, $8.1 million for the year ended December 31, 2009 and $35.5 million for the year ended December 31, 2008. The decrease in 2009 was due to the economic downturn in late 2008 and 2009. Our capital expenditures for 2011 are estimated to be approximately $99.7 million. To date, we have financed capital expenditures primarily with funding from our equity sponsor, cash generated by operations and borrowings under our credit facilities. We will pay down outstanding indebtedness with the net proceeds of this offering. Following the completion of this offering and the application of the net proceeds thereafter, we intend to finance our capital expenditures primarily with cash on hand, cash flow from operations and borrowings under our revolving credit facility. We may be unable to generate sufficient cash from operations and other capital resources to maintain planned or future levels of capital expenditures which, among other things, may prevent us from acquiring new equipment or properly maintaining our existing equipment. This could put us at a competitive disadvantage or interfere with our growth plans. Further, our actual capital expenditures for 2011 could exceed our capital expenditure budget. In the event our capital expenditure requirements at any time are greater than the amount we have available, we could be required to seek additional sources of capital, which may include debt financing, joint venture partnerships, sales of assets, offerings of debt or equity securities or other means. We may not be able to obtain any such alternative source of capital or, if we can obtain alternative sources of capital, the terms of such alternative may not be favorable to us. In particular, the terms of any debt financing may include covenants that significantly restrict our operations. Our inability to grow as planned may reduce our chances of maintaining and improving profitability.
Our acquisitions may expose us to various risks, including those relating to difficulties in identifying suitable acquisition opportunities and integrating businesses, assets and personnel, as well as difficulties in obtaining financing for targeted acquisitions and the potential for increased leverage or debt service requirements.
As a component of our business strategy, we have pursued and intend to continue to pursue selected acquisitions of complementary assets, businesses and technologies. Since our commencement of operations in
16
Table of Contents
Index to Financial Statements
December 2005, we have completed three acquisitions for an aggregate consideration of approximately $78.5 million. Acquisitions involve numerous risks, including:
| • | unanticipated costs and assumption of liabilities and exposure to unforeseen liabilities of acquired businesses, including but not limited to environmental liabilities; |
| • | difficulties in integrating the operations and assets of the acquired business and the acquired personnel; |
| • | limitations on our ability to properly assess and maintain an effective internal control environment over an acquired business, in order to comply with public reporting requirements; |
| • | potential losses of key employees and customers of the acquired businesses; |
| • | inability to commercially develop acquired technologies; |
| • | risks of entering markets in which we have limited prior experience; and |
| • | increases in our expenses and working capital requirements. |
The process of integrating an acquired business may involve unforeseen costs and delays or other operational, technical and financial difficulties and may require a disproportionate amount of management attention and financial and other resources. Our failure to achieve consolidation savings, to incorporate the acquired businesses and assets into our existing operations successfully or to minimize any unforeseen operational difficulties could have a material adverse effect on our financial condition and results of operations. Furthermore, there is intense competition for acquisition opportunities in our industry. Competition for acquisitions may increase the cost of, or cause us to refrain from, completing acquisitions.
In addition, we may not have sufficient capital resources to complete additional acquisitions. Historically, we have financed capital expenditures primarily with funding from our equity sponsor, cash generated by operations and borrowings under our credit facilities. We may incur substantial indebtedness to finance future acquisitions and also may issue equity, debt or convertible securities in connection with such acquisitions. Debt service requirements could represent a significant burden on our results of operations and financial condition and the issuance of additional equity or convertible securities could be dilutive to our existing stockholders. Furthermore, we may not be able to obtain additional financing on satisfactory terms. Even if we have access to the necessary capital, we may be unable to continue to identify additional suitable acquisition opportunities, negotiate acceptable terms or successfully acquire identified targets.
Our ability to grow through acquisitions and manage growth will require us to continue to invest in operational, financial and management information systems and to attract, retain, motivate and effectively manage our employees. The inability to effectively manage the integration of acquisitions could reduce our focus on subsequent acquisitions and current operations, which, in turn, could negatively impact our earnings and growth. Our financial position and results of operations may fluctuate significantly from period to period, based on whether or not significant acquisitions are completed in particular periods.
Our customer base is concentrated and the loss of one or more of our significant customers could cause our revenue to decline substantially.
Our top five customers accounted for approximately 46%, 36%, 26% and 30% of our revenue for the three months ended March 31, 2011 and for the years ended December 31, 2010, 2009 and 2008, respectively. Our largest customer accounted for approximately 15%, 18%, 11% and 13% of our revenue for the three months ended March 31, 2011 and for the years ended December 31, 2010, 2009 and 2008, respectively. It is likely that we will continue to derive a significant portion of our revenue from a relatively small number of customers in the future. If a major customer decided not to continue to use our services, our revenue would decline and our operating results and financial condition could be harmed.
17
Table of Contents
Index to Financial Statements
Many of our customers’ activity levels, spending for our services and payment patterns have been and may continue to be impacted by the credit markets.
Many of our customers finance their activities through cash flow from operations, the incurrence of debt or the issuance of equity. During 2008 there was a significant decline in the credit and equity markets, adversely impacting the availability of capital. We believe that since March 2009, the credit and equity markets have improved. However, uncertainty regarding any continued improvement or the actual deterioration of these markets could have a material adverse impact on our customers’ willingness or ability to spend for our services. Such reduction in spending could have a material adverse effect on our operations.
In addition, while historically our customer base has not presented significant credit risks, the same factors that may lead to a reduction in our customers’ spending also may increase our exposure to the risks of nonpayment and nonperformance by our customers. A significant reduction in our customers’ liquidity may result in a decrease in their ability to pay or otherwise perform on their obligations to us. Any increase in the nonpayment of and nonperformance by our counterparties, either as a result of recent changes in financial and economic conditions or otherwise, could have an adverse impact on our operating results and could adversely affect our liquidity.
Our indebtedness and liquidity needs could restrict our operations and make us more vulnerable to adverse economic conditions.
Our existing and future indebtedness, whether incurred in connection with acquisitions, operations or otherwise, may adversely affect our operations and limit our growth, and we may have difficulty making debt service payments on such indebtedness as payments become due. Our level of indebtedness may affect our operations in several ways, including the following:
| • | increasing our vulnerability to general adverse economic and industry conditions; |
| • | the covenants that are contained in the agreements that govern our indebtedness could limit our ability to borrow funds, dispose of assets, pay dividends and make certain investments; |
| • | our debt covenants could also affect our flexibility in planning for, and reacting to, changes in the economy and in our industry; |
| • | any failure to comply with the financial or other covenants of our debt could result in an event of default, which could result in some or all of our indebtedness becoming immediately due and payable; |
| • | our level of debt could impair our ability to obtain additional financing in the future for working capital, capital expenditures, acquisitions or other general corporate purposes; and |
| • | our business may not generate sufficient cash flow from operations to enable us to meet our obligations under our indebtedness. |
Our revolving credit facility imposes restrictions on us that may affect our ability to successfully operate our business.
Our revolving credit facility limits our ability to take various actions, such as:
| • | incurring additional indebtedness; |
| • | paying dividends; |
| • | creating certain additional liens on our assets; |
| • | entering into sale and leaseback transactions; |
| • | making investments; |
| • | entering into transactions with affiliates; |
18
Table of Contents
Index to Financial Statements
| • | making material changes to the type of business we conduct or our business structure; |
| • | making guarantees; |
| • | disposing of assets in excess of certain permitted amounts; |
| • | merging or consolidating with other entities; and |
| • | selling all or substantially all of our assets. |
In addition, our revolving credit facility requires us to maintain certain financial ratios and to satisfy certain financial conditions, which may require us to reduce our debt or take some other action in order to comply with each of them. These restrictions could also limit our ability to obtain future financings, make needed capital expenditures, withstand a downturn in our business or the economy in general, or otherwise conduct necessary corporate activities. We also may be prevented from taking advantage of business opportunities that arise because of the limitations imposed on us by the restrictive covenants under our revolving credit facility.
We may not be able to provide services that meet the specific needs of oil and natural gas exploration and production companies at competitive prices.
The markets in which we operate are generally highly competitive and have relatively few barriers to entry. The principal competitive factors in our markets are price, product and service quality and availability, responsiveness, experience, technology, equipment quality and reputation for safety. We compete with large national and multi-national companies that have longer operating histories, greater financial, technical and other resources and greater name recognition than we do. Several of our competitors provide a broader array of services and have a stronger presence in more geographic markets. In addition, we compete with several smaller companies capable of competing effectively on a regional or local basis. Our competitors may be able to respond more quickly to new or emerging technologies and services and changes in customer requirements. Some contracts are awarded on a bid basis, which further increases competition based on price. Pricing is often the primary factor in determining which qualified contractor is awarded a job. The competitive environment has intensified as recent mergers among oil and natural gas companies have reduced the number of available customers. As a result of competition, we may lose market share or be unable to maintain or increase prices for our present services or to acquire additional business opportunities, which could have a material adverse effect on our business, financial condition, results of operations and cash flows.
In addition, some exploration and production companies have begun performing hydraulic fracturing and directional drilling on their wells using their own equipment and personnel. Any increase in the development and utilization of in-house fracturing and directional drilling capabilities by our customers could decrease the demand for our services and have a material adverse impact on our business.
Severe weather could have a material adverse impact on our business.
Our business could be materially and adversely affected by severe weather. Repercussions of severe weather conditions may include:
| • | curtailment of services; |
| • | weather-related damage to equipment resulting in suspension of operations; |
| • | weather-related damage to our facilities; |
| • | inability to deliver equipment and materials to jobsites in accordance with contract schedules; and |
| • | loss of productivity. |
In addition, oil and natural gas operations of customers located in Michigan, Montana, North Dakota, West Virginia, Wyoming and other cold weather states can be adversely affected by seasonal weather conditions, primarily in the spring. Many municipalities impose weight restrictions on the paved roads that lead to our
19
Table of Contents
Index to Financial Statements
jobsites due to the muddy conditions caused by spring thaws. This can limit our access to these jobsites and our ability to service wells in these areas. These constraints and the resulting shortages or high costs could delay our operations and materially increase our operating and capital costs in those regions.
Our operations are subject to hazards inherent in the oil and natural gas industry, which could expose us to substantial liability and cause us to lose customers and substantial revenue.
Risks inherent to our industry, such as equipment defects, vehicle accidents, explosions, uncontrollable flows of gas or well fluids, and releases of and exposure to hazardous substances, including certain substances contained in hydraulic fracturing fluid such as hydrochloric acid and petrochemicals, can cause personal injury, loss of life, suspension of operations, damage to formations, damage to facilities, business interruption and damage to or destruction of property, equipment, natural resources and the environment. The cost of managing such risks may be significant. These risks could expose us to substantial liability for personal injury, wrongful death, property damage, loss of oil and natural gas production, pollution, natural resources and other environmental damages and environmental clean-up responsibilities. The frequency and severity of such incidents will affect operating costs, insurability and relationships with customers, employees and regulators. In particular, our customers may elect not to purchase our services if they view our environmental or safety record as unacceptable, which could cause us to lose customers and substantial revenues. In addition, these risks may be greater for us than some of our competitors because we sometimes acquire companies that may not have allocated significant resources and management focus to safety and environmental matters and may have a poor environmental and safety record and associated possible exposure.
We work in a dangerous business and our safety procedures may not always prevent accidents. Our insurance coverage may be inadequate to cover our liabilities. In addition, we may not be able to maintain adequate insurance in the future at rates we consider reasonable and commercially justifiable and insurance may not continue to be available on terms as favorable as our current arrangements. In addition, certain types of insurance coverage may not be available in the future. The occurrence of a significant uninsured claim, a claim in excess of the insurance coverage limits maintained by us or a claim at a time when we are not able to obtain liability insurance could have a material adverse effect on our ability to conduct normal business operations and on our financial condition, results of operations and cash flows. Our senior management may not be successful in improving our overall environmental and safety record.
We are subject to extensive environmental, health and safety laws and regulations that may subject us to substantial liability or require us to take actions that will adversely affect our results of operations.
Our business is significantly affected by stringent and complex federal, state and local laws and regulations governing the discharge of substances into the environment or otherwise relating to environmental protection and health and safety matters. As part of our business, we handle, transport and dispose of a variety of fluids and substances, including hydraulic fracturing fluids which can contain hydrochloric acid and certain petrochemicals. This activity poses some risks of environmental liability, including leakage of hazardous substances from the wells to surface and subsurface soils, surface water or groundwater. We also handle, transport and store these substances. The handling, transportation, storage and disposal of these fluids are regulated by a number of laws, including the Resource Conservation and Recovery Act; the Comprehensive Environmental Response, Compensation, and Liability Act; the Clean Water Act; the Safe Drinking Water Act; and other federal and state laws and regulations promulgated thereunder. The cost of compliance with these laws can be significant. Failure to properly handle, transport or dispose of these materials or otherwise conduct our operations in accordance with these and other environmental laws could expose us to substantial liability for administrative, civil and criminal penalties, cleanup and site restoration costs and liability associated with releases of such materials, damages to natural resources and other damages, as well as potentially impair our ability to conduct our operations. We could be exposed to liability for cleanup costs, natural resource damages and other damages under these and other environmental laws. Such liability is commonly on a strict, joint and several liability basis, without regard to fault. Liability may be imposed as a result of our conduct that was lawful at the time it occurred or the conduct
20
Table of Contents
Index to Financial Statements
of, or conditions caused by, prior operators or other third parties. Environmental laws and regulations have changed in the past, and they are likely to change in the future and become more stringent. If existing environmental requirements or enforcement policies change, we may be required to make significant unanticipated capital and operating expenditures.
Many nations have agreed to limit emissions of “greenhouse gases,” or GHG’s, pursuant to the United Nations Framework Convention on Climate Change, also known as the “Kyoto Protocol.” Methane, a primary component of natural gas, and carbon dioxide, a byproduct of the burning of oil, natural gas, and refined petroleum products are GHGs regulated by the Kyoto Protocol. Although the United States is not participating in the Kyoto Protocol at this time, several states have adopted legislation and regulations to reduce emissions of greenhouse gases. Additionally, on April 2, 2007, the U.S. Supreme Court ruled, in Massachusetts, et al. v. EPA, that the United States Environmental Protection Agency, or EPA, has the authority to regulate carbon dioxide emissions from automobiles as “air pollutant” under the federal Clean Air Act. Thereafter, in December 2009, the EPA determined that emissions of carbon dioxide, methane and other GHGs present an endangerment to human health and the environment because, according to the EPA, emissions of such gases contribute to warming of the earth’s atmosphere and other climatic changes. These findings by the EPA allowed the agency to proceed with the adoption and implementation of regulations that would restrict emissions of GHGs under existing provisions of the federal Clean Air Act. Subsequently, the EPA recently adopted two sets of related rules, one of which purports to regulate emissions of GHGs from motor vehicles and the other of which would regulate emissions of GHGs from large stationary sources of emissions such as power plants or industrial facilities. The EPA finalized the motor vehicle rule in April 2010 and it became effective January 2011, although it does not require immediate reductions in GHG emissions. The EPA adopted the stationary source rule in May 2010, and it also became effective January 2011, although it remains the subject of several pending lawsuits filed by industry groups. Additionally, in September 2009, the EPA issued a final rule requiring the reporting of GHG emissions from specified large GHG emission sources in the U.S., including natural gas liquids fractionators and local natural gas/distribution companies, beginning in 2011 for emissions occurring in 2010.
In June 2009, the U.S. House of Representatives passed the American Clean Energy and Security (ACES) Act that, among other things, would have established a cap-and-trade system to regulate greenhouse gas emissions and would have required an 80% reduction in GHG emissions from sources within the United States between 2012 and 2050. The ACES Act did not pass the Senate, however, and so was not enacted by the 111th Congress. The United States Congress is likely to again consider a climate change bill in the future. Moreover, almost half of the states have already taken legal measures to reduce emissions of GHGs, primarily through the planned development of GHG emission inventories and/or regional GHG cap and trade programs. Most of these cap and trade programs work by requiring major sources of emissions, such as electric power plants, or major producers of fuels, such as refineries and gas processing plants, to acquire and surrender emission allowances corresponding with their annual emissions of GHGs. The number of allowances available for purchase is reduced each year until the overall GHG emission reduction goal is achieved. As the number of GHG emission allowances declines each year, the cost or value of allowances is expected to escalate significantly. Restrictions on emissions of methane or carbon dioxide that may be imposed in various states could adversely affect the oil and natural gas industry and, therefore, could reduce the demand for our products and services. Currently, our operations are not adversely impacted by existing state and local climate change initiatives and, at this time, it is not possible to accurately estimate how potential future laws or regulations addressing greenhouse gas emissions would impact our business.
Any failure by us to comply with applicable environmental laws and regulations may result in governmental authorities taking actions that could adversely impact our operations and financial condition, including the:
| • | issuance of administrative, civil and criminal penalties; |
| • | denial, suspension or revocation of necessary permits, licenses or other authorizations; |
| • | imposition of injunctive obligations or limitations on our operations; |
| • | requirement that additional pollution controls be installed on our equipment; and |
| • | required performance of site investigatory, remedial or other corrective actions. |
21
Table of Contents
Index to Financial Statements
The effect of environmental laws and regulations on our business is discussed in greater detail under “Business—Government Regulation—Environmental Matters” beginning on page 67 of this prospectus.
Federal and state legislative and regulatory initiatives relating to hydraulic fracturing could result in increased costs and additional operating restrictions or delays.
The federal Safe Drinking Water Act, or SDWA, regulates the underground injection of substances through the Underground Injection Control, or UIC, program. Hydraulic fracturing generally is exempt from regulation under the UIC program, and the hydraulic fracturing process is typically regulated by state oil and gas commissions. The EPA has recently taken the position that hydraulic fracturing with fluids containing diesel fuel is subject to regulation under the UIC program, specifically as “Class II” UIC wells. At the same time, the EPA has commenced a study of the potential environmental impacts of hydraulic fracturing activities, and a committee of the U.S. House of Representatives is also conducting an investigation of hydraulic fracturing practices. As part of these studies, both the EPA and the House committee have requested that certain companies provide them with information concerning the chemicals used in the hydraulic fracturing process. These studies, depending on their results, could spur initiatives to regulate hydraulic fracturing under the SDWA or otherwise.
In March 2011, companion bills entitled the Fracturing Responsibility and Awareness of Chemicals (FRAC) Act of 2009 were reintroduced in the United States Senate and House of Representatives. These bills, which are currently under consideration by Congress, would repeal the exemption for hydraulic fracturing from the SDWA, which would have the effect of allowing the EPA to promulgate regulations requiring permits and implementing potential new requirements on hydraulic fracturing under the SDWA. This could, in turn, require state regulatory agencies in states with programs delegated under the SDWA to impose additional requirements on hydraulic fracturing operations. In addition, the bills would require persons using hydraulic fracturing, such as us, to disclose the chemical constituents, but not the proprietary formulas, of their fracturing fluids to a regulatory agency, which would make the information public via the internet. Additionally, fracturing companies would be required to disclose specific chemical contents of fluids, including proprietary chemical formulas, to state authorities or to a requesting physician or nurse if deemed necessary by the physician or nurse in connection with a medical emergency.
Some states have adopted or are considering adopting regulations that could restrict hydraulic fracturing in certain circumstances and/or require the disclosure of the composition of hydraulic fracturing fluids, which generally contain hazardous substances. For example, in June 2010, the Wyoming Oil and Gas Conservation Commission passed a rule requiring disclosure of hydraulic fracturing fluid content. In November 2010, the Pennsylvania Environmental Quality Board proposed regulations that would require reporting of the chemicals used in fracturing fluids. Effective January 15, 2011, Arkansas began requiring disclosure of the components, but not the precise chemical composition, of hydraulic fracturing fluids. On May 31, 2011, the Texas Legislature adopted new legislation requiring oil and gas operators to publicly disclose the chemicals used in the hydraulic fracturing process. It was signed into law on June 17, 2011, effective as of September 1, 2011. The Texas Railroad Commission will adopt rules and regulations implementing this legislation in two phases by July 1, 2012 and 2013, respectively. The new law requires that well operators disclose the list of chemical ingredients subject to the requirements of federal Occupational Safety and Health Act (OSHA) for disclosure on an internet website and also file the list of chemicals with the Railroad Commission with the well completion report. The total volume of water used to hydraulically fracture a well must also be disclosed to the public and filed with the Railroad Commission. In addition, the new law requires disclosure on a public website and to the Railroad Commission of other chemical ingredients that were intentionally included and used for the purpose of hydraulic fracturing. The new law contemplates that certain hydraulic fracturing chemicals may be claimed as a trade secret, although disclosure of such information would be required to a health professional or emergency responder who needs the information for medical treatment.
If new laws or regulations that significantly restrict hydraulic fracturing, such as the FRAC Act, are adopted, such laws could make it more difficult or costly for us to perform fracturing to stimulate production from tight formations as well as make it easier for third parties opposing the hydraulic fracturing process to initiate legal
22
Table of Contents
Index to Financial Statements
proceedings based on allegations that specific chemicals used in the fracturing process could adversely affect groundwater. In addition, if hydraulic fracturing is further regulated at the federal or state level, our fracturing activities could become subject to additional permitting and financial assurance requirements, more stringent construction specifications, increased monitoring, reporting and recordkeeping obligations, plugging and abandonment requirements and also to attendant permitting delays and potential increases in costs and liability. Such legislative changes could cause us to incur substantial compliance costs, and compliance or the consequences of any failure to comply by us could have a material adverse effect on our financial condition and results of operations. At this time, it is not possible to estimate the impact on our business of newly enacted or potential federal or state legislation governing hydraulic fracturing.
Increasing trucking regulations may increase our costs and negatively impact our results of operations.
Through our transportation and relocation of our oilfield service equipment, we operate trucks and other heavy equipment. As such, we operate as a motor carrier in providing certain of our services and therefore are subject to regulation by the United States Department of Transportation and by various state agencies. These regulatory authorities exercise broad powers, governing activities such as the authorization to engage in motor carrier operations, driver licensing and qualification, insurance requirements, hours of service, financial reporting and review of certain mergers, consolidations and acquisitions, and transportation of hazardous materials (HAZMAT). The Department of Transportation periodically conducts compliance reviews and may revoke registration privileges based on certain safety performance criteria which could result in a suspension of operations. The rating scale consists of “satisfactory,” “conditional,” and “unsatisfactory” ratings. Currently, Great White Pressure Control LLC and Great White Pressure Pumping LLC are operating with a “conditional” rating. Our trucking operations are subject to possible regulatory and legislative changes that may increase our costs. Some of these possible changes include increasingly stringent environmental regulations, changes in the hours of service regulations which govern the amount of time a driver may drive or work in any specific period, onboard black box recorder device requirements or limits on vehicle weight and size.
Interstate motor carrier operations are subject to safety requirements prescribed by the United States Department of Transportation. To a large degree, intrastate motor carrier operations are subject to state safety regulations that mirror federal regulations. Matters such as the weight and dimensions of equipment are also subject to federal and state regulations. From time to time, various legislative proposals are introduced, including proposals to increase federal, state, or local taxes, including taxes on motor fuels, which may increase our costs or adversely impact the recruitment of drivers. We cannot predict whether, or in what form, any increase in such taxes applicable to us will be enacted.
A terrorist attack or armed conflict could harm our business.
Terrorist activities, anti-terrorist efforts and other armed conflicts involving the United States or other countries may adversely affect the United States and global economies and could prevent us from meeting our financial and other obligations. If any of these events occur, the resulting political instability and societal disruption could reduce overall demand for oil and natural gas, potentially putting downward pressure on demand for our services and causing a reduction in our revenues. Oil and natural gas related facilities could be direct targets of terrorist attacks, and our operations could be adversely impacted if infrastructure integral to our customers’ operations is destroyed or damaged. Costs for insurance and other security may increase as a result of these threats, and some insurance coverage may become more difficult to obtain, if available at all.
Legal requirements, conservation measures and technological advances could reduce demand for oil and natural gas, which may adversely affect our business, financial condition, results of operations and cash flows.
Environmental and energy matters have been the focus of increased scientific and political scrutiny and are subject to various legal requirements. International agreements, national laws, state laws and various regulatory
23
Table of Contents
Index to Financial Statements
schemes limit or otherwise regulate energy-related activities, such as emissions of greenhouse gasses, and additional restrictions are under consideration by governmental entities. These legal requirements as well as fuel conservation measures, alternative fuel requirements, increasing consumer demand for alternatives to oil and natural gas, technological advances in fuel economy and energy generation devices could reduce demand for oil and natural gas. Management cannot predict the impact of the changing demand for oil and gas services and products, and any major changes may have a material adverse effect on our business, financial condition, results of operations and cash flows.
Losses and liabilities from uninsured or underinsured drilling and operating activities could have a material adverse effect on our financial condition and operations.
We maintain operational insurance coverage of types and amounts that we believe to be customary in the industry, including commercial general liability, workers’ compensation, business auto, excess auto liability, commercial property, motor truck cargo, umbrella liability and excess liability insurance policies. We are not fully insured against all risks, either because insurance is not available or because of the high premium costs relative to perceived risk. Further, any insurance obtained by us may not be adequate to cover any losses or liabilities and this insurance may not continue to be available at all or on terms which are acceptable to us. Insurance rates have in the past been subject to wide fluctuation and changes in coverage could result in less coverage, increases in cost or higher deductibles and retentions. See “Business—Operating Risk and Insurance” on page 65 of this prospectus for additional information on our insurance policies. Liabilities for which we are not insured, or which exceed the policy limits of our applicable insurance, could have a material adverse effect on our business activities, financial condition and results of operations.
We may be subject to claims for personal injury and property damage, which could materially adversely affect our financial condition and results of operations.
We operate with most of our customers through master service agreements, or MSAs. We endeavor to allocate potential liabilities and risks between the parties in the MSAs. Generally, our MSAs contain indemnification to us for liability for pollution or environmental claims arising from subsurface conditions or resulting from the drilling activities of our customers or their operators. We may have liability in such cases if we are negligent or commit willful acts. Generally, our customers also agree to indemnify us against claims arising from their employees’ personal injury or death, unless resulting from our gross negligence or willful misconduct. Similarly, we agree to indemnify our customers for liabilities arising from personal injury or death of any of our employees, unless resulting from gross negligence or willful misconduct of the customer. In addition, our customers agree to indemnify us for loss or destruction of customer-owned property or equipment and in turn, we agree to indemnify our customers for loss or destruction of property or equipment we own. Losses due to catastrophic events, such as blowouts, are generally the responsibility of the customer. However, despite this general allocation of risk, we might not succeed in enforcing such contractual allocation, might incur an unforeseen liability falling outside the scope of such allocation or may be required to enter into an MSA with terms that vary from the above allocations of risk. As a result, we may incur substantial losses which could materially and adversely affect our financial condition and results of operation.
We will be subject to the requirements of Section 404 of the Sarbanes-Oxley Act. If we are unable to timely comply with Section 404 or if the costs related to compliance are significant, our profitability, stock price and results of operations and financial condition could be materially adversely affected.
We will be required to comply with the provisions of Section 404(a) of the Sarbanes-Oxley Act of 2002 as early as December 31, 2012. Section 404(a) requires that we document and test our internal control over financial reporting and issue management’s assessment of our internal control over financial reporting. Section 404(b) requires that our independent registered public accounting firm opine on the effectiveness of those internal controls as early as December 31, 2012. Implementation, documentation, testing and compliance with the
24
Table of Contents
Index to Financial Statements
requirements of Section 404 of the Sarbanes-Oxley Act will require changes to our accounting systems, accounting processes and internal controls. This may require hiring additional accounting, finance, information technology and other staff which will increase our costs.
If we fail to comply with the requirements of Section 404 or if we or our auditors identify and report material weaknesses or significant deficiencies in the future, the accuracy and timeliness of the filing of our annual and quarterly reports may be materially adversely affected, which could cause investors to lose confidence in our reported financial information and have a negative effect on the trading price of our common stock. In addition, a material weakness or deficiencies in the effectiveness of our internal control over financial reporting could result in an increased chance of fraud and the loss of customers, reduce our ability to obtain financing and require additional expenditures to comply with these requirements, each of which could have a material adverse effect on our business, results of operations and financial condition.
We believe that the out-of-pocket costs and the diversion of management’s attention from running our day-to-day operations that will be needed to maintain our internal controls, perform an annual assessment of such controls and otherwise comply with the requirements of Section 404 of the Sarbanes-Oxley Act could be significant. If the time and costs associated with such compliance exceed our current expectations, our results of operations could be materially adversely affected.
Risks Related to this Offering and Our Common Stock
Our largest stockholder controls a significant percentage of our common stock, and its interests may conflict with those of our other stockholders.
GWES Holdings and Diamondback Holdings, entities controlled by Wexford, are the selling stockholders in this offering. The selling stockholders are offering to sell an aggregate of 11,250,000 shares in this offering, or 13,125,000 shares if the underwriters exercise their over-allotment option in full. Upon completion of this offering, Wexford will beneficially own approximately 72.2% of our common stock, or 68.1% if the underwriters exercise their over-allotment option in full. See “Principal and Selling Stockholders” on page 94 of this prospectus. As a result, Wexford will continue to be able to exercise control over all matters requiring stockholder approval, including the election of directors, changes to our organizational documents and significant corporate transactions. This concentration of ownership makes it unlikely that any other holder or group of holders of our common stock will be able to affect the way we are managed or the direction of our business. The interests of Wexford with respect to matters potentially or actually involving or affecting us, such as future acquisitions, financings and other corporate opportunities and attempts to acquire us, may conflict with the interests of our other stockholders. Wexford’s continued concentrated ownership will make it impossible for another company to acquire us and for you to receive any related takeover premium for your shares unless Wexford approves the acquisition.
We will incur increased costs as a result of being a public company, which may significantly affect our financial condition.
As a public company, we will incur significant legal, accounting and other expenses that we did not incur as a private company. We will incur costs associated with our public company reporting requirements. We also anticipate that we will incur costs associated with corporate governance requirements, including requirements under the Sarbanes-Oxley Act of 2002, as well as rules implemented by the SEC and the Financial Industry Regulatory Authority. We expect these rules and regulations to increase our legal and financial compliance costs and to make some activities more time-consuming and costly. We also expect these rules and regulations may make it more difficult and more expensive for us to obtain director and officer liability insurance and we may be required to accept reduced policy limits and coverage or incur substantially higher costs to obtain the same or similar coverage. As a result, it may be more difficult for us to attract and retain qualified individuals to serve on our board of directors or as executive officers. We are currently evaluating these rules, and we cannot predict or estimate the amount of additional costs we may incur or the timing of such costs.
25
Table of Contents
Index to Financial Statements
Since we are a “controlled company” for purposes of The NASDAQ Global Market’s corporate governance requirements, our stockholders will not have, and may never have, the protections that these corporate governance requirements are intended to provide.
Since we are a “controlled company” for purposes of The NASDAQ Global Market’s corporate governance requirements, we are not required to comply with the provisions requiring that a majority of our directors be independent, the compensation of our executives be determined by independent directors or nominees for election to our board of directors be selected by independent directors. As a result, our stockholders may not have the protections that these rules are intended to provide.
The corporate opportunity provisions in our certificate of incorporation could enable Wexford, our equity sponsor, or other affiliates of ours to benefit from corporate opportunities that might otherwise be available to us.
Subject to the limitations of applicable law, our certificate of incorporation, among other things:
| • | permits us to enter into transactions with entities in which one or more of our officers or directors are financially or otherwise interested; |
| • | permits any of our stockholders, officers or directors to conduct business that competes with us and to make investments in any kind of property in which we may make investments; and |
| • | provides that if any director or officer of one of our affiliates who is also one of our officers or directors becomes aware of a potential business opportunity, transaction or other matter (other than one expressly offered to that director or officer in writing solely in his or her capacity as our director or officer), that director or officer will have no duty to communicate or offer that opportunity to us, and will be permitted to communicate or offer that opportunity to such affiliates and that director or officer will not be deemed to have (i) acted in a manner inconsistent with his or her fiduciary or other duties to us regarding the opportunity or (ii) acted in bad faith or in a manner inconsistent with our best interests. |
These provisions create the possibility that a corporate opportunity that would otherwise be available to us may be used for the benefit of one of our affiliates.
We have engaged in transactions with our affiliates and expect to do so in the future. The terms of such transactions and the resolution of any conflicts that may arise may not always be in our or our stockholders’ best interests.
We have engaged in transactions and expect to continue to engage in transactions with affiliated companies. As described under the caption “Related Party Transactions” on page 91 of this prospectus, these include, among others, oilfield services provided by us to Windsor Energy Group, L.L.C., real property leased by us from Caliber Investment Group, LLC and affiliated entities, manufacturing contracts from Serva Group LLC, and a shared services agreement for information technology with Everest Operations Management LLC. The resolution of these conflicts may not always be in our or our stockholders’ best interests.
There has been no public market for our common stock and if the price of our common stock fluctuates significantly, your investment could lose value.
We have applied to have our common stock listed on The NASDAQ Global Market. Prior to this offering, there has been no public market for our common stock, and an active public market may not develop for our common stock or our common stock may not trade in the public market subsequent to this offering at or above the initial public offering price. If an active public market for our common stock does not develop, the trading price and liquidity of our common stock will be materially and adversely affected. If there is a thin trading market or “float” for our stock, the market price for our common stock may fluctuate significantly more than the stock market as a whole. Without a large float, our common stock is less liquid than the stock of companies with
26
Table of Contents
Index to Financial Statements
broader public ownership and, as a result, the trading prices of our common stock may be more volatile. In addition, in the absence of an active public trading market, investors may be unable to liquidate their investment in us. The initial offering price, which will be negotiated between us and the underwriters, may not be indicative of the trading price for our common stock after this offering. In addition, the stock market is subject to significant price and volume fluctuations, and the price of our common stock could fluctuate widely in response to several factors, including:
| • | our quarterly or annual operating results; |
| • | changes in our earnings estimates; |
| • | investment recommendations by securities analysts following our business or our industry; |
| • | additions or departures of key personnel; |
| • | changes in the business, earnings estimates or market perceptions of our competitors; |
| • | our failure to achieve operating results consistent with securities analysts’ projections; |
| • | changes in industry, general market or economic conditions; and |
| • | announcements of legislative or regulatory change. |
The stock market has experienced extreme price and volume fluctuations in recent years that have significantly affected the quoted prices of the securities of many companies, including companies in our industry. The changes often appear to occur without regard to specific operating performance. The price of our common stock could fluctuate based upon factors that have little or nothing to do with our company and these fluctuations could materially reduce our stock price.
Future sales of our common stock, or the perception that such future sales may occur, may cause our stock price to decline.
We may sell additional shares of common stock in subsequent public offerings. We may also in the future issue shares of common stock to employees, in connection with acquisitions or otherwise. GWES Holdings and Diamondback Holdings, the selling stockholders in this offering, will continue to own an aggregate of 32,529,314 shares of our common stock following the completion of this offering (assuming no exercise of the underwriters’ over-allotment option), and could sell a substantial number of shares of our common stock in the public market in the future, subject to compliance with the securities laws and certain restrictions discussed below. See “Shares Eligible for Future Sale” on page 100 of this prospectus.
After this offering, we will have 45,029,314 shares of common stock outstanding, excluding shares of common stock reserved for issuance under our 2011 Equity Incentive Plan. Of these shares, all shares sold in this offering, other than shares, if any, purchased by our affiliates, will be freely tradable. We, our officers and directors and the selling stockholders have agreed not to sell or otherwise dispose of any shares of our common stock for a period of 180 days after the date of this prospectus, which period may be extended under limited circumstances, without the prior written consent of Raymond James & Associates, Inc. However, these lock-up agreements are subject to certain specific exceptions.
We intend to file a registration statement on Form S-8 providing for the registration of 2,500,000 shares of our common stock reserved for issuance under our 2011 Equity Incentive Plan. Subject to the satisfaction of vesting conditions, shares registered under that registration statement will be available for resale in the public market immediately and without restriction.
Sales of substantial amounts of our common stock in the public market after this offering, or the perception that such sales may occur, could cause the market price of our common stock to decline. In addition, the sale of shares by our stockholders could impair our ability to raise capital through the sale of additional common or preferred stock.
27
Table of Contents
Index to Financial Statements
Purchasers in this offering will experience immediate and substantial dilution of approximately $15.91 per share and will experience further dilution with the future exercise of stock options.
The initial public offering price is substantially higher than the pro forma net tangible book value per share of our outstanding common stock. As a result, you will experience immediate and substantial dilution of approximately $15.91 per share, representing the difference between our net tangible book value per share as of March 31, 2011 after giving effect to this offering and an assumed initial public offering price of $20.00 (which is the midpoint of the range set forth on the cover of the prospectus). A $1.00 increase (decrease) in the assumed initial public offering price of $20.00 per share (which is the midpoint of the range set forth on the cover page of this prospectus) would increase (decrease) our net tangible book value per share after giving effect to this offering by $1.2 million, and increase (decrease) the dilution to new investors by $0.03, assuming the number of shares offered by us, as set forth on the cover page of this prospectus, remains the same and after deducting the estimated underwriting discounts and commissions and estimated offered expenses payable by us. See “Dilution” on page 34 of this prospectus for a description of dilution.
Provisions in our certificate of incorporation and bylaws will make it more difficult to effect a change in control of our company, which could adversely affect the price of our common stock.
The existence of some provisions in our certificate of incorporation and bylaws could delay or prevent a change in control of our company, even if that change would be beneficial to our stockholders. Our certificate of incorporation and bylaws will contain provisions that may make acquiring control of our company difficult, including:
| • | provisions regulating the ability of our stockholders to nominate directors for election or to bring matters for action at annual meetings of our stockholders; |
| • | limitations on the ability of our stockholders to call a special meeting and act by written consent; |
| • | the ability of our board of directors to adopt, amend or repeal bylaws, and the requirement that the affirmative vote of holders representing at least 66 2/3% of the voting power of all outstanding shares of capital stock be obtained for stockholders to amend our bylaws; |
| • | the requirement that the affirmative vote of holders representing at least 66 2/3% of the voting power of all outstanding shares of capital stock be obtained to remove directors; |
| • | the requirement that the affirmative vote of holders representing at least 66 2/3% of the voting power of all outstanding shares of capital stock be obtained to amend our certificate of incorporation; and |
| • | the authorization given to our board of directors to issue and set the terms of preferred stock without the approval of our stockholders, which preferred stock could adversely impact the voting power or value of our common stock. |
These provisions also could discourage proxy contests and make it more difficult for you and other stockholders to elect directors and take other corporate actions. As a result, these provisions could make it more difficult for a third party to acquire us, even if doing so would benefit our stockholders, which may limit the price that investors are willing to pay in the future for shares of our common stock.
We may issue preferred stock whose terms could adversely affect the voting power or value of our common stock.
Our certificate of incorporation authorizes us to issue, without the approval of our stockholders, one or more classes or series of preferred stock having such designations, preferences, limitations and relative rights, including preferences over our common stock respecting dividends and distributions, as our board of directors may determine. The terms of one or more classes or series of preferred stock could adversely impact the voting power or value of our common stock. For example, we might grant holders of preferred stock the right to elect some number of our directors in all events or on the happening of specified events or the right to veto specified transactions. Similarly, the repurchase or redemption rights or liquidation preferences we might assign to holders of preferred stock could affect the residual value of the common stock.
28
Table of Contents
Index to Financial Statements
We do not intend to pay cash dividends on our common stock in the foreseeable future and, therefore, only appreciation of the price of our common stock will provide a return to our stockholders.
We currently anticipate that we will retain all future earnings, if any, to finance the growth and development of our business. We do not intend to pay cash dividends in the foreseeable future. Any future determination as to the declaration and payment of cash dividends will be at the discretion of our board of directors and will depend upon our financial condition, results of operations, contractual restrictions, capital requirements, business prospects and other factors deemed relevant by our board of directors. In addition, the terms of our revolving credit facility restrict the payment of dividends to the holders of our common stock and any other equity holders and, under the terms of an equipment financing agreement with a financial institution, we have agreed not to pay dividends in an amount that exceeds our annual net income based on the results of the rolling last four quarters. As a result, only appreciation of the price of our common stock, which may not occur, will provide a return to our stockholders.
29
Table of Contents
Index to Financial Statements
CAUTIONARY NOTE REGARDING FORWARD-LOOKING STATEMENTS
This prospectus contains forward-looking statements. These forward-looking statements are subject to a number of risks and uncertainties, many of which are beyond our control, which may include statements about our:
| • | business strategy; |
| • | planned acquisitions and future capital expenditures; |
| • | ability to obtain permits and governmental approvals; |
| • | technology; |
| • | financial strategy; |
| • | future operating results; and |
| • | plans, objectives, expectations and intentions. |
All of these types of statements, other than statements of historical fact included in this prospectus, are forward-looking statements. These forward-looking statements may be found in the “Prospectus Summary,” “Risk Factors,” “Management’s Discussion and Analysis of Financial Condition and Results of Operations,” “Business” and other sections of the prospectus. In some cases, you can identify forward-looking statements by terminology such as “may,” “could,” “should,” “expect,” “plan,” “project,” “intend,” “anticipate,” “believe,” “estimate,” “predict,” “potential,” “pursue,” “target,” “seek,” “objective” or “continue,” the negative of such terms or other comparable terminology.
The forward-looking statements contained in this prospectus are largely based on our expectations, which reflect estimates and assumptions made by our management. These estimates and assumptions reflect our best judgment based on currently known market conditions and other factors. Although we believe such estimates and assumptions to be reasonable, they are inherently uncertain and involve a number of risks and uncertainties that are beyond our control. In addition, management’s assumptions about future events may prove to be inaccurate. Management cautions all readers that the forward-looking statements contained in this prospectus are not guarantees of future performance, and we cannot assure any reader that such statements will be realized or the forward-looking events and circumstances will occur. Actual results may differ materially from those anticipated or implied in the forward-looking statements due to the many factors including those listed in the “Risk Factors” section and elsewhere in this prospectus. All forward-looking statements speak only as of the date of this prospectus. We do not intend to publicly update or revise any forward-looking statements as a result of new information, future events or otherwise. These cautionary statements qualify all forward-looking statements attributable to us or persons acting on our behalf.
30
Table of Contents
Index to Financial Statements
Our net proceeds from the sale of 1,250,000 shares of common stock in this offering, assuming a public offering price of $20.00 per share (which is the midpoint of the range set forth on the cover of this prospectus), are estimated to be $21.8 million, after deducting underwriting discounts and commissions and estimated offering expenses. We will use all of the net proceeds of this offering to pay down outstanding borrowings under our revolving credit facility. Thereafter, we intend to use future borrowings under our revolving credit facility, together with cash flow from our operations and cash on hand, to fund our capital expenditures and for general corporate purposes. Our capital expenditure budget for 2011 is estimated to be approximately $99.7 million, of which approximately $65.2 million had been incurred as of June 30, 2011. Remaining 2011 capital expenditures included estimated amounts of $20.2 million for hydraulic fracturing units and related equipment, $4.1 million for coiled tubing units and related equipment and $6.8 million related to our MWD kits and drilling motors. See “Management’s Discussion and Analysis of Financial Condition and Results of Operations—Capital Requirements and Sources of Liquidity” on page 51 of this prospectus.
We will not receive any proceeds from the sale of shares by the selling stockholders, including any sale the selling stockholders may make upon exercise of the underwriters’ over-allotment option.
All borrowings outstanding under our revolving credit facility will be due and payable on February 15, 2016. As of July 1, 2011, $26.0 million was outstanding under our revolving credit facility and bore interest at the Eurodollar rate of 2.7% per annum. The amounts initially borrowed under our revolving credit facility were used to repay in full the outstanding indebtedness under our prior credit facility and for general corporate purposes. After giving effect to this offering and the application of the net proceeds thereof, based on the assumed public offering price of $20.00 per share, we could have up to $45.8 million available for future borrowings under our revolving credit facility.
An affiliate of SunTrust Robinson Humphrey, Inc. is the lender under our revolving credit facility. Since we will use the net proceeds of this offering to repay outstanding borrowings under our revolving credit facility, such affiliate will receive 5% or more of the net proceeds of this offering, not including underwriting compensation. See “Underwriting—Conflict of Interest” on page 105 of this prospectus.
Great White Energy Services, Inc. has never declared or paid any cash dividends on its capital stock. We currently intend to retain all available funds and any future earnings for use in the operation and expansion of our business and do not anticipate declaring or paying any cash dividends in the foreseeable future. Any future determination as to the declaration and payment of dividends will be at the discretion of our board of directors and will depend on then existing conditions, including our financial condition, results of operations, contractual restrictions, capital requirements, business prospects and other factors that our board of directors considers relevant. Further, we are a holding company that conducts its business through the contributed entities. Under the terms of an equipment financing agreement with a financial institution, the aggregate amount of dividends and/or distributions paid by the contributed entities during any calendar year may not exceed the amount of annual net income based on the results of the rolling last four quarters. In addition, the terms of our revolving credit facility restrict the payment of dividends to the holders of our common stock and any other equity holders.
31
Table of Contents
Index to Financial Statements
The following table sets forth our cash and cash equivalents as of March 31, 2011:
| • | on an actual basis; |
| • | on a pro forma basis to give effect to the issuance of 28,456,554 shares of our common stock to GWES Holdings and 15,322,760 shares of our common stock to Diamondback Holdings in our merger with GWH prior to the completion of this offering; and |
| • | on the pro forma basis described above as adjusted to give effect to the sale of shares of our common stock in this offering at an assumed initial public offering price of $20.00 per share (which is the midpoint of the range set forth on the cover of this prospectus), our receipt of an estimated $21.8 million of net proceeds after deducting the underwriting discounts and commissions and the estimated offering expenses and the payment of an aggregate $4.9 million to certain employees upon completion of this offering. |
You should read the following table in conjunction with “Management’s Discussion and Analysis of Financial Condition and Results of Operations” beginning on page 39 of this prospectus and our consolidated financial statements and related notes appearing elsewhere in this prospectus.
| As of March 31, 2011 | ||||||||||||
| Actual(1) | Pro Forma(1) | Pro
Forma As Adjusted(2) |
||||||||||
| (in thousands) | ||||||||||||
| Cash and cash equivalents |
$ | 19,924 | $ | 19,924 | $ | 15,034 | ||||||
| Long term debt (including current maturities)(3) |
$ | 22,349 | $ | 22,349 | $ | 599 | ||||||
| Capital lease obligations (including current maturities) |
7,027 | 7,027 | 7,027 | |||||||||
| Total debt |
29,376 | 29,376 | 7,626 | |||||||||
| Member’s equity |
186,595 | — | — | |||||||||
| Non-controlling interest in variable interest entities |
611 | 611 | 611 | |||||||||
| Stockholders’ equity: |
||||||||||||
| Common stock, par value $0.01; 100,000,000 shares authorized and 43,779,314 shares issued and outstanding pro forma and 45,029,314 shares issued and outstanding pro forma as adjusted for the offering |
— | 438 | 450 | |||||||||
| Additional paid-in capital |
— | 186,157 | 207,895 | (4) | ||||||||
| Accumulated deficit(5) |
— | (26,100 | ) | (30,990 | )(4) | |||||||
| Total stockholders’ equity |
— | 160,495 | 177,355 | |||||||||
| Total equity |
187,206 | 161,106 | 177,966 | |||||||||
| Total capitalization |
$ | 216,582 | $ | 190,482 | $ | 185,592 | ||||||
| (1) | Great White Energy Services, Inc. was formed in December 2010 and will not conduct any material business operations prior to the merger described below. We are currently a wholly-owned subsidiary of GW Holdings I LLC, or GWH, and all of our assets and operations described in this prospectus are currently owned by GWH, which is an entity controlled by our equity sponsor, Wexford. Effective December 31, 2010, GWES Holdings LLC, which we refer to as GWES Holdings, contributed to GWH its membership interests or common stock, as applicable, in three of its wholly-owned subsidiaries, Great White Pressure Control LLC, Great White Pressure Pumping LLC and Acid, Inc., and Diamondback Holdings, LLC, which |
32
Table of Contents
Index to Financial Statements
| we refer to as Diamondback Holdings, contributed to GWH its membership interests in two of its wholly-owned subsidiaries, Great White Directional Services LLC (formerly Diamondback-Quantum LLC) and Diamondback-Directional Drilling LLC. In connection with its contribution to GWH, Diamondback Holdings extinguished all indebtedness we owed to it under a revolving credit agreement with Diamondback Holdings. See “Management’s Discussion and Analysis of Financial Condition and Results of Operations—Liquidity and Capital Resources—Credit Facilities” on page 50. Prior to the closing of this offering, we will merge with GWH and continue as the surviving corporation. In the merger, we will issue 28,456,554 shares of our common stock to GWES Holdings and 15,322,760 shares of our common stock to Diamondback Holdings. In this prospectus, we refer to Great White Pressure Control LLC, Great White Pressure Pumping LLC, Acid, Inc., Great White Directional Services LLC (formerly Diamondback-Quantum LLC) and Diamondback-Directional Drilling LLC as the contributed entities. As a result of the merger, the contributed entities will become our wholly-owned subsidiaries. |
| (2) | A $1.00 increase (decrease) in the assumed initial public offering price of $20.00 per share (which is the midpoint of the range set forth on the cover of this prospectus) would increase (decrease) each of cash and cash equivalents, additional paid-in-capital and total capitalization by $1.2 million, assuming the number of shares offered by us, as set forth on the cover page of this prospectus, remains the same and after deducting the estimated underwriting discounts and commissions and estimated offering expenses payable by us. |
| (3) | At July 1, 2011, $26.0 million was outstanding under our revolving credit facility. |
| (4) | We will issue 585,600 shares to certain employees 181 days after the completion of this offering under restricted stock units that will be issued following the closing of this offering under the terms of their employment agreements. We will recognize an increase of $11.7 million to additional paid in capital and accumulated deficit at the time of the offering because the restricted stock units will not be subject to forfeiture and the receipt of the shares will be subject only to the passage of time. These transactions have not been reflected in the pro forma or pro forma as adjusted columns above. |
| (5) | Each of the contributed entities other than Acid, Inc. was treated as a partnership for federal income tax purposes. As a result, essentially all of our taxable earnings and losses were passed through to Wexford, and we did not pay federal income taxes at the entity level. Upon completion of this offering, we will recognize deferred tax liabilities and assets for temporary differences between the historical cost bases and tax bases of these assets and liabilities. Based on estimates of those temporary differences as of March 31, 2011, net deferred tax liabilities of approximately $26.1 million will be recognized with a corresponding charge to earnings. |
33
Table of Contents
Index to Financial Statements
Our reported net tangible book value as of March 31, 2011 was $162.6 million, or $3.71 per share, based upon 43,779,314 shares that would have been outstanding as of that date after giving pro forma effect to the merger. Net tangible book value per share is determined by dividing such number of outstanding shares of common stock into our net tangible book value, which is our total tangible assets less total liabilities. Assuming the sale by us of 1,250,000 shares of common stock offered in this offering at an estimated initial public offering price of $20.00 per share (which is the midpoint of the range set forth on the cover of this prospectus) and after deducting the underwriting discounts and commissions and estimated offering expenses payable by us, our net tangible book value as of March 31, 2011 would have been approximately $184.4 million, or $4.09 per share, after giving pro forma effect to the merger. This represents an immediate increase in net tangible book value of $0.38 per share to our existing stockholders and an immediate dilution of $15.91 per share to new investors purchasing shares at the initial public offering price.
The following table illustrates the per share dilution:
| Assumed initial public offering price per share |
$ | 20.00 | ||||||
| Net tangible book value per share as of March 31, 2011 |
$ | 3.71 | ||||||
| Increase per share attributable to new investors |
0.38 | |||||||
| As adjusted net tangible book value per share after the offering |
$ | 4.09 | ||||||
| Dilution per share to new investors |
$ | 15.91 | ||||||
A $1.00 increase in the assumed initial public offering price of $20.00 per share (which is the midpoint of the range set forth in the cover of this prospectus) would increase our net tangible book value after the offering by $1.2 million, and decrease the dilution to new investors by $0.03, assuming the number of shares offered by us, as set forth on the cover page of this prospectus, remains the same and after deducting the estimated underwriting discounts and commissions and estimated offering expenses payable by us.
The following table sets forth, as of March 31, 2011, after giving pro forma effect to the merger, the number of shares of common stock to be issued by us in the merger to GWES Holdings and Diamondback Holdings, which will be our existing stockholders immediately prior to this offering, and to the new investors in this offering at the assumed initial public offering price of $20.00 per share, together with the total consideration paid and average price per share paid by each of these groups, before deducting underwriting discounts and commissions and estimated offering expenses.
| Shares Purchased | Total Consideration | Average Price Per Share |
||||||||||||||||||
| Number | Percent | Amount | Percent | |||||||||||||||||
| (in thousands) | ||||||||||||||||||||
| Existing stockholders |
43,779,314 | 97.2 | % | $ | — | — | % | $ | — | |||||||||||
| New investors |
1,250,000 | 2.8 | % | 25,000 | 100.0 | % | $ | 20.00 | ||||||||||||
| Total |
45,029,314 | 100.0 | % | $ | 25,000 | 100.0 | % | |||||||||||||
If the underwriters’ over-allotment option is exercised in full, the number of shares held by new investors will be 1,250,000, or approximately, 2.8% of the total number of shares of common stock.
34
Table of Contents
Index to Financial Statements
The data in the table excludes 2,500,000 shares of common stock reserved for issuance under our 2011 Equity Incentive Plan, including, based on an assumed public offering price of $20.00 per share (which is the midpoint of the range set forth on the cover of this prospectus):
| • | 585,600 restricted stock units to be issued to certain employees following the closing of this offering under the terms of their employment agreements, which restricted stock units will not be subject to forfeiture and will have a settlement date that is 181 days after the closing of this offering; |
| • | 46,662 restricted stock units to be issued to our non-employee directors following the closing of this offering as part of their director compensation; and |
| • | options to purchase 935,819 shares of our common stock to be granted to our Chief Executive Officer following the closing of this offering under the terms of his employment agreement. |
35
Table of Contents
Index to Financial Statements
SELECTED HISTORICAL FINANCIAL DATA
The following selected historical consolidated financial data as of December 31, 2010 and 2009 and for each of the years in the three-year period ended December 31, 2010 are based on our audited consolidated financial statements included elsewhere in the prospectus. The selected consolidated financial data as of December 31, 2008 and for the year ended December 31, 2007 are based on our audited financial statements not included in this prospectus. The selected consolidated financial data as of December 31, 2007 and 2006 and for the year ended December 31, 2006 are based on our unaudited consolidated financial statements not included in this prospectus. The data as of and for the three months ended March 31, 2011 and 2010 are based on our unaudited consolidated financial statements included elsewhere in the prospectus. The unaudited pro forma data presented gives effect to income taxes assuming that the Company operated as a taxable corporation throughout the periods presented. Operating results for the periods ended March 31, 2011 and 2010 and December 31, 2010, 2009, 2008, 2007 and 2006 are not necessarily indicative of results that may be expected for the entire year 2011 or any future periods. You should review this information together with “Management’s Discussion and Analysis of Financial Condition and Results of Operations” and our historical consolidated financial statements and related notes included elsewhere in this prospectus.
| Three Months Ended March 31, |
Year Ended December 31, | |||||||||||||||||||||||||||
| 2011 | 2010 | 2010 | 2009 | 2008 | 2007 | 2006 | ||||||||||||||||||||||
| (in thousands, except per share data) |
||||||||||||||||||||||||||||
| Statement of Operations Data: |
||||||||||||||||||||||||||||
| Revenue: |
||||||||||||||||||||||||||||
| Completion and production services |
$ | 60,474 | $ | 21,321 | $ | 135,863 | $ | 55,841 | $ | 103,509 | $ | 42,461 | $ | 6,962 | ||||||||||||||
| Horizontal and directional drilling services |
19,890 | 14,521 | 70,867 | 42,732 | 105,106 | 83,138 | 52,307 | |||||||||||||||||||||
| Total |
80,364 | 35,842 | 206,730 | 98,573 | 208,615 | 125,599 | 59,269 | |||||||||||||||||||||
| Expenses: |
||||||||||||||||||||||||||||
| Cost of revenue, exclusive of depreciation, amortization and impairment: |
||||||||||||||||||||||||||||
| Completion and production services |
34,376 | 16,596 | 92,669 | 49,946 | 68,107 | 33,157 | 3,941 | |||||||||||||||||||||
| Horizontal and directional drilling services |
15,213 | 11,403 | 53,098 | 32,801 | 63,507 | 58,772 | 34,549 | |||||||||||||||||||||
| Selling, general and administrative |
4,908 | 3,371 | 15,102 | 10,332 | 15,896 | 13,059 | 9,894 | |||||||||||||||||||||
| Depreciation and amortization |
6,554 | 5,450 | 23,419 | 22,367 | 20,673 | 13,469 | 4,650 | |||||||||||||||||||||
| Impairment of goodwill and intangible assets |
— | — | — | — | 20,185 | — | — | |||||||||||||||||||||
| Operating income (loss) |
19,313 | (978 | ) | 22,442 | (16,873 | ) | 20,247 | 7,142 | 6,235 | |||||||||||||||||||
| Interest expense |
(29 | ) | (354 | ) | (1,346 | ) | (1,826 | ) | (2,110 | ) | (1,033 | ) | (123 | ) | ||||||||||||||
| Other income |
40 | 1 | 68 | 207 | 462 | 308 | 101 | |||||||||||||||||||||
| Income (loss) before income taxes |
19,324 | (1,331 | ) | 21,164 | (18,492 | ) | 18,599 | 6,417 | 6,213 | |||||||||||||||||||
| Provision (benefit) for income taxes |
33 | (33 | ) | 273 | 28 | (2,455 | ) | 885 | 466 | |||||||||||||||||||
| Net income (loss) |
19,291 | (1,298 | ) | 20,891 | (18,520 | ) | 21,054 | 5,532 | 5,747 | |||||||||||||||||||
| Income attributable to non-controlling interest in variable interest entities |
11 | 11 | 41 | 28 | 9 | 8 | — | |||||||||||||||||||||
| Net income (loss) attributable to equity holders of the Company |
$ | 19,280 | $ | (1,309 | ) | $ | 20,850 | $ | (18,548 | ) | $ | 21,045 | $ | 5,524 | $ | 5,747 | ||||||||||||
36
Table of Contents
Index to Financial Statements
| Three Months Ended March 31, |
Year Ended December 31, | |||||||||||||||||||||||||||
| 2011 | 2010 | 2010 | 2009 | 2008 | 2007 | 2006 | ||||||||||||||||||||||
| (in thousands, except per share data) | ||||||||||||||||||||||||||||
| Pro Forma C Corporation Data (unaudited):(1) |
||||||||||||||||||||||||||||
| Historical income (loss) before income taxes |
$ | 19,324 | $ | (1,331 | ) | $ | 21,164 | $ | (18,492 | ) | $ | 18,599 | $ | 6,417 | $ | 6,213 | ||||||||||||
| Pro forma provision (benefit) for income taxes |
7,385 | (464 | ) | 8,160 | (6,928 | ) | 15,271 | 3,289 | 2,613 | |||||||||||||||||||
| Pro forma net income (loss) |
$ | 11,939 | $ | (867 | ) | $ | 13,004 | $ | (11,564 | ) | $ | 3,328 | $ | 3,128 | $ | 3,600 | ||||||||||||
| Pro forma net income (loss) attributable to equity holders of the Company |
$ | 11,928 | $ | (878 | ) | $ | 12,963 | $ | (11,592 | ) | $ | 3,319 | $ | 3,120 | $ | 3,600 | ||||||||||||
| Pro forma income (loss) per common share—basic and diluted(2) |
$ | .27 | $ | .30 | ||||||||||||||||||||||||
| Weighted average pro forma shares outstanding—basic and diluted(2) |
43,779 | 43,779 | ||||||||||||||||||||||||||
| Other Financial Data: |
||||||||||||||||||||||||||||
| Adjusted EBITDA (unaudited)(3) |
$ | 25,907 | $ | 4,473 | $ | 45,929 | $ | 5,701 | $ | 61,567 | $ | 20,919 | $ | 10,986 | ||||||||||||||
| Cash flows provided by (used in) operating activities |
16,252 | 377 | 29,931 | 22,479 | 38,657 | 16,254 | (4,273 | ) | ||||||||||||||||||||
| Cash flows used in investing activities |
(21,055 | ) | (2,706 | ) | (48,253 | ) | (5,871 | ) | (24,245 | ) | (80,177 | ) | (45,219 | ) | ||||||||||||||
| Cash flows provided by (used in) financing activities |
16,739 | 4,551 | 24,825 | (15,749 | ) | (16,056 | ) | 59,309 | 55,955 | |||||||||||||||||||
| Cash capital expenditures: |
||||||||||||||||||||||||||||
| Acquisitions, net of cash acquired |
— | — | — | — | — | (23,479 | ) | (20,827 | ) | |||||||||||||||||||
| Property and equipment |
(21,846 | ) | (3,490 | ) | (52,569 | ) | (9,455 | ) | (32,848 | ) | (61,562 | ) | (25,492 | ) | ||||||||||||||
| As of March 31, | As of December 31, | |||||||||||||||||||||||||||
| 2011 | 2010 | 2010 | 2009 | 2008 | 2007 | 2006 | ||||||||||||||||||||||
| (in thousands) |
||||||||||||||||||||||||||||
| Balance Sheet Data: |
||||||||||||||||||||||||||||
| Total current assets |
$ | 79,672 | $ | 33,800 | $ | 54,066 | $ | 24,948 | $ | 45,364 | $ | 37,637 | $ | 30,348 | ||||||||||||||
| Total assets |
261,260 | 157,284 | 213,506 | 150,449 | 185,783 | 182,630 | 108,849 | |||||||||||||||||||||
| Advances from Great White Energy Services LLC |
5,043 | 10,334 | 638 | 10,464 | 9,948 | 14,471 | 92 | |||||||||||||||||||||
| Total current liabilities |
47,299 | 27,952 | 31,921 | 24,451 | 30,016 | 33,158 | 11,660 | |||||||||||||||||||||
| Capital lease obligations, net of current portion |
|
6,252 |
|
|
6,519 |
|
6,457 | 6,614 | 6,481 | 3,278 | — | |||||||||||||||||
| Long term debt, net of current portion |
|
19,497 |
|
— | 6,012 | — | — | — | — | |||||||||||||||||||
| Total liabilities |
74,054 | 35,901 | 45,552 | 32,572 | 38,213 | 44,944 | 20,054 | |||||||||||||||||||||
| Non-controlling interest in variable interest entities |
611 | 679 | 639 | 668 | 690 | 727 | — | |||||||||||||||||||||
| Total equity |
187,206 | 121,383 | 167,955 | 117,878 | 147,570 | 137,686 | 88,795 | |||||||||||||||||||||
| (1) | Great White Energy Services, Inc. was formed as a Delaware corporation in December 2010 and will not conduct any material business operations prior to the merger described below. We are currently a wholly-owned subsidiary of GW Holdings I LLC, or GWH, and all of our assets and operations described in this prospectus are currently owned by GWH, which is an entity controlled by our equity sponsor, Wexford. Effective December 31, 2010, GWES Holdings LLC, which we refer to as GWES Holdings, contributed to GWH its membership interests or common stock, as applicable, in three of its wholly-owned subsidiaries, Great White Pressure Control LLC, Great White Pressure Pumping LLC and Acid, Inc., and Diamondback Holdings, LLC, which we refer to as Diamondback Holdings, contributed to GWH its membership interests in two of its wholly-owned subsidiaries, Great White Directional Services LLC (formerly Diamondback-Quantum LLC) and Diamondback-Directional Drilling LLC. In connection with its contribution to GWH, Diamondback Holdings extinguished all indebtedness owed to it by the contributed entities under a revolving credit agreement. See “Management’s Discussion and Analysis of Financial Condition and Results of Operations—Liquidity and Capital Resources—Credit Facilities” on page 50 of this prospectus. Prior to the closing of this offering, we will merge with GWH and continue as the surviving corporation. In the merger, we will issue 28,456,554 shares of our common stock to GWES |
37
Table of Contents
Index to Financial Statements
| Holdings and 15,322,760 shares of our common stock to Diamondback Holdings. In this prospectus, Great White Pressure Control LLC, Great White Pressure Pumping LLC, Acid, Inc., Great White Directional Services LLC (formerly Diamondback-Quantum LLC) and Diamondback-Directional Drilling LLC are referred to as the contributed entities. As a result of the merger, the contributed entities will become our wholly-owned subsidiaries. Our historical consolidated financial statements were prepared on a consolidated basis and represent the consolidated assets, liabilities, revenues and expenses of GWH. See “Note A—Nature of Operations and Summary of Significant Accounting Policies” to our historical consolidated financial statements on page F-7 of this prospectus for additional information regarding the basis upon which our financial statements have been prepared. Each of the contributed entities other than Acid, Inc. was treated as a partnership for federal income tax purposes. As a result, essentially all of our taxable earnings and losses were passed through to Wexford, and we did not pay federal income taxes at the entity level. For comparative purposes, we have included a pro forma provision (benefit) for income taxes assuming we had been taxed as a C corporation in all periods prior to the merger. The unaudited pro forma data are presented for informational purposes only, and do not purport to project our results of operations for any future period or our financial position as of any future date. |
| (2) | The pro forma earnings per share data have been presented for the latest fiscal year and interim period and have been calculated as if the merger discussed in note 1 above had been consummated and the shares of common stock were issued to GWES Holdings and Diamondback Holdings in the merger at the beginning of such period. |
| (3) | Adjusted EBITDA consists of net income (loss) attributable to the equity holders of the Company before interest expense, income taxes (benefit), depreciation and amortization, income attributable to non-controlling interest in variable interest entities, or VIEs, and impairment of goodwill and intangible assets. Adjusted EBITDA is a non-GAAP financial measure, which is generally defined by the SEC as one that purports to measure historical or future financial performance, financial position or cash flows, but excludes or includes amounts that would not be so adjusted in the most comparable GAAP measure. Adjusted EBITDA is included in this prospectus because our management considers it an important supplemental measure of our performance and believes that it is frequently used by securities analysts, investors and other interested parties in the evaluation of companies in our industry that have different financing and capital structures and/or tax rates. In addition, we use Adjusted EBITDA in evaluating acquisition targets. Adjusted EBITDA is not a substitute for the GAAP measures of earnings or of cash flow and is not necessarily a measure of our ability to fund our cash needs. In addition, it should be noted that companies calculate Adjusted EBITDA differently and, therefore, may not be useful in comparing our results to those of the other companies. Adjusted EBITDA has material limitations as a performance measure because it excludes interest expense, taxes, depreciation and amortization, income attributable to non-controlling interest in VIEs and impairment of goodwill and intangible assets. The table below reconciles Adjusted EBITDA for the three months ended March 31, 2011 and 2010 and the years ended December 31, 2010, 2009, 2008, 2007 and 2006 to the most comparable GAAP measure, net income (loss) attributable to the equity holders of the Company. |
Reconciliation of Adjusted EBITDA to Net Income (Loss)
Attributable to the Equity Holders of the Company
| Three Months Ended March 31, |
For the Year Ended December 31, | |||||||||||||||||||||||||||
| 2011 | 2010 | 2010 | 2009 | 2008 | 2007 | 2006 | ||||||||||||||||||||||
| (in thousands) | ||||||||||||||||||||||||||||
| Adjusted EBITDA |
$ | 25,907 | $ | 4,473 | $ | 45,929 | $ | 5,701 | $ | 61,567 | $ | 20,919 | $ | 10,986 | ||||||||||||||
| Depreciation and amortization |
(6,554 | ) | (5,450 | ) | (23,419 | ) | (22,367 | ) | (20,673 | ) | (13,469 | ) | (4,650 | ) | ||||||||||||||
| Impairment loss |
|
— |
|
|
— |
|
— | — | (20,185 | ) | — | — | ||||||||||||||||
| Interest expense |
(29 | ) | (354 | ) | (1,346 | ) | (1,826 | ) | (2,110 | ) | (1,033 | ) | (123 | ) | ||||||||||||||
| Income attributable to non-controlling interest in VIEs |
(11 | ) | (11 | ) | (41 | ) | (28 | ) | (9 | ) | (8 | ) | — | |||||||||||||||
| Income tax (provision) benefit |
(33 | ) | 33 | (273 | ) | (28 | ) | 2,455 | (885 | ) | (466 | ) | ||||||||||||||||
| Net income (loss) attributable to equity holders of the Company |
$ | 19,280 | $ | (1,309 | ) | $ | 20,850 | $ | (18,548 | ) | $ | 21,045 | $ | 5,524 | $ | 5,747 | ||||||||||||
38
Table of Contents
Index to Financial Statements
MANAGEMENT’S DISCUSSION AND ANALYSIS OF
FINANCIAL CONDITION AND RESULTS OF OPERATIONS
The following discussion and analysis should be read in conjunction with the “Selected Historical Financial Data” on page 36 of this prospectus and the consolidated financial statements and related notes included elsewhere in this prospectus. This discussion contains forward-looking statements reflecting our current expectations and estimates and assumptions concerning events and financial trends that may affect our future operating results or financial position. Actual results and the timing of events may differ materially from those contained in these forward-looking statements due to a number of factors, including those discussed in the sections entitled “Risk Factors” beginning on page 13 and “Cautionary Note Regarding Forward-Looking Statements” on page 30 of this prospectus.
Introduction
Great White Energy Services, Inc. was formed as a Delaware corporation in December 2010 and will not conduct any material business operations prior to the merger described below. We are currently a wholly-owned subsidiary of GW Holdings I LLC, or GWH, and all of our assets and operations described in this prospectus are currently owned by GWH, an entity controlled by our equity sponsor, Wexford. Effective December 31, 2010, GWES Holdings LLC, an entity controlled by Wexford, which we refer to as GWES Holdings, contributed to GWH its membership interests or common stock, as applicable, in three of its wholly-owned subsidiaries, Great White Pressure Control LLC, Great White Pressure Pumping LLC and Acid, Inc., and Diamondback Holdings, LLC, an entity controlled by Wexford, which we refer to as Diamondback Holdings, contributed to GWH its membership interests in two of its wholly-owned subsidiaries, Great White Directional Services LLC (formerly Diamondback-Quantum LLC) and Diamondback-Directional Drilling LLC. In connection with its contribution to GWH, Diamondback Holdings extinguished all indebtedness we owed to it under a revolving credit agreement with Diamondback Holdings. See “—Liquidity and Capital Resources—Credit Facilities” on page 50 of the prospectus. Prior to the closing of this offering, we will merge with GWH and continue as the surviving corporation. In the merger, we will issue 28,456,554 shares of our common stock to GWES Holdings and 15,322,760 shares of our common stock to Diamondback Holdings. In this prospectus, Great White Pressure Control LLC, Great White Pressure Pumping LLC, Acid, Inc., Great White Directional Services LLC (formerly Diamondback-Quantum LLC) and Diamondback-Directional Drilling LLC are referred to as the contributed entities. As a result of the merger, the contributed entities will become our wholly-owned subsidiaries.
Our historical consolidated financial statements as of December 31, 2009 and 2010, and for the years ended December 31, 2008, 2009 and 2010, as well as our unaudited consolidated financial statements as of March 31, 2011 and for the periods ended March 31, 2011 and 2010, included in this prospectus were prepared on a consolidated basis and represent the consolidated assets, liabilities, revenues and expenses of GWH. See “Note A—Nature of Operations and Summary of Significant Accounting Policies” to our historical consolidated financial statements on page F-7 of this prospectus for additional information regarding the basis upon which our financial statements have been prepared. The financial statements included in this prospectus also present an unaudited balance sheet as of March 31, 2011 and an audited balance sheet as of January 4, 2011 of Great White Energy Services, Inc.
Overview
We are a diversified oilfield service company designed to capture the growth in the extended reach horizontal drilling markets in the U.S. unconventional shale oil and natural gas resource plays. Our equipment is tailored to serve the unconventional resource markets. We currently conduct our operations through two operating segments—completion and production services and horizontal and directional drilling services. We believe that our services are critical in increasing the ultimate recovery and present value of production streams for unconventional resources. Our complementary suite of drilling, completion and production related services provides us with the opportunity to cross sell our services and expand our customer base and geographic positioning.
39
Table of Contents
Index to Financial Statements
Our business is strategically positioned primarily in the Bakken, Cana Woodford, Cleveland, Eagle Ford, Fayetteville, Granite Wash, Cotton Valley, Haynesville, Marcellus, Marmaton, Mississippi, Niobrara, Permian, Trenton, Utica and Woodford resource plays. A resource play is a term used to describe an accumulation of hydrocarbons known to exist over a large area. We serve these markets through our 13 service centers located in Michigan, Oklahoma, Texas, West Virginia and Wyoming.
Our operational division heads have an average of over 30 years of oilfield service experience and bring valuable basin-level expertise and long-term customer relationships to our business. We provide our completion and production and horizontal and directional drilling services to a diversified range of both public and private independent producers as well as integrated major companies. Our top five customers for the year ended December 31, 2010, representing 36% of our revenue, were SandRidge Energy, Inc., Windsor Permian LLC, Chesapeake Energy Corp., Continental Resources, Inc. and East Resources, Inc. Our top five customers for the three months ended March 31, 2011, representing 46% of our revenue, were SandRidge Energy, Inc., Unit Petroleum Company, Windsor Permian LLC, EOG Resources, Inc. and Continental Resources, Inc.
We commenced operations with the acquisition of the assets of Quantum Drilling Motors L.L.C. in December 2005 for $25.9 million and later acquired the membership interests of Directional Drilling Contractors L.L.C. in August 2007 for $23.5 million. These acquisitions formed the platform for our horizontal and directional drilling business. Our completion and production segment was formed in July 2006 through the hiring of an experienced senior management team. Since then, this team has developed our pressure control services through organic growth. We began providing pressure pumping services in September 2006 with the stock acquisition of Acid Inc. for a cost of $29.1 million. We have since grown rapidly through acquisition of equipment and organic growth. We have invested a net total of $155.7 million from inception through March 31, 2011 to build our business, including the strategic acquisitions discussed above.
We currently conduct our operations through the following two business segments:
| • | Completion and Production Services. Our completion and production segment provides pressure pumping services and pressure control services. Our pressure pumping services include hydraulic fracturing and acidizing services. These services are used primarily in optimizing hydrocarbon flow paths during the completion phase of unconventional wellbores. Our pressure control services equipment is tailored to the unconventional resource market with the ability to operate under high pressures without having to delay or cease production during completion operations. Ceasing or suppressing production in the completion phase of an unconventional well could result in formation damage impacting the overall recovery of reserves. Our pressure control services include coiled tubing, snubbing, wireline services, nitrogen and fluid pumping and well control services. |
| • | Horizontal and Directional Drilling Services. Our horizontal and directional drilling equipment is designed for efficient drilling and production of oil and natural gas from the unconventional resource plays that we serve. Our horizontal and directional drilling services allow our customers to drill wellbores to specific objectives within narrow location parameters. The evolution of unconventional resource reserve recovery has increased the need for the precise placement of the wellbore. Wellbores are often drilled sideways across long-lateral intervals within narrow formations as thin as ten feet. Our personnel are involved in all aspects of the well from the initial planning of the well to the management and execution of the horizontal or directional drilling operation. Our horizontal and drilling equipment includes drilling motors, MWD kits and EM kits. |
Outlook
Our customers are predominately independent oil and natural gas exploration and production companies. The primary factors that affect demand for our services are the levels of drilling and production-related activity of our customers, which in turn are affected in part by current and anticipated future oil and natural gas prices. Our growth strategy is focused on increasing service and product offerings in our current service areas and
40
Table of Contents
Index to Financial Statements
expanding our operations into new service areas either through acquisitions or establishment of new field offices. We seek to leverage our established customer relationships in achieving our growth strategy.
We consider the number of wells drilled, number of drilling rigs working and well service rig counts to be an indication of spending levels by our customers. We believe that our customers tend to invest more in these activities, particularly drilling-related activities, when hydrocarbon prices are at higher levels or anticipated to increase. The following tables summarize average North American drilling and well service rig activity as reported by Baker-Hughes Incorporated, as well as historical natural gas and crude oil near-month prices on the New York Mercantile Exchange (NYMEX) as recorded by Thomson ONE.
Year End Rig Count(1)
| BHI Rotary Rig Count |
Year Ended 12/31/05 |
Year Ended 12/31/06 |
Year Ended 12/31/07 |
Year Ended 12/31/08 |
Year Ended 12/31/09 |
Year Ended 12/31/10 |
||||||||||||||||||
| U.S. Land |
1,391 | 1,626 | 1,719 | 1,653 | 1,150 | 1,670 | ||||||||||||||||||
| U.S. Offshore |
80 | 84 | 63 | 68 | 39 | 24 | ||||||||||||||||||
| Total U.S. |
1,471 | 1,710 | 1,782 | 1,721 | 1,189 | 1,694 | ||||||||||||||||||
U.S. Oil & Gas Prices
| Natural Gas Near Month Contract Price | Crude Oil Near Month Contract Price | |||||||||||||||||||||||
| Period |
Minimum | Average | Maximum | Minimum | Average | Maximum | ||||||||||||||||||
| 1/1/05-12/31/05(2) |
$ | 6.33 | $ | 9.17 | $ | 13.95 | $ | 42.12 | $ | 56.59 | $ | 69.81 | ||||||||||||
| 1/1/06-12/31/06(3) |
6.39 | 6.86 | 7.97 | 55.81 | 66.09 | 77.03 | ||||||||||||||||||
| 1/1/07-12/31/07(3) |
6.55 | 7.45 | 8.32 | 50.48 | 72.23 | 98.88 | ||||||||||||||||||
| 1/1/08-12/31/08(3) |
6.94 | 8.53 | 10.41 | 31.41 | 99.92 | 145.29 | ||||||||||||||||||
| 1/1/09-12/31/09(3) |
6.00 | 6.61 | 7.37 | 33.98 | 61.99 | 81.04 | ||||||||||||||||||
| 1/1/10-12/31/10(3) |
4.11 | 5.10 | 6.28 | 65.96 | 79.51 | 91.49 | ||||||||||||||||||
| (1) | Source: Baker Hughes Incorporated |
| (2) | Source: Thomson ONE |
| (3) | Source: Bloomberg |
Marketing Environment
We operate in a highly competitive industry. Our competition includes many large and small oilfield service companies. As such, we price our services and products to remain competitive in the markets in which we operate, adjusting our rates to reflect current market conditions as necessary. We examine the rate of utilization of our equipment as one measure of our ability to compete in the current market environment.
Seasonality
We provide oilfield services for oil and natural gas operations primarily in the Bakken, Cana Woodford, Cleveland, Eagle Ford, Fayetteville, Granite Wash, Cotton Valley, Haynesville, Marcellus, Marmaton, Mississippi, Niobrara, Permian, Trenton, Utica and Woodford resource plays. We serve these markets through our 13 service centers located in Michigan, Oklahoma, Texas, West Virginia and Wyoming.
For the year ended December 31, 2010, over 83% of our revenue was generated from operations in Louisiana, Oklahoma and Texas. As a result, we are generally not affected by seasonal weather conditions. We also have operations in Michigan, West Virginia, Wyoming, North Dakota and Montana where weather conditions may be severe and limit our ability to operate in those areas, particularly during winter and spring months. However, our operations in Michigan, West Virginia, Wyoming, North Dakota and Montana have
41
Table of Contents
Index to Financial Statements
historically generated significantly less revenue than our Louisiana, Oklahoma and Texas operations. As a result, seasonal weather fluctuations have not, historically, had a material adverse effect on our operations or results of operations.
Application of Critical Accounting Policies and Estimates
The discussion and analysis of our financial condition and results of operations are based upon our consolidated financial statements, which have been prepared in accordance with accounting principles generally accepted in the United States. Below, we have provided expanded discussion of our more significant accounting policies, estimates and judgments. We believe these accounting policies reflect our more significant estimates and assumptions used in preparation of our financial statements. See Note A of the notes to our consolidated financial statements appearing elsewhere in this prospectus for a discussion of additional accounting policies and estimates made by management.
Use of Estimates. In preparing the financial statements, our management makes informed judgments and estimates that affect the reported amounts of assets and liabilities, the disclosure of contingent assets and liabilities at the date of the financial statements and reported amounts of revenues and expenses during the reporting period. Actual results could differ from those estimates. Significant estimates include but are not limited to the allowance for doubtful accounts, reserves for self-insurance, depreciation and amortization of property and equipment and amortizable intangibles, future cash flows and fair values used to assess recoverability and impairment of long-lived assets and goodwill and allocation of general, administrative and corporate overhead expenses.
Revenue Recognition. We generate revenue from multiple sources within our two operating segments. In all cases, revenue is recognized when services are performed, collection of the receivables is probable, persuasive evidence of an arrangement exists and the price is fixed and determinable. Services are sold without warranty or the right to return. The specific revenue sources are outlined as follows:
| • | Completion and Production Services. Our completion and production business consists of providing pressure pumping and pressure control services. Pressure control services include nitrogen stimulation and fluid or nitrogen services, coiled tubing, wireline services, snubbing, valve drilling, hot tapping and engineering services. Pressure pumping services involve hydraulic fracturing and acidizing services and are used in optimizing hydrocarbon flow paths and in the drilling, completing and plugging of wells. Production and completion services are typically provided on a day rate or contracted basis and revenue is recognized as the work progresses. Additional revenue is generated through the sale of consumable supplies that are incidental to the service being performed. |
| • | Horizontal and Directional Drilling Services. Our horizontal and directional drilling services are designed to allow our customers to reach the intended total well depth faster, thus increasing well economics by accelerating the timing of hydrocarbon production and facilitating recovery of hydrocarbons from the reservoir. Our drilling services include well planning, horizontal and directional drilling, and underbalanced drilling. Our motors are used to propel drill bits and we provide measurement while drilling, or MWD, kits and electromagnetic, or EM, kits. As part of our horizontal and directional drilling services, we provide advanced technical drilling expertise, including horizontal and directional drilling crews. These services are generally provided on a day rate or hourly rate basis. Revenue is recognized as the work progresses. Proceeds from customers for the cost of oilfield rental equipment that is involuntarily damaged or lost down-hole are reflected as revenues. |
Allowance for Doubtful Accounts. We regularly review receivables and provide for estimated losses through an allowance for doubtful accounts. In evaluating the level of established reserves, we make judgments regarding our customers’ ability to make required payments, economic events and other factors. As the financial condition of customers change, circumstances develop or additional information becomes available, adjustments to the allowance for doubtful accounts may be required. In the event we were to determine that a customer may
42
Table of Contents
Index to Financial Statements
not be able to make required payments, we would increase the allowance through a charge to income in the period in which that determination is made. Uncollectable accounts receivable are periodically charged against the allowance for doubtful accounts once final determination is made of their uncollectability.
Depreciation and Amortization. In order to depreciate and amortize our property and equipment and our intangible assets with finite lives, we estimate useful lives, attrition factors and salvage values of these items. Our estimates may be affected by such factors as changing market conditions, technological advances in industry or changes in regulations governing the industry.
Impairment of Long-Lived Assets. Long-lived assets, primarily property and equipment and amortizable intangibles, are reviewed for impairment when events or changes in circumstances indicate that the carrying amount of such assets may not be recoverable. Recoverability of such assets is evaluated by measuring the carrying amount of the assets against the estimated undiscounted future cash flows associated with the assets. If such evaluations indicate that the future undiscounted cash flow from the assets is not sufficient to recover the carrying value of such assets, the assets are adjusted to their estimated fair values.
Annual Evaluation of Goodwill. Goodwill is tested for impairment as of October 1 each year or more frequently if events or changes in circumstances indicate that goodwill might be impaired. This assessment involves a considerable degree of judgment and is performed in a two step process. Initially, each reporting unit’s fair value is compared to its carrying value to determine whether an indication of impairment exists. If impairment is indicated, then the implied value of the reporting unit’s goodwill is determined by allocating the unit’s fair value to its assets and liabilities as if the reporting unit had been acquired in a business combination. The fair value of the reporting unit is determined using the discounted cash flow approach, excluding interest. The amount of impairment for goodwill is measured as the excess of its carrying value over it implied value. As of December 31, 2010, 2009 and 2008, the carrying value of our goodwill was $16.2 million. No indications of impairment were noted during 2010, however, as a result of the downturn in the economy and decline in commodity prices, goodwill of $14.0 million was determined to be impaired and written off in 2008.
Income Taxes. All the contributed entities with the exception of Acid, Inc are limited liability companies and as such are treated as pass-through entities for income tax purposes; accordingly, income taxes on net earnings are payable by the stockholders, members or partners and are not reflected in the historical financial statements. Acid, Inc. is subject to corporate income taxes and they are provided in the financial statements based upon Financial Accounting Standards Board, or FASB, Accounting Standard Codification, or ASC, 740 Income Taxes. As such, deferred tax assets and liabilities are recognized for the future tax consequences attributable to differences between the financial statement carrying amounts of existing assets and liabilities and their respective tax bases. Deferred tax assets and liabilities are measured using statutory tax rates expected to apply to taxable income in the years in which those temporary differences are expected to be recovered or settled. The effect of deferred tax assets and liabilities as a result of a change in tax rate is recognized in the period that includes the statutory enactment date. A valuation allowance for deferred tax assets is recognized when it is more likely than not that the benefit of deferred tax assets will not be realized. Upon completion of this offering, we will be taxed as a C corporation.
43
Table of Contents
Index to Financial Statements
Results of Operations
The following table sets forth selected operating data for the periods indicated.
| Three Months Ended March 31, |
Year Ended December 31, | |||||||||||||||||||
| 2011 | 2010 | 2010 | 2009 | 2008 | ||||||||||||||||
| (in thousands) |
||||||||||||||||||||
| Revenue |
||||||||||||||||||||
| Completion and Production Services |
$ | 60,474 | $ | 21,321 | $ | 135,863 | $ | 55,841 | $ | 103,509 | ||||||||||
| Horizontal and Directional Drilling Services |
19,890 | 14,521 | 70,867 | 42,732 | 105,106 | |||||||||||||||
| Total revenue |
80,364 | 35,842 | 206,730 | 98,573 | 208,615 | |||||||||||||||
| Cost of revenue |
||||||||||||||||||||
| Completion and Production Services |
34,376 | 16,596 | 92,669 | 49,946 | 68,107 | |||||||||||||||
| Horizontal and Directional Drilling Services |
15,213 | 11,403 | 53,098 | 32,801 | 63,507 | |||||||||||||||
| Total cost of revenue |
49,589 | 27,999 | 145,767 | 82,747 | 131,614 | |||||||||||||||
| Selling, general and administrative |
4,908 | 3,371 | 15,102 | 10,332 | 15,896 | |||||||||||||||
| Depreciation and amortization |
6,554 | 5,450 | 23,419 | 22,367 | 20,673 | |||||||||||||||
| Impairment of goodwill and intangible assets |
— | — | — | — | 20,185 | |||||||||||||||
| Operating income (loss) |
19,313 | (978 | ) | 22,442 | (16,873 | ) | 20,247 | |||||||||||||
| Interest expense |
(29 | ) | (354 | ) | (1,346 | ) | (1,826 | ) | (2,110 | ) | ||||||||||
| Other income |
40 | 1 | 68 | 207 | 462 | |||||||||||||||
| Provision (benefit) for income taxes |
33 | (33 | ) | 273 | 28 | (2,455 | ) | |||||||||||||
| Net income (loss) |
$ | 19,291 | $ | (1,298 | ) | $ | 20,891 | $ | (18,520 | ) | $ | 21,054 | ||||||||
Three Months Ended March 31, 2011 Compared to Three Months Ended March 31, 2010
Revenue. Revenue for the three months ended March 31, 2011 totaled $80.4 million compared to $35.8 million for the three months ended March 31, 2010, an increase of 124.2%. The increase by segment was as follows:
| • | Completion and Production Services. Segment revenue for the three months ended March 31, 2011 was $60.5 million compared to $21.3 million for the same period of the prior year. This represents an increase of 183.6% and was principally driven by a $25.0 million increase in hydraulic fracturing services and a $14.6 million increase in pressure control services. |
The increase in hydraulic fracturing revenue was attributable to an increase of 27,617 in average available horsepower for the quarter ended March 31, 2011 compared to 48,200 average available horsepower for the quarter ended March 31, 2010. This increase in horsepower allowed the company to pursue and service hydraulic fracturing engagements with longer laterals, higher pressure requirements and increased stages resulting in average revenue per job in the first quarter of 2011 of $379,000 compared to average revenue per job in the first quarter of 2010 of $76,000.
The growth in revenue in pressure control services was attributable to a 40% increase in the number of jobs performed coupled with a 49% increase in the weighted average revenue per job.
| • | Horizontal and Directional Drilling Services. For the three months ended March 31, 2011, revenue for this segment totaled $19.9 million which was a $5.4 million, or 37%, increase over segment revenue for the same period of the prior year. The increase resulted from a 22.6% increase in the average number of MWD kits available coupled with a 16% increase in the average day rate. |
Cost of Revenue. Cost of revenue includes the costs of labor, materials, maintenance, fuel and facility costs incurred in performing our completion and production services and our horizontal and directional drilling
44
Table of Contents
Index to Financial Statements
services. Cost of revenue increased by $21.6 million, or 77.1%, in the first quarter of 2011 compared to the same period in 2010. The increase was attributable to the $44.6 million increase in revenue discussed above. Cost of revenue by segment was as follows:
| • | Completion and Production Services. Cost of revenue for the completion and production segment increased $17.8 million, or 107.1%, for the three months ended March 31, 2011 compared to the three months ended March 31, 2010. As a percentage of revenue, these costs totaled 56.8% of revenue for the 2011 period, down from 77.8% in the same period in 2010. The decline was primarily attributable to improved gross margins as a result of higher pricing. The increase in these expenses was primarily attributable to salaries, wages and benefits ($5.1 million), chemicals ($5.9 million), fuel ($1.9 million) and freight ($2.5 million). |
| • | Horizontal and Directional Drilling Services. Cost of revenue for this segment totaled $15.2 million for the three months ended March 31, 2011 compared to $11.4 million for the three months ended March 31, 2010. This increase of $3.8 million, or 33.4%, principally arose from higher salaries, wages and benefits resulting from the revenue increase discussed above. |
Selling, General and Administrative Expenses. Selling, general and administrative expenses include salaries and other related expenses for our selling, administrative, finance, information technology and human resource functions. These expenses increased $1.5 million, or 45.6%, from $3.4 million to $4.9 million during the three months ended March 31, 2011 compared to the three months ended March 31, 2010. Of the increase in expenses, $1.0 million was attributable to compensation and benefits due to additional staffing related to the growth in revenue experienced period over period and $0.4 million was attributable to increased professional fees.
Depreciation and Amortization. For the quarter ended March 31, 2011, depreciation and amortization increased $1.1 million, or 20.3%, to $6.6 million from $5.5 million recorded for the quarter ended March 31, 2010. The increase principally related to the $36.3 million of equipment additions placed in service during 2010. As a percent of revenue, depreciation and amortization declined to 8.2% for the three months ended March 31, 2011 from 15.2% for the three months ended March 31, 2010. The percentage decline was due to the 124.2% growth in revenue of the first quarter of 2011 compared to the first quarter of 2010.
Interest Expense. For the three months ended March 31, 2011, interest expense totaled $29,000 compared to $355,000 for the same period in 2010. The decline was primarily attributable to the capitalization of $336,000 of interest expense during the first quarter of 2011.
Income Taxes. Each of the contributed entities except Acid, Inc. is a limited liability company that is treated as a pass-through entity for federal income tax and most state income tax purposes. The income tax provision for the three months ended March 31, 2011 was $33,000, compared to the income tax benefit of $33,000 for the three months ended March 31, 2010.
Year Ended December 31, 2010 Compared to Year Ended December 31, 2009
Revenue. Revenue for the year ended December 31, 2010 increased $108.2 million, or 109.7%, to $206.7 million from $98.6 million from the year ended December 31, 2009. The increase by segment was as follows:
| • | Completion and Production Services. Segment revenue increased $80.0 million, or 143.3%, to $135.9 million in 2010 from $55.8 million in 2009. The increase was attributable to the growth in our pressure pumping services, which accounted for $40.3 million of the increase, and our pressure control services, which accounted for $39.7 million. |
The growth in our pressure pumping services in 2010 was attributable to an increase in our hydraulic fracturing capacity with the addition of 25,000 horsepower in the last four months of 2010 combined
45
Table of Contents
Index to Financial Statements
with the success of our strategy to focus on larger fracturing jobs involving more stages and requiring greater pressure and pumping capacity. This change resulted in a 20% reduction in the number of fracturing jobs performed in 2010 compared to 2009, but a 206% increase in the resulting revenue per job.
The growth in revenue from our pressure control services was attributable to a 74% increase in the number of jobs performed and a 61% increase in the weighted average revenue per job.
| • | Horizontal and Directional Drilling Services. Segment revenue increased $28.1 million, or 65.8%, to $70.9 million for 2010 from $42.8 million for 2009. The increase resulted from an 86.7% increase in the number of operating days due to a 21% increase in the utilization rate and the effect of the addition of six MWD kits in 2010, partially offset by a 6% decrease in our average day rate in 2010 compared to 2009. |
Cost of Revenue. Cost of revenue includes the costs of labor, materials, maintenance, fuel and facility costs incurred in performing our completion and production services and our horizontal and directional drilling services. Cost of revenue increased by $63.0 million, or 76.2%, to $145.8 million for the year ended December 31, 2010 compared to the $82.7 million for the year ended December 31, 2009. The increase was a direct result of the $108.2 million, or 109.7%, increase in revenue discussed above.
| • | Completion and Production Services. Cost of revenue increased $42.7 million, or 85.5%, for 2010 compared to 2009. The increase in cost of revenue was due primarily to costs attributable to chemicals, labor and benefits, equipment repair and maintenance, fuel and tools and supplies. As a percentage of completion and production service revenues, cost of revenue for this segment decreased to 68.2% in 2010 from 89.4% in 2009. |
| • | Horizontal and Directional Drilling Services. Cost of revenue increased $20.3 million, or 61.9%, compared to the prior year. The increase in cost of revenue resulted from the increase in operating activity and was due primarily to labor and benefits, repairs and maintenance expense and equipment rental. As a percentage of horizontal and directional drilling service revenue, cost of revenue decreased to 74.9% in 2010 from 76.8% in 2009. |
Selling, General and Administrative Expenses. Selling, general and administrative expenses includes salaries and other related expenses for our selling, administrative, finance, information technology and human resource functions. These expenses increased $4.8 million to $15.1 million for the year ended December 31, 2010 from $10.3 million for the year ended December 31, 2009. As a percentage of revenue, these expenses decreased to 7.3% for the year ended December 31, 2010 from 10.5% for the prior year. This decline was attributable to the year-over-year revenue increase while maintaining control and restrictions over adding additional costs.
Depreciation and Amortization. Depreciation and amortization expense totaled $23.4 million and $22.4 million for the years ended December 31, 2010 and 2009, respectively. Depreciation and amortization expense increased $1.0 million as fixed asset additions were deferred until the end of the year, including $20.0 million of deposits on equipment and equipment in process of assembly. For the year ended December 31, 2010, depreciation and amortization represented 11.3% of revenue compared to 22.7% for 2009. This decrease as a percentage of revenue resulted from the growth in revenue discussed above.
Interest Expense. Interest expense for the year ended December 31, 2010 decreased $0.5 million to $1.3 million from $1.8 million for the year ended December 31, 2009. Of this decrease, $0.3 million was attributable to the capitalization of interest during 2010 in connection with the production and assembly of equipment and $0.3 million was attributable to the repayment in full during 2009 of a $4.5 million interest bearing business purchase obligation in 2009, offset in part by a $0.1 million increase in average outstanding debt of $1.5 million in 2010 compared to 2009.
46
Table of Contents
Index to Financial Statements
Income taxes. Each of the contributed entities except Acid, Inc. is a limited liability company that is treated as a pass-through entity for federal income tax and most state income tax purposes. The income tax expense recognized for the year ended December 31, 2010 was $0.3 million, as compared to the income tax expense of $0.03 million recognized for the year ended December 31, 2009, and was primarily attributable to state margin tax resulting from the improved 2010 results.
Year Ended December 31, 2009 Compared to Year Ended December 31, 2008
Revenue. Revenue for the year ended December 31, 2009 decreased by $110.0 million, or 52.7%, to $98.6 million from $208.6 million for the prior year due to lower pricing and utilization rates for our services. The decrease by segment was as follows:
| • | Completion and Production Services. Segment revenue decreased $47.7 million, or 46.1%, in 2009, as compared to 2008, primarily due to an overall decline in oil and natural gas exploration and development activities by our customers in our service areas as a result of lower oil and natural gas commodity prices and concerns over the availability of capital for such activities. We experienced lower pricing and equipment utilization for each of our completion and production service offerings on a year-over-year basis. |
| • | Horizontal and Directional Drilling Services. Segment revenue decreased $62.4 million, or 59.3%, in 2009, as compared to 2008, as a direct result of the decline in oilfield service activities throughout 2009. We experienced lower equipment utilization and pricing pressure in our drilling business due to a decrease in customer activity levels primarily related to lower oil and natural gas prices, uncertainty about the economy and tight credit markets. |
Cost of Revenue. Cost of revenue includes the costs of labor, materials, maintenance, fuel and facility costs incurred in performing our completion and production services and horizontal and directional drilling services. Cost of revenue decreased by $48.9 million, or 37.1%, to $82.7 million in 2009, from $131.6 million in 2008, due to the decline in revenue of both our operating segments. The decrease by segment was as follows:
| • | Completion and Production Services. Cost of revenue for this segment declined $18.2 million, or 26.7%, in 2009, as compared to 2008, due to the decrease in completion and production services in 2009 resulting from the overall decline in activity levels in the oil and gas industry in our service areas. As a percent of completion and production service revenue, these costs increased to 89.4% in 2009 from 65.8% in 2008 primarily due to lower equipment utilization and pricing pressure from competitors which could not be fully offset by the implementation of cost saving measures. |
| • | Horizontal and Directional Drilling Services. Cost of revenue for this segment declined $30.7 million, or 48.4%, in 2009, as compared to 2008, as a result of the decrease in drilling activity by our customers. As a percent of horizontal and directional drilling service revenue, these costs increased to 76.8% in 2009 from 60.4% in 2008 primarily due to lower utilization of our equipment and lower pricing on a year-over-year basis, partially offset by cost-saving measures. |
Selling, General and Administrative Expenses. Selling, general and administrative expenses include salaries and other related expenses for our selling, administrative, finance, information technology and human resource functions. As a percentage of revenue, these expenses increased to 10.5% in 2009 from 7.6% in 2008 but in total dollars these expenses declined $5.6 million to $10.3 million in 2009 from $15.9 million in 2008. This reduction was attributable to cost saving measures introduced in 2009, including staff reductions, salary reductions and the elimination or tighter control of expenses including temporary cessation of the Company’s 401(k) match.
Depreciation and Amortization. Depreciation and amortization expense increased to $22.4 million in 2009 from $20.7 million in 2008, representing an 8.2% increase. The increase in depreciation principally resulted from a full year of depreciation on the $35.5 million of asset additions in 2008 compared to $8.1 million of additions
47
Table of Contents
Index to Financial Statements
in fixed assets during 2009. As a percentage of revenue, depreciation and amortization expense increased to 22.7% in 2009 from 9.9% in 2008. This increase was principally driven by the reduction in revenue resulting from decreased customer activity related to the decrease in oil and gas prices and the economic uncertainty and decreased lending activity in the credit markets.
Interest Expense. Interest expense for 2009 was $1.8 million as compared to $2.1 million for 2008. This decline in interest expense was due to a $4.9 million decrease in our average balance outstanding and a 0.2% decrease in the stated rate.
Taxes. Each of the contributed entities except Acid, Inc. is a limited liability company that is treated as a pass-through entity for federal income tax and most state income tax purposes. The provision for income tax of $0.03 million for the year ended December 31, 2009 is principally attributable to state taxes as compared to a benefit of $2.5 million in 2008 primarily resulting from the pre-tax losses of Acid, Inc., including the tax effect arising from the impairment of $6.2 million of intangible assets related to customer relationships.
Liquidity and Capital Resources
We require capital to fund ongoing operations, maintenance expenditures on our existing equipment, organic growth initiatives and acquisitions. Historically, the sources of our funds have been capital contributions and loans from our equity sponsor, Wexford, cash flow from operations and borrowings under our revolving credit facilities. We will pay down outstanding indebtedness with the net proceeds of this offering. Following the completion of this offering and the application of the net proceeds thereof, our liquidity will be provided primarily by cash flow from operations, borrowings under our revolving credit facility, net proceeds from this offering and net proceeds from any future equity or debt offerings.
Operating Activities
Net cash provided by operating activities reflects service revenue generated through the growth of our business, partially offset by working capital changes associated with accounts receivable and the need to purchase and carry levels of inventory to meet the demands of our business. Net cash provided by operating activities was $16.3 million for the three months ended March 31, 2011 compared to $0.4 million for the three months ended March 31, 2010. The increase was attributable to the improvement in industry conditions and the increase in drilling activity resulting in improved gross margins and net income of $19.3 million for the first quarter of 2011 compared to the $1.3 million net loss for the first quarter of 2010. This increased activity negatively impacted cash provided by operating activities through a $13.7 million increase in accounts receivable which was partially offset by a $4.1 million increase in combined trade and related party payables and depreciation and amortization of $6.6 million.
Net cash provided by operating activities for the year ended December 31, 2010 totaled $29.9 million. The 2010 amount was primarily attributable to a $39.4 million improvement in net income, as compared to 2009, as a result of the increased demand and improved efficiency in our well service activities and cost control and reduction efforts, as well as a $10.8 million increase in accounts payable and accrued and other current liabilities, offset in part by a $22.8 million increase in accounts receivable resulting from the increased sales and an increase in inventory of $1.0 million.
Net cash provided by operating activities was $22.5 million for the year ended December 31, 2009. This cash was generated despite a net loss of $18.5 million as the net loss included depreciation and amortization of $22.4 million. The other major source of cash was a $19.0 million reduction in accounts receivable as amounts were collected but not replaced by new accounts receivable as a result of the economic downturn and the reduction in drilling activity of our customers.
For the year ended 2008, operating activities provided cash of $38.7 million. This resulted from net income of $21.1 million, depreciation and amortization of $20.7 million, less $7.2 million of gain on equipment
48
Table of Contents
Index to Financial Statements
involuntarily damaged or lost down hole, and impairment of goodwill and intangible assets charges of $20.2 million partially offset by net increases in working capital of $16.8 million related to a $10.7 million increase in accounts receivable as a result of the increased revenue during the year as well as an increase in the age of receivables due to the economic downturn.
Investing Activities
Net cash used in investing activities for the three months ended March 31, 2011 and 2010 was $21.1 million and $2.7 million, respectively. The cash was used in making additions to property and equipment of $21.8 million for the three months ended March 31, 2011 and $3.5 million for the three months ended March, 31, 2010. The respective additions were partially offset by proceeds from asset disposals and equipment damaged or lost down-hole of $0.8 million for both periods.
Net cash used in investing activities was $48.3 million for the year ended December 31, 2010. This consisted of $52.6 million for additions to property and equipment. Proceeds from the sale of equipment involuntarily damaged or lost down-hole provided cash of $3.6 million and asset disposals provided additional cash of $0.7 million.
Net cash used in investing activities for the year ended December 31, 2009 was $5.9 million. Of this amount, $9.5 million was used for property and equipment and additions and was partially offset by proceeds of $3.5 million from sales of equipment involuntarily damaged or lost down-hole and $.05 million of proceeds from asset disposals.
Net cash used in investing activities was $24.2 million during the year ended December 31, 2008. Additions to property and equipment totaled $32.8 million and were partially offset by $8.5 million of proceeds from sale of equipment involuntarily damaged or lost down-hole. These investment activities were principally funded through cash generated by operating activities.
Financing Activities
Net cash provided by financing activities during the first quarter of 2011 totaled $16.7 million compared to $4.6 million during the first quarter of 2010. For the period ended March 31, 2011, advances under long-term debt agreements provided cash of $14.2 million and advances from Great White Energy Services LLC provided cash of $4.4 million, partially offset by payments on the long-term debt and capital leases of $1.0 million and deferred financing and stock issuance costs of $0.8 million. For the period ended March 31, 2010, the principal source of net cash provided was net capital contributions of $4.8 million.
Financing activities provided cash of $24.8 million for the year ended December 31, 2010. Of this source of funds, $19.4 million was provided by equity contributions net of distributions and advances net of payments on the revolving line of credit with a related party described below and $8.7 million consisted of an advance on long-term debt, offset by $1.2 million used to provide cash collateral to be held by the lender and $1.9 million paid on capital lease obligations, as well as $0.2 million of other activities.
Net cash used in financing activities was $15.7 million in 2009. The major use of cash was net payments of $11.1 million in capital distributions to Diamondback Holdings, $4.5 million relating to final payments incurred in connection with the purchase of a business in 2006 and $0.6 million for capital lease obligations, partially offset by net advances of $0.5 million from an affiliate.
For 2008, net cash used in financing activities was $16.1 million, of which $11.1 million was attributable to net capital distributions to Diamondback Holdings, $4.5 million was attributable to the repayment of advances from an affiliate and $0.4 million was attributable to capital lease obligations.
49
Table of Contents
Index to Financial Statements
Credit Facilities
On February 15, 2011, we entered into a $50.0 million revolving line of credit facility with SunTrust Bank with a borrowing base of $37.9 million as of March 31, 2011. Our borrowing base, at any particular time, is an amount equal to the sum of (a) 85% of eligible receivables, (b) 75% of eligible unbilled accounts (but not to exceed $7.0 million) minus (c) certain reserves determined from time to time by the administrative agent minus (d) until July 31, 2011, the greater of $5.0 million or 10% of the commitment amount and $0 thereafter.
As of July 1, 2011, outstanding borrowings under our revolving credit facility were $26.0 million. The amounts borrowed under our revolving credit facility were used for capital expenditures and for general corporate purposes. The revolving credit facility is secured by substantially all of our working capital assets and a pledge of equity interests in our subsidiaries and is guaranteed by our subsidiaries. Advances under the revolving credit facility may be in the form of either base rate loans or Eurodollar loans. The interest rate for base rate loans is equal to (a) the applicable rate, which ranges from 2.25% to 2.75%, plus (b) the highest of: (i) the rate of interest in effect from time to time as announced by agent as its “prime rate,” (ii) the federal funds rate plus 0.5% and (iii) the Eurodollar rate for an interest period of one month. The interest rate for Eurodollar loans is equal to (x) the applicable rate, which ranges from 2.25% to 2.75%, plus (y) the one, two, three, or six month offered rate displayed on that page of the Bloomberg reporting service, or similar service, that displays the British Banker’s Association Interest Settlement Rate for deposits in U.S. dollars (as adjusted for the Eurodollar reserve percentage). At July 1, 2011, amounts borrowed under our new revolving credit facility bore interest at 2.7%.
The credit agreement contains customary negative covenants including, but not limited to, restrictions on our and our subsidiaries’ ability to: incur indebtedness; grant liens; pay dividends and make other restricted payments; make investments; make fundamental changes; dispose of assets; change the nature of their business; and enter into transactions with their affiliates. The negative covenants are subject to certain exceptions as specified in the credit agreement. The credit agreement also requires a minimum fixed charge coverage ratio that may not be less than 1.10 to 1.00. The fixed charge coverage ratio means, with respect to the borrowers and their subsidiaries on a consolidated basis, the ratio of (a) the greater of (i) (x) EBITDA for such period minus (y) the sum of (A) unfinanced capital expenditures and (B) tax payments paid in cash during such period (but no less than zero), or (ii) zero, to (b) fixed charges, which is the sum of (A) interest expenses paid or payable during such period, (B) scheduled payments of principal paid or payable with respect to funded debt during such period and (C) dividends paid in cash during such period. The fixed charge coverage ratio will not be tested during the period between February 15, 2011 and July 31, 2011. We were in compliance with all covenants at April 30, 2011. Our revolving credit facility will mature on February 15, 2016.
On November 24, 2010, Great White Pressure Pumping LLC entered into an equipment financing agreement with a financial institution providing a maximum financing amount available of $10.0 million. At March 31, 2011, $7.7 million was outstanding under this agreement. The term of the agreement is thirty-six months and the interest rate is fixed at 6.28%. Outstanding borrowings are secured by ten new fracturing units and ancillary equipment and cash collateral. As part of the financing agreement, the tangible net worth of the contributed entities must at all times exceed $95.0 million and the aggregate amount of dividends and/or distributions paid by the contributed entities during any calendar year may not exceed the amount of annual net income based on the results of the rolling last four quarters.
On June 29, 2007, our subsidiaries Great White Pressure Control LLC and Acid, Inc, together with certain of their affiliates, entered into a $30.0 million revolving line of credit agreement with a financial institution. On December 10, 2007, the line was increased to $35.0 million and a participating bank was added as a lender and on December 31, 2007, Great White Pressure Pumping, LLC was added as an additional borrower. Based on certain financial ratios, the line bore interest at LIBOR plus 2.25% to 3.25% or the greater of the lender’s prime rate and the federal funds rate plus 1.25% to 2.25%. The line was subject to a borrowing base formula based on trade accounts receivable, inventory and capital assets of the borrowers and also provided for a default rate of 2%. Borrowings were secured by substantially all of the assets of the borrowing group. The credit agreement
50
Table of Contents
Index to Financial Statements
contained certain financial covenants including a total debt leverage ratio, senior debt leverage ratio, minimum EBITDA, minimum tangible net worth and minimum fixed charge coverage ratio to be calculated on the basis of the aggregate borrowing group. Other covenants included limitations on operating leases, restrictions on acquisitions, limiting the use of funds outside of the borrowing group and restrictions on the transfer of capital between parties included in the borrowing group and those outside the borrowing group.
The line, as amended, matured in October 2009, and all outstanding principal, accrued and unpaid interest, and any other charges then remaining outstanding on the line of credit became due. Such amounts were not paid by the borrowers and, at December 31, 2009, the borrowers remained in default and were negotiating an extension with their lenders. Effective February 4, 2010, the existing lenders assigned 100% of their rights and obligations, including all liens and security interests in the collateral, under the credit agreement to Diamondback Holdings, one of the selling stockholders, in exchange for full payment of all principal and other charges outstanding under the line of credit. Subsequently, Diamondback Holdings and the borrowers amended the credit agreement to extend the maturity date of the line of credit to April 30, 2012, waive all defaults and, effective February 4, 2010, established a fixed interest rate of 7.25% for all outstanding borrowings. Effective September 30, 2010, Diamondback Holdings and the borrowers further amended the credit agreement to limit the liability of Great White Pressure Control LLC, Acid, Inc. and Great White Pressure Pumping LLC under the credit agreement to $12.0 million on existing borrowings and permit Great White Pressure Control LLC, Acid, Inc. and Great White Pressure Pumping LLC to borrow up to an additional $20.0 million. Total outstanding borrowings under this line at December 31, 2009 and 2008 were $30.8 million and $25.8 million, respectively. All of our obligations under this credit agreement were extinguished by Diamondback Holdings as of December 31, 2010 in connection with the contribution. Through December 31, 2009, borrowings attributed to us under this credit agreement were reflected in our financial statements as “advances from Great White Energy Services LLC.”
Capital Requirements and Sources of Liquidity
As part of our business strategy, we regularly evaluate market expansion and acquisition opportunities, including both equipment and business. Our capital expenditures in 2009 were approximately $8.1 million, which were used for the expansion and maintenance of our equipment. Our 2010 capital expenditures were approximately $55.5 million, of which $42.1 million related to our completion and production services segment and $13.4 million related to our horizontal and directional drilling services segment. These 2010 capital expenditures were funded by cash flow from operations, borrowings from a financial institution under an equipment financing agreement and capital contributions from our equity sponsor.
We currently anticipate our 2011 capital budget will be approximately $99.7 million, which does not include any amounts related to acquisitions. We intend to allocate the 2011 expenditures among our segments as follows: approximately $88.1 million to our completion and production services segment of which $62.4 million is allocated for new fracturing units and related equipment and $25.7 million is allocated for coiled tubing units and related equipment; and approximately $11.6 million to our horizontal and directional drilling services segment for maintenance of our MWD kits and drilling motors. However, the amount and timing of these capital expenditures is largely discretionary and within our control and, accordingly, the amounts may vary significantly.
As of March 31, 2011, we had net working capital of $32.4 million as compared to working capital at December 31, 2010 and 2009 of $22.1 million and $0.5 million, respectively. The increase in working capital for the three months ended March 31, 2011 resulted from improved operating results.
Our ability to fund our operations and planned capital expenditures will primarily depend on our future operating performance. We will pay down outstanding indebtedness with the net proceeds of this offering. Based on our current performance and view of market demand, we believe that our cash on hand, internally generated cash flow from operations and borrowings under a revolving credit facility will be sufficient to finance our cash requirements and budgeted capital expenditures for at least the next twelve months after the completion of this
51
Table of Contents
Index to Financial Statements
offering. However, future cash flows are subject to a number of variables. There can be no assurance that operations and other capital resources will provide cash in sufficient amounts to maintain planned or future levels of capital expenditures. If we seek additional capital for that or other reasons, including acquisitions, we may do so through traditional borrowing arrangements, joint venture partnerships, asset sales, offerings of debt and equity securities or other means. We cannot assure you that needed capital will be available on acceptable terms or at all. If we are unable to obtain funds when needed or on acceptable terms, we may not be able to complete acquisitions that may be favorable to us or finance the capital expenditures necessary to implement our business strategy.
Contractual and Commercial Commitments
We have significant contractual obligations in the future that will require capital resources. At December 31, 2010 our primary contractual obligations consisted of the following:
| Total | 2011 | 2012-2013 | 2014-2015 | Thereafter | ||||||||||||||||
| (in thousands) | ||||||||||||||||||||
| Capital leases including interest expense(1) |
$ | 12,271 | $ | 1,564 | $ | 1,959 | $ | 1,407 | $ | 7,341 | ||||||||||
| Operating leases(1) |
4,553 | 684 | 833 | 489 | 2,547 | |||||||||||||||
| Employee agreements(2) |
2,000 | 2,000 | — | — | — | |||||||||||||||
| Term loan(3) |
9,125 | 2,989 | 6,083 | 53 | — | |||||||||||||||
| Vehicle loans(3) |
432 | 149 | 283 | — | — | |||||||||||||||
| Total |
$ | 28,381 | $ | 7,386 | $ | 9,158 | $ | 1,949 | $ | 9,888 | ||||||||||
| (1) | We have entered into operating lease arrangements for certain of our specialized equipment and operating facilities. The lease terms vary from one year to 20 years and include renewal and purchase options. See additional information regarding our operating and capital leases in Notes J and K to our historical consolidated financial statements elsewhere in this prospectus. |
| (2) | We entered into employment agreements with certain of our employees in connection with the start-up of a subsidiary. Under these agreements, a portion of each employee’s signing bonus was payable at the third anniversary of the agreement if the executive was still employed by us. Under terms of an amendment, these payments were deferred and each employee indemnified the Company, up to his respective accrued amount, in relation to any adverse outcome of litigation accusing the Company of misappropriation of trade secrets and unfair competition. See Note N to our historical consolidated financial statements of GW Holdings I LLC elsewhere in this prospectus. We amended and restated the employment agreement of one of these employees effective June 1, 2011. Under the terms of this amended and restated employment agreement we agreed to pay the deferred portion of such employee’s signing bonus within fifteen days of June 1, 2011 and revised such employee’s indemnification obligations to us. See “Related Party Transactions—Indemnification” on page 93 of this prospectus. |
| (3) | We have entered into financing agreements for certain equipment and vehicles. The terms are for 36 months, and require us to comply with certain reporting requirements and covenants. See additional information regarding the term loan and vehicle loans in Note I to our historical consolidated financial statements elsewhere in this prospectus. |
Off-Balance Sheet Arrangements
We have no off-balance sheet arrangements, other than normal operating leases included in the table above, that have or are likely to have a material effect on our financial condition, changes in financial condition, revenue expenses, results of operations, liquidity, capital expenditures or capital resources.
Quantitative and Qualitative Disclosure about Market Risk
The demand, pricing and terms for oil and gas services provided by us are largely dependent upon the level of activity for the U.S. oil and natural gas industry. Industry conditions are influenced by numerous factors over which
52
Table of Contents
Index to Financial Statements
we have no control, including, but not limited to: the supply of and demand for oil and natural gas; the level of prices, and expectations about future prices of oil and natural gas; the cost of exploring for, developing, producing and delivering oil and natural gas; the expected rates of declining current production; the discovery rates of new oil and natural gas reserves; available pipeline and other transportation capacity; weather conditions; domestic and worldwide economic conditions; political instability in oil-producing countries; technical advances affecting energy consumption; the price and availability of alternative fuels; the ability of oil and natural gas producers to raise equity capital and debt financing; and merger and divestiture activity among oil and natural gas producers.
The level of activity in the U.S. oil and natural gas exploration and production industry is volatile. Expected trends in oil and natural gas production activities may not continue and demand for our services may not reflect the level of activity in the industry. Any prolonged substantial reduction in oil and natural gas prices would likely affect oil and natural gas production levels and therefore affect demand for our services. A material decline in oil and natural gas prices or U.S. activity levels could have a material adverse effect on our business, financial condition, results of operations and cash flows. Recently, demand for our services has been strong and we are continuing our past practice of committing our equipment on a short-term or day-to-day basis. At March 31, 2011, the Company was not subject to market risk exposure related to changes in interest rates as all the Company’s indebtedness bears interest at fixed interest rates.
On February 15, 2011, we entered into a new revolving credit facility with SunTrust Bank. Our new revolving credit facility is structured under floating rate terms, as advances under this facility may be in the form of either base rate loans or Eurodollar loans. As such, our interest expense is sensitive to fluctuations in the prime rates in the U.S. or, if the Eurodollar rates are elected, the Eurodollar rates. As of July 1, 2011, amounts borrowed under our revolving credit agreement bore interest at 2.7%. Based on the current debt structure, a 1% increase in interest rates would increase interest expense by approximately $140,000 per year, based on $14.0 million outstanding under our revolving credit facility as of May 31, 2011. As of May 31, 2011, we did not have any interest rate swaps to hedge our interest rate risks.
Recent Accounting Pronouncements
In December 2009, the FASB issued Accounting Standards Update, or ASU 2009-17, “Consolidations (ASC Topic 810): Improvements to Financial Reporting by Enterprises Involved with Variable Interest Entities,” or ASU 2009-17, which is effective for annual periods beginning after November 15, 2009. ASU 2009-17 requires our management to consider a variable entity’s purpose and design and our ability to direct the activities of the variable interest entity that most significantly impact such entity’s economic performance when determining whether such entity should be consolidated. We adopted the provisions of ASU 2009-17 as required on January 1, 2010. The provisions had no impact on our combined financial position or results of operations upon adoption.
In January 2010, the FASB issued ASU No. 2010-06, “Improving Disclosures about Fair Value Measurements” or ASU No. 2010-06. ASU No. 2010-06 requires the disclosure of significant transfers in and out of Level 1 and Level 2 fair value measurements. It also requires that Level 3 fair value measurements present information about purchases, sales, issuances and settlements. Fair value disclosures should also disclose valuation techniques and inputs used to measure both recurring and nonrecurring fair value measurements. This update becomes effective for the Company on January 1, 2010 except for the disclosures about purchases, sales, issuances, and settlements in the roll forward in activity in Level 3 fair value measurements, which become effective January 1, 2011. This update did not change the techniques we use to measure fair values and is not expected to have a material impact on our combined financial statements.
53
Table of Contents
Index to Financial Statements
Overview
We are a diversified oilfield service company providing completion and production and horizontal and directional drilling services primarily in the U.S. onshore unconventional tight sands and shale oil and natural gas markets, commonly referred to as “unconventional resources.” These resources are called unconventional due to the different manner by which they are extracted as compared to the extraction of conventional resources. To extract unconventional resources, the wellbore is generally drilled to specific objectives within narrow parameters, often across long, horizontal intervals within narrow formations offering greater contact area with the producing formation. Typically, the well is then hydraulically fractured at multiple stages to optimize production. We use our equipment to drill and complete those horizontal wells.
We currently conduct our operations through two operating segments — completion and production services and horizontal and directional drilling services. We believe that our services are critical in increasing the ultimate recovery and present value of production streams for unconventional resources. Our complementary suite of drilling, completion and production related services provides us with the opportunity to cross sell our services and expand our customer base and geographic positioning.
Our 13 service centers are strategically located in Michigan, Oklahoma, Texas, West Virginia and Wyoming primarily to serve the following resource plays:
| • | the Bakken Shale in Montana and North Dakota; |
| • | the Cana Woodford Shale and the Cleveland Sand in Oklahoma; |
| • | the Eagle Ford Shale in South Texas; |
| • | the Fayetteville Shale in Arkansas; |
| • | the Granite Wash in Oklahoma and Texas; |
| • | the Cotton Valley and the Haynesville Shale in Northwest Louisiana and East Texas; |
| • | the Marcellus Shale in West Virginia and Pennsylvania; |
| • | the Marmaton and Mississippi Shales in Oklahoma and Texas; |
| • | the Niobrara formation in Wyoming; |
| • | the Permian Basin in West Texas; |
| • | the Trenton formation in Michigan; |
| • | the Utica Shale in Ohio and Pennsylvania; and |
| • | the Woodford Shale in Southeastern Oklahoma. |
54
Table of Contents
Index to Financial Statements
The illustration below represents our geographic positioning and service offerings in each resource play in which we operate:
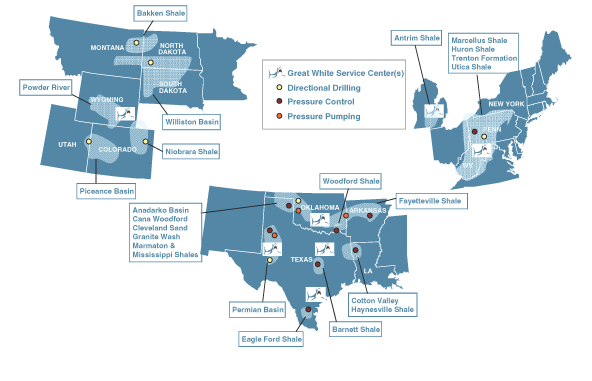
The following table sets forth certain additional information regarding each of our 13 service centers:
| Geographic Location |
Number | Services Provided |
Resource Plays Serviced | |||||
| State |
City |
|||||||
| Michigan | Traverse City | 1 | Horizontal and Directional Drilling |
Marcellus Trenton Huron Antrim | ||||
| Oklahoma | Oklahoma City | 2 | Pressure Control Horizontal and Directional Drilling |
All Barnett Cana Woodford Cotton Valley Haynesville Shale Woodford Mississippi Granite Wash | ||||
| El Reno | 1 | Pressure Pumping | Cana Woodford | |||||
| Elk City | 1 | Pressure Control | Permian Cana Woodford Barnett | |||||
| Lindsay | 1 | Pressure Control | Permian | |||||
| Arnett | 1 | Pressure Control | Cleveland Granite Wash | |||||
| Woodward | 1 | Pressure Pumping | Marmaton Mississippi | |||||
55
Table of Contents
Index to Financial Statements
| Geographic Location |
Number | Services Provided |
Resource Plays Serviced | |||||
| State |
City |
|||||||
| Texas(1) | Longview | 1 | Pressure Control | Eagle Ford Fayetteville Woodford Cotton Valley Haynesville | ||||
| Midland | 1 | Pressure Pumping | Permian | |||||
| Odessa | 1 | Horizontal and Directional Drilling | Permian | |||||
| West Virginia | Buckhannon | 1 | Horizontal and Directional Drilling | Marcellus Utica | ||||
| Wyoming | Mills | 1 | Horizontal and Directional Drilling | Bakken Niobrara Williston Powder River Piceance | ||||
| (1) | We expect to complete our fourteenth service center, located in Victoria, Texas, in the third quarter of 2011 which will service the Eagle Ford Shale. |
Our operational division heads have an average of over 30 years of oilfield service experience and bring valuable basin-level expertise and long-term customer relationships to our business. We provide our completion and production and horizontal and directional drilling services to a diversified range of both public and private independent producers as well as integrated major companies. Our top five customers for the year ended December 31, 2010, representing 36% of our revenue, were SandRidge Energy, Inc., Windsor Permian LLC, Chesapeake Energy Corp., Continental Resources, Inc. and East Resources, Inc. Our top five customers for the three months ended March 31, 2011, representing 46% of our revenue, were SandRidge Energy, Inc., Unit Petroleum Company, Windsor Permian LLC, EOG Resources, Inc. and Continental Resources, Inc.
We commenced our operations in December 2005 with the acquisition of the assets of Quantum Drilling Motors, L.L.C., which we refer to as Quantum. We have since grown through acquisitions and organically by focusing on the growing needs of producers in unconventional resource plays. Further information regarding our growth is provided below under “—Our Services.” We had $80.4 million in revenue, $25.9 million in Adjusted EBITDA and net income of $19.3 million for the three months ended March 31, 2011, $206.7 million in revenue, $45.9 million in Adjusted EBITDA and net income of $20.9 million for the year ended December 31, 2010, $98.6 million in revenue, $5.7 million in Adjusted EBITDA and a net loss of $18.5 million for the year ended December 31, 2009, and $208.6 million in revenue, $61.6 million in Adjusted EBITDA and net income of $21.1 million for the year ended December 31, 2008. For a definition of Adjusted EBITDA, a reconciliation of Adjusted EBITDA to net income (loss) and a discussion of Adjusted EBITDA as a performance measure, please see “Selected Historical Financial Data” on page 36 of this prospectus.
Our Services
We manage our business through two segments: completion and production services and horizontal and directional drilling services.
Completion and Production Services
Our completion and production business provides pressure control services and pressure pumping services.
56
Table of Contents
Index to Financial Statements
Our pressure control services equipment is tailored to the unconventional resources market with the ability to operate under high pressure without having to delay or cease production during completion operations. Ceasing or suppressing production in the completion phase of an unconventional well could result in formation damage, impacting the overall recovery of reserves. Our pressure control services consist of coiled tubing, snubbing, nitrogen, wireline, fluid pumping and well control services. Currently, we provide pressure control services in the Fayetteville Shale in Arkansas, the Granite Wash and Mississippi Shale in Oklahoma and Texas, the Cana Woodford and Woodford Shales and the Cleveland Sand in Oklahoma, the Cotton Valley and the Haynesville Shale in Northwest Louisiana and East Texas, the Barnett Shale in East Texas, the Permian Basin in West Texas and the Eagle Ford Shale in South Texas. Our completion and production services segment generated approximately $60.5 million, or 75.2% of our total revenue, for the three months ended March 31, 2011, $135.9 million, or 65.7% of our total revenue, for the year ended December 31, 2010, $55.8 million, or 56.6% of our total revenue, for the year ended December 31, 2009, and $103.5 million, or 49.6% of our total revenue, for the year ended December 31, 2008. Our pressure control services include the following:
| • | Coiled Tubing Services. Coiled tubing services involve injecting coiled tubing into wells to perform various well-servicing operations. Coiled tubing is a flexible steel pipe with a diameter of typically less than three inches and manufactured in continuous lengths of thousands of feet. It is wound or coiled on a truck-mounted reel for onshore applications. Due to its small diameter, coiled tubing can be inserted into existing production tubing and used to perform a variety of services to enhance the flow of oil or natural gas without using a larger, more costly workover rig. The principal advantages of using coiled tubing in a workover include the ability to (i) continue production from the well without interruption, thus reducing the risk of formation damage to the well, (ii) move continuous coiled tubing in and out of a well significantly faster than conventional pipe, which must be jointed and unjointed, (iii) direct fluids into a wellbore with more precision, allowing for improved stimulation fluid placement, (iv) provide a source of energy to power a down-hole motor or manipulate down-hole tools and (v) enhance access to remote fields due to the smaller size and mobility of a coiled tubing unit. As of March 31, 2011, we had eight coiled tubing units, seven of which we consider premium units capable of running over 19,500 feet of 2.00 inch coiled tubing. This capability is well suited for the unconventional resource markets we serve. The average age of these units was less than three years at March 31, 2011. Based on currently anticipated delivery schedules, we expect to have 12 coiled tubing units by the end of 2011, 11 of which will be premium units. |
| • | Snubbing Services. Our snubbing units can provide a means of running tubing under pressure. Snubbing is utilized in several operations including well control, conventional workovers, completion services and fishing. As of March 31, 2011, we had 19 snubbing units, 16 of which were trailer mounted units for easy movement between tightly spaced unconventional wells. The average age of these units was less than three years at March 31, 2011. These units are designed to limit well downtime and potential reservoir damage in unconventional wells. Based on currently anticipated delivery schedules, we expect to have 24 snubbing units by the end of 2011, 18 of which will be trailer mounted units. |
| • | Nitrogen Services. Nitrogen services involve the use of nitrogen, an inert gas, in various pressure pumping operations. When provided as a stand-alone service, nitrogen is used in displacing fluids in various oilfield applications. As of March 31, 2011, we had 14 nitrogen pumping units, which were capable of pumping at a rate of 3,000 to 17,000 standard cubic feet per minute with pressures up to 15,000 pounds per square inch. Pumping at these rates and pressures is typically required for the unconventional oil and natural gas resource plays we serve. The average age of these units was less than four years at March 31, 2011. Based on currently anticipated delivery schedules, we expect to have a total of 16 nitrogen pumping units by the end of 2011. |
| • | Wireline Services. Wireline services typically utilize a single truck equipped with a spool of wireline that is used to lower and raise a variety of specialized tools in and out of a cased wellbore. These tools can be used to measure pressures and temperatures. Other applications for wireline tools include placing equipment in or retrieving equipment from the wellbore and perforating the tubing. Wireline |
57
Table of Contents
Index to Financial Statements
| trucks, like well servicing rigs, are utilized throughout the life of a well. Our wireline trucks have self contained masts to provide quick rig ups and create a smaller footprint on locations. As of March 31, 2011, we had six wireline units with an average age of less than four years that were well suited for quick rig-up and well clean-out applications. |
| • | Fluid Pumping Services. Fluid pumping services include maintaining well pressure, assisting coiled tubing units and jetting of fluids and solids from the wellbore for clean-out operations. As of March 31, 2011, we had nine fluid pumping units with an average age of less than three years. Based on currently anticipated delivery schedules, we expect to have 15 fluid pumping units by the end of 2011. |
| • | Well Control Services. Our well control group is comprised of a team of five trained technicians with specialized equipment. Service offerings in the well control group include well control, blowout services, well recovery, contingency planning, rig inspections, hot tapping, and gate valve drilling, freezing and engineering services. Our hot tap units have the ability to locate pressure trapped in tubing and contain it and are capable of performing land based and off-shore operations. Freeze services are a unique operation where a fluid is pumped into the wellbore, tree, valve or other component and frozen to isolate anything above or below the freeze area. Once it has been determined that the wellbore is sealed by the ice plug, the section above the freeze area is removed. A replacement section for the piece that was removed can then be inserted. As of March 31, 2011, we had one self-contained gate valve drilling unit, various hot tapping units and firefighting equipment. |
Our pressure pumping services consist of hydraulic fracturing and acidizing services. These services are used in the completion of wells and to stimulate hydrocarbon flow. Currently, we provide pressure pumping services in the Cana Woodford and Mississippi Shales in Oklahoma, the Marmaton Shale in Oklahoma and Texas and the Permian Basin in West Texas.
Our pressure pumping services includes hydraulic fracturing services and acidizing services.
Hydraulic Fracturing. We provide high-pressure hydraulic fracturing services. Fracturing services are performed to enhance the production of oil and natural gas from formations having low permeability such that the natural flow is restricted. We have significant expertise in multi-stage fracturing of horizontal oil- and natural gas-producing wells in shale and other unconventional geological formations. We perform our hydraulic fracturing services in the Cana Woodford and Mississippi Shales in Oklahoma, the Marmaton Shale in Oklahoma and Texas and the Permian Basin in West Texas. For the three months ended March 31, 2011 and the years ended December 31, 2010, 2009, and 2008, our hydraulic fracturing services represented approximately 53.4%, 41.7%, 26.8% and 37.9% of our completion and production segment revenue.
The fracturing process consists of pumping a fracturing fluid into a well at sufficient pressure to fracture the formation. Materials known as proppants, in our case primarily sand or ceramic beads, are suspended in the fracturing fluid and are pumped into the fracture to prop it open. The fracturing fluid is designed to “break,” or loosen viscosity, and be forced out of the formation by its pressure, leaving the proppants suspended in the fractures. At the completion of the fracturing process, production rates are usually enhanced substantially, thus increasing the rate of return for the operator.
We own and operate fleets of mobile hydraulic fracturing units and other auxiliary heavy equipment to perform fracturing services. Our hydraulic fracturing units consist primarily of a high pressure hydraulic pump, a diesel engine, a transmission and various hoses, valves, tanks and other supporting equipment that are typically mounted to a flat-bed trailer. As of March 31, 2011, we owned 42 high-pressure fracturing units capable of delivering a total of 98,800 horsepower. We expect to have a total of 47 quintuplex pumps capable of delivering a total of 107,800 horsepower by the end of 2011. The group of fracturing units, other equipment and vehicles necessary to perform a typical fracturing job is referred to as a “fleet” and the personnel assigned to each fleet are commonly referred to as a “crew.” In areas in which we operate on a 24-hour-per-day basis, we typically staff two crews per fleet. All of our fracturing units and high pressure pumps are manufactured to our specifications to enhance the performance and durability of our equipment and meet our customers’ needs.
58
Table of Contents
Index to Financial Statements
Each hydraulic fracturing fleet includes a mobile, on-site control center that monitors pressures, rates and volumes, as applicable, of each critical piece of equipment used on the job site. Management and supervision of each job is controlled from the data center via radio to the personnel that are operating the equipment. Each data center is also equipped with high band-width satellite hardware that provides continuous upload and download of job telemetry data. The data is delivered on a real-time basis to designated personnel of the Company and the operator for display in both digital and graphical form. In addition to our field supervision, the assigned coordinator at our main office can simultaneously monitor the same digital and graphical data that is being viewed by the on-site job personnel.
An important element of fracturing services is determining the proper fracturing fluid, proppants and injection program to maximize results. In virtually all of our hydraulic fracturing jobs, our customers specify the composition of the fracturing fluid that we are to use. The fracturing fluid may contain hazardous substances, such as hydrochloric acid and certain petrochemicals. In addition, our customers are responsible for the disposal of the fracturing fluid that flows back out of the well as waste water. The customers remove the water from the well using a controlled flow-back process, and we are not involved in that process or in the disposal of the fluid. Presently, we do not drill, set casing or cement the wells for which we provide fracturing services.
We operate with most of our customers under MSAs. We endeavor to allocate potential liabilities and risks between the parties in the MSAs. Generally, under our MSAs, including those relating to our hydraulic fracturing services, we assume responsibility for, including control and removal of, pollution or contamination which originates above surface and originates from our equipment or services. Our customer assumes responsibility for, including control and removal of, all other pollution or contamination which may occur during operations, including that which may result from seepage or any other uncontrolled flow of drilling fluids. We may have liability in such cases if we are negligent or commit willful acts. Generally, our customers also agree to indemnify us against claims arising from their employees’ personal injury or death to the extent that, in the case of our hydraulic fracturing operations, their employees are injured or their properties are damaged by such operations, unless resulting from our gross negligence or willful misconduct. Similarly, we generally agree to indemnify our customers for liabilities arising from personal injury to or death of any of our employees, unless resulting from gross negligence or willful misconduct of the customer. In addition, our customers generally agree to indemnify us for loss or destruction of customer-owned property or equipment and in turn, we agree to indemnify our customers for loss or destruction of property or equipment we own. Losses due to catastrophic events, such as blowouts, are generally the responsibility of the customer. However, despite this general allocation of risk, we might not succeed in enforcing such contractual allocation, might incur an unforeseen liability falling outside the scope of such allocation or may be required to enter into an MSA with terms that vary from the above allocations of risk. As a result, we may incur substantial losses which could materially and adversely affect our financial condition and results of operation.
Acidizing Services. Acidizing services involve the injection of highly reactive, low pH (such as hydrochloric acid) solutions into the area where the hydrocarbons enter the wellbore. Acidizing is the most common means of reducing near-wellbore damage, as it dissolves and dilutes contaminants that have accumulated and are restricting the flow of hydrocarbons from a reservoir toward the wellbore, thus increasing well productivity. Acid is also used in conjunction with hydraulic fracturing as a spearhead fluid. As of March 31, 2011, we owned six acid transports.
Horizontal and Directional Drilling Services
Our horizontal and directional drilling equipment is designed for efficient drilling and production of oil and natural gas from unconventional resource plays. Our horizontal and directional drilling services allow our customers to drill wellbores to specific objectives within narrow location parameters. The evolution of unconventional resource reserve recovery has increased the need for the precise placement of a wellbore. Wellbores are often drilled sideways across long-lateral intervals within narrow formations as thin as ten feet. Our personnel are involved in all aspects of a well from the initial planning to the management and execution of the horizontal or directional drilling operation.
59
Table of Contents
Index to Financial Statements
Our horizontal and directional drilling equipment includes motors used to propel drill bits and kits for measurement while drilling, or MWD, and electromagnetic, or EM, technology. As of March 31, 2011, we owned 39 MWD kits and six EM kits used in vertical, horizontal and directional drilling applications, 392 motors, four dedicated wireline units and an inventory of parts and other equipment. MWD kits are down-hole tools that provide real-time measurements of the location and orientation of the bottom-hole assembly, which is necessary to adjust the drilling process and guide the wellbore to a specific target. As of June 20, 2011, we employed 76 directional drillers with significant industry experience to implement our services. We perform our horizontal and directional drilling services in the Piceance Basin in Colorado, the Cotton Valley and the Haynseville Shale in Northwest Louisiana and East Texas, the Bakken Shale in North Dakota and Montana, the Williston Basin in North Dakota and South Dakota, the Granite Wash in Oklahoma and Texas, the Woodford Shale in Oklahoma, the Huron and Marcellus Shales in West Virginia and Pennsylvania, the Permian Basin in West Texas, the Powder River Basin and the Niobrara formation in Wyoming, the Utica Shale in Ohio and Pennsylvania and the Trenton formation in Michigan.
We commenced our horizontal and directional drilling operations with the acquisition of the assets of Quantum in December 2005. We subsequently acquired the membership units of Directional Drilling Contractors L.L.C. in August 2007, and have since grown this business segment organically. Our horizontal and directional drilling services segment generated approximately $19.9 million, or 24.8% of our total revenue, for the three months ended March 31, 2011, $70.9 million, or 34.3% of our total revenue, for the year ended December 31, 2010, $42.7 million, or 43.4% of our total revenue, for the year ended December 31, 2009 and $105.1 million, or 50.4% of our total revenue, for the year ended December 31, 2008.
Our Industry
We believe that the following trends in our industry should benefit our operations:
| • | Increased fracturing and other well stimulation services required for horizontal wells. Multiple stages of hydraulic fracturing are typically required to enhance hydrocarbon production in horizontal wells. Water, sand and other additives are used in the fracturing process. The fractures created in the formation are held open through the use of sand and other proppants such as resin-coated and ceramic particles. The scope of these services for a horizontal well is greater than for a conventional well. It has been reported in the industry that the average horsepower, length of the lateral and number of fracture stages has increased since 2008. The total size of the U.S. hydraulic fracturing market, based on revenue, was estimated to be approximately $15.9 billion in 2008, based on data from a 2010 report by Spears & Associates. Fracturing revenue increased by $2.0 billion in 2010 as compared to 2009, primarily due to increased drilling activity, higher oil prices and a greater proportion of horizontal wells relative to vertical wells. |
| • | Increased use of horizontal drilling to develop unconventional resource plays. According to the Baker Hughes rig count, the horizontal rig count on March 31, 2011 was 995, or 58% of the total U.S. onshore rig count. This compares to 650 horizontal rigs, equating to 34% of the total U.S. onshore rig count, in 2008, the previous peak of the horizontal rig count. For the twelve months ended March 31, 2011, horizontal rigs comprised, on average 56% of the total U.S. onshore rig count. As a result of improvements in drilling and production-enhancement technologies, oil and natural gas companies are increasingly developing unconventional resources such as tight sands and shales. Successful and economic production of these unconventional resource plays frequently requires increased horizontal drilling, fracturing and stimulation services. Drilling related activity for unconventional resources is typically done on tighter acre-spacing and thus requires that more wells be drilled relative to conventional resources. We believe that all of these characteristics will drive the demand for our services. |
60
Table of Contents
Index to Financial Statements
The following graph shows the horizontal rig count and the horizontal rig count as a percentage of the total U.S. onshore rig count as published by Baker Hughes as of March 31, 2011.
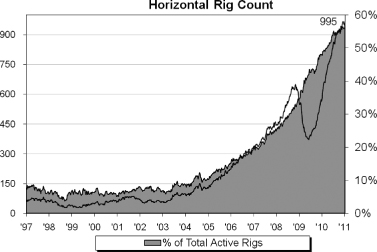
| • | New and emerging unconventional resource plays. In addition to the growth and development of existing unconventional resource plays such as the Barnett, Fayetteville, Cotton Valley, Haynesville, Marcellus and Woodford Shales, exploration and production companies continue to find new unconventional resources. These include oil and liquids-based shales in the Bakken, Cana Woodford, Eagle Ford, Granite Wash, Niobrara, Permian and Woodford resource plays. In certain cases, exploration and production companies have acquired vast acreage positions in these plays that require them to drill and produce hydrocarbons to hold the leased acreage. We believe these emerging resource plays will continue to drive demand for our services as they typically require the use of extended reach horizontal drilling, multiple stage fracture stimulation and high pressure completion capabilities. |
The following graphs show the total U.S. onshore oil rig count and the U.S. onshore horizontal rig count as a percentage of oil versus natural gas.
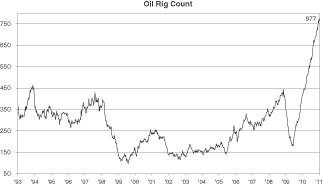
|
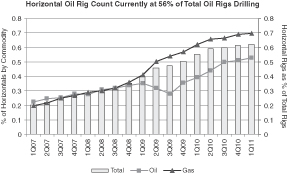
|
61
Table of Contents
Index to Financial Statements
| • | Increased onshore focus from major integrated oil and natural gas companies. Major integrated exploration and production companies have increasingly been allocating capital and other resources to the U.S. onshore unconventional oil and natural gas tight sand and shale resource plays. Over the past two years, exploration and production companies such as ExxonMobil Corporation, BP p.l.c. and Chevron Corporation have made strategic acquisitions and/or formed joint ventures in unconventional resource plays. This onshore focus may intensify as regulatory scrutiny of offshore operations increases due to the blow out of BP p.l.c.’s Macondo well and related oil spill in the Gulf of Mexico. The following table represents selected joint ventures and acquisitions done in unconventional oil and natural gas shale plays since the beginning of 2008. |
| Date |
Buyer |
Seller or Joint Venture Partners |
Transaction Value | Play | ||||||||
| (millions) | ||||||||||||
| 3/11 | KNOC | Anadarko Petroleum | $ | 1,550 | Eagle Ford Shale | |||||||
| 2/11 | Linn Energy | Concho Resources | $ | 196 | Bakken Shale | |||||||
| 2/11 | Private Company | Range Resources | $ | 900 | Barnett Shale | |||||||
| 2/11 | BHP Billiton | Chesapeake Energy | $ | 4,750 | Fayetteville Shale | |||||||
| 1/11 | CNOOC | Chesapeake Energy | $ | 1,267 | Niobrara Shale | |||||||
| 11/10 | Chevron | Atlas Energy | $ | 4,300 | Marcellus Shale | |||||||
| 10/10 | CNOOC | Chesapeake Energy | $ | 2,160 | Eagle Ford Shale | |||||||
| 10/10 | Talisman/Statoil | Enduring Resources LLC | $ | 1,325 | Eagle Ford Shale | |||||||
| 10/10 | Statoil | Talisman Energy | $ | 180 | Eagle Ford Shale | |||||||
| 10/10 | Plains Exploration & Production | Dan A. Hughes Company | $ | 578 | Eagle Ford Shale | |||||||
| 8/10 | Reliance Industries | Carrizo Oil & Gas | $ | 392 | Marcellus Shale | |||||||
| 6/10 | Reliance Industries | Pioneer Natural Resources | $ | 1,150 | Eagle Ford Shale | |||||||
| 5/10 | BG Group | EXCO Resources | $ | 950 | Appalachian Basin | |||||||
| 4/10 | Reliance Industries | Atlas Energy | $ | 1,700 | Marcellus Shale | |||||||
| 3/10 | Consol Energy | CNX Gas | $ | 989 | Marcellus Shale/Appalachia | |||||||
| 3/10 | Consol Energy | Dominion Resources | $ | 3,475 | Marcellus Shale/Appalachia | |||||||
| 2/10 | Mitsui E&P USA | Anadarko Petroleum | $ | 1,400 | Marcellus Shale | |||||||
| 1/10 | Total | Chesapeake Energy | $ | 2,250 | Barnett Shale | |||||||
| 12/09 | Exxon Mobil | XTO | $ | 41,000 | Corporate Acquisition | |||||||
| 6/09 | BG Group | EXCO Resources | $ | 1,055 | Haynesville Shale | |||||||
| 5/09 | Eni | Quicksilver Resources | $ | 280 | Barnett Shale | |||||||
| 11/08 | StatoilHydro | Chesapeake Energy | $ | 3,375 | Marcellus Shale | |||||||
| 9/08 | BP | Chesapeake Energy | $ | 1,900 | Fayetteville Shale | |||||||
| 7/08 | BP | Chesapeake Energy | $ | 1,750 | Arkoma Woodford Shale | |||||||
| 7/08 | Plains Exploration & Production | Chesapeake Energy | $ | 3,300 | Haynesville Shale | |||||||
Source: Publicly available materials.
| • | Need for additional drilling activity to maintain production levels. With the increased maturity of the onshore conventional and, in many cases, unconventional resource plays, oil and natural gas production may be characterized as having steeper initial decline curves. As a result, we believe that an increasing number of wells will need to be drilled to offset production declines. Given average decline rates and demand forecasts, we believe that the number of wells drilled is likely to continue to increase in coming years. Once a well has been drilled, it requires recurring production and completion services, which we believe will drive demand for our services. |
Our Strategy
Our strategy is to leverage our equipment and personnel to provide drilling, completion and production services in unconventional resource plays. These services optimize the ultimate recovery and present value of hydrocarbon reserves in the unconventional resource plays that we serve. We believe that our services provide cost efficiencies for our customers. Specifically, we intend to:
| • | Capitalize on the increased activity in the unconventional resource plays. Our equipment is tailored to provide drilling, completion and production services for unconventional wells and our operations are strategically located in major unconventional resource plays. We intend to continue capturing the anticipated growth in these markets and diversifying our operations across the different unconventional resource basins. Our core operations are |
62
Table of Contents
Index to Financial Statements
| focused in proven producing regions, primarily in the Bakken Shale in North Dakota and Montana, the Eagle Ford Shale in South Texas, the Fayetteville Shale in Arkansas, the Granite Wash in Oklahoma and Texas, the Cotton Valley and the Haynesville Shale in Northwest Louisiana and East Texas, the Marcellus Shale in West Virginia and Pennsylvania, the Marmaton and Mississippi Shales in Oklahoma and Texas, the Niobrara formation in Wyoming, the Permian Basin in West Texas, the Trenton formation in Michigan, the Utica Shale in Ohio and Pennsylvania and the Woodford Shale in Southeastern Oklahoma. We intend to continue to strategically deploy assets to these unconventional resource basins and will look to capture further growth in the emerging unconventional resource plays such as the Bakken, Cana Woodford, Eagle Ford and Niobrara. |
| • | Expand our completion and production services fleet. We have recently expanded and intend to continue to expand our fleet used to provide completion and production services. We acquired approximately $42.1 million of equipment during 2010 and currently expect to spend approximately $88.1 million during 2011 on new equipment, including 18 quintuplex high-pressure pumps, six coiled tubing units, six snubbing units, seven fluid pumpers and two nitrogen units. |
| • | Leverage our broad range of services for unconventional wells. We offer a complementary suite of services relating to the drilling, completion and production of unconventional wells. Our completion and production segment provides production enhancement and completion services for unconventional wells and our horizontal and directional drilling segment assists in the drilling of these wells. These complementary services have provided us with opportunities to cross sell our services and expand our service offerings to existing customers, obtain new customers and expand our geographic presence. We intend to continue to expand our services in an effort to increase cross selling opportunities and create operational efficiencies for our customers. |
| • | Capitalize on organic growth opportunities. We intend to use our existing customer relationships, cross selling of services and operational track record to expand opportunistically to other geographic regions in which our customers have operations. In addition, we believe our reputation will allow us to successfully expand our customer base and geographic presence. |
| • | Expand through selected acquisitions. To complement our organic growth, we intend to pursue selected acquisitions that can meet our targeted returns on invested capital. We believe this strategy will facilitate the continued expansion of our customer base, geographic presence and service offerings. |
| • | Leverage our experienced operational management team and basin-level expertise. We seek to manage our business as close to our customer base as possible. Our operational division heads have an average of over 30 years of experience in the oilfield service business. These members of our management team have long-term customer relationships with our largest customers. We intend to leverage our operational management team’s basin-level expertise to deliver innovative, basin-specific services to our customers. |
Our Strengths
We believe that the following strengths position us well within our industry and will help us successfully execute our strategy:
| • | Quality equipment. Our service fleet is predominantly comprised of equipment that has been tailored to provide services for unconventional wells. Approximately 40% of our pressure pumping equipment has been built within the last year. Most of our pressure control equipment has been designed and built by us and is less than four years old. We believe that our equipment will allow us to provide a high level of service to our customers and capture future growth in the unconventional resource plays that we serve. |
| • | Experienced management and operating team. Our operational division heads have an extensive track record in the oilfield services business and an average of over 30 years of oilfield services experience. We believe their knowledge of our industry and business lines enhances our ability to provide a high |
63
Table of Contents
Index to Financial Statements
| level of customer service. In addition, our field managers have expertise in the geological basins in which they operate and understand the regional challenges that our customers face, which we believe strengthens our relationships with our customers. |
| • | Strategic geographic positioning. Currently, we operate 13 service centers to support our operations in major unconventional resource plays in the United States, including the Bakken Shale in North Dakota and Montana, the Cana Woodford Shale and the Cleveland Sand in Oklahoma, the Eagle Ford Shale in South Texas, the Fayetteville Shale in Arkansas, the Granite Wash in Oklahoma and Texas, the Cotton Valley and the Haynesville Shale in Northwest Louisiana and East Texas, the Marcellus Shale in West Virginia and Pennsylvania, the Niobrara formation in Wyoming, the Permian Basin in West Texas, the Trenton formation in Michigan, the Utica Shale in Ohio and Pennsylvania and the Woodford Shale in Southeastern Oklahoma. We expect to complete our fourteenth service center, located in Victoria, Texas, in the third quarter of 2011 to service our expanding activities in the Eagle Ford Shale. Our operations are focused in the growing oil and natural gas liquids resource plays, as well as natural gas resource plays. We believe our geographic positioning provides us with both a more stable revenue stream and access to the growth occurring in these unconventional resource plays. |
| • | Long-term, basin-level relationships with a stable customer base. Our operational division heads and field managers have formed long-term relationships with our customer base. We believe that these relationships will help provide us with a stable and growth-oriented client base in the unconventional shale markets that we serve. Our customers include large independent oil and natural gas exploration and production companies. Our top five customers for the year ended December 31, 2010, representing 36% of our revenue, were SandRidge Energy, Inc., Windsor Permian LLC, Chesapeake Energy Corp., Continental Resources, Inc. and East Resources, Inc. |
Properties
Our corporate headquarters are located at 14201 Caliber Drive, Suite 300, Oklahoma City, Oklahoma 73134 in an office building leased from Caliber Investment Group LLC, an affiliate of ours. We currently own three properties, two located in Texas and the other in Michigan, which are used for field offices and yards. In addition to our headquarters, we also lease eleven properties that are used for field offices or yards, or for both purposes. We lease five of these properties from third parties and six from our affiliates. For a more detailed description of our transactions with our affiliates, see “Related Party Transactions” beginning on page 91 of this prospectus.
We believe that our facilities are adequate for our current operations.
Customers
Our customers consist primarily of independent oil and natural gas producers and land-based drilling contractors in North America. For the year ended December 31, 2010, we had over 375 customers. Our top five customers by revenue for the year ended December 31, 2010 were SandRidge Energy, Inc., Windsor Permian LLC, Chesapeake Energy Corp., Continental Resources, Inc. and East Resources, Inc. Our top five customers accounted for approximately 36%, 26% and 30% of our revenue for the years ended December 31, 2010, 2009 and 2008, respectively. Our largest customer accounted for approximately 18%, 11% and 13% of our revenue for the years ended December 31, 2010, 2009 and 2008, respectively. No other customer accounted for more than 10% of our revenue during any of those periods. Although we believe we have a broad customer base and wide geographic coverage of operations, it is likely that we will continue to derive a significant portion of our revenue from a relatively small number of customers in the future. If a major customer decided not to continue to use our services, revenue could decline and our operating results and financial condition could be harmed.
64
Table of Contents
Index to Financial Statements
Operating Risk and Insurance
Our operations are subject to hazards inherent in the oil and natural gas industry, such as accidents, blowouts, explosions, fires and spills and releases that can cause:
| • | personal injury or loss of life; |
| • | damage or destruction of property, equipment, natural resources and the environment; and |
| • | suspension of operations. |
In addition, claims for loss of oil and natural gas production and damage to formations can occur in the oilfield services industry. If a serious accident were to occur at a location where our equipment and services are being used, it could result in us being named as a defendant in lawsuits asserting large claims.
Because our business involves the transportation of heavy equipment and materials, we may also experience traffic accidents which may result in spills, property damage and personal injury.
Despite our efforts to maintain safety standards, we from time to time have suffered accidents in the past and anticipate that we could experience accidents in the future. In addition to the property damage, personal injury and other losses from these accidents, the frequency and severity of these incidents affect our operating costs and insurability and our relationships with customers, employees, regulatory agencies and other parties. Any significant increase in the frequency or severity of these incidents, or the general level of compensation awards, could adversely affect the cost of, or our ability to obtain, workers’ compensation and other forms of insurance, and could have other material adverse effects on our financial condition and results of operations.
We maintain commercial general liability, workers’ compensation, business auto, commercial property, motor truck cargo, umbrella liability and excess liability, directors and officers, and fiduciary practices liability insurance policies. The limits for our general liability policies are as follows:
| • | Commercial General Liability limit (primary policy): $1,000,000 per occurrence and $2,000,000 per project aggregate |
| • | Commercial Umbrella limit: $25,000,000 |
| • | Excess Liability limit (in excess of Commercial Umbrella): $10,000,000 |
The above policies do not require a deductible. In addition, we have pollution legal liability coverage with a $5,000,000 limit and a $25,000 deductible and workers compensation insurance coverage with a $1,000,000 limit. Our pollution liability policy would cover, among other things, third party liability and costs of clean-up relating to environmental contamination on our premises, while our equipment and chemicals are in transit and while on our customers’ job site. With respect to our hydraulic fracturing operations, coverage would be available under our pollution legal liability policy for any surface or subsurface environmental clean-up and liability to third parties arising from any surface or subsurface contamination.
Although we maintain insurance coverage of types and amounts that we believe to be customary in the industry, we are not fully insured against all risks, either because insurance is not available or because of the high premium costs relative to perceived risk. Further, insurance rates have in the past been subject to wide fluctuation and changes in coverage could result in less coverage, increases in cost or higher deductibles and retentions. Liabilities for which we are not insured, or which exceed the policy limits of our applicable insurance, could have a material adverse effect on us. See “Risk Factors” on page 13 of this prospectus for a description of certain risks associated with our insurance policies.
Safety and Remediation Program
In the oilfield services industry, an important competitive factor in establishing and maintaining long-term customer relationships is having an experienced and skilled workforce. Recently, many of our large customers
65
Table of Contents
Index to Financial Statements
have placed an emphasis not only on pricing, but also on safety records and quality management systems of contractors. We believe these factors will gain further importance in the future. We have committed resources toward employee safety and quality management training programs. Our field employees are required to complete both technical and safety training programs. Further, as part of our safety program and remediation procedures, we check fluid lines for any defects on a periodic basis to avoid line failure during hydraulic fracturing operations, marking such fluid lines to reflect the most recent testing date. We also regularly monitor pressure levels in the fluid lines used for fracturing and the surface casing to verify that the pressure and flow rates are consistent with the job specific model in an effort to avoid failure. As part of our safety procedures, we also have the capabilities to shut down our pressure pumping and fracturing operations both at the lines and in our data van. In addition, we maintain spill kits on location for containment of pollutants that may be spilled in the process of providing our hydraulic fracturing services. The spill kits are generally comprised of pads and booms for absorption and containment of spills, as well as soda ash for neutralizing acid. Fire extinguishers are also in place on job sites at each pump.
Historically, we have used a third-party contractor to provide remediation and spill response services when necessary to address spills that were beyond the Company’s containment capabilities. None of these prior spills were significant, and we have not experienced any incidents, citations or legal proceeding relating to our hydraulic fracturing services for environmental concerns. To the extent our hydraulic fracturing or other oil field services operations result in a future spill, leak or other environmental impact that is beyond our ability to contain, we intend to engage the services of such remediation company or an alternative company to assist us with clean-up and remediation.
Competition
The markets in which we operate are highly competitive. To be successful, a company must provide services and products that meet the specific needs of oil and natural gas exploration and production companies and drilling services contractors at competitive prices.
We provide our services and products across the United States and we compete against different companies in each service and product line we offer. Our competition includes many large and small oilfield service companies, including the largest integrated oilfield services companies.
Our major competitors for our pressure control services include Schlumberger Limited, Halliburton Company, Baker Hughes Incorporated, Weatherford International Ltd., Key Energy Services Inc., Nabors Industries Ltd., Complete Energy Services, Inc. and RPC Incorporated and a significant number of locally oriented businesses. Our major competitors in pressure pumping services include Nabors Industries Ltd., RPC Incorporated, Complete Energy Services, Inc., FracTech Services, Inc., Baker Hughes Incorporated, Halliburton Company, Schlumberger Limited and Weatherford International Ltd. In our horizontal and directional drilling services segment, our primary competitors include Schlumberger Limited, Halliburton Company, Baker Hughes Incorporated, Weatherford International Ltd., Scientific Drilling and various regional and local service providers. We believe that the principal competitive factors in the market areas that we serve are quality of service and products, reputation for safety and technical proficiency, availability and price. While we must be competitive in our pricing, we believe our customers select our services and products based on the local leadership and basin-expertise that our field management and operating personnel use to deliver quality services and products.
Government Regulation
We operate under the jurisdiction of a number of regulatory bodies that regulate worker safety standards, the handling of hazardous materials, the transportation of explosives, the protection of human health and the environment and driving standards of operation. Regulations concerning equipment certification create an ongoing need for regular maintenance which is incorporated into our daily operating procedures. The oil and natural gas industry is subject to environmental regulation pursuant to local, state and federal legislation.
66
Table of Contents
Index to Financial Statements
Transportation Matters
Through our transportation and relocation of our oilfield service equipment, we operate trucks and other heavy equipment. As such, we operate as a motor carrier in providing certain of our services and therefore are subject to regulation by the United States Department of Transportation and by various state agencies. These regulatory authorities exercise broad powers, governing activities such as the authorization to engage in motor carrier operations, driver licensing and insurance requirements, financial reporting and review of certain mergers, consolidations and acquisitions, and transportation of hazardous materials (HAZMAT). Our trucking operations are subject to possible regulatory and legislative changes that increase our costs. Some of these possible changes include increasingly stringent environmental regulations, changes in the hours of service regulations which govern the amount of time a driver may drive or work in any specific period, onboard black box recorder device requirements or limits on vehicle weight and size.
Interstate motor carrier operations are subject to safety requirements prescribed by the United States Department of Transportation. To a large degree, intrastate motor carrier operations are subject to state safety regulations that mirror federal regulations. Matters such as the weight and dimensions of equipment are also subject to federal and state regulations. From time to time, various legislative proposals are introduced, including proposals to increase federal, state, or local taxes, including taxes on motor fuels, which may increase our costs or adversely impact the recruitment of drivers. We cannot predict whether, or in what form, any increase in such taxes applicable to us will be enacted.
Certain motor vehicle operators require registration with the Department of Transportation. This registration requires an acceptable operating record. The Department of Transportation periodically conducts compliance reviews and may revoke registration privileges based on certain safety performance criteria which could result in a suspension of operations. The rating scale consists of “satisfactory,” “conditional,” and “unsatisfactory” ratings. Currently, Great White Pressure Control LLC and Great White Pressure Pumping LLC are operating with a “conditional” rating. We have undertaken comprehensive efforts that we believe are adequate to comply with the regulations. Further information regarding our safety performance is available at the Department of Transportation Federal Motor Carrier Safety Administration website at www.fmcsa.dot.gov.
Environmental Matters
Our operations are subject to numerous federal, state and local environmental laws, regulations and other requirements governing the release and/or discharge of materials into the environment or otherwise relating to protection of human health and the environment. Numerous governmental agencies issue regulations to implement and enforce these laws, for which compliance is often costly and difficult. The violation of these laws and regulations may result in the denial or revocation of permits, issuance of corrective action orders, assessment of administrative and civil penalties, and even criminal prosecution. We believe that we are in substantial compliance with applicable environmental laws and regulations. Further, we do not anticipate that compliance with existing environmental laws and regulations will have a material effect on our consolidated financial statements. However, it is possible that substantial costs for compliance or liability may be incurred in the future. Moreover, it is possible that other developments, such as the adoption of stricter environmental laws, regulations, and enforcement policies, could result in additional costs or liabilities that we cannot currently quantify.
We handle, transport, store and dispose of wastes that are subject to the federal Resource Conservation and Recovery Act, or RCRA, and comparable state statutes. The U.S. Environmental Protection Agency, or EPA, and state agencies have limited the approved methods of disposal for some types of hazardous and nonhazardous wastes. Certain petroleum production wastes are excluded from RCRA’s hazardous waste regulations. However, it is possible that these wastes, which could include wastes handled or generated by us in our field service activities, will in the future be designated as “hazardous wastes” and, therefore, be subject to more rigorous and costly regulation. Indeed, legislation has been proposed from time to time in Congress to re-categorize certain oil and gas exploration and production wastes as “hazardous wastes.” If this were to occur, we would become subject to more rigorous and costly operating and disposal requirements that could have a material adverse affect
67
Table of Contents
Index to Financial Statements
on our capital expenditure and operating expenses. The federal Comprehensive Environmental Response, Compensation, and Liability Act, CERCLA or the “Superfund” law, and comparable state statutes impose strict, joint and several liability, without regard to fault or legality of the original conduct, on certain classes of potentially responsible persons. Such classes of persons include current and former owners or operators who owned or operated a contaminated site when a hazardous substance was released, and companies that disposed or arranged for disposal of hazardous substances, including at offsite locations such as landfills. Under CERCLA, these persons may be ordered to take certain actions or assume liability for the costs of cleaning up the hazardous substances that have been released into the environment and for damages to natural resources. It is not uncommon for neighboring landowners and other third parties to file claims for personal injury and property damage allegedly caused by the hazardous substances released into the environment. We currently own, lease, or operate numerous properties and facilities that for many years have been used for industrial activities, including oil and gas production operations. We have also formerly owned or operated such facilities. Hazardous substances, wastes, or hydrocarbons may have been released on or under the properties owned or leased by us, or on or under other locations where such substances have been taken for disposal. In addition, some of these properties have been operated by third parties or by previous owners whose treatment and disposal or release of hazardous substances, wastes, or hydrocarbons, was not under our control. These properties and the substances disposed or released on them may be subject to CERCLA, RCRA and analogous state laws. Under such laws, we could be required to remove previously disposed substances and wastes (including substances disposed of or released by prior owners or operators or other parties), remediate contaminated property (including groundwater contamination, whether from prior owners or operators or other activities or spills), or perform remedial plugging or pit closure operations to prevent future contamination. These laws and regulations may also expose us to liability for our acts that were in compliance with applicable laws at the time the acts were performed.
In the course of our operations, some of our equipment may be exposed to naturally occurring radiation associated with oil and gas deposits, and this exposure may result in the generation of wastes and other materials containing naturally occurring radioactive materials, or NORM. NORM exhibiting trace levels of naturally occurring radiation in excess of established state standards are subject to special handling and disposal requirements, and any storage vessels, piping and work area affected by NORM may be subject to remediation or restoration requirements. Because certain of the properties presently or previously owned, operated or occupied by us may have been used for oil and gas production operations, it is possible that we may incur costs or liabilities associated with NORM.
The Federal Water Pollution Control Act, also known as the Clean Water Act, and analogous state laws impose restrictions and strict controls regarding the discharge of pollutants into federal or state waters. The discharge of pollutants into jurisdictional waters is prohibited unless the discharge is permitted by the EPA or applicable state agencies. Certain of our properties and operations require permits for discharges of wastewater and/or stormwater. In addition, the Oil Pollution Act of 1990 imposes a variety of requirements on responsible parties related to the prevention of oil spills and liability for damages, including natural resource damages, resulting from such spills. A responsible party includes the owner or operator of a facility. The Federal Water Pollution Control Act and analogous state laws provide for administrative, civil and criminal penalties for unauthorized discharges and, together with the Oil Pollution Act, impose rigorous requirements for spill prevention and response planning, as well as substantial potential liability for the costs of removal, remediation, and damages in connection with any unauthorized discharges.
Some of our operations also result in emissions of regulated air pollutants. The federal Clean Air Act and analogous state laws require permits for facilities that have the potential to emit substances into the atmosphere that could adversely affect environmental quality. Failure to obtain a permit or to comply with permit requirements could result in the imposition of substantial administrative, civil and even criminal penalties. The obtaining of new or modified air permits could also expose us to increased costs of operations.
Many nations have agreed to limit emissions of “greenhouse gases,” or GHGs, pursuant to the United Nations Framework Convention on Climate Change, also known as the “Kyoto Protocol.” Methane, a primary
68
Table of Contents
Index to Financial Statements
component of natural gas, and carbon dioxide, a byproduct of the burning of oil, natural gas, and refined petroleum products are GHGs regulated by the Kyoto Protocol. Although the United States is not participating in the Kyoto Protocol at this time, several states have adopted legislation and regulations to reduce emissions of greenhouse gases. Additionally, on April 2, 2007, the U.S. Supreme Court ruled, in Massachusetts, et al. v. EPA, that the EPA has the authority to regulate carbon dioxide emissions from automobiles as “air pollutant” under the federal Clean Air Act. Thereafter, in December 2009, the EPA determined that emissions of carbon dioxide, methane and other GHGs present an endangerment to human health and the environment because, according to the EPA, emissions of such gases contribute to warming of the earth’s atmosphere and other climatic changes. These findings by the EPA allowed the agency to proceed with the adoption and implementation of regulations that would restrict emissions of GHGs under existing provisions of the federal Clean Air Act. Subsequently, the EPA recently adopted two sets of related rules, one of which purports to regulate emissions of GHGs from motor vehicles and the other of which would regulate emissions of GHGs from large stationary sources of emissions such as power plants or industrial facilities. The EPA finalized the motor vehicle rule in April 2010 and it became effective January 2011, although it does not require immediate reductions in GHG emissions. The EPA adopted the stationary source rule in May 2010, and it also became effective January 2011, although it remains the subject of several pending lawsuits filed by industry groups. Additionally, in September 2009, the EPA issued a final rule requiring the reporting of GHG emissions from specified large GHG emission sources in the U.S., including natural gas liquids fractionators and local natural gas/distribution companies, beginning in 2011 for emissions occurring in 2010.
In June 2009, the U.S. House of Representatives passed the American Clean Energy and Security (ACES) Act that, among other things, would have established a cap-and-trade system to regulate greenhouse gas emissions and would have required an 80% reduction in GHG emissions from sources within the United States between 2012 and 2050. The ACES Act did not pass the Senate, however, and so was not enacted by the 111th Congress. The United States Congress is likely to again consider a climate change bill in the future. Moreover, almost half of the states have already taken legal measures to reduce emissions of GHGs, primarily through the planned development of GHG emission inventories and/or regional GHG cap and trade programs. Most of these cap and trade programs work by requiring major sources of emissions, such as electric power plants, or major producers of fuels, such as refineries and gas processing plants, to acquire and surrender emission allowances corresponding with their annual emissions of GHGs. The number of allowances available for purchase is reduced each year until the overall GHG emission reduction goal is achieved. As the number of GHG emission allowances declines each year, the cost or value of allowances is expected to escalate significantly. Restrictions on emissions of methane or carbon dioxide that may be imposed in various states could adversely affect the oil and natural gas industry and, therefore, could reduce the demand for our products and services. Currently, our operations are not adversely impacted by existing state and local climate change initiatives and, at this time, it is not possible to accurately estimate how potential future laws or regulations addressing greenhouse gas emissions would impact our business.
OSHA Matters
We are also subject to the requirements of the federal Occupational Safety and Health Act (OSHA) and comparable state statutes that regulate the protection of the health and safety of workers. In addition, the OSHA hazard communication standard requires that information be maintained about hazardous materials used or produced in operations and that this information be provided to employees, state and local government authorities and the public. We believe that our operations are in substantial compliance with the OSHA requirements, including general industry standards, record keeping requirements, and monitoring of occupational exposure to regulated substances.
Employees
As of May 31, 2011, we had 759 full-time employees and four part-time employees. We also hire independent contractors and consultants involved in land, technical, regulatory and other disciplines to assist our full time employees.
69
Table of Contents
Index to Financial Statements
Legal Proceedings
In November 2006, Cudd Pressure Control, Inc., or Cudd, filed a lawsuit against Great White Pressure Control LLC, among others, in the 129th Judicial District Harris County, Texas. The lawsuit was subsequently removed to the United States District Court for the Southern District of Texas (Houston Division). The lawsuit alleges RICO violations and several other causes of action relating to an affiliate company’s employment of several former Cudd employees and seeks unspecified monetary damages and injunctive relief. The defendants in the suit are Ronnie Roles, Rocky Roles, Steve Winters, Bert Ballard, Nelson Britton, Michael Fields, Great White Pressure Control LLC and Gulfport Energy Corporation. These individuals are officers or key employees of Great White Pressure Control LLC. On stipulation by the parties, the plaintiff’s RICO claim was dismissed without prejudice by order of the court on February 14, 2007. We filed a motion for summary judgment on October 5, 2007. The Court entered a final interlocutory judgment in favor of all defendants, including us, on April 8, 2008. On November 3, 2008, Cudd filed its appeal with the U.S. Court of Appeals for the Fifth Circuit. The Fifth Circuit vacated the district court decision finding, among other things, that the district court should not have entered summary judgment without first allowing more discovery. The case was remanded back to the district court, and Cudd filed a motion to remand the case to state court, which was granted. On February 3, 2010, Cudd filed its second amended petition with the state court (a) alleging that we conspired with the other defendants to misappropriate, and misappropriated, Cudd’s trade secrets and caused its employees to breach their fiduciary duties, and (b) seeking unspecified monetary damages. On April 13, 2010, our motion to be dismissed from the proceeding for lack of personal jurisdiction was denied. On February 15, 2011, the plaintiff filed its third amended petition with the state court seeking (a) damages of up to $26.5 million as the value of defendants’ alleged misappropriation and (b) the individuals’ disgorgement of $6.0 million in signing bonuses. This state court proceeding is in its initial stages. Due to the current stage of the Cudd litigation, the outcome is uncertain and management cannot determine the amount of loss, if any, that might result. Litigation is inherently uncertain. An adverse decision in the above matter could have a material adverse effect on our financial condition or results of operations.
Due to the nature of our business, we are, from time to time, involved in routine litigation or subject to disputes or claims related to our business activities, including workers’ compensation claims and employment related disputes. In the opinion of our management, none of such other litigation, disputes or claims against us, if decided adversely, is expected to have a material adverse effect on our financial condition or results of operations.
70
Table of Contents
Index to Financial Statements
Executive Officers and Directors
Set forth below is the name, age, position and a brief account of the business experience of each of our executive officers and directors as of July 1, 2011.
| Name |
Age | Position | ||||
| Executive Officers and Directors: |
||||||
| John Jordan |
54 | Chief Executive Officer | ||||
| David W. Sparkman | 54 | Chief Financial Officer and Executive Vice President | ||||
| Ronnie G. Roles | 55 | Senior Vice President of Pressure Control Services | ||||
| William E. Haley | 52 | Senior Vice President of Pressure Pumping Services | ||||
| Danny Ward | 55 | Senior Vice President of Directional Drilling Services | ||||
| Randall J. Holder | 58 | General Counsel, Executive Vice President and Secretary | ||||
| Steven E. West | 50 | Director | ||||
| Arthur H. Amron |
54 | Director Nominee | ||||
| Charles E. Davidson |
58 | Director Nominee | ||||
| David L. Houston |
58 | Director Nominee | ||||
| Douglas Lambert | 54 | Director Nominee | ||||
| Mike Liddell |
57 | Director Nominee | ||||
| Mark L. Plaumann | 55 | Director Nominee | ||||
John Jordan—Chief Executive Officer—Mr. Jordan joined Great White as our Chief Executive Officer in March 2011. Prior to joining Great White, Mr. Jordan served from March 2010 to March 2011 as the Chief Executive Officer of ASCO’s operations in the Americas, where he was responsible for ASCO’s North and South American logistics and global freight forwarding business units. From January 2005 to February 2010, Mr. Jordan was Group Chief Executive Officer of Energy Cranes International, a provider of offshore crane engineering, operation and manufacture services. Prior to that, Mr. Jordan served as Group Chief Executive Officer of SPS International, an oilfield services company, from 2001 to 2004. From 1999 to 2001, Mr. Jordan served in various executive capacities, including Senior Vice President, Chief Operating Officer and Chief Financial Officer, for Global Completion Services, an oilfield services company, which merged with SPS International in 2001. From 1996 to 1999, Mr. Jordan served as President and Chief Operating Officer for OSCA, Inc., an oilfield services company. From 1995 to 1996, Mr. Jordan was a Vice President and General Manager of the United States operations of Nowsco Well Services, Inc., an oilfield services company. Mr. Jordan began his career with Western Company of North America, an oilfield services company, as a management trainee in 1979 and served in various capacities before ultimately being named President of Western Petroleum Services in 1993. He remained President of Western Petroleum Services until 1995, when the company was sold to BJ Services. Following the acquisition, Mr. Jordan remained with BJ Services for part of 1995 as a Region Manager, responsible for integrating Western Petroleum Services’ Gulf Coast operations. Mr. Jordan attended the University of Louisiana-Lafayette and earned his M.B.A. from Tulane University in New Orleans.
David W. Sparkman—Chief Financial Officer and Executive Vice President—Mr. Sparkman joined Great White in July 2010 as our Chief Financial Officer and Vice President responsible for our accounting, treasury and risk management activities. Prior to that, he was owner and President of Ulysses Enterprises, LLC, a financial consulting firm, from February 2009 to June 2009 and Chief Financial Officer for Sitton Properties and Strateline Industries, LLC from March 2008 to January 2009. Mr. Sparkman served as Executive Vice-President/Finance of Dollar Thrifty Automotive Group, a vehicle rental company, from January 2003 to February 2008 and before that he was Executive Vice-President Chief Financial Officer of Thrifty Rent-A-Car System, Inc., a vehicle rental company, from May 1995 to December 2002. Mr. Sparkman also served as Controller of Thompson Pipe and Steel, a manufacturer of steel pipe, from June 1993 to May 1995. He began his career in public accounting in the Tulsa and Denver offices of Coopers & Lybrand. He is a certified public accountant and graduated from the University of Arkansas with a BSBA in accounting.
71
Table of Contents
Index to Financial Statements
Ronnie G. Roles—Senior Vice President of Pressure Control Services—Mr. Roles has served as President of Great White Pressure Control LLC since August 2006. Prior to joining Great White, Mr. Roles was with Cudd Pressure Control, an oilfield services company, from February 1977 to August 2006, where he served as President of operations, overseeing domestic and international field offices. Mr. Roles has over 30 years experience in all phases of pressure control techniques and processes, including snubbing, wireline, coil-tubing and well control.
William E. Haley—Senior Vice President of Pressure Pumping Services—Mr. Haley has served as President of Great White Pressure Pumping LLC since September 2010. Prior to his current position, Mr. Haley worked as an engineering consultant for Crescent Services, an oilfield services company, from February 2010 to September 2010; regional manager for Superior Well Services, Inc., an oilfield services company, in Oklahoma and Texas from November 2008 to February 2010; and Director of Operations for the pumping services operations of Diamondback Energy Services from December 2007 to October 2008. Mr. Haley worked as a fracturing specialist for Cimarex Energy Co., an oil and gas exploration company, from January 2005 to November 2007. Mr. Haley was with Halliburton, an oilfield services company, for 23 years prior to Diamondback Energy Services. Mr. Haley has over 30 years experience in the stimulation industry. Mr. Haley is a graduate of Southwestern Oklahoma State University with a Bachelor of Science degree in computer science.
Danny Ward—Senior Vice President of Directional Drilling Services—Mr. Ward served as Chief Operating Officer of Great White Directional Services LLC and Diamond-Directional Drilling LLC from September 2008 to March 2011 and has served as President of Great White Directional Services LLC and Diamondback-Directional Drilling LLC since March 2011. Previously, Mr. Ward served as Vice President of Operations of the drilling technology services and applications division of Diamondback-Quantum from December 2005 to August 2008. Mr. Ward served as Vice President of Operations of Quantum Drilling Motors, an oilfield services company, from June 2002 until our acquisition of substantially all of the assets of that company in December 2005. From December 1997 to June 2002, Mr. Ward served as mid-continent regional manager of Weatherford-Dailey International, an oilfield services company, and from November 1988 to June 1997 he served as operations manager for Drillex Systems Performance Drilling, an oilfield services company. Mr. Ward has over 30 years of oil and natural gas industry experience, including experience in all aspects of directional, horizontal and drilling motor services.
Randall J. Holder—General Counsel, Executive Vice President and Secretary—Mr. Holder joined Great White in November 2008 as General Counsel and Vice President responsible for legal and human resources. Mr. Holder served as Executive Vice President and General Counsel for R.L. Hudson and Company, a supplier of molded rubber and plastic components, from February 2007 to October 2008. Mr. Holder was in private practice of law and a member of Holder Betz LLC from February 2005 to February 2007. Mr. Holder served as Vice President and Assistant General Counsel for Dollar Thrifty Automotive Group, a vehicle rental company, from January 2003 to February 2005 and, before that, as Vice President and General Counsel for Thrifty Rent-A-Car System, Inc., a vehicle rental company, from September 1996 to December 2002. He also served as Vice President and General Counsel for Pentastar Transportation Group, Inc. from November 1992 to September 1996, which was wholly owned by Chrysler Corporation. Mr. Holder started his legal career with Tenneco Oil Company where he served as a Division Attorney providing legal services to the company’s mid-continent division for ten years.
Steven E. West—Director—Mr. West has served as a director of our company since January 2011. Since January 2011, Mr. West has been a partner at Wexford, focusing on Wexford’s private equity energy investments. From August 2006 until December 2010, Mr. West served as senior portfolio advisor at Wexford. From August 2003 until August 2006, Mr. West was the chief financial officer of Sunterra Corporation, a former Wexford portfolio company. From December 1993 until July 2003, Mr. West held senior financial positions at Coast Asset Management and IndyMac Bank. Prior to that, Mr. West worked at First Nationwide Bank, Lehman Brothers and Peat Marwick Mitchell & Co., the predecessor of KPMG LLP. Mr. West holds a Bachelor of Science degree in accounting from California State University, Chico. We believe Mr. West’s strong background in finance, accounting and private equity energy investments, as well as his executive management skills
72
Table of Contents
Index to Financial Statements
developed as part of his career with Wexford, its portfolio companies and other financial institutions qualify him to serve on our board of directors.
Arthur H. Amron—Director Nominee—Mr. Amron has agreed to serve as a director of our company and is expected to join our board prior to the closing of this offering. Mr. Amron is a partner at Wexford, a position he has held since 1999, and serves as its General Counsel, a position he has held since joining Wexford in 1994. Mr. Amron also actively participates in various private equity transactions and has served on the boards and creditors’ committees of a number of public and private companies in which Wexford has held investments. Mr. Amron has served as a director of Rhino GP, LLC, the general partner of Rhino Resources Partners LP since September 2010. Mr. Amron has served as a director of Nephros, Inc. since September 2007. From 1991 to 1994, Mr. Amron was an Associate at Schulte Roth & Zabel LLP, specializing in corporate and bankruptcy law, and from 1984 to 1991, Mr. Amron was an Associate at Debevoise & Plimpton LLP specializing in corporate litigation and bankruptcy law. Mr. Amron holds a JD from Harvard University and a BA in political theory from Colgate University. Mr. Amron is a member of the New York Bar. We believe that Mr. Amron’s legal training and experience in the capital markets, as well as his experience serving on boards of directors of other public companies, qualify him for service on our board of directors.
Charles E. Davidson—Director Nominee—Mr. Davidson has agreed to serve as a director of our company and is expected to join our board prior to the closing of this offering. Mr. Davidson co-founded Wexford in 1994 and has served as its Chairman and Chief Investment Officer since that time. From 1984 to 1994, Mr. Davidson was a General Partner of Steinhardt Partners, L.P. From 1977 to 1984, Mr. Davidson was employed by Goldman Sachs & Co. where he was the head of domestic corporate bond trading and proprietary trading. Mr. Davidson holds an MBA and a BA in economics from the University of California – Los Angeles. We believe that Mr. Davidson’s financial background, executive management experience and capital markets experience qualify him for service on our board of directors.
David L. Houston—Director Nominee—Mr. Houston has agreed to serve as a director of our company and is expected to join our board prior to the closing of this offering. Since 1991, Mr. Houston has been the principal of Houston & Associates, a firm that offers life and disability insurance, compensation and benefits plans and estate planning. Prior to 1991, Mr. Houston was President and Chief Executive Officer of Equity Bank for Savings, F.A., an Oklahoma-based savings bank. Mr. Houston served on the board of directors and executive committee of Deaconess Hospital, Oklahoma City, Oklahoma, from January 1993 until December 2008 and is the former chair of the Oklahoma State Ethics Commission and the Oklahoma League of Savings Institutions. Mr. Houston has served as a director of Gulfport Energy Corporation since July 1998 and is the chairman of its audit committee. He also served as a director of Bronco Drilling Company from May 2005 until December 2010 and was a member of its audit committee. Mr. Houston received a Bachelor of Science degree in business from Oklahoma State University and a graduate degree in banking from Louisiana State University. We believe that Mr. Houston’s financial background and his executive management experience qualify him for service on our board of directors.
Douglas Lambert—Director Nominee—Mr. Lambert has agreed to serve as a director of our company and is expected to join our board prior to the closing of this offering. He is presently a Managing Director in the North American Restructuring Practice Group of Alvarez & Marsal Inc., a position he has held since November 2006, and has served as Chief Executive Officer of Legacy Asset Management Company, a wholly-owned subsidiary of Lehman Brothers Holdings, Inc. since May 2010. Mr. Lambert has served as a director and a member of the audit and conflicts committee of the general partner of Rhino Resource Partners LP, a coal operating company, since October 2010. Mr. Lambert has been a director of Republic Airways Holdings, Inc., an airline holding company, since 2001. From 1994 to 2003, Mr. Lambert was a Senior Vice President of Wexford. From 1983 to 1994, Mr. Lambert held various financial positions with Integrated Resources, Inc.’s Equipment Leasing Group, including Treasurer and Chief Financial Officer. Mr. Lambert is a member of the American Institute of Certified Public Accountants and the New York State Society of Certified Public Accountants. We believe that Mr. Lambert’s strong financial and accounting background and his executive management experience qualify him for service on our board of directors.
73
Table of Contents
Index to Financial Statements
Mike Liddell—Director Nominee—Mr. Liddell has agreed to serve as a director of our company and is expected to join our board prior to the closing of this offering. Mr. Liddell has served as a director of Gulfport Energy Corporation since July 1997 and as Chairman of the Board of Gulfport Energy Corporation since July 1998. Mr. Liddell served as Chief Executive Officer of Gulfport Energy Corporation from April 1998 to December 2005 and President from July 2000 to December 2005. Mr. Liddell also served as President and Chief Executive Officer of Caliber Development Company, LLC from March 2004 until June 2006, and has served as its Chief Executive Officer since June 2006. Mr. Liddell served as a director of Bronco Drilling Company, Inc., a provider of contract land drilling services, from May 2005 until August 2008 and as its Chairman of the Board from May 2005 until August 2007. Mr. Liddell has served as Chairman of the Board of Windsor Energy Group, L.L.C. and Great White Energy Services, LLC since December 2005 and November 2006, respectively, and served as Chairman of the Board of Diamondback Energy Services, Inc. from November 2006 until December 2008. In addition, Mr. Liddell served as Chief Executive Officer of DLB Oil & Gas, Inc., a publicly held oil and natural gas company, from 1994 to 1998, and as a director of DLB Oil & Gas from 1991 through April 1998. From 1991 to 1994, Mr. Liddell was President of DLB Oil & Gas. From 1979 to 1991, he was President and Chief Executive Officer of DLB Energy. Mr. Liddell received a Bachelor of Science degree in education from Oklahoma State University. We believe that Mr. Liddell’s strong oil and natural gas background and executive management experience, as well as his experience serving on boards of directors of other public companies, qualify him for service on our board of directors.
Mark L. Plaumann—Director Nominee—Mr. Plaumann has agreed to serve as a director of our company and is expected to join our board prior to the closing of this offering. He is currently a Managing Member of Greyhawke Capital Advisors LLC, or Greyhawke, which he co-founded in 1998. Prior to founding Greyhawke, Mr. Plaumann was a Senior Vice President of Wexford. Mr. Plaumann was formerly a Managing Director of Alvarez & Marsal, Inc. and the President of American Healthcare Management, Inc. He also was Senior Manager at Ernst & Young LLP. Mr. Plaumann served as a director and audit committee chairman for ICx Technologies, Inc. until October 2010 and currently serves as a director and audit committee chairman of Republic Airways Holdings, Inc., and a director of one private company. Mr. Plaumann also serves as a director, an audit committee chairman and a member of the conflicts committee of the general partner of Rhino Resource Partners LP, a coal operating company, since October 2010. Mr. Plaumann holds an M.B.A. and a B.A. in Business from the University of Central Florida. We believe that Mr. Plaumann’s service on the boards of other public companies and his executive management experience, including previous experience as chairman of audit committees, qualifies him for service on our board of directors.
Our Board of Directors and Committees
Upon completion of this offering, our board of directors will consist of seven directors, three of whom will satisfy the independence requirements of current SEC rules and The NASDAQ Global Market listing standards. Our certificate of incorporation provides that the terms of office of the directors are one year from the time of their election until the next annual meeting of stockholders or until their successors are duly elected and qualified.
Our certificate of incorporation provides that the authorized number of directors will generally be not less than five nor more than thirteen, and the exact number of directors will be fixed from time to time exclusively by the board of directors pursuant to a resolution adopted by a majority of the whole board. In addition, our certificate of incorporation and our bylaws provide that, in general, vacancies on the board may be filled by a majority of directors in office, although less than a quorum.
Our board of directors will establish an audit committee in connection with this offering whose functions will include the following:
| • | assist the board of directors in its oversight responsibilities regarding (1) the integrity of our financial statements, (2) our compliance with legal and regulatory requirements, (3) the independent accountant’s qualifications and independence and (4) our accounting and financial reporting processes of and the audits of our financial statements; |
74
Table of Contents
Index to Financial Statements
| • | prepare the report required by the SEC for inclusion in our annual proxy or information statement; |
| • | appoint, retain, compensate, evaluate and terminate our independent accountants; |
| • | approve audit and non-audit services to be performed by the independent accountants; |
| • | perform such other functions as the board of directors may from time to time assign to the audit committee; and |
| • | review and approve related party transactions. |
| • | perform such other functions as the board of directors may from time to time assign to the audit committee; and |
| • | review and approve related party transactions. |
The specific functions and responsibilities of the audit committee will be set forth in the audit committee charter. Upon completion of this offering, our audit committee will include at least one director who satisfies the independence requirements of current SEC rules and The NASDAQ Global Market listing standards. Within one year after completion of the offering, we expect that our audit committee will be composed of three members that will satisfy the independence requirements of current SEC rules and The NASDAQ Global Market listing standards. We also expect that one of the members of the audit committee will qualify as an audit committee financial expert as defined under these rules and listing standards, and the other members of our audit committee will satisfy the financial literacy standards for audit committee members under these rules and listing standards.
Pursuant to our bylaws, our board of directors may, from time to time, establish other committees to facilitate the management of our business and operations. Because we are considered to be controlled by Wexford under The NASDAQ Global Market rules, we are eligible for exemptions from provisions of these rules requiring a majority of independent directors, nominating and corporate governance and compensation committees composed entirely of independent directors and written charters addressing specified matters. We may elect to take advantage of these exemptions. In the event that we cease to be a controlled company within the meaning of these rules, we will be required to comply with these provisions after the specified transition periods.
Although we will be eligible for an exemption from the compensation committee requirements under The NASDAQ Global Market rules, we intend to establish a compensation committee composed of at least two independent directors in connection with this offering. See “—Executive Compensation—Compensation Discussion and Analysis—Compensation Policy” beginning on page 76 of this prospectus.
Director Compensation
To date, none of our directors has received compensation for services rendered as a board member. Members of our board of directors who are also officers or employees of our company will not receive compensation for their services as directors. It is anticipated that after the completion of this offering, we will pay our non-employee directors a monthly retainer of $1,000 and a per meeting attendance fee of $500 and reimburse all ordinary and necessary expenses incurred in the conduct of our business.
In connection with this offering, we intend to implement an equity incentive plan. Under the plan, non-employee directors will be granted 6,666 restricted stock units, which will vest in three equal annual installments at the end of each year in the three-year period.
Compensation Committee Interlocks and Insider Participation
We do not currently have a compensation committee. None of our executive officers serves, or has served during the past year, as a member of the board of directors or compensation committee of any other company that has one or more executive officers serving as a member of our board of directors or compensation committee.
75
Table of Contents
Index to Financial Statements
Executive Compensation
Compensation Discussion and Analysis
Compensation Practices
Historically, our equity sponsor, Wexford, determined the overall compensation philosophy and set the compensation of the named executive officers, after taking into consideration recommendations of our then serving Chief Executive Officer. In the case of our named executives with employment agreements, the compensation of such individuals is determined in accordance with their respective employment agreements.
Prior to the completion of this offering, our board of directors intends to establish a compensation committee comprised of three independent, non-employee directors and adopt a written charter for the compensation committee setting forth the compensation committee’s purpose and responsibilities. The principal responsibilities of the compensation committee will be to review and approve corporate goals and objectives relevant to the compensation of our executive officers, evaluate their performance in light of these goals, determine and approve our executive officers’ compensation based on such evaluation and establish policies, including with respect to the following:
| • | the determination of the elements of the executive compensation and allocation among different types of executive compensation; |
| • | the determination as to when awards are granted, including awards of equity-based compensation such as restricted stock units and/or options; |
| • | stock ownership guidelines and any policies regarding hedging the economic risk of such ownership; and |
| • | the review of the risks and rewards associated with our compensation policies and programs. |
The compensation committee will seek to provide a total compensation package designed to drive performance and reward contributions in support of our business strategies and to attract, motivate and retain high quality talent with the skills and competencies required by us. It is possible that the compensation committee will examine the compensation practices of our peer companies and may also review compensation data from the oil and natural gas industry generally to the extent the competition for executive talent is broader than a group of selected peer companies, but any decisions regarding possible benchmarking will be made following the completion of this offering. In addition, the compensation committee may review and, in certain cases, participate in, various relevant compensation surveys and consult with compensation consultants with respect to determining compensation for the named executive officers. We expect that our Chief Executive Officer will provide periodic recommendations to the compensation committee regarding the compensation of the other named executive officers. We expect that the compensation committee will design our compensation policies and programs to encourage and reward prudent business judgment and appropriate risk-taking over the long term.
Compensation Policy
Our general compensation policy is guided by several key principles:
| • | designing competitive total compensation programs to enhance our ability to attract and retain knowledgeable and experienced senior management level employees; |
| • | motivating employees to deliver outstanding financial performance and meet or exceed general and specific business, operational, and individual objectives; and |
| • | setting compensation and incentive levels relevant to the market in which the employee provides service. |
76
Table of Contents
Index to Financial Statements
In the future, we also intend to ensure that a portion of the total compensation made available to the named executive officers is determined by increases in equity value, thus assuring an alignment of interests between our senior management level employees and our stockholders.
Upon completion of this offering, our compensation committee will determine the mix of compensation, both among short-term and long-term compensation and cash and non-cash compensation, to establish structures that it believes are appropriate for each of the named executive officers. In making compensation decisions with respect to each element of compensation, the compensation committee is expected to consider numerous factors, including:
| • | the individual’s particular background and circumstances, including training and prior relevant work experience; |
| • | the individual’s role with us and the compensation paid to similar persons in comparable companies; |
| • | the demand for individuals with the individual’s specific expertise and experience at the time of hire; |
| • | achievement of individual and company performance goals and other expectations relating to the position; |
| • | comparison to other executives within our company having similar levels of expertise and experience and the uniqueness of the individual’s industry skills; and |
| • | aligning the compensation of our executives with the performance of our company on both a short-term and long-term basis. |
Although we expect the compensation committee to follow these policies, it is possible that the compensation committee could develop a compensation philosophy different than that discussed here.
Historic Elements of Compensation
Historically the principal elements of compensation for the named executive officers have been:
| • | base salary; |
| • | bonus awards; and |
| • | health insurance, life and disability insurance and 401(k) plan benefits available to all of our other employees. |
Historically, our compensation program has predominately been focused on retention and the achievement of strong short-term annual results. The preponderance of these short-term incentives has been in the form of discretionary cash bonuses that are based on both objective performance criteria and subjective criteria.
For 2010, each of our named executive officers, except Mr. Lancaster and Mr. Jordan, had a target payout amount with respect to his performance bonus that was set as a percentage of his annualized base salary. As specified in their respective employment agreements, for 2010, the bonus target for each of Messrs. Roles, Williams and Holder was set at 50% of such named executive officer’s annual base salary. Consistent with Mr. Sparkman’s employment agreement, his 2010 performance bonus potential was limited to $100,000, although for 2011 and thereafter it is set at 50% of his annual base salary. The employment agreement for Mr. Roles also contemplates a signing bonus, as described in more detail under the heading “—Employment Agreements.” As specified in Mr. Ward’s employment agreement and his individual 2010 bonus plan, his performance bonus target was set at 38.5% of his annual salary. Under his employment agreement, Mr. Ward also is entitled to receive a retention bonus, described in more detail under the heading “—Employment Agreements.” Mr. Lancaster’s bonus for 2010 was determined in accordance with his employee retention agreement described in more detail under “—Employment Agreements” and was not subject to any performance targets. Mr. Jordan was hired as our new Chief Executive Officer in March 2011 and did not receive any compensation for 2010.
77
Table of Contents
Index to Financial Statements
Performance Targets
Targets for the payment of performance bonuses for 2010 to our named executive officers were generally driven by profitability objectives, but in certain cases also had an individual performance component. Specifically, the payout of the performance bonus for each of Messrs. Williams and Holder was based both on objective and subjective criteria as follows: (1) 50% upon our meeting of certain quarterly profit targets discussed below and (2) 50% upon such named executive officer’s individual performance for the preceding quarter, as determined in the discretion of our Chief Executive Officer. For 2010, the following quarterly profit targets were set forth in our 2010 incentive compensation and retention plan, in which Messrs. Williams and Holder participated:
| First Quarter | Second Quarter | Third Quarter | Fourth Quarter | Total | ||||||||||||||||
| Quarterly Profit Targets (in millions) |
$ | 5.48 | $ | 9.18 | $ | 12.58 | $ | 11.80 | $ | 39.04 | ||||||||||
| Actual Performance (in millions) |
$ | 4.50 | $ | 11.30 | $ | 14.60 | $ | 15.50 | $ | 45.90 | ||||||||||
These quarterly profit targets were based on the consolidated EBITDA of the contributed entities and an allocated portion of general and administrative expense of Oilfield Management Services LLC, formerly known as Great White Energy Services LLC, and referred to in this prospectus as Management Services or Great White Energy Services LLC. The 2010 incentive compensation and retention plan provided that a minimum of 85% of the applicable profit target must be achieved in order to receive any award, with the maximum award set at the 100% level. Interpolated percentages were used for profit/award levels between the above markers. These performance bonuses are payable in quarterly increments (20% in each of the first three quarters and 40% in the fourth quarter), provided quarterly performance targets are achieved. Any portion of the performance bonus not achieved during a specific quarter could be achieved on an annual basis, payable as part of the fourth quarter bonus award, provided that the annual profit target of $39.04 million was achieved in 2010. The profit targets for these named executive officers for 2010 were subject to adjustment by the Chief Executive Officer to reflect the changes resulting from increased or decreased capital expenditures or other single event, non-recurring items not initially contemplated. No adjustments were made to the profit targets for 2010. Each of Messrs. Williams and Holder achieved his respective performance targets and received 100% of his respective performance bonus. The subjective component of the bonus determination was based on individual performance considerations, which included such named executive officers’ performance, productivity and management of expenses.
As provided in his employment agreement, the payout of Mr. Sparkman’s 2010 performance bonus was dependent upon the following: (1) 25% on the achievement of annual EBITDA target of $39.04 million; (2) 30% on management of certain expenses; (3) 25% on the achievement of certain initial public offering goals; and (4) 20% on the achievement of certain management efficiencies, in each case as determined in the discretion of the Chief Executive Officer. Each of these targets was achieved and Mr. Sparkman received 100% of his performance bonus for 2010.
As provided in his employment agreement, the payout of Mr. Roles’ 2010 performance bonus was dependant on the achievement of $8.0 million in net income by Great White Pressure Control LLC, one of the contributed entities, during the trailing 12 months period. This target was achieved and Mr. Roles received 100% of his performance bonus for 2010.
The payout of Mr. Ward’s 2010 performance bonus was dependent upon the following: (1) the achievement of the annual EBITDA target of $39.04 million and (2) the achievement of quarterly consolidated EBITDA targets ($3.7 million for the first quarter, $6.0 million for the second quarter, $8.7 million for the third quarter and $7.8 million for the fourth quarter of 2010) by certain contributed entities, with annual EBITDA target of $26.1 million for such contributed entities. Each quarterly target did not need to be achieved to receive the maximum year-end bonus payout, provided that the applicable annual targets were achieved. The performance bonus for Mr. Ward was payable only if all of the applicable targets were attained and was not to be prorated for
78
Table of Contents
Index to Financial Statements
the attainment of a lesser amount. These targets were subject to adjustment by the Chief Executive Officer to reflect changes resulting from increased or decreased capital expenditures. No adjustments were made to those targets for 2010. The targets for each quarter of 2010 by such contributed entities were not achieved and no performance bonus was paid to Mr. Ward. Mr. Ward did receive a 2010 discretionary bonus in the amount of $12,500.
Our named executive officers’ salaries, bonus awards and other compensation for the year ended December 31, 2010 are discussed in more detail below and in the Summary Compensation Table below. We believe that our company does not utilize compensation policies and programs creating risks that are reasonably likely to have a material adverse impact on our company. Historically, certain management, administrative and treasury functions were provided to us by Management Services, a wholly owned subsidiary of GWES Holdings, and by Diamondback Holdings. For purposes of presenting the consolidated financial statements, included elsewhere in this prospectus, allocations were made to determine the cost of general and administrative activities performed attributable to us. The allocations were made based upon underlying salary costs of employees performing Company related functions, payroll, revenue or headcount relative to other companies managed by Management Services or Diamondback Holdings, or specifically identified invoices processed, depending on the nature of the cost. As of May 1, 2011, we employed all our executive officers directly and they devote their full business time to us. We no longer use Management Services for management, administrative or treasury functions.
Components of Compensation Following the Completion of the Offering
We believe a material amount of executive compensation should be tied to our performance, and a significant portion of the total prospective compensation of each named executive officer should be tied to measurable financial and operational objectives. These objectives may include absolute performance or performance relative to a peer group. During periods when performance meets or exceeds established objectives, the named executive officers should be paid at or above targeted levels, respectively. When our performance does not meet key objectives, incentive award payments, if any, should be less than such targeted levels.
Following the completion of this offering, we anticipate that the compensation committee will seek to balance awards based on short-term annual results with awards intended to compensate our executives based on our long-term viability and success. Consequently, in addition to annual bonuses, in the future we anticipate that we will provide long-term incentives to our executives in the form of equity based awards to align the interests of the named executive officers with those of our equity holders. In connection with this offering, our board of directors will adopt a long-term incentive plan, which we believe will further incentivize the executive officers to perform their duties in a way that will enhance our long-term success.
As discussed above, following the completion of this offering, our compensation committee will determine the mix of compensation, both among short-term and long-term compensation and cash and non-cash compensation, to establish structures that it believes are appropriate for each of the named executive officers. We believe that the mix of base salary, awards, awards under the long-term incentive plan and the other benefits that will be available to the named executive officers will accomplish our overall compensation objectives. We believe that these elements of compensation create competitive compensation opportunities to align and drive employee performance in support of our business strategies and to attract, motivate and retain high quality talent with the skills and competencies required by us.
Base Salary
Our named executive officers’ base salaries are determined in accordance with their respective employment agreements. We have not retained compensation consultants to advise us on compensation matters. Base salaries will be reviewed annually as part of our performance management program and may be increased for merit reasons, based on the executive’s success in meeting or exceeding individual performance objectives and an
79
Table of Contents
Index to Financial Statements
assessment of whether significant corporate goals were achieved. Subject to applicable employment agreements, the compensation committee may adjust base salaries to align such salaries with market levels for comparable positions in other companies in our industry if we identify significant market changes. Additionally, the compensation committee may adjust base salaries as warranted throughout the year for promotions or other changes in the scope or breadth of an executive’s role or responsibilities. The compensation committee may also evaluate our named executive officers’ salaries together with other components of their compensation to ensure that the executive’s total compensation is in line with our overall compensation philosophy. Upon completion of this offering, Messrs. Jordan, Sparkman, Roles, Ward and Holder will, initially, continue to be compensated at their current annual rates of $400,000, $236,250, $400,000, $350,000 and $210,000, respectively.
Discretionary Annual Bonus
The compensation committee will have the authority to award discretionary annual cash bonuses to our executive officers based on individual and company performance. We believe these bonuses will be an important tool in motivating and rewarding the performance of our executive officers. For 2010, our named executive officers received bonuses set forth in the “Summary Compensation Table” included on page 82 of this prospectus. See also “—Historic Elements of Compensation” above for a discussion of bonus determinations for our named executive officers for 2010.
Long Term Equity Incentive Compensation
We will seek to promote an ownership culture among our executive officers in an effort to enhance our long-term performance. We believe the use of stock and stock-based awards offers the best approach to achieving our compensation goals. To date, no stock or stock-based awards have been granted to any of our employees and we have not adopted stock ownership guidelines for our executives. Prior to this offering, however, we intend to implement our 2011 Equity Incentive Plan. The purpose of this plan will be to enable us, and our affiliates, to attract and retain the services of the types of employees, consultants and directors who will contribute to our long range success and to provide incentives that will be linked directly to increases in share value that will inure to the benefit of our stockholders. The plan will provide a means by which eligible recipients of awards may be given an opportunity to benefit from increases in value of our common stock through the granting of equity awards. The terms of the 2011 Equity Incentive Plan are described in more detail following the Summary Compensation Table.
In connection with this offering, we will grant options to our Chief Executive Officer and expect to grant restricted stock units to our other executive officers, in each case under our 2011 Equity Incentive Plan to provide long-term incentive to build stockholder value. Except for the options to be granted to our Chief Executive Officer under the terms of his employment agreement, as described under the heading “—Employment Agreements,” we initially intend to grant only restricted stock units as long-term equity incentive compensation for our executive officers. We believe the total number of shares underlying restricted stock units granted by us will be substantially less than the number of shares issuable upon exercise of options under an option program designed to deliver equivalent levels of compensation. However, the 2011 Equity Incentive Plan will provide for other equity awards, including incentive stock options, nonstatutory stock options, performance awards, stock appreciation rights and any combination thereof, that we may issue to our executive officers and other eligible participants in the future.
Other Compensation and Perquisites
Consistent with our compensation philosophy, we anticipate that the compensation committee will continue to provide benefits to our executives that are substantially the same as those currently being offered to our other employees, including health insurance, life and disability insurance and a 401(k) plan. The benefits and perquisites that may be available to our executive officers in addition to those available to our other employees include a car allowance and club dues.
80
Table of Contents
Index to Financial Statements
Tax Implications of Executive Compensation Policy
Under Section 162(m) of the Internal Revenue Code, a public company generally may not deduct compensation in excess of $1.0 million paid to its chief executive officer and the three other most highly compensated executive officers other than the chief executive officer and the chief financial officer. Qualifying performance-based compensation will not be subject to the deduction limit if certain requirements are met. Although our long-term and incentive compensation plans and agreements have provisions that are intended to satisfy the performance-based compensation exception to the Section 162(m) deduction limit, regulations under Section 162(m) also provide a transition reliance period in the case of a corporation that is not publicly held and becomes publicly held in connection with an initial public offering. During the reliance period, the deduction limit of Section 162(m) does not apply to any compensation paid pursuant to a plan or agreement that existed during the period that the corporation was not publicly held, provided the prospectus accompanying the initial public offering discloses information concerning the plans or agreements in accordance with applicable securities laws. The reliance period ends on the earliest of (1) the expiration of the plan or agreement; (2) the material modification of the plan or agreement; (3) the issuance of all employer stock or compensation reserved under the plan; or (4) the first meeting of stockholders at which directors are elected that occurs after the close of the third calendar year following the calendar year in which the initial public offering occurs.
We anticipate that our compensation committee will structure our long-term and incentive compensation programs to preserve the tax deductibility of compensation paid to our executive officers. However, our compensation committee will have the authority to award performance based compensation that is not deductible and we cannot guarantee that it will only award deductible compensation to our executive officers. In addition, notwithstanding our compensation committee’s efforts, ambiguities and uncertainties regarding the application and interpretation of Section 162(m) make it impossible to provide assurance that any performance based compensation will, in fact, satisfy the requirements for deductibility under Section 162(m). Time vested options and restricted stock unit awards will not be treated as performance based compensation and, as a result, the deductibility of such awards could be limited. Also, base salaries and other non-performance based compensation as defined in Section 162(m) in excess of $1.0 million paid to these executive officers in any year would not qualify for deductibility under Section 162(m).
81
Table of Contents
Index to Financial Statements
Summary of Compensation for Our Named Executive Officers
The following table shows the compensation of all individuals serving as our principal executive officer and principal financial officer during 2010 and of our three other most highly compensated executive officers serving as of December 31, 2010 whose total compensation exceeded $100,000 for the fiscal year ended December 31, 2010.
Summary Compensation Table
| Names and Principal Position |
Year | Salary ($) | Bonus ($) | Stock Awards ($) |
Non-Equity Incentive Option Awards ($) |
Plan Compen- sation Earnings |
Change in Pension Value and Nonqualified Deferred Compen- sation ($) |
All Other Compensation ($) |
Total ($) |
|||||||||||||||||||||||||||
| John Jordan(1) |
— | — | — | — | — | — | — | — | — | |||||||||||||||||||||||||||
| Phillip Lancaster(2) |
2010 | $ | 278,182 | $ | 570,000 | — | — | — | — | $ | 27,848 | $ | 876,030 | |||||||||||||||||||||||
| Former Chief Executive Officer |
||||||||||||||||||||||||||||||||||||
| David W. Sparkman(3) |
2010 | 103,125 | 100,000 | — | — | — | — | 12,205 | 215,330 | |||||||||||||||||||||||||||
| Chief Financial Officer and Executive Vice President |
||||||||||||||||||||||||||||||||||||
| Steven Williams(4) |
2010 | 105,583 | 50,000 | — | — | — | — | 10,454 | 166,037 | |||||||||||||||||||||||||||
| Former Chief Financial Officer |
||||||||||||||||||||||||||||||||||||
| Ronnie Roles |
2010 | 400,000 | 200,000 | — | — | — | — | 16,400 | 616,400 | |||||||||||||||||||||||||||
| Senior Vice President of Great White Pressure Control |
||||||||||||||||||||||||||||||||||||
| Danny Ward |
2010 | 332,692 | 62,500 | — | — | — | — | 13,998 | 409,190 | |||||||||||||||||||||||||||
| Senior Vice President of Directional Drilling Services |
||||||||||||||||||||||||||||||||||||
| Randall J. Holder |
2010 | 200,000 | 150,000 | — | — | — | — | 29,011 | 379,011 | |||||||||||||||||||||||||||
| General Counsel, Executive Vice President and Secretary |
||||||||||||||||||||||||||||||||||||
| (1) | Mr. Jordan became our Chief Executive Officer in March 2011 and his current base salary is $400,000. |
| (2) | Mr. Lancaster resigned as our Chief Executive Officer in November 2010 but continues as an employee under the terms of a retention agreement. |
| (3) | Mr. Sparkman became our Chief Financial Officer in July 2010. |
| (4) | Mr. Williams became our Chief Financial Officer in July 2009 and resigned in July 2010. |
The compensation included in the All Other Compensation column for (i) Mr. Lancaster consists of $10,785 attributable to personal use of a company automobile, $800 attributable to reimbursement of health care premiums, $12,347 attributable to our matching 401(k) contributions and $3,916 attributable to supplemental medical reimbursement coverage, (ii) Mr. Sparkman consists of $9,000 attributable to our matching 401(k) contributions and $3,205 attributable to supplemental medical reimbursement coverage, (iii) Mr. Williams consists of $4,500 for an automobile allowance, $800 attributable to reimbursement of health care premiums, $4,153 attributable to our matching 401(k) contributions and $1,002 attributable to supplemental medical reimbursement coverage, (iv) Mr. Ronnie Roles consists of $3,850 attributable to personal use of a company automobile, $1,050 attributable to reimbursement of health care premiums and $11,500 attributable to our matching 401(k) contributions, (v) Mr. Ward consists of amounts attributable to our matching 401(k) contributions, and (vi) Mr. Holder consists of $10,000 attributable to relocation expenses, $10,900 attributable to our matching 401(k) contributions and $8,111 attributable to supplemental medical reimbursement coverage.
82
Table of Contents
Index to Financial Statements
Employment Agreements
The following paragraphs summarize the material terms of the employment agreements of our named executive officers who are currently employed by us.
John Jordan. Effective as of March 1, 2011, we entered into an employment agreement with Mr. Jordan, our Chief Executive Officer. The employment agreement has a three-year term expiring on March 1, 2014 and provides for an annual base salary of $400,000. Subject to our attainment of certain performance goals, Mr. Jordan is eligible for an annual performance bonus in an amount up to $600,000, but shall receive a minimum annual bonus of $200,000. We also agreed to provide Mr. Jordan with a monthly vehicle allowance of $900, temporary lodging for a period of six months and up to $25,000 for relocation expenses. Mr. Jordan is also entitled to participate in certain benefit plans generally available to the Company’s executive officers, including life and medical insurance plans. Pursuant to the terms of his employment agreement, upon completion of this offering, Mr. Jordan shall be granted an option to acquire shares of our common stock in an amount equal to two percent of our common stock issued and outstanding immediately upon completion of the offering after giving effect to any equity awards granted to the Company’s officers, directors and employees at the time of the offering. Mr. Jordan has agreed to certain restrictive covenants in his employment agreement. These include his agreement not to compete in the oilfield services industry, not to interfere with any of our employees, suppliers or regulators and not to solicit our employees and customers for a period of 12 months following his termination. In the event that Mr. Jordan’s employment is terminated by us without “cause”, he will be entitled to his annual base salary through the remainder of the three-year term of his employment agreement, at the same times and in the same manner in which annual base salary was payable prior to termination, provided that Mr. Jordan executes a general release in our favor. In the event that Mr. Jordan is terminated due to death or disability, he will be entitled to the earned but unpaid annual base salary for the period prior to the effective date of his termination. For purposes of Mr. Jordan’s employment agreement, “cause” generally means Mr. Jordan’s: (a) willful and knowing refusal or failure to perform his duties in any material respect; (b) willful misconduct or gross negligence in performing his duties; (c) material breach of his employment agreement; (d) conviction or a plea of nolo contendere of a felony or material misdemeanor; (e) indictment for a felony involving embezzlement or theft or fraud; (f) filing of a voluntary petition in bankruptcy or consent to an involuntary petition in bankruptcy; or (g) failure to comply with directives of our board of directors.
Phillip Lancaster. Mr. Lancaster served as our Chief Executive Officer from July 2006 to November 16, 2010. In connection with this employment, Mr. Lancaster entered into a long term incentive award agreement with Management Services, one of our affiliates, in June 2008 under which he was granted a $2.0 million incentive award. This award was to vest in four equal installments of $500,000 beginning June 30, 2008 and ending on June 30, 2011, subject to Mr. Lancaster’s continuous employment with us or one of our affiliates, with installments payable in cash within 60 days after the vesting date unless we had initiated an initial public offering. In the event that Mr. Lancaster’s employment with us was terminated as result of his death or disability or without “cause” he would have been entitled to receive the pro rata portion of the award that would otherwise have vested on the next vesting date following such termination of employment, based on the number of days Mr. Lancaster was employed by us during the period beginning on July 1 and ending on his termination date. For purposes of his long term incentive award agreement, “cause” generally meant Mr. Lancaster’s: (a) indictment or conviction of any felony or of a misdemeanor involving fraud, dishonesty or moral turpitude; (b) commission of any act of fraud or dishonesty in the performance of his duties on behalf of us; (c) failure to comply with our lawful directives; or (d) breach of his obligations under the long term incentive award agreement. Mr. Lancaster also agreed to certain restrictive covenants in his long term incentive award agreement. These include his agreement not to recruit our employees or solicit our customers and suppliers for two years following his termination.
The terms of Mr. Lancaster’s long-term incentive award agreement were superceded by an employee retention agreement effective August 16, 2010, also with Management Services, under which he agreed to continue to serve as our Chief Executive Officer through November 16, 2010 at his existing base salary of
83
Table of Contents
Index to Financial Statements
$300,000 plus existing benefits and thereafter continue as an employee until November 16, 2011 at a base salary of $120,000 plus existing benefits. As a result, Mr. Lancaster is no longer involved in the management of the Company or its business. He does, however, remain available to provide consulting services to the Company’s management during the transition period ending November 16, 2011. In the employee retention agreement, Mr. Lancaster acknowledged (1) that $180,000 of the $500,000 incentive award that vested on June 30, 2010 had been paid to him, (2) that the remaining $320,000 would be paid in ten monthly installments of $30,000 with a final installment of $20,000 payable to him in the eleventh month and (3) that he would not be entitled to the fourth and final installment of his long term incentive award. Unless terminated prior to November 16, 2011 for “cause” or by reason of death or disability, Mr. Lancaster is also entitled under his employee retention agreement to receive a payment of $500,000 by December 15, 2011, which we refer to as a “continuation payment.” Pursuant to the terms of this agreement, upon a sale of all or substantially all the assets, accounts or the ownership of Great White Energy Services LLC or if there is a reorganization or consolidation of Management Services in connection with an initial public offering and either such transaction is completed on or before November 16, 2011, Mr. Lancaster will be entitled to receive a payment of $500,000, which we refer to as a “change of control payment,” provided that he remain with us for ninety days after the completion of such event, which date we refer to as a “qualifying date.” In the event that Mr. Lancaster is terminated without “cause” or in the event his employment is terminated by reason of death or permanent disability prior to a qualifying date, Mr. Lancaster or his beneficiaries, as the case may be, will be entitled to receive a payment of $500,000, which we refer to as a “severance payment,” in one lump sum payment within 60 days after the qualifying date if he is terminated without “cause” and within 30 days after the qualifying date if he is terminated by reason of death or permanent disability. Pursuant to the terms of the retention agreement, Mr. Lancaster is entitled to receive up to an aggregate of $500,000 for any continuation payment, change of control payment and severance payment to which he may be entitled and any such payment is conditioned on Mr. Lancaster executing a general release in our favor. For purposes of Mr. Lancaster’s employee retention agreement, “cause” generally means Mr. Lancaster’s: (a) conviction of any criminal violation involving dishonesty, fraud or moral turpitude; (b) failure to comply with our reasonable directives; or (c) material breach of his employee retention agreement. In connection with the completion of the offering, we will assume all obligations owed to Mr. Lancaster under his employee retention agreement.
David W. Sparkman. Effective as of May 16, 2011, we entered into an amended and restated employment agreement with Mr. Sparkman, our Chief Financial Officer. Mr. Sparkman’s annual base salary is currently $236,250 under his employment agreement, which salary is subject to adjustment in our sole discretion. Subject to our attainment of certain performance goals, Mr. Sparkman is eligible for a performance bonus in an amount up to 50% of his annual base salary per year. In accordance with the terms of his employment agreement, on May 26, 2011 we paid Mr. Sparkman a one-time discretionary bonus in the amount of $472,500, of which $59,062 shall be applied towards Mr. Sparkman’s 2011 annual bonus. We also agreed to provide Mr. Sparkman with an apartment for up to six months after the effective date of his employment agreement and, effective March 1, 2011, we further agreed to provide Mr. Sparkman with a $900 per month vehicle allowance. Mr. Sparkman is also entitled to participate in certain benefit plans which the Company sponsors, including, medical, dental, vacation and disability. Mr. Sparkman has agreed to certain restrictive covenants in his employment agreement. These include his agreement not to solicit our employees, customers and suppliers for a period of 12 months following his termination. In the event that Mr. Sparkman’s employment is terminated by us for any reason, other than for cause, during the twenty four months immediately following the effective date of his employment agreement, he will be entitled to receive monthly payments of his then current base salary for a period of six months after the date of his termination, provided that Mr. Sparkman executes a general release in our favor. Mr. Sparkman will not be entitled to such payments if he is terminated for “cause.” For purposes of Mr. Sparkman’s employment agreement, “cause” generally means Mr. Sparkman’s: (a) breach of duties as an employee which breach is detrimental to our company; (b) failure to comply in any material respect with any direction of the Company which reasonably relates to the performance of his duties; (c) failure to substantially perform his duties as an employee; (d) conviction or a plea of nolo contendere of a felony or a criminal act that constitutes a felony or involves fraud, dishonesty or moral turpitude; (e) commission of any act of fraud or dishonesty in the performance of his duties; (f) inability or failure to devote his full business time to his duties;
84
Table of Contents
Index to Financial Statements
(g) unsatisfactory results of any background verification; (h) taking any action, knowing or with reckless disregard, that is adverse in any material respect to our interests; (i) material violation of our policies; or (j) material breach of his employment agreement.
Steve Williams. Mr. Williams served as our Chief Financial Officer from July 2009 until July 2010. Under the terms of his employment agreement, Mr. Williams’ annual base salary was $200,000, which salary was subject to adjustment in our sole discretion. Mr. Williams was eligible for a performance bonus in amount up to 50% of his annual base salary per year subject to attainment of certain performance goals. Mr. Williams was also entitled to participate in certain benefit plans generally available to the Company’s executive officers, including, medical, dental, vacation and disability. Mr. Williams agreed to certain restrictive covenants in his employment agreement. These included his agreement not to solicit our employees, customers and suppliers for a period of 12 months following his termination. Under the terms of his employment agreement, in the event that Mr. Williams’ employment was terminated by us for any reason, other than for “cause,” during the twenty four months immediately following the effective date of his employment agreement, he would have been entitled to receive monthly payments of his then current base salary for a period of six months after the date of his termination, provided that Mr. Williams executed a general release in our favor. Mr. Williams would not have been entitled to receive such payments if he was terminated for “cause.” For purposes of Mr. Williams’ employment agreement, “cause” has the same meaning set forth in Mr. Sparkman’s employment agreement as described above. Mr. Williams resigned as our Chief Financial Officer and terminated his employment with the Company in July 2010. He did not receive any severance benefits in connection with his resignation or termination of employment.
Ronnie Roles. Effective June 1, 2011, we entered into an amended and restated employment agreement with Mr. Roles pursuant to which he serves as President of Great White Pressure Control LLC. The employment agreement has a three-year term expiring on May 31, 2014. Mr. Roles’ annual base salary is $400,000 under the terms of his employment agreement, which salary is subject to increases in our sole discretion. Mr. Roles was entitled to receive a $1.75 million signing bonus payable in two installments. The first installment of $1.0 million was paid upon the effectiveness of his initial employment agreement. The second installment of $750,000 shall be paid within fifteen days of June 1, 2011. Mr. Roles received an equity interest in Great White Pressure Control LLC in connection with his employment agreement. Upon the completion of this offering, Mr. Roles will receive approximately $1.3 million in exchange for that equity interest. In connection with this offering, Mr. Roles will also be entitled to receive restricted stock units under our 2011 Equity Incentive Plan with a value, based on the offering price to the public in this offering, of approximately $3.5 million. Mr. Roles is also permitted to participate in an annual incentive compensation plan, whereby Mr. Roles is eligible to receive a performance bonus in an amount up to 50% of his annual base salary per year subject to attainment of certain performance goals. In addition, Mr. Roles is entitled to receive cash incentive compensation in an amount up to $2.0 million. This cash incentive compensation is payable in $500,000 increments for each of 2012, 2013, 2014 and 2015 so long as Great White Pressure Control LLC’s EBITDA for the applicable fiscal year meets or exceeds the EBITDA target established for such fiscal year and Mr. Roles is employed by the Company at such time. Each cash incentive compensation payment will be paid to Mr. Roles within fifteen business days after completion and release of the audited financial statements for the applicable fiscal year. Mr. Roles is entitled to participate in certain benefit plans which the Company sponsors, including, medical insurance, dental insurance, 401k plan and life insurance. We also agreed to provide Mr. Roles with a vehicle under his employment agreement. Mr. Roles is subject to certain restrictive covenants under his employment agreement. These include his agreement not to compete with us, recruit our employees or solicit our customers and suppliers for one year following his termination.
In the event that Mr. Roles’ employment with us is terminated without “cause,” he will be entitled to his annual base salary through the remainder of the three-year term of his employment agreement, at the same times and in the same manner in which his annual base salary was payable prior to termination, cash incentive compensation payments that would have otherwise been payable had Mr. Roles remained employed with us and certain medical benefits. Either Mr. Roles or the company can terminate Mr. Roles’ employment agreement upon 30 days’ prior written notice if Mr. Roles becomes disabled. In such event, Mr. Roles will be entitled to receive
85
Table of Contents
Index to Financial Statements
his annual base salary and any other benefits due to him during such 30-day period. In all other events of termination, Mr. Roles will be entitled to receive his annual base salary and other benefits due to him through the effective date of his termination. For purposes of Mr. Roles employment agreement, “cause” generally means Mr. Roles’: (a) felony conviction of any criminal violation involving dishonesty, fraud or moral turpitude; (b) gross negligence or willful misconduct in the performance of his duties; (c) breach of trust or fiduciary duty; (d) willful failure to comply with our reasonable directives; or (e) material breach of his employment agreement.
Danny Ward. Effective as of September 1, 2008, we entered into an employment agreement with Mr. Ward, our Senior Vice President of Directional Drilling Services, with a term of three years. Mr. Ward’s annual base salary is currently $350,000 under his employment agreement. Subject to our attainment of certain performance goals, Mr. Ward is eligible for (i) a performance bonus in an amount up to $125,000 per year and (ii) a retention bonus of $50,000 per year. Mr. Ward is also entitled to such employee benefits as provided by the Company from to time to time to its employees generally. Mr. Ward has agreed to certain restrictive covenants in his employment agreement. These include his agreement not to compete with us or solicit our employees and customers for a period of six months following his termination. In the event that Mr. Ward’s employment is terminated by us without “cause” he will be entitled to his annual base salary through the remainder of the term of his employment agreement, at the same times and in the same manner in which his annual base salary was payable prior to termination, provided that any such payment is conditioned on Mr. Ward executing a general release and confidentiality agreement in our favor. For purposes of Mr. Ward’s employment agreement, “cause” generally means Mr. Ward’s: (i) breach or threatened breach of his employment agreement; (ii) breach of a fiduciary duty; (iii) misappropriation or fraudulent conduct with respect to assets of the Company; (iv) disregard of instruction of the board directors or other officers; (v) personal misconduct; or (vi) conviction of a felony or any crime involving fraud or dishonesty.
Randall J. Holder. Effective as of May 16, 2011, we entered into an amended and restated employment agreement with Mr. Holder, our General Counsel, under which his annual base salary is $210,000, subject to adjustment in our sole discretion. Subject to our attainment of certain performance goals, Mr. Holder is eligible for a performance bonus in an amount up to 50% of his annual base salary per year. In accordance with the terms of his employment agreement, on May 26, 2011 we paid Mr. Holder a one time discretionary bonus in the amount of $210,000. We also agreed to provide Mr. Holder with an apartment for six months after the effective date of his employment agreement. Mr. Holder is also entitled to participate in certain benefit plans which the Company sponsors, including, medical, dental, vacation and disability. Effective March 1, 2011, we also agreed to provide Mr. Holder with a $900 per month vehicle allowance. Mr. Holder has agreed to certain restrictive covenants in his employment agreement. These include his agreement not to solicit our employees, customers and suppliers for a period of 12 months following his termination. In the event that Mr. Holder’s employment is terminated by us for any reason, other than for cause, during the twenty-four months immediately following the effective date of his employment agreement, he will be entitled to receive monthly payments of his then current base salary for a period of six months after the date of his termination, provided that Mr. Holder executes a general release in our favor. Mr. Holder will not be entitled to such payments if he is terminated for “cause.” For purposes of Mr. Holder’s employment agreement, “cause” generally means Mr. Holder’s: (a) breach of duties as an employee which breach is detrimental to our company; (b) failure to comply in any material respect with any direction of the Company which reasonably relates to the performance of his duties; (c) failure to substantially perform his duties as an employee; (d) conviction or a plea of nolo contendere of a felony or a criminal act that constitutes a felony or involves fraud, dishonesty or moral turpitude; (e) commission of any act of fraud or dishonesty in the performance of his duties; (f) inability or failure to devote his full business time to his duties; (g) unsatisfactory results of any background verification; (h) taking any action, knowing or with reckless disregard, that is adverse in any material respect to our interests; (i) material violation of our policies; or (j) material breach of his employment agreement.
86
Table of Contents
Index to Financial Statements
Equity Incentive Plan
Prior to the completion of this offering, we did not have any stock option or other equity compensation plan and, as a result, there were no stock option or restricted stock unit grants or other equity awards granted to, or options exercises by, any of our named executive officers. Prior to this offering, we intend to implement our 2011 Equity Incentive Plan.
Eligible award recipients are employees, consultants and directors of our company and its affiliates. Incentive stock options may be granted only to our employees. Awards other than incentive stock options may be granted to employees, consultants and directors. The shares that may be issued pursuant to awards consist of our authorized but unissued common stock, and the maximum aggregate amount of such common stock which may be issued upon exercise of all awards under the plan, including incentive stock options, may not exceed 2,500,000, shares, subject to adjustment to reflect certain corporate transactions or changes in our capital structure. To the extent that an award is intended to qualify as performance-based compensation under Section 162(m) of the Internal Revenue Code, then the maximum number of shares of common stock issuable in the form of each type of award under the 2011 Equity Incentive Plan to any one participant during a calendar year shall not exceed 1,000,000 shares. Additionally, no participant shall receive in excess of the aggregate amount of 1,000,000 shares pursuant to all awards issued under the 2011 Equity Incentive Plan during any calendar year.
We anticipate granting options and restricted stock units to employees and certain non-employee directors under the plan upon completion of this offering in the amount to be determined by the compensation committee.
Share Reserve. The aggregate number of shares of common stock initially authorized for issuance under the plan is 2,500,000 shares. However, (i) shares covered by an award that expires or otherwise terminates without having been exercised in full and (ii) shares that are forfeited to, or repurchased by, us pursuant to a forfeiture or repurchase provision under the plan may return to the plan and be available for issuance in connection with a future award.
Administration. Our board of directors (or our compensation committee or any other committee of the board of directors as may be appointed by our board of directors from time to time) administers the plan. Among other responsibilities, the plan administrator selects participants from among the eligible individuals, determines the number of shares that will be subject to each award and determines the terms and conditions of each award, including methods of payment, vesting schedules and limitations and restrictions on awards. The plan administrator may amend, suspend, or terminate the plan at any time. Amendments will not be effective without stockholder approval if stockholder approval is required by applicable law or stock exchange requirements. Unless terminated earlier, the 2011 Equity Incentive Plan will terminate in July 2021.
Stock Options. Incentive and nonstatutory stock options are granted pursuant to incentive and nonstatutory stock option agreements. Employees, directors and consultants may be granted nonstatutory stock options, but only employees may be granted incentive stock options. The plan administrator determines the exercise price of a stock option, provided that the exercise price of a stock option generally cannot be less than 100% (and in the case of an incentive stock option granted to a more than 10% stockholder, 110%) of the fair market value of our common stock on the date of grant, except when assuming or substituting options in limited situations such as an acquisition. Generally, options granted under the plan vest ratably over a five-year period and have a term of ten years (five years in the case of an incentive stock option granted to a more than 10% stockholder), unless specified otherwise by the plan administrator in the option agreement.
Acceptable consideration for the purchase of common stock issued upon the exercise of a stock option will be determined by the plan administrator and may include (i) cash or check, (ii) a broker-assisted cashless exercise, (iii) the tender of common stock previously owned by the optionee, (iv) stock withholding and (v) other legal consideration approved by the plan administrator, such as exercise with a full recourse promissory note (not applicable for directors and executive officers).
87
Table of Contents
Index to Financial Statements
Unless the plan administrator provides otherwise (solely with respect to intervivos transfers to certain family members and estate planning vehicles), nonstatutory options generally are not transferable except by will or the laws of descent and distribution. An optionee may designate a beneficiary, however, who may exercise the option following the optionee’s death. Incentive stock options are not transferable except by will or the laws of descent and distribution.
Restricted Awards. Restricted awards are awards of either actual shares of common stock (e.g., restricted stock awards), or of hypothetical share units (e.g., restricted stock awards) having a value equal to the fair market value of an identical number of shares of common stock, that will be settled in the form of shares of common stock upon vesting or other specified payment date, and which may provide that such restricted awards may not be sold, transferred, or otherwise disposed of for such period as the plan administrator determines. The purchase price and vesting schedule, if applicable, of restricted awards are determined by the plan administrator. A restricted stock unit is similar to a restricted stock award except that participants holding restricted stock units do not have any stockholder rights until the stock unit is settled with shares. Stock units represent an unfunded and unsecured obligation for us and a holder of a stock unit has no rights other than those of a general creditor.
Performance Awards. Performance awards entitle the recipient to vest in or acquire shares of common stock, or hypothetical share units having a value equal to the fair market value of an identical number of shares of common stock that will be settled in the form of shares of common stock upon the attainment of specified performance goals. Performance awards may be granted independent of or in connection with the granting of any other award under the plan. Performance goals will be established by the plan administrator based on one or more business criteria that apply to the plan participant, a business unit, or our company and our affiliates. Performance goals will be objective and will be intended to meet the requirements of Section 162(m) of the Code. Performance goals must be determined prior to the time 25% of the service period has elapsed but not later than 90 days after the beginning of the service period. No payout will be made on a performance award granted to a named executive officer unless all applicable performance goals and service requirements are achieved. Performance awards may not be sold, assigned, transferred, pledged or otherwise encumbered and terminate upon the termination of the participant’s service to us or our affiliates.
Stock Appreciation Rights. Stock appreciation rights may be granted independent of or in tandem with the granting of any option under the plan. Stock appreciation rights are granted pursuant to stock appreciation rights agreements. The exercise price of a stock appreciation right granted independent of an option is determined by the plan administrator, but as a general rule will be no less than 100% of the fair market value of our common stock on the date of grant. The exercise price of a stock appreciation right granted in tandem with an option is the same as the exercise price of the related option. Upon the exercise of a stock appreciation right, we will pay the participant an amount equal to the product of (i) the excess of the per share fair market value of our common stock on the date of exercise over the strike price, multiplied by (ii) the number of shares of common stock with respect to which the stock appreciation right is exercised. Payment will be made in cash, delivery of stock, or a combination of cash and stock as deemed appropriate by the plan administrator.
Adjustments in capitalization. In the event that there is a specified type of change in our common stock without the receipt of consideration by us, such as pursuant to a merger, consolidation, reorganization, recapitalization, reincorporation, stock dividend, dividend in property other than cash, stock split, liquidating dividend, combination of shares, exchange of shares, change in corporate structure or other transaction, appropriate adjustments will be made to the various limits under, and the share terms of, the plan including (i) the number and class of shares reserved under the plan, (ii) the maximum number of stock options and stock appreciation rights that can be granted to any one person in a calendar year and (iii) the number and class of shares and exercise price, strike price, or purchase price, if applicable, of all outstanding stock awards.
Corporate Transactions. In the event of a change in control transaction (other than a transaction resulting in Wexford or an entity controlled by, or under common control with Wexford maintaining direct or indirect control over the Company), or a corporate transaction such as a dissolution or liquidation of our company, or any
88
Table of Contents
Index to Financial Statements
corporate separation or division, including, but not limited to, a split-up, a split-off or a spin-off, or a sale in one or a series of related transactions, of all or substantially all of the assets of our company or a merger, consolidation, or reverse merger in which we are not the surviving entity, then all outstanding stock awards under the plan may be assumed, continued or substituted for by any surviving or acquiring entity (or its parent company), or may be cancelled either with or without consideration for the vested portion of the awards, all as determined by the plan administrator. In the event an award would be cancelled without consideration paid to the extent vested, the award recipient may exercise the award in full or in part for a period of ten days.
401(k) Plan
We participate in a multi-employer 401(k) Plan with affiliates of ours. Employees may elect to defer a portion of their compensation up to the statutorily prescribed limit. Each pay period we make a matching contribution to each employee’s deferral, not to exceed six percent. An employee’s interests in his or her deferrals are 100% vested when contributed. An employee’s interests in the matching contribution are vested at the rate of 20% for each completed year of eligibility. The 401(k) Plan is intended to qualify under Section 401(a) of the Internal Revenue Code. As such, contributions to the 401(k) Plan and earnings on those contributions are not taxable to the employee until distributed from the 401(k) Plan, and all contributions are deductible by us when made.
Potential Payments upon Termination and Following a Change in Control
The following table shows the estimated benefits payable upon a hypothetical termination of employment of our named executive officers under various termination scenarios as of December 31, 2010:
| Termination Without Cause | Termination on Change in Control | |||||||||||||||||||||||||||||||
| Name |
Base Salary | Benefits | Other | Total | Base Salary | Benefits | Other | Total | ||||||||||||||||||||||||
| John Jordan(1) |
$ | 1,200,000 | (2) | $ | 0 | $ | 0 | $ | 1,200,000 | $ | — | (3) | $ | 0 | $ | 0 | $ | — | (3) | |||||||||||||
| Phillip Lancaster(4) |
0 | 0 | 500,000 | (5) | 500,000 | 0 | 0 | 500,000 | (6) | 500,000 | ||||||||||||||||||||||
| David W. Sparkman(7) |
113,000 | (8) | 0 | 0 | 113,000 | 113,000 | 0 | 0 | 113,000 | |||||||||||||||||||||||
| Ronnie G. Roles |
650,000 | (9) | 28,000 | (10) | 0 | (11) | 678,000 | 650,000 | 28,000 | 0 | 678,000 | |||||||||||||||||||||
| Danny Ward |
233,333 | (8) | 0 | 0 | 233,333 | 233,333 | 0 | 0 | 233,333 | |||||||||||||||||||||||
| Randall J. Holder |
100,000 | (8) | 0 | 0 | 100,000 | 200,000 | 0 | 0 | 200,000 | |||||||||||||||||||||||
| (1) | Mr. Jordan was hired in March 2011. The amounts payable under this table assume he was employed on December 31, 2010. |
| (2) | Represents the severance amount set forth in Mr. Jordan’s employment agreement and is equal to his annual base salary for the remainder of the term of his employment agreement, which expires March 1, 2014. |
| (3) | As described in his employment agreement, upon a sale of all or substantially all of the assets or equity of GWH during the three-year term of Mr. Jordan’s employment agreement, Mr. Jordan will be entitled to a payment of two percent of the amount equal to the difference between the net proceeds from such sale and the market value of GWH as determined by Wexford. |
| (4) | Mr. Lancaster resigned as our Chief Executive Officer in November 2010 but continues as an employee under the terms of a retention agreement. In addition to the amounts described in the above table, Mr. Lancaster is entitled to receive a payment of $500,000 upon a termination due to his death or disability under his employee retention agreement. |
| (5) | Represents the severance amount set forth in Mr. Lancaster’s employee retention agreement. |
| (6) | Represents the continuation payment set forth in Mr. Lancaster’s employee retention agreement. |
| (7) | Mr. Sparkman was hired in July 2010. |
| (8) | Represents the severance amount set forth in Messrs. Sparkman’s, Ward’s and Holder’s employment agreements, respectively, and is equal to six months base salary. |
| (9) | Represents the severance amount set forth in Mr. Roles’ employment agreement in effect at December 31, 2010. The severance amount is equal to Mr. Roles’ base salary for the remainder of the term of his employment agreement, which expires on August 20, 2012. |
89
Table of Contents
Index to Financial Statements
| (10) | Represents medical coverage for the remainder of the term of Mr. Roles’ employment agreement, which expires on August 20, 2012. |
| (11) | Does not include amounts payable as the second installment of such executive’s initial signing bonus. See “—Employment Agreements” above. |
Limitations on Liability and Indemnification of Officers and Directors
Certificate of Incorporation and Bylaws
Our certificate of incorporation provides that no director shall be personally liable to us or any of our stockholders for monetary damages resulting from breaches of their fiduciary duty as directors, except to the extent such limitation on or exemption from liability is not permitted under the Delaware General Corporation Law, or DGCL. The effect of this provision of our certificate of incorporation is to eliminate our rights and those of our stockholders (through stockholders’ derivative suits on our behalf) to recover monetary damages against a director for breach of the fiduciary duty of care as a director, including breaches resulting from negligent or grossly negligent behavior, except, as restricted by the DGCL:
| • | for any breach of the director’s duty of loyalty to the company or its stockholders; |
| • | for acts or omissions not in good faith or that involve intentional misconduct or a knowing violation of law; |
| • | in respect of certain unlawful dividend payments or stock redemptions or repurchases; and |
| • | for any transaction from which the director derives an improper personal benefit. |
This provision does not limit or eliminate our rights or the rights of any stockholder to seek non-monetary relief, such as an injunction or rescission, in the event of a breach of a director’s duty of care.
Our certificate of incorporation also provides that we will, to the fullest extent permitted by Delaware law, indemnify our directors and officers against losses that they may incur in investigations and legal proceedings resulting from their service.
Our bylaws include provisions relating to advancement of expenses and indemnification rights consistent with those provided in our certificate of incorporation. In addition, our bylaws provide:
| • | for a right of indemnitee to bring a suit in the event a claim for indemnification or advancement of expenses is not paid in full by us within a specified period of time; and |
| • | permit us to purchase and maintain insurance, at our expense, to protect us and any of our directors, officers and employees against any loss, whether or not we would have the power to indemnify that person against that loss under Delaware law. |
Indemnification Agreements
We will enter into indemnification agreements with each of our current directors and executive officers effective upon the closing of this offering. These agreements require us to indemnify these individuals to the fullest extent permitted under Delaware law against liabilities that may arise by reason of their service to us, and to advance expenses incurred as a result of any proceeding against them as to which they could be indemnified. We also intend to enter into indemnification agreements with our future directors and executive officers.
Liability Insurance
We intend to provide liability insurance for our directors and officers, including coverage for public securities matters. There is no pending litigation or proceeding involving any of our directors, officers or employees for which indemnification from us is sought, except that we agreed to pay all legal fees and related expenses of the defendants in the Cudd litigation. We are not aware of any threatened litigation that may result in claims for indemnification from us.
90
Table of Contents
Index to Financial Statements
Review and Approval of Related Party Transactions
We do not currently have a written policy regarding the review and approval of related party transactions, but intend to implement such policy in connection with, and prior to the completion of, this offering. In connection with this offering, we will establish an audit committee consisting solely of independent directors whose functions will be set forth in the audit committee charter. We anticipate that one of the audit committee’s functions will be to review and approve all relationships and transactions in which we and our directors, director nominees and executive officers and their immediate family members, as well as holders of more than 5% of any class of our voting securities and their family members, have a direct or indirect material interest. We anticipate that such policy will be a written policy included as part the audit committee charter that will be implemented by the audit committee and in the Code of Business Conduct and Ethics that our board of directors will adopt prior to the completion of this offering.
Historically, the review and approval of related party transactions have been the responsibility of our management, and all of the transactions discussed under “Related Party Transactions” below have been approved by the management, subject to a conflicts of interest policy set forth in our employee handbook, pursuant to which all of our employees must avoid any situations where their personal outside interest could conflict, or even appear to conflict, with the interests of the Company. Although management believes that the terms of the related party transactions described below are reasonable, it is possible that we could have negotiated more favorable terms for such transactions with unrelated third parties.
Our management will continue to review and approve related party transactions, subject to the above-referenced conflicts of interest policy, until the adoption of the policy regarding the review and approval of such transactions by the audit committee in connection with and prior to the closing of this offering.
Office Space and Service Centers
We lease our corporate headquarters in Oklahoma City, Oklahoma from Caliber Investment Group LLC, an entity controlled by Wexford. The lease has a term of ten years with a commencement date of December 10, 2007. Our monthly base rent will be $31,358 through November 30, 2012 and $33,744 from December 1, 2012 through November 30, 2017. Prior to February 2011, a portion of this rent was borne by certain of our affiliates. For the three months ended March 31, 2011 and the years ended December 31, 2010, 2009 and 2008, we were allocated approximately $90,000, $334,000, $87,000 and $76,000, respectively, under this lease.
We lease four of our service centers from Caliber Development Group LLC. Two service centers are located in Oklahoma City, Oklahoma and one is located in each of Elk City, Oklahoma and Lindsay, Oklahoma. We lease one service center in Mills, Wyoming from Caliber Wyoming Properties, LLC and another service center in Odessa, Texas from Caliber Texas Properties LP. Each of these lessors is an entity controlled by Wexford. Each of these leases has a term of 20 years and we have the right to extend each lease for up to two additional five year periods. The leases have commencement dates between July 1, 2006 and June 1, 2007 and monthly rents ranging from approximately $2,000 to $29,000 per location. For the three months ended March 31, 2011 and the years ended December 31, 2010, 2009 and 2008, we paid $246,539, $930,881, $965,971 and $857,777, respectively, for the six service centers leased from Caliber Development Group LLC, Caliber Wyoming Properties, LLC and Caliber Texas Properties LP, collectively.
Master Service Agreements and Other Service Arrangements
On March 3, 2008, we entered into a master service agreement to provide oilfield services to Windsor Energy Group LLC, or WEG, an entity owned by CD Holding Company, LLC and Liddell Investments LLC. Charles E. Davidson, one of our director nominees, is the manager and a member of CD Holding Company, LLC and chairman and chief investment officer of Wexford, and Mike Liddell, another of our director nominees, is
91
Table of Contents
Index to Financial Statements
the sole member of Liddell Investments LLC. For the years ended December 31, 2009 and 2008, we billed WEG $350,360 and $1,004,122, respectively, for such services. These costs were ultimately billed to the working interest owners, some of whom are affiliates of Wexford. We no longer provide services to WEG under this agreement, and there are no amounts currently outstanding.
On January 1, 2010, we entered into a master service agreement to provide oilfield services to Gulfport Energy Corporation, or Gulfport, an entity in which an affiliate of Wexford currently owns approximately 18.0% of its outstanding common stock. In addition, Mike Liddell, one of our director nominees, is the chairman of the board of Gulfport. For the three months ended March 31, 2011 and the years ended December 31, 2010, 2009 and 2008, we provided $804,449, $3,079,620, $1,243,318 and $0, respectively, in oilfield services to Gulfport Energy Corporation. As of March 31, 2011, we were owed $1,380,961 by Gulfport for such services.
Since April 2008, we have provided oilfield services to Windsor Permian LLC, an entity controlled by Wexford. For the three months ended March 31, 2011 and years ended December 31, 2010, 2009 and 2008, we provided $5,991,391, $10,667,865, $3,228,317 and $309,455, respectively, in services to Windsor Permian LLC. As of March 31, 2011, we were owed $2,209,369, by Windsor Permian LLC for such services. Either of the parties may terminate this arrangement at any time.
Manufacturing Contracts
From time to time we enter into manufacturing and service agreements with Serva Group LLC, an entity controlled by Wexford, to build and service equipment for us. For the three months ended March 31, 2011 and the years ended December 31, 2010, 2009 and 2008, we paid $11,076,963, $11,880,509, $5,892,541 and $1,123,676, respectively, to Serva Group LLC for equipment it built and/or serviced for us.
Advisory Services Agreement
Prior to the closing of this offering we will enter into an advisory services agreement with Wexford under which Wexford will provide us with financial and strategic advisory services related to our business in return for an annual fee of $500,000, plus reasonable out-of-pocket expenses. This agreement has a term of two years commencing on the completion of this offering. The parties may extend the then current term for additional one-year periods by entering into a written agreement reflecting the terms of such extension at least ten days prior to the expiration of the then current term. The agreement may be terminated at any time by either party upon 30 days’ prior written notice. In the event we terminate the agreement, we are obligated to pay all amounts due through the remaining term of the agreement. In addition, in this agreement we have agreed to pay Wexford to-be-negotiated market-based fees approved by our independent directors for such services as may be provided by Wexford at our request in connection with future acquisitions and divestitures in which we may be involved. The services provided by Wexford under the advisory services agreement will not extend to our day-to-day business or operations.
Shared Service Agreement
Beginning March 1, 2007, Everest Operations Management, LLC, or Everest, an entity controlled by Wexford, has provided tax, management and telephone services to us. This arrangement continues on a month-to-month basis until cancelled by either party upon 30 days’ prior written notice. For the three months ended March 31, 2011 and the years ended December 31, 2010, 2009 and 2008, we paid approximately $132,000, $265,000, $0 and $0, respectively, under this arrangement. In May 2011, we began providing information technology services to Everest. This arrangement continues on a month-to-month basis until cancelled by either party upon 30 days’ prior written notice. Everest pays us approximately $23,500 each month for these services.
On July 22, 2006, we entered into a shared services agreement with Gulfport. Gulfport provided us with human resources, administrative, accounting, legal, treasury and information technology services under this agreement. All services under this agreement ceased in January 2007, although we owe continuing indemnification obligations to Gulfport in connection with the pending Cudd litigation. See
92
Table of Contents
Index to Financial Statements
“Business—Legal Proceedings” beginning on page 70 of this prospectus. For the three months ended March 31, 2011 and the years ended December 31, 2010, 2009, 2008, we paid Gulfport $0, $0, $32,492 and $106,654, respectively, as reimbursement for its attorneys’ fees and expenses.
IT Services
Since January 2010, Management Services has provided information technology services to us on a month-to-month basis. For the three months ended March 31, 2011 and the year ended December 31, 2010 we incurred approximately $147,000 and $588,000, respectively under this arrangement.
Credit Facility
On June 29, 2007, our subsidiaries Great White Pressure Control LLC and Acid, Inc, together with certain of their affiliates, entered into a $30.0 million revolving line of credit agreement with a financial institution, as discussed in more detail under “Management’s Discussion and Analysis of Financial Condition and Results of Operations—Liquidity and Capital Resources—Credit Facilities” on page 50. All of our obligations under this credit agreement were extinguished by Diamondback Holdings as of December 31, 2010 in connection with the contribution.
Ownership Interests of Certain Directors
Each of Charles E. Davidson, Arthur H. Amron and Steven E. West, principals of Wexford, and Mike Liddell has a direct or indirect interest in one or more Wexford entities described above.
Indemnification
In connection with the Cudd litigation discussed in more detail under “Business—Legal Proceedings” on page 70, we entered into an indemnification agreement with one of our executive officers who is party to the Cudd litigation, which indemnification agreement was included as part of such executive officer’s employment agreement with us. Under the employment agreement, we agreed to limit such executive officer’s indemnification obligation to us to the second bonus installment provided by his employment agreement and postponed the payment of that second bonus installment until the Cudd litigation was fully resolved. Effective June 1, 2011, the employment agreement with such executive officer was amended and restated to, among other things, remove the limitation on the amount of such executive officer’s liability to us in connection with the Cudd litigation and provide for the payment of the second bonus installment to such executive within fifteen days of June 1, 2011. For additional information regarding this amended and restated employment agreement and the second bonus installment, see “Management—Employment Agreements” beginning on page 83 of this prospectus. Under the amended and restated employment agreement, we also released the executive’s indemnity obligation to us with respect to the Cudd litigation to the extent of matters contained in the documents produced and testimony given in the Cudd litigation as of June 1, 2011. In addition, we agreed to pay all of his legal fees and related costs and expenses pertaining to the Cudd litigation, regardless of any provisions to the contrary set forth in the amended and restated employment agreement. We incurred $350,428 in such legal fees and related expenses as of March 31, 2011. In the event the executive voluntarily terminates his employment with us or in the event we terminate his employment with us for good cause, the limitations on the executive’s indemnification obligations to us will no longer apply. The executive’s indemnity obligations contemplated by the amended and restated employment agreement will terminate upon his death.
Other Related Party Arrangement
Mr. Ronnie Roles is our Senior Vice President of Pressure Control Services. Mr. Ronnie Roles’ brother, Mr. Rocky Roles, is a non executive officer of the Company. Under an amended and restated employment agreement, dated June 1, 2011 and expiring March 31, 2014, Mr. Rocky Roles serves as Executive Vice
93
Table of Contents
Index to Financial Statements
President of Coil Tubing, Nitrogen and Wireline Services of Great White Pressure Control LLC with an annual base salary of $300,000. Under his employment agreement, Mr. Rocky Roles was entitled to receive a $1.5 million signing bonus payable in two installments. The first installment of $1.0 million was paid upon the effectiveness of the employment agreement in August 2006. The second installment of $500,000 will be paid in June 2011. Mr. Rocky Roles also received an equity interest in Great White Pressure Control LLC in connection with his employment agreement. Upon completion of this offering, Mr. Rocky Roles will receive approximately $855,000 in exchange for that equity interest and will also be entitled to receive restricted stock units under our 2011 Equity Incentive Plan with a value, based on the offering price to the public in this offering, of approximately $2.3 million. Mr. Rocky Roles is also permitted to participate in an annual incentive compensation plan whereby Mr. Rocky Roles is eligible to receive a performance bonus in an amount up to 50% of his annual base salary per year. In addition, Mr. Rocky Roles is entitled to receive cash incentive compensation in an amount up to $2.0 million. This cash incentive compensation is payable in $500,000 increments for each of 2012, 2013, 2014 and 2015 so long as Great White Pressure Control LLC’s EBITDA for the applicable fiscal year meets or exceeds the EBITDA target established for such fiscal year and Mr. Rocky Roles is employed by the Company at such time. In the event that Mr. Rocky Roles’ employment with us is terminated without cause, he will be entitled to receive his annual base salary, cash incentive compensation and other benefits for the remainder of the term of his employment agreement. Mr. Rocky Roles received approximately $460,000 in total compensation for 2010.
94
Table of Contents
Index to Financial Statements
PRINCIPAL AND SELLING STOCKHOLDERS
The following table sets forth certain information with respect to the beneficial ownership of our common stock by:
| • | each selling stockholder; |
| • | each stockholder known by us to be the beneficial owner of more than five percent of the outstanding shares of our common stock; |
| • | each of our directors and nominees for director; |
| • | each of our named executive officers; and |
| • | all of our directors and executive officers as a group. |
Except as otherwise indicated, we believe that each of the stockholders named in this table has sole voting and investment power with respect to the shares indicated as beneficially owned.
| Name of Beneficial Owner |
Shares Beneficially Owned Prior to Offering |
Number of Shares Offered |
Shares Beneficially Owned After Offering(1) |
Shares to be Sold if Over-Allotment Option is Exercised in Full |
Shares Beneficially Owned After Offering if Over-Allotment Option is Exercised in Full |
|||||||||||||||||||||||||||
| Number | Percentage | Number | Percentage | Number | Percentage | |||||||||||||||||||||||||||
| GWES Holdings LLC(2) |
28,456,554 | 65.0 | % | 7,312,500 | 21,144,054 | (3) | 46.9 | %(3) | 1,218,750 | 19,925,304 | (3) | 44.3 | %(3) | |||||||||||||||||||
| Diamondback Holdings, LLC(2) |
15,322,760 | 35.0 | % | 3,937,500 | 11,385,260 | (3) | 25.3 | %(3) | 656,250 | 10,729,010 | (3) | 23.8 | %(3) | |||||||||||||||||||
| Executive Officers and Directors: |
||||||||||||||||||||||||||||||||
| John Jordan(3) |
— | — | — | — | — | — | — | — | ||||||||||||||||||||||||
| David W. Sparkman |
— | — | — | — | — | — | — | — | ||||||||||||||||||||||||
| Ronnie G. Roles(4) |
— | — | — | — | — | — | — | — | ||||||||||||||||||||||||
| William E. Haley |
— | — | — | — | — | — | — | — | ||||||||||||||||||||||||
| Danny Ward |
— | — | — | — | — | — | — | — | ||||||||||||||||||||||||
| Randall J. Holder |
— | — | — | — | — | — | — | — | ||||||||||||||||||||||||
| Steven E. West(5)* |
— | — | — | — | — | — | — | — | ||||||||||||||||||||||||
| Arthur H. Amron(5)** |
— | — | — | — | — | — | — | — | ||||||||||||||||||||||||
| Charles E. Davidson(2)(5)** |
43,779,314 | 100 | % | — | 32,529,314 | (6) | 72.2 | %(6) | — | 30,654,314 | (6) | 68.1 | %(6) | |||||||||||||||||||
| David L. Houston(5)** |
— | — | — | — | — | — | — | — | ||||||||||||||||||||||||
| Douglas Lambert(5)** |
— | — | — | — | — | — | — | — | ||||||||||||||||||||||||
| Mike Liddell(3)(5)** |
— | — | — | — | — | — | — | — | ||||||||||||||||||||||||
| Mark L. Plaumann** |
— | — | — | — | — | — | — | — | ||||||||||||||||||||||||
| All executive officers and directors as a group (7 persons) |
— | — | — | — | — | — | — | — | ||||||||||||||||||||||||
| * | Director |
| ** | Director Nominee |
| (1) | Percentage of beneficial ownership is based upon 43,779,314 shares of common stock outstanding immediately prior to the offering, after giving effect to the merger, and 45,029,314 shares of common stock outstanding after the offering. The table assumes no exercise of the underwriters’ over-allotment option. For purposes of this table, a person or group of persons is deemed to have “beneficial ownership” of any shares which such person has the right to acquire within 60 days. For purposes of computing the percentage of outstanding shares held by each person or group of persons named above, any security which such person or group of persons has the right to acquire within 60 days is deemed to be outstanding for the purpose of computing the percentage ownership for such person or persons, but is not deemed to be outstanding for the purpose of computing the percentage ownership of any other person. As a result, the denominator used in calculating the beneficial ownership among our stockholders may differ. |
| (2) | Wexford is the sole manager of each of GWES Holdings and Diamondback Holdings and may, by reason of such status, may be deemed to own beneficially the interest in the shares of our common stock held by GWES Holdings and Diamondback Holdings. Each of Charles E. Davidson, one of our director nominees, and Joseph M. Jacobs may, by reason of his status as a controlling person of Wexford, be deemed to beneficially own the interests in the shares of our common stock of which GWES Holdings and Diamondback Holdings possess beneficial ownership. Each of Charles E. Davidson, Joseph M. Jacobs and Wexford shares the power to vote and to dispose of the interests in the shares of our common stock |
95
Table of Contents
Index to Financial Statements
| held by GWES Holdings and Diamondback Holdings. Each of Messrs. Davidson and Jacobs disclaims beneficial ownership of the shares of our common stock owned by GWES Holdings, Diamondback Holdings and Wexford. Wexford’s address is Wexford Plaza, 411 West Putnam Avenue, Greenwich, Connecticut 06830. |
| (3) | Excludes options to purchase 935,819 shares of our common stock to be granted to our Chief Executive Officer under our 2011 Equity Incentive Plan, based on an assumed public offering price of $20.00 per share (which is the midpoint of the range set forth on the cover of this prospectus), following the closing of this offering under the terms of his employment agreement, which options will vest in four equal annual installments beginning on March 1, 2012. |
| (4) | Excludes 175,118 restricted stock units to be granted to Mr. Roles under our 2011 Equity Incentive Plan, based on an assumed public offering price of $20.00 per share (which is the midpoint of the range set forth on the cover of this prospectus), following the closing of this offering under the terms of his employment agreement, which restricted stock units will not be subject to forfeiture and will have a settlement date that is 181 days after the closing of this offering. |
| (5) | Excludes 6,666 restricted stock units to be granted to each non-employee director under our 2011 Equity Incentive Plan following the closing of this offering, which will vest in three equal annual installments at the end of each year in the three-year period from the time of the grant. |
| (6) | In connection with this offering, an aggregate of 3,252,931 shares of common stock (or 3,065,431 shares of common stock if the over-allotment option is exercised in full) will be distributed to Mike Liddell by GWES Holdings and Diamondback Holdings in respect of Mr. Liddell’s interests in GWES Holdings and Diamondback Holdings, which will reduce the percentage of shares of common stock beneficially owned by GWES Holdings and Diamondback Holdings after the offering to 42.3% and 22.8%, respectively (or to 39.8% and 21.4%, respectively, if the over-allotment option is exercised in full). Following such distribution, Mr. Liddell will beneficially own approximately 7.2% of our outstanding common stock (or 6.8% of our outstanding common stock if the over-allotment option is exercised in full). |
96
Table of Contents
Index to Financial Statements
We will amend and restate our certificate of incorporation and bylaws in connection with this offering. The following description of our common stock, certificate of incorporation and our bylaws are summaries thereof and are qualified by reference to our certificate of incorporation and our bylaws as so amended and restated, copies of which will be filed with the SEC as exhibits to the registration statement of which this prospectus is a part.
Our authorized capital stock consists of 100,000,000 shares of common stock, par value $0.01 per share, and 10,000,000 shares of preferred stock, par value $0.01 per share. We have applied to have our shares of common stock listed on The NASDAQ Global Market under the symbol “JAWS.”
Common Stock
Holders of shares of common stock are entitled to one vote per share on all matters submitted to a vote of stockholders. Shares of common stock do not have cumulative voting rights, which means that the holders of more than 50% of the shares voting for the election of the board of directors can elect all the directors to be elected at that time, and, in such event, the holders of the remaining shares will be unable to elect any directors to be elected at that time. Our certificate of incorporation denies stockholders any preemptive rights to acquire or subscribe for any stock, obligation, warrant or other securities of ours. Holders of shares of our common stock have no redemption or conversion rights nor are they entitled to the benefits of any sinking fund provisions.
In the event of our liquidation, dissolution or winding up, holders of shares of common stock shall be entitled to receive, pro rata, all the remaining assets of our company available for distribution to our stockholders after payment of our debts and after there shall have been paid to or set aside for the holders of capital stock ranking senior to common stock in respect of rights upon liquidation, dissolution or winding up the full preferential amounts to which they are respectively entitled.
Holders of record of shares of common stock are entitled to receive dividends when and if declared by the board of directors out of any assets legally available for such dividends, subject to both the rights of all outstanding shares of capital stock ranking senior to the common stock in respect of dividends and to any dividend restrictions contained in debt agreements. All outstanding shares of common stock and any shares sold and issued in this offering will be fully paid and nonassessable by us.
Preferred Stock
Our board of directors is authorized to issue up to 10,000,000 shares of preferred stock in one or more series. The board of directors may fix for each series:
| • | the distinctive serial designation and number of shares of the series; |
| • | the voting powers and the right, if any, to elect a director or directors; |
| • | the terms of office of any directors the holders of preferred shares are entitled to elect; |
| • | the dividend rights, if any; |
| • | the terms of redemption, and the amount of and provisions regarding any sinking fund for the purchase or redemption thereof; |
| • | the liquidation preferences and the amounts payable on dissolution or liquidation; |
| • | the terms and conditions under which shares of the series may or shall be converted into any other series or class of stock or debt of the corporation; and |
| • | any other terms or provisions which the board of directors is legally authorized to fix or alter. |
97
Table of Contents
Index to Financial Statements
We do not need stockholder approval to issue or fix the terms of the preferred stock. The actual effect of the authorization of the preferred stock upon your rights as holders of common stock is unknown until our board of directors determines the specific rights of owners of any series of preferred stock. Depending upon the rights granted to any series of preferred stock, your voting power, liquidation preference or other rights could be adversely affected. Preferred stock may be issued in acquisitions or for other corporate purposes. Issuance in connection with a stockholder rights plan or other takeover defense could have the effect of making it more difficult for a third party to acquire, or of discouraging a third party from acquiring, control of our company. We have no present plans to issue any shares of preferred stock.
Related Party Transactions and Corporate Opportunities
Subject to the limitations of applicable law, our certificate of incorporation, among other things:
| • | permits us to enter into transactions with entities in which one or more of our officers or directors are financially or otherwise interested so long as it has been approved by our board of directors; |
| • | permits any of our stockholders, officers or directors to conduct business that competes with us and to make investments in any kind of property in which we may make investments; and |
| • | provides that if any director or officer of one of our affiliates who is also one of our officers or directors becomes aware of a potential business opportunity, transaction or other matter (other than one expressly offered to that director or officer in writing solely in his or her capacity as our director or officer), that director or officer will have no duty to communicate or offer that opportunity to us, and will be permitted to communicate or offer that opportunity to such affiliates and that director or officer will not be deemed to have (i) acted in a manner inconsistent with his or her fiduciary or other duties to us regarding the opportunity or (ii) acted in bad faith or in a manner inconsistent with our best interests. |
Anti-takeover Effects of Provisions of Our Certificate of Incorporation and Our Bylaws
Some provisions of our certificate of incorporation and our bylaws contain provisions that could make it more difficult to acquire us by means of a merger, tender offer, proxy contest or otherwise, or to remove our incumbent officers and directors. These provisions, summarized below, are expected to discourage coercive takeover practices and inadequate takeover bids. These provisions are also designed to encourage persons seeking to acquire control of us to first negotiate with our board of directors. We believe that the benefits of increased protection of our potential ability to negotiate with the proponent of an unfriendly or unsolicited proposal to acquire or restructure us outweigh the disadvantages of discouraging such proposals because negotiation of such proposals could result in an improvement of their terms.
Undesignated preferred stock. The ability to authorize and issue undesignated preferred stock may enable our board of directors to render more difficult or discourage an attempt to change control of us by means of a merger, tender offer, proxy contest or otherwise. For example, if in the due exercise of its fiduciary obligations, the board of directors were to determine that a takeover proposal is not in our best interest, the board of directors could cause shares of preferred stock to be issued without stockholder approval in one or more private offerings or other transactions that might dilute the voting or other rights of the proposed acquirer or insurgent stockholder or stockholder group.
Stockholder meetings. Our certificate of incorporation and bylaws provide that a special meeting of stockholders may be called only by the Chairman of the Board, the Chief Executive Officer or by a resolution adopted by a majority of the total number of directors our board of directors would have if there were no vacancies.
Requirements for advance notification of stockholder nominations and proposals. Our bylaws establish advance notice procedures with respect to stockholder proposals and the nomination of candidates for election as directors, other than nominations made by or at the direction of the board of directors.
98
Table of Contents
Index to Financial Statements
Stockholder action by written consent. Our bylaws provide that, except as may otherwise be provided with respect to the rights of the holders of preferred stock, no action that is required or permitted to be taken by our stockholders at any annual or special meeting may be effected by written consent of stockholders in lieu of a meeting of stockholders, unless the action to be effected by written consent of stockholders and the taking of such action by such written consent have expressly been approved in advance by our board. This provision, which may not be amended except by the affirmative vote of at least 66 2/3% of the voting power of all then outstanding shares of capital stock entitled to vote generally in the election of directors, voting together as a single class, makes it difficult for stockholders to initiate or effect an action by written consent that is opposed by our board.
Amendment of the Bylaws. Under Delaware law, the power to adopt, amend or repeal bylaws is conferred upon the stockholders. A corporation may, however, in its certificate of incorporation also confer upon the board of directors the power to adopt, amend or repeal its bylaws. Our certificate of incorporation and bylaws grant our board the power to adopt, amend and repeal our bylaws at any regular or special meeting of the board on the affirmative vote of a majority of the total number of directors our board of directors would have if there were no vacancies. Our stockholders may adopt, amend or repeal our bylaws but only at any regular or special meeting of stockholders by an affirmative vote of holders of at least 66 2/3% of the voting power of all then outstanding shares of capital stock entitled to vote generally in the election of directors, voting together as a single class.
Removal of Director. Our certificate of incorporation and bylaws provide that members of our board of directors may only be removed by the affirmative vote of holders of at least 66 2/3% of the voting power of all then outstanding shares of capital stock entitled to vote generally in the election of directors, voting together as a single class.
Amendment of the Certificate of Incorporation. Our certificate of incorporation provides that, in addition to any other vote that may be required by law or any preferred stock designation, the affirmative vote of the holders of at least 66 2/3% of the voting power of all then outstanding shares of capital stock entitled to vote generally in the election of directors, voting together as a single class, is required to amend, alter or repeal, or adopt any provision as part of our certificate of incorporation inconsistent with the provisions of our certificate of incorporation dealing with distributions on our common stock, related party transactions, our board of directors, our bylaws, meetings of our stockholders or amendment of our certificate of incorporation.
The provisions of our certificate of incorporation and bylaws could have the effect of discouraging others from attempting hostile takeovers and, as a consequence, they may also inhibit temporary fluctuations in the market price of our common stock that often result from actual or rumored hostile takeover attempts. These provisions may also have the effect of preventing changes in our management. It is possible that these provisions could make it more difficult to accomplish transactions which stockholders may otherwise deem to be in their best interests.
Transfer Agent and Registrar
Computershare Trust Company, N.A. will be the transfer agent and registrar for our common stock.
99
Table of Contents
Index to Financial Statements
SHARES ELIGIBLE FOR FUTURE SALE
Prior to this offering, there has been no market for our common stock. Future sales in the public markets of substantial amounts of common stock, including shares issued upon exercise of outstanding options, could adversely affect prevailing market prices from time to time for our common stock and impair our ability to raise capital through future sales of equity securities.
Upon completion of this offering, we will have outstanding an aggregate of 45,029,314 shares of common stock. All of the shares sold in this offering will be freely tradable without restriction or further registration under the Securities Act of 1933, or the Securities Act, except for shares, if any, which may be acquired by our “affiliates” as that term is defined in Rule 144 under the Securities Act. Persons who may be deemed to be affiliates generally include individuals or entities that control, are controlled by, or are under common control with, us and may include our directors and officers as well as our significant stockholders, if any.
Lock-up Agreements
In connection with this offering, we, our executive officers and directors, GWES Holdings and Diamondback Holdings have agreed to enter into lock-up agreements in favor of the underwriters that prohibit us and these other individuals or entities, directly or indirectly, from selling or otherwise disposing of any shares or securities convertible into shares for a period of 180 days from the date of this prospectus, without the prior written consent of Raymond James, subject to limited exceptions. These exceptions include transfers of common stock as a bona fide gift or by will or intestate and transfers to such person’s immediate family or to a trust. Immediately following this offering, persons subject to lock-up agreements will own shares representing approximately 72.2% of the then outstanding shares, or approximately 68.1% if the underwriters’ over-allotment option is exercised in full.
Rule 144
Under Rule 144 as in effect on the date of this prospectus, a person who has beneficially owned restricted shares of our common stock or warrants for at least six months is entitled to sell their securities provided that (i) such person is not deemed to have been one of our affiliates at the time of, or at any time during the three months preceding, a sale and (ii) we are subject to the Securities Exchange Act of 1934, as amended, or the Exchange Act, periodic reporting requirements for at least three months before the sale. Persons who have beneficially owned restricted shares of our common stock for at least six months but who are our affiliates at the time of, or any time during the three months preceding, a sale, are subject to additional restrictions, by which such persons are entitled to sell within any three-month period only a number of securities that does not exceed the greater of either of the following:
| • | 1% of the total number of shares of common stock then outstanding, which will equal 450,293 shares immediately after this offering (or 450,293 shares if the underwriters exercise their over-allotment option in full); or |
| • | the average weekly trading volume of such securities during the four calendar weeks preceding the filing of a notice on Form 144 with respect to the sale; |
provided, in each case, that we are subject to the Exchange Act periodic reporting requirements for at least three months before the sale. Such sales must also comply with the manner of sale and notice provisions of Rule 144.
Registration Rights
We have entered into a registration rights agreement with GWES Holdings and Diamondback Holdings. Under the registration rights agreement, these entities have three demand registration rights, as well as “piggyback” registration rights. The demand rights enable them to require us to register their shares of our common stock with the SEC at any time, subject to the 180-day lock-up agreement they have entered into in
100
Table of Contents
Index to Financial Statements
connection with our initial public offering. The piggyback rights will allow each of GWES Holdings and Diamondback Holdings to register the shares of our common stock that it owns along with any shares that we register with the SEC. These registration rights are subject to customary conditions and limitations, including the right of the underwriters of an offering to limit the number of shares.
Equity Incentive Plan
An aggregate of 2,500,000 shares of our common stock have been reserved for issuance pursuant to our 2011 Equity Incentive Plan. We intend to file a registration statement on Form S-8 with respect to the issuance of all shares issuable under the plan. Accordingly, shares issued pursuant to this plan will be freely tradable, except for any shares held by our affiliates, as such term is defined by the SEC.
101
Table of Contents
Index to Financial Statements
Subject to the terms and conditions in an underwriting agreement dated , 2011, the underwriters named below, for whom Raymond James & Associates, Inc. and Jefferies & Company, Inc. are acting as representatives, have severally agreed to purchase from us, and we have agreed to sell to them, the number of shares of common stock set forth opposite their names below:
| Name of Underwriter |
Number of Shares | |||
| Raymond James & Associates, Inc. |
||||
| Jefferies & Company, Inc. |
||||
| Johnson Rice & Company L.L.C. |
||||
| Fearnley Fonds ASA |
||||
| Simmons & Company International |
||||
| SunTrust Robinson Humphrey, Inc. |
||||
| Total |
12,500,000 | |||
The underwriting agreement provides that the obligations of the underwriters to purchase and accept delivery of the shares offered by this prospectus are subject to the satisfaction of the conditions contained in the underwriting agreement, including:
| • | the representations and warranties made by us to the underwriters are true; |
| • | there is no material adverse change in the financial market; and |
| • | we deliver customary closing documents and legal opinions to the underwriters. |
The underwriters are obligated to purchase and accept delivery of all of the shares offered by this prospectus, if any are purchased, other than those covered by the option to purchase additional shares described below.
The underwriters propose to offer the shares directly to the public at the public offering price indicated on the cover page of this prospectus and to various dealers at that price less a concession not in excess of $ per share. If all of the shares are not sold at the public offering price, the underwriters may change the public offering price and other selling terms. The shares are offered by the underwriters as stated in this prospectus, subject to receipt and acceptance by them. The underwriters reserve the right to reject an order for the purchase of shares in whole or in part.
Fearnley Fonds ASA is not a U.S. registered broker-dealer. To the extent that Fearnley Fonds ASA intends to effect sales of shares in the United States, it will do so through one or more U.S. registered broker-dealers in accordance with the applicable U.S. securities laws and regulations. Fearnley Fonds ASA has agreed that in making any sales it will conform to the provisions of certain NASD conduct rules administered by FINRA to the same extent as though it were a member of FINRA.
Option to Purchase Additional Shares
The selling stockholders have granted the underwriters an option, exercisable for 30 days after the date of this prospectus, to purchase from time to time up to an aggregate of 1,875,000 additional shares of our common stock to cover over-allotments, if any, at the public offering price less the underwriting discount set forth on the cover page of this prospectus. If the underwriters exercise this option, each underwriter, subject to certain conditions, will become obligated to purchase its pro rata portion of these additional shares based on the underwriter’s percentage purchase commitment in this offering as indicated in the table above. The underwriters may exercise the option to purchase additional shares only to cover over-allotments made in connection with the sale of the shares offered in this offering.
102
Table of Contents
Index to Financial Statements
Discounts and Expenses
The following table shows the amount per share and total underwriting discounts we will pay to the underwriters (dollars in thousands, except per share amounts). The amounts are shown assuming both no exercise and full exercise of the underwriters’ option to purchase additional shares.
| Per Share | Total | |||||||||||||||
| Without Overallotment |
With Overallotment |
Without Overallotment |
With Overallotment |
|||||||||||||
| Public offering price for shares sold by us |
$ | $ | $ | $ | ||||||||||||
| Underwriting fees to be paid by us |
||||||||||||||||
| Proceeds, before expenses, to us |
||||||||||||||||
| Public offering price for shares sold by the selling stockholders |
||||||||||||||||
| Underwriting fees to be paid by the selling stockholders |
||||||||||||||||
| Proceeds, before expenses, to the selling stockholders |
$ | $ | $ | $ | ||||||||||||
The expenses of this offering that are payable by us are estimated to be $ million (excluding the underwriting discount).
Indemnification
We have agreed to indemnify the underwriters against certain liabilities that may arise in connection with this offering, including liabilities under the Securities Act, and to contribute to payments that the underwriters may be required to make for those liabilities.
Directed Share Program
At our request, the underwriters have reserved up to % of the common stock being offered by this prospectus for sale to our directors, officers, employees, business associates and related persons at the public offering price. The sales will be made by the underwriters through a directed share program. We do not know if these persons will choose to purchase all or any portion of this reserved common stock, but any purchases they do make will reduce the number of shares available to the general public. To the extent the allotted shares are not purchased in the directed share program, we will offer these shares to the public. These persons must commit to purchase no later than the close of business on the day following the date of this prospectus. Any directors or officers purchasing such reserved common stock will be prohibited from selling such stock for a period of 180 days after the date of this prospectus. The common stock issued in connection with the directed share program will be issued as part of the underwritten offer.
Lock-Up Agreements
Subject to specified exceptions, we, our directors and executive officers, GWES Holdings and Diamondback Holdings have agreed with the underwriters, for a period of 180 days after the date of this prospectus, without the prior written consent of Raymond James & Associates, Inc.:
| • | not to offer, sell, contract to sell, announce the intention to sell or pledge any shares of our common stock; |
| • | not to grant or sell any option or contract to purchase any shares of our common stock; |
| • | not to enter into any swap or other agreement that transfers any of the economic consequences of ownership of, or otherwise transfer or dispose of, directly or indirectly, any shares of our common stock; and |
103
Table of Contents
Index to Financial Statements
| • | not to enter into any hedging, collar or other transaction or arrangement that is designed or reasonably expected to lead to or result in a transfer, in whole or in part, of any of the economic consequences of ownership of shares of our common stock, whether or not such transfer would be for any consideration. |
These agreements also prohibit us from entering into any of the foregoing transactions with respect to any securities that are convertible into or exchangeable for shares of our common stock.
Raymond James & Associates, Inc. may, in its discretion and at any time without notice, release all or any portion of the securities subject to these agreements. Raymond James & Associates, Inc. does not have any present intent or any understanding to release all or any portion of the securities subject to these agreements.
The 180-day period described in the preceding paragraphs will be extended if:
| • | during the last 17 days of the 180-day period, we issue an earnings release or announce material news or a material event relating to us occurs; or |
| • | prior to the expiration of the 180-day period, we announce that we will release earnings results during the 16-day period beginning on the last day of the 180-day period, |
in which case the restrictions described in the preceding paragraphs will continue to apply until the expiration of the 18-day period beginning on the issuance of the earnings release, the announcement of the material news or the occurrence of the material event.
Stabilization
Until this offering is completed, rules of the SEC may limit the ability of the underwriters to bid for and purchase shares of our common stock. As an exception to these rules, the underwriters may engage in activities that stabilize, maintain or otherwise affect the price of the shares, including:
| • | short sales; |
| • | syndicate covering transactions; |
| • | imposition of penalty bids; and |
| • | purchases to cover positions created by short sales. |
Stabilizing transactions consist of bids or purchases made for the purpose of preventing or retarding a decline in the market price of the shares while this offering is in progress. Stabilizing transactions may include making short sales of shares, which involve the sale by the underwriters of a greater number of shares than it is required to purchase in this offering and purchasing shares from us or in the open market to cover positions created by short sales. Short sales may be “covered” shorts, which are short positions in an amount not greater than the underwriters’ option to purchase additional shares referred to above, or may be “naked” shorts, which are short positions in excess of that amount.
Each underwriter may close out any covered short position either by exercising its option to purchase additional shares, in whole or in part, or by purchasing shares in the open market. In making this determination, each underwriter will consider, among other things, the price of the shares available for purchase in the open market compared to the price at which the underwriter may purchase shares pursuant to the option to purchase additional shares.
A naked short position is more likely to be created if the underwriters are concerned that there may be downward pressure on the price of the shares in the open market that could adversely affect investors who purchased in this offering. To the extent that the underwriters create a naked short position, they will purchase shares in the open market to cover the position.
104
Table of Contents
Index to Financial Statements
As a result of these activities, the price of the shares may be higher than the price that otherwise might exist in the open market. If the underwriters commence these activities, they may discontinue them without notice at any time. The underwriters may carry out these transactions on the NASDAQ or otherwise.
Conflict of Interest
An affiliate of SunTrust Robinson Humphrey, Inc. is the lender under our revolving credit facility. Since we will use the net proceeds of this offering to repay outstanding borrowings under our revolving credit facility, such affiliate will receive 5% or more of the net proceeds of this offering, not including underwriting compensation. As a result, SunTrust Robinson Humphrey, Inc. may be deemed to have a “conflict of interest” within the meaning of FINRA Rule 5121. Because neither Raymond James & Associates, Inc. nor Jefferies & Company, Inc., the underwriters primarily responsible for managing this offering, has a conflict of interest, and each of them meets the applicable requirements of Rule 5121, no qualified independent underwriter is required. However, this offering is being conducted in compliance with all other applicable provisions of Rule 5121. In accordance with Rule 5121, SunTrust Robinson Humphrey, Inc. will not make sales to discretionary accounts without the prior written consent of the account holders.
Other Relationships
Certain of the underwriters and their affiliates may provide in the future investment banking, financial advisory or other financial services for us and our affiliates, for which they may receive advisory or transaction fees, as applicable, plus out-of-pocket expenses, of the nature and in amounts customary in the industry for these financial services.
Discretionary Accounts
The underwriters may confirm sales of the shares offered by this prospectus to accounts over which they exercise discretionary authority but do not expect those sales to exceed 5% of the total number of shares offered by this prospectus.
Listing
We have applied to have our common stock listed on the NASDAQ Global Market under the symbol “JAWS.”
Determination of Initial Offering Price
Prior to this offering, there has been no public market for the shares. Consequently, the initial public offering price for the shares was determined by negotiations among us and the underwriters. The primary factors considered in determining the initial public offering price were:
| • | the overall quality of our assets and operations; |
| • | industry and market conditions prevalent in the oilfield service industry; |
| • | the information set forth in this prospectus and otherwise available to the representatives; and |
| • | the general conditions of the securities markets at the time of this offering. |
The initial offering price may not correspond to the price at which the shares will trade in the public market subsequent to this offering, and an active trading market may not develop and continue after this offering.
105
Table of Contents
Index to Financial Statements
Electronic Prospectus
A prospectus in electronic format may be available on the Internet sites or through other online services maintained by one or more of the underwriters participating in this offering, or by their affiliates. In those cases, prospective investors may view offering terms online and, depending upon the underwriter, prospective investors may be allowed to place orders online. The underwriters may agree with us to allocate a specific number of shares for sale to online brokerage account holders. Any such allocation for online distributions will be made by the underwriters on the same basis as other allocations.
Other than the prospectus in electronic format, the information on any underwriter’s website and any information contained in any other website maintained by the underwriters is not part of this prospectus or the registration statement of which this prospectus forms a part, has not been approved or endorsed by us or any underwriters in its capacity as underwriter and should not be relied upon by investors.
Selling Restrictions
Australia
This document has not been lodged with the Australian Securities & Investments Commission and is only directed to certain categories of exempt persons. Accordingly, if you receive this document in Australia:
| (a) | you confirm and warrant that you are either: |
| (i) | a “sophisticated investor” under section 708(8)(a) or (b) of the Corporations Act 2001 (Cth) of Australia (Corporations Act); |
| (ii) | a “sophisticated investor” under section 708(8)(c) or (d) of the Corporations Act and that you have provided an accountant’s certificate to the Company which complies with the requirements of section 708(8)(c)(i) or (ii) of the Corporations Act and related regulations before the offer has been made; or |
| (iii) | a “professional investor” within the meaning of section 708(11)(a) or (b) of the Corporations Act, |
and to the extent that you are unable to confirm or warrant that you are an exempt sophisticated investor or professional investor under the Corporations Act, any offer made to you under this document is void and incapable of acceptance.
| (b) | you warrant and agree that you will not offer any of the shares issued to you pursuant to this document for resale in Australia within 12 months of those shares being issued unless any such resale offer is exempt from the requirement to issue a disclosure document under section 708 of the Corporations Act. |
European Economic Area
In relation to each Member State of the European Economic Area which has implemented the Prospectus Directive (each, a Relevant Member State), each of the underwriters has represented and agreed that with effect from and including the date on which the Prospectus Directive is implemented in that Relevant Member State (the Relevant Implementation Date) it has not made and will not make an offer of the common stock to the public in that Relevant Member State prior to the publication of a prospectus in relation to the common stock which has been approved by the competent authority in that Relevant Member State or, where appropriate, approved in another Relevant Member State and notified to the competent authority in that Relevant Member State, all in accordance with the Prospectus Directive and the 2010 PD Amending Directive to the extent implemented, except that it may, with effect from and including the Relevant Implementation Date, make an offer of common stock to the public in that Relevant Member State at any time:
| • | to any legal entity which is a qualified investor as defined in the Prospectus Directive or the 2010 PD Amending Directive if the relevant provision has been implemented; |
106
Table of Contents
Index to Financial Statements
| • | to fewer than (i) 100 natural or legal persons per Relevant Member State (other than qualified investors as defined in the Prospectus Directive or the 2010 PD Amending Directive if the relevant provision has been implemented) or (ii) if the Relevant Member State has implemented the relevant provision of the 2010 PD Amending Directive, 150 natural or legal persons per Relevant Member State (other than qualified investors as defined in the Prospectus Directive or the 2010 PD Amending Directive if the relevant provision has been implemented), subject to obtaining the prior consent of the relevant dealer or dealers nominated by the company for any such offer; or |
| • | in any other circumstances falling within Article 3(2) of the Prospectus Directive or Article 3(2) of the 2010 PD Amending Directive to the extent implemented. |
For the purposes of this provision, the expression an ‘‘offer of the common stock to the public,’’ in relation to any common stock in any Relevant Member State, means the communication in any form and by any means of sufficient information on the terms of the offer and the common stock to be offered so as to enable an investor to decide to purchase or subscribe for the common stock, as the same may be varied in that Relevant Member State by any measure implementing the Prospectus Directive in that Relevant Member State, the expression “Prospectus Directive” means Directive 2003/71/EC, and includes any relevant implementing measure in that Relevant Member State, and the expression “2010 PD Amending Directive” means Directive 2010/73/EC.
United Kingdom
Each underwriter has represented and agreed that it has only communicated or caused to be communicated and will only communicate or cause to be communicated an invitation or inducement to engage in investment activity (within the meaning of Section 21 of the Financial Services and Markets Act 2000) in connection with the issue or sale of the shares in circumstances in which Section 21(1) of such Act does not apply to us and it has complied and will comply with all applicable provisions of such Act with respect to anything done by it in relation to any shares in, from or otherwise involving the United Kingdom.
107
Table of Contents
Index to Financial Statements
The shares of common stock offered hereby may be offered in Canada in the provinces of British Columbia, Alberta, Ontario and Quebec only.
Resale Restrictions
The distribution of the common stock in Canada is being made only on a private placement basis exempt from the requirement that we prepare and file a prospectus with the securities regulatory authorities in each province where trades of the common stock are made. We are not a reporting issuer in any province or territory in Canada, the common stock is not listed on any stock exchange in Canada, and we do not intend to become a reporting issuer or to list the common stock on any stock exchange in Canada. Any resale of the common stock in Canada must be made under applicable securities laws which will vary depending on the relevant jurisdiction, and which may require resales to be made under available statutory exemptions or under a discretionary exemption granted by the applicable Canadian securities regulatory authority. Purchasers are advised to seek legal advice prior to any resale of the common stock.
Representations of Purchasers
By purchasing the common stock in Canada and accepting a purchase confirmation, each purchaser is representing to us and the dealer from whom the purchase confirmation is received that such purchaser:
| • | is an “accredited investor” as defined in section 1.1 of National Instrument 45-106 – Prospectus and Registration Exemptions (“NI 45-106”) (other than a person described in paragraph (m) of such definition that was created or is used solely to purchase or hold securities as an accredited investor); |
| • | is purchasing common stock as principal or is deemed under NI 45-106 to be purchasing common stock as principal; and |
| • | is either (i) a permitted client within the meaning of National Instrument 31-103 – Registration Requirements and Exemptions or (ii) purchasing common stock from a dealer that is registered with the securities regulatory authority of the applicable province as an investment dealer or an exempt market dealer. |
We are required to provide, and will deliver to the Ontario Securities Commission (the “OSC”) in accordance with NI 45-106, information (“personal information”) pertaining to the purchaser as required to be disclosed in Schedule I of Form 45-106F1 (including its name, address, telephone number and the number and value of common stock purchased), which form we are required to file under NI 45-106. Such information is being collected indirectly by the OSC under the authority granted to it under securities legislation of Ontario and is being collected for the purposes of the administration and enforcement of securities legislation in Ontario. The public official in Ontario who can answer questions about the OSC’s indirect collection of such personal information is the Administrative Assistant to the Director of Corporate Finance at the OSC, Suite 1903, Box 55, 20 Queen Street West, Toronto, Ontario M5H 3S8, Telephone: (416) 593-8086. The purchaser’s name, address, telephone number and other specified information, including the number of shares of common stock it has purchased and the aggregate purchase price to the purchaser, may be disclosed to other Canadian securities regulatory authorities and may become available to the public in accordance with the requirements of applicable laws. By placing an order to purchase shares of common stock, the purchaser consents to the disclosure of such information.
Rights of Action—Ontario Purchasers Only
Under Ontario securities legislation, certain purchasers who purchase a security offered by this prospectus during the period of distribution will have a statutory right of action for damages, or while still the owner of the common stock, for rescission against us in the event that this prospectus contains a misrepresentation without regard
108
Table of Contents
Index to Financial Statements
to whether the purchaser relied on the misrepresentation. For purpose of the following summary, “misrepresentation” means an untrue statement of a material fact or an omission to state a material fact that is necessary in order to make a statement not misleading in light of the circumstances in which it was made. The right of action for damages for a misrepresentation is exercisable not later than the earlier of 180 days from the date the purchaser first had knowledge of the facts giving rise to the cause of action and three years from the date on which payment is made for the common stock. The right of action for rescission based on a misrepresentation is exercisable not later than 180 days from the date on which payment is made for the common stock. If a purchaser elects to exercise the right of action for rescission, the purchaser will have no right of action for damages against us. In no case will the amount recoverable in any action exceed the price at which the common stock were offered to the purchaser and if the purchaser is shown to have purchased the securities with knowledge of the misrepresentation, we will have no liability. In the case of an action for damages, we will not be liable for all or any portion of the damages that are proven to not represent the depreciation in value of the common stock as a result of the misrepresentation relied upon. We will not be liable for a misrepresentation in forward-looking statements if we prove that: (a) this prospectus contains, proximate to the forward-looking statements, reasonable cautionary language identifying the forward-looking statements as such, and identifying material factors that could cause actual results to differ materially from a conclusion, forecast or projection in the forward-looking statements, and a statement of material factors or assumptions that were applied in drawing a conclusion or making a forecast or projection set out in the forward-looking statements; and (b) we had a reasonable basis for drawing the conclusions or making the forecasts and projections set out in the forward-looking statements.
The foregoing rights do not apply if the purchaser is: (a) a Canadian financial institution (as defined in NI 45-106) or a Schedule III bank; (b) the Business Development Bank of Canada incorporated under the Business Development Bank of Canada Act (Canada); or (c) a subsidiary of any person referred to in paragraphs (a) and (b), if the person owns all of the voting securities of the subsidiary, except the voting securities required by law to be owned by directors of that subsidiary. These rights are in addition to, and without derogation from, any other rights or remedies available at law to an Ontario purchaser. The foregoing is a summary of the rights available to an Ontario purchaser. Ontario purchasers should refer to the complete text of the relevant statutory provisions.
Enforcement of Legal Rights
We were established under the laws of a jurisdiction outside Canada. All of our directors and officers as well as the experts named herein may be located outside of Canada and, as a result, it may not be possible for Canadian purchasers to effect service of process within Canada upon us or those persons. All or a substantial portion of our assets and the assets of those persons may be located outside of Canada and, as a result, it may not be possible to satisfy a judgment against us or those persons in Canada or to enforce a judgment obtained in Canadian courts against us or those persons outside of Canada.
Taxation and Eligibility for Investment
Any discussion of taxation and related matters contained in this prospectus does not address Canadian tax considerations. Canadian purchasers of the common stock should consult their own legal and tax advisors with respect to the tax consequences of an investment in the common stock in their particular circumstances and about the eligibility of the common stock for investment by the purchaser under relevant Canadian legislation and regulations.
Language
By purchasing the common stock offered under this prospectus, each purchaser is deemed to acknowledge that its express wish is that all documents evidencing or relating in any way to the sale of the common stock be drafted in the English language only. En souscrivant des valeurs mobilières en vertu de la présente notice d’offre, chaque souscripteur est réputé reconnaître avoir exigé que tous les documents faisant foi de ou relatifs à la vente des valeurs mobilières soient rédigés uniquement en anglais.
109
Table of Contents
Index to Financial Statements
The validity of the shares of common stock that are offered hereby by us and the selling stockholders will be passed upon by Akin Gump Strauss Hauer & Feld LLP. The underwriters have been represented by Andrews Kurth LLP.
The audited financial statements included in this prospectus and elsewhere in the registration statement have been so included in reliance upon the reports of Grant Thornton LLP, independent registered public accountants, upon the authority of said firm as experts in accounting and auditing.
WHERE YOU CAN FIND MORE INFORMATION
We have filed with the SEC a registration statement on Form S-1 under the Securities Act covering the securities offered by this prospectus. This prospectus, which constitutes a part of that registration statement, does not contain all of the information that you can find in that registration statement and its exhibits. Certain items are omitted from this prospectus in accordance with the rules and regulations of the SEC. For further information about us and the common stock offered by this prospectus, reference is made to the registration statement and the exhibits filed with the registration statement. Statements contained in this prospectus and any prospectus supplement as to the contents of any contract or other document referred to are not necessarily complete and in each instance such statement is qualified by reference to each such contract or document filed as part of the registration statement. When we complete this offering, we will be required to file annual, quarterly and current reports, proxy statements and other information with the SEC. You may read any materials we file with the SEC free of charge at the SEC’s Public Reference Room at 100 F Street, N.E., Washington, D.C. 20549. Copies of all or any part of these documents may be obtained from such office upon the payment of the fees prescribed by the SEC. The public may obtain information on the operation of the public reference room by calling the SEC at 1-800-SEC-0330. The SEC maintains an Internet site that contains reports, proxy and information statements and other information regarding registrants that file electronically with the SEC. The address of the site is www.sec.gov. The registration statement, including all exhibits thereto and amendments thereof, has been filed electronically with the SEC.
110
Table of Contents
Index to Financial Statements
GLOSSARY OF OIL AND NATURAL GAS TERMS
Acidizing. The pumping of acid into the wellbore to remove near-well formation damage and other damaging substances.
Blowout. An uncontrolled flow of reservoir fluids into the wellbore, and sometimes catastrophically to the surface. A blowout may consist of salt water, oil, natural gas or a mixture of these. Blowouts can occur in all types of exploration and production operations, not just during drilling operations. If reservoir fluids flow into another formation and do not flow to the surface, the result is called an underground blowout. If the well experiencing a blowout has significant open-hole intervals, it is possible that the well will bridge over (or seal itself with rock fragments from collapsing formations) down-hole and intervention efforts will be averted.
Bottomhole assembly. The lower portion of the drillstring, consisting of (from the bottom up in a vertical well) the bit, bit sub, a mud motor (in certain cases), stabilizers, drill collar, heavy-weight drillpipe, jarring devices (“jars”) and crossovers for various threadforms. The bottomhole assembly must provide force for the bit to break the rock (weight on bit), survive a hostile mechanical environment and provide the driller with directional control of the well. Oftentimes the assembly includes a mud motor, directional drilling and measuring equipment, measurements-while-drilling tools, logging-while-drilling tools and other specialized devices.
Cementing. To prepare and pump cement into place in a wellbore.
Coiled tubing. A long, continuous length of pipe wound on a spool. The pipe is straightened prior to pushing into a wellbore and rewound to coil the pipe back onto the transport and storage spool. Depending on the pipe diameter (1 in. to 4 1/2 in.) and the spool size, coiled tubing can range from 2,000 ft to 15,000 ft (610 m to 4,570 m) or greater length.
Completion. A generic term used to describe the assembly of down-hole tubulars and equipment required to enable safe and efficient production from an oil or gas well. The point at which the completion process begins may depend on the type and design of the well.
Directional drilling. The intentional deviation of a wellbore from the path it would naturally take. This is accomplished through the use of whipstocks, bottomhole assembly (BHA) configurations, instruments to measure the path of the wellbore in three-dimensional space, data links to communicate measurements taken down-hole to the surface, mud motors and special BHA components and drill bits, including rotary steerable systems, and drill bits. The directional driller also exploits drilling parameters such as weight on bit and rotary speed to deflect the bit away from the axis of the existing wellbore. In some cases, such as drilling steeply dipping formations or unpredictable deviation in conventional drilling operations, directional-drilling techniques may be employed to ensure that the hole is drilled vertically. While many techniques can accomplish this, the general concept is simple: point the bit in the direction that one wants to drill. The most common way is through the use of a bend near the bit in a down-hole steerable mud motor. The bend points the bit in a direction different from the axis of the wellbore when the entire drillstring is not rotating. By pumping mud through the mud motor, the bit turns while the drillstring does not rotate, allowing the bit to drill in the direction it points. When a particular wellbore direction is achieved, that direction may be maintained by rotating the entire drillstring (including the bent section) so that the bit does not drill in a single direction off the wellbore axis, but instead sweeps around and its net direction coincides with the existing wellbore. Rotary steerable tools allow steering while rotating, usually with higher rates of penetration and ultimately smoother boreholes.
Down-hole. Pertaining to or in the wellbore (as opposed to being on the surface).
Down-hole motor. A drilling motor located in the drill string above the drilling bit powered by the flow of drilling mud. Down-hole motors are used to increase the speed and efficiency of the drill bit or can be used to steer the bit in directional drilling operations. Drilling motors have become very popular because of horizontal and directional drilling applications and the increase of day rates for drilling rigs.
111
Table of Contents
Index to Financial Statements
Drilling rig. The machine used to drill a wellbore.
Drillpipe. Tubular steel conduit fitted with special threaded ends called tool joints. The drillpipe connects the rig surface equipment with the bottomhole assembly and the bit, both to pump drilling fluid to the bit and to be able to raise, lower and rotate the bottomhole assembly and bit.
Drillstring. The combination of the drillpipe, the bottomhole assembly and any other tools used to make the drill bit turn at the bottom of the wellbore.
Horizontal drilling. A subset of the more general term “directional drilling,” used where the departure of the wellbore from vertical exceeds about 80 degrees. Note that some horizontal wells are designed such that after reaching true 90-degree horizontal, the wellbore may actually start drilling upward. In such cases, the angle past 90 degrees is continued, as in 95 degrees, rather than reporting it as deviation from vertical, which would then be 85 degrees. Because a horizontal well typically penetrates a greater length of the reservoir, it can offer significant production improvement over a vertical well.
Hot tapping. The process of drilling a hole through a pressure barrier using special equipment and procedures to ensure that the pressure and fluids are safely contained when access is made. Hot tapping is often used to enable access to the wellbore when wellhead valves jam closed.
Hydraulic fracturing. A stimulation treatment routinely performed on oil and gas wells in low-permeability reservoirs. Specially engineered fluids are pumped at high pressure and rate into the reservoir interval to be treated, causing a vertical fracture to open. The wings of the fracture extend away from the wellbore in opposing directions according to the natural stresses within the formation. Proppant, such as grains of sand of a particular size, is mixed with the treatment fluid to keep the fracture open when the treatment is complete. Hydraulic fracturing creates high-conductivity communication with a large area of formation and bypasses any damage that may exist in the near-wellbore area.
Hydrocarbon. A naturally occurring organic compound comprising hydrogen and carbon. Hydrocarbons can be as simple as methane, but many are highly complex molecules, and can occur as gases, liquids or solids. Petroleum is a complex mixture of hydrocarbons. The most common hydrocarbons are natural gas, oil and coal.
Measurement while drilling (MWD). The evaluation of physical properties, usually including pressure, temperature and wellbore trajectory in three-dimensional space, while extending a wellbore. MWD is now standard practice in offshore directional wells, where the tool cost is offset by rig time and wellbore stability considerations if other tools are used. The measurements are made down-hole, stored in solid-state memory for some time and later transmitted to the surface. Data transmission methods vary from company to company, but usually involve digitally encoding data and transmitting to the surface as pressure pulses in the mud system. These pressures may be positive, negative or continuous sine waves. Some MWD tools have the ability to store data if the transmission link fails. MWD tools that measure formation parameters (resistivity, porosity, sonic velocity, gamma ray) are referred to as logging-while-drilling (LWD) tools. LWD tools use similar data storage and transmission systems, with some having more solid-state memory to provide higher resolution logs after the tool is tripped out than is possible with the relatively low bandwidth, mud-pulse data transmission system.
Mud motors. A positive displacement drilling motor that uses hydraulic horsepower of the drilling fluid to drive the drill bit. Mud motors are used extensively in directional drilling operations.
Natural gas liquids. Components of natural gas that are liquid at surface in field facilities or in gas-processing plants. Natural gas liquids can be classified according to their vapor pressures as low (condensate), intermediate (natural gasoline) and high (liquefied petroleum gas) vapor pressure.
Nitrogen pumping unit. A high-pressure pump or compressor unit capable of delivering high-purity nitrogen gas for use in oil or gas wells. Two basic types of unit are commonly available: a nitrogen converter unit that
112
Table of Contents
Index to Financial Statements
pumps liquid nitrogen at high pressure through a heat exchanger or converter to deliver high-pressure gas at ambient temperature, and a nitrogen generator unit that compresses and separates air to provide a supply of high-pressure nitrogen gas.
Plugging. The process of permanently closing oil and gas wells no longer capable of producing in economic quantities. Plugging work can be performed with a well servicing rig along with wireline and cementing equipment; however, this service is typically provided by companies that specialize in plugging work.
Plug. A down-hole packer assembly used in a well to seal off or isolate a particular formation for testing, acidizing, cementing, etc.; also a type of plug used to seal off a well temporarily while the wellhead is removed.
Pressure pumping. Services that include the pumping of liquids under pressure.
Producing formation. An underground rock formation from which oil, natural gas or water is produced. Any porous rock will contain fluids of some sort, and all rocks at considerable distance below the Earth’s surface will initially be under pressure, often related to the hydrostatic column of ground waters above the reservoir. To produce, rocks must also have permeability, or the capacity to permit fluids to flow through them.
Proppant. Sized particles mixed with fracturing fluid to hold fractures open after a hydraulic fracturing treatment. In addition to naturally occurring sand grains, man-made or specially engineered proppants, such as resin-coated sand or high-strength ceramic materials like sintered bauxite, may also be used. Proppant materials are carefully sorted for size and sphericity to provide an efficient conduit for production of fluid from the reservoir to the wellbore.
Resource Play. Accumulation of hydrocarbons known to exist over a large area.
Shale. A fine-grained, fissile, sedimentary rock formed by consolidation of clay- and silt-sized particles into thin, relatively impermeable layers.
Sidepocket mandrel. A completion component that is used to house gas-lift valves and similar devices that require communication with the annulus. The design of a side-pocket mandrel is such that the installed components do not obstruct the production flow path, enabling access to the wellbore and completion components below.
Slickline. A thin nonelectric cable used for selective placement and retrieval of wellbore hardware, such as plugs, gauges and valves located in sidepocket mandrels. Valves and sleeves can also be adjusted using slickline tools. Partially collapsed tubing can be repaired using a tubing swage on slickline.
Snubbing. The act of putting drillpipe into the wellbore when the blowout preventers (BOPs) are closed and pressure is contained in the well. Snubbing is necessary when a kick is taken, since well kill operations should always be conducted with the drillstring on bottom, and not somewhere up the wellbore. If only the annular BOP has been closed, the drillpipe may be slowly and carefully lowered into the wellbore, and the BOP itself will open slightly to permit the larger diameter tool joints to pass through. If the well has been closed with the use of ram BOPs, the tool joints will not pass by the closed ram element. Hence, while keeping the well closed with either another ram BOP or the annular BOP, the ram must be opened manually, then the pipe lowered until the tool joint is just below the ram, and then closing the ram again. This procedure is repeated whenever a tool joint must pass by a ram BOP. In snubbing operations, the pressure in the wellbore acting on the cross-sectional area of the tubular can exert sufficient force to overcome the weight of the drillstring, so the string must be pushed (or “snubbed”) back into the wellbore. In ordinary stripping operations, the pipe falls into the wellbore under its own weight, and no additional downward force or pushing is required.
Threadform. A particular style or type of threaded connection, especially as used for rotary shouldered connections. Threadforms come in a variety of sizes, pitches, tapers, threads per in., and individual thread profiles. Fortunately, each of these varieties has a published standard, either considered public and maintained by the American Petroleum Institute (API) or maintained by operating or service companies as proprietary information.
113
Table of Contents
Index to Financial Statements
Tight sands. A type of unconventional tight reservoir. Tight reservoirs are those which have low permeability, often quantified as less than 0.1 millidarcies.
Tubulars. A generic term pertaining to any type of oilfield pipe, such as drillpipe, drill collars, pup joints, casing, production tubing and pipeline.
Unconventional resource. An umbrella term for oil and natural gas that is produced by means that do not meet the criteria for conventional production. What has qualified as “unconventional” at any particular time is a complex function of resource characteristics, the available exploration and production technologies, the economic environment, and the scale, frequency and duration of production from the resource. Perceptions of these factors inevitably change over time and often differ among users of the term. At present, the term is used in reference to oil and gas resources whose porosity, permeability, fluid trapping mechanism, or other characteristics differ from conventional sandstone and carbonate reservoirs. Coalbed methane, gas hydrates, shale gas, fractured reservoirs, and tight gas sands are considered unconventional resources.
Underbalanced drilling. The amount of pressure (or force per unit area) exerted on a formation exposed in a wellbore below the internal fluid pressure of that formation. If sufficient porosity and permeability exist, formation fluids enter the wellbore. The drilling rate typically increases as an underbalanced condition is approached.
Wellbore. The physical conduit from surface into the hydrocarbon reservoir.
Well planning. The description of a proposed wellbore, including the shape, orientation, depth, completion, and evaluation. Well plans might be relatively simple for vertical wellbores. Directional or horizontal wellbores require more detailed planning about where to land the well and begin directional drilling, how long the directional or horizontal section should be, and how to evaluate and complete the well. Shale gas wells, many of which are horizontal wells, require highly detailed well plans to optimize production from reservoirs that are vertically and laterally heterogeneous.
Well stimulation. A treatment performed to restore or enhance the productivity of a well. Stimulation treatments fall into two main groups, hydraulic fracturing treatments and matrix treatments. Fracturing treatments are performed above the fracture pressure of the reservoir formation and create a highly conductive flow path between the reservoir and the wellbore. Matrix treatments are performed below the reservoir fracture pressure and generally are designed to restore the natural permeability of the reservoir following damage to the near-wellbore area. Stimulation in shale gas reservoirs typically takes the form of hydraulic fracturing treatments.
Wireline. A general term used to describe well-intervention operations conducted using single-strand or multi-strand wire or cable for intervention in oil or gas wells. Although applied inconsistently, the term commonly is used in association with electric logging and cables incorporating electrical conductors. Similarly, the term slickline is commonly used to differentiate operations performed with single-strand wire or braided lines.
Workover. The process of performing major maintenance or remedial treatments on an oil or gas well. In many cases, workover implies the removal and replacement of the production tubing string after the well has been killed and a workover rig has been placed on location. Through-tubing workover operations, using coiled tubing, snubbing or slickline equipment, are routinely conducted to complete treatments or well service activities that avoid a full workover where the tubing is removed. This operation saves considerable time and expense.
114
Table of Contents
Index to Financial Statements
F-1
Table of Contents
Index to Financial Statements
Report of Independent Registered Public Accounting Firm
Manager
GW Holdings I LLC
We have audited the accompanying consolidated balance sheets of GW Holdings I LLC and subsidiaries (collectively the “Company”) as of December 31, 2010 and 2009, and the related consolidated statements of operations, equity, and cash flows for each of the three years in the period ended December 31, 2010. These financial statements are the responsibility of the Company’s management. Our responsibility is to express an opinion on these financial statements based on our audits.
We conducted our audits in accordance with the standards of the Public Company Accounting Oversight Board (United States). Those standards require that we plan and perform the audit to obtain reasonable assurance about whether the financial statements are free of material misstatement. The Company is not required to have, nor were we engaged to perform, an audit of its internal control over financial reporting. Our audit included consideration of internal control over financial reporting as a basis for designing audit procedures that are appropriate in the circumstances, but not for the purpose of expressing an opinion on the effectiveness of the Company’s internal control over financial reporting. Accordingly, we express no such opinion. An audit also includes examining, on a test basis, evidence supporting the amounts and disclosures in the financial statements, assessing the accounting principles used and significant estimates made by management, as well as evaluating the overall financial statement presentation. We believe that our audits provide a reasonable basis for our opinion.
In our opinion, the consolidated financial statements referred to above present fairly, in all material respects, the financial position of GW Holdings I LLC and subsidiaries as of December 31, 2010 and 2009, and the results of their operations and their cash flows for each of the three years in the period ended December 31, 2010 in conformity with accounting principles generally accepted in the United States of America.
/s/ GRANT THORNTON LLP
Oklahoma City, Oklahoma
April 28, 2011
F-2
Table of Contents
Index to Financial Statements
Consolidated Balance Sheets
December 31, 2010 and 2009
| 2010 | 2009 | |||||||
| Assets |
||||||||
| Current assets |
||||||||
| Cash and cash equivalents ($43,013 and $49,752 related to VIEs) |
$ | 7,988,912 | $ | 1,485,845 | ||||
| Accounts receivable (net of allowance of $1,323,510 and $1,399,857) |
35,871,390 | 17,815,210 | ||||||
| Receivables from related parties |
4,864,881 | 1,262,824 | ||||||
| Inventories |
4,069,466 | 3,056,709 | ||||||
| Prepaid expenses and other |
1,271,746 | 1,327,474 | ||||||
| Total current assets |
54,066,395 | 24,948,062 | ||||||
| Property and equipment, net ($600,490 and $621,408 related to VIEs) |
134,084,654 | 100,036,408 | ||||||
| Other non-current assets |
1,369,063 | 41,646 | ||||||
| Intangible assets, net |
7,763,814 | 9,200,899 | ||||||
| Goodwill |
16,222,481 | 16,222,481 | ||||||
| Total assets |
$ | 213,506,407 | $ | 150,449,496 | ||||
| Liabilities and Equity |
||||||||
| Current liabilities |
||||||||
| Accounts payable ($4,483 and $426 related to VIEs) |
$ | 16,696,185 | $ | 7,907,132 | ||||
| Accrued and other current liabilities ($0 and $2,688 related to VIEs) |
10,087,814 | 5,412,886 | ||||||
| Payables to related parties |
796,201 | 171,500 | ||||||
| Advances from Great White Energy Services LLC |
637,725 | 10,464,373 | ||||||
| Current portion of long-term debt |
2,673,605 | — | ||||||
| Current portion of capital lease obligations |
1,029,137 | 494,853 | ||||||
| Total current liabilities |
31,920,667 | 24,450,744 | ||||||
| Deferred income taxes |
1,162,299 | 1,507,001 | ||||||
| Capital lease obligations, net of current portion |
6,456,527 | 6,613,806 | ||||||
| Long-term debt |
6,012,170 | — | ||||||
| Total liabilities |
45,551,663 | 32,571,551 | ||||||
| Commitments and contingencies (Notes I, K and N) |
||||||||
| Equity |
||||||||
| Member’s equity |
167,315,724 | 117,209,899 | ||||||
| Non-controlling interest in variable interest entities |
639,020 | 668,046 | ||||||
| Total equity |
167,954,744 | 117,877,945 | ||||||
| Total liabilities and equity |
$ | 213,506,407 | $ | 150,449,496 | ||||
The accompanying notes are an integral part of these financial statements
F-3
Table of Contents
Index to Financial Statements
Consolidated Statements of Operations
Years Ended December 31, 2010, 2009 and 2008
| 2010 | 2009 | 2008 | ||||||||||
| Revenue |
||||||||||||
| Revenue |
$ | 192,982,667 | $ | 93,751,758 | $ | 207,301,245 | ||||||
| Revenue—related parties |
13,747,485 | 4,821,270 | 1,313,577 | |||||||||
| Total revenue |
206,730,152 | 98,573,028 | 208,614,822 | |||||||||
| Costs and expenses |
||||||||||||
| Cost of revenue (exclusive of depreciation and amortization) |
145,029,654 | 82,369,868 | 131,333,365 | |||||||||
| Cost of revenue (exclusive of depreciation and amortization)—related parties |
737,457 | 377,362 | 280,734 | |||||||||
| Selling, general, and administrative |
14,957,806 | 10,197,872 | 15,839,134 | |||||||||
| Selling, general, and administrative—related parties |
144,147 | 133,850 | 56,807 | |||||||||
| Depreciation and amortization |
23,419,257 | 22,367,235 | 20,673,441 | |||||||||
| Impairment of goodwill and intangible assets |
— | — | 20,184,607 | |||||||||
| Total costs and expenses |
184,288,321 | 115,446,187 | 188,368,088 | |||||||||
| Operating income (loss) |
22,441,831 | (16,873,159 | ) | 20,246,734 | ||||||||
| Other income (expense) |
||||||||||||
| Interest expense |
(152,673 | ) | (468,652 | ) | (383,690 | ) | ||||||
| Interest expense—related parties |
(1,193,539 | ) | (1,357,131 | ) | (1,726,538 | ) | ||||||
| Other |
68,597 | 206,545 | 462,282 | |||||||||
| (1,277,615 | ) | (1,619,238 | ) | (1,647,946 | ) | |||||||
| Income (loss) before income taxes |
21,164,216 | (18,492,397 | ) | 18,598,788 | ||||||||
| Provision (benefit) for income taxes |
273,348 | 27,673 | (2,455,196 | ) | ||||||||
| Net income (loss) |
20,890,868 | (18,520,070 | ) | 21,053,984 | ||||||||
| Income attributable to non-controlling interest in variable interest entities |
40,974 | 27,796 | 8,942 | |||||||||
| Net income (loss) attributable to equity holders of the Company |
$ | 20,849,894 | $ | (18,547,866 | ) | $ | 21,045,042 | |||||
| Pro forma information—unaudited (Note A 15) |
||||||||||||
| Income (loss) before income taxes as reported |
$ | 21,164,216 | $ | (18,492,397 | ) | $ | 18,598,788 | |||||
| Pro forma adjustment for income tax expense (benefit) |
8,159,803 | (6,928,362 | ) | 15,271,464 | ||||||||
| Pro forma net income (loss) |
$ | 13,004,413 | $ | (11,564,035 | ) | $ | 3,327,324 | |||||
| Pro forma net income (loss) attributable to equity holders of the Company |
$ | 12,963,439 | $ | (11,591,831 | ) | $ | 3,318,382 | |||||
| Basic and diluted attributable to the Company |
||||||||||||
| Pro forma net income (loss) per common share |
$ | .30 | ||||||||||
| Pro forma average weighted common shares outstanding used in net income (loss) per common share |
43,779,314 | |||||||||||
The accompanying notes are an integral part of these financial statements
F-4
Table of Contents
Index to Financial Statements
Consolidated Statement of Equity
Years Ended December 31, 2010, 2009 and 2008
| Member’s Equity |
Non-controlling Interest In Variable Interest Entities |
Total Equity | ||||||||||
| Balance at January 1, 2008 |
$ | 136,959,537 | $ | 726,709 | $ | 137,686,246 | ||||||
| Capital contributions |
12,658,072 | — | 12,658,072 | |||||||||
| Capital distributions |
(23,782,971 | ) | (45,401 | ) | (23,828,372 | ) | ||||||
| Net income |
21,045,042 | 8,942 | 21,053,984 | |||||||||
| Balance at December 31, 2008 |
146,879,680 | 690,250 | 147,569,930 | |||||||||
| Capital contributions |
10,616,000 | — | 10,616,000 | |||||||||
| Capital distributions |
(21,737,915 | ) | (50,000 | ) | (21,787,915 | ) | ||||||
| Net (loss) income |
(18,547,866 | ) | 27,796 | (18,520,070 | ) | |||||||
| Balance at December 31, 2009 |
117,209,899 | 668,046 | 117,877,945 | |||||||||
| Capital contributions |
43,959,634 | — | 43,959,634 | |||||||||
| Capital distributions |
(14,703,703 | ) | (70,000 | ) | (14,773,703 | ) | ||||||
| Net income |
20,849,894 | 40,974 | 20,890,868 | |||||||||
| Balance at December 31, 2010 |
$ | 167,315,724 | $ | 639,020 | $ | 167,954,744 | ||||||
The accompanying notes are an integral part of these financial statements
F-5
Table of Contents
Index to Financial Statements
Consolidated Statements of Cash Flows
Years Ended December 31, 2010, 2009 and 2008
| 2010 | 2009 | 2008 | ||||||||||
| Cash flows from operating activities |
||||||||||||
| Net income (loss) |
$ | 20,890,868 | $ | (18,520,070 | ) | $ | 21,053,984 | |||||
| Adjustments to reconcile net income (loss) to net cash provided by operating activities: |
||||||||||||
| Depreciation and amortization |
23,419,257 | 22,367,235 | 20,673,441 | |||||||||
| Accretion of obligation under business purchase agreement |
— | 272,494 | 326,820 | |||||||||
| Impairment of goodwill and intangible assets |
— | — | 20,184,607 | |||||||||
| Provision for doubtful accounts |
1,171,231 | 1,190,960 | 1,819,604 | |||||||||
| Deferred income tax benefit |
(344,702 | ) | (209,296 | ) | (2,853,137 | ) | ||||||
| Loss (gain) on sale or disposal of assets |
24,584 | (7,232 | ) | (5,011 | ) | |||||||
| Gain on sale of equipment involuntarily damaged or lost down-hole |
(2,583,532 | ) | (2,108,666 | ) | (7,189,168 | ) | ||||||
| Change in operating assets and liabilities: |
||||||||||||
| Accounts receivable |
(19,227,411 | ) | 20,277,850 | (11,513,587 | ) | |||||||
| Receivables from related parties |
(3,602,057 | ) | (1,249,094 | ) | 843,193 | |||||||
| Inventories |
(1,012,757 | ) | 308,559 | (341,990 | ) | |||||||
| Prepaid expenses and other |
55,728 | 747,162 | (178,576 | ) | ||||||||
| Other assets |
1,092 | 1,236 | 1,461,969 | |||||||||
| Payables to related parties |
364,413 | (15,729 | ) | (639,239 | ) | |||||||
| Accounts payable and accrued and other current liabilities |
10,774,559 | (576,012 | ) | (4,985,573 | ) | |||||||
| Net cash provided by operating activities |
29,931,273 | 22,479,397 | 38,657,337 | |||||||||
| Cash flows from investing activities |
||||||||||||
| Proceeds from sale of equipment involuntarily damaged or lost down-hole |
3,640,558 | 3,536,835 | 8,518,288 | |||||||||
| Proceeds from asset disposals |
675,682 | 46,861 | 83,902 | |||||||||
| Additions to property and equipment |
(52,569,174 | ) | (9,455,058 | ) | (32,847,685 | ) | ||||||
| Net cash used in investing activities |
(48,252,934 | ) | (5,871,362 | ) | (24,245,495 | ) | ||||||
| Cash flows from financing activities |
||||||||||||
| Payments on capital lease obligations |
(1,891,821 | ) | (555,903 | ) | (363,367 | ) | ||||||
| Advances under long-term debt agreements |
8,698,328 | — | — | |||||||||
| Payments on long-term debt agreements |
(12,553 | ) | — | — | ||||||||
| Cash collateral held by lender |
(1,245,603 | ) | — | — | ||||||||
| Deferred financing costs |
(82,906 | ) | — | — | ||||||||
| Advances from Great White Energy Services LLC |
30,592,376 | 12,198,381 | 7,368,823 | |||||||||
| Payments to Great White Energy Services LLC |
(18,635,730 | ) | (11,682,467 | ) | (11,891,419 | ) | ||||||
| Payments under business purchase obligation |
— | (4,536,932 | ) | — | ||||||||
| Capital distributions |
(14,703,703 | ) | (21,737,915 | ) | (23,782,971 | ) | ||||||
| Capital contributions |
22,176,340 | 10,616,000 | 12,658,072 | |||||||||
| Capital distributed by variable interest entities |
(70,000 | ) | (50,000 | ) | (45,401 | ) | ||||||
| Net cash provided by (used in) financing activities |
24,824,728 | (15,748,836 | ) | (16,056,263 | ) | |||||||
| Net increase (decrease) in cash and cash equivalents |
6,503,067 | 859,199 | (1,644,421 | ) | ||||||||
| Cash and cash equivalents at beginning of period |
1,485,845 | 626,646 | 2,271,067 | |||||||||
| Cash and cash equivalents at end of period |
$ | 7,988,912 | $ | 1,485,845 | $ | 626,646 | ||||||
| Cash paid for interest, net of capitalized interest |
$ | 371,665 | $ | 844,999 | $ | 1,256,023 | ||||||
| Non-cash investing and financing activities |
||||||||||||
| Property and equipment acquired by capital lease |
$ | 2,268,826 | $ | 780,343 | $ | 3,703,088 | ||||||
| Noncash conversion of advances from Great White Energy Services LLC to equity (Note H) |
$ | 21,782,294 | $ | — | $ | — | ||||||
| Capital contribution receivable |
$ | 1,000 | $ | — | $ | — | ||||||
The accompanying notes are an integral part of these financial statements
F-6
Table of Contents
Index to Financial Statements
Notes to Consolidated Financial Statements
Note A-Nature of Operations and Summary of Significant Accounting Policies
GW Holdings I LLC was formed December 10, 2010 by Wexford Capital LP (“Wexford”). The membership interests or common stock, as applicable, in Great White Pressure Control LLC, Great White Pressure Pumping LLC, Acid, Inc., Great White Directional Services LLC, Diamondback-Directional Drilling LLC, and Great White Energy Services, Inc. (“GWES”) were contributed on December 31, 2010 to GW Holdings I LLC by GWES Holdings LLC and Diamondback Holdings, LLC, which are entities controlled and managed by Wexford. Accordingly, the contributions were treated as a combination of entities under common control and the assets and liabilities contributed have been accounted for at the historical cost of the contributing entities and the Company’s financial statements include all operations and transactions of the contributed entities for all periods presented. Collectively, GW Holdings I LLC, and its wholly owned subsidiaries, Great White Pressure Control LLC, Great White Pressure Pumping LLC, Acid, Inc., Great White Directional Services LLC, Diamondback-Directional Drilling LLC, and GWES are referred to as the (“Company”). GWES was formed on December 1, 2010 in anticipation of an initial public offering (“IPO”). Prior to the consummation of the IPO, GW Holdings I LLC will be merged with GWES and GWES will continue as the surviving corporation. These financial statements also include a consolidated variable interest entity, Caliber Wyoming Properties, LLC and certain allocated activities of Great White Energy Services LLC and Diamondback Holdings, LLC.
Certain management, administrative, and treasury functions were provided to the Company by Great White Energy Services LLC, a wholly owned subsidiary of GWES Holdings LLC, and Diamondback Holdings, LLC. For purposes of presenting the consolidated financial statements, allocations were required to determine the cost of general and administrative activities performed attributable to the Company. The allocations were made based upon underlying salary costs of employees performing Company related functions, payroll, revenue, or headcount relative to other companies managed by Great White Energy Services LLC or Diamondback Holdings, LLC, or specifically identified invoices processed, depending on the nature of the cost. Management believes that the allocation methodology was reasonable; however, expenses allocated to the Company are not necessarily indicative of the expenses that would have been incurred on a stand-alone basis nor are they indicative of costs that may be incurred in the future.
Generally, a centralized cash management program was utilized under which cash receipts and cash disbursements of the Company were remitted to or funded from central accounts owned and controlled by Great White Energy Services LLC or Diamondback Holdings, LLC. Such disbursement transactions with Great White Energy Services LLC were reported as a liability because it was expected that net amounts advanced would be repaid. Such cash receipts transactions with Great White Energy Services LLC were reported as reductions to the liability. Great White Energy Services LLC charged interest on net amounts advanced based on interest rates consistent with its line of credit. Such transactions with Diamondback Holdings, LLC were reported as equity transactions and no interest was charged.
Member’s equity includes transfers of cash to or from Diamondback Holdings, LLC to fund certain of the Company’s operations. Other transactions affecting member’s equity include general, administrative, and corporate overhead expenses allocated to the Company.
Operations
The Company is an oilfield service company that provides horizontal and directional drilling and completion and production services used in connection with drilling oil and natural gas wells. The Company provides horizontal and directional drilling services by using directional drilling motors and measurement while drilling and electromagnetic technology systems. The Company’s completion and production services include hydraulic fracturing, coil tubing, snubbing, wireline, nitrogen, fluid pumping and well control. All of the Company’s
F-7
Table of Contents
Index to Financial Statements
GW Holdings I LLC
Notes to Consolidated Financial Statements
operations are in the United States. Primary regions of operations are the Mid-Continent Basin, Permian Basin, Rocky Mountain region and Appalachian Basin. The Company’s business depends in large part on the conditions in the oil and natural gas industry and specifically on the amount of capital spending by its customers. Any prolonged increase or decrease in oil and natural gas prices affects the levels of exploration, development and production activity, as well as the entire health of the oil and natural gas industry. Changes in the commodity prices for oil and natural gas could have a material effect on the Company’s results of operations and financial condition.
A summary of the significant accounting policies are as follows.
| 1. | Principles of Consolidation |
The consolidated financial statements are prepared in accordance with accounting principles generally accepted in the United States of America (“U.S. GAAP”). All material accounts and transactions between the entities within the Company have been eliminated in the consolidated financial statements.
| 2. | Cash and Cash Equivalents |
All highly liquid investments with a maturity of three months or less when acquired are considered cash equivalents.
| 3. | Accounts Receivable |
Accounts receivable include amounts due from customers for services performed and are recorded as the work progresses. The Company grants credit to customers in the ordinary course of business and generally does not require collateral. Most areas in which the Company operates provide for a mechanic’s lien against the property on which the service is performed if the lien is filed within the statutorily specified time frame. Customer balances are generally considered delinquent if unpaid by the 30th day following the invoice date and credit privileges may be revoked if balances remain unpaid.
The Company regularly reviews receivables and provides for estimated losses through an allowance for doubtful accounts. In evaluating the level of established reserves, the Company makes judgments regarding its customers’ ability to make required payments, economic events, and other factors. As the financial condition of customers change, circumstances develop, or additional information becomes available, adjustments to the allowance for doubtful accounts may be required. In the event the Company was to determine that a customer may not be able to make required payments, the Company would increase the allowance through a charge to income in the period in which that determination is made. Uncollectible accounts receivable are periodically charged against the allowance for doubtful accounts once final determination is made of their uncollectability.
F-8
Table of Contents
Index to Financial Statements
GW Holdings I LLC
Notes to Consolidated Financial Statements
The following is a roll forward of the allowance for doubtful accounts for the years ended December 31, 2010, 2009 and 2008:
| Balance, January 1, 2008 |
$ | 825,509 | ||
| Additions charged to expense |
1,819,604 | |||
| Deductions for uncollectible receivables written off |
(1,591,570 | ) | ||
| Balance, December 31, 2008 |
1,053,543 | |||
| Additions charged to expense |
1,190,960 | |||
| Deductions for uncollectible receivables written off |
(844,646 | ) | ||
| Balance, December 31, 2009 |
1,399,857 | |||
| Additions charged to expense |
1,171,231 | |||
| Deductions for uncollectible receivables written off |
(1,247,578 | ) | ||
| Balance, December 31, 2010 |
$ | 1,323,510 | ||
| 4. | Inventories |
Inventories are stated at the lower of cost or market, determined on a first in first out cost basis. Inventories consist of repair parts and consumable supplies. The Company assesses the valuation of its inventories based upon specific usage and future utility. A charge to results of operations is taken when factors that would result in a need for a reduction in the valuation, such as excess or obsolete inventory, are determined. As of December 31, 2010 and 2009, the reserves were nominal.
| 5. | Property and Equipment |
Property and equipment are recorded at cost. Expenditures for major additions and improvements are capitalized while minor replacements, maintenance, and repairs, which do not increase the capacity, improve the efficiency or safety, or improve or extend the useful life of such assets, are charged to operations as incurred. Disposals are removed at cost, less accumulated depreciation, and any resulting gain or loss is reflected in operations.
Proceeds from customers for horizontal and directional drilling services equipment involuntarily damaged or lost down-hole are reflected in revenue with the carrying value of the related equipment charged to cost of revenues and are reported as cash inflows from investing activities in the statement of cash flows. For the years ended December 31, 2010, 2009 and 2008, proceeds from the sale of equipment involuntarily damaged or lost down-hole were $3,640,558, $3,536,835 and $8,518,288, respectively, and gain on sales of equipment involuntarily damaged or lost down-hole were $2,583,532, $2,108,666, and $7,189,168, respectively.
Depreciation is calculated using the straight-line method over the shorter of the estimated useful life, or the remaining lease term, as applicable. The useful lives of the major classes of property and equipment are as follows:
| Office equipment, furniture and fixtures |
3-10 years | |||
| Machinery and equipment: |
||||
| Horizontal and directional drilling services |
2-7 years | |||
| Completion and production services |
2-12 years | |||
| Vehicles and trailers |
3-7 years | |||
| Buildings and leasehold improvements |
3-40 years |
F-9
Table of Contents
Index to Financial Statements
GW Holdings I LLC
Notes to Consolidated Financial Statements
| 6. | Long-Lived Assets |
Long-lived assets, primarily property and equipment and amortizable intangibles, are reviewed for impairment when events or changes in circumstances indicate that the carrying amount of such assets may not be recoverable. Recoverability of such assets is evaluated by measuring the carrying amount of the assets against the estimated undiscounted future cash flows associated with the assets. If such evaluations indicate that the future undiscounted cash flows from the assets are not sufficient to recover the carrying value of such assets, the assets are adjusted to their estimated values.
There were no acquisitions of intangible assets during the years ended December 31, 2010, 2009 or 2008. The decline in oil and gas commodity prices as well as the overall downturn affecting the United States and worldwide economies that occurred in the latter half of 2008 significantly impacted the Company’s operations. As a result of these changes in economic conditions, the Company reviewed its long-lived assets for potential impairment. During 2008, amortizable intangible assets with a carrying value of $6,172,906 were determined to be impaired and were written off. Impairment amounts were determined by comparing the fair values of the long-lived assets, as determined through discounted cash flows, with the carrying values of the related assets.
| 7. | Amortizable Intangible Assets |
Intangible assets subject to amortization include customer relationships and trade names. Customer relationships are amortized based on an estimated attrition factor of their useful life of 9 to 16 years and trade names are amortized straight line over their estimated useful lives of 20 years.
| 8. | Goodwill |
Goodwill is tested for impairment as of October 1 each year or more frequently if events or changes in circumstances indicate that goodwill might be impaired. The impairment test is a two-step process. First, the fair value of each reporting unit is compared to its carrying value to determine whether an indication of impairment exists. If impairment is indicated, then the implied value of the reporting unit’s goodwill is determined by allocating the unit’s fair value to its assets and liabilities as if the reporting unit had been acquired in a business combination. The fair value of the reporting unit is determined using the discounted cash flow approach, excluding interest. The amount of impairment for goodwill is measured as the excess of its carrying value over its implied value.
No indications of impairment were noted during the years ended December 31, 2010 or 2009. As a result of the decline in commodity prices and the downturn in the economy, as previously described, goodwill of $14,011,701 was determined to be impaired and written off in 2008.
| 9. | Deferred Financing Costs |
The Company capitalizes certain costs in connection with obtaining its borrowings, such as lender’s fees and related attorney’s fees. These costs are charged to interest expense over the contractual term of the debt using the effective interest method.
| 10. | Litigation and Self-Insured Risk Reserves |
The Company estimates its reserves related to litigation and self-insured risks based on the facts and circumstances specific to the litigation and self-insured claims. There were no litigation reserves as of December 31, 2010 or 2009. The Company maintains accruals in the consolidated balance sheets to cover estimated self-insurance retentions (See Note N).
F-10
Table of Contents
Index to Financial Statements
GW Holdings I LLC
Notes to Consolidated Financial Statements
| 11. | Revenue Recognition |
The Company generates revenue from multiple sources within its two operating segments. In all cases, revenue is recognized when services are performed, collection of the receivable is probable, persuasive evidence of an arrangement exists, and the price is fixed and determinable. Services are sold without warranty or right of return. Taxes assessed on revenue transactions are presented on a net basis and are not included in revenue.
Horizontal and directional drilling services are provided on a day rate or hourly basis. Revenue is recognized as the work progresses. Proceeds from customers for the cost of oilfield rental equipment that is involuntarily damaged or lost down-hole are reflected as revenues.
Completion and production services are typically provided on a day rate or contracted basis and revenue is recognized as the work progresses. Additional revenue is generated through the sale of consumable supplies that are incidental to the service being performed.
| 12. | Cost of Revenue |
The primary components of cost of revenue are those salaries, consumable supplies, repairs and maintenance and general operational costs that are directly associated with the services performed for the customers. Cost of revenue – related parties reflects expenses incurred from related parties.
| 13. | Use of Estimates |
The preparation of financial statements in conformity with U.S. GAAP requires management to make estimates and assumptions that affect the reported amounts of assets and liabilities, the disclosure of contingent assets and liabilities at the date of the financial statements and the reported amounts of revenues and expenses during the reporting period. Actual results could differ from those estimates. Significant estimates include but are not limited to the allowance for doubtful accounts, reserves for self-insurance, depreciation and amortization of property and equipment and amortizable intangibles, future cash flows and fair values used to assess recoverability and impairment of long-lived assets and goodwill and allocation of general, administrative and corporate overhead expenses.
| 14. | Income Taxes |
Each of the operating entities comprising the Company other than Acid, Inc. are limited liability companies and as such are treated as pass-through entities for income tax purposes. As pass-through entities, income taxes on net earnings are payable by the members and are not reflected in the financial statements. Acid, Inc. is subject to corporate income taxes, and such taxes are provided in the financial statements based upon Financial Accounting Standards Board (“FASB”) Accounting Standard Codification (“ASC”) 740, Income Taxes. Under FASB ASC 740, deferred tax assets and liabilities are recognized for the future tax consequences attributable to differences between the financial statement carrying amounts of existing assets and liabilities and their respective tax bases. Deferred tax assets and liabilities are measured using statutory tax rates expected to apply to taxable income in the years in which those temporary differences are expected to be recovered or settled. The effect of deferred tax assets and liabilities as a result of a change in tax rate is recognized in the period that includes the statutory enactment date. A valuation allowance for deferred tax assets is recognized when it is more likely than not that the benefit of deferred tax assets will not be realized.
As required by ASC 740, the Company recognizes the financial statement benefit of a tax position only after determining that the relevant tax authority would more likely than not sustain the position following an audit. For tax positions meeting the more-likely-than-not threshold, the amount recognized in the financial
F-11
Table of Contents
Index to Financial Statements
GW Holdings I LLC
Notes to Consolidated Financial Statements
statements is the largest benefit that has a greater than 50 percent likelihood of being realized upon ultimate settlement with the relevant tax authority. During the years ended December 31, 2010, 2009 and 2008, there were no financial statement benefits or obligations recognized related to uncertain tax positions.
Certain operations of the Company are also subject to the Texas Margin Tax or Michigan Business Tax, and the Company accounts for these taxes based upon the provisions of FASB ASC 740. Generally, the pass-through entities are no longer subject to tax examinations by tax authorities for years before 2006.
The Company’s accounting policy relating to income tax penalties and interest assessments is to accrue for these costs and record a charge to selling, general and administrative expense for tax penalties and a charge to interest expense for interest assessments during the period that the Company has unrecognized tax benefits.
Acid, Inc. files income tax returns in the U.S. federal jurisdiction and various state jurisdictions. Generally, Acid, Inc. is no longer subject to U.S. federal and state income tax examinations by tax authorities for years before 2007.
Based on estimates of the temporary differences as of December 31, 2010, upon conversion to a taxable entity, net deferred tax liabilities of approximately $20,100,000 will be recognized with a corresponding charge to provision for income taxes.
| 15. | Unaudited Pro Forma Income Taxes and Earnings Per Share |
Upon completion of a proposed initial public offering (“IPO”) by the Company of its common stock, the Company will be treated as a C-Corp under the Internal Revenue Code and will be subject to income taxes. Accordingly, a pro forma income tax provision has been disclosed as if the Company were a C-Corp for all periods presented. The pro forma tax expense has been calculated at a rate of 38%. The tax rate is based upon a federal corporate level tax rate and a state tax rate, net of federal benefit, incorporating permanent differences.
Upon the merger of GW Holdings I LLC and GWES in contemplation of a proposed IPO, the Company has presented pro forma earnings per share for the most recent annual period. Pro forma basic and diluted income (loss) per share has been computed by dividing net income (loss) attributable to the Company by the number of shares of common stock determined as if the shares of GWES common stock issued to GWES Holdings (28,456,554 shares) and Diamondback Holdings, LLC (15,322,760 shares) in the merger were outstanding for all of 2010.
| 16. | Financial Instruments |
The Company’s financial instruments consist primarily of cash and cash equivalents, trade receivables, trade payables, advances from Great White Energy Services LLC, and long-term debt. The carrying value of cash and cash equivalents, trade receivables, trade payables, and advances from Great White Energy Services LLC are considered representative of their fair value due to the short term nature of these instruments. The carrying value of long-term debt is deemed representative of fair value based on bearing interest rates and having terms comparable to prevailing market conditions.
The cash collateral agreement held by lender is security related to certain of the Company’s long-term debt, is non-interest bearing, and has a carrying value of $1,245,603 and a fair value of $1,187,677. Fair value was determined by discounting the carrying amount by the interest rate offered on 36 month certificates of deposit.
| 17. | Concentrations of Credit Risk and Significant Customers |
Financial instruments that potentially subject the Company to concentrations of credit risk consist of cash and cash equivalents occasionally in excess of federally insured limits and trade receivables. The
F-12
Table of Contents
Index to Financial Statements
GW Holdings I LLC
Notes to Consolidated Financial Statements
Company’s accounts receivable have a concentration in the oil and natural gas industry and the customer base consists primarily of independent oil and natural gas producers.
Both of the Company’s operating segments provide services to one company which accounted for total revenue of 17.9% in 2010, 11.1% in 2009, and 13.2% in 2008. This company represented 16.0% and 13.1% of consolidated accounts receivable at December 31, 2010 and 2009, respectively.
| 18. | Concentration of Key Raw Material Suppliers |
The completion and production services segment relies on a limited number of suppliers for sand and other proppants. These key materials are critical for certain of the Company’s operations. The loss of one or more of these suppliers or the limited availability of these materials may negatively impact the Company’s revenues or increase its operating costs.
| 19. | Variable Interest Entities |
The Company has a lease agreement for certain land and property with Caliber Wyoming Properties, LLC. Caliber Wyoming Properties, LLC is an entity controlled by Wexford. The primary operation of this entity is to own and lease facilities to the Company. In accordance with FASB ASC 810, Consolidation, the Company determined that Caliber Wyoming Properties, LLC is a variable interest entity in which it is the primary beneficiary. As such, the entity has been consolidated. The Company does not have legal control over Caliber Wyoming Properties, LLC and its liabilities do not represent additional claims on the Company’s assets; rather they represent claims against the specific assets of Caliber Wyoming Properties, LLC. Likewise, the assets of Caliber Wyoming Properties, LLC do not represent additional assets available to satisfy the claims against the Company’s assets. At December 31, 2010, the assets of Caliber Wyoming Properties, LLC were $643,503, and current liabilities were $4,483. The assets were comprised of cash and cash equivalents of $43,013 and net property and equipment of $600,490. At December 31, 2009, the assets and current liabilities were $671,160 and $3,114, respectively. The net equity of Caliber Wyoming Properties, LLC is included in equity as a non-controlling interest in variable interest entities.
| 20. | Recent Accounting Pronouncements |
In January 2010, the FASB issued ASU No. 2010-06, “Improving disclosures about Fair Value Measurements” (“ASU No. 2010-06”). ASU No. 2010-06 requires the disclosure of significant transfers in and out of Level 1 and Level 2 fair value measurements. It also requires that Level 3 fair value measurements present information about purchases, sales, issuances and settlements. Fair value disclosures should also disclose valuation techniques and inputs used to measure both recurring and nonrecurring fair value measurements. This update became effective for the Company on January 1, 2010, except for the disclosures about purchases, sales, issuances and settlements in the roll forward in activity in Level 3 fair value measurements, which becomes effective January 1, 2011. This update did not change the techniques the Company uses to measure fair values and is not expected to have a material impact on the Company’s consolidated financial statements.
In December 2009, the FASB issued Accounting Standards Update (“ASU”) 2009-17, “Consolidations (ASC Topic 810): Improvements to Financial Reporting by Enterprises Involved with Variable Interest Entities” (“ASU 2009-17”), which was effective for annual periods beginning after November 15, 2009. ASU 2009-17 requires Company management to consider a variable interest entity’s purpose and design and the Company’s ability to direct the activities of the variable interest entity that most significantly impact such entity’s economic performance when determining whether such entity should be consolidated. The Company adopted the provisions of ASU 2009-17 as required on January 1, 2010. The provisions had no impact on the Company’s consolidated financial position or results of operations upon adoption.
F-13
Table of Contents
Index to Financial Statements
GW Holdings I LLC
Notes to Consolidated Financial Statements
Note B-Inventory
Inventory consists of the following as of December 31:
| 2010 | 2009 | |||||||
| Repair parts |
$ | 2,984,205 | $ | 2,292,604 | ||||
| Consumable supplies |
1,085,261 | 764,105 | ||||||
| $ | 4,069,466 | $ | 3,056,709 | |||||
Note C-Property and Equipment
Net property and equipment consists of the following as of December 31:
| 2010 | 2009 | |||||||
| Office equipment, furniture and fixtures |
$ | 3,153,842 | $ | 2,794,448 | ||||
| Machinery and equipment |
||||||||
| Horizontal and directional drilling services |
55,951,404 | 43,708,539 | ||||||
| Completion and production services |
101,947,569 | 81,402,226 | ||||||
| Vehicles and trailers |
9,237,655 | 7,099,085 | ||||||
| Buildings and leasehold improvements |
12,303,379 | 12,337,600 | ||||||
| 182,593,849 | 147,341,898 | |||||||
| Less accumulated depreciation and amortization |
(69,513,879 | ) | (49,064,527 | ) | ||||
| 113,079,970 | 98,277,371 | |||||||
| Deposits on equipment and equipment in process of assembly |
19,980,973 | 735,074 | ||||||
| Land |
1,023,711 | 1,023,963 | ||||||
| $ | 134,084,654 | $ | 100,036,408 | |||||
The Company has certain buildings and equipment under capital leases that extend through 2027. Amortization of assets recorded under capital leases is reported in depreciation and amortization. The carrying value of assets held under capital lease and the related accumulated amortization consists of the following as of December 31:
| 2010 | 2009 | |||||||
| Buildings under capital leases |
$ | 7,783,525 | $ | 7,778,767 | ||||
| Equipment under capital leases |
1,760,850 | — | ||||||
| Vehicles under capital leases |
544,310 | 241,299 | ||||||
| Accumulated amortization |
(1,899,371 | ) | (1,046,136 | ) | ||||
| $ | 8,189,314 | $ | 6,973,930 | |||||
Deposits on equipment and equipment in process of assembly represents deposits placed with vendors for equipment that is in the process of assembly and purchased equipment that is being outfitted for its intended use. This equipment is not depreciated until it has been placed in service.
Depreciation expense charged to operations totaled $21,982,172, $20,526,486, and $17,537,656 for the years ended December 31, 2010, 2009 and 2008, respectively.
Capitalized interest totaled $295,957 for the year ended December 31, 2010.
F-14
Table of Contents
Index to Financial Statements
GW Holdings I LLC
Notes to Consolidated Financial Statements
Note D-Other Non-current Assets
Other non-current assets consist of the following as of December 31:
| 2010 | 2009 | |||||||
| Cash collateral held by lender |
$ | 1,245,603 | $ | — | ||||
| Deferred financing costs, net |
82,906 | — | ||||||
| Deposits |
40,554 | 41,646 | ||||||
| $ | 1,369,063 | $ | 41,646 | |||||
In connection with the $10,000,000 credit agreement discussed in Note I, Great White Pressure Pumping LLC was required to deposit cash collateral with the lender. The lender has sole and exclusive possession and control of the cash collateral. The cash collateral does not accrue interest. Upon satisfaction of all the obligations contained in the credit agreement, the lender is obligated to return the cash collateral.
Note E-Intangible Assets
The tables below provide a summary of the Company’s intangible assets subject to amortization as of December 31:
| 2010 | ||||||||||||||||
| Estimated Useful Lives |
Gross Carrying Amount |
Accumulated Amortization |
Net Carrying Amount |
|||||||||||||
| Customer relationships |
9-16 yrs | $ | 14,557,000 | $ | 7,807,311 | $ | 6,749,689 | |||||||||
| Trade names |
20 yrs | 1,220,000 | 205,875 | 1,014,125 | ||||||||||||
| $ | 15,777,000 | $ | 8,013,186 | $ | 7,763,814 | |||||||||||
| 2009 | ||||||||||||||||
| Estimated Useful Lives |
Gross Carrying Amount |
Accumulated Amortization |
Net Carrying Amount |
|||||||||||||
| Customer relationships |
9-16 yrs | $ | 14,557,000 | $ | 6,431,226 | $ | 8,125,774 | |||||||||
| Trade names |
20 yrs | 1,220,000 | 144,875 | 1,075,125 | ||||||||||||
| $ | 15,777,000 | $ | 6,576,101 | $ | 9,200,899 | |||||||||||
For the years ended December 31, 2010, 2009 and 2008, amortization expense totaled $1,437,085, $1,840,749 and $3,135,785, respectively. During 2008, intangible assets with a carrying value of $6,172,906 were written off due to impairment.
Estimated amortization expense for the years subsequent to December 31, 2010 is as follows:
| 2011 |
$ | 1,176,924 | ||
| 2012 |
975,796 | |||
| 2013 |
815,204 | |||
| 2014 |
695,588 | |||
| 2015 |
609,188 | |||
| Thereafter |
3,491,114 | |||
| Total |
$ | 7,763,814 | ||
F-15
Table of Contents
Index to Financial Statements
GW Holdings I LLC
Notes to Consolidated Financial Statements
Note F-Accrued and Other Current Liabilities
Accrued and other current liabilities consisted of the following as of December 31:
| 2010 | 2009 | |||||||
| Accrued compensation, benefits and related taxes |
$ | 5,336,125 | $ | 4,118,905 | ||||
| Sales taxes |
3,210,394 | 675,234 | ||||||
| Insurance payable |
1,174,968 | 208,074 | ||||||
| Other |
366,327 | 410,673 | ||||||
| $ | 10,087,814 | $ | 5,412,886 | |||||
In connection with the start-up of Great White Pressure Control LLC the Company entered into employment agreements with certain key executives which provided signing bonuses if the executive is still employed by the Company upon the third anniversary. The obligation was accrued over the three years for which service was provided and totaled $2,000,000 at December 31, 2010 and 2009, and is included in accrued compensation, benefits and related taxes. Under the terms of an amendment, the payment of this amount is deferred and each employee has indemnified the Company, up to their accrued amount, in relation to any adverse outcome of litigation accusing the Company of misappropriation of trade secrets and unfair competition relating to the Company’s employment of plaintiff’s former employees. All expenses of defense will be borne by the Company (See Note N).
Note G-Obligation under Business Purchase Agreement
In connection with the acquisition of Acid, Inc. in 2006, the Company entered into an agreement to defer payment of a portion of the purchase price for 36 months. The obligation bore interest on the face value at 5% on redemption. The Company recorded this obligation at fair value at the date of acquisition, which resulted in a discount to the face value. The Company accreted the obligation to its redemption value. The obligation was fully paid in 2009.
Note H-Debt of Related Parties
On June 29, 2007, Great White Energy Services LLC and certain of it sister companies (the “borrowers” or “borrowing group”), including Great White Pressure Control LLC, Great White Pressure Pumping LLC and Acid, Inc., entered into a revolving line of credit agreement with a group of banks. The line matured October 2009 and all outstanding principal, accrued and unpaid interest, and any other charges then remaining outstanding on the line of credit were due. At December 31, 2009, the borrowers were in default and were negotiating an extension with the lenders.
Effective February 4, 2010, the existing lenders assigned 100% of their rights and obligations, including all liens and security interests in the collateral, under the credit agreement to Diamondback Holdings, LLC in exchange for full payment of all principal and any other charges outstanding on the line of credit. On May 4, 2010 (with an effective date of March 11, 2010) Great White Energy Services LLC entered into an agreement with Diamondback Holdings, LLC to extend the maturity of the line of credit to April 30, 2011 and waive all defaults.
Effective September 30, 2010 Diamondback Holdings, LLC limited the liability of Great White Pressure Control LLC and Great White Pressure Pumping LLC under the credit agreement to $12,000,000 plus any additional principal sums advanced and extended the maturity date to April 30, 2012. The amount represented the majority of the then outstanding advances from Great White Energy Services LLC. During 2010, the interest rate on this line of credit was 7.25%.
F-16
Table of Contents
Index to Financial Statements
GW Holdings I LLC
Notes to Consolidated Financial Statements
In connection with the Diamondback Holdings, LLC contributions described in Note A that were made on December 31, 2010, Diamondback Holdings, LLC converted the principal plus accrued interest outstanding under the credit agreement to equity in GW Holdings I LLC. The total amount outstanding as of the date of conversion was $21,782,294, which included principal of $20,800,000 and accrued interest of $982,294.
Note I-Long-Term Debt
Long-term debt consists of the following as of December 31:
| 2010 | 2009 | |||||||
| Credit facilities: |
||||||||
| Term loan |
$ | 8,296,710 | $ | — | ||||
| Vehicle loans |
389,065 | — | ||||||
| 8,685,775 | — | |||||||
| Less current portion |
2,673,605 | — | ||||||
| Total |
$ | 6,012,170 | $ | — | ||||
On November 24, 2010, Great White Pressure Pumping LLC entered into a borrowing agreement with a third party. The maximum amount available under the agreement is $10,000,000. The agreement subjects Great White Pressure Pumping LLC to certain financial reporting requirements and financial covenants. The credit agreement requires maintenance of a minimum tangible net worth of $95,000,000 and restricts the aggregate amount of dividends and/or distributions, excluding loan payments made to a parent or affiliate in connection with the credit agreement, to the amount of annual net income based on the results of the rolling last four (4) quarters. The credit agreement is secured by certain specified equipment and cash collateral (See Note D). Each draw is treated as a separate note under the terms of the credit agreement. The separate notes mature in 36 months and require monthly payments of principal and interest. As of December 31, 2010, the monthly payments were $253,467. The maturity dates range between December 2013 and January 2014. The interest rate on the notes is fixed and was 6.28% as of December 31, 2010. The borrowing agreement is secured by assets with a cost of $14,427,283 at December 31, 2010. The Company was in compliance with the financial covenants at December 31, 2010.
On various dates between November 26, 2010 and December 3, 2010, Great White Pressure Pumping entered into borrowing agreements to finance the purchase of certain vehicles. The agreements are secured by certain specified vehicles. The cost of the vehicles serving as collateral for the borrowing agreements was $401,618 at December 31, 2010. The loan agreements are for 36 months and require monthly payments of principal and interest. As of December 31, 2010, the monthly payments were $12,434. The interest rate on the loans is fixed at 6.99%.
At December 31, 2010 the aggregate maturities of long-term debt, excluding capital leases, are as follows:
| 2011 |
$ | 2,673,605 | ||
| 2012 |
2,892,926 | |||
| 2013 |
3,066,605 | |||
| 2014 |
52,639 | |||
| Total |
$ | 8,685,775 | ||
F-17
Table of Contents
Index to Financial Statements
GW Holdings I LLC
Notes to Consolidated Financial Statements
Note J-Capital Leases
The Company leases three properties for its completion and production service operation from a related third party controlled by Wexford. The leases commenced in 2007 and 2008 and have lease terms of 20 years with options for two five year extensions. The aggregate monthly lease payments are $54,922 and provide for annual lease escalation based on increases in the consumer price index.
The Company also leases another operating facility for its completion and production service operations from a development company controlled by an employee of the operations. The lease was effective April 1, 2009 and has an initial term of five years with options for three five year extensions. The Company has the option to purchase the facility at a prescribed formula based on the facility’s cost at any time after the first extension term or at any time upon the employee’s termination, his departure from the development company, or his receipt of a bona fide third party offer to purchase the property. The monthly lease payments are $11,250 during the initial term and subject to negotiation thereafter.
The Company leases certain equipment under a capital lease. The lease terms are 42 months at an aggregate monthly payment of $16,724. Ownership of the assets transfers at expiration of the lease but purchase of the assets, at a prescribed formula, can be accelerated at lessee’s option at any time.
The Company leases certain equipment under a capital lease. The lease terms are 12 months at an aggregate monthly payment of $135,324. Ownership of the assets transfers at expiration of the lease.
The Company leases certain vehicles under a capital lease. The terms are 36 months at an aggregate monthly payment of $16,104.
Future minimum lease payments under capital leases as of December 31, 2010 are:
| 2011 |
$ | 1,564,480 | ||
| 2012 |
1,068,065 | |||
| 2013 |
890,963 | |||
| 2014 |
747,822 | |||
| 2015 |
659,072 | |||
| Thereafter |
7,340,657 | |||
| Total minimum payments |
12,271,059 | |||
| Less amounts representing interest |
4,785,395 | |||
| Total obligations under capital leases |
7,485,664 | |||
| Less current portion |
1,029,137 | |||
| Long-term portion |
$ | 6,456,527 | ||
Note K-Operating Leases
The Company has committed to various facility and equipment leases some of which have renewal and purchase options. The lease terms vary from one year to 20 years. Future minimum lease payments for these leases are as follows as of December 31, 2010:
| 2011 |
$ | 683,844 | ||
| 2012 |
469,472 | |||
| 2013 |
363,872 | |||
| 2014 |
246,850 | |||
| 2015 |
241,792 | |||
| Thereafter |
2,547,124 | |||
| Total |
$ | 4,552,954 | ||
F-18
Table of Contents
Index to Financial Statements
GW Holdings I LLC
Notes to Consolidated Financial Statements
Rent expense for the years ended December 31, 2010, 2009, and 2008 was $1,004,913, $926,770 and $743,826, respectively.
The Company leases two facilities from a Wexford controlled entity which are included in the future minimum lease payments presented above. The leases commenced in 2006 and 2007 and have a term of 20 years. One of the leases has options for two five year extensions and the other lease provides for one five year renewal option. The monthly lease payments aggregate to $19,700 and provide for an annual lease escalation based on increase in the consumer price index.
Note L-Income Taxes
Income tax expense (benefit) consists of the following for the year ended December 31:
| 2010 | 2009 | 2008 | ||||||||||
| Current: |
||||||||||||
| Federal |
$ | 385,983 | $ | 47,882 | $ | (96,913 | ) | |||||
| State |
232,067 | 189,087 | 494,854 | |||||||||
| Total |
618,050 | 236,969 | 397,941 | |||||||||
| Deferred: |
||||||||||||
| Federal |
(302,317 | ) | (176,214 | ) | (2,509,870 | ) | ||||||
| State |
(42,385 | ) | (33,082 | ) | (343,267 | ) | ||||||
| Total |
(344,702 | ) | (209,296 | ) | (2,853,137 | ) | ||||||
| Total |
||||||||||||
| Federal |
83,666 | (128,332 | ) | (2,606,783 | ) | |||||||
| State |
189,682 | 156,005 | 151,587 | |||||||||
| Total |
$ | 273,348 | $ | 27,673 | $ | (2,455,196 | ) | |||||
The entities comprising the Company are primarily pass through entities for federal tax purposes. As such, the income taxes related to those entities are payable by the members and are not reflected in the financial statements. As of December 31, 2010, the tax basis of the assets and liabilities of the pass through entities is less than the related reported amounts by approximately $52,900,000.
The tax effects of temporary differences that give rise to deferred income tax assets and liabilities are as follows as of December 31:
| 2010 | 2009 | |||||||
| Deferred income tax assets |
||||||||
| NOL carry-forward |
$ | — | $ | 304,956 | ||||
| Other |
33,523 | — | ||||||
| Tax credits |
— | 15,000 | ||||||
| Total deferred income tax assets |
33,523 | 319,956 | ||||||
| Deferred income tax liabilities |
||||||||
| Property and equipment |
(1,195,822 | ) | (1,813,749 | ) | ||||
| Other |
— | (13,208 | ) | |||||
| Total deferred income tax liabilities |
(1,195,822 | ) | (1,826,957 | ) | ||||
| Net deferred income tax liabilities |
$ | (1,162,299 | ) | $ | (1,507,001 | ) | ||
F-19
Table of Contents
Index to Financial Statements
GW Holdings I LLC
Notes to Consolidated Financial Statements
The Company provides a valuation allowance when it is more likely than not that some portion of deferred income tax assets will not be realized. There was no valuation allowance necessary as of December 31, 2010 or 2009.
A reconciliation of amounts determined by applying the federal statutory rate of 34% to income or loss before income taxes with the provision for income taxes is as follows for the years ended December 31:
| 2010 | 2009 | 2008 | ||||||||||
| Statutory federal income tax |
$ | 7,195,833 | $ | (6,287,415 | ) | $ | 6,323,588 | |||||
| State income taxes, net of federal benefit |
232,067 | 163,751 | 217,003 | |||||||||
| (Income) loss attributable to pass through entities |
(7,346,403 | ) | 6,051,112 | (13,830,687 | ) | |||||||
| Goodwill impairment |
— | — | 4,764,084 | |||||||||
| Non-deductible expenses |
— | 107,221 | — | |||||||||
| Other |
191,851 | (6,996 | ) | 70,816 | ||||||||
| $ | 273,348 | $ | 27,673 | $ | (2,455,196 | ) | ||||||
Note M-Member’s Equity
The Company’s ownership in Great White Pressure Pumping LLC, Great White Directional Services LLC and Diamondback Directional Drilling LLC are represented by membership interests in the companies. Ownership of Acid, Inc. and Great White Energy Services, Inc. is represented by common stock. The membership interests and common stock entitle the holder to all voting rights and 100% of profits and losses.
Ownership of Great White Pressure Control LLC (“GWPC”) is represented by 1,000 Class A and 1,000 Class B units. Seventy Class B units were issued to key employees pursuant to employment agreements. The Class B units have no voting rights and are convertible one for one into Class A units upon Wexford’s recovery of its investment plus a specified return (as defined in the agreements), the sale of all units to an unaffiliated third party, or an initial public offering within a larger consolidated affiliate. If conversion occurs as a result of a sale to a third party, vesting is immediate. If conversion otherwise occurs within the first five years, the units are subject to a vesting schedule through the remaining period of the five years. If conversion otherwise occurs after five years, vesting is immediate. Satisfaction of the performance conditions of these agreements effectively requires the occurrence of a liquidity event and, as such, costs of these agreements will be recognized upon actual occurrence of the liquidity event and upon meeting vesting requirements.
Note N-Commitments and Contingencies
In November 2006, Cudd Pressure Control, Inc., (“Cudd”) filed a lawsuit against Great White Pressure Control LLC and Gulfport Energy Corporation, among others, in the 129th Judicial District Harris County, Texas. The lawsuit was subsequently removed to the United States District Court for the Southern District of Texas (Houston Division). The lawsuit alleges RICO violations and several other causes of action relating to the employment of several former Cudd employees and seeks unspecified monetary damages and injunctive relief.
On stipulation by the parties, the plaintiff’s RICO claim was dismissed without prejudice by order of the court on February 14, 2007. The Company filed a motion for summary judgment on October 5, 2007. The court entered a final interlocutory judgment in favor of all defendants, including the Company, on April 8, 2008. On November 3, 2008, Cudd filed its appeal with the U.S. Court of Appeals for the Fifth Circuit. The Fifth Circuit vacated the district court decision finding, among other things, that the district court should not have entered
F-20
Table of Contents
Index to Financial Statements
GW Holdings I LLC
Notes to Consolidated Financial Statements
summary judgment without first allowing more discovery. The case was remanded back to the federal district court, and Cudd filed a motion to remand the case to state court. The federal district court granted Cudd’s motion and remanded the case to state court. On February 3, 2010, the plaintiff filed its second amended petition with the state court (a) alleging that Great White Pressure Control LLC conspired with the other defendants to misappropriate, and misappropriated, Cudd’s trade secrets and caused its employees to breach their fiduciary duties, and (b) seeking unspecified monetary damages. On April 13, 2010, the Company’s motion to be dismissed from the proceedings for lack of personal jurisdiction was denied. On February 15, 2011, the plaintiff filed its third amended petition with the state court seeking (a) damages of up to $26.5 million as the value of defendants’ alleged misappropriation and (b) the individuals’ disgorgement of $6.0 million in signing bonuses. This state court proceeding is in its initial stages. Therefore, the impact to the financial statements, if any, cannot be determined.
The Company is, from time to time, involved in routine litigation or subject to disputes or claims related to business activities, including workers’ compensation claims and employment related disputes. In the opinion of management, other than that discussed above, none of the pending litigation, disputes or claims against the Company, if decided adversely, is expected to have a material effect on the Company’s financial condition, results of operations, or cash flows.
Prior to September 2009, Great White Directional Services LLC and Diamondback Directional Drilling LLC partially insured their workers’ compensation claims, which included medical expenses, lost time and temporary and permanent disability benefits. During that time, the companies were covered by an insurance policy that required a $250,000 deductible per occurrence. The Company establishes liabilities for the unpaid deductible portion of claims incurred relating to workers’ compensation based on estimates. As of December 31, 2010 accrued claims were $201,680. At December 31, 2009, such estimated liabilities were nominal. These estimates may change in the near term as actual claims continue to develop. In connection with the Great White Directional Services LLC and Diamondback Directional Drilling LLC insurance programs, letters of credit of $2,779,755 have been issued supporting the estimated retained risk exposure. As of December 31, 2010, these letters of credit are cash collateralized by Diamondback Holdings, LLC.
The Company participates in a self-insured health plan and maintains individual stop loss coverage of $150,000 per person and aggregate stop loss coverage subject to an annual limit of $6,421,243 as of December 31, 2010. Claims processing and the overall administration of the plan are provided by a third party. The Company was allocated its share of expenses and related self-insured retention under the plan in the amount of $3,356,745, $3,602,510, and $2,982,052 for the years ended December 31, 2010, 2009 and 2008, respectively. At December 31, 2010 and 2009, accrued claims were $416,861 and $304,411, respectively.
The Company has entered into employment contracts with certain key employees. In the event of termination without good cause, these employees may receive compensation as defined under the contracts. The maximum that could be paid under the contracts at December 31, 2010 for termination without good cause is $3,016,667. Some of the employment contracts contain provisions that require the Company to make payments to the key employees in the event of either an IPO or sale of substantially all of the assets of the Company to a third party buyer. At December 31, 2010, the maximum that could be paid upon the occurrence of one of these events was $700,000.
The Company has firm purchase commitments for equipment of approximately $25,226,000 as of December 31, 2010.
F-21
Table of Contents
Index to Financial Statements
GW Holdings I LLC
Notes to Consolidated Financial Statements
Note O-Related Party Transactions
The Company has entered into transactions with certain other entities affiliated with Wexford, other subsidiaries of GWES Holdings LLC or Diamondback Holdings, LLC, or operating management. A summary of transactions with those related parties that are not separately stated on the face of the financial statements for the years ended December 31, 2010, 2009 and 2008 follows:
| 2010 | 2009 | 2008 | ||||||||||
| Purchased services |
$ | 510,205 | $ | 229,185 | $ | 175,995 | ||||||
| Capital asset purchases |
$ | 11,436,173 | $ | 5,724,954 | $ | 2,297,498 | ||||||
| Capital asset sales |
$ | 331,318 | $ | 54,218 | $ | 10,357 | ||||||
| Facility operating leases |
$ | 371,399 | $ | 402,027 | $ | 301,373 | ||||||
Note P-401(k) Plans
The Company participates in a multi-employer 401(k) plan with affiliates that enabled employees to defer up to specific percentages of their annual compensation and contribute such amount to the plan. The Company provides a matching contribution up to 6% for each participant and could also contribute additional amounts at their sole discretion. Part of the Company’s match may come from plan forfeitures. During 2009, the Company suspended the employer match. For the years ended December 31, 2010, 2009 and 2008 the matching contribution was $1,327,732, $584,314 and $2,381,342, respectively.
Note Q-Operating Segments
The Company is organized into two reportable segments based on the nature of services provided and the basis on which the chief executive officer and segment management make business and operating decisions. The Company principally provides oilfield services in connection with the on-shore drilling of oil and natural gas wells for small to large domestic independent oil and natural gas producers.
The Company’s two segments consist of horizontal and directional drilling services and completion and production services. A description of the operating segments and the type of products and services from which their revenues are derived follows:
The horizontal and directional drilling services segment generates revenue through operating the Company’s measurement while drilling equipment and electromagnetic technology equipment for the horizontal and directional drilling operations of the Company’s customers. The primary regions of operations are the Mid-Continent Basin, Permian Basin, Rocky Mountain region and Appalachian Basin. The horizontal and directional drilling services segment includes Caliber Wyoming Properties, LLC, which is a variable interest entity that has been consolidated in the accompanying financial statements in accordance with FASB ASC 810.
The completion and production services segment generates revenue by providing hydraulic fracturing, coil tubing, snubbing, nitrogen, wireline, fluid pumping and well control services. The primary regions of operations are the Mid-Continent Basin and Permian Basin.
Corporate contains the reconciliation between the totals for reportable segments and the Company’s totals and other corporate items not allocated to the reportable segments.
F-22
Table of Contents
Index to Financial Statements
GW Holdings I LLC
Notes to Consolidated Financial Statements
The following table sets forth certain financial information with respect to the Company’s reportable segments:
| Horizontal and Directional Drilling Services |
Completion and Production Services |
Corporate | Total | |||||||||||||
| 2010 |
||||||||||||||||
| Revenue from external customers |
$ | 67,599,102 | $ | 125,383,565 | $ | — | $ | 192,982,667 | ||||||||
| Revenue from related parties |
$ | 3,267,788 | $ | 10,479,697 | $ | — | $ | 13,747,485 | ||||||||
| Interest expense |
$ | 79,178 | $ | 1,267,034 | $ | — | $ | 1,346,212 | ||||||||
| Depreciation and amortization expense |
$ | 11,980,798 | $ | 11,438,459 | $ | — | $ | 23,419,257 | ||||||||
| Income tax provision |
$ | 53,168 | $ | 220,180 | $ | — | $ | 273,348 | ||||||||
| Net income (loss) |
$ | 1,889,430 | $ | 24,409,275 | $ | (5,407,837 | ) | $ | 20,890,868 | |||||||
| Total expenditures for long-lived assets |
$ | 12,237,695 | $ | 40,331,479 | $ | — | $ | 52,569,174 | ||||||||
| Goodwill |
$ | 16,222,481 | $ | — | $ | — | $ | 16,222,481 | ||||||||
| Intangible assets, net |
$ | 7,763,814 | $ | — | $ | — | $ | 7,763,814 | ||||||||
| Total assets |
$ | 73,277,756 | $ | 140,228,651 | $ | — | $ | 213,506,407 | ||||||||
| 2009 |
||||||||||||||||
| Revenue from external customers |
$ | 40,788,551 | $ | 52,963,207 | $ | — | $ | 93,751,758 | ||||||||
| Revenue from related parties |
$ | 1,943,303 | $ | 2,877,967 | $ | — | $ | 4,821,270 | ||||||||
| Interest expense |
$ | 6,615 | $ | 1,819,168 | $ | — | $ | 1,825,783 | ||||||||
| Depreciation and amortization expense |
$ | 11,818,442 | $ | 10,548,793 | $ | — | $ | 22,367,235 | ||||||||
| Income tax provision (benefit) |
$ | 116,358 | $ | (88,685 | ) | $ | — | $ | 27,673 | |||||||
| Net loss |
$ | (5,619,402 | ) | $ | (10,799,338 | ) | $ | (2,101,330 | ) | $ | (18,520,070 | ) | ||||
| Total expenditures for long-lived assets |
$ | 4,601,580 | $ | 4,853,478 | $ | — | $ | 9,455,058 | ||||||||
| Goodwill |
$ | 16,222,481 | $ | — | $ | — | $ | 16,222,481 | ||||||||
| Intangible assets, net |
$ | 9,200,899 | $ | — | $ | — | $ | 9,200,899 | ||||||||
| Total assets |
$ | 39,820,228 | $ | 110,629,268 | $ | — | $ | 150,449,496 | ||||||||
| 2008 |
||||||||||||||||
| Revenue from external customers |
$ | 103,792,359 | $ | 103,508,886 | $ | — | $ | 207,301,245 | ||||||||
| Revenue from related parties |
$ | 1,313,577 | $ | — | $ | — | $ | 1,313,577 | ||||||||
| Interest expense |
$ | 17,643 | $ | 2,092,585 | $ | — | $ | 2,110,228 | ||||||||
| Depreciation and amortization expense |
$ | 10,557,743 | $ | 10,115,698 | $ | — | $ | 20,673,441 | ||||||||
| Income tax provision (benefit) |
$ | 459,370 | $ | (2,914,566 | ) | $ | — | $ | (2,455,196 | ) | ||||||
| Goodwill and intangible asset impairment |
$ | — | $ | 20,184,607 | $ | — | $ | 20,184,607 | ||||||||
| Net income (loss) |
$ | 24,969,279 | $ | (402,565 | ) | $ | (3,512,730 | ) | $ | 21,053,984 | ||||||
| Total expenditures for long-lived assets |
$ | 15,063,721 | $ | 17,783,964 | $ | — | $ | 32,847,685 | ||||||||
| Goodwill |
$ | 16,222,481 | $ | — | $ | — | $ | 16,222,481 | ||||||||
| Intangible assets, net |
$ | 11,041,648 | $ | — | $ | — | $ | 11,041,648 | ||||||||
| Total assets |
$ | 85,189,113 | $ | 100,593,837 | $ | — | $ | 185,782,950 | ||||||||
F-23
Table of Contents
Index to Financial Statements
GW Holdings I LLC
Notes to Consolidated Financial Statements
Note R-Subsequent Events
On February 15, 2011, the Company entered into a revolving line of credit agreement with a bank. GW Holdings I LLC, Great White Energy Service, Inc., Acid, Inc., Diamondback Directional Drilling LLC, Great White Directional Services LLC, Great White Pressure Control LLC, and Great White Pressure Pumping LLC, individually and collectively, are borrowers under the credit agreement. The line provides up to $50,000,000 in total commitments. The line matures on February 15, 2016 with interest payable monthly. At the Company’s option, advances bear interest at Base Rate or Eurodollar Rate plus 2.25% to 2.75%. Under the terms of the credit agreement, “Base Rate” is defined as the higher of (i) the rate at which the lender announces from time to time as its prime lending rate, as in effect from time to time, (ii) the Federal Funds Rate, as in effect from time to time, plus one-half percent per annum or (iii) the Eurodollar Rate determined on a daily basis for a period of one (1) month.
The maximum amount available under the credit facility is subject to a borrowing base formula based on trade accounts receivable of the borrowing group less reserves. The reserves are at the discretion of the bank and include reserves for certain taxes, bank products, dilution, and other reserves. Until July 31, 2011, the availability is reduced by the greater of $5,000,000 or ten percent of the revolving loan commitment. At March 31, 2011, the Company had drawn $14,000,000 of the facility and total availability was limited to $37,938,716 by the borrowing base calculation. The line of credit agreement contains certain financial information covenants, including a minimum fixed charge coverage ratio. Other covenants restrict additional debt to $40,000,000, restrict specified payments and purchases, and restrict specified affiliate transactions.
The obligations under the revolving line of credit agreement are secured by all working capital assets of the Borrowers under a related security agreement.
The Company has evaluated events and transactions that occurred subsequent to December 31, 2010 through April 28, 2011, the date these financial statements were available to be issued, for potential recognition or disclosure in these financial statements.
F-24
Table of Contents
Index to Financial Statements
[THIS PAGE INTENTIONALLY LEFT BLANK]
F-25
Table of Contents
Index to Financial Statements
Consolidated Balance Sheets
| March 31, 2011 (unaudited) |
December 31, 2010 |
|||||||
| Assets |
||||||||
| Current assets |
||||||||
| Cash and cash equivalents ($21,656 and $43,013 related to VIEs) |
$ | 19,924,339 | $ | 7,988,912 | ||||
| Accounts receivable (net of allowance of $1,320,220 and $1,323,510) |
50,488,990 | 35,871,390 | ||||||
| Receivables from related parties |
3,595,536 | 4,864,881 | ||||||
| Inventories |
4,169,227 | 4,069,466 | ||||||
| Prepaid expenses and other |
1,493,522 | 1,271,746 | ||||||
| Total current assets |
79,671,614 | 54,066,395 | ||||||
| Property and equipment, net ($595,260 and $600,490 related to VIEs) |
155,722,880 | 134,084,654 | ||||||
| Other non-current assets |
2,173,872 | 1,369,063 | ||||||
| Intangible assets, net |
7,469,584 | 7,763,814 | ||||||
| Goodwill |
16,222,481 | 16,222,481 | ||||||
| Total assets |
$ | 261,260,431 | $ | 213,506,407 | ||||
| Liabilities and Equity |
||||||||
| Current liabilities |
||||||||
| Accounts payable ($5,826 and $4,483 related to VIEs) |
$ | 19,307,293 | $ | 16,696,185 | ||||
| Accrued and other current liabilities |
12,261,284 | 10,087,814 | ||||||
| Payables to related parties |
7,060,154 | 796,201 | ||||||
| Advances from Great White Energy Services LLC |
5,043,264 | 637,725 | ||||||
| Current portion of long-term debt |
2,851,516 | 2,673,605 | ||||||
| Current portion of capital lease obligations |
775,472 | 1,029,137 | ||||||
| Total current liabilities |
47,298,983 | 31,920,667 | ||||||
| Deferred income taxes |
1,005,964 | 1,162,299 | ||||||
| Capital lease obligations, net of current portion |
6,251,847 | 6,456,527 | ||||||
| Long-term debt |
19,497,219 | 6,012,170 | ||||||
| Total liabilities |
74,054,013 | 45,551,663 | ||||||
| Commitments and contingencies (Notes H, J and L) |
||||||||
| Equity |
||||||||
| Member’s equity |
186,595,328 | 167,315,724 | ||||||
| Non-controlling interest in variable interest entities |
611,090 | 639,020 | ||||||
| Total equity |
187,206,418 | 167,954,744 | ||||||
| Total liabilities and equity |
$ | 261,260,431 | $ | 213,506,407 | ||||
The accompanying notes are an integral part of these financial statements
F-26
Table of Contents
Index to Financial Statements
Consolidated Statements of Operations
Three Months Ended March 31, 2011 and 2010
(unaudited)
| 2011 | 2010 | |||||||
| Revenue |
||||||||
| Revenue |
$ | 73,568,392 | $ | 34,882,728 | ||||
| Revenue—related parties |
6,795,840 | 959,728 | ||||||
| Total revenue |
80,364,232 | 35,842,456 | ||||||
| Costs and expenses |
||||||||
| Cost of revenue (exclusive of depreciation and amortization) |
49,290,623 | 27,897,474 | ||||||
| Cost of revenue (exclusive of depreciation and amortization)—related parties |
298,227 | 101,533 | ||||||
| Selling, general, and administrative |
4,876,197 | 3,332,642 | ||||||
| Selling, general, and administrative—related parties |
31,837 | 38,754 | ||||||
| Depreciation and amortization |
6,554,140 | 5,450,006 | ||||||
| Total costs and expenses |
61,051,024 | 36,820,409 | ||||||
| Operating income (loss) |
19,313,208 | (977,953 | ) | |||||
| Other income (expense) |
||||||||
| Interest expense |
(19,387 | ) | (30,290 | ) | ||||
| Interest expense—related parties |
(10,086 | ) | (324,219 | ) | ||||
| Other |
40,070 | 976 | ||||||
| 10,597 | (353,533 | ) | ||||||
| Income (loss) before income taxes |
19,323,805 | (1,331,486 | ) | |||||
| Provision (benefit) for income taxes |
33,131 | (33,596 | ) | |||||
| Net income (loss) |
19,290,674 | (1,297,890 | ) | |||||
| Income attributable to non-controlling interest in variable interest entities |
11,070 | 10,684 | ||||||
| Net income (loss) attributable to equity holders of the Company |
$ | 19,279,604 | $ | (1,308,574 | ) | |||
| Pro forma information |
||||||||
| Income (loss) before income taxes as reported |
$ | 19,323,805 | $ | (1,331,486 | ) | |||
| Pro forma adjustment for income tax expense (benefit) |
7,385,330 | (464,235 | ) | |||||
| Pro forma net income (loss) |
$ | 11,938,475 | $ | (867,251 | ) | |||
| Pro forma net income (loss) attributable to equity holders of the Company |
$ | 11,927,405 | $ | (877,935 | ) | |||
| Basic and diluted attributable to the Company |
||||||||
| Pro forma net income (loss) per common share |
$ | .27 | ||||||
| Pro forma average weighted common shares outstanding used in net income (loss) per common share |
43,779,314 | |||||||
The accompanying notes are an integral part of these financial statements
F-27
Table of Contents
Index to Financial Statements
Consolidated Statement of Equity
For the Three Months Ended March 31, 2011 and 2010
(unaudited)
| Member’s Equity |
Non-controlling Interest In Variable Interest Entities |
Total Equity |
||||||||||
| Balance at January 1, 2010 |
$ | 117,209,899 | $ | 668,046 | $ | 117,877,945 | ||||||
| Capital contributions |
8,420,978 | — | 8,420,978 | |||||||||
| Capital distributions |
(3,618,197 | ) | — | (3,618,197 | ) | |||||||
| Net (loss) income |
(1,308,574 | ) | 10,684 | (1,297,890 | ) | |||||||
| Balance at March 31, 2010 |
$ | 120,704,106 | $ | 678,730 | $ | 121,382,836 | ||||||
| Balance at January 1, 2011 |
$ | 167,315,724 | $ | 639,020 | $ | 167,954,744 | ||||||
| Capital distributions |
— | (39,000 | ) | (39,000 | ) | |||||||
| Net income |
19,279,604 | 11,070 | 19,290,674 | |||||||||
| Balance at March 31, 2011 |
$ | 186,595,328 | $ | 611,090 | $ | 187,206,418 | ||||||
The accompanying notes are an integral part of these financial statements
F-28
Table of Contents
Index to Financial Statements
Consolidated Statements of Cash Flows
Three Months Ended March 31, 2011 and 2010
(unaudited)
| 2011 | 2010 | |||||||
| Cash flows from operating activities |
||||||||
| Net income (loss) |
$ | 19,290,674 | $ | (1,297,890 | ) | |||
| Adjustments to reconcile net income (loss) to net cash provided by operating activities: |
||||||||
| Depreciation and amortization |
6,554,140 | 5,450,006 | ||||||
| Amortization of deferred financing costs |
27,127 | — | ||||||
| Provision for doubtful accounts |
324,378 | 253,103 | ||||||
| Deferred income tax benefit |
(156,335 | ) | (76,943 | ) | ||||
| Loss on sale or disposal of assets |
285,775 | — | ||||||
| Gain on sale of equipment involuntarily damaged or lost down-hole |
(216,849 | ) | (502,532 | ) | ||||
| Change in operating assets and liabilities: |
||||||||
| Accounts receivable |
(14,941,978 | ) | (5,618,417 | ) | ||||
| Receivables from related parties |
1,269,345 | (605,324 | ) | |||||
| Inventories |
(99,761 | ) | (482,007 | ) | ||||
| Prepaid expenses and other |
(221,776 | ) | (176,938 | ) | ||||
| Other assets |
— | (101 | ) | |||||
| Payables to related parties |
1,157,141 | 48,818 | ||||||
| Accounts payable and accrued and other current liabilities |
2,979,774 | 3,385,217 | ||||||
| Net cash provided by operating activities |
16,251,655 | 376,992 | ||||||
| Cash flows from investing activities |
||||||||
| Proceeds from sale of equipment involuntarily damaged or lost down-hole |
401,646 | 784,047 | ||||||
| Proceeds from asset disposals |
388,413 | — | ||||||
| Additions to property and equipment |
(21,845,505 | ) | (3,490,047 | ) | ||||
| Net cash used in investing activities |
(21,055,446 | ) | (2,706,000 | ) | ||||
| Cash flows from financing activities |
||||||||
| Payments on capital lease obligations |
(458,345 | ) | (121,319 | ) | ||||
| Advances under long-term debt agreements |
14,191,609 | — | ||||||
| Payments on long-term debt agreements |
(528,649 | ) | — | |||||
| Deferred financing costs and stock issuance costs |
(831,936 | ) | — | |||||
| Advances from Great White Energy Services LLC |
4,405,539 | 3,087,958 | ||||||
| Payments to Great White Energy Services LLC |
— | (3,218,317 | ) | |||||
| Capital distributions |
— | (3,618,197 | ) | |||||
| Capital contributions |
— | 8,420,978 | ||||||
| Capital distributed by variable interest entities |
(39,000 | ) | — | |||||
| Net cash provided by financing activities |
16,739,218 | 4,551,103 | ||||||
| Net increase in cash and cash equivalents |
11,935,427 | 2,222,095 | ||||||
| Cash and cash equivalents at beginning of period |
7,988,912 | 1,485,845 | ||||||
| Cash and cash equivalents at end of period |
$ | 19,924,339 | $ | 3,707,940 | ||||
| Cash paid for interest, net of capitalized interest |
$ | 11,596 | $ | 171,263 | ||||
The accompanying notes are an integral part of these financial statements
F-29
Table of Contents
Index to Financial Statements
Notes to Consolidated Financial Statements
(Information as of March 31, 2011 and for the three months ended March 31, 2011 and 2010 is unaudited)
Note A-Nature of Operations and Summary of Significant Accounting Policies
The accompanying consolidated balance sheet as of March 31, 2011 and the consolidated statements of operations, cash flows and equity for the three months ended March 31, 2011 and 2010 have been prepared by GW Holdings I LLC without audit pursuant to the rules and regulations of the Securities and Exchange Commission, and reflect all adjustments, which in the opinion of management are necessary for the fair presentation of the results for the interim periods, on a basis consistent with the annual consolidated financial statements. All such adjustments are of a normal recurring nature. Certain information, accounting policies, and footnote disclosures normally included in financial statements prepared in accordance with generally accepted accounting principles have been omitted pursuant to such rules and regulations, although the Company believes that the disclosures are adequate to make the information presented not misleading. These consolidated interim financial statements should be read in conjunction with the consolidated financial statements and the summary of significant accounting policies and notes thereto included in the Company’s 2010 annual consolidated financial statements.
GW Holdings I LLC was formed December 10, 2010 by Wexford Capital LP (“Wexford”). The membership interests or common stock, as applicable, in Great White Pressure Control LLC, Great White Pressure Pumping LLC, Acid, Inc., Great White Directional Services LLC, Diamondback-Directional Drilling LLC, and Great White Energy Services, Inc. (“GWES”) were contributed on December 31, 2010 to GW Holdings I LLC by GWES Holdings LLC and Diamondback Holdings, LLC, which are entities controlled and managed by Wexford. Accordingly, the contributions were treated as a combination of entities under common control and the assets and liabilities contributed have been accounted for at the historical cost of the contributing entities and the Company’s financial statements include all operations and transactions of the contributed entities for all periods presented. Collectively, GW Holdings I LLC, and its wholly owned subsidiaries, Great White Pressure Control LLC, Great White Pressure Pumping LLC, Acid, Inc., Great White Directional Services LLC, Diamondback-Directional Drilling LLC, and GWES are referred to as the (“Company”). GWES was formed on December 1, 2010 in anticipation of an initial public offering (“IPO”). Prior to the consummation of the IPO, GW Holdings I LLC will be merged with GWES and GWES will continue as the surviving corporation. These financial statements also include a consolidated variable interest entity, Caliber Wyoming Properties, LLC and certain allocated activities of Great White Energy Services LLC and Diamondback Holdings, LLC.
Certain management, administrative, and treasury functions were provided to the Company by Great White Energy Services LLC, a wholly owned subsidiary of GWES Holdings LLC, and Diamondback Holdings, LLC. For purposes of presenting the consolidated financial statements, allocations were required to determine the cost of general and administrative activities performed attributable to the Company. The allocations were made based upon underlying salary costs of employees performing Company related functions, payroll, revenue, or headcount relative to other companies managed by Great White Energy Services LLC or Diamondback Holdings, LLC, or specifically identified invoices processed, depending on the nature of the cost. Management believes that the allocation methodology was reasonable; however, expenses allocated to the Company are not necessarily indicative of the expenses that would have been incurred on a stand-alone basis nor are they indicative of costs that may be incurred in the future.
Generally, a centralized cash management program was utilized under which cash receipts and cash disbursements of the Company were remitted to or funded from central accounts owned and controlled by Great White Energy Services LLC or Diamondback Holdings, LLC. Such disbursement transactions with Great White Energy Services LLC were reported as a liability because it was expected that net amounts advanced would be repaid. Such cash receipts transactions with Great White Energy Services LLC were reported as reductions to the liability. Great White Energy Services LLC charged interest on net amounts advanced based on interest rates consistent with its line of credit through December 31, 2010. Such transactions with Diamondback Holdings,
F-30
Table of Contents
Index to Financial Statements
GW Holdings I LLC
Notes to Consolidated Financial Statements
(Information as of March 31, 2011 and for the three months ended March 31, 2011 and 2010 is unaudited)
LLC were reported as equity transactions through December 31, 2010 and no interest was charged. Beginning January 1, 2011, transactions with Diamondback Holdings, LLC are reported as a liability because it was expected that net amounts advanced would be repaid.
Member’s equity includes transfers of cash to or from Diamondback Holdings, LLC to fund certain of the Company’s operations. Other transactions affecting member’s equity include general, administrative, and corporate overhead expenses allocated to the Company during 2010. During 2011, general, administrative, and corporate overhead expenses allocated to the Company are reflected as a payable since it is expected that these amounts will be repaid.
Operations
The Company is an oilfield service company that provides horizontal and directional drilling and completion and production services used in connection with drilling oil and natural gas wells. The Company provides horizontal and directional drilling services by using directional drilling motors and measurement while drilling and electromagnetic technology systems. The Company’s completion and production services include hydraulic fracturing, coil tubing, snubbing, wireline, nitrogen, fluid pumping and well control. All of the Company’s operations are in the United States. Primary regions of operations are the Mid-Continent Basin, Permian Basin, Rocky Mountain region and Appalachian Basin. The Company’s business depends in large part on the conditions in the oil and natural gas industry and specifically on the amount of capital spending by its customers. Any prolonged increase or decrease in oil and natural gas prices affects the levels of exploration, development and production activity, as well as the entire health of the oil and natural gas industry. Changes in the commodity prices for oil and natural gas could have a material effect on the Company’s results of operations and financial condition.
A summary of the significant accounting policies are as follows.
| 1. | Principles of Consolidation |
The consolidated financial statements are prepared in accordance with accounting principles generally accepted in the United States of America (“U.S. GAAP”). All material accounts and transactions between the entities within the Company have been eliminated in the consolidated financial statements.
| 2. | Cash and Cash Equivalents |
All highly liquid investments with a maturity of three months or less when acquired are considered cash equivalents.
| 3. | Accounts Receivable |
Accounts receivable include amounts due from customers for services performed and are recorded as the work progresses. The Company extends credit to customers in the ordinary course of business and generally does not require collateral. Most areas in which the Company operates provide for a mechanic’s lien against the property on which the service is performed if the lien is filed within the statutorily specified time frame. Customer balances are generally considered delinquent if unpaid by the 30th day following the invoice date and credit privileges may be revoked if balances remain unpaid.
F-31
Table of Contents
Index to Financial Statements
GW Holdings I LLC
Notes to Consolidated Financial Statements
(Information as of March 31, 2011 and for the three months ended March 31, 2011 and 2010 is unaudited)
The Company regularly reviews receivables and provides for estimated losses through an allowance for doubtful accounts. In evaluating the level of established reserves, the Company makes judgments regarding its customers’ ability to make required payments, economic events, and other factors. As the financial condition of customers change, circumstances develop, or additional information becomes available, adjustments to the allowance for doubtful accounts may be required. In the event the Company was to determine that a customer may not be able to make required payments, the Company would increase the allowance through a charge to income in the period in which that determination is made. Uncollectible accounts receivable are periodically charged against the allowance for doubtful accounts once final determination is made of their uncollectability.
| 4. | Inventories |
Inventories are stated at the lower of cost or market, determined on a first in first out cost basis. Inventories consist of repair parts and consumable supplies. The Company assesses the valuation of its inventories based upon specific usage and future utility. A charge to results of operations is taken when factors that would result in a need for a reduction in the valuation, such as excess or obsolete inventory, are determined. As of March 31, 2011 and December 31, 2010, the reserves were nominal.
| 5. | Property and Equipment |
Property and equipment are recorded at cost. Expenditures for major additions and improvements are capitalized while minor replacements, maintenance, and repairs, which do not increase the capacity, improve the efficiency or safety, or improve or extend the useful life of such assets, are charged to operations as incurred. Disposals are removed at cost, less accumulated depreciation, and any resulting gain or loss is reflected in operations.
Proceeds from customers for horizontal and directional drilling services equipment involuntarily damaged or lost down-hole are reflected in revenue with the carrying value of the related equipment charged to cost of revenues and are reported as cash inflows from investing activities in the statement of cash flows. For the three months ended March 31, 2011 and 2010, proceeds from the sale of equipment involuntarily damaged or lost down-hole were $401,646 and $784,047, respectively, and gain on sales of equipment involuntarily damaged or lost down-hole were $216,849 and $502,532, respectively.
Depreciation is calculated using the straight-line method over the shorter of the estimated useful life, or the remaining lease term, as applicable. The useful lives of the major classes of property and equipment are as follows:
| Office equipment, furniture and fixtures |
3-10 years | |||
| Machinery and equipment: |
||||
| Horizontal and directional drilling services |
2-7 years | |||
| Completion and production services |
2-12 years | |||
| Vehicles and trailers |
3-7 years | |||
| Buildings and leasehold improvements |
3-40 years |
| 6. | Long-Lived Assets |
Long-lived assets, primarily property and equipment and amortizable intangibles, are reviewed for impairment when events or changes in circumstances indicate that the carrying amount of such assets may not be recoverable. Recoverability of such assets is evaluated by measuring the carrying amount of the assets against the estimated undiscounted future cash flows associated with the assets. If such evaluations
F-32
Table of Contents
Index to Financial Statements
GW Holdings I LLC
Notes to Consolidated Financial Statements
(Information as of March 31, 2011 and for the three months ended March 31, 2011 and 2010 is unaudited)
indicate that the future undiscounted cash flows from the assets are not sufficient to recover the carrying value of such assets, the assets are adjusted to their estimated values.
There were no acquisitions of intangible assets during the three months ended March 31, 2011 or 2010.
| 7. | Amortizable Intangible Assets |
Intangible assets subject to amortization include customer relationships and trade names. Customer relationships are amortized based on an estimated attrition factor of their useful life of 9 to 16 years and trade names are amortized straight line over their estimated useful lives of 20 years.
| 8. | Goodwill |
Goodwill is tested for impairment as of October 1 each year or more frequently if events or changes in circumstances indicate that goodwill might be impaired. The impairment test is a two-step process. First, the fair value of each reporting unit is compared to its carrying value to determine whether an indication of impairment exists. If impairment is indicated, then the implied value of the reporting unit’s goodwill is determined by allocating the unit’s fair value to its assets and liabilities as if the reporting unit had been acquired in a business combination. The fair value of the reporting unit is determined using the discounted cash flow approach, excluding interest. The amount of impairment for goodwill is measured as the excess of its carrying value over its implied value.
No indications of impairment were noted during the three months ended March 31, 2011 or 2010.
| 9. | Deferred Financing Costs |
The Company capitalizes certain costs in connection with obtaining its borrowings, such as lender’s fees and related attorney’s fees. These costs are charged to interest expense over the contractual term of the debt using the effective interest method.
| 10. | Litigation and Self-Insured Risk Reserves |
The Company estimates its reserves related to litigation and self-insured risks based on the facts and circumstances specific to the litigation and self-insured claims. There were no litigation reserves as of March 31, 2011 or December 31, 2010. The Company maintains accruals in the consolidated balance sheets to cover estimated self-insurance retentions (See Note L).
| 11. | Revenue Recognition |
The Company generates revenue from multiple sources within its two operating segments. In all cases, revenue is recognized when services are performed, collection of the receivable is probable, persuasive evidence of an arrangement exists, and the price is fixed and determinable. Services are sold without warranty or right of return. Taxes assessed on revenue transactions are presented on a net basis and are not included in revenue.
Horizontal and directional drilling services are provided on a day rate or hourly basis. Revenue is recognized as the work progresses. Proceeds from customers for the cost of oilfield rental equipment that is involuntarily damaged or lost down-hole are reflected as revenues.
F-33
Table of Contents
Index to Financial Statements
GW Holdings I LLC
Notes to Consolidated Financial Statements
(Information as of March 31, 2011 and for the three months ended March 31, 2011 and 2010 is unaudited)
Completion and production services are typically provided on a day rate or contracted basis and revenue is recognized as the work progresses. Additional revenue is generated through the sale of consumable supplies that are incidental to the service being performed.
| 12. | Cost of Revenue |
The primary components of cost of revenue are those salaries, consumable supplies, repairs and maintenance and general operational costs that are directly associated with the services performed for the customers. Cost of revenue – related parties reflects expenses incurred from related parties.
| 13. | Use of Estimates |
The preparation of financial statements in conformity with U.S. GAAP requires management to make estimates and assumptions that affect the reported amounts of assets and liabilities, the disclosure of contingent assets and liabilities at the date of the financial statements and the reported amounts of revenues and expenses during the reporting period. Actual results could differ from those estimates. Significant estimates include but are not limited to the allowance for doubtful accounts, reserves for self-insurance, depreciation and amortization of property and equipment and amortizable intangibles, future cash flows and fair values used to assess recoverability and impairment of long-lived assets and goodwill and allocation of general, administrative and corporate overhead expenses.
| 14. | Income Taxes |
Each of the operating entities comprising the Company other than Acid, Inc. are limited liability companies and as such are treated as pass-through entities for income tax purposes. As pass-through entities, income taxes on net earnings are payable by the members and are not reflected in the financial statements. Acid, Inc. is subject to corporate income taxes, and such taxes are provided in the financial statements based upon Financial Accounting Standards Board (“FASB”) Accounting Standard Codification (“ASC”) 740, Income Taxes. Under FASB ASC 740, deferred tax assets and liabilities are recognized for the future tax consequences attributable to differences between the financial statement carrying amounts of existing assets and liabilities and their respective tax bases. Deferred tax assets and liabilities are measured using statutory tax rates expected to apply to taxable income in the years in which those temporary differences are expected to be recovered or settled. The effect of deferred tax assets and liabilities as a result of a change in tax rate is recognized in the period that includes the statutory enactment date. A valuation allowance for deferred tax assets is recognized when it is more likely than not that the benefit of deferred tax assets will not be realized.
As required by ASC 740, the Company recognizes the financial statement benefit of a tax position only after determining that the relevant tax authority would more likely than not sustain the position following an audit. For tax positions meeting the more-likely-than-not threshold, the amount recognized in the financial statements is the largest benefit that has a greater than 50 percent likelihood of being realized upon ultimate settlement with the relevant tax authority. During the three months ended March 31, 2011 and 2010, there were no financial statement benefits or obligations recognized related to uncertain tax positions.
Certain operations of the Company are also subject to the Texas Margin Tax or Michigan Business Tax, and the Company accounts for these taxes based upon the provisions of FASB ASC 740. Generally, the pass-through entities are no longer subject to tax examinations by tax authorities for years before 2006.
F-34
Table of Contents
Index to Financial Statements
GW Holdings I LLC
Notes to Consolidated Financial Statements
(Information as of March 31, 2011 and for the three months ended March 31, 2011 and 2010 is unaudited)
The Company’s accounting policy relating to income tax penalties and interest assessments is to accrue for these costs and record a charge to selling, general and administrative expense for tax penalties and a charge to interest expense for interest assessments during the period that the Company has unrecognized tax benefits.
Acid, Inc. files income tax returns in the U.S. federal jurisdiction and various state jurisdictions. Generally, Acid, Inc. is no longer subject to U.S. federal and state income tax examinations by tax authorities for years before 2007.
Based on estimates of the temporary differences as of March 31, 2011, upon conversion to a taxable entity, net deferred tax liabilities of approximately $26,100,000 will be recognized with a corresponding charge to provision for income taxes.
| 15. | Unaudited Pro Forma Income Taxes and Earnings Per Share |
Upon completion of a proposed initial public offering (“IPO”) by the Company of its common stock, the Company will be treated as a C-Corp under the Internal Revenue Code and will be subject to income taxes. Accordingly, a pro forma income tax provision has been disclosed as if the Company were a C-Corp for all periods presented. The pro forma tax expense has been calculated at a rate of 38%. The tax rate is based upon a federal corporate level tax rate and a state tax rate, net of federal benefit, incorporating permanent differences.
Upon the merger of GW Holdings I LLC and GWES in contemplation of a proposed IPO, the Company has presented pro forma earnings per share for the most recent interim period. Pro forma basic and diluted income (loss) per share has been computed by dividing net income (loss) attributable to the Company by the number of shares of common stock determined as if the shares of GWES common stock issued to GWES Holdings (28,456,554 shares) and Diamondback Holdings, LLC (15,322,760 shares) in the merger were outstanding for the three months ended March 31, 2011.
| 16. | Financial Instruments |
The Company’s financial instruments consist primarily of cash and cash equivalents, trade receivables, trade payables, advances from Great White Energy Services LLC, and long-term debt. The carrying value of cash and cash equivalents, trade receivables, trade payables, and advances from Great White Energy Services LLC are considered representative of their fair value due to the short term nature of these instruments. The carrying value of long-term debt is deemed representative of fair value based on bearing interest rates and having terms comparable to prevailing market conditions.
The cash collateral agreement held by lender is security related to certain of the Company’s long-term debt, is non-interest bearing, and has a carrying value of $1,245,603 and a fair value of $1,188,536. Fair value was determined by discounting the carrying amount by the interest rate offered on 36 month certificates of deposit.
| 17. | Concentrations of Credit Risk and Significant Customers |
Financial instruments that potentially subject the Company to concentrations of credit risk consist of cash and cash equivalents occasionally in excess of federally insured limits and trade receivables. The Company’s accounts receivable have a concentration in the oil and natural gas industry and the customer base consists primarily of independent oil and natural gas producers.
Both of the Company’s operating segments provide services to one company which accounted for total revenue of 15.3% and 18.9% for the three months ended March 31, 2011 and in 2010. This company
F-35
Table of Contents
Index to Financial Statements
GW Holdings I LLC
Notes to Consolidated Financial Statements
(Information as of March 31, 2011 and for the three months ended March 31, 2011 and 2010 is unaudited)
represented 15.4% and 16.0% of consolidated accounts receivable at March 31, 2011 and December 31, 2010 respectively.
| 18. | Concentration of Key Raw Material Suppliers |
The completion and production services segment relies on a limited number of suppliers for sand and other proppants. These key materials are critical for certain of the Company’s operations. The loss of one or more of these suppliers or the limited availability of these materials may negatively impact the Company’s revenues or increase its operating costs.
| 19. | Variable Interest Entities |
The Company has a lease agreement for certain land and property with Caliber Wyoming Properties, LLC. Caliber Wyoming Properties, LLC is an entity controlled by Wexford. The primary operation of this entity is to own and lease facilities to the Company. In accordance with FASB ASC 810, Consolidation, the Company determined that Caliber Wyoming Properties, LLC is a variable interest entity in which it is the primary beneficiary. As such, the entity has been consolidated. The Company does not have legal control over Caliber Wyoming Properties, LLC and its liabilities do not represent additional claims on the Company’s assets; rather they represent claims against the specific assets of Caliber Wyoming Properties, LLC. Likewise, the assets of Caliber Wyoming Properties, LLC do not represent additional assets available to satisfy the claims against the Company’s assets. At March 31, 2011, the assets of Caliber Wyoming Properties, LLC were $616,916, and current liabilities were $5,826. The assets were comprised of cash and cash equivalents of $21,656 and net property and equipment of $595,260. At December 31, 2010, the assets and current liabilities were $643,503 and $4,483, respectively. The net equity of Caliber Wyoming Properties, LLC is included in equity as a non-controlling interest in variable interest entities.
| 20. | Recent Accounting Pronouncements |
In January 2010, the FASB issued ASU No. 2010-06, “Improving disclosures about Fair Value Measurements” (“ASU No. 2010-06”). ASU No. 2010-06 requires the disclosure of significant transfers in and out of Level 1 and Level 2 fair value measurements. It also requires that Level 3 fair value measurements present information about purchases, sales, issuances and settlements. Fair value disclosures should also disclose valuation techniques and inputs used to measure both recurring and nonrecurring fair value measurements. This update became effective for the Company on January 1, 2010, except for the disclosures about purchases, sales, issuances and settlements in the roll forward in activity in Level 3 fair value measurements, which became effective January 1, 2011. This update did not change the techniques the Company uses to measure fair values and did not have a material impact on the Company’s consolidated financial statements.
Note B-Inventory
Inventory consists of the following:
| March 31, 2011 |
December 31, 2010 |
|||||||
| Repair parts |
$ | 3,265,308 | $ | 2,984,205 | ||||
| Consumable supplies |
903,919 | 1,085,261 | ||||||
| $ | 4,169,227 | $ | 4,069,466 | |||||
F-36
Table of Contents
Index to Financial Statements
GW Holdings I LLC
Notes to Consolidated Financial Statements
(Information as of March 31, 2011 and for the three months ended March 31, 2011 and 2010 is unaudited)
Note C-Property and Equipment
Net property and equipment consists of the following:
| March 31, 2011 |
December 31, 2010 |
|||||||
| Office equipment, furniture and fixtures |
$ | 3,273,079 | $ | 3,153,842 | ||||
| Machinery and equipment |
||||||||
| Horizontal and directional drilling services |
57,255,176 | 55,951,404 | ||||||
| Completion and production services |
116,157,875 | 101,947,569 | ||||||
| Vehicles and trailers |
10,016,298 | 9,237,655 | ||||||
| Buildings and leasehold improvements |
12,308,729 | 12,303,379 | ||||||
| 199,011,157 | 182,593,849 | |||||||
| Less accumulated depreciation and amortization |
(75,322,015 | ) | (69,513,879 | ) | ||||
| 123,689,142 | 113,079,970 | |||||||
| Deposits on equipment and equipment in process of assembly |
30,867,223 | 19,980,973 | ||||||
| Land |
1,166,515 | 1,023,711 | ||||||
| $ | 155,722,880 | $ | 134,084,654 | |||||
The Company has certain buildings and equipment under capital leases that extend through 2027. Amortization of assets recorded under capital leases is reported in depreciation and amortization. The carrying value of assets held under capital lease and the related accumulated amortization consists of the following:
| March 31, 2011 |
December 31, 2010 |
|||||||
| Buildings under capital leases |
$ | 7,783,525 | $ | 7,783,525 | ||||
| Equipment under capital leases |
917,895 | 1,760,850 | ||||||
| Vehicles under capital leases |
544,310 | 544,310 | ||||||
| Accumulated amortization |
(1,738,001 | ) | (1,899,371 | ) | ||||
| $ | 7,507,729 | $ | 8,189,314 | |||||
Deposits on equipment and equipment in process of assembly represents deposits placed with vendors for equipment that is in the process of assembly and purchased equipment that is being outfitted for its intended use. This equipment is not depreciated until it has been placed in service.
Depreciation expense charged to operations totaled $6,259,910, and $5,090,735 for the three months ended March 31, 2011 and 2010, respectively.
Capitalized interest totaled $335,638 for the three months ended March 31, 2011.
F-37
Table of Contents
Index to Financial Statements
GW Holdings I LLC
Notes to Consolidated Financial Statements
(Information as of March 31, 2011 and for the three months ended March 31, 2011 and 2010 is unaudited)
Note D-Other Non-current Assets
Other non-current assets consist of the following:
| March 31, 2011 |
December 31, 2010 |
|||||||
| Cash collateral held by lender |
$ | 1,245,603 | $ | 1,245,603 | ||||
| Deferred financing costs, net |
632,217 | 82,906 | ||||||
| Capitalized common stock issuance costs |
255,498 | — | ||||||
| Deposits |
40,554 | 40,554 | ||||||
| $ | 2,173,872 | $ | 1,369,063 | |||||
In connection with the $10,000,000 credit agreement discussed in Note H, Great White Pressure Pumping LLC was required to deposit cash collateral with the lender. The lender has sole and exclusive possession and control of the cash collateral. The cash collateral does not accrue interest. Upon satisfaction of all the obligations contained in the credit agreement, the lender is obligated to return the cash collateral.
Capitalized common stock issuance costs include printing, legal and other professional fees incurred in connection with the proposed IPO discussed in Note A. Upon the issuance of stock in an IPO, the capitalized common stock issuance costs will be offset against the IPO proceeds in additional paid-in capital.
Note E-Intangible Assets
The tables below provide a summary of the Company’s intangible assets subject to amortization:
| March 31, 2011 | ||||||||||||||||
| Estimated Useful Lives |
Gross Carrying Amount |
Accumulated Amortization |
Net Carrying Amount |
|||||||||||||
| Customer relationships |
9-16 yrs | $ | 14,557,000 | $ | 8,086,291 | $ | 6,470,709 | |||||||||
| Trade names |
20 yrs | 1,220,000 | 221,125 | 998,875 | ||||||||||||
| $ | 15,777,000 | $ | 8,307,416 | $ | 7,469,584 | |||||||||||
| December 31, 2010 | ||||||||||||||||
| Estimated Useful Lives |
Gross Carrying Amount |
Accumulated Amortization |
Net Carrying Amount |
|||||||||||||
| Customer relationships |
9-16 yrs | $ | 14,557,000 | $ | 7,807,311 | $ | 6,749,689 | |||||||||
| Trade names |
20 yrs | 1,220,000 | 205,875 | 1,014,125 | ||||||||||||
| $ | 15,777,000 | $ | 8,013,186 | $ | 7,763,814 | |||||||||||
For the three months ended March 31, 2011 and 2010, amortization expense totaled $294,230 and $359,271, respectively.
F-38
Table of Contents
Index to Financial Statements
GW Holdings I LLC
Notes to Consolidated Financial Statements
(Information as of March 31, 2011 and for the three months ended March 31, 2011 and 2010 is unaudited)
Note F-Accrued and Other Current Liabilities
Accrued and other current liabilities consisted of the following:
| March 31, 2011 |
December 31, 2010 |
|||||||
| Accrued compensation, benefits and related taxes |
$ | 6,253,775 | $ | 5,336,125 | ||||
| Sales taxes |
3,997,157 | 3,210,394 | ||||||
| Insurance payable |
1,232,009 | 1,174,968 | ||||||
| Other |
778,343 | 366,327 | ||||||
| $ | 12,261,284 | $ | 10,087,814 | |||||
In connection with the start-up of Great White Pressure Control LLC the Company entered into employment agreements with certain key executives which provided signing bonuses if the executive is still employed by the Company upon the third anniversary. The obligation was accrued over the three years for which service was provided and totaled $2,000,000 at March 31, 2011 and December 31, 2010, and is included in accrued compensation, benefits and related taxes. Under the terms of an amendment, the payment of this amount is deferred and each employee has indemnified the Company, up to their accrued amount, in relation to any adverse outcome of litigation accusing the Company of misappropriation of trade secrets and unfair competition relating to the Company’s employment of plaintiff’s former employees. All expenses of defense will be borne by the Company (See Note L).
Note G-Debt of Related Parties
On June 29, 2007, Great White Energy Services LLC and certain of it sister companies (the “borrowers” or “borrowing group”), including Great White Pressure Control LLC, Great White Pressure Pumping LLC and Acid, Inc., entered into a revolving line of credit agreement with a group of banks. The line matured in October 2009 and all outstanding principal, accrued and unpaid interest, and any other charges then remaining outstanding on the line of credit were due. At December 31, 2009, the borrowers were in default and were negotiating an extension with the lenders.
Effective February 4, 2010, the existing lenders assigned 100% of their rights and obligations, including all liens and security interests in the collateral, under the credit agreement to Diamondback Holdings, LLC in exchange for full payment of all principal and any other charges outstanding on the line of credit. On May 4, 2010 (with an effective date of March 11, 2010) Great White Energy Services LLC entered into an agreement with Diamondback Holdings, LLC to extend the maturity of the line of credit to April 30, 2011 and waive all defaults.
Effective September 30, 2010 Diamondback Holdings, LLC limited the liability of Great White Pressure Control LLC and Great White Pressure Pumping LLC under the credit agreement to $12,000,000 plus any additional principal sums advanced and extended the maturity date to April 30, 2012. The amount represented the majority of the then outstanding advances from Great White Energy Services LLC. During 2010, the interest rate on this line of credit was 7.25%.
In connection with the Diamondback Holdings, LLC contributions described in Note A that were made on December 31, 2010, Diamondback Holdings, LLC converted the principal plus accrued interest outstanding under the credit agreement to equity in GW Holdings I LLC. The total amount outstanding as of the date of conversion was $21,782,294, which included principal of $20,800,000 and accrued interest of $982,294.
F-39
Table of Contents
Index to Financial Statements
GW Holdings I LLC
Notes to Consolidated Financial Statements
(Information as of March 31, 2011 and for the three months ended March 31, 2011 and 2010 is unaudited)
Note H-Long-Term Debt
Long-term debt consists of the following:
| March 31, 2011 |
December 31, 2010 |
|||||||
| Credit facilities: |
||||||||
| Revolving loan |
$ | 14,000,000 | $ | — | ||||
| Term loan |
7,705,770 | 8,296,710 | ||||||
| Vehicle loans |
642,965 | 389,065 | ||||||
| 22,348,735 | 8,685,775 | |||||||
| Less current portion |
2,851,516 | 2,673,605 | ||||||
| Total |
$ | 19,497,219 | $ | 6,012,170 | ||||
On February 15, 2011, the Company entered into a revolving line of credit agreement with a bank. GW Holdings I LLC, Great White Energy Service, Inc., Acid, Inc., Diamondback Directional Drilling LLC, Great White Directional Services LLC, Great White Pressure Control LLC, and Great White Pressure Pumping LLC, individually and collectively, are borrowers under the credit agreement. The line provides up to $50,000,000 in total commitments. The line matures on February 15, 2016 with interest payable monthly. At the Company’s option, advances bear interest at Base Rate or Eurodollar Rate plus 2.25% to 2.75%. Under the terms of the credit agreement, “Base Rate” is defined as the higher of (i) the rate at which the lender announces from time to time as its prime lending rate, as in effect from time to time, (ii) the Federal Funds Rate, as in effect from time to time, plus one-half percent per annum or (iii) the Eurodollar Rate determined on a daily basis for a period of one (1) month. The line is subject to an unused line fee of .375% through April 30, 2011. Beginning May 1, 2011, the line is subject to an unused line fee of .375% if the average amount outstanding is greater than or equal to 50% of the total commitment and .5% if the average amount outstanding is less than or equal to 50% of the total commitment.
The maximum amount available under the credit facility is subject to a borrowing base formula based on trade accounts receivable of the borrowing group less reserves. The reserves are at the discretion of the bank and include reserves for certain taxes, bank products, dilution, and other reserves. Until July 31, 2011, the availability is reduced by the greater of $5,000,000 or ten percent of the revolving loan commitment. At March 31, 2011, total availability was limited to $37,938,716 by the borrowing base calculation. The interest rate on the revolving line of credit was 2.81% as of March 31, 2011. The line of credit agreement contains certain financial information covenants, including a minimum fixed charge coverage ratio. Other covenants restrict additional debt to $40,000,000, restrict specified payments and purchases, and restrict specified affiliate transactions. The Company was in compliance with the financial covenants at March 31, 2011.
The obligations under the revolving line of credit agreement are secured by all working capital assets of the Borrowers under a related security agreement.
On November 24, 2010, Great White Pressure Pumping LLC entered into a borrowing agreement with a third party. The maximum amount available under the agreement is $10,000,000. The agreement subjects Great White Pressure Pumping LLC to certain financial reporting requirements and financial covenants. The credit agreement requires maintenance of a minimum tangible net worth of $95,000,000 and restricts the aggregate amount of dividends and/or distributions, excluding loan payments made to a parent or affiliate in connection with the credit agreement, to the amount of annual net income based on the results of the rolling last four (4) quarters. The credit agreement is secured by certain specified equipment and cash collateral (See Note D). Each draw is treated as a
F-40
Table of Contents
Index to Financial Statements
GW Holdings I LLC
Notes to Consolidated Financial Statements
(Information as of March 31, 2011 and for the three months ended March 31, 2011 and 2010 is unaudited)
separate note under the terms of the credit agreement. The separate notes mature in 36 months and require monthly payments of principal and interest. As of March 31, 2011, the monthly payments were $253,467. The maturity dates range between December 2013 and January 2014. The interest rate on the notes is fixed and was 6.28% as of March 31, 2011. The borrowing agreement is secured by assets with a cost of $14,427,283 at March 31, 2011. The Company was in compliance with the financial covenants at March 31, 2011.
On various dates between November 26, 2010 and December 3, 2010, Great White Pressure Pumping entered into borrowing agreements to finance the purchase of certain vehicles. The agreements are secured by certain specified vehicles. The cost of the vehicles serving as collateral for the borrowing agreements was $401,618 at March 31, 2011. The loan agreements are for 36 months and require monthly payments of principal and interest. As of March 31, 2011, the monthly payments were $12,434. The interest rate on the loans is fixed at 6.99%.
On January 31, 2011, Great White Pressure Pumping entered into a borrowing agreement to finance the purchase of certain vehicles. The agreement is secured by certain specified vehicles. The cost of the vehicles serving as collateral for the borrowing agreements was $291,900 at March 31, 2011. The loan agreements are for 36 months and require monthly payments of principal and interest. As of March 31, 2011, the monthly payments were $8,764. The interest rate on the loans is fixed at 4.99%.
At March 31, 2011 the aggregate maturities of long-term debt, excluding capital leases, are as follows:
| For the twelve months ended March 31: |
||||
| 2012 |
$ | 2,851,516 | ||
| 2013 |
3,036,831 | |||
| 2014 |
2,460,388 | |||
| 2015 |
— | |||
| 2016 |
14,000,000 | |||
| Total |
$ | 22,348,735 | ||
Note I-Capital Leases
The Company leases three properties for its completion and production service operation from a related third party controlled by Wexford. The leases commenced in 2007 and 2008 and have lease terms of 20 years with options for two five year extensions. The aggregate monthly lease payments are $54,922 and provide for annual lease escalation based on increases in the consumer price index.
The Company also leases another operating facility for its completion and production service operations from a development company controlled by an employee of the operations. The lease was effective April 1, 2009 and has an initial term of five years with options for three five year extensions. The Company has the option to purchase the facility at a prescribed formula based on the facility’s cost at any time after the first extension term or at any time upon the employee’s termination, his departure from the development company, or his receipt of a bona fide third party offer to purchase the property. The monthly lease payments are $11,250 during the initial term and subject to negotiation thereafter.
The Company leases certain equipment under a capital lease. The lease terms are 42 months at an aggregate monthly payment of $16,724. Ownership of the assets transfers at expiration of the lease but purchase of the assets, at a prescribed formula, can be accelerated at lessee’s option at any time.
F-41
Table of Contents
Index to Financial Statements
GW Holdings I LLC
Notes to Consolidated Financial Statements
(Information as of March 31, 2011 and for the three months ended March 31, 2011 and 2010 is unaudited)
The Company leases certain equipment under a capital lease. The lease terms are 12 months at an aggregate monthly payment of $35,753. Ownership of the assets transfers at expiration of the lease.
The Company leases certain vehicles under a capital lease. The terms are 36 months at an aggregate monthly payment of $16,104.
Future minimum lease payments under capital leases as of March 31, 2011 are:
| For the twelve months ended March 31: |
||||
| 2012 |
$ | 1,296,151 | ||
| 2013 |
1,017,901 | |||
| 2014 |
810,175 | |||
| 2015 |
714,072 | |||
| 2016 |
659,072 | |||
| Thereafter |
7,176,004 | |||
| Total minimum payments |
11,673,375 | |||
| Less amounts representing interest |
4,646,056 | |||
| Total obligations under capital leases |
7,027,319 | |||
| Less current portion |
775,472 | |||
| Long-term portion |
$ | 6,251,847 | ||
Note J-Operating Leases
The Company has committed to various facility and equipment leases some of which have renewal and purchase options. The lease terms vary from one year to 20 years. Future minimum lease payments for these leases are as follows as of March 31, 2011:
| For the twelve months ended March 31: |
||||
| 2012 |
$ | 759,679 | ||
| 2013 |
541,906 | |||
| 2014 |
379,511 | |||
| 2015 |
317,050 | |||
| 2016 |
309,379 | |||
| Thereafter |
2,833,174 | |||
| Total |
$ | 5,140,699 | ||
Rent expense for the three months ended March 31, 2011, and 2010 was $290,845 and $233,248, respectively.
The Company leases two facilities from a Wexford controlled entity which are included in the future minimum lease payments presented above. The leases commenced in 2006 and 2007 and have a term of 20 years. One of the leases has options for two five year extensions and the other lease provides for one five year renewal option. The monthly lease payments aggregate to $19,700 and provide for an annual lease escalation based on increase in the consumer price index.
F-42
Table of Contents
Index to Financial Statements
GW Holdings I LLC
Notes to Consolidated Financial Statements
(Information as of March 31, 2011 and for the three months ended March 31, 2011 and 2010 is unaudited)
Note K-Member’s Equity
The Company’s ownership in Great White Pressure Pumping LLC, Great White Directional Services LLC and Diamondback Directional Drilling LLC is represented by membership interests in the companies. Ownership of Acid, Inc. and Great White Energy Services, Inc. is represented by common stock. The membership interests and common stock entitle the holder to all voting rights and 100% of profits and losses.
Ownership of Great White Pressure Control LLC (“GWPC”) is represented by 1,000 Class A and 1,000 Class B units. Seventy Class B units were issued to key employees pursuant to employment agreements. The Class B units have no voting rights and are convertible one for one into Class A units upon Wexford’s recovery of its investment plus a specified return (as defined in the agreements), the sale of all units to an unaffiliated third party, or an initial public offering within a larger consolidated affiliate. If conversion occurs as a result of a sale to a third party, vesting is immediate. If conversion otherwise occurs within the first five years, the units are subject to a vesting schedule through the remaining period of the five years. If conversion otherwise occurs after five years, vesting is immediate. Satisfaction of the performance conditions of these agreements effectively requires the occurrence of a liquidity event and, as such, costs of these agreements will be recognized upon actual occurrence of the liquidity event and upon meeting vesting requirements.
Note L-Commitments and Contingencies
In November 2006, Cudd Pressure Control, Inc., (“Cudd”) filed a lawsuit against Great White Pressure Control LLC and Gulfport Energy Corporation, among others, in the 129th Judicial District Harris County, Texas. The lawsuit was subsequently removed to the United States District Court for the Southern District of Texas (Houston Division). The lawsuit alleges RICO violations and several other causes of action relating to the employment of several former Cudd employees and seeks unspecified monetary damages and injunctive relief.
On stipulation by the parties, the plaintiff’s RICO claim was dismissed without prejudice by order of the court on February 14, 2007. The Company filed a motion for summary judgment on October 5, 2007. The court entered a final interlocutory judgment in favor of all defendants, including the Company, on April 8, 2008. On November 3, 2008, Cudd filed its appeal with the U.S. Court of Appeals for the Fifth Circuit. The Fifth Circuit vacated the district court decision finding, among other things, that the district court should not have entered summary judgment without first allowing more discovery. The case was remanded back to the federal district court, and Cudd filed a motion to remand the case to state court. The federal district court granted Cudd’s motion and remanded the case to state court. On February 3, 2010, the plaintiff filed its second amended petition with the state court (a) alleging that Great White Pressure Control LLC conspired with the other defendants to misappropriate, and misappropriated, Cudd’s trade secrets and caused its employees to breach their fiduciary duties, and (b) seeking unspecified monetary damages. On April 13, 2010, the Company’s motion to be dismissed from the proceedings for lack of personal jurisdiction was denied. On February 15, 2011, the plaintiff filed its third amended petition with the state court seeking (a) damages of up to $26.5 million as the value of defendants’ alleged misappropriation and (b) the individuals’ disgorgement of $6.0 million in signing bonuses. This state court proceeding is in its initial stages. Therefore, the impact to the financial statements, if any, cannot be determined.
The Company is, from time to time, involved in routine litigation or subject to disputes or claims related to business activities, including workers’ compensation claims and employment related disputes. In the opinion of management, other than that discussed above, none of the pending litigation, disputes or claims against the Company, if decided adversely, is expected to have a material effect on the Company’s financial condition, results of operations, or cash flows.
F-43
Table of Contents
Index to Financial Statements
GW Holdings I LLC
Notes to Consolidated Financial Statements
(Information as of March 31, 2011 and for the three months ended March 31, 2011 and 2010 is unaudited)
Prior to September 2009, Great White Directional Services LLC and Diamondback Directional Drilling LLC partially insured their workers’ compensation claims, which included medical expenses, lost time and temporary and permanent disability benefits. During that time, the companies were covered by an insurance policy that required a $250,000 deductible per occurrence. The Company establishes liabilities for the unpaid deductible portion of claims incurred relating to workers’ compensation based on estimates. As of March 31, 2011 and December 31, 2010 accrued claims were $201,680. These estimates may change in the near term as actual claims continue to develop. In connection with the Great White Directional Services LLC and Diamondback Directional Drilling LLC insurance programs, letters of credit of $2,779,755 have been issued supporting the estimated retained risk exposure. As of March 31, 2011, these letters of credit are cash collateralized by Diamondback Holdings, LLC.
The Company participates in a self-insured health plan and maintains individual stop loss coverage of $150,000 per person and aggregate stop loss coverage subject to an annual limit of $7,162,905 as of March 31, 2011. Claims processing and the overall administration of the plan are provided by a third party. The Company was allocated its share of expenses and related self-insured retention under the plan in the amount of $1,116,517 and $784,726 for the three months ended March 31, 2011 and 2010, respectively. At March 31, 2011 and December 31, 2010, accrued claims were $346,049 and $416,861, respectively.
The Company has entered into employment contracts with certain key employees. In the event of termination without good cause, these employees may receive compensation as defined under the contracts. The maximum that could be paid under the contracts at March 31, 2011 for termination without good cause is $3,762,917. Some of the employment contracts contain provisions that require the Company to make payments to the key employees in the event of either an IPO or sale of substantially all of the assets of the Company to a third party buyer. At March 31, 2011, the maximum that could be paid upon the occurrence of one of these events was $700,000.
The Company has firm purchase commitments for equipment of approximately $25,483,000 as of March 31, 2011.
Note M-Related Party Transactions
The Company has entered into transactions with certain other entities affiliated with Wexford, other subsidiaries of GWES Holdings LLC or Diamondback Holdings, LLC, or operating management. A summary of transactions with those related parties that are not separately stated on the face of the financial statements for the three months ended March 31, 2011 and 2010 follows:
| 2011 | 2010 | |||||||
| Purchased services |
$ | 270,799 | $ | 51,187 | ||||
| Capital asset purchases |
$ | 11,076,963 | $ | 2,525,734 | ||||
| Capital asset sales |
$ | 5,205 | $ | — | ||||
| Facility operating leases |
$ | 59,265 | $ | 89,100 | ||||
Note N-Operating Segments
The Company is organized into two reportable segments based on the nature of services provided and the basis on which the chief executive officer and segment management make business and operating decisions. The Company principally provides oilfield services in connection with the on-shore drilling of oil and natural gas wells for small to large domestic independent oil and natural gas producers.
F-44
Table of Contents
Index to Financial Statements
GW Holdings I LLC
Notes to Consolidated Financial Statements
(Information as of March 31, 2011 and for the three months ended March 31, 2011 and 2010 is unaudited)
The Company’s two segments consist of horizontal and directional drilling services and completion and production services. A description of the operating segments and the type of products and services from which their revenues are derived follows:
The horizontal and directional drilling services segment generates revenue through operating the Company’s measurement while drilling equipment and electromagnetic technology equipment for the horizontal and directional drilling operations of the Company’s customers. The primary regions of operations are the Mid-Continent Basin, Permian Basin, Rocky Mountain region and Appalachian Basin. The horizontal and directional drilling services segment includes Caliber Wyoming Properties, LLC, which is a variable interest entity that has been consolidated in the accompanying financial statements in accordance with FASB ASC 810.
The completion and production services segment generates revenue by providing hydraulic fracturing, coil tubing, snubbing, nitrogen, wireline, fluid pumping and well control services. The primary regions of operations are the Mid-Continent Basin and Permian Basin.
Corporate contains the reconciliation between the totals for reportable segments and the Company’s totals and other corporate items not allocated to the reportable segments.
The following table sets forth certain financial information with respect to the Company’s reportable segments:
| Horizontal and Directional Drilling Services |
Completion and Production Services |
Corporate | Total | |||||||||||||
| March 31, 2011 |
||||||||||||||||
| Revenue from external customers |
$ | 18,933,598 | $ | 54,634,794 | $ | — | $ | 73,568,392 | ||||||||
| Revenue from related parties |
$ | 956,767 | $ | 5,839,073 | $ | — | $ | 6,795,840 | ||||||||
| Interest expense |
$ | 11,503 | $ | (22,403 | ) | $ | 40,373 | $ | 29,473 | |||||||
| Depreciation and amortization expense |
$ | 2,993,040 | $ | 3,561,100 | $ | — | $ | 6,554,140 | ||||||||
| Income tax provision |
$ | 7,218 | $ | 25,913 | $ | — | $ | 33,131 | ||||||||
| Net income (loss) |
$ | 497,548 | $ | 20,603,060 | $ | (1,809,934 | ) | $ | 19,290,674 | |||||||
| Total expenditures for long-lived assets |
$ | 1,911,744 | $ | 19,933,761 | $ | — | $ | 21,845,505 | ||||||||
| Goodwill |
$ | 16,222,481 | $ | — | $ | — | $ | 16,222,481 | ||||||||
| Intangible assets, net |
$ | 7,469,584 | $ | — | $ | — | $ | 7,469,584 | ||||||||
| Total assets |
$ | 75,061,178 | $ | 168,135,655 | $ | 18,063,598 | $ | 261,260,431 | ||||||||
| March 31, 2010 |
||||||||||||||||
| Revenue from external customers |
$ | 13,972,869 | $ | 20,909,859 | $ | — | $ | 34,882,728 | ||||||||
| Revenue from related parties |
$ | 548,524 | $ | 411,204 | $ | — | $ | 959,728 | ||||||||
| Interest expense |
$ | 478 | $ | 354,031 | $ | — | $ | 354,509 | ||||||||
| Depreciation and amortization expense |
$ | 2,799,243 | $ | 2,650,763 | $ | — | $ | 5,450,006 | ||||||||
| Income tax provision (benefit) |
$ | 12,185 | $ | (45,781 | ) | $ | — | $ | (33,596 | ) | ||||||
| Net (loss) income |
$ | (766,430 | ) | $ | 517,873 | $ | (1,049,333 | ) | $ | (1,297,890 | ) | |||||
| Total expenditures for long-lived assets |
$ | 1,636,655 | $ | 1,853,392 | $ | — | $ | 3,490,047 | ||||||||
| Goodwill |
$ | 16,222,481 | $ | — | $ | — | $ | 16,222,481 | ||||||||
| Intangible assets, net |
$ | 8,841,628 | $ | — | $ | — | $ | 8,841,628 | ||||||||
| Total assets |
$ | 67,227,287 | $ | 90,056,281 | $ | — | $ | 157,283,568 | ||||||||
F-45
Table of Contents
Index to Financial Statements
GW Holdings I LLC
Notes to Consolidated Financial Statements
(Information as of March 31, 2011 and for the three months ended March 31, 2011 and 2010 is unaudited)
Note O-Subsequent Events
The Company has evaluated events and transactions that occurred subsequent to March 31, 2011 through July 14, 2011, the date these financial statements were available to be issued, for potential recognition or disclosure in these financial statements.
During June 2011, the Company entered into Amended and Restated Employment Agreements effective as of June 1, 2011 with six executives which provide for a term of three years ending May 31, 2014 at their current base salary plus certain incentive compensation, subject to achievement of certain financial performance targets. The agreement also provides salary continuation for the remainder of the term if terminated by the Company without good cause. In connection with signing these agreements the executives will receive a payment of $2,000,000, which is the $2,000,000 obligation accrued at March 31, 2011 and included in accrued and other current liabilities. (See Note F).
Additionally, upon the closing of an IPO the executives will be paid a lump sum of $4,294,445 and receive restricted stock units (“RSUs”) with a value of $11,713,580 calculated at the price per share offered to the public in the offering. The RSUs will be subject to a six month lock-up and other regulatory restrictions.
Additionally, the executives indemnification of the Company with respect to the Cudd litigation was released to the extent of matters contained in documents produced and testimony given as of June 1, 2011, subject to certain conditions. (See Notes F and L).
F-46
Table of Contents
Index to Financial Statements
[THIS PAGE INTENTIONALLY LEFT BLANK]
F-47
Table of Contents
Index to Financial Statements
Report of Independent Registered Public Accounting Firm
Board of Directors and Stockholder
Great White Energy Services, Inc.
We have audited the accompanying balance sheet of Great White Energy Services, Inc. as of January 4, 2011. This financial statement is the responsibility of the Company’s management. Our responsibility is to express an opinion on this financial statement based on our audit.
We conducted our audit in accordance with the standards of the Public Company Accounting Oversight Board (United States). Those standards require that we plan and perform the audit to obtain reasonable assurance about whether the balance sheet is free of material misstatement. The Company is not required to have, nor were we engaged to perform, an audit of its internal control over financial reporting. Our audit included consideration of internal control over financial reporting as a basis for designing audit procedures that are appropriate in the circumstances, but not for the purpose of expressing an opinion on the effectiveness of the Company’s internal control over financial reporting. Accordingly, we express no such opinion. An audit also includes examining, on a test basis, evidence supporting the amounts and disclosures in the balance sheet, assessing the accounting principles used and significant estimates made by management, as well as evaluating the overall balance sheet presentation. We believe that our audit of the balance sheet provides a reasonable basis for our opinion.
In our opinion, the balance sheet referred to above presents fairly, in all material respects, the financial position of Great White Energy Services, Inc. as of January 4, 2011, in conformity with accounting principles generally accepted in the United States of America.
/s/ GRANT THORNTON LLP
Oklahoma City, Oklahoma
February 10, 2011
F-48
Table of Contents
Index to Financial Statements
Great White Energy Services, Inc.
Balance Sheets
| March 31, 2011 (unaudited) |
January 4, 2011 |
|||||||
| ASSETS | ||||||||
| Cash |
$ | 992 | $ | 1,000 | ||||
| Total assets |
$ | 992 | $ | 1,000 | ||||
| STOCKHOLDERS’ EQUITY | ||||||||
| Stockholders’ equity |
||||||||
| Common stock $0.01 par value; 100 shares authorized; 100 shares issued and outstanding |
$ | 1 | $ | 1 | ||||
| Additional paid-in capital |
999 | 999 | ||||||
| Accumulated deficit |
(8 | ) | — | |||||
| Total stockholders’ equity |
$ | 992 | $ | 1,000 | ||||
The accompanying notes are an integral part of this balance sheet.
F-49
Table of Contents
Index to Financial Statements
Great White Energy Services, Inc.
Notes to Balance Sheets
1. NATURE OF OPERATIONS
Great White Energy Services, Inc. (the “Corporation”) is a Delaware corporation formed on December 1, 2010 and capitalized on January 4, 2011.
The Corporation intends to offer common stock pursuant to an initial public offering. In connection with this offering, GWES Holdings LLC has contributed to GW Holdings I LLC (“GWH”) its membership interests or common stock, as applicable, in three of its wholly owned subsidiaries, Great White Pressure Control LLC, Great White Pressure Pumping LLC, and Acid, Inc., and Diamondback Holdings, LLC has contributed to GWH its membership interests in two of its wholly owned subsidiaries, Great White Directional Services LLC and Diamondback Directional Drilling LLC in exchange for common stock. Prior to the completion of its initial public offering, the Corporation will be merged into GWH and the Corporation will continue as the surviving corporation.
Through January 4, 2011, the Corporation had not earned any income and had incurred only nominal expenses; therefore, the statements of income, stockholders’ equity and cash flows have been omitted.
2. SUBSEQUENT EVENTS
The Corporation has evaluated events and transactions that occurred subsequent to January 4, 2011 through February 10, 2011, the date the January 4, 2011 balance sheet was available to be issued, for potential recognition or disclosure in that financial statement.
3. UNAUDITED INTERIM BALANCE SHEET
The accompanying balance sheet as of March 31, 2011 has been prepared by the Corporation without audit pursuant to the rules and regulations of the Securities and Exchange Commission. The interim balance sheet has been prepared on a basis consistent with the January 4, 2011 balance sheet.
Through March 31, 2011, the Corporation had not earned any income and had incurred only nominal expenses; therefore, the statements of income, stockholders’ equity and cash flows have been omitted.
The Corporation has evaluated events and transactions that occurred subsequent to March 31, 2011 through June 7, 2011, the date the March 31, 2011 balance sheet was available to be issued, for potential recognition or disclosure in the financial statement.
F-50
Table of Contents
Index to Financial Statements
Table of Contents
Index to Financial Statements
PART II
INFORMATION NOT REQUIRED IN PROSPECTUS
| Item 13. | Other Expenses of Issuance and Distribution. |
The following table sets forth the fees and expenses in connection with the issuance and distribution of the securities being registered hereunder. Except for the SEC registration fee and FINRA filing fee, all amounts are estimates.
| SEC registration fee |
$ | 35,048 | ||
| FINRA filing fee |
$ | 30,687 | ||
| NASDAQ Global Market listing fee |
$ | 25,000 | ||
| Accounting fees and expenses |
$ | 300,000 | ||
| Legal fees and expenses |
$ | 900,000 | ||
| Blue Sky fees and expenses (including counsel fees) |
$ | 15,000 | ||
| Printing and Engraving expenses |
$ | 125,000 | ||
| Transfer Agent and Registrar fees and expenses |
$ | 15,000 | ||
| Miscellaneous expenses |
$ | 54,265 | ||
| Total |
$ | 1,500,000 | ||
| Item 14. | Indemnification of Directors and Officers. |
Limitation of Liability
Section 102(b)(7) of the Delaware General Corporation Law, or the DGCL, permits a corporation, in its certificate of incorporation, to limit or eliminate, subject to certain statutory limitations, the liability of directors to the corporation or its stockholders for monetary damages for breaches of fiduciary duty, except for liability:
| • | for any breach of the director’s duty of loyalty to the company or its stockholders; |
| • | for acts or omissions not in good faith or that involve intentional misconduct or a knowing violation of law; |
| • | in respect of certain unlawful dividend payments or stock redemptions or repurchases; and |
| • | for any transaction from which the director derives an improper personal benefit. |
In accordance with Section 102(b)(7) of the DGCL, Section 9.1 of our certificate of incorporation provides that that no director shall be personally liable to us or any of our stockholders for monetary damages resulting from breaches of their fiduciary duty as directors, except to the extent such limitation on or exemption from liability is not permitted under the DGCL. The effect of this provision of our certificate of incorporation is to eliminate our rights and those of our stockholders (through stockholders’ derivative suits on our behalf) to recover monetary damages against a director for breach of the fiduciary duty of care as a director, including breaches resulting from negligent or grossly negligent behavior, except, as restricted by Section 102(b)(7) of the DGCL. However, this provision does not limit or eliminate our rights or the rights of any stockholder to seek non-monetary relief, such as an injunction or rescission, in the event of a breach of a director’s duty of care.
If the DGCL is amended to authorize corporate action further eliminating or limiting the liability of directors, then, in accordance with our certificate of incorporation, the liability of our directors to us or our stockholders will be eliminated or limited to the fullest extent authorized by the DGCL, as so amended. Any repeal or amendment of provisions of our certificate of incorporation limiting or eliminating the liability of directors, whether by our stockholders or by changes in law, or the adoption of any other provisions inconsistent therewith, will (unless otherwise required by law) be prospective only, except to the extent such amendment or change in law permits us to further limit or eliminate the liability of directors on a retroactive basis.
II-1
Table of Contents
Index to Financial Statements
Indemnification
Section 145 of the DGCL permits a corporation, under specified circumstances, to indemnify its directors, officers, employees or agents against expenses (including attorneys’ fees), judgments, fines and amounts paid in settlements actually and reasonably incurred by them in connection with any action, suit or proceeding brought by third parties by reason of the fact that they were or are directors, officers, employees or agents of the corporation, if such directors, officers, employees or agents acted in good faith and in a manner they reasonably believed to be in or not opposed to the best interests of the corporation and, with respect to any criminal action or proceeding, had no reason to believe their conduct was unlawful. In a derivative action, i.e., one by or in the right of the corporation, indemnification may be made only for expenses actually and reasonably incurred by directors, officers, employees or agents in connection with the defense or settlement of an action or suit, and only with respect to a matter as to which they shall have acted in good faith and in a manner they reasonably believed to be in or not opposed to the best interests of the corporation, except that no indemnification shall be made if such person shall have been adjudged liable to the corporation, unless and only to the extent that the court in which the action or suit was brought shall determine upon application that the defendant directors, officers, employees or agents are fairly and reasonably entitled to indemnity for such expenses despite such adjudication of liability.
Our certificate of incorporation provides that we will, to the fullest extent authorized or permitted by applicable law, indemnify our current and former directors and officers, as well as those persons who, while directors or officers of our corporation, are or were serving as directors, officers, employees or agents of another entity, trust or other enterprise, including service with respect to an employee benefit plan, in connection with any threatened, pending or completed proceeding, whether civil, criminal, administrative or investigative, against all expense, liability and loss (including, without limitation, attorney’s fees, judgments, fines, ERISA excise taxes and penalties and amounts paid in settlement) reasonably incurred or suffered by any such person in connection with any such proceeding. Notwithstanding the foregoing, a person eligible for indemnification pursuant to our certificate of incorporation will be indemnified by us in connection with a proceeding initiated by such person only if such proceeding was authorized by our board of directors, except for proceedings to enforce rights to indemnification.
The right to indemnification conferred by our certificate of incorporation is a contract right that includes the right to be paid by us the expenses incurred in defending or otherwise participating in any proceeding referenced above in advance of its final disposition, provided, however, that if the DGCL requires, an advancement of expenses incurred by our officer or director (solely in the capacity as an officer or director of our corporation) will be made only upon delivery to us of an undertaking, by or on behalf of such officer or director, to repay all amounts so advanced if it is ultimately determined that such person is not entitled to be indemnified for such expenses under our certificate of incorporation or otherwise.
The rights to indemnification and advancement of expenses will not be deemed exclusive of any other rights which any person covered by our certificate of incorporation may have or hereafter acquire under law, our certificate of incorporation, our bylaws, an agreement, vote of stockholders or disinterested directors, or otherwise.
Any repeal or amendment of provisions of our certificate of incorporation affecting indemnification rights, whether by our stockholders or by changes in law, or the adoption of any other provisions inconsistent therewith, will (unless otherwise required by law) be prospective only, except to the extent such amendment or change in law permits us to provide broader indemnification rights on a retroactive basis, and will not in any way diminish or adversely affect any right or protection existing at the time of such repeal or amendment or adoption of such inconsistent provision with respect to any act or omission occurring prior to such repeal or amendment or adoption of such inconsistent provision. Our certificate of incorporation also permits us, to the extent and in the manner authorized or permitted by law, to indemnify and to advance expenses to persons other that those specifically covered by our certificate of incorporation.
Our bylaws include the provisions relating to advancement of expenses and indemnification rights consistent with those set forth in our certificate of incorporation. In addition, our bylaws provide for a right of
II-2
Table of Contents
Index to Financial Statements
indemnitee to bring a suit in the event a claim for indemnification or advancement of expenses is not paid in full by us within a specified period of time. Our bylaws also permit us to purchase and maintain insurance, at our expense, to protect us and/or any director, officer, employee or agent of our corporation or another entity, trust or other enterprise against any expense, liability or loss, whether or not we would have the power to indemnify such person against such expense, liability or loss under the DGCL.
Any repeal or amendment of provisions of our bylaws affecting indemnification rights, whether by our board of directors, stockholders or by changes in applicable law, or the adoption of any other provisions inconsistent therewith, will (unless otherwise required by law) be prospective only, except to the extent such amendment or change in law permits us to provide broader indemnification rights on a retroactive basis, and will not in any way diminish or adversely affect any right or protection existing thereunder with respect to any act or omission occurring prior to such repeal or amendment or adoption of such inconsistent provision.
We will enter into indemnification agreements with each of our current directors and executive officers. These agreements will require us to indemnify these individuals to the fullest extent permitted under Delaware law against liabilities that may arise by reason of their service to us, and to advance expenses incurred as a result of any proceeding against them as to which they could be indemnified. We also intend to enter into indemnification agreements with our future directors and executive officers.
Under the Underwriting Agreement, the underwriters are obligated, under certain circumstances, to indemnify directors and officers of the registrant against certain liabilities, including liabilities under the Securities Act of 1933, as amended, or the Securities Act. Reference is made to the form of Underwriting Agreement to be filed as Exhibit 1.1 to this Registration Statement.
| Item 15. | Recent Sales of Unregistered Securities. |
None.
| Item 16. | Exhibits and Financial Statement Schedules. |
| (A) | Exhibits: |
| Exhibit |
Number Description | |
| 1.1* |
Form of Underwriting Agreement. | |
| 2.1* |
Contribution Agreement by and among GWES Holdings LLC, Diamondback Holdings LLC and GW Holdings I LLC, dated as of December 31, 2010. | |
| 2.2* |
Form of Merger Agreement by and among GWES Holdings LLC, Diamondback Holdings, LLC, GW Holdings I LLC and Great White Energy Services, Inc. | |
| 3.1* |
Certificate of Incorporation of the Company. | |
| 3.2* |
Form of proposed Amended and Restated Certificate of Incorporation to be effective immediately upon the closing of the offering made pursuant to this registration statement. | |
| 3.3* |
Bylaws of the Company. | |
| 3.4* |
Form of proposed Bylaws to be effective immediately upon the closing of the offering made pursuant to this registration statement. | |
| 4.1* |
Specimen Certificate for shares of common stock, par value $0.01 per share, of the Company. | |
| 4.2* |
Form of Registration Rights Agreement by and among the Company, GWES Holdings LLC and Diamondback Holdings, LLC. | |
| 5.1* |
Opinion of Akin Gump Strauss Hauer & Feld LLP. | |
II-3
Table of Contents
Index to Financial Statements
| Exhibit |
Number Description | |
| 10.1* |
Master Service Contract between Diamondback Holdings, LLC and Windsor Energy Group, LLC, dated March 3, 2008. | |
| 10.2* |
Shared Services Agreement between Great White Energy Services LLC and Gulfport Energy Corporation, dated July 22, 2006. | |
| 10.3* |
Shared Services Agreement between Great White Energy Services LLC and Everest Operations Management LLC, dated March 1, 2007. | |
| 10.4* |
Shared Services Agreement between Great White Energy Services LLC and Everest Operations Management LLC, dated August 1, 2008. | |
| 10.5* |
Office Lease Agreement between Caliber Investment Group LLC and Great White Energy Services LLC, dated December 10, 2007. | |
| 10.6* |
Data Room Addendum to Office Lease Agreement between Caliber Investment Group LLC and Great White Energy Services LLC, dated December 10, 2007. | |
| 10.7* |
Amended and Restated Lease Agreement between Caliber Development Company LLC and Great White Pressure Control, LLC, dated November 11, 2008. | |
| 10.8* |
Lease Agreement between Caliber Development Company LLC and Great White Pressure Control, LLC, dated November 11, 2008. | |
| 10.9* |
Lease Amendment Agreement between Caliber Development Company LLC and Great White Pressure Control, LLC, dated May 10, 2007. | |
| 10.10* |
Lease Agreement between Caliber Texas Properties LP and Diamondback-Quantum LLC, dated March 1, 2007. | |
| 10.11* |
Amended and Restated Lease Agreement between Caliber Development Company LLC and Diamondback-Quantum LLC, dated January 1, 2009. | |
| 10.12* |
Amended and Restated Lease Agreement between Caliber Wyoming Properties LLC and Diamondback-Quantum LLC, dated January 1, 2009. | |
| 10.13*† |
Long Term Incentive Award Agreement between Great White Energy Services LLC and Phillip Lancaster, dated June 30, 2008. | |
| 10.14*† |
Employee Retention Agreement between Great White Energy Services LLC and Phillip Lancaster, dated August 16, 2010. | |
| 10.15*† |
Assignment and Assumption of and Amended and Restated Employment Agreement among Great White Energy Services LLC, GW Holdings I, LLC and David Sparkman, dated May 16, 2011. | |
| 10.16*† |
Employment Agreement between Great White Energy Services LLC and Steve Williams, dated April 1, 2010. | |
| 10.17*† |
Amended and Restated Employment Agreement between Great White Pressure Control LLC and Ronnie Roles, dated June 1, 2011. | |
| 10.18*† |
Employment Agreement between GW Holdings I, LLC and John Jordan, dated March 1, 2011. | |
| 10.19*† |
Assignment and Assumption of and Amended and Restated Employment Agreement among Great White Energy Services LLC, GW Holdings I, LLC and Randall Holder, dated May 16, 2011. | |
| 10.20*† |
Employment Agreement between Diamondback Holdings, LLC and Danny Ward, dated September 1, 2008. | |
II-4
Table of Contents
Index to Financial Statements
| Exhibit |
Number Description | |
| 10.21*† |
Assignment and Assumption of and First Amendment to Diamondback Employment Agreement, by and among Diamondback Holdings, LLC, Great White Directional Services LLC and Danny Ward, dated March 25, 2011. | |
| 10.22*† |
Form of 2011 Equity Incentive Plan. | |
| 10.23*† |
Form of Stock Option Agreement. | |
| 10.24*† |
Form of Restricted Stock Unit Agreement. | |
| 10.25*† |
Form of Director and Officer Indemnification Agreement. | |
| 10.26* |
Form of Master Services Agreement by and between Sandridge Energy Inc. and Great White Pressure Pumping LLC. | |
| 10.27* |
Form of Advisory Services Agreement by and between Great White Energy Services, Inc. and Wexford Capital LP. | |
| 10.28* |
Credit Agreement by and among GW Holdings I, LLC, Great White Energy Services, Inc., Acid Inc. Diamondback-Directional Drilling LLC, Great White Directional Services LLC, Great White Pressure Control LLC, Great White Pressure Pumping LLC, the persons party thereto from time to time as guarantors, the financial institutions party thereto from time to time as lenders and SunTrust Bank, dated February 15, 2011. | |
| 10.29* |
Amended and Restated Employment Agreement between Great White Pressure Control LLC and Rocky Roles, dated June 1, 2011. | |
| 21.1* |
List of Significant Subsidiaries of the Company. | |
| 23.1** |
Consent of Grant Thornton LLP. | |
| 23.2* |
Consent of Akin Gump Strauss Hauer & Feld LLP (included in Exhibit 5.1). | |
| 24.1 |
Power of Attorney (included on signature page). | |
| 99.1* |
Consent of Arthur H. Amron to being named as a director nominee. | |
| 99.2* |
Consent of Charles E. Davidson to being named as a director nominee. | |
| 99.3* |
Consent of Douglas Lambert to being named as a director nominee. | |
| 99.4* |
Consent of Mike Liddell to being named as a director nominee. | |
| 99.5* |
Consent of Mark L. Plaumann to being named as a director nominee. | |
| 99.6* |
Consent of David L. Houston to being named as a director nominee. | |
| * | Previously filed. |
| ** | Filed herewith. |
| † | Management contract, compensatory plan or arrangement. |
| (B) | Financial Statement Schedules. |
All schedules are omitted because the required information is (i) not applicable, (ii) not present in amounts sufficient to require submission of the schedule or (iii) included in our financial statements and the accompanying notes included in the prospectus to this Registration Statement.
| Item 17. | Undertakings. |
The undersigned Registrant hereby undertakes to provide to the underwriters at the closing specified in the underwriting agreements, certificates in such denominations and registered in such names as required by the underwriters to permit prompt delivery to each purchaser.
II-5
Table of Contents
Index to Financial Statements
Insofar as indemnification by the Registrant for liabilities arising under the Securities Act may be permitted to directors, officers and controlling persons of the Registrant pursuant to the foregoing provisions, or otherwise, the Registrant has been advised that in the opinion of the Securities and Exchange Commission such indemnification is against public policy as expressed in the Securities Act and is, therefore, unenforceable. In the event that a claim for indemnification against such liabilities (other than the payment by the Registrant of expenses incurred or paid by a director, officer, or controlling person of the Registrant in the successful defense of any action, suit or proceeding) is asserted by such director, officer, or controlling person in connection with the securities being registered hereunder, the Registrant will, unless in the opinion of its counsel the matter has been settled by controlling precedent, submit to a court of appropriate jurisdiction the question whether such indemnification by it is against public policy as expressed in the Securities Act and will be governed by the final adjudication of such issue.
The Registrant hereby undertakes that:
(1) For purposes of determining any liability under the Securities Act, the information omitted from the form of prospectus filed as part of this Registration Statement in reliance upon Rule 430A and contained in a form of prospectus filed by the Registrant pursuant to Rule 424(b)(1) or (4) or 497(h) under the Securities Act shall be deemed to be part of this Registration Statement as of the time it was declared effective.
(2) For the purpose of determining any liability under the Securities Act, each post-effective amendment that contains a form of prospectus shall be deemed to be a new registration statement relating to the securities offered therein, and the offering of such securities at that time shall be deemed to be the initial bona fide offering thereof.
II-6
Table of Contents
Index to Financial Statements
SIGNATURES
Pursuant to the requirements of the Securities Act of 1933, the Registrant has duly caused this Registration Statement to be signed on its behalf by the undersigned, thereunto duly authorized, in the City of Oklahoma City, State of Oklahoma, on July 19, 2011.
| GREAT WHITE ENERGY SERVICES, INC. | ||
| By: | /S/ DAVID W. SPARKMAN | |
| David W. Sparkman | ||
| Chief Financial Officer and Executive Vice President | ||
Pursuant to the requirements of the Securities Act of 1933, this Registration Statement has been signed by the following persons in the capacities indicated on July 19, 2011.
| Signature |
Title | |
| /S/ JOHN JORDAN John Jordan |
Chief Executive Officer (Principal Executive Officer) | |
| /S/ DAVID W. SPARKMAN David W. Sparkman |
Chief Financial Officer and Vice President (Principal Financial and Accounting Officer) | |
| * Steven E. West |
Director | |
| *By: | /S/ DAVID W. SPARKMAN | |
| David W. Sparkman | ||
| Attorney-in-Fact | ||
Table of Contents
Index to Financial Statements
EXHIBIT INDEX
| Exhibit |
Number Description | |
| 1.1* |
Form of Underwriting Agreement. | |
| 2.1* |
Contribution Agreement by and among GWES Holdings LLC, Diamondback Holdings LLC and GW Holdings I LLC, dated as of December 31, 2010. | |
| 2.2* |
Form of Merger Agreement by and among GWES Holdings LLC, Diamondback Holdings, LLC, GW Holdings I LLC and Great White Energy Services, Inc. | |
| 3.1* |
Certificate of Incorporation of the Company. | |
| 3.2* |
Form of proposed Amended and Restated Certificate of Incorporation to be effective immediately upon the closing of the offering made pursuant to this registration statement. | |
| 3.3* |
Bylaws of the Company. | |
| 3.4* |
Form of proposed Bylaws to be effective immediately upon the closing of the offering made pursuant to this registration statement. | |
| 4.1* |
Specimen Certificate for shares of common stock, par value $0.01 per share, of the Company. | |
| 4.2* |
Form of Registration Rights Agreement by and among the Company, GWES Holdings LLC and Diamondback Holdings, LLC. | |
| 5.1* |
Opinion of Akin Gump Strauss Hauer & Feld LLP. | |
| 10.1* |
Master Service Contract between Diamondback Holdings, LLC and Windsor Energy Group, LLC, dated March 3, 2008. | |
| 10.2* |
Shared Services Agreement between Great White Energy Services LLC and Gulfport Energy Corporation, dated July 22, 2006. | |
| 10.3* |
Shared Services Agreement between Great White Energy Services LLC and Everest Operations Management LLC, dated March 1, 2007. | |
| 10.4* |
Shared Services Agreement between Great White Energy Services LLC and Everest Operations Management LLC, dated August 1, 2008. | |
| 10.5* |
Office Lease Agreement between Caliber Investment Group LLC and Great White Energy Services LLC, dated December 10, 2007. | |
| 10.6* |
Data Room Addendum to Office Lease Agreement between Caliber Investment Group LLC and Great White Energy Services LLC, dated December 10, 2007. | |
| 10.7* |
Amended and Restated Lease Agreement between Caliber Development Company LLC and Great White Pressure Control, LLC, dated November 11, 2008. | |
| 10.8* |
Lease Agreement between Caliber Development Company LLC and Great White Pressure Control, LLC, dated November 11, 2008. | |
| 10.9* |
Lease Amendment Agreement between Caliber Development Company LLC and Great White Pressure Control, LLC, dated May 10, 2007. | |
| 10.10* |
Lease Agreement between Caliber Texas Properties LP and Diamondback-Quantum LLC, dated March 1, 2007. | |
| 10.11* |
Amended and Restated Lease Agreement between Caliber Development Company LLC and Diamondback-Quantum LLC, dated January 1, 2009. | |
| 10.12* |
Amended and Restated Lease Agreement between Caliber Wyoming Properties LLC and Diamondback-Quantum LLC, dated January 1, 2009. | |
| 10.13*† |
Long Term Incentive Award Agreement between Great White Energy Services LLC and Phillip Lancaster, dated June 30, 2008. | |
| 10.14*† |
Employee Retention Agreement between Great White Energy Services LLC and Phillip Lancaster, dated August 16, 2010. | |
Table of Contents
Index to Financial Statements
| Exhibit |
Number Description | |
| 10.15*† |
Employment Agreement among Great White Energy Services LLC, GW Holdings I, LLC and David Sparkman, dated May 16, 2011. | |
| 10.16*† |
Employment Agreement between Great White Energy Services LLC and Steve Williams, dated April 1, 2010. | |
| 10.17*† |
Amended and Restated Employment Agreement between Great White Pressure Control LLC and Ronnie Roles, dated June 1, 2011. | |
| 10.18*† |
Employment Agreement between GW Holdings I, LLC and John Jordan, dated March 1, 2011. | |
| 10.19*† |
Assignment and Assumption of and Amended and Restated Employment Agreement among Great White Energy Services LLC, GW Holdings I, LLC and Randall Holder, dated May 16, 2011. | |
| 10.20*† |
Employment Agreement between Diamondback Holdings, LLC and Danny Ward, dated September 1, 2008. | |
| 10.21*† |
Assignment and Assumption of and First Amendment to Diamondback Employment Agreement, by and among Diamondback Holdings, LLC, Great White Directional Services LLC and Danny Ward, dated March 25, 2011. | |
| 10.22*† |
Form of 2011 Equity Incentive Plan. | |
| 10.23*† |
Form of Stock Option Agreement. | |
| 10.24*† |
Form of Restricted Stock Unit Agreement. | |
| 10.25*† |
Form of Director and Officer Indemnification Agreement. | |
| 10.26* |
Form of Master Services Agreement by and between Sandridge Energy Inc. and Great White Pressure Pumping LLC. | |
| 10.27* |
Form of Advisory Services Agreement by and between Great White Services, Inc. and Wexford Capital LP. | |
| 10.28* |
Credit Agreement by and among GW Holdings I, LLC, Great White Energy Services, Inc., Acid Inc., Diamondback-Directional Drilling LLC, Great White Directional Services LLC, Great White Pressure Control LLC, Great White Pressure Pumping LLC, the persons party thereto from time to time as guarantors, the financial institutions party thereto from time to time as lenders and SunTrust Bank, dated February 15, 2011. | |
| 10.29* |
Amended and Restated Employment Agreement between Great White Pressure Control LLC and Rocky Roles, dated June 1, 2011. | |
| 21.1* |
List of Significant Subsidiaries of the Company. | |
| 23.1** |
Consent of Grant Thornton LLP. | |
| 23.2* |
Consent of Akin Gump Strauss Hauer & Feld LLP (included in Exhibit 5.1). | |
| 24.1 |
Power of Attorney (included on signature page). | |
| 99.1* |
Consent of Arthur H. Amron to being named as a director nominee. | |
| 99.2* |
Consent of Charles E. Davidson to being named as a director nominee. | |
| 99.3* |
Consent of Douglas Lambert to being named as a director nominee. | |
| 99.4* |
Consent of Mike Liddell to being named as a director nominee. | |
| 99.5* |
Consent of Mark L. Plaumann to being named as a director nominee. | |
| 99.6* |
Consent of David L. Houston to being named as a director nominee. | |
| * | Previously filed. |
| ** | Filed herewith. |
| † | Management contract, compensatory plan or arrangement. |