Attached files
| file | filename |
|---|---|
| 8-K - TRI-VALLEY CORPORATION 8-K - TRI VALLEY CORP | a6796798.htm |
Exhibit 99.1
Tri-Valley CorporationJohn E. Durbin, Chief Financial OfficerNYSE Amex: TIVJuly 2011
Special Note Regarding Forward-Looking Statements All statements contained in this presentation that refer to future events or other non-historical matters are forward-looking statements. We have attempted to identify forward-looking statements by terminology including “anticipates,” “believes,” “can,” “continue,” “could,” “estimates,” “expects,” “intends,” “may,” “plans,” “potential,” or “predicts,” or the negative of these terms or other comparable terminology. Although we do not make forward-looking statements unless we believe we have a reasonable basis for doing so, we cannot guarantee their accuracy. These statements are only predictions based on management’s expectations as of the date of this presentation, and involve known and unknown risks, uncertainties and other factors, including: our ability to obtain additional funding; fluctuations in oil and natural gas prices; imprecise estimates of oil reserves; drilling hazards such as equipment failures, fires, explosions, blow-outs, and pipe failure; shortages or delays in the delivery of drilling rigs and other equipment; problems in delivery to market; adverse weather conditions; compliance with governmental and regulatory requirements; geographical concentration of oil and gas reserves in the State of California; changes in or inability to maintain strategic and joint venture partnerships; pending and threatened lawsuits against us; potential rescission rights stemming from our potential violation of Section 5 of the Securities Act of 1933; and such other risks and factors that are discussed in our filings with the Securities and Exchange Commission from time to time, including, but not limited to, under “Item 1A. Risk Factors” and “Item 7. Management’s Discussion and Analysis of Financial Condition and Results of Operations,” contained in the Company’s Annual Report on Form 10-K for the year ended December 31, 2010 and Form 10-Q for the quarter ended March 31, 2011. Except as required by law, we undertake no obligation to update or revise publicly any of the forward-looking statements after the date of this presentation to conform such statements to actual results or to reflect events or circumstances occurring after the date of this presentation.
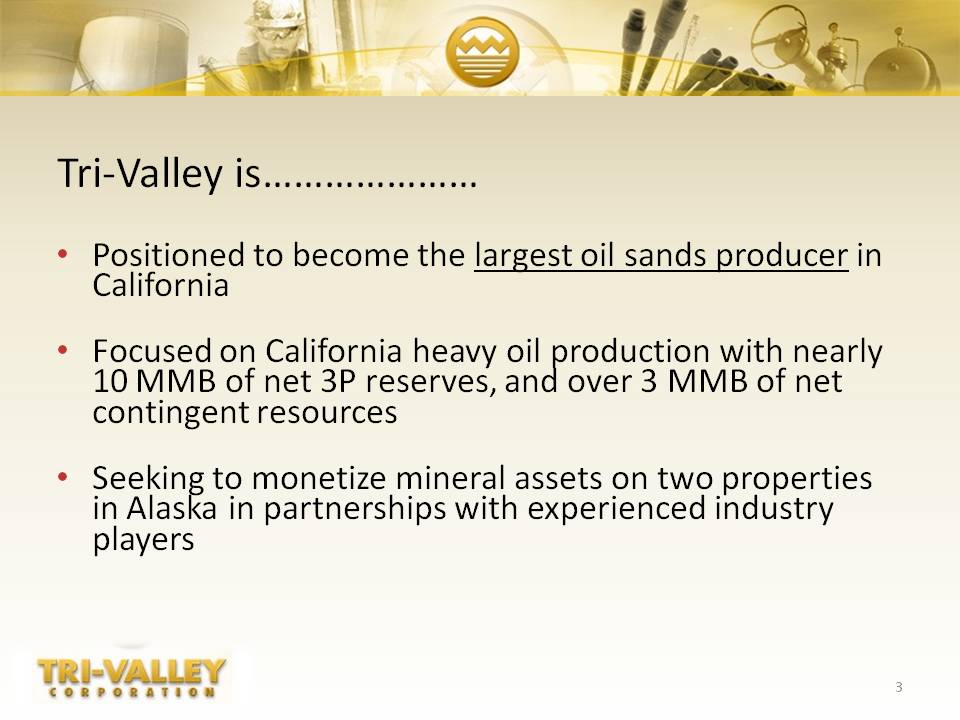
Tri-Valley is…………………Positioned to become the largest oil sands producer in California Focused on California heavy oil production with nearly 10 MMB of net 3P reserves, and over 3 MMB of net contingent resources Seeking to monetize mineral assets on two properties in Alaska in partnerships with experienced industry players
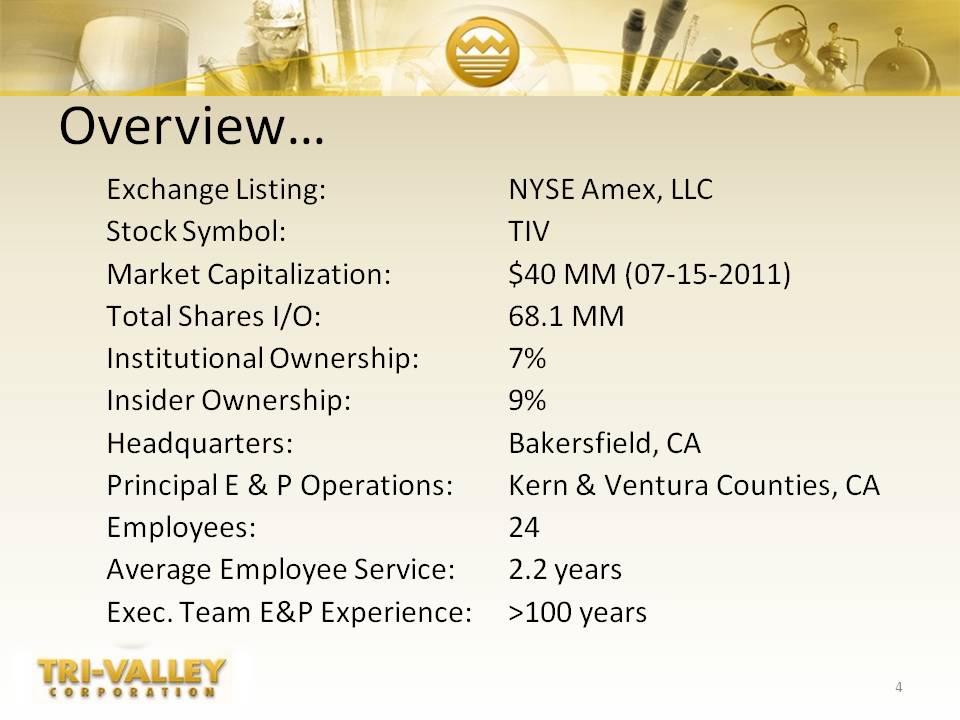
Overview… Exchange Listing: NYSE Amex, LLC Stock Symbol: TIV Market Capitalization: $40 MM (07-15-2011)Total Shares I/O: 68.1 MM Institutional Ownership: 7% Insider Ownership: 9% Headquarters: Bakersfield, CAPrincipal E & P Operations: Kern & Ventura Counties, CA Employees: 24 Average Employee Service: 2.2 years Exec. Team E&P Experience: >100 years
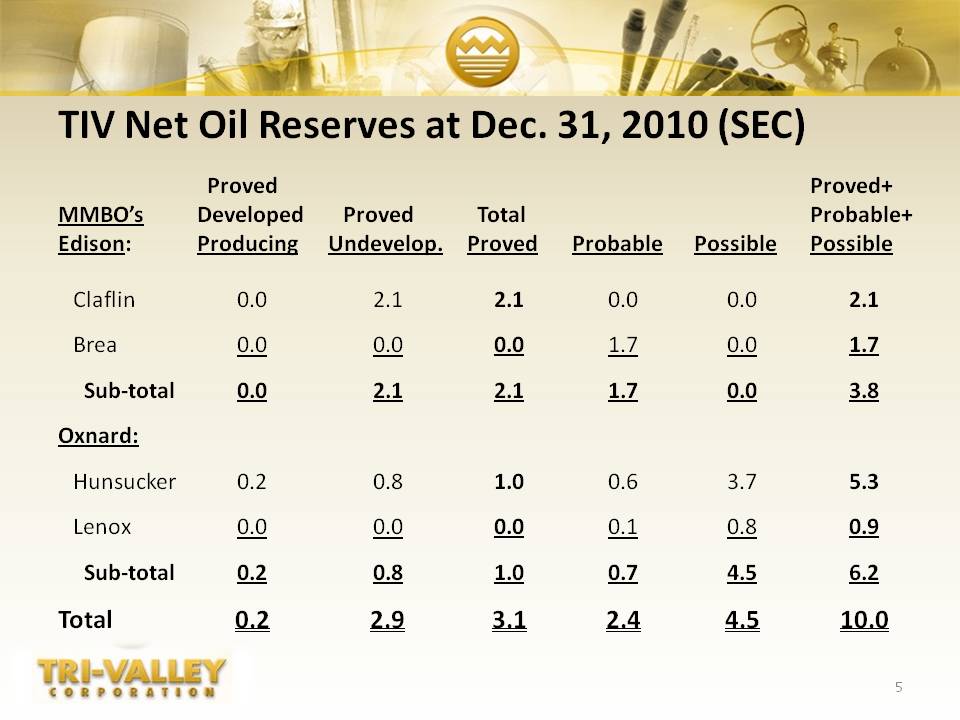
TIV Net Oil Reserves at Dec. 31, 2010 (SEC) Proved Proved+ MMBO’s Edison: Developed Producing Proved Undevelop. Total Proved Probable Possible Probable+ Possible Claflin 0.0 2.1 2.1 0.0 0.0 2.1 Brea 0.0 0.0 0.0 1.7 0.0 1.7 Sub‐total 0.0 2.1 2.1 1.7 0.0 3.8 Oxnard: Hunsucker 0.2 0.8 1.0 0.6 3.7 5.3 Lenox 0.0 0.0 0.0 0.1 0.8 0.9 Sub‐total 0.2 0.8 1.0 0.7 4.5 6.2 0 2 2 9 3 1 2 4 4 5 10 0 5 Total 0.2 2.9 3.1 2.4 4.5 10.0
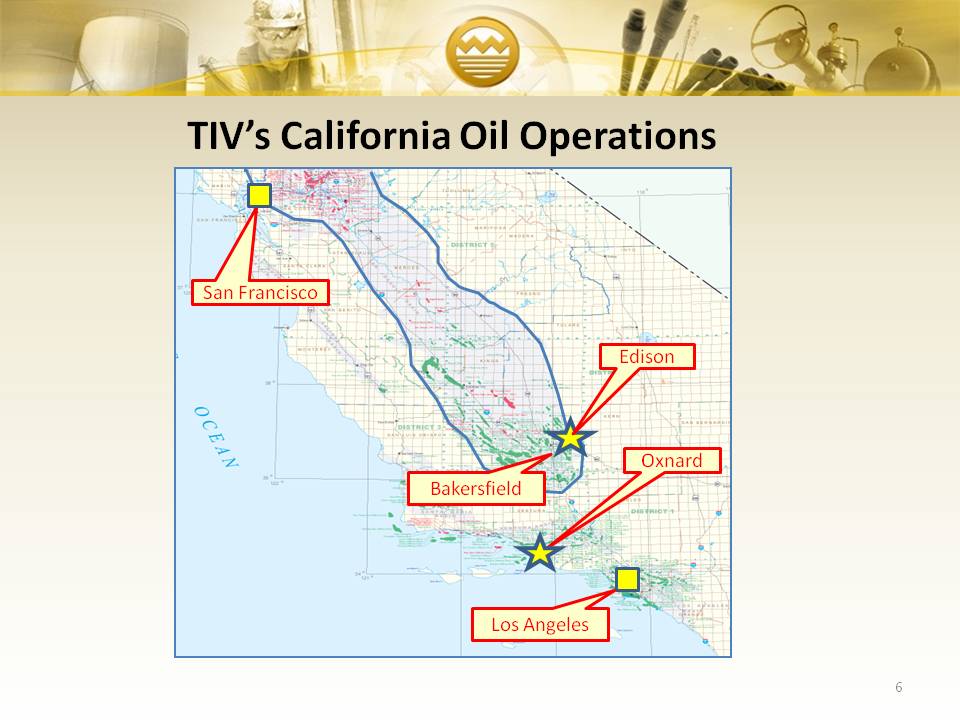
(Gp:) Edison TIV’s California Oil Operations Oxnard San Francisco Los Angeles Bakersfield
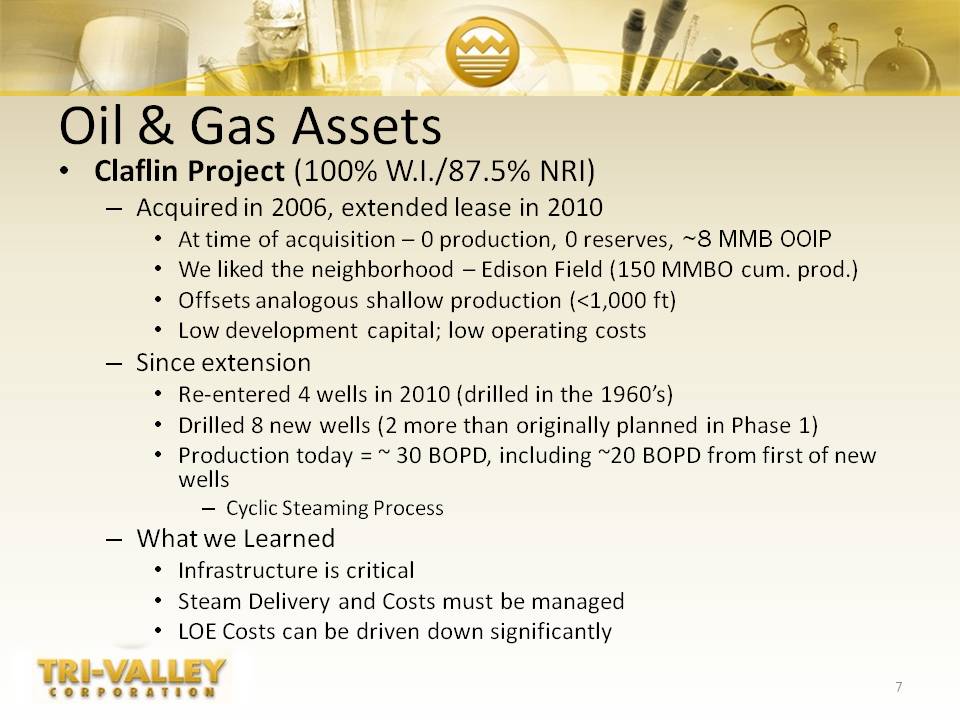
Oil & Gas Assets Claflin Project (100% W.I./87.5% NRI)Acquired in 2006, extended lease in 2010At time of acquisition – 0 production, 0 reserves, ~8 MMB OOIPWe liked the neighborhood – Edison Field (150 MMBO cum. prod.)Offsets analogous shallow production (<1,000 ft)Low development capital; low operating costsSince extensionRe-entered 4 wells in 2010 (drilled in the 1960’s) Drilled 8 new wells (2 more than originally planned in Phase 1) Production today = ~ 30 BOPD, including ~20 BOPD from first of new wells Cyclic Steaming ProcessWhat we LearnedInfrastructure is criticalSteam Delivery and Costs must be managedLOE Costs can be driven down significantly
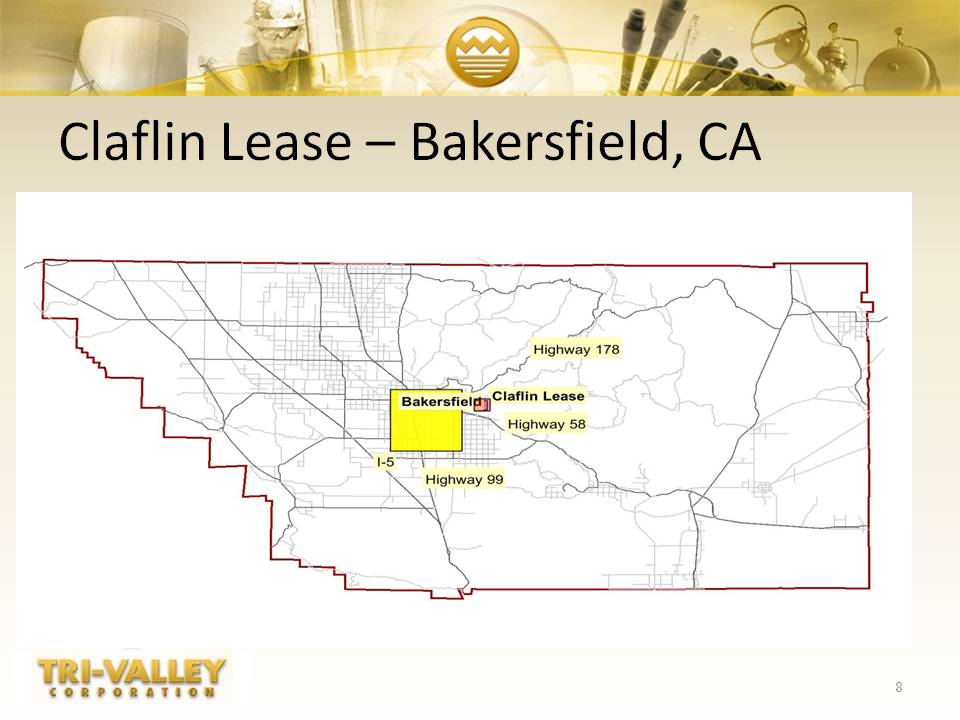
Claflin Lease – Bakersfield, CA
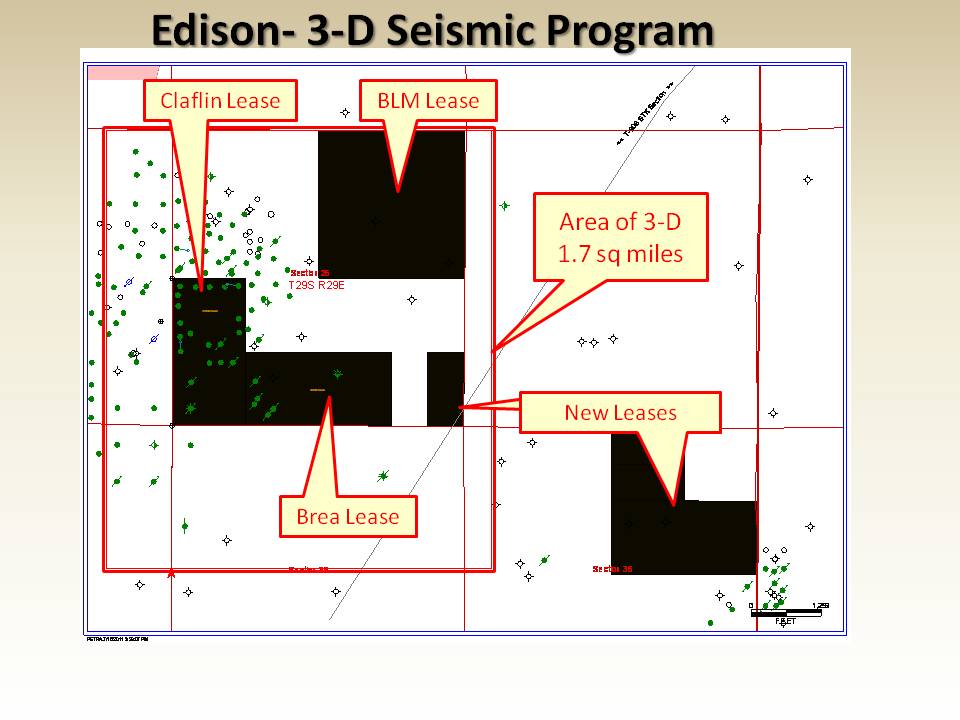
Edison- 3-D Seismic Program Area of 3-D 1.7 sq miles Claflin Lease BLM Lease Brea Lease New Leases New Leases
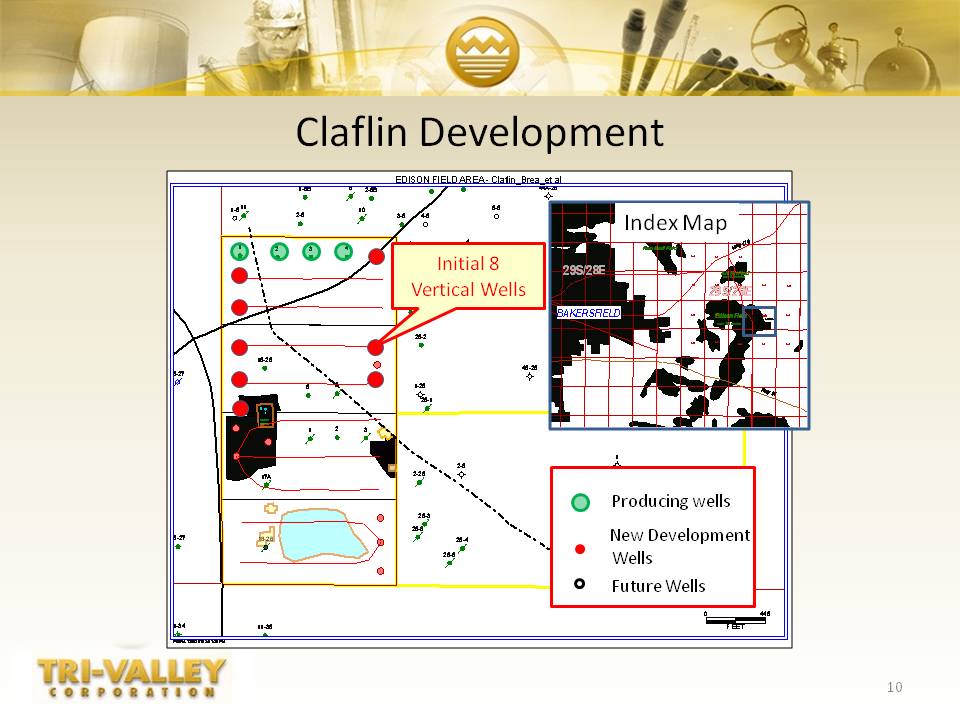
Claflin Development Initial 8 Vertical Wells Index Map (Gp:) Producing wells (Gp:) New Development Wells (Gp:) Future Wells
Claflin Initiatives Phase 1 complete, 8 new wells drilled of planned 22Production from first new well commenced in June, remaining new wells should be producing oil by end of August 3-D seismic program permits almost complete; seismic acquisition could start by end of JulyPhase 2 should commence in September9 horizontal and 5 vertical wells; upgrades to facilitiesProduction should increase to ~800 BOPD by year endShould allow TIV to reach profitability by yearendTIV will develop the adjoining Brea lease in 2012Recently acquired 5 new leases nearby which increase TIV’s ownership to 450 net acres in the Edison Field area.
Oil & Gas Assets Pleasant Valley Project – Upper Vaca Tar (Oil Sands) Acquired three leases in 2005 (TIV 25%/OPUS 75%)At time of acquisition – 0 production, 0 reserves, 128 MMB OOIPKnown oilfield with enhanced recovery potentialWas evaluated in 2000 for SAGD by Dr. Roger Butler (SAGD inventor)50% or greater recovery of OOIP may be possible with SAGDSince Acquisition:Drilled 8 new horizontal wells (first operator to do so)Production today = ~ 300 BOPD (gross)Cyclic Steam Production Process being optimizedSAGD pilot planned in second half 2011 What we’ve learned:Upper Vaca Tar is similar to the Canadian Oil Sands We need to approach it in similar fashionSAGD Development could be keyLeverage Canadian SAGD experienceTIV and OPUS must work together to attract development capital
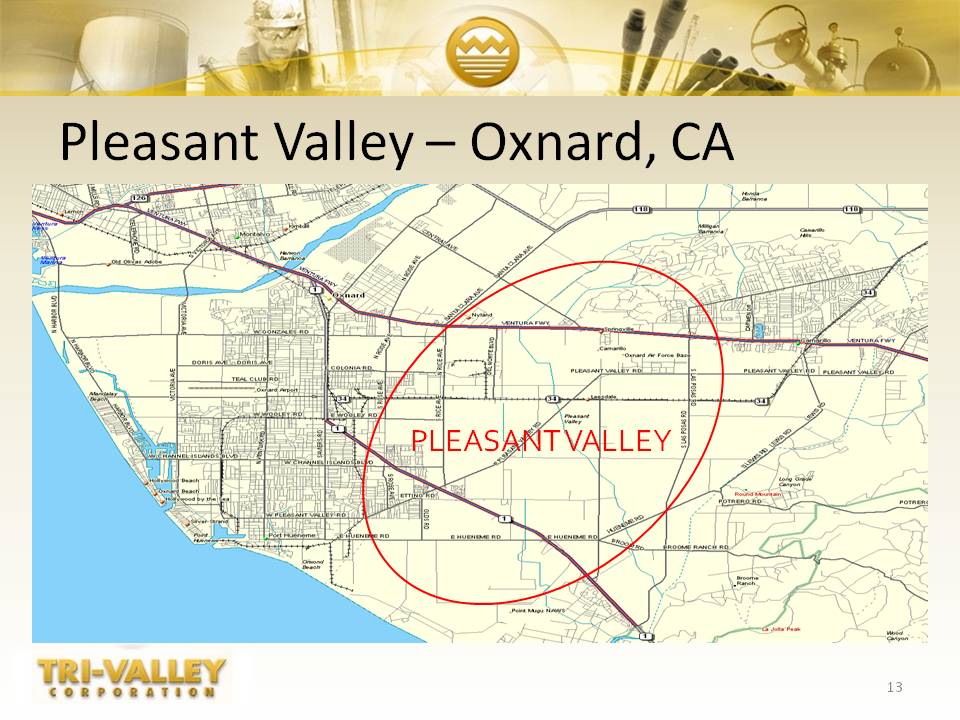
Pleasant Valley – Oxnard, CA PLEASANT VALLEY
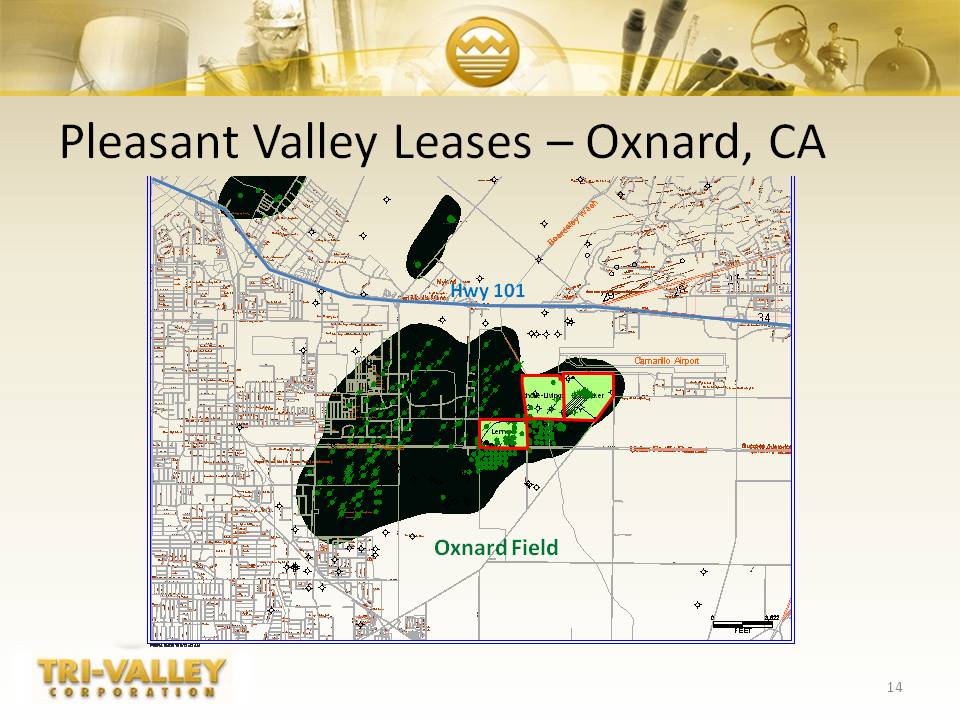
Pleasant Valley Leases – Oxnard, CA Oxnard Field Hwy 101
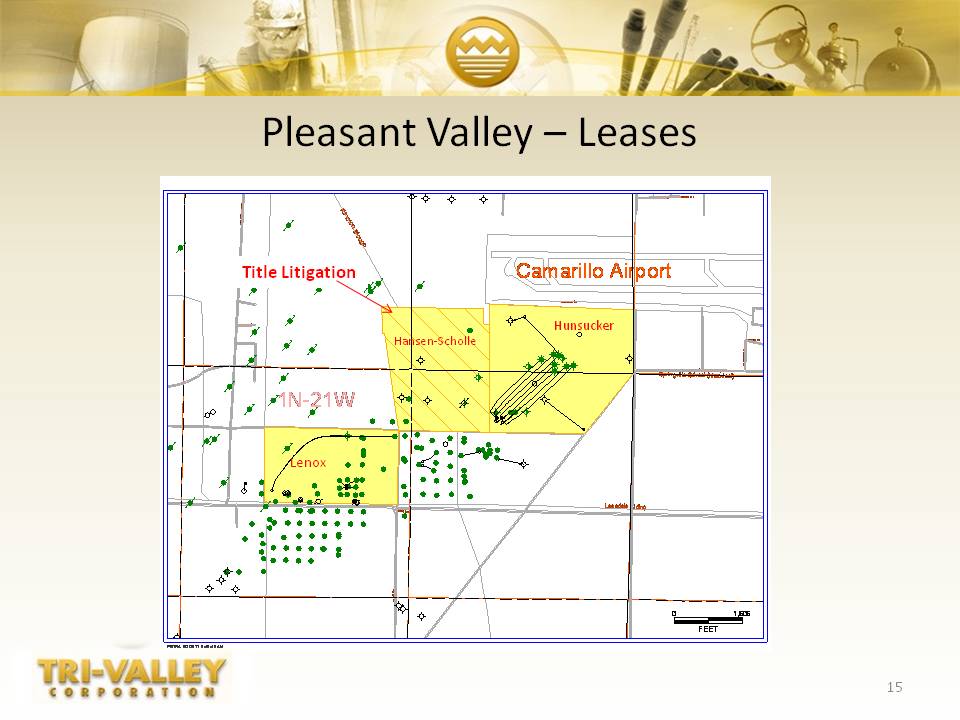
Pleasant Valley – Leases Lenox Hunsucker Title Litigation Hansen-Scholle
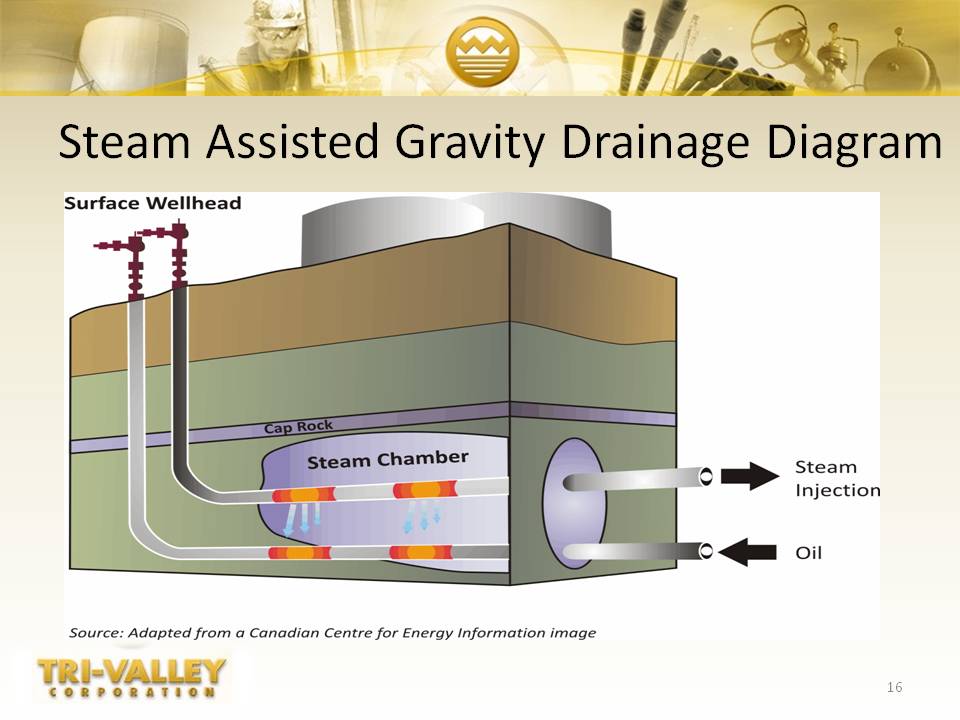
Steam Assisted Gravity Drainage Diagram
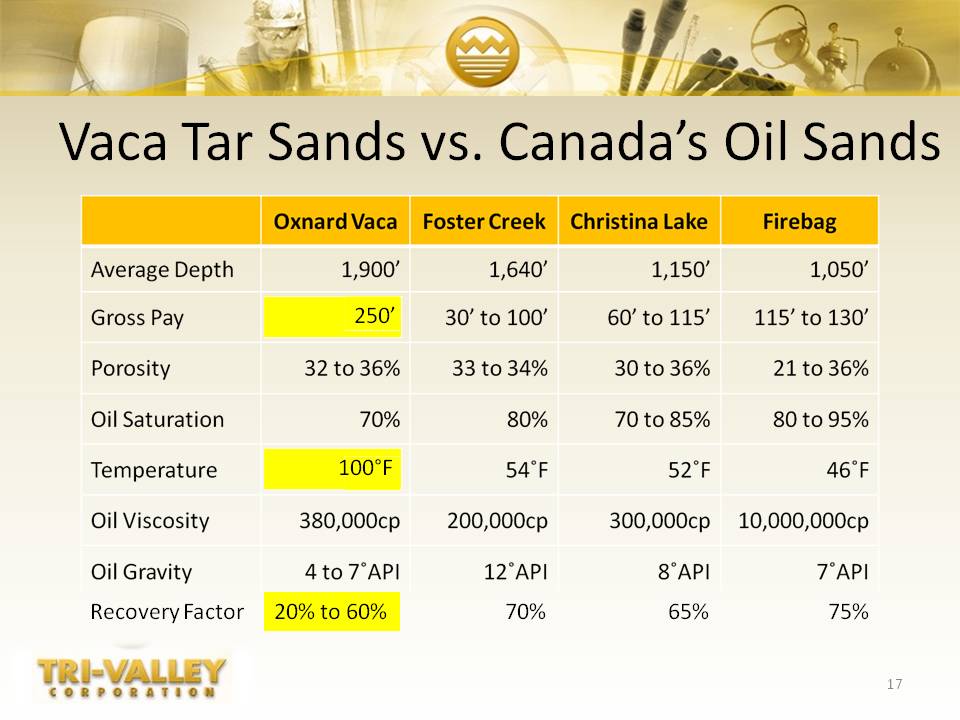
Vaca Tar Sands vs. Canada’s Oil Sands Recovery Factor 75% 65% 70% 20% to 60% 250’ 100°F
Other Assets
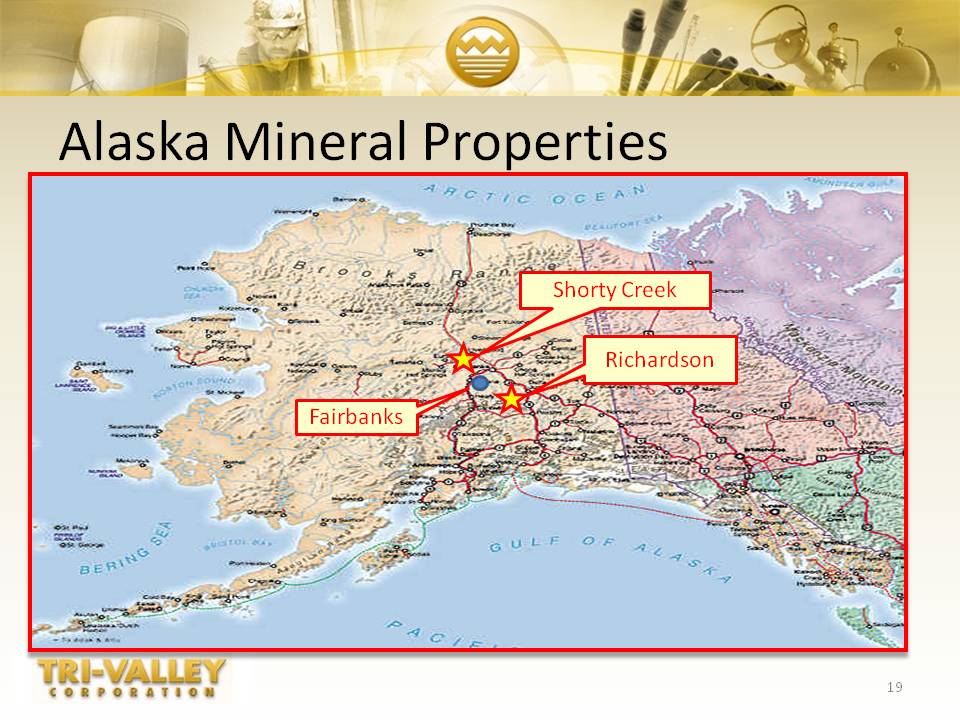
Alaska Mineral Properties Fairbanks Richardson Shorty Creek
Richardson Have identified six anomalies with surface geochem sampling, limited core drilling, and some previous miningAll of the anomalies are associated with the Intrusion Related Gold Deposit ModelSigned 4-year Exploration Lease and Purchase Option Definitive Agreement with US Gold Corporation (NYSE: UXG) to explore & develop the property on July 1US Gold has option to purchase 60% upon completion of $5 million in exploration expendituresEstimated $200,000 reduction in annual burden costs for TIVUS Gold commenced field work on July 5Drilling and other exploration work on identified anomalies may require an additional $5-10 MM investment
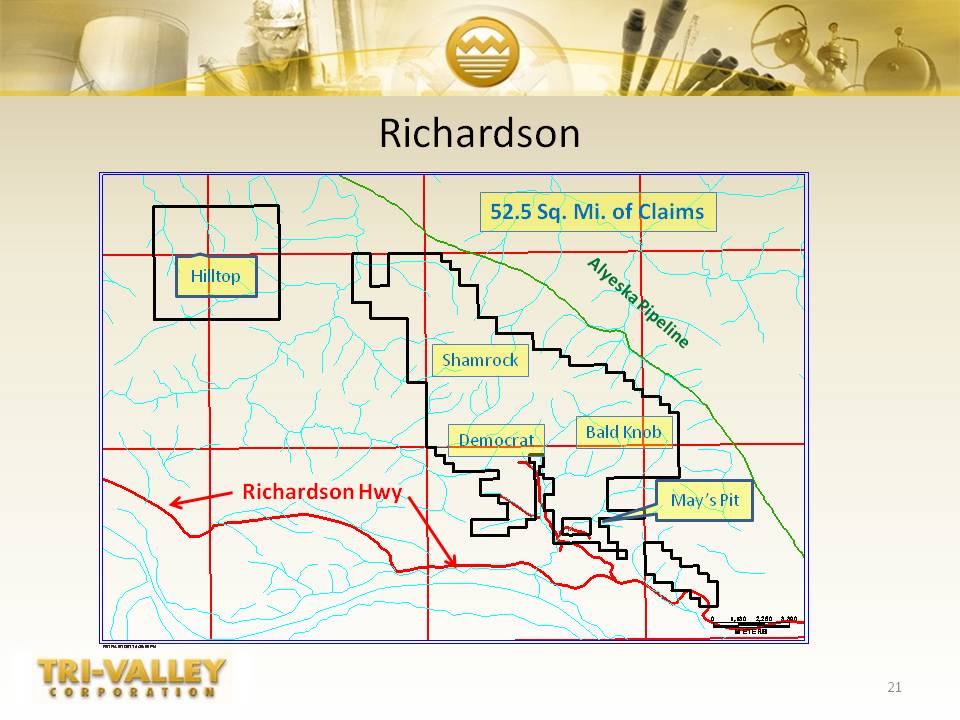
Richardson Richardson Hwy 52.5 Sq. Mi. of Claims Shamrock Bald Knob Democrat Alyeska Pipeline Hilltop May’s Pit
Shorty Creek Shorty Creek is a potential world-class porphyry depositContiguous to ITH’s Livengood property containing 13.3 Million oz of gold resource (indicated and inferred) at 0.5 grams/ton cut-off (heap leach quality)Six anomalies have been identified for further exploration work in the 2010 NI 43-101 Report evaluation, which indicates a large porphyry copper, gold, and molybdenum system up to eight miles in diameterIdeal joint venture opportunity for a major or mid-tier gold or copper producer to earn a majority interestMay ultimately require $10-15 million in new exploration investment
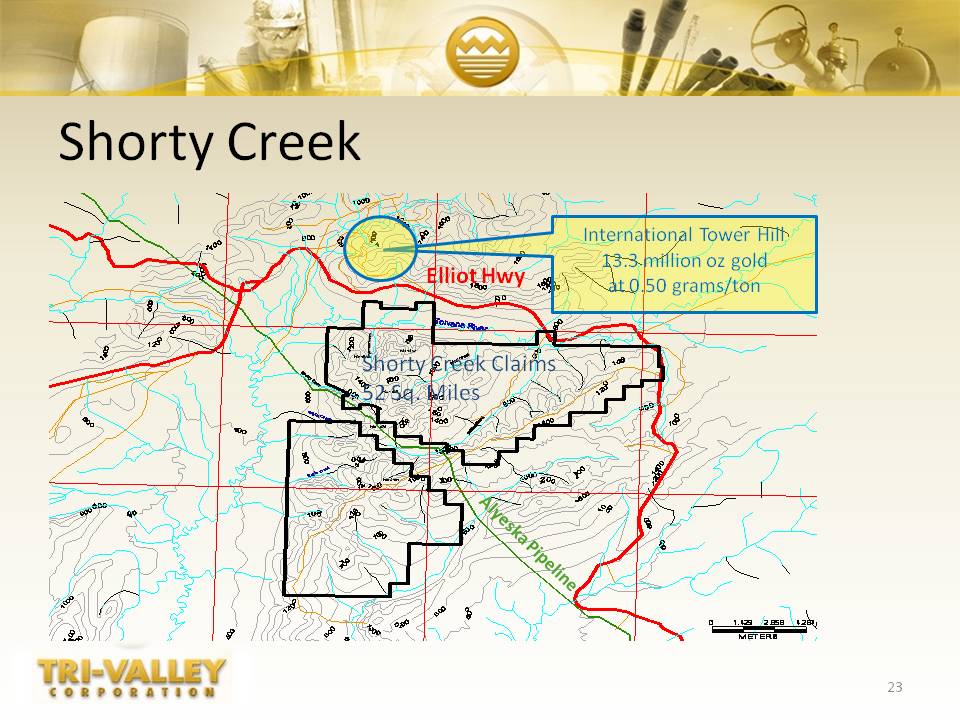
Shorty Creek Shorty Creek Claims52 Sq. Miles International Tower Hill13.3 million oz goldat 0.50 grams/ton Alyeska Pipeline Elliot Hwy
Experienced Management Team Maston Cunningham – President and CEOJoined TIV in 2009; became CEO in March 201022 years with Occidental Petroleum, includes 15 years abroad President & GM of Oxy’s subsidiary in EcuadorJohn Durbin – CFO30-year career in senior financial positions with Conoco and DuPontExtensive international experienceMichael Stark – VP of Exploration12 years with Ivanhoe Energy; most recently as VP of Exploration and Land 20 years with Occidental Petroleum, includes 9 years abroadLed successful exploration campaigns that discovered >500 MMBO
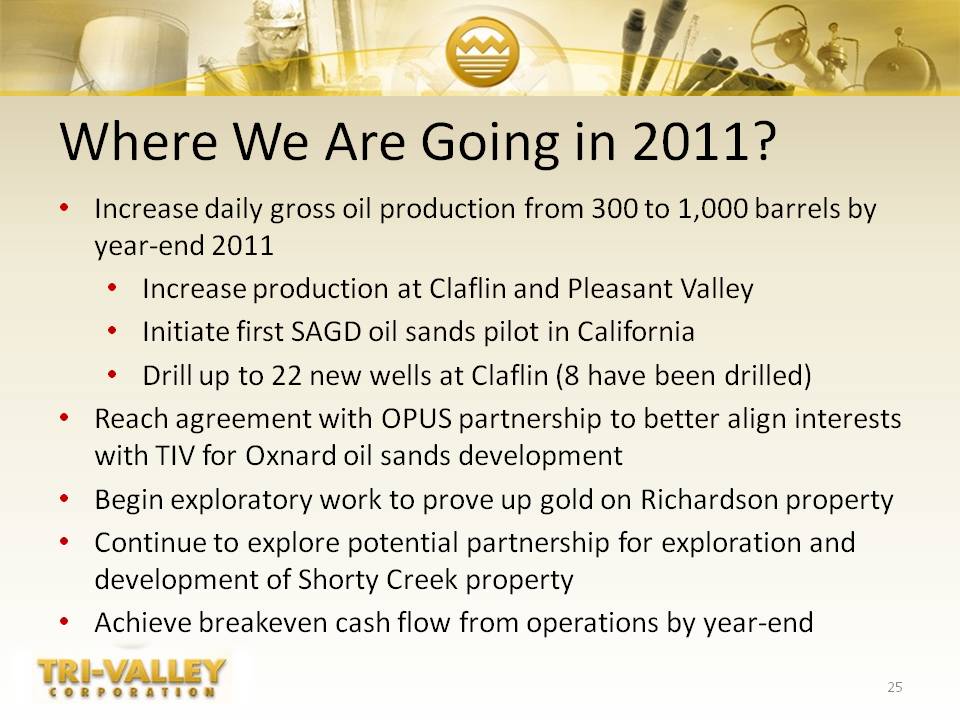
Where We Are Going in 2011? Increase daily gross oil production from 300 to 1,000 barrels by year-end 2011Increase production at Claflin and Pleasant ValleyInitiate first SAGD oil sands pilot in CaliforniaDrill up to 22 new wells at Claflin (8 have been drilled)Reach agreement with OPUS partnership to better align interests with TIV for Oxnard oil sands developmentBegin exploratory work to prove up gold on Richardson propertyContinue to explore potential partnership for exploration and development of Shorty Creek propertyAchieve breakeven cash flow from operations by year-end
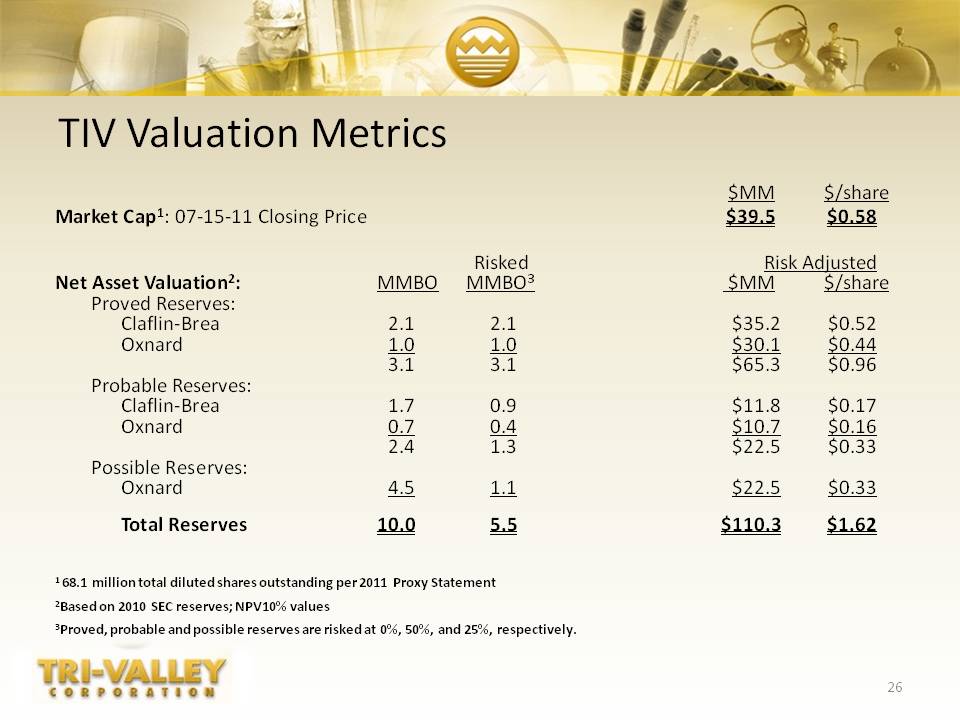
TIV Valuation Metrics $MM $/shareMarket Cap1: 07-15-11 Closing Price $39.5 $0.58 Risked Risk AdjustedNet Asset Valuation2: MMBO MMBO3 $MM $/share Proved Reserves: Claflin-Brea 2.1 2.1 $35.2 $0.52 Oxnard 1.0 1.0 $30.1 $0.44 3.1 3.1 $65.3 $0.96 Probable Reserves: Claflin-Brea 1.7 0.9 $11.8 $0.17 Oxnard 0.7 0.4 $10.7 $0.16 2.4 1.3 $22.5 $0.33 Possible Reserves: Oxnard 4.5 1.1 $22.5 $0.33 Total Reserves 10.0 5.5 $110.3 $1.621 68.1 million total diluted shares outstanding per 2011 Proxy Statement 2Based on 2010 SEC reserves; NPV10% values 3Proved, probable and possible reserves are risked at 0%, 50%, and 25%, respectively.