Attached files
| file | filename |
|---|---|
| 8-K - FORM 8-K - OMEGA PROTEIN CORP | d8k.htm |
 Investor Presentation
NEWS
EXHIBIT 99.1 |
 The
information presented herein may contain projections, predictions, estimates and other forward-
looking statements within the meaning of Section 27A of the Securities Act of 1933
and Section 21E of the
Securities
Exchange
Act
of
1934.
Forward-looking
statements
will
use
words
like
“may,”
“may
not,”
“believes,”
“do
not
believe,”
“expects,”
“do
not
expect,”
“anticipate,”
“does
not
anticipate,”
and
other
similar
expressions.
Although
the
Company
believes
that
its
expectations
are
based
on
reasonable
assumptions, we can give no assurance that these expectations will be realized.
Important factors that could cause actual results to differ materially from
those included in these forward looking statements include: (1) our ability
to meet our raw material requirements through our annual menhaden harvest,
which is subject to fluctuations due to natural conditions over which we have no
control, such as varying fish population, fish oil yields, adverse weather
conditions, oil spill impacts and disease; (2) the impact of laws and
regulations that may be enacted that may restrict our operations or the sale of products; (3) the
impact
of
worldwide
supply
and
demand
relationships
on
prices
for
our
products;
(4)
our
expectations
regarding demand and pricing for our products proving to be incorrect; (5)
fluctuations in the Company’s quarterly operating results due to the
seasonality of our business and our deferral of inventory sales based
on
worldwide
prices
for
competing
products;
(6)
the
effect
of
the
Deepwater
Horizon
oil
spill
on
our
business, operations and fish catch; and (7)
the business, operations, potential or prospects for our new
Cyvex subsidiary, the dietary supplement market or the human health and wellness
segment generally. Forward Looking Statements
2 |
 Agenda
3
Omega Protein: Pure Play on the Growth of High Quality
Protein Ingredients and Omega-3 fatty Acids
Favorable Supply Demand Outlook
Overview of What We Do
How We Plan to Grow
Review of our Business Divisions
Competitive Advantages
Our Financial Performance |
 Omega
Protein Corporation (NYSE: OME) Pure play on high quality protein
ingredients and omega-3 fatty acids
Benefitting from increasing demand for
nutritional ingredients and limited supply
of fish meal and fish oil
Significant barriers to entry
Strong 2010 financial performance
$168M revenue
$18M net income
Strong balance sheet
4 |
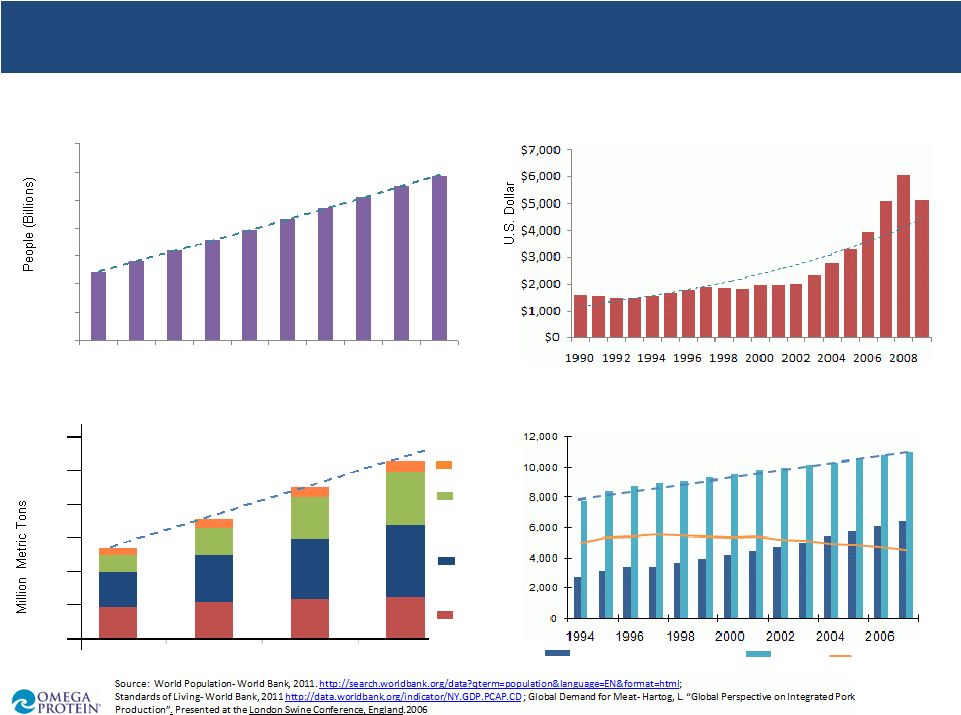 5
Global Demand for Meat
World Population
Standards of Living
Developing Countries* GDP per Capita (PPP)
5.60
5.80
6.00
6.20
6.40
6.60
6.80
7.00
2000
2001
2002
2003
2004
2005
2006
2007
2008
2009
* As defined by the World Bank-
2010-2011
300
250
200
150
100
50
0
+37%
+27%
+17%
1980
1990
2000
2010
Beef
Pork
Poultry
Other
Global Demand for Seafood
Growing Demand for Protein Around the World
Global Aquaculture Consumption
Total
Wild Catch |
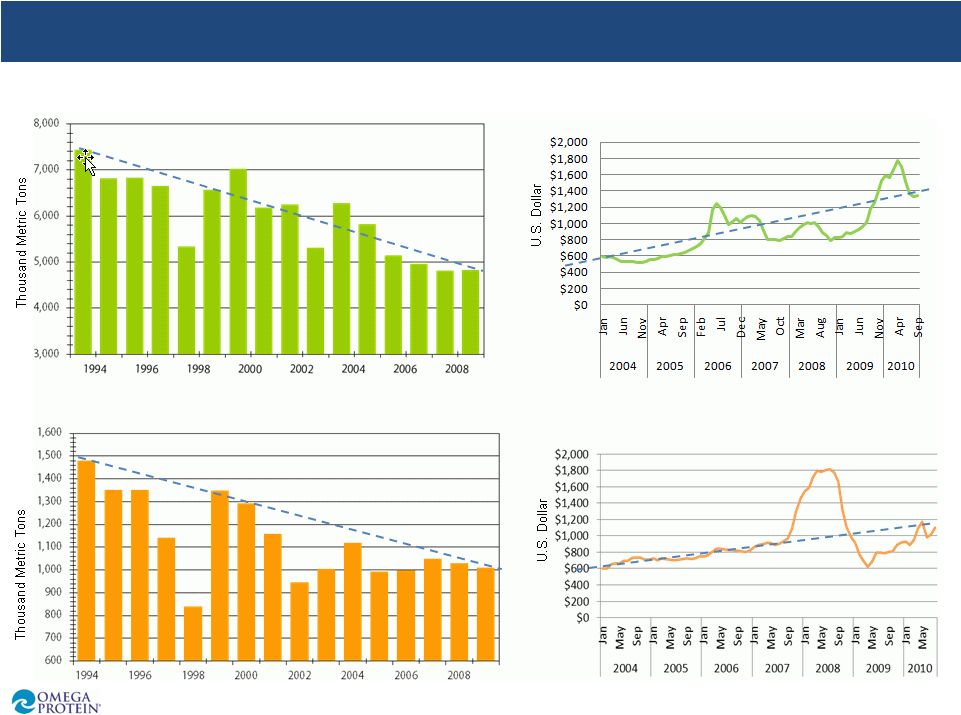 6
World Supply/Demand Imbalance
Source: IFFO, 2010
Global Fish Meal Production
Global Fish Oil Production
Average Fish Meal Prices (FOB from Peru)
Average Fish Oil Prices (FOB from Netherlands) |
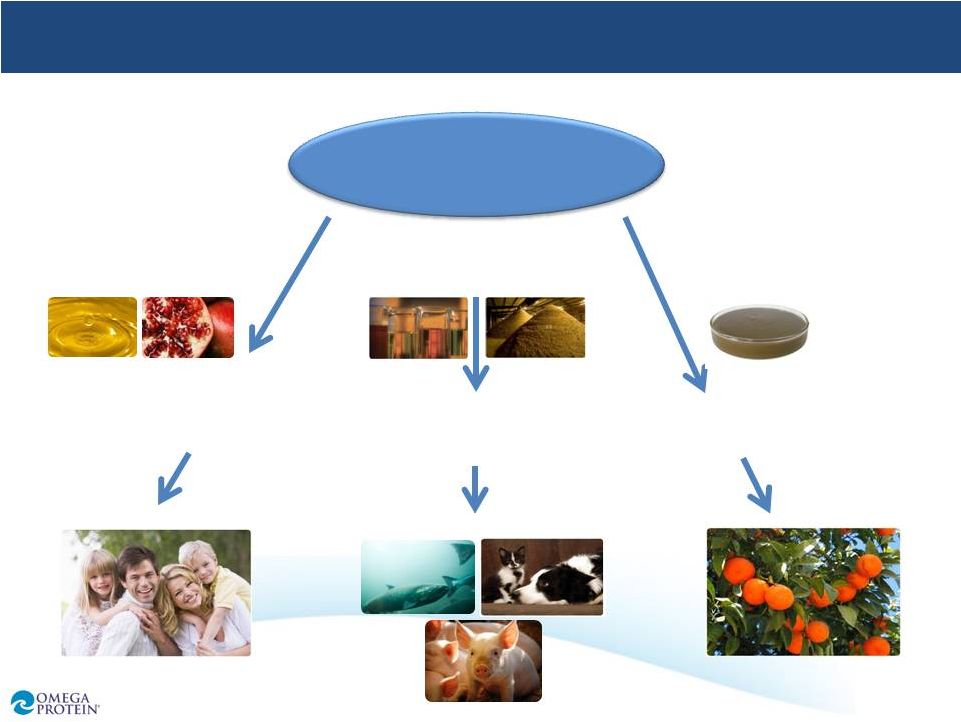 7
Omega Protein
Corporation
Human Nutrition
Ingredients
Animal Nutrition
Ingredients
Plant Nutrition
Ingredients
Nutraceuticals
Functional Foods
Aquaculture Feed
Pet Food
Livestock Feed
Organic
Fruits and Vegetables
Our Business Fuels Healthy Living |
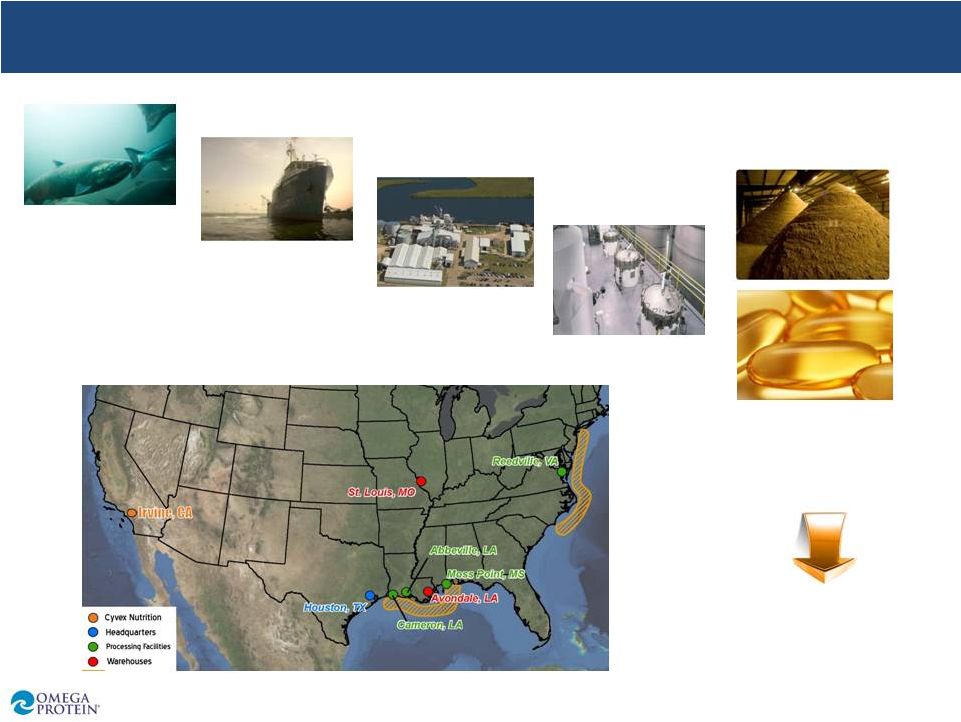 Vertically Integrated: From Catch to Market
A sustainable
fishery
49 vessels and
34 spotter planes
4 meal and oil
processing plants
Fish oil refinery
Sales and distribution
network into top
manufacturers
8
Vertically
Vertically
Integrated
Integrated
8 |
 9
Focus on research and development
enhance production
improve health benefits of end
products
develop novel new products
Leverage customer relationships
Allocate funds based on return on capital
Expand participation in the value chain
Additional product lines
Increase presence in human nutrition
Access opportunities in new markets
Add new customers in existing markets
Organic Growth
Organic Growth
Acquisitions
Acquisitions
How We Plan to Grow
Leverage existing protein and fatty acid platform to
expand line of nutritional ingredients
Leverage existing protein and fatty acid platform to
expand line of nutritional ingredients |
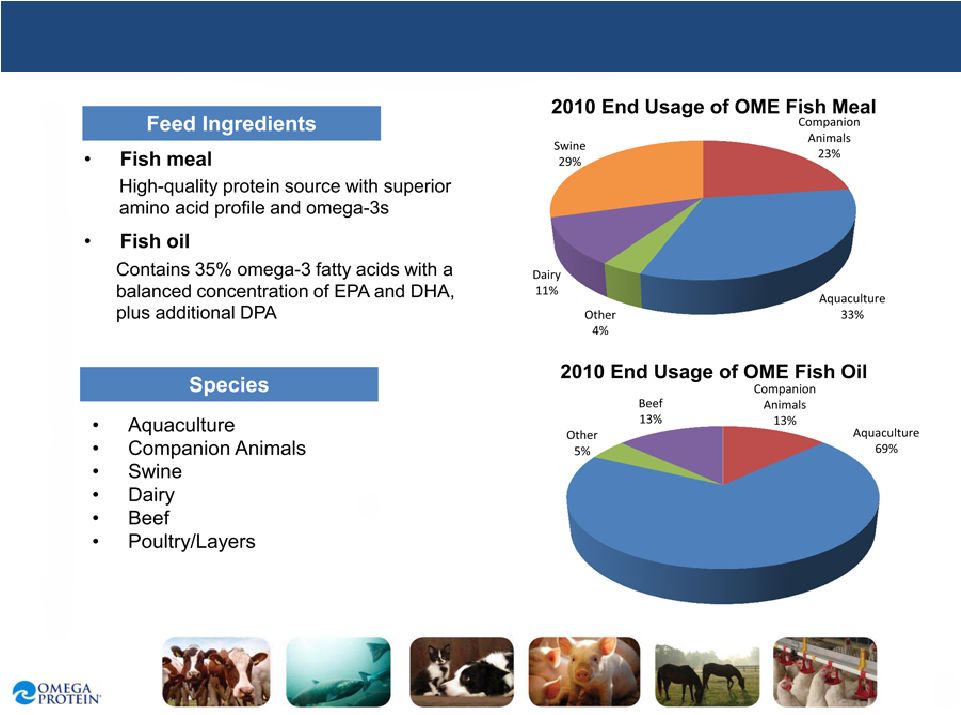 Animal Nutrition: Our Core Business
10 |
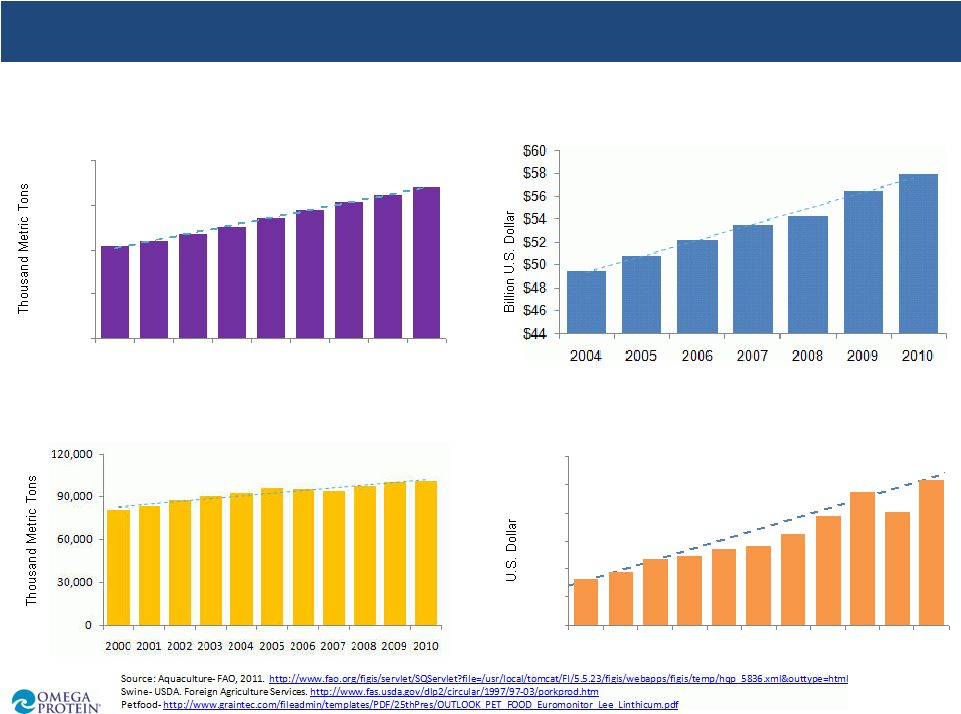 11
Animal Nutrition: Market is Growing
Global Swine Production by Volume
Global Aquaculture Production by Volume
Global Pet food Market by Retail Sales
OME Revenue per Ton (U.S. Dollar)
$325
$374
$465
$489
$539
$563
$654
$784
$947
$806
$1,036
$0
$200
$400
$600
$800
$1,000
$1,200
2000
2001
2002
2003
2004
2005
2006
2007
2008
2009
2010
0
20,000
40,000
60,000
80,000
2000
2001
2002
2003
2004
2005
2006
2007
2008 |
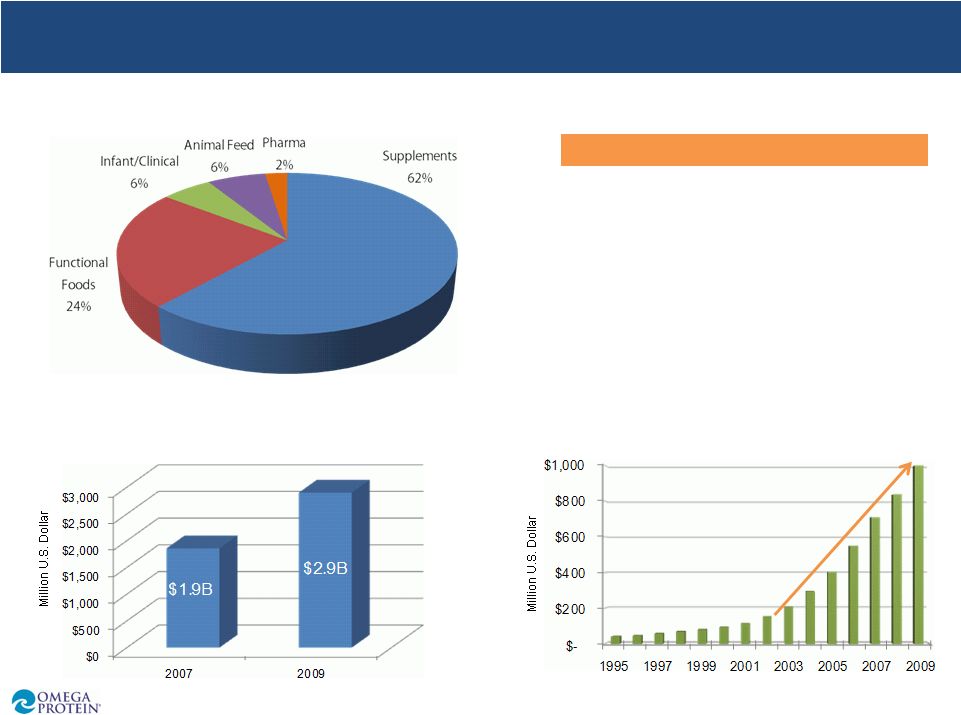
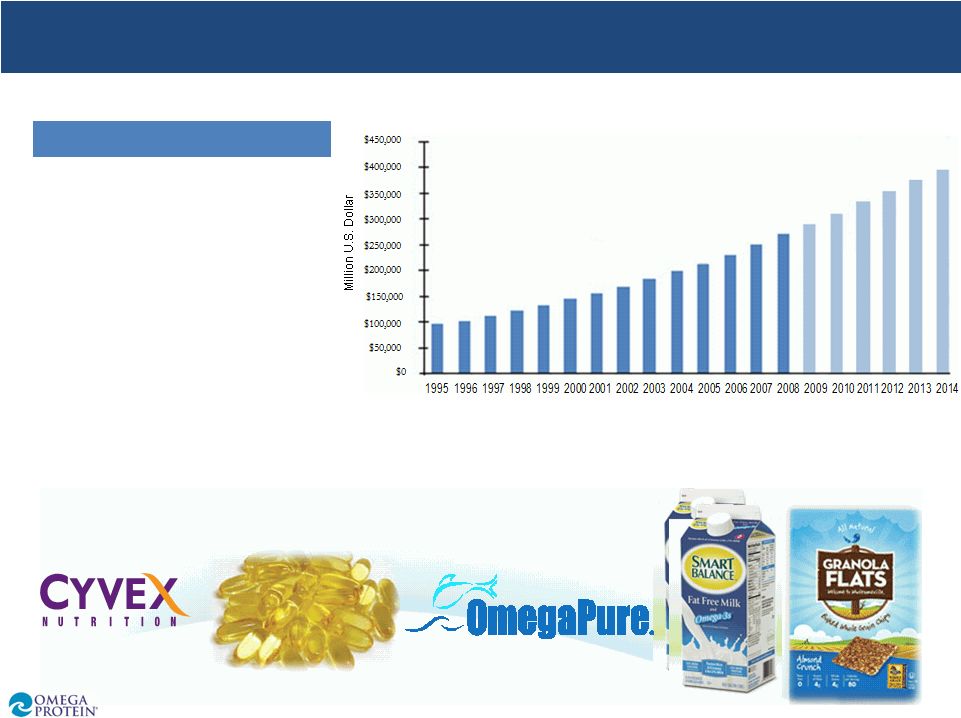 Nutraceutical Ingredients
Global Nutrition Industry
•
Diverse product set of
nutritional ingredients
•
Supply the dietary
supplement
and functional
food
markets
•
Supports good health and
well-being
•
Sales today represent a
fraction of the market
Source:
“Global
Nutrition
Industry.”
Nutrition Business Journal. March, 2010.
*2009-2014 are projections
12
Human Nutrition: Greatest Growth Potential |
 13
Source:
“Global
Omega-3
Industry
Report.”
Frost
&
Sullivan.
September
2009.;
“Top
5
Supplements”.
Consumer
Lab.com.
Survey,
2011
Animal
Feed
5,243
End Use Applications of EPA and DHA Oils (Metric Tons)
Global Omega-3 Dietary Supplement Sales
U.S. Omega-3 Dietary Supplement Sales
Fish Oil Usage Surpasses Multi-Vitamin
1.
Fish Oil
2.
Multi-Vitamin
3.
Vitamin D
4.
Calcium
5.
Q-10 (cOq10)
Top 5 Supplements (Consumption Order)
Human Nutrition: Booming Supplement Market |
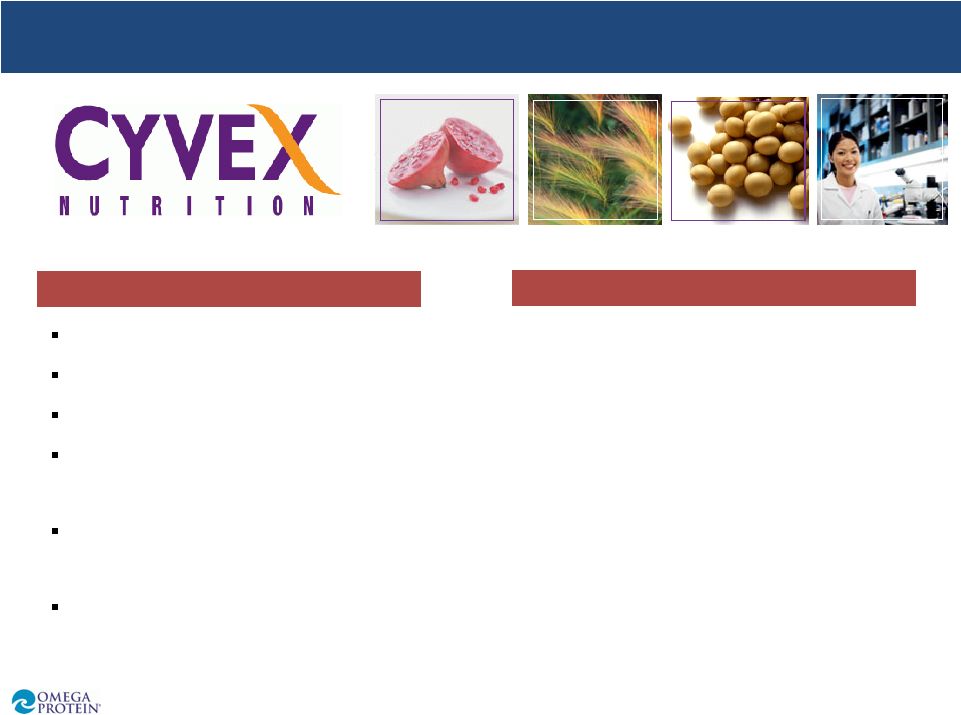 Founded in 1984
Located in Irvine, California
Selling focus: health and well-being
Strong customer relationships in the
dietary supplements industry
Focused on high-value, higher margin
products
2010 sales ~ $12M
14
Human Nutrition: Acquisitive Growth
Background
Transaction Rationale
•
Increase offering to the in human nutrition
industry
•
Provides access to the top dietary
supplement manufacturers
•
Adds established distribution network for
omega-3 fatty acids (fish oil)
•
Adds line of non-marine products
•
Supports shifting customer demand
•
B2B ingredient supplier |
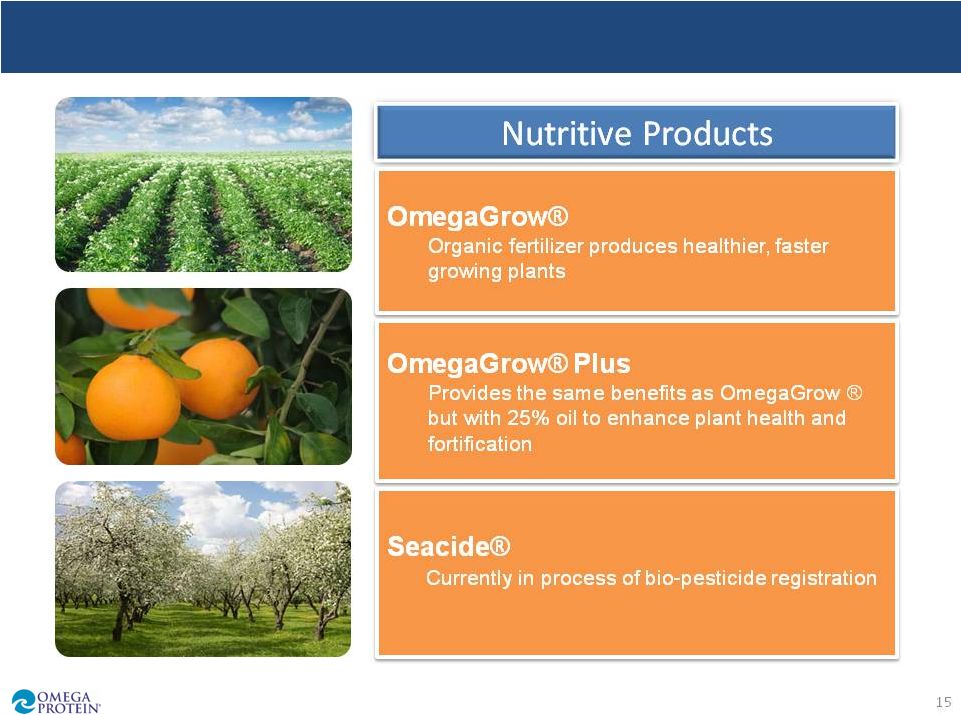 Plant Nutrition: Niche Opportunity
15
Source: Omega Protein |
 16
Comprehensive In-House Research and Development Effort
OmegaPure Technology and Innovation Center completed in 2008
-
Analytical Laboratory
-
Pilot Plant from Oil Refinery
-
AOCS/GOED certified for the analysis of marine oils
-
Beverage and Emulsions Laboratory
-
Commercial Kitchen and Bakery Laboratory
Supports Process Innovation
Enhances Menhaden Utilization
Provides for Novel Product Development
Benefits from Partnerships and Contracts with Universities
R&D Initiatives Support Growth |
 Global Distribution Network
17
Source: Omega Protein
Optimize International Sales
Maximize Pricing
Enhance Margins |
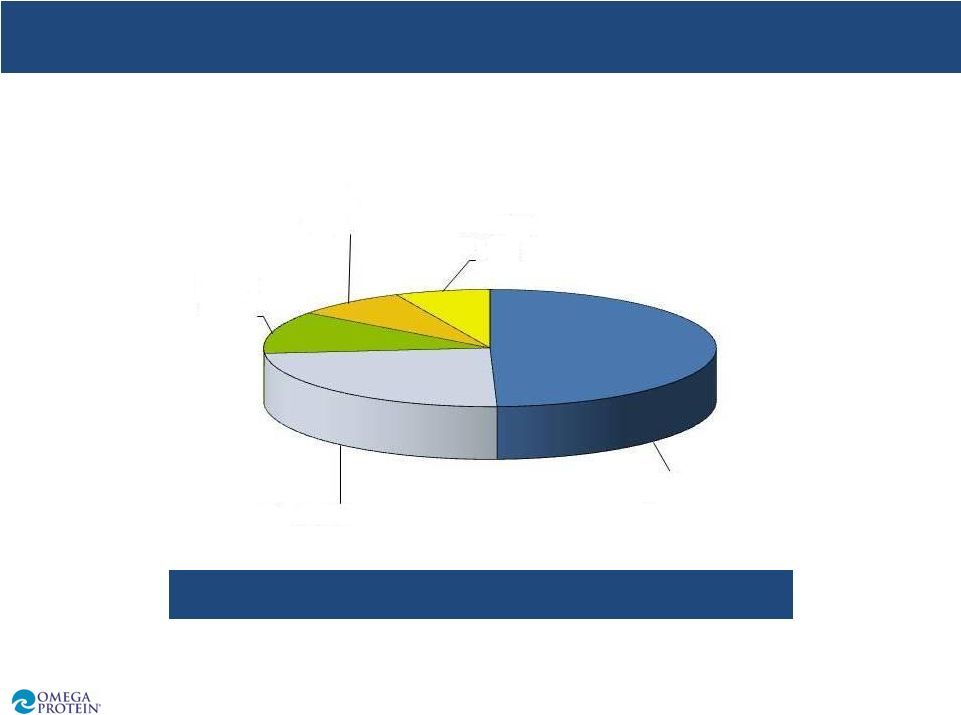 18
2010 exports represent over 50% of sales
2010 Sales Breakdown by Geography
Canada
8.0%
Latin
America
6.8%
US
49.5%
Asia 24.0%
Europe
11.7% |
 19
Blue Chip Customers |
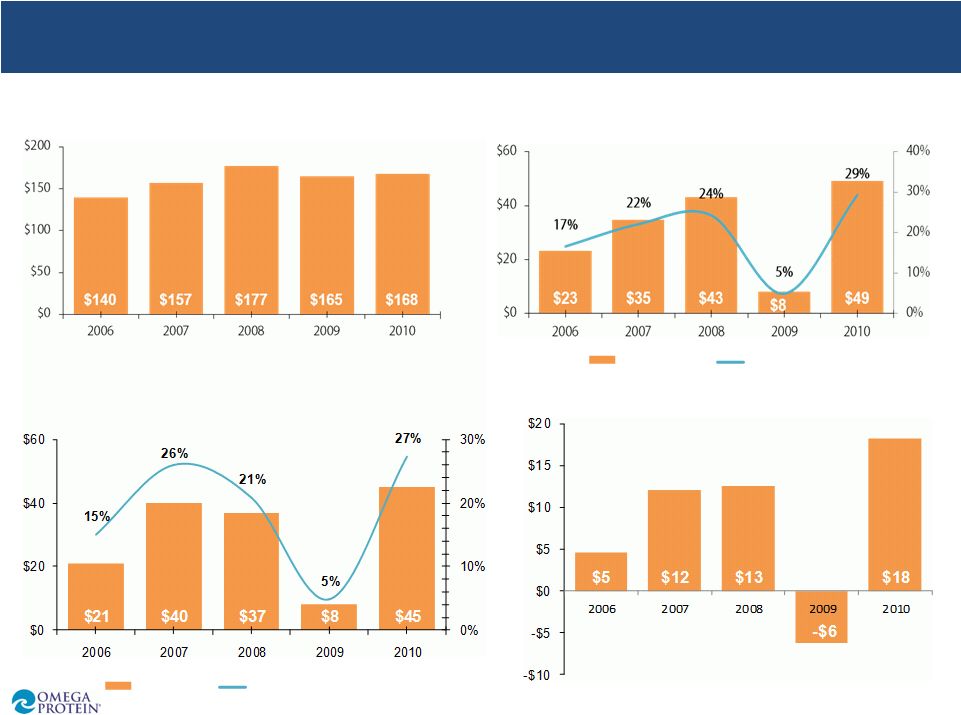 Financial Performance
Gross
Margin
2006-2010
(Million
U.S.
Dollar)
Revenue
2006-2010
(Million
U.S.
Dollar)
20
EBITDA
2006-2010
(Million
U.S.
Dollar)
Net Income 2006-2010
(Million U.S. Dollar)
Source: Omega Protein
Gross Profit
Gross Margin
EBITDA
EBITDA Margin |
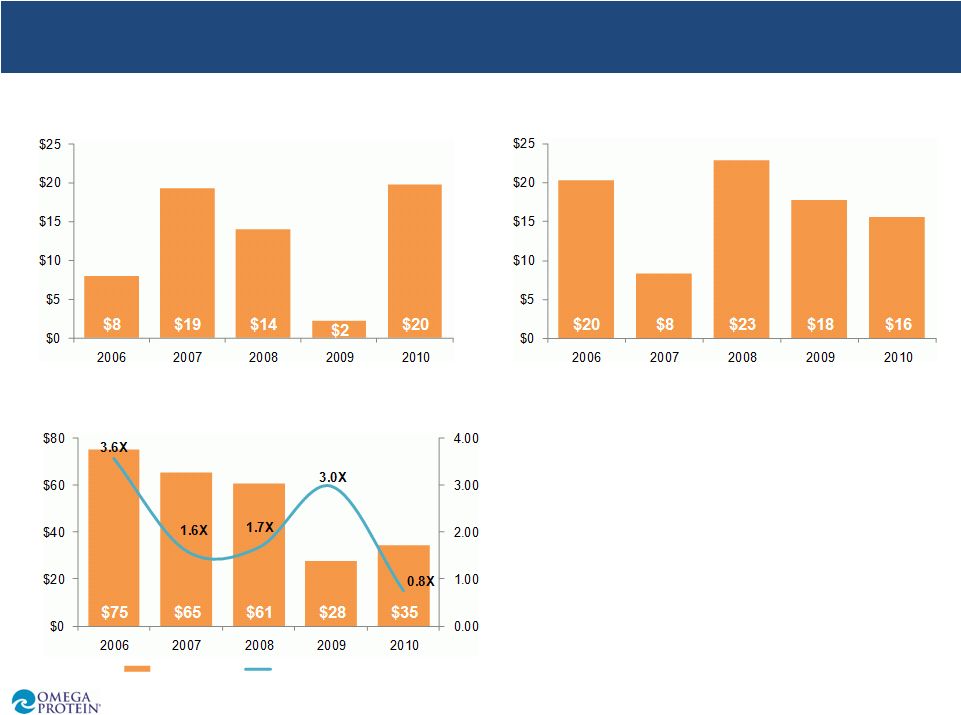 Financial Performance
Capital
Expenditures
(Million
U.S.
Dollar)
Cash
Balance
(Million
U.S.
Dollar)
21
Debt
Balance
(Million
U.S.
Dollar)
Source: Omega Protein
Debt
Debt/EBITDA |
 Why
OME? Compelling fundamentals
Growing populations and standards of living
Increased demand for high quality protein
Supply/demand imbalance for fish meal and fish oil
Strong product price appreciation should continue
Opportunities for organic growth
Expand products for human nutrition
R&D-driven new product development / enhancements
Production improvements
Focus on acquisitions
Potential to add new product lines
Target new products or markets
Strong balance sheet
22 |