Attached files
Table of Contents
UNITED STATES
SECURITIES AND EXCHANGE COMMISSION
Washington, D.C. 20549
FORM 10-K
(Mark One)
| x | ANNUAL REPORT PURSUANT TO SECTION 13 OR 15(d) OF THE SECURITIES EXCHANGE ACT OF 1934 |
For the fiscal year ended May 1, 2011
OR
| ¨ | TRANSITION REPORT PURSUANT TO SECTION 13 OR 15(d) OF THE SECURITIES EXCHANGE ACT OF 1934 |
For the transition period from to .
Commission file number 333-107830-05
DEL MONTE CORPORATION
(Exact name of registrant as specified in its charter)
| Delaware | 75-3064217 | |
| (State or other jurisdiction of incorporation or organization) |
(I.R.S. Employer Identification Number) |
One Maritime Plaza, San Francisco, California 94111
(Address of principal executive offices including zip code)
(415) 247-3000
(Registrant’s telephone number, including area code)
Securities registered pursuant to Section 12(b) of the Act: NONE
Securities registered pursuant to Section 12(g) of the Act: NONE
Indicate by check mark if the registrant is a well-known seasoned issuer, as defined in Rule 405 of the Securities Act. Yes ¨ No x
Indicate by check mark if the registrant is not required to file reports pursuant to Section 13 or Section 15(d) of the Act. Yes ¨ No x
Indicate by check mark whether the registrant (1) has filed all reports required to be filed by Section 13 or 15(d) of the Securities Exchange Act of 1934 during the preceding 12 months (or for such shorter period that the registrant was required to file such reports), and (2) has been subject to such filing requirements for the past 90 days. Yes x No ¨
Indicate by check mark whether the registrant has submitted electronically and posted on its corporate Web site, if any, every Interactive Data File required to be submitted and posted pursuant to Rule 405 of Regulation S-T (§232.405 of this chapter) during the preceding 12 months (or for such shorter period that the registrant was required to submit and post such files). Yes ¨ No ¨
Indicate by check mark if disclosure of delinquent filers pursuant to Item 405 of Regulation S-K (§229.405 of this chapter) is not contained herein, and will not be contained, to the best of the registrant’s knowledge, in definitive proxy or information statements incorporated by reference in Part III of this Form 10-K or any amendment to this Form 10-K. x
Indicate by check mark whether the registrant is a large accelerated filer, an accelerated filer, a non-accelerated filer, or a smaller reporting company. See the definitions of “large accelerated filer,” “accelerated filer” and “smaller reporting company” in Rule 12b-2 of the Exchange Act.
| Large accelerated filer | ¨ | Accelerated filer | ¨ | |||
| Non-accelerated filer | x (Do not check if a smaller reporting company) | Smaller reporting company | ¨ | |||
Indicate by check mark whether the registrant is a shell company (as defined in Rule 12b-2 of the Act. Yes ¨ No x
The Company is privately held. All of its common stock is owned by Blue Acquisition Group, Inc. There is no trading in the Company’s common stock and therefore an aggregate market value based on sales or bid and asked prices is not determinable.
The number of shares outstanding of the Company’s common stock, par value $0.01, as of close of business on July 11, 2011 was 10.
Table of Contents

For the Fiscal Year Ended May 1, 2011
TABLE OF CONTENTS
| Page | ||||||
| PART I | ||||||
| Item 1. |
3 | |||||
| Item 1A. |
11 | |||||
| Item 1B. |
26 | |||||
| Item 2. |
26 | |||||
| Item 3. |
27 | |||||
| Item 4. |
31 | |||||
| PART II | ||||||
| Item 5. |
32 | |||||
| Item 6. |
33 | |||||
| Item 7. |
Management’s Discussion and Analysis of Financial Condition and Results of Operations |
34 | ||||
| Item 7A. |
53 | |||||
| Item 8. |
55 | |||||
| Item 9. |
Changes in and Disagreements with Accountants on Accounting and Financial Disclosure |
103 | ||||
| Item 9A. |
103 | |||||
| Item 9B. |
104 | |||||
| PART III | ||||||
| Item 10. |
105 | |||||
| Item 11. |
110 | |||||
| Item 12. |
Security Ownership of Certain Beneficial Owners and Management and Related Stockholder Matters |
154 | ||||
| Item 13. |
Certain Relationships and Related Transactions, and Director Independence |
156 | ||||
| Item 14. |
160 | |||||
| PART IV | ||||||
| Item 15. |
161 | |||||
| 162 | ||||||
| 163 | ||||||
| 164 | ||||||
Table of Contents
Special Note Regarding Forward-Looking Statements
This Annual Report on Form 10-K, including the sections entitled “Item 1. Business,” “Item 1A. Risk Factors” and “Item 7. Management’s Discussion and Analysis of Financial Condition and Results of Operations,” contains forward-looking statements within the meaning of Section 27A of the Securities Act of 1933, and Section 21E of the Securities Exchange Act of 1934. Statements that are not historical facts, including statements about our beliefs or expectations, are forward-looking statements. In some cases, you can identify forward-looking statements by the use of forward-looking terms such as “may,” “will,” “should,” “expect,” “intend,” “plan,” “anticipate,” “believe,” “estimate,” “predict,” “potential,” or “continue” or the negative of these terms or other comparable terms.
Forward-looking statements are based on our plans, estimates, expectations and assumptions as of the date of this Annual Report on Form 10-K, and are subject to risks and uncertainties that may cause actual results to differ materially from the forward-looking statements. Accordingly, you should not place undue reliance on them. A detailed discussion of the known risks and uncertainties that could cause actual results and events to differ materially from such forward-looking statements is included in the section entitled “Risk Factors” (refer to Part I, Item 1A of this Annual Report on Form 10-K). All forward-looking statements in this Annual Report on Form 10-K are made only as of the date of this report. We undertake no obligation, other than as required by law, to update or revise publicly any forward-looking statements, whether as a result of new information, future events or otherwise.
Helpful Information
As used throughout this Annual Report on Form 10-K, unless the context otherwise requires, “DMFC” means Del Monte Foods Company, “DMC” means Del Monte Corporation, and “Del Monte” or “the Company” means DMC and its consolidated subsidiaries.
1
Table of Contents
Del Monte’s fiscal year ends on the Sunday closest to April 30, and its fiscal quarters typically end on the Sunday closest to the end of July, October and January. As used throughout this Form 10-K, “fiscal 2012” means Del Monte’s fiscal year ending April 29, 2012; “fiscal 2011” means Del Monte’s fiscal year ending May 1, 2011; “fiscal 2010” means Del Monte’s fiscal year ending May 2, 2010; “fiscal 2009” means Del Monte’s fiscal year ending May 3, 2009; “fiscal 2008” means Del Monte’s fiscal year ended April 27, 2008; and “fiscal 2007” means Del Monte’s fiscal year ended April 29, 2007.
On March 8, 2011, we were acquired by an investor group led by funds affiliated with Kohlberg Kravis Roberts & Co. L.P. (“KKR”), Vestar Capital Partners (“Vestar”) and Centerview Capital, L.P. (“Centerview”). The acquisition (also referred to as the “Merger”) was effected by the merger of Blue Merger Sub Inc. (“Blue Sub”) with and into DMFC, with DMFC being the surviving corporation. As a result of the Merger, DMFC became a wholly-owned subsidiary of Blue Acquisition Group, Inc. (“Parent”).
On April 26, 2011, DMFC merged with and into DMC, with DMC being the surviving corporation. As a result of this merger, DMC became a direct wholly-owned subsidiary of Parent. Also as a result of this merger, our filings with the Securities and Exchange Commission can now be found under Del Monte Corporation. Prior to the merger on April 26, 2011, our filings can be found under Del Monte Foods Company.
Amounts discussed for the twelve-months ended May 1, 2011 include the 44-week Predecessor period from May 3, 2010 through March 7, 2011 and the 8-week Successor period, from March 8, 2010 through May 1, 2011. For comparison purposes, the discussions below are generally based on the mathematical combination of the Successor and Predecessor periods for the twelve months ended May 1, 2011, which we believe provides a more meaningful understanding of the underlying business.
Market Data
Unless otherwise indicated, all statements presented in this Annual Report on Form 10-K regarding Del Monte’s brands and market share are Del Monte all-outlet estimates of equivalent case volume for pet food and consumer markets while dollars are used for pet snacks, which we believe is a more appropriate measure for that business. These estimates are based on Nielsen Grocery Scanner and Nielsen Household Panel data and are intended to reflect estimates for all retail channels (which include grocery, Walmart, club stores, dollar stores and pet specialty stores). We have not independently verified information obtained from Nielsen. The data for pet products includes the dry dog food, wet dog food, dry cat food, wet cat food, chewy dog snacks, biscuit crunchy dog snacks, long-lasting chew dog snacks and cat treat categories. References to processed fruit, vegetables and tomato products do not include frozen products. Market share data for processed vegetables and tomato products include only those categories in which Del Monte competes. Additionally, market share data for the processed tomato category excludes ketchup, spaghetti sauce and pizza sauce. The data for processed fruit includes major fruit, single-serve and packaged produce categories in which Del Monte competes, includes specialty and pineapple categories and excludes applesauce. The data for broth products includes the total broth category. References to fiscal 2011 market share refer to the 52-week period ended April 30, 2011. References to trends for the categories in which we compete are based on internal estimates of dollar sales calculated from data obtained through Nielsen Grocery Scanner and Nielsen Household Panel data and are intended to reflect estimates for all retail channels (which include grocery, Walmart, club stores, dollar stores and pet specialty stores).
Trademarks
Meow Mix, Kibbles ‘n Bits, Milk-Bone, 9Lives, Pup-Peroni, Gravy Train, Nature’s Recipe, Canine Carry Outs, Snausages, Alley Cat, Meaty Bone, Pounce, Jerky Treats, Milo’s Kitchen, Del Monte, Contadina, S&W, College Inn, Del Monte Fruit Chillers, SunFresh, Fruit Naturals and Orchard Select, among others, are registered or unregistered trademarks of Del Monte Corporation (including its subsidiaries).
2
Table of Contents
| Item 1. | Business |
Overview
Del Monte Corporation (“DMC,” previously a subsidiary of Del Monte Foods Company) and its consolidated subsidiaries (“Del Monte” or the “Company”) is one of the country’s largest producers, distributors and marketers of premium quality, branded pet products and food products for the U.S. retail market, generating $3.7 billion in net sales for the twelve months ended May 1, 2011. Our pet food and pet snacks brands include Meow Mix, Kibbles ‘n Bits, Milk-Bone, 9Lives, Pup-Peroni, Gravy Train, Nature’s Recipe, Canine Carry Outs, Milo’s Kitchen and other brand names and our leading food brands include Del Monte, Contadina, S&W, College Inn and other brand names. We also produce and distribute private label pet products and food products. Our products are sold nationwide, in all channels serving retail markets, as well as to the U.S. military, certain export markets, the foodservice industry and other food processors. At May 1, 2011, our principal facilities consist of 17 production facilities and 9 distribution centers in the United States, as well as two production facilities in Mexico and one production facility in Venezuela.
We believe our diversified, multi-category product line provides us with a competitive advantage in selling to the retail grocery industry. We sell our products in the U.S. retail dry grocery market and produce sections, primarily through grocery chains, club stores, supercenters and mass merchandisers. We believe we have developed strong relationships with our customers over the long term that provide a solid base for our business.
History of Del Monte Corporation
Our predecessor was originally incorporated in 1916 and was a publicly traded company until its acquisition in 1979 by the predecessor of RJR Nabisco, Inc. From 1979 to 1999, our predecessor’s business went through a number of ownership changes and divestitures. In February 1999, Del Monte Foods Corporation (“DMFC”) became a publicly traded company and was listed on the New York Stock Exchange under the symbol “DLM.” DMFC remained a publicly traded company until March 2011 (see description of the “Merger” below).
From 1997 to 2001, we completed several acquisitions, including: in 1997, the acquisition of assets comprising Nestle USA, Inc.’s U.S. business of manufacturing and marketing certain processed tomato products and the rights to Contadina processed tomato products; in 1998, the rights to the Del Monte brand in South America from Nabisco, Inc. and Nabisco’s processed vegetable and tomato business in Venezuela; in 2000, the rights to the SunFresh brand citrus and tropical fruits line of the UniMark Group. Inc.; and in 2001, the inventory and rights to the brand name of the S&W business from Tri Valley Growers, an agricultural cooperative association, which included processed fruits, tomatoes, vegetables, beans and specialty sauces.
On December 20, 2002, we acquired certain businesses from H.J. Heinz Company (the “2002 Merger”), including their U.S. and Canadian pet food and pet snacks, North American tuna, U.S. retail private label soup and U.S. infant feeding businesses (the “2002 Acquired Businesses”). The 2002 Acquired Businesses included brand names such as StarKist, College Inn, 9Lives, Kibbles ‘n Bits, Pup-Peroni, Snausages and Pounce.
In fiscal 2004, we sold the IVD, Medi-Cal and Techni-Cal brands we acquired from Heinz. In fiscal 2005, we acquired fruit packing operations, located in Mexico, and related assets.
On April 24, 2006, we sold certain assets and liabilities related to our private label soup, infant feeding and food service soup businesses (collectively, the “Soup and Infant Feeding Businesses”) to TreeHouse Foods, Inc.
On May 19, 2006, we completed the acquisition of Meow Mix Holdings, Inc. and its subsidiaries (“Meow Mix”), the maker of Meow Mix brand cat food and Alley Cat brand cat food. Effective July 2, 2006, we completed the acquisition of certain pet product assets, including the Milk-Bone brand (“Milk-Bone”), from Kraft Foods Global, Inc.
On October 6, 2008, we (i) sold all of the outstanding stock of Galapesca S.A., Panapesca Fishing, Inc. and Marine Trading Pacific, Inc., (ii) caused Star-Kist Samoa, Inc. to be merged with and into a subsidiary of the purchaser and (iii) sold certain assets that are primarily related to the business of manufacturing, marketing, selling and distributing StarKist brand products and private label seafood products (such business, the “StarKist Seafood Business”). See “Note 1. Business and Basis of Presentation” of our consolidated financial statements in this Annual Report on Form 10-K for more information regarding this divestiture.
On March 8, 2011, we were acquired by an investor group led by funds affiliated with Kohlberg Kravis Roberts & Co. L.P. (“KKR”), Vestar Capital Partners (“Vestar”) and Centerview Capital, L.P. (“Centerview”). Under the terms of the merger agreement, DMFC’s stockholders received $19.00 per share in cash. The acquisition (also referred to as the “Merger”) was effected by the merger of Blue
3
Table of Contents
Merger Sub Inc. (“Blue Sub”) with and into DMFC, with DMFC being the surviving corporation. As a result of the Merger, DMFC became a wholly-owned subsidiary of Blue Acquisition Group, Inc. (“Parent”). DMFC stockholders approved the transaction on March 7, 2011. DMFC’s common stock ceased trading on the New York Stock Exchange before the opening of the market on March 9, 2011.
On April 26, 2011, DMFC merged with and into DMC, with DMC being the surviving corporation. As a result of this merger, DMC became a direct wholly-owned subsidiary of Parent.
DMC was incorporated in Delaware in June 2002 under the name SKF Foods, Inc. Del Monte maintains its principal executive office at One Maritime Plaza, San Francisco, CA 94111. Del Monte’s telephone number is (415) 247-3000 and our website is www.delmontefoods.com.
Our periodic and current reports, including our annual report on Form 10-K, quarterly reports on Form 10-Q, current reports on Form 8-K and all amendments to such reports filed or furnished pursuant to Section 13(a) or 15(d) of the Securities Exchange Act of 1934 (the “Exchange Act”), are available free of charge on our website as soon as reasonably practicable after such material is electronically filed with, or furnished to, the Securities and Exchange Commission (the “SEC”).
The Industry
Overall. The United States consumer packaged goods industry is generally characterized by relatively stable growth, based on modest price and population increases. Companies are facing challenges due to the current competitive promotional environment and the reduced capability to price to cover costs and maintain margins, as well as the need to differentiate their products through innovation to drive growth. However, we believe that the long-term fundamentals for the overall consumer packaged goods industry are favorable, particularly for branded manufacturers with an ability to innovate based on consumer insights through strong, well-known brands, to effectively price and to successfully manage relationships with customers who are industry leaders. While overall consumption growth is expected to be stable, we believe that certain categories that best meet consumer needs, such as pet snacks and dry pet food, offer opportunities for higher margins and/or higher growth.
Our categories are affected by consumer behavioral changes in shopping and consumption, which may be impacted by economic conditions. We believe both the pet and consumer categories reflected the current challenging economic environment with an increased focus on value-oriented products.
Over the last decade, we have seen consumers migrate away from the grocery channel to value channels. As a result, discounters, clubs and outlets have grown; private label has grown; and, we believe, even affluent consumers are becoming value shoppers. The “humanization” of pets continues to be a key driving factor in the growth of the pet market. The growing importance of pets as part of the family, increased rates of value-added new pet product entries and increased prices have contributed to significant growth in this category.
We face substantial competition throughout our product lines from numerous well-established businesses operating globally, nationally or regionally with single or multiple branded product lines. We also face competition from private label manufacturers that compete for consumer preference, distribution, shelf space and merchandising support. We generally compete based upon our brand recognition and loyalty, product and packaging, quality and innovation, taste, nutrition, breadth of our product line, price and convenience.
Consumer packaged goods producers have been impacted by two key trends affecting their retail customers: cost pressures and competitive pressures. Retailers are rationalizing costs in an effort to improve profitability, including efforts to reduce inventory levels, increase supply-chain efficiency and decrease working capital requirements. In addition, more traditional grocers have experienced increasing competition from club stores, supercenters and mass merchandisers, which generally offer every-day low prices. Retailer customers generally offer a private label store brand in addition to offering the number one and number two national or regional brands in different product categories. Sustaining strong relationships with retailers has become a critical success factor for food companies.
The market share data presented below are estimates based on Nielsen Grocery Scanner and Nielsen Household Panel data and include all retail channels (which include grocery, Walmart, club stores, dollar stores and pet specialty stores). References to trends for the categories in which we compete are based on internal estimates calculated from data obtained through Nielsen Grocery Scanner and Nielsen Household Panel data and are intended to reflect estimates for all retail channels.
Pet Products. Our Pet Products participate in a market with stable annual retail sales of approximately $18 billion. The categories in which we compete are dry and wet dog food, dry and wet cat food, dog snacks and cat snacks. We believe that growth in the dry pet food and snacks categories will continue to be fueled by pricing, as well as higher consumer spending on more premium products due to the heightened importance of pets as part of the family and growth in the pet population. Over half of all American households own a dog or a cat. The Pet Products market in which we compete is divided primarily among a small number of large, multi-national manufacturers.
4
Table of Contents
Consumer Products. Our Consumer Products participate in a market of approximately $7 billion of retail sales annually. The categories in which we compete are processed fruit, vegetables, tomatoes and broth. We believe that our categories will continue to be stable, declining modestly in terms of volume, but growing over the prior year in terms of dollars, driven by category pricing. In fiscal 2011, on a volume basis, the fruit category was down approximately 3%, the vegetable category was down approximately 2% and the tomato category was down approximately 1%. We believe our categories are well-positioned to benefit from the growing importance of adding fruits and vegetables to our consumers’ diet. Private label products as a group represented 32.4%, 46.7% and 40.2% of sales in the processed fruit, vegetable and tomato categories in which we compete, respectively, in fiscal 2011.
Reportable Segments
We have the following reportable segments:
| • | The Pet Products segment includes the Pet Products operating segment, which manufactures, markets and sells branded and private label dry and wet pet food and pet snacks. |
| • | The Consumer Products segment includes the Consumer Products operating segment, which manufactures, markets and sells branded and private label shelf-stable products, including fruit, vegetable, tomato and broth products. |
For financial information by segment, refer to “Note 15. Segment Information” of our consolidated financial statements in this Annual Report on Form 10-K.
Company Products
Pet Products. Our pet products represent some of the leading pet food and pet snacks brands in the United States, with a strong presence in most major product categories. Our pet products portfolio includes well-recognized national brands such as Meow Mix, Kibbles ‘n Bits, Milk-Bone, 9Lives and Pup-Peroni, as well as private label products. We compete in the dry and wet dog food categories, with market shares of 7.8% and 4.0% in fiscal 2011, respectively; the dry and wet cat food categories, with market shares of 22.2% and 13.4%, respectively; and the dog snack category (excluding rawhide), with a market share of 29.8%, in fiscal 2011. We also compete in the cat treats category, with a market share of 6.6% in fiscal 2011.
The products in the pet foods categories are primarily marketed under nationally recognized brands. Meow Mix cat food is associated by consumers with ingredient driven indulgence that “cats ask for by name” and 9Lives cat food is associated by consumers with the widely recognizable icon Morris the cat. Kibbles ‘n Bits dog food is comprised of crunchy, moist and meaty pieces. In fiscal 2011, we continued to invest in marketing behind our core brands. This marketing investment related primarily to Milk-Bone dog snacks, Kibbles ‘n Bits dog food, Meow Mix cat food and Pup-Peroni dog snacks. In January 2011, we invested in the launch of Kibbles n’ Bits Bistro Meals with a fully integrated marketing campaign that developed distribution and drove consumers to try the product.
Our pet snacks portfolio includes strong brands in one of the fastest growing categories of the pet food industry. We have a diverse and expanding pet snack product portfolio, including brands such as Milk-Bone and Pup-Peroni. Milk-Bone dog snacks include biscuits, which are differentiated on the basis of premium ingredients and the brand’s longstanding health and wellness positioning, and soft and chewy snacks. Pup-Peroni dog snacks are soft and chewy snacks. Our pet snacks businesses also include the well-established brands Canine Carry Outs, Snausages, Meaty Bone, Pounce and Jerky Treats. In 2011, we launched a new snack brand, Milo’s Kitchen, which will focus on the emerging consumer demand for real ingredient pet snacks. In 2011, we also introduced Milk-Bone Mini’s and Milk-Bone Healthy Favorites.
We compete in the pet food and pet snacks categories primarily based on brand recognition, taste, nutrition, variety and value. We face competition from branded pet food and pet snack products manufactured by companies such as Nestle-Purina, Mars, Colgate and Procter & Gamble. In addition, we face competition from private label pet food and pet snack products manufactured by companies such as Simmons and Mars.
Consumer Products. In our Consumer Products segment, we sell products under the Del Monte, Contadina, S&W and College Inn brand names, as well as private label products to key customers. We are one of the largest marketers of processed fruit, vegetables and tomatoes in the United States, with market shares of 30.2%, 25.8% and 14.7% in fiscal 2011, respectively. Our fruit, vegetable and tomato products are in mature categories, characterized by high household penetration. Our fruit category includes packaged produce products. Due to our strong brand awareness and our value-added products, we are able to price our fruit, vegetable and tomato products at a premium compared to private label products. College Inn broth products accounted for 12.1% of the total broth category in fiscal 2011 and was the second largest branded broth product in the U.S. Our fruit, vegetable, tomato and broth products compete primarily on the basis of brand recognition, taste, variety, convenience and value. In fiscal 2011, we continued our new product innovations with the launches of Fruit Naturals Berries and Del Monte Fruit Cup No-Sugar-Added single serve fruit line extensions. Our competitors include branded and private label fruit, vegetable, tomato and broth processors. Our primary competitors include Dole, Seneca Foods and Pacific Coast Producers in the fruit category; General Mills and Seneca Foods in the vegetable category; Con Agra, Heinz and Unilever in the tomato category; and Campbell Soup and smaller regional brands in the broth category.
5
Table of Contents
Sales and Marketing
We use a direct sales force and independent food brokers to sell our products to our customers in different channels. A direct sales force is used for most of our sales to grocery, club store, supercenter and mass merchandiser customers. We use a combination of a direct sales force and some food brokers for other channels such as pet specialty, dollar stores, drug stores, convenience stores, military, foodservice, food ingredients and private label. These brokers are paid commissions based on a percentage of sales. Our sales of pet products in Canada and our College Inn foodservice sales in the United States are performed by Heinz through agency agreements. Within the grocery channel and certain other channels, we manage retail in-store conditions through our primary broker and generally pay a flat fee for this retail coverage.
We believe that a focused and consistent marketing strategy is critical to the growth of our brands, and we have maintained our investment in our brands, including marketing and trade spending, at competitive levels. Our marketing function oversees new product development, pricing strategy, advertising, publicity, consumer promotion and package design. Collectively, our marketing programs are designed to strengthen our brand equities, generate awareness of new items and stimulate trial among our target consumers. We also partner with our customers to develop trade promotion programs which deliver merchandising and price promotions to our consumers.
Foreign Sales and Operations
Revenues from Foreign Countries
Our foreign sales are consummated either through local operations or through brokers, distributors, U.S. exporters, direct sales force or licensees for foreign destinations. For financial information regarding foreign sales, refer to “Note 15. Segment Information” of our consolidated financial statements in this Annual Report on Form 10-K.
Foreign Operations
We have subsidiaries located in Canada, Mexico, Venezuela, Colombia, Ecuador and Peru.
To supply sales of products in the South American market, We operate a food processing plant in Venezuela and we purchase raw product, primarily vegetables, from approximately 18 growers in Venezuela. In addition we purchase tomato paste, frozen vegetables and fruit pulps from five suppliers in Chile and dried beans from two suppliers in the United States. We also use five co-packers located in Chile, the Philippines and Belgium to provide products sold in South America.
Products produced in Mexico are sold primarily in the United States. We operate two fruit processing plants in Mexico, and we buy fruits from about 400 growers in Mexico, Canada, the United States, Argentina, Chile and the Philippines to supply these plants.
See “Item 1A. Risk Factors—Risk associated with foreign operations, including changes in import/export duties, wage rates, political or economic climates, or exchange rates, may adversely affect our operations.”
Geographic Location of Fixed Assets
Our fixed assets are primarily located in the United States, with $37.1 million, or 5.1% of our total net fixed assets located in foreign countries at May 1, 2011.
6
Table of Contents
Customers
Most food retailers in the U.S. carry our products, and we have developed strong relationships over the long term with the majority of significant participants in the retail grocery trade.
On a consolidated basis for the twelve months ended May 1, 2011, sales to one customer, Walmart, represented approximately 34% of our overall list sales, which approximates our gross sales, and an even higher percentage of sales of our Pet Products business. Walmart, which includes Walmart’s stores and supercenters along with SAM’S CLUB, is also the most significant customer of each of our reportable segments, with sales to Walmart representing in excess of 20% of list sales in each of our segments. In addition, our top 10 customers represented approximately 63% of our list sales for the twelve months ended May 1, 2011.
Our sales teams work with our customers to promote the resale of our products in their stores. These efforts include working with customers in the areas of merchandising, product assortment and distribution and shelving. Our customers provide us with purchase orders as they desire product and we fill these orders based on generally standard terms of sale. Where we provide private label products for our customers, we typically supply those customers on a purchase order basis as well. These purchase orders could be on a stand-alone basis, or issued under a master agreement that sets forth matters such as payment and delivery terms. Our arrangements with our largest customer, Walmart, operate in generally the same fashion as those with our other customers and on overall similar terms.
Supply
The cost of raw materials may fluctuate due to demand, weather conditions, governmental regulations, crop yields, economic climate, seasonal factors, exchange rates or other circumstances. Raw materials reflect only a portion of our cost of goods sold. See “Item 1A. Risk Factors—The inputs, commodities, ingredients and other raw materials that we require are subject to price increases and shortages that could adversely affect our results of operations” and “—Adverse weather conditions (caused by climate change or otherwise), natural disasters, pestilences and other natural conditions can affect crops and other inputs, which can adversely affect our operations and our results of operations.”
Pet Products
We purchase certain commodities such as soybean meal, corn and wheat. For these commodities, we maintain a hedging program designed to limit the price volatility associated with anticipated commodity purchases. Coverage of these hedges may range up to 24 months of projected production requirements. See “Item 1A. Risk Factors—If our assessments and assumptions about commodity prices, as well as ingredient and other prices and interest and currency exchange rates, prove to be incorrect in connection with our hedging or forward-buy efforts or planning cycles, our costs may be greater than anticipated and our financial results could be adversely affected. Volatility in interest rates, commodities and other hedged items will impact our results of operations.” We generally purchase meat, meat by-products (including fats and oils), vitamins/flavorings, flour and other ingredients through supply agreements or on the open market.
Consumer Products
We manufacture our products from a wide variety of raw materials. For the Consumer Products operating segment, each year, we buy over 1.1 million tons of fresh fruit, vegetables and tomatoes from individual growers, farmers and cooperatives located primarily in the United States. Our fruit supply contracts range from one to ten years. Fruit prices are generally negotiated with grower associations annually. We purchase raw product from approximately 500 fruit growers located in California, Oregon and Washington. Yellow cling peaches are contracted by the acre, while contracts for other fruits require delivery of specified quantities each year. Our vegetable supply contracts are for a one-year term and require delivery from contracted acreage with specified quality. Vegetable prices are negotiated annually. We purchase raw product from over 500 vegetable growers located primarily in Wisconsin, Illinois, Minnesota, Washington and Texas. We purchase raw tomatoes from approximately 20 tomato growers located in California, where approximately 95% of domestic tomatoes for processing are grown. Tomato prices are generally negotiated with grower associations and are reset each year. We actively participate in agricultural management, agricultural practices, quality control and compliance with pesticide/herbicide regulations. Other ingredients, including sugar and sweeteners, spices, proteins, grains, flour, and certain other fruits and vegetables are generally purchased through annual supply agreements or on the open market.
We maintain long-term relationships with growers to help ensure a consistent supply of raw fruit, vegetables and tomatoes. We own virtually no agricultural land.
Cans and Ends
We have long-term supply agreements with two suppliers covering the purchase of metal cans and ends. Our agreement with Impress Holdings, B.V. (“Impress”) was amended and restated January 23, 2008 and, as described in “Note 4. Discontinued Operations” of our consolidated financial statements in this Annual Report on Form 10-K, this agreement was bifurcated in connection with the sale of the StarKist Seafood Business in October 2008. Currently, our agreement grants Impress the exclusive right, subject to certain specified exceptions, to supply metal cans and ends for our pet products. The agreement included certain minimum volume purchase requirements and guaranteed a certain minimum financial return to Impress until August 13, 2010. As of May 1, 2011, we have committed to make purchases of approximately $14.0 million in fiscal 2012. The Impress agreement expires December 31, 2015.
7
Table of Contents
We currently are a party to a supply agreement, effective as of January 1, 2010, with Silgan Containers LLC (“Silgan”) which relates to Silgan’s provision of metal cans and ends used for our fruit, vegetable, tomato and broth products. Under the agreement and subject to certain specified exceptions, we must purchase all of our United States metal food and beverage container requirements for our fruit, vegetable, tomato and broth products from Silgan. As of May 1, 2011, we have committed to make purchases of approximately $41.1 million in fiscal 2012. The Silgan agreement expires December 31, 2021.
Pricing under the Impress agreement and the Silgan agreement is adjusted up to twice a year to reflect changes in metal costs and annually to reflect changes in the costs of manufacturing.
Production and Distribution
Production
Pet Products. At the end of fiscal 2011, our pet products were primarily manufactured in five of our production facilities located in the U.S. We also use eight co-packers and nine re-packers located within the U.S., China and Thailand to supplement production capacity. Our facility in Bloomsburg, PA, produces a variety of dry dog and cat products and the majority of our canned pet product requirements. In Lawrence, KS, we pack the majority of our dry Kibbles ‘n Bits products in a variety of sizes and package types. Our Topeka, KS facility produces the majority of our soft and chewy pet snacks in a wide range of packages. In addition, our Topeka factory produces a wide variety of dry dog and cat products. Our facility in Decatur, AL produces a variety of dry dog and cat products and our facility in Buffalo, NY produces Milk-Bone dog snacks. Our pet food facilities supply pet products for both the U.S. and Canadian markets. We also have a co-pack agreement to source all of our Pup-Peroni pet snacks from one co-packer located in Utah.
Consumer Products. We operate 15 production facilities for our Consumer Products segment in the U.S., Mexico and Venezuela. See “Item 2. Properties” for a listing of our principal production facilities. Our fruit plants are located in California and Washington, most of our vegetable plants are located in the Midwest and our tomato plants are located in California and Indiana. A significant portion of our Consumer Products operating segment has a seasonal production cycle that generally runs between the months of June and October. Most of our seasonal plants operate at or close to full capacity during the packing season. This seasonal production primarily relates to the majority of our fruit, vegetable and tomato products, while some of our fruit and tomato products and our College Inn broth products are produced throughout the year.
Our Consumer Products operating segment uses 15 co-packers and 5 re-packers located in the U.S. and foreign locations, in addition to our own production facilities. Co-packers are used for broth, pineapple, tropical fruit salad, mandarin oranges, asparagus and certain other products. We have a supply agreement to source the majority of our pineapple requirements from GTL Limited (formerly Del Monte Philippines, Inc.), an unaffiliated company. We also periodically use co-packers to supplement supplies of certain fruit, vegetable and tomato products.
Distribution
Customers can order products to be delivered via third-party trucking, on a customer pickup basis or by rail. Distribution centers provide casing, labeling and special packaging and other services. From time to time we evaluate our distribution center network and, accordingly, may make changes to our network. See “Item 2. Properties” for a listing of the principal distribution centers owned or leased by us. In addition, our distribution network includes third-party distribution centers. See “Item 1A. Risk Factors—We rely upon a number of third parties to manage or provide distribution centers for our products. Failures by these third parties could adversely affect our business.”
Research and Development
Our research and development organization provides product, packaging and process development. For the twelve months ended May 1, 2011 and for fiscal 2010 and fiscal 2009, research and development expenditures were $30.2 million, $26.8 million and $23.7 million, respectively. We operate a research and development facility in Terminal Island, CA where we develop new products and product line extensions and research existing products related to pet food and pet snacks. We also maintain a research and development facility in Walnut Creek, CA, where we develop new products and product line extensions and conduct research in a number of areas related to our fruit, vegetable, tomato and broth products, including packaging, pest management, food science, environmental and engineering. These facilities employ scientists, engineers and researchers and are equipped with pilot shops and test kitchens.
8
Table of Contents
Intellectual Property
We own a number of registered and unregistered trademarks for use in connection with various food and snack products, including:
| • | Pet Products: Meow Mix, Kibbles ‘n Bits, Milk-Bone, 9Lives, Pup-Peroni, Gravy Train, Nature’s Recipe, Canine Carry Outs, Snausages, Alley Cat, Meaty Bone, Pounce, Jerky Treats and Milo’s Kitchen. |
| • | Consumer Products: Del Monte, Contadina, S&W, College Inn, Del Monte Fruit Chillers, SunFresh, Fruit Naturals and Orchard Select. |
Brand name recognition and the product quality associated with our brands are key factors in the success of our products. The current registrations of these trademarks in the United States and foreign countries are effective for varying periods of time, and may be renewed periodically, provided that we, as the registered owner, or our licensees where applicable, comply with all applicable renewal requirements including, where necessary, the continued use of the trademarks in connection with similar goods. We are not aware of any material challenge to our ownership of our major trademarks. Our registered and unregistered trademarks associated with the pet business relate primarily to North America and South America. With respect to our broth business, our trademarks relate primarily to the United States, Canada and Australia. We generally did not acquire trademark rights for the 2002 Acquired Businesses outside of the territories identified above. As a result, we may be restricted from selling products under the brands relating to the 2002 Acquired Businesses in other territories to the extent these trademark rights are owned by another party.
We have granted various perpetual, exclusive, royalty-free licenses for use of the Del Monte name and trademark, along with certain other trademarks, patents, copyrights and trade secrets to other companies or their affiliates. Licenses for the use of the Del Monte name and trademark are generally for use outside of the United States. For example, Kikkoman Corporation holds the rights to use Del Monte trademarks in Asia and the South Pacific (excluding the Philippines and the Indian Subcontinent); Fresh Del Monte Produce Inc. holds the rights to use the Del Monte name and trademark with respect to fresh fruit, vegetables and produce throughout the world (including the United States); and Fresh Del Monte Produce Inc., through its subsidiary Del Monte Foods International, Inc. and its affiliates, holds the rights in Europe, Africa and the Middle East (including ownership rights for processed food products in South Africa). These companies are not affiliated with Del Monte. We have granted other licenses for the use of our trademarks both within and outside of the United States.
We retain the right to review the quality of the licensees’ products under each of our license agreements. We generally may inspect the licensees’ facilities for quality and may require the licensees to periodically submit samples to us for inspection. Licensees may grant sublicenses but all sublicensees are bound by these quality control standards and other terms of the license.
In addition to granting certain licenses, we have sold trademarks from time to time. During fiscal 2007, in addition to granting a license with respect to the S&W trademark for beans in the United States, we sold the rights to the S&W trademark in Australia and New Zealand. During fiscal 2008, we sold our remaining rights to the S&W trademark in all markets outside of North and South America.
We have granted various security and tangible interests in our trademarks and related trade names, copyrights, patents, trade secrets and other intellectual property to our creditors, in connection with our credit facilities, and to our licensees, to secure certain obligations of Del Monte under the license agreements.
As of May 1, 2011, we owned 27 issued U.S. patents covering food production and preservation methods, methods for manufacturing cans and ends, methods for sealing cans, animal foods and food processing equipment. These patents expire between 2011 and 2029 and cannot be renewed. Our patents are generally not material to our business.
We have developed a number of proprietary vegetable seed varieties, which we protect by restricting access and/or by the use of non-disclosure agreements. We cannot guarantee that these methods will be sufficient to protect the secrecy of our seed varieties. In addition, other companies may independently develop similar seed varieties. We have obtained U.S. plant variety protection certificates under the Plant Variety Protection Act on some of our proprietary seed varieties. Under a protection certificate, the breeder has the right, among other rights, to exclude others from offering or selling the variety or reproducing it in the United States. The protection afforded by a protection certificate generally runs for 20 years from the date of its filing and is not renewable.
Governmental Regulation; Environmental Compliance and Sustainability
As a manufacturer and marketer of food products, our operations are subject to extensive regulation by various federal government agencies, including the Food and Drug Administration, the United States Department of Agriculture, U.S. Customs and Border Protection, Environmental Protection Agency and the Federal Trade Commission (“FTC”), as well as state and local agencies, with respect to registrations, production processes, product attributes, packaging, labeling, storage and distribution. Under various statutes and regulations, these agencies prescribe requirements and establish standards for safety, purity, performance and labeling. Our products must comply with all applicable laws and regulations, including food and drug laws, of the jurisdictions in which they are manufactured and marketed, such as the Federal Food, Drug and Cosmetic Act of 1938, as amended, and the Federal Fair Packaging and Labeling Act of 1966, as amended. In addition, advertising of our products is subject to regulation by the FTC, and our operations are subject to certain health and safety regulations, including those issued under the Occupational Safety and Health Act. Our
9
Table of Contents
manufacturing facilities and products are subject to periodic inspection by federal, state and local authorities. We seek to comply with all such laws and regulations and to obtain any necessary permits and licenses. We believe our facilities and practices are sufficient to maintain material compliance with current applicable governmental laws, regulations, permits and licenses. Nevertheless, we cannot guarantee that we are currently in compliance with all applicable laws, regulations, or requirements for permits or licenses nor that we will be able to comply with any future laws and regulations or requirements for necessary permits and licenses. Our failure to comply with applicable laws and regulations or obtain any necessary permits and licenses could subject us to civil remedies including fines, injunctions, recalls or seizures, as well as potential criminal sanctions. See “Item 1A. Risk Factors—Government regulation could increase our costs of production and increase legal and regulatory expenses.”
As a result of our agricultural, food processing and packaging activities, we are subject to numerous environmental laws and regulations. These laws and regulations govern the treatment, handling, storage and disposal of materials and waste and the remediation of contaminated properties. Violations or non-compliance with these laws and regulations could result in the imposition of fines or civil liability against us by governmental entities or private parties. We seek to comply with these laws and regulations. Outside the United States, we are also subject to applicable multi-national, national and local environmental laws and regulations in the host countries where we do business. We have programs across our international business operations designed to meet compliance with requirements in the environmental area. However, we cannot predict the extent to which the enforcement of any existing or future environmental law or regulation may affect our operations. Among the environmental matters currently affecting us are the following:
| • | We have conducted groundwater remediation at our Stockton, CA property associated with petroleum hydrocarbon contamination that resulted from the operations of a prior owner of the property. We have completed remediation and have been advised that no further action is necessary by the Regional Water Quality Control Board. |
| • | We are investigating soil and groundwater contamination at our Decatur, AL property associated with the presence of dioxins that resulted from the operations of a prior owner of the property. This facility was acquired in May 2006 in the Meow Mix acquisition. In connection with our purchase accounting for the Meow Mix acquisition, reserves were established that we believe will be adequate to cover any liability that may result from this contamination. |
| • | We are performing soil and groundwater investigation and remediation and site restoration at our Terminal Island, CA property as part of the closure and demolition of a facility which was operated by a joint venture to which a former subsidiary was a party. We also expect to perform soil and groundwater investigation and remediation and site restoration at our Terminal Island, CA property as part of the closure and demolition of other facilities which were directly operated by a former subsidiary. We assumed these liabilities in connection with the 2002 Merger. We are consulting with the Port of Los Angeles, which owns the property where these facilities are located, regarding the nature and scope of the investigation, remediation and restoration to be performed. We believe that we have adequate reserves to cover any material liability that may result from these investigations and remediation. |
| • | A group of potentially responsible parties (the “PRP Group”) at the BKK landfill in Southern California has notified us that we are a potentially responsible party at the site and that we may be liable for the costs of environmental investigation and remediation. The PRP Group has incurred costs to perform maintenance and repair of the site and expects to investigate potential groundwater contamination in the future. We cannot at this time reasonably estimate the range of potential exposure at the site. |
| • | Governmental authorities and private claimants have notified us that we may be liable for environmental investigation and remediation costs at certain contaminated sites, including certain third-party sites at which we disposed of wastes. We may be liable for remediation costs at these sites as a result of alleged leaks, spills, releases or disposal of certain wastes or other substances at these sites. Based upon the information currently available, we do not expect that our liability for the remaining sites will be material. We may receive additional claims that we are potentially liable for environmental investigation and remediation costs at other sites in the future. |
Our environmental expenditures in recent years have related to wastewater treatment systems, settlement of environmental litigation and remediation activities. We project that we will spend approximately $6.6 million in fiscal 2012 on capital projects and other expenditures in connection with environmental compliance for our existing businesses, primarily for compliance with wastewater treatment and remediation activities. We believe that our environmental matters for fiscal 2012 will not have a material adverse effect on our financial position or results of operations; however a number of factors may affect our environmental compliance costs or accruals. See “Item 1A. Risk Factors—We are subject to environmental regulation and environmental risks, which may adversely affect our business. Climate change or concerns regarding climate change may increase environmental regulation and environmental risks.”
In addition to our environmental compliance efforts, we are engaged in a variety of sustainability activities, including initiatives designed to reduce our use of energy and resources and to reduce our waste. Sustainability is also an area of interest for certain of our customers and consumers and, particularly in light of concerns regarding climate change, may become an area of increased focus. Additionally, sustainability and environmental matters are areas of increased legislative focus. See “Item 1A. Risk Factors—We are subject to environmental regulation and environmental risks, which may adversely affect our business. Climate change or concerns regarding climate change may increase environmental regulation and environmental risk,” “—Adverse weather conditions (caused by
10
Table of Contents
climate change or otherwise), natural disasters, pestilences and other natural conditions can affect crops and other inputs, which can adversely affect our operations and our results of operations” and “—The loss of a significant customer, certain actions by a significant customer or financial difficulties of a significant customer could adversely affect our results of operations.”
Seasonality; Working Capital
Our historical net sales generally have exhibited seasonality, with the first fiscal quarter typically having the lowest net sales. Lower levels of promotional activity, the availability of fresh produce, the timing of price increases and other factors have historically affected net sales in the first quarter. We have experienced increased sales of our fruit, vegetable, tomato and broth products during the back-to-school and holiday periods in the United States, extending from September through December, as well as during periods associated with the Easter holiday. We have also experienced increases in pet snacks sales during the year-end holiday period. We typically schedule promotional events to coincide with these periods of increased product consumption.
We typically use cash from operations in addition to our revolver to fund our working capital needs. Our quarterly operating results have varied in the past and are likely to vary in the future based upon a number of factors. Our working capital requirements are seasonally affected by the growing cycle of some of the products we process. Our inventory position for these products is also seasonally affected by this growing cycle. The vast majority of our fruit, vegetable and tomato inventories are produced during the harvesting and packing months of June through October and depleted through the last seven months of our fiscal year. Accordingly, the majority of our cash flow is generated in our third and fourth quarters as we sell inventory that was produced primarily in the first and second quarters. This seasonality factor also typically has an effect, but to a lesser extent, upon our results of operations. Pet products and broth are produced throughout the year.
Employees
As of May 1, 2011, we employed approximately 5,200 full-time employees in the U.S. and abroad. In addition, temporary seasonal workers are hired during our fruit, vegetable and tomato pack season, typically June through October, adding approximately 9,300 seasonal employees to our workforce during those months. We consider our relationship with our employees to be good.
As of May 1, 2011, we had 16 collective bargaining agreements with 15 union locals covering approximately 72% of our hourly full-time and seasonal employees. Of these employees, approximately 21% are covered under collective bargaining agreements scheduled to expire in fiscal 2012 and approximately 50% are covered under collective bargaining agreements scheduled to expire in fiscal 2013. These agreements are subject to negotiation and renewal. Failure to renew any of our significant collective bargaining agreements could result in a strike or work stoppage that could materially adversely affect our operations.
| Item 1A. | Risk Factors |
Factors that May Affect Our Future Results
We are subject to many risks and uncertainties (including, without limitation, our results of operations and cash flows). Some of the risks and uncertainties that may cause our financial performance, business or operations to vary or that may materially or adversely affect our financial performance are discussed below. The risks and uncertainties described in this Annual Report on Form 10-K are not the only ones facing us. Additional risks and uncertainties that currently are not known to us or that we currently believe are immaterial also may adversely affect our financial performance, business or operations.
Our substantial indebtedness could adversely affect our operations and financial condition.
As of May 1, 2011, we had a total of $4,008.6 million of indebtedness, primarily relating to $1,300.0 million aggregate principal amount of 7.625% Senior Notes due 2019 (the “Notes”) and $2,700.0 million outstanding under a senior secured term loan credit agreement, dated as of March 8, 2011 (the “Term Loan Facility”). Additionally, as of May 1, 2011, we had $506.2 million of availability under a $750 million senior secured asset-based revolving facility (the “ABL Facility” and, together with the Term Loan Facility, the “Credit Facilities”). Our high level of indebtedness could have important consequences, such as:
| • | making it more difficult to satisfy our obligations with respect to our outstanding debt; |
| • | requiring a substantial portion of our cash flows to be dedicated to debt service payments instead of other purposes, thereby reducing the amount of cash flows available to fund growth, working capital, capital expenditures, investments or acquisitions, debt service requirements or other cash requirements; |
| • | reducing our flexibility to adjust to changing business conditions and increasing our vulnerability to adverse changes in general economic, industry and competitive conditions; |
11
Table of Contents
| • | exposing us to the risk of increased interest rates as certain of our borrowings, including borrowings under our Credit Facilities, are at variable rates of interest; |
| • | limiting our ability to obtain additional financing to fund growth, working capital, capital expenditures, investments or acquisitions, debt service requirements or other cash requirements; |
| • | placing us at a disadvantage compared to other, less leveraged competitors; and |
| • | increasing our cost of borrowing. |
If our cash from operations is not sufficient to meet our operating needs, expenditures and debt service obligations, our business would be adversely impacted. Additionally, we may be required to refinance our debt, sell assets, borrow additional money or raise equity. We may be unable to take such actions on acceptable terms or at all.
Our ability to generate cash to meet our operating needs, expenditures and debt service obligations will depend on our future performance and financial condition, which will be affected by financial, business, economic, legislative, regulatory and other factors, including potential changes in costs, pricing, the success of product innovation and marketing, pressure from competitors, consumer preferences and other matters discussed in this Annual Report on Form 10-K (including this “Risk Factors” section). If our cash flow and capital resources are insufficient to fund our debt service obligations and other cash needs, we could face substantial liquidity problems and could be forced to reduce or delay investments and capital expenditures or to dispose of material assets or operations, seek additional debt or equity capital or restructure or refinance our indebtedness. The Credit Facilities and indenture governing the Notes may restrict our ability to take these actions and we may not be able to effect any such alternative measures on commercially reasonable terms or at all. Even if we are successful in taking any such alternative actions, such actions may materially and adversely affect our financial position and results of operations and such actions may not allow us to meet our scheduled debt service obligations.
If we cannot make scheduled payments on our debt, we will be in default and holders of the Notes could declare all outstanding principal and interest to be due and payable, the lenders under the ABL Facility could terminate their commitments to loan money, and our secured lenders under the ABL Facility and Term Loan Facility could declare all outstanding principal and interest to be due and payable and foreclose against the assets securing their borrowings and we could be forced into bankruptcy or liquidation.
Restrictive covenants in the Credit Facilities and the indenture governing the Notes may restrict our operational flexibility. If we fail to comply with these restrictions, we may be required to repay our debt, which would materially and adversely affect our financial position and results of operations.
The Credit Facilities and the indenture governing the Notes include certain restrictive covenants that impose significant operating and financial restrictions on us and may limit our ability to engage in acts that may be in our best interests, such as making strategic acquisitions or investments or otherwise pursuing business opportunities that may be in our interests. These covenants include restrictions on our ability to:
| • | incur additional indebtedness and guarantee indebtedness; |
| • | pay dividends or make other distributions in respect of, or repurchase or redeem, stock and warrants, options or other rights to acquire stock; |
| • | prepay, redeem or repurchase certain debt; |
| • | make loans, investments and other restricted payments; |
| • | sell or otherwise dispose of assets; |
| • | incur liens; |
| • | enter into transactions with affiliates; |
| • | alter the businesses we conduct; |
12
Table of Contents
| • | enter into agreements restricting our subsidiaries’ ability to pay dividends; and |
| • | consolidate, merge or sell all or substantially all of our assets. |
In addition, the ABL Facility requires that we maintain an adjusted fixed charge coverage ratio of 1.0 to 1.0 for periods during which we have borrowed a significant majority of the available amounts under the ABL Facility. Our ability to meet this financial ratio will depend upon our future performance and may be affected by events beyond our control (including factors discussed in this “Risk Factors” section). We may not be able to comply with this ratio.
A breach of the covenants in the Credit Facilities or the indenture governing the Notes could result in an event of default under the applicable indebtedness. Such a default may allow the creditors to accelerate the related debt and may result in the acceleration of any other debt to which a cross-acceleration or cross-default provision applies. In addition, an event of default under the Credit Facilities would permit the lenders under our ABL Facility to terminate all commitments to extend further credit under that facility. Furthermore, if we were unable to repay the amounts due and payable under the Credit Facilities, those lenders could proceed against the collateral granted to them to secure that indebtedness. In the event our lenders or noteholders accelerate the repayment of our borrowings, we may not have sufficient assets to repay that indebtedness, which would materially and adversely affect our financial position and results of operations.
Despite our significant indebtedness, we may still be able to incur substantially more debt in the future. This could further exacerbate the risks to our financial condition and business described above.
We may be able to incur significant additional indebtedness in the future. For example, as of May 1, 2011, we had $506.2 million of availability under our ABL Facility. Although the Credit Facilities and the indenture governing the Notes contain restrictions on the incurrence of additional indebtedness, these restrictions are subject to a number of qualifications and exceptions, and the additional indebtedness incurred in compliance with these restrictions could be substantial. These restrictions also will not prevent us from incurring obligations that do not constitute indebtedness. In addition, our ABL Facility could be increased, subject only to the consent of the new or existing lenders providing such increases, such that the aggregate principal amount of commitments under the ABL Facility does not exceed $1,000.0 million. We also can incur up to an additional $500.0 million of secured indebtedness under the Term Loan Facility if certain specified conditions are met, subject also to the consent of the new or existing lenders providing such additional loans. If our current debt level increases, the related risks we face could intensify.
Our variable rate indebtedness subjects us to interest rate risk, which could cause our debt service obligations to increase significantly.
Borrowings under our Credit Facilities are at variable rates of interest and expose us to interest rate risk. If interest rates increase, our debt service obligations on the variable rate indebtedness will increase even though the amount borrowed remained the same, and our net income and cash flows, including cash available for servicing our indebtedness, will correspondingly decrease. Assuming indebtedness of $3,206.2 million under our Credit Facilities (reflecting the $2,700.0 million of borrowings under the Term Loan Facility and the $506.2 million available under the ABL Facility as of May 1, 2011), and taking into account our interest rate swap in effect as of May 1, 2011 as described under “Item 7A. Quantitative and Qualitative Disclosures about Market Risk,” each quarter point change in interest rates would result in an $1.3 million change in annual interest expense on our indebtedness under the ABL Facility and, if interest rates rise above the LIBOR floor of 1.50%, each quarter point change in interest rates would result in a $6.0 million change in annual interest expense on our indebtedness under the Term Loan Facility. We have additional interest rate swaps that are not currently in effect. In the future, we may enter into additional interest rate swaps that involve the exchange of floating for fixed rate interest payments in order to reduce interest rate volatility. However, we may not maintain interest rate swaps with respect to all of our variable rate indebtedness, and any swaps we enter into (including our existing swaps) may not fully mitigate our interest rate risk, may prove disadvantageous, or may create additional risks, including risks discussed elsewhere in this “Risk Factors” section.
13
Table of Contents
If the financial institutions that are part of the syndicate of our ABL Facility fail to extend credit under our facility or reduce the borrowing base under our ABL Facility, our liquidity and results of operations may be adversely affected.
We plan to use the ABL Facility, in part, to fund our seasonal working capital needs, and accordingly, our need to draw on the ABL Facility fluctuates significantly during the year. Each financial institution that is part of the syndicate for our ABL Facility is responsible on a several, but not joint, basis for providing a portion of the loans to be made under our facility. If any participant or group of participants with a significant portion of the commitments in our ABL Facility fails to satisfy its or their respective obligations to extend credit under the facility and we are unable to find a replacement for such participant or participants on a timely basis (if at all), our liquidity may be adversely affected. In addition, the financial institutions that are part of the syndicate of our ABL Facility may reduce the borrowing base under our ABL Facility in certain circumstances. If our liquidity under our ABL Facility is materially adversely impacted, particularly during the harvesting and packing months of June through October when we have our highest cash needs, our results of operations could be materially adversely affected.
Cash generated by our subsidiaries may be unavailable to satisfy our indebtedness.
As of May 1, 2011, none of our subsidiaries were guarantors of the Notes or our other indebtedness. Unless they are guarantors of the Notes or our other indebtedness, our subsidiaries do not have any obligation to pay amounts due on the Notes or our other indebtedness or to make funds available for that purpose. Our subsidiaries may not be able to, or may not be permitted to, make distributions to enable us to make payments in respect of our indebtedness. Each subsidiary is a distinct legal entity, and, under certain circumstances, legal, practical and contractual restrictions may limit our ability to obtain cash from our subsidiaries.
The pet product and food product categories in which we participate are highly competitive and, if we are not able to compete effectively, our results of operations could be adversely affected.
The pet product and food product categories in which we participate are highly competitive. There are numerous brands and products that compete for shelf space and sales, with competition based primarily on quality, breadth of product line, brand awareness, innovation, price, taste, nutrition, variety, packaging and value-added customer services such as inventory management services. We compete with a significant number of companies of varying sizes, including divisions or subsidiaries of larger companies. Our branded products face strong competition from private label products that are generally sold at lower prices, imports, other national and regional brands and fresh and frozen alternatives. The impact of price gaps between our products and private label products may be particularly acute in our Consumer Products segment, where significant price gaps may result in share erosion and harm our business. A number of our competitors have broader product lines, substantially greater financial and other resources and/or lower fixed costs than we have. Our competitors may succeed in developing new or enhanced products that are more attractive to customers or consumers than ours. These competitors may also prove to be more successful in marketing and selling their products than we are; and may be better able to increase prices to reflect cost pressures. We may not compete successfully with these other companies or maintain or grow the distribution of our products. We cannot predict the pricing or promotional activities of our competitors or whether they will have a negative effect on us. Many of our competitors engage in aggressive pricing and promotional activities. There are competitive pressures and other factors which could cause our products to lose market share or decline in sales or result in significant price or margin erosion, which would have a material adverse effect on our business, financial condition and results of operations.
We may be unable to successfully introduce new products, reposition existing products or anticipate changes in pet or consumer preferences, which could adversely affect our results of operations.
Our future business and financial performance depend, in part, on our ability to successfully introduce new products and improved products, reposition existing products, and anticipate and offer products that appeal to the changing tastes, dietary habits and trends and product packaging preferences of consumers and, their pets, in the market categories in which we compete. Innovation may be particularly important in our Pet Products segment, where innovation plays a significant role in the competitive landscape and is a significant driver of sales and share growth in the pet food and pet snacks categories in which we compete. We cannot be certain that opportunities for product innovation will exist or that we will be able to successfully introduce new products or reposition existing products. We incur significant development and marketing costs in connection with the introduction of new products or repositioning of existing products. Successfully launching and selling new products puts pressure on our sales and marketing resources, and we may fail to invest sufficient funds behind a new product introduction to make it successful. If customers and consumers do not accept a new product, then the introduction of a new product can reduce our operating income as introduction costs, including slotting fees, may exceed revenues. If we are not able to anticipate, identify or develop and market products that respond to changes in pet or
14
Table of Contents
consumer preferences or if our new product introductions or repositioned products fail to gain consumer acceptance, we may not grow our business as anticipated. Additionally, demand for our products could decline and our results of operations could be adversely affected.
Our success depends in part upon our ability to persuade consumers to purchase our branded products versus lower-priced branded and private-label offerings. During economic downturns, consumers may be less willing or able to pay a price premium for our branded products and may shift purchases to lower-priced or other value offerings, which may adversely affect our results of operations.
Our branded products generally command a price premium as compared to the prices of the private-label products with which they compete. Additionally, our branded products in our Consumer Products segment generally command a price premium as compared to the prices of the branded products with which they compete. The current premium for our products may limit our ability to effectively implement price increases. Additionally, these price premiums may increase in the future, particularly if we implement price increases. The willingness of consumers to pay a price premium for our branded products depends on a number of factors, including the effectiveness of our marketing programs, the continuing strength of our brands and general economic conditions. During periods of challenging economic conditions, consumers may be less willing or able to pay a price differential for our branded products, notwithstanding our marketing programs or the strength of our brands, and may shift purchases away from our branded products to lower-priced offerings or forgo purchases of our products altogether. If the price premium for our branded products exceeds the amount consumers are willing to pay, whether due to economic conditions or otherwise, our sales would suffer and our revenues and results of operations could be adversely affected. In addition consumers may migrate to higher-value, larger-sized packages of our branded products (which tend to have lower margins than our smaller-sized offerings), which could also have an adverse effect on our results of operations.
If we are unable to maintain or increase prices for our products, our results of operations may be adversely affected.
We rely in part on price increases to neutralize cost increases and improve the profitability of our business. We have implemented significant price increases for our products in recent years. For example, in fiscal 2009, price increases to address inflationary pressures accounted for a 12.4% increase in net sales while volume and mix made up the other 1.7% increase in net sales. Our ability to effectively implement price increases or otherwise raise prices for our products can be affected by a number of factors, including competition, aggregate industry supply, category limitations, market demand and economic conditions, including inflationary pressures. During challenging economic times, our ability to increase the prices of our products may be particularly constrained. Additionally, customers may pressure us to rescind price increases that we have announced or already implemented (either through a change in list price or increased promotional activity). If we are unable to maintain or increase prices for our products (or must increase promotional activity), our results of operations could be adversely affected. Furthermore, price increases generally result in volume losses, as consumers purchase fewer units. If such losses (also referred to as the elasticity impact) are greater than expected or if we lose distribution due to a price increase (which may result from a customer response or otherwise), our results of operations could be adversely affected.
We may not be able to successfully implement initiatives to improve productivity and streamline operations to control or reduce costs. Failure to implement such initiatives could adversely affect our results of operations.
Because our ability to effectively implement price increases for our products can be affected by factors outside of our control, our profitability and growth depend significantly on our efforts to control our operating costs. Because many of our costs, such as energy and logistics costs, packaging costs and ingredient, commodity and raw product costs, are affected by factors outside or substantially outside our control, we generally must seek to control or reduce costs through operating efficiency or other initiatives. For example, in fiscal 2008, we realigned the manufacture of certain of our dry pet food products, enabling us to reduce the number of miles we had to ship such products, which in turn improved our cost structure. Such initiatives are important to our success. If in the future we are not able to identify and complete additional initiatives designed to control or reduce costs and increase operating efficiency on time or within budget, our results of operations could be adversely impacted. In addition, if the cost savings initiatives we have implemented to date, or any future cost-savings initiatives, do not generate expected cost savings, our results of operations could be adversely affected.
15
Table of Contents
The inputs, commodities, ingredients and other raw materials that we require are subject to price increases and shortages that could adversely affect our results of operations.
The primary inputs, commodities, ingredients and other raw materials that we use include energy (including natural gas), fuel, packaging, fruits, vegetables, tomatoes, grains (including corn), sugar, spices, meats, meat by-products, soybean meal, water, fats, oils and chemicals. Prices for these and other items we use may be volatile and we may experience shortages in these items due to factors beyond our control, such as commodity market fluctuations, availability of supply, increased demand (whether for the item we require or for other items, which in turn impacts the item we require), weather conditions, natural disasters, currency fluctuations, governmental regulations (including import restrictions), agricultural programs or issues, energy programs, labor strikes and the financial health of our suppliers. Input, commodity, ingredient and other raw material price increases or shortages may result in higher costs or interrupt our production schedules, each of which could have a material adverse affect on our results of operations. Production delays could lead to reduced sales volumes and profitability as well as loss of market share. Higher costs could adversely impact our earnings. For example, fuel prices affect our transportation costs for both raw materials and finished product and natural gas prices also affect our production costs. If we are not able to implement our productivity initiatives or increase our product prices to offset price increases of our inputs, commodities, ingredients and other raw materials, as a result of consumer sensitivity to pricing or otherwise, or if sales volumes decline due to price increases, our results of operations could be adversely affected. Our competitors may be better able than we are to implement productivity initiatives or effect price increases or to otherwise pass along cost increases to their customers. Moreover, if we increase our prices in response to increased costs, we may need to increase marketing spending, including trade promotion spending, in order to retain our market share. Such increased marketing spending may significantly offset the benefits, if any, of any price increase and negatively impact our results of operations.
Increases in logistics and other transportation-related costs could materially adversely impact our results of operations. Our ability to competitively serve our customers depends on the cost and availability of reliable transportation.
Logistics and other transportation related costs have a significant impact on our earnings and results of operations. We use multiple forms of transportation to bring our products to the market. They include ships, trucks, intermodals and railcars. Disruption to the timely supply of these services or increases in the cost of these services for any reason, including availability or cost of fuel, regulations affecting the industry, service failures by our third-party logistics service provider, or natural disasters (which may impact the transportation infrastructure or demand for transportation services), could have an adverse effect on our ability to serve our customers, and could have a material adverse effect on our financial performance.
If our assessments and assumptions about commodity prices, as well as ingredient and other prices and interest and currency exchange rates, prove to be incorrect in connection with our hedging or forward-buy efforts or planning cycles, our costs may be greater than anticipated and our financial results could be adversely affected. Volatility in interest rates, commodities and other hedged items will impact our results of operations.
We generally use commodity futures and options to reduce the price volatility associated with anticipated commodity purchases of corn, wheat and soybean meal used in the production of certain of our products. Additionally, we have hedging programs relating to interest rates, currency, natural gas and diesel fuel. See “Item 7A. Quantitative and Qualitative Disclosures about Market Risk” for a discussion of our current hedging and derivatives programs. We may cease any of our current programs or use other hedging or derivative programs in the future. The extent of our hedges at any given time depends on our assessment of the markets for these commodities, diesel fuel, natural gas, and capital, including our assumptions about future prices, currency exchange rates and interest rates. For example, if we believe market prices for the commodities we use are unusually high, we may choose to hedge less, or even none, of our upcoming requirements. If we fail to hedge and prices, interest rates or currency exchange rates subsequently increase, or if we institute a hedge and prices, interest rates or currency exchange rates subsequently decrease, our costs may be greater than anticipated or greater than our competitors’ costs and our financial results could be adversely affected. Additionally, changes in the value of our commodities and other derivatives accounted for as economic hedges are recorded directly as other income or expense. As of May 1, 2011, all our hedges were accounted for as economic hedges and we currently expect to continue such practice. Accordingly, volatility in interest rates, commodities and other hedged items could result in volatility in our results of operations.
16
Table of Contents
Our success depends in part on our ability to grow our pet products business.
Our current strategy for growing our business includes efforts to expand our pet products business sales. Our efforts to grow in this area include product innovation and marketing efforts, which carry risks discussed elsewhere in this “Risk Factors” section.
The loss of a significant customer, certain actions by a significant customer or financial difficulties of a significant customer could adversely affect our results of operations.
A relatively limited number of customers account for a large percentage of our total sales. During the twelve months ended May 1, 2011, our top customer, Walmart (including Walmart’s stores and supercenters as well as SAM’S CLUB), represented approximately 34% of our overall list sales, which approximates our gross sales, and an even higher percentage of sales of our Pet Products business. Our ten largest customers represented approximately 63% of our overall list sales. These percentages may increase if there is consolidation among existing food retailers or if mass merchandisers grow disproportionately to their competition. We expect that a significant portion of our revenues will continue to be derived from a small number of customers; however, there can be no assurance that these customers will continue to purchase our products in the same quantities as they have in the past. Our customers are generally not contractually obligated to purchase from us. Customers typically make purchase decisions based on a combination of price, product quality, consumer demand, customer service performance, their desired inventory levels and other factors. Competition may be particularly intense where a customer (such as a club store) typically carries only one of a particular type of product or uses a bid process. Our sales volume could decrease if we fail to win a bid and lose the ability to distribute our products, even temporarily, through such customer. Changes in our customers’ strategies, including a reduction in the number of brands they carry, shipping strategies, a shift of shelf space to or increased emphasis on private label products (including “store brands”), or a reduction in shelf space for core grocery items may adversely affect our sales. Requirements that may be imposed on us by our customers, such as sustainability, inventory management or product specification requirements, may have an adverse effect on our results of operations. Additionally, our customers may face financial difficulties, bankruptcy or other business disruptions that may impact their operations and their purchases from us and may affect their ability to pay us for products purchased from us. During economic downturns, our customers may be more susceptible to experiencing any of the foregoing conditions. If our customers experience financial difficulties (including difficulty accessing funds necessary to operate their businesses), bankruptcy or other business disruptions because of economic conditions or otherwise, our customers could reduce or cease purchases of our products, discontinue operations, or delay payment, or fail to pay, for products purchased, each of which could adversely affect our results of operations. In addition, to the extent that any customer seeks protection under the bankruptcy laws, such customer may seek return of moneys already paid to us. If our sales of products to one or more of our significant customers are reduced, this reduction could have a material adverse effect on our business, financial condition and results of operations.
Transformative plans involve risk and may adversely affect our business and financial results.
We may in the future contemplate and adopt plans intended to effect significant change within our Company. For example, in fiscal 2008, we completed a two-year transformation plan for which we incurred significant costs. Our future plans, if any, may, but need not, involve closure or disposal of plants, distribution centers, businesses or other assets as well as headcount reductions or reductions in our number of product offerings, which could increase our expenses and adversely affect our results of operations. Divesting plants, distribution centers, businesses or other assets or changes in strategy may also adversely impact our results of operations due to related write-offs or the acceleration of remediation expenses or due to the loss of operating income that may be associated with any such disposed business. Additionally, restructuring or disposition efforts may divert management’s and other employees’ attention from other business concerns or may otherwise disrupt our business. We may be unable to complete dispositions we may desire to undertake at targeted prices, if at all, which may adversely impact our financial results and our ability to implement our business strategies.
We may not be successful in our future acquisition or other strategic transaction endeavors, if any, which could have an adverse effect on our business and results of operations.
We have historically engaged in acquisition activity and we may in the future engage in acquisitions or other strategic transactions, such as joint ventures or investments in other entities. We may be unable to identify suitable targets, opportunistic or otherwise, for acquisitions or other strategic transactions in the future. If we identify a suitable candidate, our ability to successfully implement the
17
Table of Contents
strategic transaction would depend on a variety of factors, including our ability to obtain financing on acceptable terms and to comply with the restrictions contained in our debt agreements. If we need to obtain our lenders’ consent to a strategic transaction, they may refuse to provide such consent or condition their consent on our compliance with additional restrictive covenants that limit our operating flexibility. Strategic transactions involve risks, including those associated with integrating the operations or maintaining the operations as separate (as applicable), financial reporting, disparate technologies and personnel of acquired companies, joint ventures or related companies; managing geographically dispersed operations, joint ventures or other strategic investments; the diversion of management’s attention from other business concerns; the inherent risks in entering markets or lines of business in which we have either limited or no direct experience; unknown risks; and the potential loss of key employees, customers and strategic partners of acquired companies, joint ventures or companies in which we may make strategic investments. We may not successfully integrate any businesses or technologies we may acquire or strategically develop in the future and may not achieve anticipated revenue and cost benefits relating to any such strategic transactions. Strategic transactions may be expensive, time consuming and may strain our resources. Strategic transactions may not be accretive and may negatively impact our results of operations as a result of, among other things, the incurrence of debt, write-offs of goodwill and amortization expenses of other intangible assets.
Pending shareholder suits could materially adversely impact our cash flow.
Del Monte Foods Company, its former directors, one of its former officers, and other parties, including Blue Merger Sub, Inc. (for which Del Monte Corporation is successor in interest), have been named as defendants in putative class action lawsuits brought by certain former Del Monte Foods Company stockholders challenging the Merger and seeking, among other things, injunctive relief, rescission of the Merger Agreement, compensatory damages, and attorneys’ fees. The named plaintiffs in each of these actions allege, among other claims arising from the Merger, that the former members of our board of directors breached their fiduciary duties. See “Legal Proceedings” for more information about these lawsuits. In connection with this litigation, we may make significant payments to or other settlements with the former stockholders of Del Monte Foods Company and their lawyers, and such payments or settlement arrangements could have a material adverse effect on our cash flow. In addition, other parties to such lawsuits have made, or may in the future make, demands against us for indemnification against losses arising from such lawsuits. If we are forced to make significant payments to resolve such demands, such payments could have a material adverse effect on our cash flow. Even if the pending shareholder lawsuits are not successful, the litigation could result in substantial costs, have a significant adverse impact on our reputation, divert management’s attention and resources, and have an adverse effect on our cash flow.
Government regulation could increase our costs of production and increase legal and regulatory expenses.
Manufacturing, processing, labeling, packaging, storing and distributing pet products and food products are activities subject to extensive federal, state and local regulation, as well as foreign regulation. In the United States, these aspects of our operations are regulated by the U.S. Food and Drug Administration (“FDA”), the United States Department of Agriculture (“USDA”) and various state and local public health and agricultural agencies. On January 4, 2011, the FDA Food Safety Modernization Act, which is intended to ensure food safety, was enacted. This Act provides direct recall authority to the FDA and includes a number of other provisions designed to enhance food safety, including increased inspections by the FDA of domestic and foreign food facilities and increased review of food products imported into the United States. In addition to periodic government agency inspections affecting our operations generally, our operations, which produce meat and poultry products, are subject to mandatory continuous on-site inspections by the USDA. Complying with government regulation, including federal Country of Origin Labeling (“COOL”) requirements, can be costly or may otherwise adversely affect our business. For example, legislation has been adopted in various jurisdictions in the United States to regulate bisphenol-A (which is an odorless, tasteless food-grade chemical commonly used in the food industry to coat the interior of cans). Additionally, legislation to eliminate the use of bisphenol-A from all food and beverage containers was introduced earlier in the current session of Congress. Although the FDA currently allows the use of bisphenol-A in food packaging materials, the FDA has called for further research on bisphenol-A and may in the future change its position on bisphenol-A. If legislation or other regulations are enacted restricting the use of bisphenol-A or requiring us to provide warnings regarding bisphenol-A under, for example, California’s Proposition 65, our costs of production could increase or our sales could be adversely affected. Alternatives to bisphenol-A may be costly or less effective, which could adversely affect our results of operations. There is no assurance that alternative packaging, if any, will maintain the current shelf life of our products. Other chemicals and substances that may be found, or may be purported to be found, in our products, including minerals such as lead, are already listed under Proposition 65. Additionally, other chemicals and substances that may be found in our products have also been proposed for listing under Proposition 65. Failure to comply with all applicable laws and regulations, including, among others, Proposition 65, could subject us to civil remedies, including fines, injunctions, recalls or seizures, as well as potential criminal sanctions, which could
18
Table of Contents
have a material adverse effect on our business, financial condition and results of operations. Our business is also affected by import and export controls and similar laws and regulations, both in the United States and elsewhere. Issues such as national security or health and safety, which slow or otherwise restrict imports or exports, could adversely affect our business. In addition, the modification of existing laws or regulations or the introduction of new laws or regulations could require us to make material expenditures or otherwise adversely affect the way that we have historically operated our business.
Concerns regarding bisphenol-A used in food packaging could adversely affect our business.
Although the FDA currently allows the use of bisphenol-A in food packaging materials, public reports and concerns regarding the potential hazards of bisphenol-A could contribute to a perceived safety risk for products packaged using bisphenol-A and adversely affect our sales and results of operations. Discussions, stories, concerns and warnings regarding bisphenol-A appear in various media outlets and other venues. We may be adversely affected by this publicity as well as any future warnings, guidance, recommendations, developments or publicity. Additionally, we are subject to the risks discussed further in “—Government regulation could increase our costs of production and increase legal and regulatory expenses” and in “—If our products are alleged to cause injury or illness or fail to comply with governmental regulations, we may suffer adverse public relations, need to recall our products and experience product liability claims.”
A change in the assumptions used to value our reporting units or our indefinite-lived intangible assets could result in goodwill or other intangible asset impairment charges, which would adversely affect our results of operations.
As of May 1, 2011, our goodwill was comprised of $1,980.2 million related to our pet products reporting unit and $143.8 million related to our consumer products reporting unit. We typically test goodwill of our pet products and consumer products reporting units for impairment at least annually. Events indicative of a potential impairment (such as a decrease in the cash flow relating to a reporting unit) may cause us to perform additional tests for impairment and may also cause us to change our judgments or assumptions. Goodwill is considered impaired if the book value of the reporting unit containing the goodwill exceeds its estimated fair value. For goodwill, we determine the estimated fair value of a reporting unit using the income approach (which is based on the cash flows the reporting unit is expected to generate over its remaining life) and the market approach (which is based on market multiples of similar businesses). As of May 1, 2011, the book value of our capitalized brand names that we have determined have indefinite lives (“Non-Amortizing Brands”) was $1,871.6 million. We typically test our Non-Amortizing Brands for impairment at least annually. Events indicative of a potential impairment (such as a significant decline in the expected sales associated with a brand) may cause us to perform additional tests for impairment. Non-Amortizing Brands are considered impaired if the book value for the brand exceeds its estimated fair value. We determine the estimated fair value of a Non-Amortizing Brand using the relief from royalty method (which is based upon the estimated rent or royalty we would pay for the use of a brand name if we did not own it). Considerable judgment by us is necessary in estimating future cash flows, market interest rates, discount factors, and other factors used in the income approach, market approach or relief from royalty method used to value goodwill and other intangible assets. Many of these factors reflect our assumptions regarding the future performance of our businesses, which may be impacted by risks discussed elsewhere in this “Risk Factors” section. If we materially change our judgments or assumptions used in valuing our goodwill or other intangible assets in connection with any future impairment tests, we may conclude that the estimated fair value of the goodwill or Non-Amortizing Brand (as applicable) is less than the book value. This would result in a write down of the goodwill or Non-Amortizing Brand book value to the estimated fair value and recognition of an impairment charge. Any such impairment charge would adversely affect our earnings and could be material.
Our operating results depend, in part, on the sufficiency and effectiveness of our marketing and trade spending programs.
In general, due to the highly competitive nature of the businesses in which we compete, we must execute effective and efficient trade spending programs and marketing investments with respect to our businesses overall to sustain our competitive position in our markets. Marketing investments may be costly. For example, in the twelve months ended May 1, 2011, our marketing expense in selling, general and administrative expenses was $140.2 million and, in fiscal 2010, our marketing expense was $216.8 million, an increase of 54.2% over fiscal 2009. Additionally, we may, from time to time, change our marketing and trade spending strategies, including the timing or nature of our related promotional programs. The sufficiency and effectiveness of our marketing and trade spending practices is important to our ability to retain or improve our market share or margins. If our marketing and trade spending programs are not successful or if we fail to implement sufficient and effective marketing and trade spending programs, our business, results of operations and financial condition may be adversely affected.
19
Table of Contents
Adverse weather conditions (caused by climate change or otherwise), natural disasters, pestilences and other natural conditions can affect crops and other inputs, which can adversely affect our operations and our results of operations.
The commodities, ingredients and raw materials that we use in the production of our products (including, among others, fruits, vegetables, tomatoes and grain) are vulnerable to adverse weather conditions and natural disasters, such as floods, droughts, frosts, earthquakes and pestilences. Adverse weather conditions may be impacted by climate change and other factors. Adverse weather conditions and natural disasters can reduce crop size and crop quality, which in turn could reduce our supplies of raw materials, lower recoveries of usable raw materials, increase the prices of our raw materials, increase our cost of storing raw materials if harvests are accelerated and processing capacity is unavailable, or interrupt or delay our production schedules if harvests are delayed. For example, our tomato suppliers are located in California, which experiences drought conditions from time to time. Additionally, the growth of crops, as well as the manufacture and processing of our products, requires significant amounts of water. Drought or other causes of a reduction of water in aquifers may affect availability of water, which in turn may adversely affect our results of operations. Competing manufacturers may be affected differently by weather conditions and natural disasters depending on the location of their supplies or operations. If our supplies of raw materials are reduced, we may not be able to find enough supplemental supply sources on favorable terms, if at all, which could impact our ability to supply product to our customers and adversely affect our business, financial condition and results of operations. Increased costs for raw materials or other inputs could also adversely affect our business, financial condition and results of operations as described in “—The inputs, commodities, ingredients and other raw materials that we require are subject to price increases and shortages that could adversely affect our results of operations.”
Natural disasters can disrupt our operations, which could adversely affect our results of operations.
A natural disaster such as an earthquake, tornado, fire, flood, or severe storm or other catastrophic event affecting our operating activities or major facilities, could cause an interruption or delay in our business and loss of inventory and/or data or render us unable to accept and fulfill customer orders in a timely manner, or at all. We are particularly susceptible to earthquakes as our executive offices, our research centers, and some of our fruit, vegetable and tomato operations are located in California where earthquakes periodically occur. Additionally, some of our pet operations are located in places where tornados periodically occur, such as Alabama and Kansas. If our operations are damaged by an earthquake, tornado or other disaster, we may be subject to supply interruptions, destruction of our facilities and products or other business disruptions, which could adversely affect our business and results of operations.
If ingredients or other raw materials we use in our products are contaminated, our results of operations could be adversely affected.
We buy ingredients, commodities and other raw materials that we use in producing our products from third party suppliers. If these materials are alleged or prove to include contaminants affecting the safety or quality of our products, we may need to find alternate materials for our products, delay production of our products, or discard or otherwise dispose of our products, which could adversely affect our results of operations. Additionally, if the presence of such contaminants are not alleged or discovered until after the affected product has been distributed, we may need to withdraw or recall the affected product and we may experience adverse publicity or product liability claims. In either case, our results of operations could be adversely affected.
If our products are alleged to cause injury or illness or fail to comply with governmental regulations, we may suffer adverse public relations, need to recall our products and experience product liability claims.
We may be exposed to product recalls, including voluntary recalls or withdrawals, and adverse public relations if our products are alleged to cause injury or illness or if we are alleged to have mislabeled or misbranded our products or otherwise violated governmental regulations. We may also voluntarily recall or withdraw products that we consider below our standards, whether for taste, appearance or otherwise, in order to protect our brand reputation. For example, in March 2007, we initiated a recall of a number of our pet food and pet snack products. Consumer concerns (whether justified or not) regarding the safety of our products could
20
Table of Contents
adversely affect our business. A product recall or withdrawal could result in substantial and unexpected expenditures, destruction of product inventory, and lost sales due to the unavailability of the product for a period of time, which could reduce profitability and cash flow. In addition, a product recall or withdrawal may require significant management attention. Product recalls may also result in adverse publicity, hurt the value of our brands, lead to a decline in consumer confidence in and demand for our products, and lead to increased scrutiny by federal and state regulatory agencies of our operations, which could have a material adverse effect on our brands, business, results of operations and financial condition. We also may be subject to product liability claims and adverse public relations if consumption, use or opening of our products is alleged to cause injury or illness. While we carry product liability insurance, our insurance may not be adequate to cover all liabilities we may incur in connection with product liability claims. For example, punitive damages are generally not covered by insurance. In addition, we may not be able to continue to maintain our existing insurance, obtain comparable insurance at a reasonable cost, if at all, or secure additional coverage (which may result in future product liability claims being uninsured). A product liability judgment against us or our agreement to settle a product liability claim could also result in substantial and unexpected expenditures, which would reduce profitability and cash flow. In addition, even if product liability claims against us are not successful or are not fully pursued, these claims could be costly and time-consuming and may require management to spend time defending the claims rather than operating our business. Product liability claims (even if unmerited or unsuccessful), or any other events that cause consumers to no longer associate our brands with high quality and safe products, may hurt the value of our brands and lead to decreased demand for our products. Product liability claims may also lead to increased scrutiny by federal and state regulatory agencies and could have a material adverse effect on our brands, business, results of operations and financial condition.
Inventory production in our Consumer Products operating segment is highly seasonal. Interference with our production schedule during peak months or inventory shortages could negatively impact our results of operations.
We do not manufacture the majority of our fruit, vegetable and tomato products continuously throughout the year, but instead have a seasonal production period that is limited to approximately three to four months primarily during the summer each year. We refer to this period as the “pack season.” An unexpected plant shutdown or any other material interference with our production schedule for any reason could adversely affect our results of operations. For most of our fruit, vegetable and tomato products, the inventory created during the pack season, plus any inventory carried over from the previous pack season, determines the quantity of inventory we have available for sale until the next pack season commences. The size of the pack is influenced by crop results, which is affected by weather and other factors. Similarly, the timing of the pack season depends upon crop timing, which in turn is affected by weather and other factors. In the event that the inventory produced during the pack season is less than desired, or if the new pack season is delayed, or if demand for product is greater than forecasted, we may be required to “allocate” or limit sales of some items to customers in an effort to stretch supplies until the new pack season begins and new product is available. We could also experience inventory shortages in the event of can or end defects, whether discovered during the pack season or thereafter, or other factors. In the event we are required to allocate or limit sales of some items, we may lose sales volume and market share, our customer relationships may be harmed, and our results of operations may be adversely impacted. Alternatively, inventory produced may be greater than desired leading to excess inventory, which may adversely affect our working capital and margins.
Disruption of our supply chain could adversely affect our business and results of operations.
Our ability and the ability of our suppliers, co-packers and other business partners to make, move and sell products are critical to our success. Damage or disruption to our or their manufacturing or distribution capabilities due to weather, natural disaster, fire, terrorism, pandemics, strikes or other reasons (including other reasons discussed elsewhere in this “Risk Factors” section) could impair our ability to manufacture or sell our products. Failure to take adequate steps to mitigate the likelihood or potential impact of such events, or to effectively manage such events if they occur, particularly when a product is sourced from a single supplier or location or if such events impact our seasonal pack, could adversely affect our business and results of operations.
We rely upon a number of third parties to manage or provide distribution centers for our products. Failures by these third parties could adversely affect our business.
A number of our distribution centers are managed by third parties. Additionally, we also use third-party distribution centers, which may distribute our products as well as the products of other companies. Activity at these distribution centers could be disrupted by a number of factors, including, labor issues, failure to meet customer standards, bankruptcy or other financial issues affecting the third party providers, or other matters affecting any such third party’s ability to service our customers effectively. Any disruption of these distribution centers could adversely affect our business.
21
Table of Contents
We rely primarily on a single company to provide us with logistics services and any failure by this provider to effectively service us could adversely affect our business.
Our logistics requirements in connection with transporting our products are handled primarily by a third-party logistics service provider. Such services include: scheduling and coordinating transportation of finished products to our distribution centers and customers; shipment tracking; freight dispatch services; transportation related payment services; and filing, collecting and resolving freight claims. Any sudden or unexpected disruption of these services for any reason could significantly disrupt our business.
We use a single national broker to represent a significant portion of our branded products to the retail grocery trade and any failure by the broker to effectively represent us would adversely affect our business.
We use a single national broker to represent a significant portion of our branded products to the retail grocery trade. Our business would suffer substantial disruption if this broker were to default in the performance of its obligations to perform brokerage services or if this broker fails to effectively represent us to the retail grocery trade. Changes in our sales strategy may impact this relationship.
To the extent our customers purchase product in excess of consumer consumption in any period, our sales in a subsequent period may be adversely affected as customers seek to reduce their inventory levels. To the extent customers seek to reduce their usual or customary inventory levels or change their willingness to purchase product in excess of consumer consumption, our sales may be adversely affected.
From time to time, customers may purchase more product than they expect to sell to consumers during a particular time period. Customers may grow their inventory in anticipation of, or during, our promotional events, which typically provide for reduced prices during a specified time or other customer or consumer incentives. Customers may also grow inventory in anticipation of a price increase for our products. If a customer increases its inventory during a particular reporting period as a result of a promotional event, anticipated price increase or otherwise, then sales during the subsequent reporting period may be adversely impacted as customers seek to reduce their inventory to usual levels. This effect may be particularly pronounced when the promotional event, price increase or other event occurs near the end or beginning of a reporting period or when there are changes in the timing of a promotional event, price increase or similar event, as compared to the prior year. To the extent customers seek to reduce their usual or customary inventory levels or change their practices regarding purchases in excess of consumer consumption, our sales and results of operations would be adversely impacted in that period.
We are subject to environmental regulation and environmental risks, which may adversely affect our business. Climate change or concerns regarding climate change may increase environmental regulation and environmental risks.
As a result of our agricultural and food processing operations, we are subject to numerous environmental laws and regulations. Many of these laws and regulations are becoming increasingly stringent and compliance with them is becoming increasingly expensive. Changes in environmental conditions may result in existing legislation having a greater impact on us. Additionally, we may be subject to new legislation and regulation in the future. For example, increasing concern about climate change may result in additional federal and state legal and regulatory requirements to reduce or mitigate the effects of green-house gas emissions. Compliance with environmental legislation and regulations, particularly if they are more aggressive than our current sustainability measures used to monitor our emissions and improve our energy efficiency, may increase our costs and adversely affect our results of operations. We cannot predict the extent to which any environmental law or regulation that may be enacted or enforced in the future may affect our operations. We have been named as a potentially responsible party (“PRP”) and may be liable for environmental investigation and remediation costs at some designated “Superfund Sites” under the Comprehensive Environmental Response, Compensation and Liability Act of 1980, as amended (“CERCLA”), or under similar state laws. We are defending ourselves in these actions as we believe appropriate. However, these matters may adversely impact our financial position or results of operations. We may in the future be named as a PRP at other currently or previously owned or operated sites, and additional remediation requirements could be imposed on us. We are currently conducting investigation and remedial activities at some locations, and other properties where we
22
Table of Contents
conduct or have conducted operations could be identified for investigation or proposed for listing under CERCLA or similar state laws in the future. Costs to investigate and remediate any such contamination could be material. Additionally, we will be required to conduct an investigation and, to the extent necessary, remedial activities at facilities in Terminal Island, CA. There can be no assurances that existing accruals will be sufficient to cover such activities. Also, under the Federal Food, Drug and Cosmetic Act and the Food Quality Protection Act of 1996, the U.S. Environmental Protection Agency is involved in a series of regulatory actions relating to the evaluation and use of pesticides in the food industry. The effect of these actions and future actions on the availability and use of pesticides could adversely impact our financial position or results of operations. If the cost of compliance with applicable environmental laws or regulations increases, our business and results of operations could be negatively impacted.
Failure by us or our third-party co-packers to comply with environmental or other regulations may disrupt our supply of certain products and adversely affect our results of operations.
Our production facilities and those of our co-packers, whether in the U.S. or overseas, are subject to a number of regulations, including environmental regulations. Failure by us or any of our co-packers to comply with regulations, or allegations of compliance failure, may disrupt our or their operations. Disruption of our operations or the operations of a co-packer could disrupt our supply of product, which could have an adverse effect on our net sales and other results of operations. Additionally, actions we may take to mitigate the impact of any such disruption or potential disruption, including increasing inventory in anticipation of a potential production interruption, may adversely affect our results of operations.
We rely upon co-packers to provide our supply of some products. Any failure by co-packers to fulfill their obligations could adversely affect our results of operations.
We have a number of supply agreements with co-packers that require them to provide us with specific finished products. For some of our products, including each of canned pineapple, mandarins, some fruit in plastic containers, some fruit in glass jars, some dog snack and pet food products and some of our broth products, we essentially rely upon a single co-packer as our sole-source for the product. We also anticipate that we will rely on sole suppliers for future products. The failure for any reason of any such sole-source or other co-packer to fulfill its obligations under the applicable agreements with us could result in disruptions to our supply of finished goods and have an adverse effect on our results of operations. Additionally, from time to time, a co-packer may experience financial difficulties, bankruptcy or other business disruptions, which could disrupt our supply of finished goods or require that we incur additional expense by providing financial accommodations to the co-packer or taking other steps to seek to minimize or avoid supply disruption, such as establishing a new co-pack arrangement with another provider. During an economic downturn, our co-packers may be more susceptible to experiencing such financial difficulties, bankruptcies or other business disruptions. A new co-pack arrangement may not be available on terms as favorable to us as the existing co-pack arrangement, if at all.
Volatility in the equity markets or interest rates could substantially increase our pension costs and have a negative impact on our results of operations.
We sponsor a qualified defined benefit pension plan and various other nonqualified retirement and supplemental retirement plans. The difference between plan obligations and assets, or the funded status of the defined benefit pension plan, significantly affects net periodic benefit costs of our pension plan and our ongoing funding requirements of that plan. The qualified defined benefit pension plan is funded with trust assets invested in a diversified portfolio of debt and equity securities and other investments. Among other factors, changes in interest rates, investment returns and the market value of plan assets can (i) affect the level of plan funding; (ii) cause volatility in the net periodic pension cost; and (iii) increase our future contribution requirements. In or following an economic environment characterized by declining investment returns and interest rates, we may be required to make additional cash contributions to our pension plan and recognize further increases in our net pension cost to satisfy our funding requirements. A significant decrease in investment returns or the market value of plan assets or a significant decrease in interest rates could increase our net periodic pension costs and adversely affect our results of operations. A significant increase in our contribution requirements with respect to our qualified defined benefit pension plan could have an adverse impact on our cash flow.
23
Table of Contents
Risk associated with foreign operations, including changes in import/export duties, wage rates, political or economic climates, or exchange rates, may adversely affect our operations.
Our foreign operations and relationships with foreign suppliers and co-packers, as well as our export of certain products (particularly pet products), subject us to the risks of doing business abroad. We are subject to the Foreign Corrupt Practice Act of 1977, as amended. As of May 1, 2011, three of our twenty production facilities were located abroad, eleven of our twenty-three co-packers were located in foreign locations. The countries from which we source our products and in which we have some facilities may be subject to political and economic instability, which may adversely affect our results of operations. For example, Venezuela (where we have one production facility) and Mexico (where we have two production facilities) are currently experiencing political and economic instability. For example, in Venezuela, the government has seized several food production facilities for allegedly skirting price controls. Given the political and economic instability in the region, the Venezuelan government may take actions that impact our operations. In Mexico, criminal activity has impacted the country’s logistics and infrastructure. Items produced by us in Mexico are sold primarily in the United States and the transportation and import of such products may be disrupted. Furthermore, foreign countries in which we produce our products as well as countries to which we export our products may periodically enact new or revise existing laws, taxes, duties, quotas, tariffs, currency controls or other restrictions to which we are subject, which may adversely affect our business. Other events that disrupt foreign production, sourcing, or transportation (such as labor unrest) or generate consumer concerns (whether justified or not) regarding foreign-produced products could also adversely affect our business. Finally, our products are subject to import duties and other restrictions, and the United States government may periodically impose new or revise existing duties, quotas, tariffs or other restrictions to which we are subject, which may adversely affect our business.
We may be exposed to counterparty risk in our currency, interest rate and commodity hedging arrangements.
From time to time we enter into arrangements with financial institutions to hedge our exposure to fluctuations in currency and interest rates, including forward contracts and swap agreements. Additionally, in the future, we may enter into arrangements with financial institutions and other counterparties to hedge our exposure to fluctuations in commodity prices, including swap agreements, as an alternative to exchange-traded derivatives. A number of financial institutions similar to those that serve or may serve as counterparties to our hedging arrangements were adversely affected by the global credit crisis. The failure of any of the counterparties to our hedging arrangements to fulfill their obligations to us could adversely affect our results of operations.
If we are not successful in protecting our intellectual property rights, we may harm our ability to compete.
Our brand names and trademarks, including the marks Del Monte, 9Lives, Kibbles ‘n Bits, Meow Mix and Milk-Bone, are important to our business. We rely on trademark, copyright, trade secret, patent and other intellectual property laws, as well as nondisclosure and confidentiality agreements and other methods, to protect our proprietary information, technologies and processes. We also have obligations with respect to the non-use and non-disclosure of third-party intellectual property. We may need to engage in litigation or similar activities to enforce our intellectual property rights, to protect our trade secrets or to determine the validity and scope of proprietary rights of others. Any such litigation could require us to expend significant resources and divert the efforts and attention of our management and other personnel from our business operations. The steps we take to prevent misappropriation, infringement or other violation of our intellectual property or the intellectual property of others may not be successful. In addition, effective patent, copyright, trademark and trade secret protection may be unavailable or limited for some of our trademarks and patents in some foreign countries. Failure to protect our intellectual property could harm our business and results of operations.
Intellectual property infringement or violation claims may adversely impact our results of operations.
We may be subject to claims by others that we infringe on their intellectual property or otherwise violate their intellectual property rights. To the extent we develop, introduce and acquire products, such risk may be exacerbated. We have in the past been subject to such claims. For example, in fiscal 2005, we lost a case brought against us by Kal Kan Foods, Inc., which was a subsidiary of Mars, Inc. As a result of the judgment against us, we were required to pay, among other amounts, compensatory damages of $3.6 million. We were also enjoined from further sales of the pet products named in the litigation, which resulted in us incurring additional expense (relating to the inventories we held of such products and specialized fixed assets used in the manufacture of such products). We are also currently subject to such claims. For example, as described in more detail in “Item 3. Legal Proceedings,” in October 2008, Fresh Del Monte Produce Inc. (“Fresh Del Monte”) filed a complaint against us that alleges, among other things, that we breached our trademark license agreement with Fresh Del Monte through the marketing and sale of certain of our products sold in the refrigerated produce section of customers’ stores. Claims of infringement or violation may require us to engage in litigation to determine the scope and validity of such claims, change our products or cease selling certain products. Any of such events may adversely impact our results of operations.
24
Table of Contents
Our business operations could be disrupted if our information technology systems fail to perform adequately.
The efficient operation of our business depends on our information technology systems, some of which are managed by third-party service providers. We rely on our information technology systems to effectively manage our business data, communications, supply chain, order entry and fulfillment, and other business processes. The failure of our information technology systems to perform as we anticipate could disrupt our business and could result in transaction errors, processing inefficiencies, and the loss of sales and customers, causing our business and results of operations to suffer. In addition, our information technology systems may be vulnerable to damage or interruption from circumstances beyond our control, including fire, natural disasters, power outages, systems failures, security breaches, cyber attacks and viruses. Any such damage or interruption could have a material adverse effect on our business.
Our business could be harmed by strikes or work stoppages by Del Monte employees.
As of May 1, 2011, we have 16 collective bargaining agreements with 15 union locals covering approximately 72% of our hourly full time and seasonal employees. Of these employees, approximately 21% are covered under collective bargaining agreements scheduled to expire in fiscal 2012 and approximately 50% are covered under collective bargaining agreements that are scheduled to expire in fiscal 2013. We may not be able to negotiate these or other collective bargaining agreements on the same or more favorable terms as the current agreements, or at all, without production interruptions caused by labor stoppages. If a strike or work stoppage were to occur in connection with negotiations of our significant collective bargaining agreements, or as a result of disputes under our collective bargaining agreements with labor unions, our business, financial condition and results of operations could be materially adversely affected.
Our Del Monte brand name could be confused with names of other companies who, by their act or omission, could adversely affect the value of the Del Monte brand name.
We have licensed the Del Monte brand name (and with respect to The Philippines and South Africa, transferred title) to various unaffiliated companies internationally and, for some products, in the United States. The common stock of one licensee, Fresh Del Monte Produce Inc., is publicly traded in the United States. Acts or omissions by these unaffiliated companies may adversely affect the value of the Del Monte brand name and demand for our products. Third-party announcements or rumors about these licensees could also have these negative effects. In addition, in connection with the 2002 Merger, Heinz retained its ownership of some of the brand names used by our businesses in countries in which we do not compete. Acts or omissions by Heinz or its licensees that adversely affect the value of these brand names may also adversely affect demand for our products.
Funds affiliated with KKR, Vestar and Centerview (collectively, the “Sponsors”), as well as AlpInvest, indirectly own substantially all of the equity interests in us and may have conflicts of interest with us or the holders of our indebtedness in the future.
Investment funds affiliated with the Sponsors and other investors collectively own all of our outstanding equity securities, and the Sponsors’ designees hold substantially all of the seats on our board of directors. As a result, affiliates of the Sponsors and other investors have control over our decisions to enter into any corporate transaction and have the ability to prevent any transaction that requires the approval of stockholders, regardless of whether others believe that any such transactions are in their own best interests. For example, affiliates of the Sponsors and other investors could collectively cause us to make acquisitions that increase the amount of our indebtedness or to sell assets, or could cause us to issue additional capital stock or declare dividends. So long as investment funds affiliated with the Sponsors and other investors continue to indirectly own a significant amount of the outstanding shares of our common stock or otherwise control a majority of our board of directors, affiliates of the Sponsors and other investors will continue to be able to strongly influence or effectively control our decisions. The Credit Facilities and the indenture governing the Notes permit us to pay advisory and other fees, pay dividends and make other restricted payments to the Sponsors under certain circumstances and the Sponsors or their affiliates may have an interest in our doing so. In addition, the Sponsors and other investors have no obligation to provide us with any additional debt or equity financing.
25
Table of Contents
Additionally, the Sponsors and other investors are in the business of making investments in companies and may from time to time acquire and hold interests in businesses that compete directly or indirectly with us or that supply us with goods and services. The Sponsors and other investors may also pursue acquisition opportunities that may be complementary to our business and, as a result, those acquisition opportunities may not be available to us. See “Part III, Item 13. Certain Relationships and Related Party Transactions, and Director Independence.”
| Item 1B. | Unresolved Staff Comments |
None.
| Item 2. | Properties |
As of May 1, 2011, as listed below, our principal facilities included 17 production facilities and nine distribution centers in the United States, and three production facilities in foreign locations. Our combined production facilities total approximately 5.9 million square feet of owned property, while our distribution centers total approximately 1.6 million square feet of owned property and approximately 3.2 million square feet of leased property. We generally own our production facilities. Our distribution centers are owned or leased by us. We also use distribution centers operated by third parties. We also have various other warehousing and storage facilities, which are primarily leased facilities. Our leases are generally long-term. Certain of our owned real properties are subject to first lien mortgages and second lien mortgages in favor of the lenders under our senior secured term loan facility and our senior secured asset-based revolving facility, respectively.
26
Table of Contents
The following table lists our principal production facilities and distribution centers as of May 1, 2011:
| Location |
Reportable Segment | |
| Production Facilities |
||
| United States: | ||
| Decatur, AL |
Pet Products | |
| Hanford, CA |
Consumer Products | |
| Kingsburg, CA |
Consumer Products | |
| Modesto, CA |
Consumer Products | |
| Mendota, IL |
Consumer Products | |
| Plymouth, IN |
Consumer Products | |
| Topeka, KS |
Pet Products | |
| Lawrence, KS |
Pet Products | |
| Sleepy Eye, MN |
Consumer Products | |
| Buffalo, NY |
Pet Products | |
| Bloomsburg, PA |
Pet Products | |
| Crystal City, TX |
Consumer Products | |
| Toppenish, WA |
Consumer Products | |
| Yakima, WA |
Consumer Products | |
| Cambria, WI |
Consumer Products | |
| Markesan, WI |
Consumer Products | |
| Plover, WI |
Consumer Products | |
| Foreign: | ||
| Turmero, Venezuela |
Consumer Products | |
| Montemorelos, Nuevo Leon, Mexico |
Consumer Products | |
| Tlatlauquitepec, Puebla, Mexico |
Consumer Products | |
| Distribution Centers | ||
| United States: |
||
| Fontana, CA |
Pet Products and Consumer Products | |
| Lathrop, CA |
Pet Products and Consumer Products | |
| Atlanta, GA |
Pet Products and Consumer Products | |
| Kankakee, IL |
Pet Products and Consumer Products | |
| Rochelle, IL |
Consumer Products | |
| Topeka, KS |
Pet Products | |
| Bloomsburg, PA |
Pet Products | |
| Fort Worth, TX |
Pet Products and Consumer Products | |
| McAllen, TX (Refrigerated) |
Consumer Products | |
Our principal administrative headquarters are located in leased office space in San Francisco, CA. We also own or lease additional administrative facilities in Pittsburgh, PA. We own our primary research and development facility in Walnut Creek, CA. In addition, our research and development facilities in Terminal Island, CA are located on leased land.
As of May 1, 2011, we had certain properties with a book value of $0.4 million held for sale.
We believe our facilities are suitable and adequate for our business and have sufficient capacity for the purposes for which they are currently intended.
| Item 3. | Legal Proceedings |
Shareholder Litigation Involving the Company
On November 25, 2010, Del Monte Foods Company announced that it had signed a definitive agreement (the “Merger Agreement”) under which an investor group led by funds affiliated with Kohlberg Kravis Roberts & Co. L.P. (“KKR”), Vestar Capital Partners (“Vestar”) and Centerview Capital L.P. (“Centerview ”) agreed to acquire all of the outstanding stock of Del Monte Foods Company for $19.00 per share in cash (the “Transaction”), subject to the conditions set forth in the Merger Agreement. Following the announcement of the Transaction, fifteen putative class action lawsuits
27
Table of Contents
(the “Shareholder Cases”) relating to the Transaction were filed against Del Monte Foods Company, certain of its now-former officers and directors, and other parties including (in certain cases) Blue Merger Sub. Inc. (“Blue Sub”), the acquisition entity which, upon consummation of the Transaction, merged with and into Del Monte Foods Company, with Del Monte Foods Company continuing as the surviving corporation (the “Merger”).
Two previously disclosed cases which were among the original fifteen Shareholder Cases arising from the Transaction were voluntarily dismissed on June 6, 2011:
| • | Heintz v. Wolford, et al.. The Heintz case was filed by Sarah P. Heintz on behalf of herself and a putative class of shareholders against the Directors, Del Monte Foods Company, Parent and Blue Sub on December 20, 2010 in the United States District Court, Northern District of California; and |
| • | Faulkner v. Wolford, et al.. The Faulkner case was filed by Dallas Faulkner on behalf of himself and a putative class of shareholders against the Directors, Del Monte Foods Company, Parent and Blue Sub on January 21, 2011 in the United States District Court, Northern District of California. |
In addition, plaintiffs in two other previously disclosed cases, which were also among the original fifteen Shareholder Cases arising from the Transaction filed requests for dismissal on March 4, 2011 and June 13, 2011, respectively:
| • | Sinor v. Wolford, et al.. The Sinor case was filed by James Sinor on behalf of himself and a putative class of shareholders against Del Monte Foods Company, the Directors, KKR, Vestar, Centerview (named as Centerview Partners; together with KKR and Vestar, the “Sponsor Defendants”), Parent and Blue Sub on December 1, 2010 in Superior Court in San Francisco, California; and |
| • | Kaiman v. Del Monte Foods Co., et al.. The Kaiman case was filed by Libby Kaiman on behalf of herself and a putative class of shareholders against Del Monte Foods Company, the Directors, the Sponsor Defendants, Parent and Blue Sub on December 1, 2010 in Superior Court in San Francisco, California. |
As a result of the voluntary dismissals and orders consolidating other shareholder cases, only two of the original fifteen Shareholder Cases arising from the Transaction remain pending one of which has been stayed:
| • | In re Del Monte Foods Company Shareholders Litigation (the “Delaware Shareholder Case”). The Delaware Shareholder Case was filed in the Delaware Court of Chancery and consolidated with other related cases filed in the same court. The latest complaint filed in the case asserts claims on behalf of lead Plaintiff NECA-IBEW Pension Fund and a putative class of shareholders against each of the now-former directors of Del Monte Foods Company (together, the “Directors”), the Company’s former Chief Executive Officer in his capacity as such, Barclays Capital, Inc. (“Barclays”), the Sponsor Defendants, Blue Acquisition Group, Inc. (“Parent”) and Blue Sub; and |
| • | Franklin v. Del Monte Foods Co., et al.. The Franklin case was filed by Elisa J. Franklin on behalf of herself and a putative class of shareholders against the Directors, Del Monte Foods Company and the Sponsor Defendants on December 10, 2010 in Superior Court in San Francisco, California. On February 28, 2011, the Court in the Franklin case granted the motion of Del Monte Foods Company and the Directors to stay the proceeding pending resolution of the Delaware Shareholder Case, and the case remains stayed. |
The plaintiff in the Delaware Shareholder Case, which is the only active and pending Shareholder Case, alleges that the Directors breached their fiduciary duties to the stockholders by agreeing to sell Del Monte Foods Company at a price that was unfair and inadequate and by agreeing to certain preclusive deal protection devices in the Merger Agreement. The plaintiff further alleges that the Sponsor Defendants, Parent, Blue Sub and Barclays aided and abetted the Directors’ alleged breaches of fiduciary duties. In addition, the plaintiff asserts a claim for breach of fiduciary duty against the former Chief Executive Officer of Del Monte Foods Company in his capacity as an officer. The plaintiff also alleges that the Sponsor Defendants violated certain Confidentiality Agreements with Del Monte Foods Company, and that Barclays induced the Sponsor Defendants to violate the Confidentiality Agreements, committing tortious interference with contract. The plaintiff in the Franklin case asserts similar claims against the Directors, alleging that they breached their fiduciary duties of care and loyalty by, among other acts, agreeing to sell Del Monte Foods Company at an inadequate price, running an ineffective sale process that relied on conflicted financial advisors, agreeing to preclusive deal protection measures, and pursuing the Transaction for their own financial ends. The plaintiff in the Franklin case also asserts claims against the Sponsor Defendants and Del Monte Foods Company for aiding and abetting these alleged breaches of fiduciary duty.
Each of the complaints seeks injunctive relief, rescission of the Merger Agreement, compensatory damages, and attorneys’ fees. We deny the plaintiffs’ allegations and plan, as the successor to Del Monte Foods Company and Blue Sub, to vigorously defend against these claims.
We have a continuing obligation to defend and indemnify the Directors and our former Chief Executive Officer for their legal fees and potential liability in the Shareholder Cases, subject to certain limitations under Delaware law or contract. Similarly, we may have contractual
28
Table of Contents
obligations to indemnify other parties to the Shareholder Cases and other matters arising out of the Transaction, subject to certain limitations under applicable law or contract. We have $50 million of director and officer insurance coverage for us and the former directors and officers of Del Monte Foods Company. The insurers have reserved their rights with respect to coverage and have not agreed at this point that coverage is available for losses the Company may sustain as a result of the Shareholder Cases. We have accrued in our consolidated financial statements in this Annual Report on Form 10-K an amount equal to our current estimate of our exposure in this matter. Given the inherent uncertainty associated with legal matters, the actual costs of resolving the Shareholder Cases may be substantially higher or lower than the established accrual. The amount that we may ultimately be responsible for in connection with the Shareholder Cases may vary based on a number of factors, including, final settlement or award amounts, the allocation of such amounts among the various parties to the litigation, insurance coverage and resolution with our carriers, indemnification obligations, the discovery of new or additional facts that impact the strength or weakness of the parties’ claims and defenses and other factors.
On February 14, 2011, following expedited discovery and a preliminary injunction hearing in the Delaware Shareholder Case, the Court of Chancery entered an order preliminarily enjoining the shareholder vote on the Merger, which was scheduled to occur at a special meeting on February 15, 2011, for a period of 20 days. In addition, the Court of Chancery enjoined the parties, pending the vote on the Merger, from enforcing various provisions in the Merger Agreement, including the no-solicitation and match right provisions in Sections 6.5(b), 6.5(c), and 6.5(h), and the termination fee provisions relating to topping bids and changes in the board of directors’ recommendations on the Merger in Section 8.5(b). The Court’s order was conditioned upon the lead plaintiff’s posting a bond in the amount of $1.2 million, which was posted on February 15, 2011.
The scheduled special meeting was convened on February 15, 2011. At such meeting, a quorum was determined to be present and, in accordance with the Court’s ruling, the meeting was adjourned until March 7, 2011, without a vote on the Merger proposal. The special meeting was reconvened on March 7, 2011. At such meeting, a quorum was determined to be present and the Merger was approved. The Merger closed on March 8, 2011.
Following the closing of the Merger, on March 25, 2011, the plaintiff in the Delaware Shareholder Case filed an application for an interim attorneys’ fee award in the amount of $12 million. On June 27, 2011, the Court of Chancery awarded the plaintiff’s attorneys an interim fee award in the amount of $2.75 million for the supplemental disclosures that Del Monte Foods Company made in connection with the Merger. The Court of Chancery deferred decision regarding the balance of the fee application, which seeks fees in connection with the preliminary injunction and suspension of deal protections.
SEC Investigation
On February 18, 2011, the Securities and Exchange Commission (“SEC”) directed us to preserve documents and records relating to recent potential or actual business combinations and preparation of Del Monte Foods Company’s proxy statement relating to the Transaction. On March 4, 2011 the SEC requested that we voluntarily produce certain documents and records, which we have done on an ongoing basis. On May 23, 2011, we received a subpoena from the SEC requesting the same documents. We intend to continue to cooperate with the SEC in its investigation. We cannot at this time reasonably estimate a range of exposure, if any, of the potential liability.
Commercial Litigation Involving the Company
On December 17, 2010, a putative class action complaint was filed against us by Lydia Littlefield, on behalf of herself and all others similarly situated, in the U.S. District Court for the District of Massachusetts, alleging intentional misrepresentation, fraud, negligent misrepresentation, breach of express warranty, breach of the implied warranty of merchantability and unjust enrichment. Specifically, the complaint alleges that we engaged in false and misleading representation of certain of our canned fruit products in representing that these products are safe and healthy, when they allegedly contain substances that are not safe and healthy. The plaintiffs seek certification of the class, injunctive relief, damages in an unspecified amount and attorneys’ fees. We intend to deny these allegations and vigorously defend ourselves. On April 19, 2011, the U.S. Judicial Panel on Multidistrict Litigation issued an order consolidating Littlefield with several similar consumer class actions filed in other jurisdictions (in which we are not a defendant) in U.S. District Court for the District of Massachusetts. We cannot at this time reasonably estimate a range of exposure, if any, of the potential liability.
On September 30, 2010, a putative class action complaint was served against us, to be filed in Hennepin County, Minnesota, alleging wage and hour violations of the Fair Labor Standards Act (“FLSA”). The complaint was served on behalf of five named plaintiffs and all others similarly situated at a manufacturing facility in Minnesota. Specifically, the complaint alleges that we violated the FLSA and state wage and hour laws by failing to compensate plaintiffs and other similarly situated workers unpaid overtime. The plaintiffs are
29
Table of Contents
seeking compensatory and statutory damages. Additionally, the plaintiffs are seeking class certification. On November 5, 2010, in connection with our removal of this case to the U.S. District Court for the District of Minnesota, the complaint was filed along with our answer. We also filed a motion for partial dismissal on November 5, 2010. On November 30, 2010, the parties jointly stipulated that the causes of action in plaintiff’s complaint for unjust enrichment and quantum meruit would be dismissed without prejudice and further stipulated that the cause of action under the Minnesota minimum wage law would be dismissed without prejudice. We deny plaintiffs’ allegations and plan to vigorously defend ourselves. We cannot at this time reasonably estimate a range of exposure, if any, of the potential liability.
On October 13, 2009, Kara Moline and Debra Lowe filed a class action complaint against us in San Francisco Superior Court, alleging violations of California’s False Advertising Act, Unfair Competition Law, and Consumer Legal Remedies Act. Specifically, the plaintiffs alleged that we engaged in false and misleading advertising in the labeling of Nature’s Recipe Farm Stand Selects dog food. The plaintiffs sought injunctive relief, disgorgement of profits in an undisclosed amount, and attorneys’ fees. Additionally, the plaintiffs sought class certification. The parties reached a settlement agreement that was approved by the Court on November 9, 2010. Under the settlement, we paid $0.2 million and agreed to modify the labels of the relevant products in the future.
On October 14, 2008, Fresh Del Monte Produce Inc. (“Fresh Del Monte”) filed a complaint against us in U.S. District Court for the Southern District of New York. Fresh Del Monte amended its complaint on November 5, 2008. Under a trademark license agreement with us, Fresh Del Monte holds the rights to use the Del Monte name and trademark with respect to fresh fruit, vegetables and produce throughout the world (including the United States). Fresh Del Monte alleges that we breached the trademark license agreement through the marketing and sale of certain of our products sold in the refrigerated produce section of customers’ stores, including Del Monte Fruit Naturals products and the more recently introduced Del Monte Refrigerated Grapefruit Bowls. Additionally, Fresh Del Monte alleges that it has the exclusive right under the trademark license agreement to sell Del Monte branded pineapple, melon, berry, papaya and banana products in the refrigerated produce section. Fresh Del Monte also alleges that our advertising for certain of the alleged infringing products was false and misleading. Fresh Del Monte is seeking damages of $10.0 million, treble damages with respect to its false advertising claim, and injunctive relief. On October 14, 2008, Fresh Del Monte filed a motion for a preliminary injunction, asking the Court to enjoin us from making certain claims about our refrigerated products. On October 23, 2008, the Court denied that motion. We deny Fresh Del Monte’s allegations and are vigorously defending ourselves. Additionally, on November 21, 2008, we filed counter-claims against Fresh Del Monte, alleging that Fresh Del Monte has breached the trademark license agreement. Specifically, we allege, among other things, that Fresh Del Monte’s “medley” products (vegetables with a dipping sauce or fruit with a caramel sauce) violate the trademark license agreement. On November 10, 2010, Fresh Del Monte filed a motion for partial summary judgment. On December 8, 2010, we filed an opposition to that motion. The Court has not scheduled a hearing date. We cannot at this time reasonably estimate a range of exposure, if any, of the potential liability.
Pet Food Products-Related Litigation
Beginning with the pet food recall announced by Menu Foods, Inc. in March 2007, many major pet food manufacturers, including us, announced recalls of select products. We believe there have been over 90 class actions and purported class actions relating to these pet food recalls. We were named as a defendant in seven class actions or purported class actions related to our pet food and pet snack recall, which we initiated March 31, 2007.
We were a defendant in the following cases:
| • | Carver v. Del Monte filed on April 4, 2007 in the U.S. District Court for the Eastern District of California; |
| • | Ford v. Del Monte filed on April 7, 2007 in the U.S. District Court for the Southern District of California; |
| • | Hart v. Del Monte filed on April 10, 2007 in state court in Los Angeles, California; |
| • | Picus v. Del Monte filed on April 30, 2007 in state court in Las Vegas, Nevada; |
| • | Blaszkowski v. Del Monte filed on May 9, 2007 in the U.S. District Court for the Southern District of Florida; |
| • | Schwinger v. Del Monte filed on May 15, 2007 in the U.S. District Court for the Western District of Missouri; and |
| • | Tompkins v. Del Monte filed on July 13, 2007 in the U.S. District Court for the District of Colorado. |
The named plaintiffs in these seven cases alleged that their pets suffered injury and/or death as a result of ingesting our and other defendants’ allegedly contaminated pet food and pet snack products. The Picus and Blaszkowski cases also contained allegations of false and misleading advertising by us.
By order dated June 28, 2007, the Carver, Ford, Hart, Schwinger, and Tompkins cases were transferred to the U.S. District Court for the District of New Jersey and consolidated with other purported pet food class actions under the federal rules for multi-district litigation. The Blaszkowski and Picus cases were not consolidated.
30
Table of Contents
The Multi-District Litigation Cases. The plaintiffs and defendants in the multi-district litigation cases, including the five consolidated cases in which we were a defendant, tentatively agreed to a settlement that was submitted to the U.S. District Court for the District of New Jersey on May 22, 2008. On May 30, 2008, the Court granted preliminary approval to the settlement. Pursuant to the Court’s order, notice of the settlement was disseminated to the public by mail and publication beginning June 16, 2008. Members of the class were allowed to opt-out of the settlement until August 15, 2008. On November 19, 2008, the Court entered orders approving the settlement, certifying the class and dismissing the complaints against the defendants, including us. The total settlement was $24.0 million. The portion of our contribution to this settlement was $0.25 million, net of insurance recovery, which we have paid. Four class members have filed objections to the settlement, which objections have been denied by the Court. On December 3, 2008 and December 12, 2008, these class members filed Notices of Appeal. After the Court of Appeals granted the appeal in part, denied the appeal in part and remanded the matter for further proceedings, the District Court approved the settlement on April 5, 2011.
The Blaszkowski Case. On April 11, 2008, the plaintiffs in the Blaszkowski case filed their fourth amended complaint. On September 12, 2008 and October 9, 2008, plaintiffs filed stipulations of dismissal with respect to their complaint against certain of the defendants, including us. The U.S. District Court for the Southern District of Florida entered such requested dismissals on such dates, resulting in the dismissal of all claims against us.
The Picus Case. The plaintiffs in the Picus case sought certification of a class action as well as unspecified damages and injunctive relief against further distribution of the allegedly defective products. On October 12, 2007, we filed a motion to dismiss in the Picus case. The state court in Las Vegas, Nevada granted our motion in part and denied our motion in part. On December 14, 2007, other defendants in the case filed a motion to deny class certification. On March 16, 2009, the Court granted the motion to deny class certification. On March 25, 2009, the plaintiffs filed an appeal of the Court’s decision. On June 30, 2009, the Court of Appeals denied plaintiffs’ appeal. By order dated February 1, 2011, we were dismissed from this lawsuit.
Other
We are also involved from time to time in various legal proceedings incidental to our business, including proceedings involving product liability claims, workers’ compensation and other employee claims, tort claims and other general liability claims, for which we carry insurance, as well as trademark, copyright, patent infringement and related litigation. Additionally, we are involved from time to time in claims relating to environmental remediation and similar events. While it is not feasible to predict or determine the ultimate outcome of these matters, we believe that none of these legal proceedings will have a material adverse effect on our financial position.
| Item 4. | (Removed and Reserved) |
31
Table of Contents
| Item 5. | Market for Registrant’s Common Equity, Related Stockholder Matters and Issuer Purchases of Equity Securities |
Market and Dividend Information
Our outstanding common stock is privately held, and there is no established public trading market for our common stock.
We declared aggregate dividends of $53.0 million and $39.6 million during the period from May 3, 2010 through March 7, 2011 and fiscal 2010, respectively. We paid aggregate dividends of $62.9 million and $37.6 million during the period from May 3, 2010 through March 7, 2011 and fiscal 2010, respectively. In the period from May 3, 2010 through March 7, 2011, the quarterly dividend declared was $0.09 per share of outstanding common stock of DMFC in the first through third quarters, and the quarterly dividend paid was $0.05 per share in the first quarter and $0.09 per share in the second through fourth quarters. No dividend was declared during the period from March 8, 2011 through May 1, 2011. In fiscal 2010, the quarterly dividend declared was $0.05 per share of outstanding stock of DMFC, and the quarterly dividend paid was $0.04 per share in the first quarter and $0.05 per share in the second through fourth quarters.
We expect to continue to use cash flows from operations (and other sources of cash, if any) to finance our working capital needs, to develop and grow our business (including capital expenditures), to reduce debt, to fund contributions to our defined benefit plans and for general corporate purposes. We may from time to time consider other uses for our cash flows from operations and other sources of cash. Such uses may include, but are not limited to, acquisitions or future transformation or restructuring plans. Currently, there are no plans to pay dividends. See “Item 7. Management’s Discussion and Analysis of Financial Condition and Results of Operations – Liquidity and Capital Resources” for a description of the restrictions on our ability to pay dividends.
Issuances of Unregistered Securities
There were no issuances of unregistered securities in the quarter ended May 1, 2011.
Issuer Purchases of Equity Securities
On June 22, 2010, DMFC entered into an accelerated stock buyback agreement (“ASB”) with Goldman Sachs & Co. (“Goldman Sachs”). Under the ASB, we paid Goldman Sachs $100 million on June 25, 2010 from available cash on hand and received 6,215,470 shares of DMFC common stock from Goldman Sachs on that date. Final settlement of this agreement occurred on August 2, 2010, resulting in our receiving an additional 885,413 shares of DMFC common stock. The total number of shares that were ultimately repurchased under the ASB was generally based on the average daily volume-weighted average share price of DMFC common stock over the duration of the transaction.
No DMFC shares were repurchased during fiscal 2010 and fiscal 2009.
32
Table of Contents
| Item 6. | Selected Financial Data |
The following tables set forth our selected historical financial data as of and for the periods indicated. The selected historical financial data presented below was derived from the audited balance sheets as of May 1, 2011, May 2, 2010, May 3, 2009, April 27, 2008 and April 29, 2007, respectively, and the audited statements of income (loss) for the periods March 8, 2011 through May 1, 2011 and May 3, 2010 through March 7, 2011, fiscal 2010, fiscal 2009, fiscal 2008 and fiscal 2007, respectively, as audited by KPMG LLP. The following information is qualified by reference to, and should be read in conjunction with, “Item 7. Management Discussion and Analysis of Financial Condition and Results of Operations” and “Item 8. Financial Statements and Supplementary Data.” The historical results are not necessarily indicative of results to be expected in any future period.
| Successor | Predecessor | |||||||||||||||||||||||||
| March 8, 2011 through May 1, 2011 (c) |
May 3, 2010 through March 7, 2011 (d) |
Fiscal 2010 |
Fiscal 2009 |
Fiscal 2008 |
Fiscal 2007 |
|||||||||||||||||||||
| (in millions) | (in millions) | |||||||||||||||||||||||||
| Statement of income (loss) data (a)(b): |
||||||||||||||||||||||||||
| Net sales |
$ | 564.8 | $ | 3,101.3 | $ | 3,739.8 | $ | 3,626.9 | $ | 3,179.8 | $ | 2,872.5 | ||||||||||||||
| Cost of products sold |
457.0 | 2,073.6 | 2,510.6 | 2,622.7 | 2,319.9 | 2,054.0 | ||||||||||||||||||||
| Gross profit |
107.8 | 1,027.7 | 1,229.2 | 1,004.2 | 859.9 | 818.5 | ||||||||||||||||||||
| Selling, general and administrative expenses |
108.9 | 535.7 | 721.2 | 643.3 | 541.4 | 537.8 | ||||||||||||||||||||
| Transaction and related costs |
82.8 | 68.8 | — | — | — | — | ||||||||||||||||||||
| Operating income (loss) |
(83.9 | ) | 423.2 | 508.0 | 360.9 | 318.5 | 280.7 | |||||||||||||||||||
| Interest expense |
44.3 | 66.7 | 116.3 | 110.3 | 131.4 | 133.5 | ||||||||||||||||||||
| Other (income) expense |
25.7 | (5.2 | ) | 9.8 | 24.1 | (2.5 | ) | 0.4 | ||||||||||||||||||
| Income (loss) from continuing operations before income taxes |
(153.9 | ) | 361.7 | 381.9 | 226.5 | 189.6 | 146.8 | |||||||||||||||||||
| Provision (benefit) for income taxes |
(49.0 | ) | 139.8 | 139.9 | 78.8 | 71.9 | 49.5 | |||||||||||||||||||
| Income (loss) from continuing operations |
(104.9 | ) | 221.9 | 242.0 | 147.7 | 117.7 | 97.3 | |||||||||||||||||||
| Income from discontinued operations (net of taxes of $0.2, $(2.6), $(0.9), $14.3, $(4.0) and $3.7, respectively) |
0.4 | 0.9 | 2.3 | 24.6 | 15.4 | 15.3 | ||||||||||||||||||||
| Net income (loss) |
$ | (104.5 | ) | $ | 222.8 | $ | 244.3 | $ | 172.3 | $ | 133.1 | $ | 112.6 | |||||||||||||
| Successor | Predecessor | |||||||||||||||||||||||||
| May 1, 2011 | May 2, 2010 | May 3, 2009 | April 27, 2008 | April 29, 2007 | ||||||||||||||||||||||
| (in millions) | (in millions) | |||||||||||||||||||||||||
| Balance sheet data: |
||||||||||||||||||||||||||
| Total assets |
$ | 7,203.7 | $ | 4,288.9 | $ | 4,321.3 | $ | 4,546.3 | $ | 4,561.5 | ||||||||||||||||
| Long-term debt, excluding current portion |
3,973.1 | 1,255.2 | 1,525.9 | 1,854.8 | 1,951.9 | |||||||||||||||||||||
| Stockholder’s equity |
1,485.4 | 1,827.4 | 1,606.5 | 1,500.5 | 1,452.2 | |||||||||||||||||||||
| Successor | Predecessor | |||||||||||||||||||||||||
| March 8,
2011 through May 1, 2011 |
May 3, 2010 through March 7, 2011 |
Fiscal 2010 |
Fiscal 2009 |
Fiscal 2008 |
Fiscal 2007 |
|||||||||||||||||||||
| (in millions) | (in millions) | |||||||||||||||||||||||||
| Cash flow data (a)(b): |
||||||||||||||||||||||||||
| Cash flows provided by operating activities |
$ | 85.2 | $ | 254.3 | $ | 355.9 | $ | 200.6 | $ | 286.9 | $ | 230.1 | ||||||||||||||
| Cash flows provided by (used in) investing activities |
(3,882.7 | ) | (66.1 | ) | (104.9 | ) | 277.1 | (79.7 | ) | (1,344.8 | ) | |||||||||||||||
| Cash flows provided by (used in) financing activities |
4,002.6 | (91.5 | ) | (336.2 | ) | (361.3 | ) | (194.5 | ) | 667.7 | ||||||||||||||||
| Capital expenditures |
25.8 | 66.1 | 104.9 | 88.7 | 96.7 | 95.0 | ||||||||||||||||||||
| (a) | For all periods presented, the operating results and assets and liabilities related to the StarKist Seafood Business have been classified as discontinued operations. We have combined cash flows from discontinued operations with cash flows from continuing operations within the operating, investing and financing categories in the Statement of Cash Flows for all periods presented. |
| (b) | The fiscal 2007 financial results include the operations for Meow Mix beginning May 19, 2006 and Milk-Bone beginning July 2, 2006. |
| (c) | The financial results for the period March 8, 2011 through May 1, 2011 represent the 8-week Successor period reflecting the Merger. |
| (d) | The financial results for the period May 3, 2010 through March 7, 2011 represent the 44-week Predecessor period prior to the Merger. |
33
Table of Contents
| Item 7. | Management’s Discussion and Analysis of Financial Condition and Results of Operations |
This discussion summarizes the significant factors affecting our consolidated operating results, financial condition and liquidity during the three-year period ended May 1, 2011. This discussion should be read in conjunction with our consolidated financial statements for the periods March 8, 2011 through May 1, 2011, May 3, 2010 through March 7, 2011 and fiscal years ended May 2, 2010 and May 3, 2009 and related notes included elsewhere in this Annual Report on Form 10-K. These historical financial statements may not be indicative of our future performance. This Management’s Discussion and Analysis of Financial Condition and Results of Operations contains a number of forward-looking statements, all of which are based on our current expectations and could be affected by the uncertainties and risks described throughout this filing, particularly in “Item 1A. Risk Factors.”
Merger
On March 8, 2011, we were acquired by an investor group led by funds affiliated with Kohlberg Kravis Roberts & Co. L.P. (“KKR”), Vestar Capital Partners (“Vestar”) and Centerview Capital, L.P. (“Centerview”). Under the terms of the merger agreement, the stockholders of Del Monte Foods Company (“DMFC”) received $19.00 per share in cash. The acquisition (also referred to as the “Merger”) was effected by the merger of Blue Merger Sub Inc. (“Blue Sub”) with and into DMFC, with DMFC being the surviving corporation. As a result of the Merger, DMFC became a wholly-owned subsidiary of Blue Acquisition Group, Inc. (“Parent”). DMFC stockholders approved the transaction on March 7, 2011. DMFC’s common stock ceased trading on the New York Stock Exchange before the opening of the market on March 9, 2011.
On April 26, 2011, DMFC merged with and into Del Monte Corporation (“DMC”), with DMC being the surviving corporation. As a result of this merger, DMC became a direct wholly-owned subsidiary of Parent.
Fiscal Year
Our fiscal year ends on the Sunday closest to April 30. Every five or six years, depending on leap years, our fiscal year has 53 weeks. Fiscal 2011 and fiscal 2010 each contained 52 weeks. Fiscal 2009 contained 53 weeks.
As discussed above, we completed the Merger on March 8, 2011. As a result of the Merger, we applied the acquisition method of accounting and established a new basis of accounting on March 8, 2011. The twelve months ended May 1, 2011 includes the 44-week Predecessor period from May 3, 2010 through March 7, 2011 (“Predecessor Period”) and the 8-week Successor period from March 8, 2010 through May 1, 2011 (“Successor Period”). The fiscal years presented from fiscal 2009 to fiscal 2010 reflect the Predecessor. For comparison purposes, the discussion of results of operations below is generally based on the mathematical combination of the Successor Period and Predecessor Period, compared to the Predecessor fiscal year 2010 ended May 2, 2010, which we believe provides a meaningful understanding of the underlying business. Transactions relating to or resulting from the Merger are discussed separately.
Background
Del Monte Corporation and its consolidated subsidiaries (“Del Monte” or the “Company”) is one of the country’s largest producers, distributors and marketers of premium quality, branded pet products and food products for the U.S. retail market, with pet food and snack brands for dogs and cats such as Meow Mix, Kibbles ‘n Bits, Milk-Bone, 9Lives, Pup-Peroni, Gravy Train, Nature’s Recipe, Canine Carry Outs, Milo’s Kitchen and other brand names and leading food brands such as Del Monte, Contadina, S&W, College Inn and other brand names.
On October 6, 2008, pursuant to the Purchase Agreement dated June 29, 2008 among DMC, Dongwon Enterprise Co., Ltd., Dongwon Industries Co., Ltd., Dongwon F&B Co., Ltd., Starkist Co. (collectively, the “Dongwon Entities”), and Starkist Samoa Co. (“Acquisition Sub”), DMC (i) sold to Starkist Co. all of the outstanding stock of Galapesca S.A., Panapesca Fishing, Inc. and Marine Trading Pacific, Inc., (ii) caused Star-Kist Samoa, Inc. to be merged with and into Acquisition Sub and (iii) sold to Starkist Co. certain assets that are primarily related to the business of manufacturing, marketing, selling and distributing StarKist brand products and private label seafood products (such business, the “StarKist Seafood Business”). Under the terms of the Purchase Agreement, the Dongwon Entities paid a purchase price of approximately $359 million at closing and an additional $23 million related to the final working capital adjustment. The financial results of the StarKist Seafood Business have been reported as a discontinued operation in all periods presented and were previously reported within the Consumer Products segment.
34
Table of Contents
Key Performance Indicators
The following table sets forth some of our key performance indicators that we utilize to assess results of operations (in millions, except percentages):
| Successor | Predecessor | |||||||||||||||||||||||||||||
| March 8, 2011 through May 1, 2011 |
May 3, 2010 through March 7, 2011 |
Fiscal 2010 | Change (a) | % Change | Volume (b) | Rate (c) | ||||||||||||||||||||||||
| Net sales |
$ | 564.8 | $ | 3,101.3 | $ | 3,739.8 | $ | (73.7 | ) | (2.0 | %) | (0.3 | %) | (1.7 | %) | |||||||||||||||
| Cost of products sold |
457.0 | 2,073.6 | 2,510.6 | (20.0 | ) | (0.8 | %) | 0.8 | % | (1.6 | %) | |||||||||||||||||||
| Gross profit |
107.8 | 1,027.7 | 1,229.2 | (93.7 | ) | (7.6 | %) | |||||||||||||||||||||||
| Selling, general and administrative (“SG&A”) expenses |
|
108.9 |
|
|
535.7 |
|
|
721.2 |
|
|
76.6 |
|
|
10.6 |
% |
|||||||||||||||
| Transaction and related costs |
82.8 | 68.8 | — | (151.6 | ) | |||||||||||||||||||||||||
| Operating income |
$ | (83.9 | ) | $ | 423.2 | $ | 508.0 | $ | (168.7 | ) | (33.2 | %) | ||||||||||||||||||
| Gross margin |
19.1 | % | 33.1 | % | 32.9 | % | ||||||||||||||||||||||||
| SG&A as a % of net sales |
19.3 | % | 17.3 | % | 19.3 | % | ||||||||||||||||||||||||
| Operating income margin |
(14.9 | %) | 13.6 | % | 13.6 | % | ||||||||||||||||||||||||
| (a) | This column represents the difference between the mathematical combination of the Successor Period and the Predecessor Period, and fiscal 2010. |
| (b) | This column represents the change, as compared to the prior year period, due to volume and mix. Volume represents the change resulting from the number of units sold, exclusive of any change in price. Volume changes in the above table include elasticity, the volume decline associated with price increases. Mix represents the change attributable to shifts in volume across products or channels. |
| (c) | This column represents the change, as compared to the prior year period, attributable to per unit changes in net sales or cost of products sold. |
| Adjusted EBITDA |
||||||||||||||||
| Trailing twelve months ended May 1, 2011 (as specified in our debt agreements (d)), in millions |
$ | 661.0 | ||||||||||||||
| Trailing twelve months ended May 2, 2010 (as specified in our debt agreements (d)), in millions |
$ | 626.9 | ||||||||||||||
| (d) | Refer to “Reconciliation of Non-GAAP Financial Measures” below. |
Executive Overview
As discussed above, we completed the Merger on March 8, 2011. As a result of the Merger, we applied the acquisition method of accounting and established a new basis of accounting on March 8, 2011. Fees and expenses related to the Merger were $82.8 million for the Successor Period, primarily consisting of deal fees, financial advisory fees and legal and other professional service fees. Fees and expenses related to the Merger were $68.8 million for the Predecessor Period, primarily consisting of accelerated stock compensation expense, investment banking fees and legal fees. In addition, our total debt and the book values of our goodwill and intangible assets increased. At May 1, 2011 our total debt was $4,008.6 million and the combined book value of our goodwill and intangible assets was $4,952.7 million. We expect interest expense and amortization expense to increase significantly in future years as a result of the Merger.
In the Successor Period, our net sales were $564.8 million, our operating loss was $83.9 million and our net loss was $104.5 million. In the Predecessor Period, our net sales were $3,101.3 million, our operating income was $423.2 million and our net income was $222.8 million. In fiscal 2010, we achieved net sales of $3,739.8 million, operating income of $508.0 million and net income of $244.3 million. Adjusted EBITDA was $661.0 million for the trailing twelve months ended May 1, 2011 and $626.9 million for the trailing twelve months ended May 2, 2010. Refer to “Reconciliation of Non-GAAP Financial Measures” below for a reconciliation of these measures to the most directly comparable GAAP measures as presented in our financial statements.
35
Table of Contents
Net sales for the Successor Period and Predecessor Period were negatively impacted by lower volumes in our Consumer Products segment and higher trade spending in both our Pet Products and Consumer Products segments in response to higher promotional activity by our competitors, partially offset by new product sales, primarily in our Pet Products segment. This higher trade spending was funded through a shift in funds from marketing expense. We believe the combination of our trade spending and marketing expenses as a percentage of sales represents a competitive level and we expect the combination of trade spending and marketing expense to continue at competitive levels focused on our key brands.
Our results for the Successor Period and Predecessor Period reflect a 33.2% decrease in operating income on a combined basis. This decrease was driven by the fees and expenses related to the Merger described above, as well as the amortization of the fair value step-up of inventory of $33.8 million recorded as a result of the Merger in the Successor Period. Operating income was positively impacted by new product sales, primarily in our Pet Products segment, partially offset by volume declines in our Consumer Products segment.
Economic Factors and Productivity Savings
During the Successor Period and Predecessor Period, we experienced higher gross costs in our Pet Products segment, as well as higher overall costs per case in our Consumer Products segment as a result of a more typical year of production compared to the high yield of peaches packed in fiscal 2010 which drove lower average fixed cost per case. These cost increases were partially offset by lower metal packaging costs and lower tomato costs. In fiscal 2012, we believe that we will experience cost increases driven primarily by commodity and energy costs. We also expect higher raw product costs for fruit, vegetables and tomatoes. Pricing and productivity savings are not expected to fully offset these cost increases in fiscal 2012.
Accelerated Growth Plan
In early fiscal 2009, we announced our Accelerated Growth Plan which we have executed against through 2011. Each of the strategic initiatives of the Accelerated Growth Plan is described below.
Execute Pricing and Productivity—Use pricing actions and productivity savings to neutralize the impact of cost inflation. Our pricing actions have been taken to mitigate higher costs, and together with our productivity initiatives, addressed the inflationary cost increases we have seen over the last few years. In the Successor Period and Predecessor Period, continued productivity savings offset the vast majority of gross cost increases.
Unleash Potential of Core Brands—Focus on growing our higher margin core business by continuing investment in the associated brands. Building on the investments made in fiscal 2010, in the Successor Period and Predecessor Period, we have made investments behind the Kibbles ‘n Bits, Milk-Bone, Meow Mix and Pup-Peroni brands.
Drive Our Growth Engines—Drive our key growth engines, including pet snacks and dry pet food, with category-building innovation and marketing. These growth engines leverage our brands to fill unmet consumer needs where there are growth opportunities. For example, in the Predecessor Period, we launched Kibbles n’ Bits Bistro Meals, an innovation behind our core Kibbles n’ Bits brand, and new varieties of 9Lives cat food. In March 2011, we launched a new pet snack brand, Milo’s Kitchen, which is focused on the emerging consumer demand for real ingredient pet snacks.
We are continually evaluating our strategy, particularly in light of the Merger, and may modify our strategy going forward.
Results of Operations
Successor Period and Predecessor Period vs. Fiscal 2010
Net sales
| Successor | Predecessor | |||||||||||||||||||||||||||||
| March 8, 2011 through May 1, 2011 |
May 3, 2010 through March 7, 2011 |
Fiscal 2010 | Change (a) | % Change | Volume (b) | Rate (c) | ||||||||||||||||||||||||
| (in millions) | (in millions, except percentages) | |||||||||||||||||||||||||||||
| Net sales: |
||||||||||||||||||||||||||||||
| Pet Products |
$ | 271.0 | $ | 1,513.2 | $ | 1,750.0 | $ | 34.2 | 2.0 | % | 3.7 | % | (1.7 | %) | ||||||||||||||||
| Consumer Products |
293.8 | 1,588.1 | 1,989.8 | (107.9 | ) | (5.4 | %) | (3.8 | %) | (1.6 | %) | |||||||||||||||||||
| Total |
$ | 564.8 | $ | 3,101.3 | $ | 3,739.8 | $ | (73.7 | ) | (2.0 | %) | |||||||||||||||||||
| (a) | This column represents the difference between the mathematical combination of the Successor Period and the Predecessor Period, and fiscal 2010. |
36
Table of Contents
| (b) | This column represents the change, as compared to the prior year period, due to volume and mix. Volume represents the change resulting from the number of units sold, exclusive of any change in price. Volume changes in the above table include elasticity, the volume decline associated with price increases. Mix represents the change attributable to shifts in volume across products or channels. |
| (c) | This column represents the change, as compared to the prior year period, attributable to per unit changes in net sales or cost of products sold. |
Net sales decreased by $73.7 million, or 2.0%, in the Successor Period and Predecessor Period combined compared to fiscal 2010. The decrease was due to decreased net sales in our Consumer Products segment, driven by lower retail sales, partially offset by increased net sales in our Pet Products segment.
Net sales in our Pet Products segment increased $34.2 million, or 2.0%, in the Successor Period and Predecessor Period combined compared to fiscal 2010. The increase was driven by new product sales, partially offset by increased trade spending.
Net sales in our Consumer Products segment decreased by $107.9 million, or 5.4%, in the Successor Period and Predecessor Period combined compared to fiscal 2010. This decrease was primarily driven by lower retail sales in tomato, vegetable and fruit products, driven by higher industry inventory levels, particularly in vegetable and fruit, resulting in higher promotional activity by our competitors which reduced our volumes. Our increased trade spending also negatively impacted our net sales for the Successor Period and Predecessor Period combined.
Cost of products sold
Cost of products sold increased by $20.0 million, or 0.8%, in the Successor Period and the Predecessor Period combined compared to fiscal 2010. This increase was primarily due to the amortization of the fair value step-up of inventory of $33.8 million recorded as a result of the Merger in the Successor Period. Cost of products sold was also impacted by higher overall costs per case as a result of a more typical year of production compared to the high yield of peaches packed in fiscal 2010 which drove a lower fixed cost per case. Higher sales volumes and higher packaging costs in our Pet Products segment also contributed to the increase in cost of products sold. Partially offsetting these cost increases were more favorable pricing for tomato raw products and more favorable pricing for metal packaging in our Consumer Products segment. Cost of products sold for the Predecessor Period also benefitted from the settlement of a prior claim with a vendor.
In fiscal 2012, we expect overall costs, primarily driven by commodity costs, energy costs and raw product costs, to be higher than in the Successor Period and the Predecessor Period combined.
Gross margin
Our gross margin percentage for the Successor Period and the Predecessor Period combined decreased 1.9 points compared to 32.9% for fiscal 2010. Gross margin was impacted by a 1.2 margin point decrease due to increased trade spending, and a 1.0 margin point decrease related to the higher costs noted above (including inventory step-up), partially offset by a 0.3 margin point increase due to product mix.
Selling, general and administrative expenses
Selling, general and administrative (“SG&A”) expenses decreased by $76.6 million, or 10.6%, during the Successor Period and the Predecessor Period combined compared to fiscal 2010. This decrease was primarily driven by a $76.6 million, or 35%, decrease in marketing costs resulting primarily from a shift in spending from marketing to trade spending as a result of increased competitive promotional activity. In fiscal 2012, we expect continued strong competitive activity.
Transaction and related costs
Transaction and related costs were $82.8 million for the Successor Period, primarily consisting of deal fees, financial advisory fees and legal and other professional service fees. Transaction and related costs were $68.8 million for the Predecessor Period, primarily consisting of accelerated stock compensation expense, investment banking fees and legal fees. There were no transaction and related costs in fiscal 2010.
Operating income (loss)
| Successor | Predecessor | |||||||||||||||||||||
| March 8, 2011 through May 1, 2011 |
May 3, 2010 through March 7, 2011 |
Fiscal 2010 | Change (a) | % Change | ||||||||||||||||||
| (in millions) | (in millions, except percentages) | |||||||||||||||||||||
| Operating income (loss): |
||||||||||||||||||||||
| Pet Products |
$ | 26.2 | $ | 351.5 | $ | 355.5 | $ | 22.2 | 6.2 | % | ||||||||||||
| Consumer Products |
9.1 | 170.9 | 222.6 | (42.6 | ) | (19.1 | %) | |||||||||||||||
| Corporate (b) |
(119.2 | ) | (99.2 | ) | (70.1 | ) | (148.3 | ) | (211.6 | %) | ||||||||||||
| Total |
$ | (83.9 | ) | $ | 423.2 | $ | 508.0 | $ | (168.7 | ) | (33.2 | %) | ||||||||||
37
Table of Contents
| (a) | This column represents the difference between the mathematical combination of the Successor Period and the Predecessor Period, and fiscal 2010. |
| (b) | Corporate represents expenses not directly attributable to reportable segments. For the Successor Period, the Predecessor Period and fiscal 2010, Corporate includes $82.8 million, $68.8 million and $0.0 of transaction-related costs, respectively. |
Operating income decreased by $168.7 million, or 33.2%, during the Successor Period and the Predecessor Period combined compared to fiscal 2010, primarily due to the transaction and related costs noted above, as well as the amortization of the fair value step-up of inventory recorded as a result of the Merger.
Our Pet Products segment’s operating income increased by $22.2 million, or 6.2%, during the Successor Period and the Predecessor Period combined compared to fiscal 2010. This increase was driven primarily by new product sales, partially offset by the $16.2 million cost related to inventory step-up in the Successor Period noted above. The decrease in marketing expense was offset by increased trade spending.
Our Consumer Products segment’s operating income decreased by $42.6 million, or 19.1%, during the Successor Period and Predecessor Period combined compared to fiscal 2010. This decrease was driven primarily by the lower net sales noted above. The impact of costs was neutral as the $17.6 million amortization of the step-up value of inventory in the Successor Period and the increased cost per case were offset by the favorable costs for tomato raw products and metal packaging costs.
Our Corporate expenses increased by $148.3 million, or 211.6%, in the Successor Period and Predecessor Period combined compared to fiscal 2010 driven by the transaction and related costs noted above.
Interest expense
Interest expense decreased by $5.3 million, or 4.6%, in the Successor Period and Predecessor Period combined compared to fiscal 2010. This decrease was driven by the absence of $24.8 million in refinancing expense recognized in fiscal 2010, partially offset by the impact of higher average debt levels in the Successor Period as a result of the Merger. We expect interest expense to increase significantly in fiscal 2012 driven by the increased debt levels.
Other (income) expense
Other expense of $25.7 million for the Successor Period was comprised primarily of the $15.8 million premium over the fair value of senior subordinated notes acquired in the tender offers or redeemed and losses on hedging contracts. See “Liquidity and Capital Resources – Description of Indebtedness” for a complete description of the financing transactions. Other income of $5.2 million for the Predecessor Period was comprised primarily of gains on foreign currency transactions. Other expense of $9.8 million for fiscal 2010 was comprised primarily of expense related to the discontinuation of hedge accounting for our three-year $400.0 million interest rate swap in connection with the fiscal 2010 refinancing of our senior credit facility. As a result of our policy decision to no longer seek hedge accounting for our derivative contracts subsequent to the Merger, we expect other (income) expense to fluctuate from period-to-period.
Provision for income taxes
The effective tax rate for continuing operations for the Successor Period and Predecessor Period combined increased compared to 36.6% for fiscal 2010. The increase in the tax rate was primarily due to the non-deductibility of certain Merger-related expenses. We do not expect Merger-related expenses to have a material impact on our effective tax rate in future periods.
Reconciliation of Non-GAAP Financial Measures
Adjusted EBITDA
We report our financial results in accordance with generally accepted accounting principles in the United States (“GAAP”). In this Annual Report on Form 10-K, we also provide a non-GAAP financial measure –Adjusted EBITDA. We present Adjusted EBITDA because we believe that it is an important supplemental measure relating to our financial condition since it is used in certain covenants in the indenture that governs our 7.625% Senior Notes due 2019 (referred to therein as “EBITDA”) and the credit agreements relating to our $2.7 billion term loan and $0.75 billion revolver (referred to therein as “Consolidated EBITDA”).
EBITDA is defined as income before interest expense, provision for income taxes, and depreciation and amortization. Adjusted EBITDA is defined as EBITDA, further adjusted as required by the definitions of “EBITDA” and “Consolidated EBITDA” contained in our indenture and credit agreements. Our presentation of Adjusted EBITDA has limitations as an analytical tool. Adjusted EBITDA is not a measure of liquidity or profitability and should not be considered as an alternative to net
38
Table of Contents
income, operating income, net cash provided by operating activities or any other measure determined in accordance with GAAP. Additionally, Adjusted EBITDA is not intended to be a measure of cash flow for management’s discretionary use, as it does not consider debt service requirements, obligations under the monitoring agreement with our Sponsors, capital expenditures or other non-discretionary expenditures that are not deducted from the measure.
We caution investors that our presentation of Adjusted EBITDA may not be comparable to similarly titled measures of other companies. Adjusted EBITDA also differs from the adjusted EBITDA measure that was presented by DMFC prior to the Merger.
| Trailing Twelve Months Ended May 1, 2011 |
Trailing Twelve Months Ended May 2, 2010 |
|||||||
| (in millions) | ||||||||
| Reconciliation: |
||||||||
| Operating loss—Successor Period |
$ | (83.9 | ) | $ | — | |||
| Operating income—Predecessor Period |
423.2 | — | ||||||
| Operating income |
— | 508.0 | ||||||
| Adjustments to derive EBITDA: |
||||||||
| Other income (expense) |
(20.5 | ) | (9.8 | ) | ||||
| Depreciation and amortization expense |
101.7 | 99.4 | ||||||
| Amortization of debt discount and debt issuance costs 1 |
(9.2 | ) | (6.2 | ) | ||||
| EBITDA |
$ | 411.3 | $ | 591.4 | ||||
| Non-cash charges |
33.0 | 6.0 | ||||||
| Derivative transactions |
23.7 | 22.6 | ||||||
| Non-cash stock based compensation |
45.7 | 21.3 | ||||||
| Non-recurring gains (losses) |
(1.0 | ) | (16.0 | ) | ||||
| Merger-related items |
118.4 | — | ||||||
| Early extinguishment of debt |
15.8 | — | ||||||
| Business optimization charges |
6.3 | — | ||||||
| Other |
7.8 | 1.6 | ||||||
| Adjusted EBITDA |
$ | 661.0 | $ | 626.9 | ||||
| 1 | Represents adjustments to eliminate duplicate reporting of the amortization of debt issuance costs and debt discount. |
Venezuela
In January 2010, the Venezuelan government announced its decision to devalue its currency and implement a two-tier exchange rate structure. As a result, the official exchange rate changed from 2.15 to 2.60 for essential goods and 4.30 for non-essential goods. We remeasure most income statement items of our Venezuelan subsidiary at the rate at which we expect to remit dividends, which currently is 4.30. Our Venezuelan subsidiary represents less than 1% of consolidated assets and less than 2% of consolidated net sales as of May 1, 2011 and for the Successor Period and Predecessor Period combined, respectively.
On May 17, 2010, the Venezuelan government enacted reforms to its foreign currency exchange control regulations to close down the parallel exchange market. On June 9, 2010, the Venezuelan government enacted additional reforms to its exchange control regulations and introduced a newly regulated foreign currency exchange system, Sistema de Transacciones con Titulos en Moneda Extranjera (“SITME”), which is controlled by the Central Bank of Venezuela (“BCV”). Foreign currency exchange transactions not conducted through the Venezuelan government’s Foreign Exchange Administrative Commission, CADIVI, or SITME may not comply with the exchange control regulations, and could therefore be considered illegal. The SITME imposes volume restrictions on the conversion of Venezuelan bolivar fuerte to U.S. dollar, currently limiting such activity to a maximum equivalent of $350,000 per month. As a result of the enactment of the reforms to the exchange control regulations, we changed the rate we used to remeasure Venezuelan bolivar fuerte-denominated transactions from the parallel exchange rate to a rate approximating the SITME rate specified by the BCV, which was quoted at 5.30 Venezuelan bolivar fuertes per U.S. dollar on May 1, 2011, and resulted in an immaterial impact to our statement of income (loss) for both the Successor Period and the Predecessor Period.
On December 30, 2010, the Venezuelan government announced that the exchange rate of 2.60 for essential goods was being eliminated. The impact was not material to our results of operations for both the Successor Period and the Predecessor Period.
Inflation in Venezuela has been at high levels over the past several years. We monitor the cumulative inflation rate using the blended Consumer Price Index and National Consumer Price Index. Based upon the three-year cumulative inflation rate, we began treating
39
Table of Contents
Venezuela as a highly inflationary economy effective with the beginning of the fourth quarter of fiscal 2010. Accordingly, the functional currency for our Venezuelan subsidiary is the U.S. dollar and beginning in the fourth quarter of fiscal 2010 the impact of Venezuelan currency fluctuations is recorded in earnings.
Fiscal 2010 vs. Fiscal 2009
Net sales
| Fiscal Year | ||||||||||||||||||||||||
| 2010 | 2009 | Change | % Change | Volume (a) | Rate (b) | |||||||||||||||||||
| (in millions, except percentages) | ||||||||||||||||||||||||
| Net sales: |
||||||||||||||||||||||||
| Pet Products |
$ | 1,750.0 | $ | 1,673.4 | $ | 76.6 | 4.6 | % | (2.7 | %) | 7.3 | % | ||||||||||||
| Consumer Products |
1,989.8 | 1,953.5 | 36.3 | 1.9 | % | 0.5 | % | 1.4 | % | |||||||||||||||
| Total |
$ | 3,739.8 | $ | 3,626.9 | $ | 112.9 | 3.1 | % | ||||||||||||||||
| (a) | This column represents the change, as compared to the prior year period, due to volume and mix. Volume represents the change resulting from the number of units sold, exclusive of any change in price. Volume changes in the above table include elasticity, the volume decline associated with price increases. Mix represents the change attributable to shifts in volume across products or channels. |
| (b) | This column represents the change, as compared to the prior year period, attributable to per unit changes in net sales or cost of products sold. |
Net sales increased by $112.9 million, or 3.1%, in fiscal 2010 compared to fiscal 2009. The increase was due to increased net sales in both our Pet Products and Consumer Products segments, driven by growth in existing products. The benefit of fiscal 2009 pricing actions, net of elasticity (the volume decline associated with price increases), as well as new product sales in Consumer Products also contributed to the growth in net sales. These increases were partially offset by the lower volume due to one extra week in fiscal 2009.
Net sales in our Pet Products segment increased $76.6 million, or 4.6%, in fiscal 2010 compared to fiscal 2009. The increase was driven by fiscal 2009 pricing actions, net of elasticity (the volume decline associated with price increases). In addition, increased volume of existing pet snacks and dry pet food as a result of category growth and promotional activities and new product sales contributed to the increase in net sales, partially offset by lower volume due to one extra week in fiscal 2009.
Net sales in our Consumer Products segment increased by $36.3 million, or 1.9%, in fiscal 2010 compared to fiscal 2009. This increase was primarily driven by growth in existing product volume, new product sales and net pricing, partially offset by lower volume due to one extra week in fiscal 2009. The increase in existing product volume was driven by fruit and vegetables as we strategically managed our price gaps through trade spending and lower margin South American sales.
Cost of products sold
Cost of products sold decreased by $112.1 million, or 4.3%, in fiscal 2010 compared to fiscal 2009. This decrease was primarily due to continued productivity savings and flat gross costs, which included lower commodity and transportation-related costs, partially offset by higher packaging and raw product costs. Lower overall volumes also contributed to the decrease in cost of products sold.
Gross margin
Our gross margin percentage for fiscal 2010 increased 5.2 points to 32.9% compared to 27.7% for fiscal 2009. Gross margin was impacted by a 2.9 margin point increase due to net pricing, a 1.7 margin point increase related to the lower costs noted above and a 0.6 margin point increase due to product mix resulting primarily from broth, vegetable and pet snacks sales.
Selling, general and administrative expenses
Selling, general and administrative (“SG&A”) expenses increased by $77.9 million, or 12.1%, during fiscal 2010 compared to fiscal 2009. This increase was primarily driven by a $76.2 million, or 54%, increase in marketing costs reflecting increased investments behind key brands consistent with our Accelerated Growth Plan. In addition, compensation and benefit costs related to stock compensation, our pension plan and our Annual Incentive Program were also higher in fiscal 2010 than in fiscal 2009. These higher SG&A costs were partially offset by lower transportation costs, the absence of costs incurred in fiscal 2009 to centralize our marketing function in San Francisco and lower intangible asset impairments in fiscal 2010 than in fiscal 2009.
40
Table of Contents
Operating income
| Fiscal Year | ||||||||||||||||
| 2010 | 2009 | Change | % Change | |||||||||||||
| (in millions, except percentages) | ||||||||||||||||
| Operating income: |
||||||||||||||||
| Pet Products |
$ | 355.5 | $ | 219.9 | $ | 135.6 | 61.7 | % | ||||||||
| Consumer Products |
222.6 | 195.1 | 27.5 | 14.1 | % | |||||||||||
| Corporate (a) |
(70.1 | ) | (54.1 | ) | (16.0 | ) | (29.6 | %) | ||||||||
| Total |
$ | 508.0 | $ | 360.9 | $ | 147.1 | 40.8 | % | ||||||||
| (a) | Corporate represents expenses not directly attributable to reportable segments. |
Operating income increased by $147.1 million, or 40.8%, during fiscal 2010 compared to fiscal 2009, due to the increase in net sales and decreased cost of products sold noted above, partially offset by increased marketing expense.
Our Pet Products segment’s operating income increased by $135.6 million, or 61.7%, during fiscal 2010 compared to fiscal 2009. This increase was driven primarily by net pricing and decreased commodity and transportation costs, partially offset by the increase in marketing expenses, all as noted above.
Our Consumer Products segment’s operating income increased by $27.5 million, or 14.1%, during fiscal 2010 compared to fiscal 2009. This increase was driven primarily by net pricing and favorable product mix, partially offset by increased packaging and raw product costs and increased marketing costs noted above.
Our Corporate expenses increased by $16.0 million, or 29.6%, in fiscal 2010 compared to fiscal 2009 primarily driven by an increase in compensation and benefit costs related to stock compensation, our pension plan and our Annual Incentive Program.
Interest expense
Interest expense increased by $6.0 million, or 5.4%, in fiscal 2010 compared to fiscal 2009. This increase was driven by $24.8 million in refinancing expense recognized in fiscal 2010, partially offset by lower debt levels and lower average interest rates.
Provision for income taxes
The effective tax rate for continuing operations for fiscal 2010 was 36.6% compared to 34.8% for fiscal 2009. The increase in the tax rate was primarily due to the benefit recorded in fiscal 2009 relating to the retroactive extension of a tax credit for companies operating in American Samoa. We have not received any additional tax benefits from this tax law change since fiscal 2009 due to the sale of the StarKist Seafood business.
Income from discontinued operations
The income from discontinued operations of $2.3 million for fiscal 2010 is primarily related to minor activities as we perform the final wind-down of items related to the StarKist Seafood Business, which was sold in October 2008. The income from discontinued operations of $24.6 million for fiscal 2009 primarily represents the gain on the sale of our StarKist Seafood Business.
Liquidity and Capital Resources
We have cash requirements that vary based primarily on the timing of our inventory production for fruit, vegetable and tomato items. Inventory production relating to these items typically peaks during the first and second fiscal quarters. Our most significant cash needs relate to this seasonal inventory production, as well as to continuing cash requirements related to the production of our other products. In addition, our cash is used for the repayment, including interest and fees, of our primary debt obligations (i.e. our revolver, our term loans, our senior notes and, if necessary, our letters of credit), contributions to our pension plans, expenditures for capital assets, lease payments for some of our equipment and properties and other general business purposes. We have also used cash for acquisitions and transformation and restructuring plans. We may from time to time consider other uses for our cash flow from operations and other sources of cash. Such uses may include, but are not limited to, future acquisitions or transformation or restructuring plans. We may need to use our cash flow to satisfy other obligations, including in connection with the existing shareholder litigation. See “Item 3. Legal Proceedings” for a description of the existing shareholder litigation. Our primary sources of cash are typically funds we receive as payment for the products we produce and sell and from our revolver.
41
Table of Contents
We made contributions to our defined benefit pension plan of $40.0 million in the Predecessor Period. No contributions to our defined benefit pension plan were made in the Successor Period. We currently meet and plan to continue to meet the minimum funding levels required under the Pension Protection Act of 2006 (the “Act”). The Act imposes certain consequences on our defined benefit plan if it does not meet the minimum funding levels. We have made contributions in excess of our required minimum amounts during the Predecessor Period and during fiscal 2010. Although our qualified pension plan is overfunded as of May 1, 2011, due to uncertainties of future funding levels as well as plan financial returns, we cannot predict whether we will continue to be fully funded. We currently expect to make contributions of approximately $15.0 million in fiscal 2012.
We believe that cash on hand, cash flow from operations and availability under our revolver will provide adequate funds for our working capital needs, planned capital expenditures, debt service obligations and planned pension plan contributions for at least the next 12 months.
Description of Indebtedness
The summary of our indebtedness and restrictive and financial covenants set forth below is qualified by reference to our senior secured term loan credit agreement, our senior secured asset-based revolving facility, our senior note indenture, and the amendments thereto, all of which are set forth as exhibits to our public filings with the Securities and Exchange Commission (“SEC”).
Senior Secured Term Loan Credit Agreement
On March 8, 2011, in connection with the Merger, DMFC entered into a new senior secured term loan credit agreement (the “Senior Secured Term Loan Credit Agreement”) with the lenders party thereto, JPMorgan Chase Bank, N.A., as administrative agent and collateral agent, and the other agents named therein, that provides for a $2,700.0 million senior secured term loan B facility (with all related loan documents, and as amended from time to time, the “Term Loan Facility”) with a term of seven years. As discussed in “Note 1. Business and Basis of Presentation” to our consolidated financial statements in this Annual Report on Form 10-K, on April 26, 2011, DMFC merged with and into DMC and DMC assumed all of the obligations of DMFC under the Term Loan Facility.
Interest Rates. Loans under the Term Loan Facility bear interest at a rate equal to an applicable margin, plus, at our option, either (i) a LIBOR rate (with a floor of 1.50%) or (ii) a base rate (with a floor of 2.50%) equal to the highest of (a) the federal funds rate plus 0.50%, (b) JPMorgan Chase Bank, N.A.’s “prime rate” and (c) the one-month LIBOR rate plus 1.00%. The applicable margin with respect to LIBOR borrowings is 3.00% and with respect to base rate borrowings is 2.00%. See “Note 8. Derivative Financial Instruments” to our consolidated financial statements in this Annual Report on Form 10-K for a discussion of our interest rate swaps.
Principal Payments. The Term Loan Facility requires quarterly scheduled principal payments of 0.25% of the outstanding principal (which is currently $6.75 million) per quarter from September 30, 2011 to December 31, 2017. The balance is due in full on the maturity date of March 8, 2018. Scheduled principal payments with respect to the Term Loan Facility are subject to reduction on a pro rata basis upon mandatory and voluntary prepayments on terms and conditions set forth in the Senior Secured Term Loan Credit Agreement. As of May 1, 2011, the amount of outstanding loans under the Term Loan Facility was $2,700.0 million and the interest rate payable was 4.62%.
The Senior Secured Term Loan Credit Agreement also requires us to prepay outstanding loans under the Term Loan Facility, subject to certain exceptions, with, among other things:
| • | Commencing with our fiscal year ending April 29, 2012, 50% (which percentage will be reduced to 25% if our leverage ratio is 5.5x or less and to 0% if our leverage ratio is 4.5x or less) of our annual excess cash flow, as defined in the Senior Secured Term Loan Credit Agreement; |
| • | 100% of the net cash proceeds of certain casualty events; |
| • | 100% of the net cash proceeds of all of our non-ordinary course asset sales or other dispositions of property, subject to our right to reinvest the proceeds; and |
| • | 100% of the net cash proceeds of any incurrence of debt, other than proceeds from the debt permitted under the Senior Secured Term Loan Credit Agreement. |
Ability to Incur Additional Indebtedness. We have the right to request an additional $500.0 million plus an additional amount of secured indebtedness under the Term Loan Facility. Lenders under this facility are under no obligation to provide any such additional loans, and any such borrowings will be subject to customary conditions precedent, including satisfaction of a prescribed leverage ratio, subject to the identification of willing lenders and other customary conditions precedent.
42
Table of Contents
Senior Secured Asset-Based Revolving Facility
On March 8, 2011, in connection with the Merger, DMFC entered into a credit agreement (the “Senior Secured Asset-Based Revolving Credit Agreement”) with Bank of America, N.A., as administrative agent, and the other lender and agent parties thereto, that provides for senior secured financing of up to $750.0 million (with all related loan documents, and as amended from time to time, the “ABL Facility”) with a term of five years. As discussed in “Note 1. Business and Basis of Presentation” to our consolidated financial statements in this Annual Report on Form 10-K, on April 26, 2011, DMFC merged with and into DMC, and DMC, which was already a borrower under the Senior Secured Asset-Based Revolving Credit Agreement, assumed all of the obligations of DMFC under the ABL Facility.
Interest Rates. Borrowings under the ABL Facility bear interest at an initial interest rate equal to an applicable margin, plus, at our option, either (i) a LIBOR rate, or (ii) a base rate equal to the highest of (a) the federal funds rate plus 0.50%, (b) Bank of America, N.A.’s “prime rate” and (c) the one-month LIBOR rate plus 1.00%. The applicable margin with respect to LIBOR borrowings will initially be 2.25% (and may decrease to 2.00% or increase to 2.50% depending on average excess availability) and with respect to base rate borrowings will initially be 1.25% (and may decrease to 1.00% or increase to 1.50% depending on average excess availability).
Commitment Fees. In addition to paying interest on outstanding principal under the ABL Facility, we are required to pay a commitment fee at an initial rate of 0.500% per annum in respect of the unutilized commitments thereunder. The commitment fee rate may be reduced to 0.375% depending on the amount of excess availability under the ABL Facility. We must also pay customary letter of credit fees and fronting fees for each letter of credit issued.
Availability under the ABL Facility. Availability under the ABL Facility is subject to a borrowing base. The borrowing base, determined at the time of calculation, is an amount equal to: (a) 85% of eligible accounts receivable and (b) the lesser of (1) 75% of the book value of eligible inventory and (2) 85% of the net orderly liquidation value of eligible inventory, of the borrowers under the facility at such time, less customary reserves. The ABL Facility will mature, and the commitments thereunder will terminate, on March 8, 2016. As of May 1, 2011, there were no loans outstanding under the ABL Facility, the amount of letters of credit issued under the ABL Facility was $35.3 million and the net availability under the ABL Facility was $506.2 million.
The ABL Facility includes a sub-limit for letters of credit and for borrowings on same-day notice, referred to as “swingline loans.” No new letters of credit were issued under the ABL Facility on March 8, 2011 but certain letters of credit outstanding under a prior credit facility were deemed to be outstanding under the ABL Facility. We are the lead borrower under the ABL Facility and other domestic subsidiaries may be designated as borrowers on a joint and several basis.
Ability to Incur Additional Indebtedness. The commitments under the ABL Facility may be increased, subject only to the consent of the new or existing lenders providing such increases, such that the aggregate principal amount of commitments does not exceed $1.0 billion. The lenders under this facility are under no obligation to provide any such additional commitments, and any increase in commitments will be subject to customary conditions precedent. Notwithstanding any such increase in the facility size, our ability to borrow under the facility will remain limited at all times by the borrowing base (to the extent the borrowing base is less than the commitments).
Guarantee of Obligations under the Senior Secured Term Loan Credit Agreement and Senior Secured Asset-Based Revolving Credit Agreement
All our obligations under the Senior Secured Term Loan Credit Agreement and Senior Secured Asset-Based Revolving Credit Agreement are unconditionally guaranteed by Parent and by substantially all our existing and future, direct and indirect, wholly-owned material restricted domestic subsidiaries, subject to certain exceptions. Currently, there are no guarantor subsidiaries under any of our debt agreements.
Senior Notes Due 2019
On February 16, 2011, Blue Sub consummated a private placement offering of senior notes due February 16, 2019 with an aggregate principal amount of $1,300.0 million and a stated interest rate of 7.625% (the “7.625% Notes”). Upon consummation of the Merger, DMFC assumed Blue Sub’s obligations under the 7.625% Notes and related indenture (the indenture hereinafter referred to as the “Senior Notes Indenture”). As discussed in “Note 1. Business and Basis of Presentation” to our consolidated financial statements in this Annual Report on Form 10-K, on April 26, 2011, DMFC merged with and into DMC, and DMC, which was already a guarantor under the Senior Notes Indenture, assumed all of the obligations of DMFC under the Senior Notes Indenture and all related documents.
43
Table of Contents
Interest Rate. Interest on the 7.625% Notes is payable semi-annually on February 15 and August 15 of each year commencing August 15, 2011.
Guarantee. The 7.625% Notes are required to be fully and unconditionally guaranteed by each of our existing and future domestic restricted subsidiaries that guarantee our obligations under the Term Loan Facility and ABL Facility.
Redemption Rights. Prior to February 15, 2014, we have the option of redeeming (a) all or a part of the 7.625% Notes at 100% of the principal amount plus a “make whole” premium, or, using the proceeds from certain equity offerings and subject to certain conditions, (b) up to 35% of the then-outstanding 7.625% Notes at a premium of 107.625% of the aggregate principal amount and a special interest payment. Beginning on February 15, 2014, we may redeem all or a part of the 7.625% Notes at a premium ranging from 103.813% to 101.906% of the aggregate principal amount. Finally, beginning on February 15, 2016, we may redeem all or a part of the 7.625% Notes at face value. Any redemption as described above is subject to the concurrent payment of accrued and unpaid interest, if any, upon redemption.
Registration Obligations. Pursuant to the terms of a registration rights agreement, we are obligated, among other things, to use our commercially reasonable efforts to file and cause to become effective an exchange offer registration statement with the SEC with respect to a registered offer (the “Exchange Offer”) to exchange the 7.625% Notes for freely tradable notes having substantially identical terms as the 7.625% Notes. Under certain circumstances, in lieu of a registered exchange offer, we are obligated to file a shelf registration statement with the SEC with respect to the resale of the 7.625% Notes. In the event that the Exchange Offer is not consummated (or, as applicable the shelf registration statement is not declared effective) on or prior to the 365th day from the issue date of the 7.625% Notes, the annual interest rate borne by the 7.625% Notes will be increased by 0.25%. The annual interest rate on the 7.625% Notes will increase by an additional 0.25% for each subsequent 90-day period during which the registration default continues, up to a maximum additional interest rate of 1.0% per year over the applicable interest rate described above. If the registration default is corrected, the applicable interest rate on such 7.625% Notes will revert to the original level.
Security Interests
Indebtedness under the Term Loan Facility is generally secured by a first priority lien on substantially all of our assets, and by a second priority lien with respect to inventories and accounts receivable. The ABL Facility is generally secured by a first priority lien on our inventories and accounts receivable and by a second priority lien on substantially all of our other assets. The 7.625% Notes are our senior unsecured obligations and rank senior in right of payment to the existing and future indebtedness and other obligations that expressly provide for their subordination to the 7.625% Notes; rank equally in right of payment to all of the existing and future unsecured indebtedness; are effectively subordinated to all of the existing and future secured debt (including obligations under the Term Loan Facility and ABL Facility described above) to the extent of the value of the collateral securing such debt; and are structurally subordinated to all existing and future liabilities, including trade payables, of the non-guarantor subsidiaries, to the extent of the assets of those subsidiaries.
Prior Credit Facility
Our prior credit facility consisted of a $500.0 million five-year revolving credit facility (the “Revolver”) that was scheduled to mature on January 30, 2015 and a $600.0 million five-year Term A facility (the “Term A Facility”) that was scheduled to mature on January 30, 2015 (the “Prior Credit Facility”). The Revolver included a letter of credit subfacility of $150.0 million. The interest rate spread for the Revolver and the Term A Facility was adjusted periodically based on the total debt ratio and was a maximum of 2.75% over the Eurodollar rate or 1.75% over the base rate. To maintain availability of funds under the Revolver, we paid a 0.50% commitment fee on the unused portion of the revolving credit facility. The commitment fee had been reduced to 0.375% prior to the termination of the credit facility. We borrowed $491.6 million under the Revolver, and repaid a total of $491.6 million for the period May 3, 2010 through March 7, 2011. On March 8, 2011, in connection with the Merger, we repaid in full all outstanding loans together with interest and all other amounts due under the Prior Credit Facility and terminated the Prior Credit Facility.
Tender Offer for Senior Subordinated Notes
In connection with the Merger, Blue Sub commenced a cash tender offer for the outstanding 6 3/4% Notes and the outstanding 7 1/2% Notes. Upon consummation of the Merger, DMFC assumed Blue Sub’s obligations in connection with the tender offer. Pursuant to the tender offer, $241.6 million aggregate principal amount of the 6 3/4% Notes and $447.9 million aggregate principal amount of the 7 1/2% Notes were purchased. Aggregate principal amounts of $8.4 million for the 6 3/4% Notes and $2.1 million for the 7 1/2% Notes were not tendered and remained outstanding until April 8, 2011, when we redeemed them.
Deferred Debt Issuance and Debt Extinguishment Costs
In connection with entering into the Senior Secured Term Loan Credit Agreement, the Senior Secured Asset-Based Revolving Credit Agreement and the Senior Notes Indenture, we capitalized $164.2 million of deferred debt issuance costs; these costs will be
44
Table of Contents
amortized as interest expense over the term of the related debt instrument. In connection with the tender offers for the 6 3/4% Notes and 7 1/2% Notes, we recognized $15.8 million of expense (included in other (income) expense for the Successor Period) which represents the excess cash consideration paid in connection with the tender offers and redemption of the remaining senior subordinated notes over the fair value of the senior subordinated notes as of the Merger date. In addition, in accordance with the acquisition method of accounting described in “Note 3. Merger” to our consolidated financial statements in this Annual Report on Form 10-K, outstanding debt immediately prior to the Merger was recorded on the opening balance sheet for the Successor Period at fair value. Because we adjusted the book value of the Prior Credit Facility and senior subordinated notes to fair value, $25.2 million of debt issuance costs and $94.2 million of debt extinguishment costs (including tender offer premiums) were reflected as a fair value adjustment rather than being written off.
Maturities
As of May 1, 2011, scheduled maturities of long-term debt are as follows (in millions)1:
| 2012 |
$ | 20.3 | ||
| 2013 |
27.0 | |||
| 2014 |
27.0 | |||
| 2015 |
27.0 | |||
| 2016 |
27.0 | |||
| Thereafter |
3,871.7 |
| 1 | Does not include any excess cash flow or other principal prepayments that may be required under the terms of the Senior Secured Term Loan Credit Agreement, as described above. |
Restrictive and Financial Covenants
The Term Loan Facility, ABL Facility and the Senior Notes Indenture contain restrictive covenants that limit our ability and the ability of our subsidiaries to take certain actions.
Term Loan Facility and ABL Facility Restrictive Covenants. The restrictive covenants in the Senior Secured Term Loan Credit Agreement and the Senior Secured Asset-Based Revolving Credit Agreement include covenants limiting our ability, and the ability of our restricted subsidiaries, to incur additional indebtedness, create liens, engage in mergers or consolidations, sell or transfer assets, pay dividends and distributions or repurchase our capital stock, make investments, loans or advances, prepay certain indebtedness, engage in certain transactions with affiliates, amend agreements governing certain subordinated indebtedness adverse to the lenders, and change our lines of business.
Senior Notes Indenture Restrictive Covenants. The restrictive covenants in the Senior Notes Indenture include covenants limiting our ability to, among other things, pay dividends or make other payments, incur additional debt, issue stock, create certain liens or encumbrances, enter into transactions with affiliates, sell, lease or transfer substantially all of its assets and to allow our restricted subsidiaries to make payments to us or incur indebtedness.
Financial Maintenance Covenants. The Term Loan Facility, ABL Facility and Senior Notes Indenture generally do not require that we comply with financial maintenance covenants. The ABL Facility, however, contains a financial covenant that applies if availability under the ABL Facility falls below a certain level.
Effect of Restrictive and Financial Covenants. The restrictive and financial covenants in the Senior Secured Term Loan Credit Agreement, the Senior Secured Asset-Based Revolving Credit Agreement and Senior Notes Indenture may adversely affect our ability to finance our future operations or capital needs or engage in other business activities that may be in our interest, such as acquisitions.
We believe that we are currently in compliance with all of our restrictive and financial covenants and were in compliance therewith as of May 1, 2011. Compliance with these covenants is monitored periodically in order to assess the likelihood of continued compliance. Our ability to continue to comply with these covenants may be affected by events beyond our control. If we are unable to comply with the covenants under the Senior Secured Term Loan Credit Agreement, the Senior Secured Asset-Based Revolving Credit Agreement and Senior Notes Indenture, there would be a default, which, if not waived, could result in the acceleration of a significant portion of our indebtedness. See “Item 1A. Risk Factors—Restrictive covenants in the Credit Facilities and the indenture governing the Notes may restrict our operational flexibility. If we fail to comply with these restrictions, we may be required to repay our debt, which would materially and adversely affect our financial position and results of operations.”
Dividends and Stock Repurchases
During the Predecessor Period aggregate dividends of $53.0 million were declared, and dividends of $62.9 million were paid. During fiscal 2010, aggregate dividends of $39.6 million were declared, and dividends of $37.6 million were paid.
45
Table of Contents
On June 10, 2010, DMFC announced that its Board had authorized the repurchase of up to $350.0 million of DMFC common stock over the next 36 months. The new authorization superseded and replaced the previous $200.0 million share repurchase authorization that was scheduled to expire in September 2010. On June 22, 2010, DMFC entered into an accelerated stock buyback agreement (“ASB”) with Goldman Sachs & Co. (“Goldman Sachs”). Under the ASB, we paid Goldman Sachs $100 million on June 25, 2010 from available cash on hand and received 6,215,470 shares of DMFC common stock from Goldman Sachs on that date. Final settlement of this agreement occurred on August 2, 2010, resulting in our receiving an additional 885,413 shares of DMFC common stock. The total number of shares that we ultimately repurchased under the ASB was generally based on the average daily volume-weighted average share price of DMFC common stock over the duration of the transaction.
On March 11, 2011 DMFC filed a Notice of Effectiveness delisting from the New York Stock Exchange as a direct result of the Merger.
The 7.625% Notes and the credit agreements relating to our $2.7 billion Term Loan Facility and $0.75 billion ABL Facility contain certain covenants, including, among other things, covenants that restrict our ability and the ability of certain of our subsidiaries to pay dividends subject to certain exceptions.
Obligations and Commitments
Contractual and Other Cash Obligations
The following table summarizes our contractual and other cash obligations at May 1, 2011:
| Payments due by period | ||||||||||||||||||||
| Total | Less than 1 year |
1 - 3 years |
3 - 5 years |
More than 5 years |
||||||||||||||||
| (in millions) | ||||||||||||||||||||
| Long-term debt obligations (1) |
$ | 5,643.1 | $ | 243.9 | $ | 497.7 | $ | 492.7 | $ | 4,408.8 | ||||||||||
| Capital lease obligations |
— | — | — | — | — | |||||||||||||||
| Operating lease obligations |
235.4 | 50.2 | 73.5 | 52.9 | 58.8 | |||||||||||||||
| Purchase obligations (2) |
1,182.3 | 664.5 | 314.3 | 129.7 | 73.8 | |||||||||||||||
| Other long-term liabilities reflected on the Balance Sheet (3) |
252.9 | — | 67.8 | 55.3 | 129.8 | |||||||||||||||
| Total contractual obligations |
$ | 7,313.7 | $ | 958.6 | $ | 953.3 | $ | 730.6 | $ | 4,671.2 | ||||||||||
| (1) | Includes interest expense calculated using the stated interest rate for the 7.625% Notes and the interest rate at May 1, 2011 for the Term Loan Facility, as described above. Does not include any excess cash flow or other principal prepayments that may be required under the terms of the Senior Secured Term Loan Credit Agreement, as described above. |
| (2) | Purchase obligations consist primarily of fixed commitments under supply, ingredient, packaging, co-pack, grower commitments and other agreements. The amounts presented in the table do not include items already recorded in accounts payable and accrued expenses at May 1, 2011, nor does the table reflect obligations we are likely to incur based on our plans, but are not currently obligated to pay. Many of our contracts are requirement contracts and currently do not represent a firm commitment to purchase from our suppliers, and therefore, are not reflected in the above table. However, certain of our suppliers commit resources based on our planned purchases and we would likely be liable for a portion of their expenses if we deviated from our communicated plans. In the above table, we have included estimates of the probable “breakage” expenses we would incur with these suppliers if we stopped purchasing from them as of May 1, 2011. Aggregate future payments for our grower commitments are estimated based on May 1, 2011 pricing and volume for the twelve months ended May 1, 2011. Aggregate future payments under employment agreements are estimated generally assuming that each such employee will continue providing services for the next five fiscal years, that salaries remain at May 1, 2011 levels, and that annual incentive awards to be paid with respect to each fiscal year shall be equal to the amounts actually paid with respect to fiscal 2010, the most recent period for which annual incentive awards have been paid as of May 1, 2011. Aggregate future payments under severance agreements do not include possible costs associated with outplacement services generally provided to executive officers whose employment is terminated without cause since such amounts have been minimal. Aggregate future payments under the monitoring agreement with the Sponsors is estimated as the minimum payment for five years. |
| (3) | As of May 1, 2011, we had non-current unrecognized tax benefits of $8.4 million ($7.5 million net of tax benefits). We are not able to reasonably estimate the timing of future cash flows related to this amount. As a result, this amount is not included in the table above. |
46
Table of Contents
Standby Letters of Credit
We have standby letters of credit for certain obligations related to insurance requirements and our South America operations. The majority of our standby letters of credit are automatically renewed annually, unless the issuer gives cancellation notice in advance. On May 1, 2011, we had $35.3 million of outstanding standby letters of credit.
Cash Flow
In the Successor Period, the Predecessor Period, fiscal 2010 and fiscal 2009 our cash and cash equivalents increased/(decreased) by $57.6 million, $93.9 million, ($89.0) million and $117.0 million, respectively.
| Successor | Predecessor | |||||||||||||||||
| March 8, 2011 through May 1, 2011 |
May 3,
2010 through March 7, 2011 |
Fiscal 2010 |
Fiscal 2009 |
|||||||||||||||
| (in millions | ) | (in millions) | ||||||||||||||||
| Net cash provided by operating activities |
$ | 85.2 | $ | 254.3 | $ | 355.9 | $ | 200.6 | ||||||||||
| Net cash provided by (used in) investing activities |
(3,882.7 | ) | (66.1 | ) | (104.9 | ) | 277.1 | |||||||||||
| Net cash provided by (used in) financing activities |
4,002.6 | (91.5 | ) | (336.2 | ) | (361.3 | ) | |||||||||||
Operating Activities
Cash provided by operating activities during the Successor Period and Predecessor Period combined decreased $16.4 million compared to $355.9 million in fiscal 2010. This decrease was driven by transaction costs paid in connection with the Merger, partially offset by lower inventory balances and lower cash payments for interest. We also had lower cash tax payments as a result of the Merger.
Cash provided by operating activities during fiscal 2010 was $355.9 million compared to $200.6 million in fiscal 2009. This $155.3 million increase was driven by increased net income.
Investing Activities
Cash used in investing activities was $3,882.7 million during the Successor Period, which consisted of $3,856.9 million paid in connection with the Merger and capital expenditures of $25.8 million. Cash used in investing activities was $66.1 million during the Predecessor Period and was comprised entirely of capital expenditures.
Cash used in investing activities was $104.9 million during fiscal 2010, which represented capital expenditures.
Cash provided by investing activities was $277.1 million during fiscal 2009, which primarily consisted of $365.8 million from the sale of the StarKist Seafood Business, partially offset by capital expenditures of $88.7 million.
Capital expenditures in the Successor Period, the Predecessor Period, fiscal 2010 and fiscal 2009 were $25.8 million, $66.1 million, $104.9 million and $88.7 million, respectively. Capital spending for fiscal 2012 is expected to approximate $100.0 million and is expected to be funded by cash on hand and cash generated by operating activities. In addition to capital expenditures, we enter into operating leases to support our ongoing operations. The decision to lease, rather than purchase, an asset is the result of a number of considerations, including the cost of funds, the useful life of the asset, its residual value and technological obsolescence. Additionally, some equipment is proprietary to the lessor and cannot be purchased. All material asset-financing decisions include an evaluation of the potential impact of the financing on our debt agreements, including applicable financial covenants.
Financing Activities
During the Successor Period, we received net capital contributions in connection with the Merger of $1,548.8 million. We also received $3,993.3 million in proceeds from Merger-related financing and made $1,357.5 million in long-term debt payments in connection with the Merger. In connection with the Merger, we paid $164.2 million of costs related to the issuance of the 7.625% Notes and entering into the Term Loan Facility and ABL Facility and $15.8 million which represented the excess cash consideration paid in connection with the tender offers and redemption of the remaining senior subordinated notes over the fair value of the senior subordinated notes as of the Merger date.
During the Predecessor Period, we made scheduled repayments of long-term debt of $22.5 million and had proceeds from short-term debt of $4.9 million. In addition, we paid $62.9 million in dividends, paid $100.0 million for the repurchase of DMFC common stock and received $59.6 million of proceeds from the issuance of DMFC common stock.
During fiscal 2010, we made net repayments of debt of $269.0 million, paid $43.6 million of costs related to the issuance of the 7 1/2% Notes and the tender offer for previously outstanding 8 5/8% senior subordinated notes due 2012 and entering into the Prior Credit Facility, and paid $37.6 million in dividends. In addition, we received $12.3 million of proceeds from the issuance of DMFC common stock. During fiscal 2009, we used $361.3 million in financing activities, which consisted primarily of net short-term borrowings of $2.0 million, loan repayments of $333.8 million and $31.6 million in dividend payments.
47
Table of Contents
Make-Whole Payment Agreements
DMFC executive officers were entitled to receive a tax gross-up payment (referred to as a “280G gross-up payment”) in the event that payments made to them in connection with a change in control of the ownership of DMFC became subject to an excise tax pursuant to Section 280G and Section 4999 of the Internal Revenue Code. In December 2010, DMFC determined that the consummation of the Merger would be expected to trigger the imposition of this excise tax with respect to payments made to certain executive officers, which would oblige DMFC to make 280G gross-up payments to these executive officers.
On December 15, 2010, DMFC entered into limited “make-whole” payment agreements with seven executive officers in connection with option exercises in calendar 2010 (but after December 15, 2010) effected for the purpose of reducing DMFC’s potential liability to make 280G gross-up payments. A total of approximately 3.9 million options were exercised in calendar 2010 after December 15, 2010 by such executive officers, resulting in approximately $35.5 million of cash proceeds to DMFC.
By exercising options prior to the end of calendar 2010, each such executive officer increased the amount of taxable income recognized by him in calendar 2010. Increased taxable income recognized in calendar 2010 reduces, and if sufficiently high can eliminate entirely, DMFC’s obligation to make a 280G gross-up payment in connection with the Merger. The purpose of the “make-whole” payment is to compensate each such executive officer for any difference between the amount received for shares sold in connection with the option exercises, as compared to the consideration that would have been payable in the Merger in respect of these option shares if the executive officer had not exercised such options in calendar 2010.
Critical Accounting Policies and Estimates
Our discussion and analysis of the financial condition and results of operations are based upon our financial statements, which have been prepared in accordance with accounting principles generally accepted in the United States. The preparation of these financial statements requires us to make estimates and judgments that affect the reported amounts of assets, liabilities, revenues and expenses. On an ongoing basis, we reevaluate our estimates, including those related to trade promotions, goodwill and intangibles, retirement benefits, and retained-insurance liabilities. Estimates in the assumptions used in the valuation of our stock compensation expense are updated periodically and reflect conditions that existed at the time of each new issuance of stock awards. We base estimates on historical experience and on various other assumptions that we believe to be reasonable under the circumstances, the results of which form the basis for making judgments about the book values of assets and liabilities that are not readily apparent from other sources. For all of these estimates, we caution that future events rarely develop exactly as forecasted and therefore, these estimates routinely require adjustment.
Management has discussed the selection of critical accounting policies and estimates with the Audit Committee of the Board of Directors, and the Audit Committee has reviewed our disclosure relating to critical accounting policies and estimates in this Annual Report on Form 10-K. Our significant accounting policies are described in “Note 2. Significant Accounting Policies” to our consolidated financial statements in this Annual Report on Form 10-K. The following is a summary of the more significant judgments and estimates used in the preparation of our financial statements:
Trade Promotions
Trade promotions are an important component of the sales and marketing of our products, and are critical to the support of our business. Trade spending includes amounts paid to encourage retailers to offer temporary price reductions for the sale of our products to consumers, to advertise our products in their circulars, to obtain favorable display positions in their stores, and to obtain shelf space. We accrue for trade promotions, primarily at the time products are sold to customers, by reducing sales and recording a corresponding accrued liability. The amount we accrue is based on an estimate of the level of performance of the trade promotion, which is dependent upon factors such as historical trends with similar promotions, expectations regarding customer and consumer participation, and sales and payment trends with similar previously offered programs. Our original estimated costs of trade promotions are reasonably likely to change in the future as a result of changes in trends with regard to customer and consumer participation, particularly for new programs and for programs related to the introduction of new products. We perform monthly evaluations of our outstanding trade promotions; making adjustments, where appropriate, to reflect changes in our estimates. The ultimate cost of a trade promotion program is dependent on the relative success of the events and the actions and level of deductions taken by our customers for amounts they consider due to them. Final determination of the permissible trade promotion amounts due to a customer generally may take up to 18 months from the product shipment date. Our evaluations during the Successor Period and Predecessor Period resulted in combined net reductions to the trade promotion liability and increases in net sales from continuing operations of $11.3 million which related to prior year activity, of which $9.1 million related to our Consumer Products segment and $2.2 million related to our Pet Products segment. Our evaluations during fiscal 2010 resulted in net reductions to the trade promotion liability and increases in net sales from continuing operations of $10.3 million, which related to prior year activity, of which $7.3 million related to our Consumer Products segment and $3.0 million, related to our Pet Products segment. These adjustments represented approximately 1% of our trade promotion expense in both the Successor Period and Predecessor Period combined and fiscal 2010.
48
Table of Contents
Goodwill and Intangibles
Del Monte produces, distributes and markets products under many different brand names (also referred to as trademarks). During an acquisition, the purchase price is allocated to identifiable assets and liabilities, including brand names and other intangibles, based on estimated fair value, with any remaining purchase price recorded as goodwill. As a result of the Merger, we applied the acquisition method of accounting and established a new basis of accounting on March 8, 2011. Accordingly, each of our active brand names now has a value on our balance sheet.
We have evaluated our capitalized brand names and determined that some have lives that generally range from 5 to 25 years (“Amortizing Brands”) and others have indefinite lives (“Non-Amortizing Brands”). Non-Amortizing Brands typically have significant market share and a history of strong earnings and cash flow, which we expect to continue into the foreseeable future.
Amortizing Brands are amortized over their estimated lives. We review the asset groups containing Amortizing Brands (including related tangible assets) for impairment whenever events or changes in circumstances indicate that the book value of an asset group may not be recoverable. An asset or asset group is considered impaired if its book value exceeds the undiscounted future net cash flow the asset or asset group is expected to generate. If an asset or asset group is considered to be impaired, the impairment to be recognized is measured by the amount by which the book value of the asset exceeds its fair value. Non-Amortizing Brands and goodwill are not amortized, but are instead tested for impairment at least annually. Non-Amortizing Brands are considered impaired if the book value exceeds the estimated fair value. Goodwill is considered impaired if the book value of the reporting unit containing the goodwill exceeds its estimated fair value. If estimated fair value is less than the book value, the asset is written down to the estimated fair value and an impairment loss is recognized.
The estimated fair value of our Non-Amortizing Brands is determined using the relief from royalty method, which is based upon the estimated rent or royalty we would pay for the use of a brand name if we did not own it. For goodwill, the estimated fair value of a reporting unit is determined using the income approach, which is based on the cash flows that the unit is expected to generate over its remaining life, and the market approach, which is based on market multiples of similar businesses. Annually, we engage third-party valuation experts to assist in this process. Considerable management judgment is necessary in estimating future cash flows, market interest rates, discount rates and other factors affecting the valuation of goodwill and intangibles, including the operating and macroeconomic factors that may affect them. We use historical financial information, internal plans and projections, and industry information in making such estimates.
We did not recognize any impairment charges for our goodwill during the Successor Period, the Predecessor Period, fiscal 2010 or fiscal 2009. During the second quarter of fiscal 2010 we recognized an impairment charge of $3.0 million related to one of our Pet Products Non-Amortizing Brands and moved this brand from Non-Amortizing to Amortizing Brands. During fiscal 2009, as a result of a decision to discontinue five non-core pet brands, we recorded an impairment charge of $11.7 million related to Amortizing Brands. We did not recognize any impairment charges for our Amortizing Brands or Non-Amortizing Brands during the Successor Period or the Predecessor Period. As a result of the Merger, at May 1, 2011, we had $2,124.0 million of goodwill, $1,871.6 million of Non-Amortizing Brands, $81.6 million of Amortizing Brands, net of amortization and $875.5 million of customer relationships, net of amortization. The Pet Products segment has 93% of the goodwill and 68% of the Non-Amortizing Brands. The Del Monte brand itself, which is included in the Consumer Products segment, comprises 30% of Non-Amortizing Brands. The Meow Mix and Milk-Bone brands together, which are included in the Pet Products segment, comprise 41% of Non-Amortizing Brands. While we currently believe the fair value of all of our intangible assets equals or exceeds book value, materially different assumptions regarding future performance and discount rates could result in future impairment losses.
Retirement Benefits
We sponsor a non-contributory defined benefit pension plan (“DB plan”), defined contribution plans, multi-employer plans and certain other unfunded retirement benefit plans for our eligible employees. The amount of DB plan benefits eligible retirees receive is based on their earnings and age. Retirees may also be eligible for medical, dental and life insurance benefits (“other benefits”) if they meet certain age and service requirements at retirement. Generally, other benefit costs are subject to plan maximums, such that the Company and retiree both share in the cost of these benefits.
Our Assumptions. We utilize third-party actuaries to assist us in calculating the expense and liabilities related to the DB plan benefits and other benefits. DB plan benefits and other benefits which are expected to be paid are expensed over the employees’ expected service period. The actuaries measure our annual DB plan benefits and other benefits expense by relying on certain assumptions made by us. Such assumptions include:
| • | The discount rate used to determine projected benefit obligation and net periodic benefit cost (DB plan benefits and other benefits); |
49
Table of Contents
| • | The expected long-term rate of return on assets (DB plan benefits); |
| • | The rate of increase in compensation levels (DB plan benefits); and |
| • | Other factors including employee turnover, retirement age, mortality and health care cost trend rates. |
These assumptions reflect our historical experience and our best judgment regarding future expectations. The assumptions, the plan assets and the plan obligations are used to measure our annual DB plan benefits expense and other benefits expense.
Since the DB plan benefits and other benefits liabilities are measured on a discounted basis, the discount rate is a significant assumption. The discount rate was determined based on an analysis of interest rates for high-quality, long-term corporate debt at the measurement date. In order to appropriately match the bond maturities with expected future cash payments, we utilize differing bond portfolios to estimate the discount rates for the DB plan and for the other benefits. The discount rate used to determine DB plan and other benefits projected benefit obligation as of the balance sheet date is the rate in effect at the measurement date. The same rate is also used to determine DB plan and other benefits expense for the following fiscal year. The long-term rate of return for DB plan’s assets is based on our historical experience, our DB plan’s investment guidelines and our expectations for long-term rates of return. Our DB plan’s investment guidelines are established based upon an evaluation of market conditions, tolerance for risk, and cash requirements for benefit payments.
The following table presents the weighted-average assumptions used to determine our projected benefit obligations for our qualified DB plan and other benefits:
| May 1, 2011 |
May 2, 2010 |
|||||||
| Pension benefits |
||||||||
| Discount rate used in determining projected benefit obligation |
5.50 | % | 5.50 | % | ||||
| Rate of increase in compensation levels |
4.69 | % | 4.68 | % | ||||
| Other benefits |
||||||||
| Discount rate used in determining projected benefit obligation |
5.75 | % | 6.00 | % | ||||
The following table presents the weighted-average assumptions used to determine our periodic benefit cost for our qualified DB plan and other benefits:
| Successor | Predecessor | |||||||||||||||||
| March 8, 2011 through May 1, 2011 |
May 3,
2010 through March 7, 2011 |
Fiscal Year | ||||||||||||||||
| 2010 | 2009 | |||||||||||||||||
| Pension benefits |
||||||||||||||||||
| Discount rate used to determine periodic benefit cost |
5.50 | % | 5.50 | % | 7.90 | % | 6.75 | % | ||||||||||
| Rate of increase in compensation levels |
4.69 | % | 4.69 | % | 4.68 | % | 4.26 | % | ||||||||||
| Long-term rate of return on assets |
7.50 | % | 7.50 | % | 7.60 | % | 8.00 | % | ||||||||||
| Other benefits |
||||||||||||||||||
| Discount rate used to determine periodic benefit cost |
5.75 | % | 6.00 | % | 7.55 | % | 6.90 | % | ||||||||||
For measurement purposes, an 8.7% annual rate of increase in the per capita cost of covered health care benefits was assumed for the preferred provider organization plan and associated indemnity plans for the Successor Period and the Predecessor Period and a 9.0% annual rate of increase in the per capita cost of covered health care benefits was assumed in fiscal 2010. The rate of increase is assumed to decline gradually to 4.5%. For the health maintenance organization plans, a 9.5% annual rate of increase in the per capita cost of covered health care benefits was assumed for the Successor Period and the Predecessor Period and a 10% annual rate of increase in the per capita cost of covered health care benefits was assumed in fiscal 2010. The rate of increase is assumed to decline gradually to 4.5%. A 5.0% annual rate of increase in the per capita cost of covered health care benefits was assumed for the dental and vision plans for the Successor Period, the Predecessor Period and fiscal 2010.
50
Table of Contents
Sensitivity of Assumptions. If we assumed a 100 basis point change in the following assumptions, our projected benefit obligation and expense for the Successor Period and the Predecessor Period combined would increase (decrease) by the following amounts (in millions):
| +100 Basis Points |
-100 Basis Points |
|||||||
| Pension benefits |
||||||||
| Discount rate used in determining projected benefit obligation |
$ | (34.3 | ) | $ | 40.2 | |||
| Discount rate used in determining net pension expense |
(2.2 | ) | 2.5 | |||||
| Long-term rate of return on assets used in determining net pension expense |
(4.0 | ) | 4.0 | |||||
| Other benefits |
||||||||
| Discount rate used in determining projected benefit obligation |
(17.2 | ) | 21.4 | |||||
An increase in the assumed health care cost trend of 100 basis points in each year would increase the postretirement benefit obligation at May 1, 2011 by $19.2 million and the aggregate of the service and interest cost components of net periodic postretirement benefit cost for the Successor Period and the Predecessor Period combined by $1.8 million. A decrease in the assumed health care cost trend of 100 basis points would decrease the postretirement benefit obligation at May 1, 2011 by $15.8 million and the aggregate of the service and interest cost components of net periodic postretirement benefit cost for the Successor Period and the Predecessor Period combined by $1.4 million.
Future Expense. Our fiscal 2012 pension expense for our qualified DB plan is currently estimated to be approximately $3.9 million and other benefits expense is currently estimated to be approximately $9.9 million. These estimates incorporate our fiscal 2012 assumptions. Our actual future pension and other benefit expense amounts may vary depending upon the accuracy of our original assumptions and future assumptions.
Stock Compensation Expense
We believe an effective way to align the interests of certain employees with those of our equity stakeholders is through employee stock-based incentives. Stock options are stock incentives in which employees benefit to the extent that the stock price for the stock underlying the option exceeds the strike price of the stock option before expiration. A stock option is the right to purchase a share of common stock at a predetermined exercise price. Restricted stock incentives are stock incentives in which employees receive the right to own shares of common stock and do not require the employee to pay an exercise price. Restricted stock incentives include restricted stock units, performance share units and performance accelerated restricted stock units. We follow the fair value method of accounting for stock-based compensation, under which employee stock option grants and other stock-based compensation are expensed over the vesting period, based on the fair value at the time the stock-based compensation is granted.
Pre-Merger Stock Compensation
Prior to the Merger, we typically issued two types of employee stock-based incentives: stock options and restricted stock incentives.
For the stock options that we granted prior to the Merger, the employee’s exercise price was equivalent to our stock price on the date of the grant (as set forth in our prior stock incentive plan). Typically, employees vested in stock options in equal annual installments over a four-year period and such options generally had a ten-year term until expiration.
Restricted stock units vested over a period of time. Performance share units vested at predetermined points in time if certain corporate performance goals were achieved or were forfeited if such goals were not met. Performance accelerated restricted stock units vested at a point in time, which may have been accelerated if certain stock performance measures were achieved.
Stock-based awards outstanding prior to the Merger vested in full in connection with the Merger and were converted to either immediate cash payments or fully vested new options to purchase common stock of Parent.
The fair value of stock options granted for the Predecessor Period was $7.6 million.
Our Pre-Merger Stock Option Assumptions. We measured stock option expense for service-based options at the date of grant using the Black-Scholes valuation model. This model estimates the fair value of the options based on a number of assumptions, such as interest rates, employee exercises, the current price and expected volatility of common stock and expected dividends.
51
Table of Contents
The following table presents the weighted-average valuation assumptions used for the recognition of stock option expense for stock options granted during the Predecessor Period, fiscal 2010 and fiscal 2009:
| Predecessor | ||||||||||||
| May 3, 2010 through |
Fiscal Year | |||||||||||
| March 7, 2011 | 2010 | 2009 | ||||||||||
| Expected life (in years) |
6.0 | 6.0 | 6.1 | |||||||||
| Expected volatility |
29.4 | % | 28.5 | % | 26.4 | % | ||||||
| Risk-free interest rate |
1.7 | % | 2.7 | % | 3.2 | % | ||||||
| Dividend yield |
2.4 | % | 2.6 | % | 1.8 | % | ||||||
| Weighted average exercise price |
$ | 12.64 | $ | 11.37 | $ | 7.90 | ||||||
| Weighted average option value |
$ | 2.90 | $ | 2.69 | $ | 2.04 | ||||||
Valuation of Restricted Stock Incentives. The fair value of restricted stock units was calculated by multiplying the average of the high and low price of DMFC’s common stock on the date of grant by the number of shares granted. The fair value of performance share units was determined based on a model that considered the estimated probability of possible outcomes. For stock awards that were not credited with dividends during the vesting period, the fair value of the stock award was reduced by the present value of the expected dividend stream during the vesting period.
Post-Merger Stock Compensation
Subsequent to the Merger, Parent issued to certain of our executive officers and other employees service-based and performance-based stock options. Service-based stock options vest in equal annual installments over a five-year period and generally have a ten-year term until expiration. Performance-based stock options vest only if certain pre-determined performance criteria are met and also have a ten-year term.
Our Post-Merger Stock Option Assumptions. We measure stock option expense for service-based options at the date of grant using the Black-Scholes valuation model. This model estimates the fair value of the options based on a number of assumptions, such as interest rates, employee exercises, the current price and expected volatility of common stock and expected dividends. Not including rollover options which have no service requirement, the fair value of service-based stock options granted for the Successor Period was $7.6 million. The following table presents the weighted-average valuation assumptions used for the recognition of stock option expense for stock options granted during the Successor Period:
| Successor | ||||
| March 8, 2011 through May 1, 2011 |
||||
| Expected life (in years) |
6.5 | |||
| Expected volatility |
45.0 | % | ||
| Risk-free interest rate |
2.8 | % | ||
| Dividend yield |
0.0 | % | ||
| Weighted average exercise price |
$ | 5.00 | ||
| Weighted average option value |
$ | 2.42 | ||
Sensitivity of Assumptions (1). Regarding options granted subsequent to the Merger, if we assumed a 100 basis point change in the following assumptions or a one-year change in the expected life, the value of a newly granted hypothetical stock option would increase (decrease) by the following percentages:
| +100 Basis Points |
-100 Basis Points |
|||||||
| Expected life |
6.8 | % | (7.6 | %) | ||||
| Expected volatility |
1.6 | % | (1.6 | %) | ||||
| Risk-free interest rate |
3.7 | % | (3.8 | %) | ||||
| Dividend yield |
(9.8 | %) | NA | |||||
| (1) | Sensitivity to changes in assumptions was determined using the Black-Scholes valuation model with the following assumptions: stock price and exercise price equal to the fair value on March 8, 2011, expected life of six and a half years, risk-free interest rate based on the average of the rate for five-year and seven-year Treasury constant maturity bonds, average stock volatility used during the Successor Period, and expected dividend yield of 0.0%. |
52
Table of Contents
Valuation of Performance-based Options. The fair value of performance options was determined based on an option pricing model. Key inputs are an expected life of 7.5 years, expected volatility of 40%, and a risk-free rate of 2.22%. The fair value of performance-based stock options granted for the Successor Period was $4.4 million.
Retained-Insurance Liabilities
Our business exposes us to the risk of liabilities arising out of our operations. For example, liabilities may arise out of claims of employees, customers or other third parties for personal injury or property damage occurring in the course of our operations. We manage these risks through various insurance contracts from third-party insurance carriers. We, however, retain an insurance risk for the deductible portion of each claim. For example, the deductible under our loss-sensitive worker’s compensation insurance policy is up to $0.5 million per claim. A third-party actuary is engaged to assist us in estimating the ultimate costs of certain retained insurance risks. Actuarial determination of our estimated retained-insurance liability is based upon the following factors:
| • | Losses which have been reported and incurred by us; |
| • | Losses which we have knowledge of but have not yet been reported to us; |
| • | Losses which we have no knowledge of but are projected based on historical information from both our Company and our industry; and |
| • | The projected costs to resolve these estimated losses. |
Our estimate of retained-insurance liabilities is subject to change as new events or circumstances develop which might materially impact the ultimate cost to settle these losses. During the Successor Period and Predecessor Period combined we reduced our estimate of retained-insurance liabilities related to prior year by approximately $2.0 million primarily as a result of favorable claims history. During fiscal 2010 we increased our estimate of retained-insurance liabilities related to prior year by approximately $3.4 million primarily as a result of the escalation in healthcare costs on open prior year claims. This increase was partially offset by a $1.1 million reduction in retained insurance liabilities related to prior years as a result of the early closure of a claim.
| Item 7A. | Quantitative and Qualitative Disclosures about Market Risk |
We have a risk management program that was adopted with the objective of minimizing our exposure to changes in interest rates, commodity, transportation and other prices and foreign currency exchange rates. We do not trade or use instruments with the objective of earning financial gains on price fluctuations alone or use instruments where there are not underlying exposures. We believe that the use of derivative instruments to manage risk is in our best interest. Subsequent to the Merger, we made a policy decision to no longer seek hedge accounting for our derivative contracts. As of May 1, 2011 all of our derivative contracts were economic hedges.
During the twelve months ended May 1, 2011, we were primarily exposed to the risk of loss resulting from adverse changes in interest rates, commodity and other prices and foreign currency exchange rates.
Interest Rates: Our debt primarily consists of floating rate term loans and fixed rate notes. We also use our floating rate revolver primarily to fund seasonal working capital needs and other uses of cash. Interest expense on our floating rate debt is typically calculated based on a fixed spread over a reference rate, such as LIBOR (also known as the Eurodollar rate). Therefore, fluctuations in market interest rates will cause interest expense increases or decreases on a given amount of floating rate debt.
From time to time, we manage a portion of our interest rate risk related to floating rate debt by entering into interest rate swaps in which we receive floating rate payments and make fixed rate payments. On April 12, 2011, we entered into interest rate swaps with a total notional amount of $900.0 million, as the fixed rate payer. The interest rate swaps fix LIBOR at 3.029% for the term of the swaps. The swaps have an effective date of September 4, 2012 and a maturity date of September 1, 2015. On August 13, 2010, we entered into an interest rate swap, with a notional amount of $300.0 million, as the fixed rate payer. The interest rate swap fixes LIBOR at 1.368% for the term of the swap. The swap has an effective date of February 1, 2011 and a maturity date of February 3, 2014. The interest rate swaps had an impact of $16.9 million on other (income) expense for the period from March 8, 2011 through May 1, 2011 and an impact of $0.3 million on interest expense for the period from May 3, 2010 through March 7, 2011. The fair value of the Company’s interest rate swaps was recorded as a current liability of $3.2 million and a non-current liability of $14.0 million at May 1, 2011.
53
Table of Contents
Assuming average floating rate loans for a one year period equal to outstanding floating rate term loans at May 1, 2011 and average revolver borrowings during the year, a hypothetical one percentage point increase in interest rates would increase interest expense by approximately $24.6 million annually.
Commodities: Certain commodities such as soybean meal, corn, wheat, soybean oil, diesel fuel and natural gas (collectively, “commodity contracts”) are used in the production or transportation of our products. As part of our commodity risk management activities, we use derivative financial instruments, primarily futures, swaps, options and swaptions (an option on a swap), to reduce the effect of changing prices and as a mechanism to procure the underlying commodity where applicable. We accounted for these commodities derivatives as either economic or cash flow hedges. Changes in the value of economic hedges are recorded directly in earnings. For cash flow hedges, the effective portion of derivative gains and losses was deferred in equity (pre-Merger) and recognized as part of cost of products sold in the appropriate period and the ineffective portion was recognized as other (income) expense.
On May 1, 2011, the fair values of our commodities hedges were recorded as current assets of $8.0 million and current liabilities of $2.2 million. On May 2, 2010, the fair values of our commodities hedges were recorded as current assets of $11.1 million and current liabilities of $2.5 million.
The sensitivity analyses presented below reflect potential losses of fair value resulting from hypothetical changes in market prices related to commodities. Sensitivity analyses do not consider the actions we may take to mitigate our exposure to changes, nor do they consider the effects such hypothetical adverse changes may have on overall economic activity. Actual changes in market prices may differ from hypothetical changes.
| Successor | Predecessor | |||||||||
| May 1, 2011 |
May 2, 2010 |
|||||||||
| (in millions) | ||||||||||
| Effect of a hypothetical 10% change in fair value |
||||||||||
| Commodity contracts |
$ | 4.7 | $ | 13.9 | ||||||
Foreign Currency: We manage our exposure to fluctuations in foreign currency exchange rates by entering into forward contracts to cover a portion of our projected expenditures paid in local currency. We accounted for these contracts as either economic hedges or cash flow hedges. Changes in the value of the economic hedges are recorded directly in earnings. For cash flow hedges, the effective portion of derivative gains and losses was deferred in equity (pre-Merger) and recognized as part of cost of products sold in the appropriate period and the ineffective portion was recognized as other (income) expense.
The table below presents our foreign currency derivative contracts as of May 1, 2011 and May 2, 2010. All of the foreign currency derivative contracts held on May 1, 2011 are scheduled to mature prior to the end of fiscal 2012.
| Successor | Predecessor | |||||||||
| May 1, 2011 |
May 2, 2010 |
|||||||||
| (in millions) | ||||||||||
| Contract amount (Mexican pesos) |
$ | 20.0 | $ | 22.5 | ||||||
| Contract amount ($CAD) |
15.3 | 29.0 | ||||||||
A summary of the fair value and the market risk associated with a hypothetical 10% adverse change in foreign currency exchange rates on our foreign currency hedges is as follows:
| Successor | Predecessor | |||||||||
| May 1, 2011 |
May 2, 2010 |
|||||||||
| (in millions) | ||||||||||
| Fair value of foreign currency contracts, net asset |
$ | 2.0 | $ | 4.0 | ||||||
| Potential net loss in fair value of a hypothetical 10% adverse change in currency exchange rates |
(3.8 | ) | (5.4 | ) | ||||||
54
Table of Contents
| Item 8. | Financial Statements and Supplementary Data |
INDEX TO THE CONSOLIDATED FINANCIAL STATEMENTS
| Page | ||||
| Report of Independent Registered Public Accounting Firm—KPMG LLP |
56 | |||
| Consolidated Balance Sheets—May 1, 2011 (Successor) and May 2, 2010 (Predecessor) |
57 | |||
| 58 | ||||
| 59 | ||||
| 60 | ||||
| 61 | ||||
55
Table of Contents
REPORT OF INDEPENDENT REGISTERED PUBLIC ACCOUNTING FIRM
The Board of Directors and Stockholder
Del Monte Corporation:
We have audited the accompanying consolidated balance sheets of Del Monte Corporation and subsidiaries (the Company) as of May 1, 2011 (Successor) and May 2, 2010 (Predecessor), and the related consolidated statements of income (loss), stockholder’s equity and comprehensive income (loss), and cash flows for the periods from March 8, 2011 to May 1, 2011 (Successor) and May 3, 2010 to March 7, 2011 (Predecessor) and the years ended May 2, 2010 (Predecessor) and May 3, 2009 (Predecessor). These consolidated financial statements are the responsibility of the Company’s management. Our responsibility is to express an opinion on these consolidated financial statements based on our audits.
We conducted our audits in accordance with the standards of the Public Company Accounting Oversight Board (United States). Those standards require that we plan and perform the audit to obtain reasonable assurance about whether the financial statements are free of material misstatement. An audit includes examining, on a test basis, evidence supporting the amounts and disclosures in the financial statements. An audit also includes assessing the accounting principles used and significant estimates made by management, as well as evaluating the overall financial statement presentation. We believe that our audits provide a reasonable basis for our opinion.
In our opinion, the consolidated financial statements referred to above present fairly, in all material respects, the financial position of Del Monte Corporation and subsidiaries as of May 1, 2011 (Successor) and May 2, 2010 (Predecessor), and the results of their operations and cash flows for the periods from March 8, 2011 to May 1, 2011 (Successor) and May 3, 2010 to March 7, 2011 (Predecessor) and the years ended May 2, 2010 (Predecessor) and May 3, 2009 (Predecessor), in conformity with U.S. generally accepted accounting principles.
As discussed in Notes 1 and 3 to the consolidated financial statements, the Company was acquired through a merger on March 8, 2011. As a result of the merger, the consolidated financial information for the period subsequent to the acquisition is presented on a different cost basis than that for the periods prior to the acquisition and, therefore, is not comparable.
/s/ KPMG LLP
San Francisco, California
July 15, 2011
56
Table of Contents
DEL MONTE CORPORATION AND SUBSIDIARIES
(previously reported as DEL MONTE FOODS COMPANY AND SUBSIDIARIES)
CONSOLIDATED BALANCE SHEETS
(in millions, except share and per share data)
| Successor | Predecessor | |||||||||
| May 1, 2011 | May 2, 2010 |
|||||||||
| ASSETS | ||||||||||
| Cash and cash equivalents |
$ | 205.2 | $ | 53.7 | ||||||
| Trade accounts receivable, net of allowance |
201.5 | 187.0 | ||||||||
| Inventories |
766.9 | 726.4 | ||||||||
| Prepaid expenses and other current assets |
165.4 | 128.5 | ||||||||
| Total current assets |
1,339.0 | 1,095.6 | ||||||||
| Property, plant and equipment, net |
731.7 | 658.8 | ||||||||
| Goodwill |
2,124.0 | 1,337.7 | ||||||||
| Intangible assets, net |
2,828.7 | 1,162.4 | ||||||||
| Other assets, net |
180.3 | 34.4 | ||||||||
| Total assets |
$ | 7,203.7 | $ | 4,288.9 | ||||||
| LIABILITIES AND STOCKHOLDER’S EQUITY | ||||||||||
| Accounts payable and accrued expenses |
$ | 486.7 | $ | 469.5 | ||||||
| Short-term borrowings |
8.6 | 5.6 | ||||||||
| Current portion of long-term debt |
20.3 | 30.0 | ||||||||
| Total current liabilities |
515.6 | 505.1 | ||||||||
| Long-term debt |
3,973.1 | 1,255.2 | ||||||||
| Deferred tax liabilities |
969.1 | 441.0 | ||||||||
| Other non-current liabilities |
260.5 | 260.2 | ||||||||
| Total liabilities |
5,718.3 | 2,461.5 | ||||||||
| Stockholder’s equity: |
||||||||||
| Common stock ($0.01 par value per share, shares authorized: |
||||||||||
| 1,000 at May 1, 2011 and 500,000,000 at May 2, 2010; 10 issued and outstanding at May 1, 2011 and 216,600,000 issued and 199,200,000 outstanding at May 2, 2010) |
$ | — | $ | 2.2 | ||||||
| Additional paid-in capital |
1,584.4 | 1,085.0 | ||||||||
| Treasury stock, at cost |
— | (183.1 | ) | |||||||
| Accumulated other comprehensive income (loss) |
5.5 | (59.8 | ) | |||||||
| Retained earnings (accumulated deficit) |
(104.5 | ) | 983.1 | |||||||
| Total stockholder’s equity |
1,485.4 | 1,827.4 | ||||||||
| Total liabilities and stockholder’s equity |
$ | 7,203.7 | $ | 4,288.9 | ||||||
See Accompanying Notes to the Consolidated Financial Statements.
57
Table of Contents
DEL MONTE CORPORATION AND SUBSIDIARIES
(previously reported as DEL MONTE FOODS COMPANY AND SUBSIDIARIES)
CONSOLIDATED STATEMENTS OF INCOME (LOSS)
(in millions)
| Successor | Predecessor | |||||||||||||||||
| March 8, 2011 through May 1, 2011 |
May 3, 2010 through March 7, 2011 |
Fiscal 2010 |
Fiscal 2009 |
|||||||||||||||
| Net sales |
$ | 564.8 | $ | 3,101.3 | $ | 3,739.8 | $ | 3,626.9 | ||||||||||
| Cost of products sold |
457.0 | 2,073.6 | 2,510.6 | 2,622.7 | ||||||||||||||
| Gross profit |
107.8 | 1,027.7 | 1,229.2 | 1,004.2 | ||||||||||||||
| Selling, general and administrative expenses |
108.9 | 535.7 | 721.2 | 643.3 | ||||||||||||||
| Transaction and related costs |
82.8 | 68.8 | — | — | ||||||||||||||
| Operating income (loss) |
(83.9 | ) | 423.2 | 508.0 | 360.9 | |||||||||||||
| Interest expense |
44.3 | 66.7 | 116.3 | 110.3 | ||||||||||||||
| Other (income) expense |
25.7 | (5.2 | ) | 9.8 | 24.1 | |||||||||||||
| Income (loss) from continuing operations before income taxes |
(153.9 | ) | 361.7 | 381.9 | 226.5 | |||||||||||||
| Provision (benefit) for income taxes |
(49.0 | ) | 139.8 | 139.9 | 78.8 | |||||||||||||
| Income (loss) from continuing operations |
(104.9 | ) | 221.9 | 242.0 | 147.7 | |||||||||||||
| Income (loss) from discontinued operations before income taxes |
0.6 | (1.7 | ) | 1.4 | 38.9 | |||||||||||||
| Provision (benefit) for income taxes |
0.2 | (2.6 | ) | (0.9 | ) | 14.3 | ||||||||||||
| Income from discontinued operations |
0.4 | 0.9 | 2.3 | 24.6 | ||||||||||||||
| Net income (loss) |
$ | (104.5 | ) | $ | 222.8 | $ | 244.3 | $ | 172.3 | |||||||||
See Accompanying Notes to the Consolidated Financial Statements.
58
Table of Contents
DEL MONTE CORPORATION AND SUBSIDIARIES
(previously reported as DEL MONTE FOODS COMPANY AND SUBSIDIARIES)
CONSOLIDATED STATEMENTS OF STOCKHOLDER’S EQUITY AND
COMPREHENSIVE INCOME (LOSS)
(in millions, except per share data)
| Common Stock 1 |
Treasury Stock 1 |
Additional Paid-in |
Accumulated Other Comprehensive |
Retained Earnings/ (Accumulated |
Total Stockholder’s |
|||||||||||||||||||||||||||
| Shares | Amount | Shares | Amount | Capital | Income (Loss) | Deficit) | Equity | |||||||||||||||||||||||||
| Predecessor balances at April 27, 2008 |
197.3 | $ | 2.1 | 17.4 | $ | (183.1 | ) | $ | 1,034.7 | $ | 8.2 | $ | 638.6 | $ | 1,500.5 | |||||||||||||||||
| Net income |
— | — | — | — | — | — | 172.3 | 172.3 | ||||||||||||||||||||||||
| Other comprehensive income/(loss): |
||||||||||||||||||||||||||||||||
| Loss on cash flow hedging instruments (net of tax of $9.5) |
— | — | — | — | — | (14.7 | ) | — | (14.7 | ) | ||||||||||||||||||||||
| Currency translation adjustment |
— | — | — | — | — | (1.5 | ) | — | (1.5 | ) | ||||||||||||||||||||||
| Pension liability adjustment (net of tax of $19.6) |
— | — | — | — | — | (30.4 | ) | — | (30.4 | ) | ||||||||||||||||||||||
| Comprehensive income |
125.7 | |||||||||||||||||||||||||||||||
| Issuance of shares |
0.4 | — | — | — | 2.1 | — | — | 2.1 | ||||||||||||||||||||||||
| Dividends declared ($0.16 per share) |
— | — | — | — | — | — | (31.6 | ) | (31.6 | ) | ||||||||||||||||||||||
| Adoption of new benefit plan guidance (net of tax of $0.5) |
— | — | — | — | — | — | (0.9 | ) | (0.9 | ) | ||||||||||||||||||||||
| Stock option expense |
— | — | — | — | 8.9 | — | — | 8.9 | ||||||||||||||||||||||||
| Restricted stock units and amortization of unearned compensation |
— | — | — | — | 1.8 | — | — | 1.8 | ||||||||||||||||||||||||
| Predecessor balances at May 3, 2009 |
197.7 | $ | 2.1 | 17.4 | $ | (183.1 | ) | $ | 1,047.5 | $ | (38.4 | ) | $ | 778.4 | $ | 1,606.5 | ||||||||||||||||
| Net income |
— | — | — | — | — | — | 244.3 | 244.3 | ||||||||||||||||||||||||
| Other comprehensive income/(loss): |
||||||||||||||||||||||||||||||||
| Gain on cash flow hedging instruments (net of tax of $14.5) |
— | — | — | — | — | 23.7 | — | 23.7 | ||||||||||||||||||||||||
| Currency translation adjustment |
— | — | — | — | — | (5.4 | ) | — | (5.4 | ) | ||||||||||||||||||||||
| Pension liability adjustment (net of tax of $25.6) |
— | — | — | — | — | (39.7 | ) | — | (39.7 | ) | ||||||||||||||||||||||
| Comprehensive income |
222.9 | |||||||||||||||||||||||||||||||
| Issuance of shares |
1.5 | 0.1 | — | — | 12.2 | — | — | 12.3 | ||||||||||||||||||||||||
| Dividends declared ($0.20 per share) |
— | — | — | — | — | — | (39.6 | ) | (39.6 | ) | ||||||||||||||||||||||
| Tax benefit from stock options exercised |
— | — | — | — | 1.7 | — | — | 1.7 | ||||||||||||||||||||||||
| Stock option expense |
— | — | — | — | 9.9 | — | — | 9.9 | ||||||||||||||||||||||||
| Restricted stock units and amortization of unearned compensation |
— | — | — | — | 13.7 | — | — | 13.7 | ||||||||||||||||||||||||
| Predecessor balances at May 2, 2010 |
199.2 | $ | 2.2 | 17.4 | $ | (183.1 | ) | $ | 1,085.0 | $ | (59.8 | ) | $ | 983.1 | $ | 1,827.4 | ||||||||||||||||
| Net income |
— | — | — | — | — | — | 222.8 | 222.8 | ||||||||||||||||||||||||
| Other comprehensive income/(loss): |
||||||||||||||||||||||||||||||||
| Gain on cash flow hedging instruments (net of tax of $1.6) |
— | — | — | — | — | 1.1 | — | 1.1 | ||||||||||||||||||||||||
| Currency translation adjustment |
— | — | — | — | — | 0.8 | — | 0.8 | ||||||||||||||||||||||||
| Pension liability adjustment (net of tax of $2.0) |
— | — | — | — | — | 3.1 | — | 3.1 | ||||||||||||||||||||||||
| Comprehensive income |
227.8 | |||||||||||||||||||||||||||||||
| Issuance of shares |
7.3 | 0.1 | — | — | 59.5 | — | — | 59.6 | ||||||||||||||||||||||||
| Repurchase of shares |
(7.1 | ) | — | 7.1 | (100.0 | ) | — | — | — | (100.0 | ) | |||||||||||||||||||||
| Dividends declared ($0.27 per share) |
— | — | — | — | — | — | (53.0 | ) | (53.0 | ) | ||||||||||||||||||||||
| Tax benefit from stock options exercised |
— | — | — | — | 34.4 | — | — | 34.4 | ||||||||||||||||||||||||
| Stock option expense |
— | — | — | — | 20.3 | — | — | 20.3 | ||||||||||||||||||||||||
| Restricted stock units and amortization of unearned compensation |
— | — | — | — | 25.0 | — | — | 25.0 | ||||||||||||||||||||||||
| Taxes remitted on behalf of employees for net share settlement of stock awards |
— | — | — | — | (5.9 | ) | — | — | (5.9 | ) | ||||||||||||||||||||||
| Elimination of Predecessor equity in connection with the Merger |
(199.4 | ) | (2.3 | ) | (24.5 | ) | 283.1 | (1,218.3 | ) | 54.8 | (1,152.9 | ) | (2,035.6 | ) | ||||||||||||||||||
| Predecessor balances subsequent to Merger on March 8, 2011 |
— | $ | — | — | $ | — | $ | — | $ | — | $ | — | $ | — | ||||||||||||||||||
| Capital contribution, net |
— | — | — | — | 1,584.0 | — | — | 1,584.0 | ||||||||||||||||||||||||
| Net loss |
— | — | — | — | — | — | (104.5 | ) | (104.5 | ) | ||||||||||||||||||||||
| Other comprehensive income/(loss): |
||||||||||||||||||||||||||||||||
| Currency translation adjustment |
— | — | — | — | — | 0.4 | — | 0.4 | ||||||||||||||||||||||||
| Pension liability adjustment (net of tax of $3.2) |
— | — | — | — | — | 5.1 | — | 5.1 | ||||||||||||||||||||||||
| Comprehensive income (loss) |
(99.0 | ) | ||||||||||||||||||||||||||||||
| Stock option expense |
— | — | — | — | 0.4 | — | — | 0.4 | ||||||||||||||||||||||||
| Successor balances at May 1, 2011 |
— | $ | — | — | $ | — | $ | 1,584.4 | $ | 5.5 | $ | (104.5 | ) | $ | 1,485.4 | |||||||||||||||||
| 1 | All amounts for common stock and treasury stock prior to the April 26, 2011 merger of DMFC into DMC relate to DMFC’s stock. See Note 1. |
See Accompanying Notes to the Consolidated Financial Statements.
59
Table of Contents
DEL MONTE CORPORATION AND SUBSIDIARIES
(previously reported as DEL MONTE FOODS COMPANY AND SUBSIDIARIES)
CONSOLIDATED STATEMENTS OF CASH FLOWS
(in millions)
| Successor | Predecessor | |||||||||||||||||
| March 8, 2011 through May 1, 2011 |
May 3, 2010 through March 7, 2011 |
Fiscal 2010 |
Fiscal 2009 |
|||||||||||||||
| Operating activities: |
||||||||||||||||||
| Net income (loss) |
$ | (104.5 | ) | $ | 222.8 | $ | 244.3 | $ | 172.3 | |||||||||
| Adjustments to reconcile net income (loss) to net cash provided by operating activities: |
||||||||||||||||||
| Depreciation and amortization |
20.4 | 81.3 | 99.4 | 104.9 | ||||||||||||||
| Deferred taxes |
(48.9 | ) | 97.8 | 54.4 | 29.5 | |||||||||||||
| Inventory step-up related to Merger |
33.8 | — | — | — | ||||||||||||||
| Write off of debt issuance cost and loss on debt refinancing |
— | — | 24.8 | — | ||||||||||||||
| Redemption premium over the fair value of senior subordinated notes tendered/redeemed |
15.8 | — | — | — | ||||||||||||||
| (Gain)/loss on asset disposal |
1.8 | 1.1 | 2.6 | (23.3 | ) | |||||||||||||
| Stock compensation expense |
0.4 | 45.3 | 21.3 | 12.2 | ||||||||||||||
| Discontinuation of hedge accounting for interest rate swap |
— | — | 13.4 | — | ||||||||||||||
| Excess tax benefits from stock-based compensation |
— | (35.3 | ) | — | — | |||||||||||||
| Impairment loss on pet intangible assets |
— | — | 3.0 | 11.7 | ||||||||||||||
| Other non-cash items, net |
12.6 | 0.1 | (3.5 | ) | 10.1 | |||||||||||||
| Changes in operating assets and liabilities: |
||||||||||||||||||
| Trade accounts receivable, net |
23.4 | (37.4 | ) | (2.4 | ) | 89.5 | ||||||||||||
| Inventories |
113.6 | (84.1 | ) | (51.9 | ) | (78.5 | ) | |||||||||||
| Prepaid expenses and other current assets |
(0.4 | ) | 11.9 | 19.7 | (58.9 | ) | ||||||||||||
| Other assets, net |
(9.2 | ) | (0.9 | ) | (0.5 | ) | 2.5 | |||||||||||
| Accounts payable and accrued expenses |
17.5 | (62.4 | ) | (38.0 | ) | (69.5 | ) | |||||||||||
| Other non-current liabilities |
8.9 | 14.1 | (30.7 | ) | (1.9 | ) | ||||||||||||
| Net cash provided by operating activities |
85.2 | 254.3 | 355.9 | 200.6 | ||||||||||||||
| Investing activities: |
||||||||||||||||||
| Merger, net of cash acquired |
(3,856.9 | ) | — | — | — | |||||||||||||
| Capital expenditures |
(25.8 | ) | (66.1 | ) | (104.9 | ) | (88.7 | ) | ||||||||||
| Net proceeds from disposal of assets |
— | — | — | 365.8 | ||||||||||||||
| Net cash provided by (used in) investing activities |
(3,882.7 | ) | (66.1 | ) | (104.9 | ) | 277.1 | |||||||||||
| Financing activities: |
||||||||||||||||||
| Capital contribution, net |
1,548.8 | — | — | — | ||||||||||||||
| Proceeds from short-term borrowings |
— | 500.7 | 208.8 | 517.7 | ||||||||||||||
| Payments on short-term borrowings |
(2.0 | ) | (495.8 | ) | (204.3 | ) | (515.7 | ) | ||||||||||
| Proceeds from long-term debt |
3,993.3 | — | 1,042.2 | — | ||||||||||||||
| Principal payments on long-term debt |
(1,357.5 | ) | (22.5 | ) | (1,315.7 | ) | (333.8 | ) | ||||||||||
| Payments of debt-related costs |
(180.0 | ) | — | (43.6 | ) | — | ||||||||||||
| Dividends paid |
— | (62.9 | ) | (37.6 | ) | (31.6 | ) | |||||||||||
| Issuance of common stock |
— | 59.6 | 12.3 | 2.1 | ||||||||||||||
| Purchase of treasury stock |
— | (100.0 | ) | — | — | |||||||||||||
| Taxes remitted on behalf of employees for net share settlement of stock awards |
— | (5.9 | ) | — | — | |||||||||||||
| Excess tax benefits from stock-based compensation |
— | 35.3 | 1.7 | — | ||||||||||||||
| Net cash provided by (used in) financing activities |
4,002.6 | (91.5 | ) | (336.2 | ) | (361.3 | ) | |||||||||||
| Effect of exchange rate changes on cash and cash equivalents |
0.1 | (2.8 | ) | (3.8 | ) | 0.6 | ||||||||||||
| Net change in cash and cash equivalents |
205.2 | 93.9 | (89.0 | ) | 117.0 | |||||||||||||
| Cash and cash equivalents at beginning of period |
— | 53.7 | 142.7 | 25.7 | ||||||||||||||
| Cash and cash equivalents at end of period |
$ | 205.2 | $ | 147.6 | $ | 53.7 | $ | 142.7 | ||||||||||
See Accompanying Notes to the Consolidated Financial Statements.
60
Table of Contents
DEL MONTE CORPORATION AND SUBSIDIARIES
(previously reported as DEL MONTE FOODS COMPANY AND SUBSIDIARIES)
NOTES TO THE CONSOLIDATED FINANCIAL STATEMENTS
May 1, 2011
Note 1. Business and Basis of Presentation
On March 8, 2011, Del Monte Foods Company (“DMFC”) was acquired by an investor group led by funds affiliated with Kohlberg Kravis Roberts & Co. L.P. (“KKR”), Vestar Capital Partners (“Vestar”) and Centerview Capital, L.P. (“Centerview,” and together with KKR and Vestar, the “Sponsors”). Under the terms of the merger agreement, DMFC’s stockholders received $19.00 per share in cash. The acquisition (also referred to as the “Merger”) was effected by the merger of Blue Merger Sub Inc. (“Blue Sub”) with and into DMFC, with DMFC being the surviving corporation. As a result of the Merger, DMFC became a wholly-owned subsidiary of Blue Acquisition Group, Inc. (“Parent”). DMFC stockholders approved the transaction on March 7, 2011. DMFC’s common stock ceased trading on the New York Stock Exchange before the opening of the market on March 9, 2011.
As a result of the Merger, the Company applied the acquisition method of accounting and established a new basis of accounting on March 8, 2011. Accordingly, the fiscal 2011 periods presented include a 44-week Predecessor period from May 3, 2010 through March 7, 2011 and an 8-week Successor period, reflecting the Merger, from March 8, 2011 through May 1, 2011. Black lines separate the Successor’s financial statements from that of the Predecessor since the financial statements are not comparable as a result of the application of acquisition accounting and changes in the Company’s capital structure resulting from the Merger. The results of operations of Blue Sub, since its inception, were included in the Successor period from March 8, 2011 through May 1, 2011. The Company operates on a 52 or 53-week fiscal year ending on the Sunday closest to April 30. The results of operations for fiscal 2010 and fiscal 2009 contain 52 and 53 weeks, respectively.
Del Monte Corporation (“DMC” and, together with its consolidated subsidiaries, “Del Monte” or the “Company”) was a direct, wholly-owned subsidiary of DMFC. On April 26, 2011, DMFC merged with and into DMC, with DMC being the surviving corporation. As a result of this merger, DMC became a direct wholly-owned subsidiary of Parent.
Del Monte is one of the country’s largest producers, distributors and marketers of premium quality, branded pet products and food products for the U.S. retail market. The Company’s pet food and pet snacks brands include Meow Mix, Kibbles ‘n Bits, Milk-Bone, 9Lives, Pup-Peroni, Gravy Train, Nature’s Recipe, Canine Carry Outs, Milo’s Kitchen and other brand names, and leading food brands include Del Monte, Contadina, S&W, College Inn and other brand names. The Company also produces and distributes private label pet products and food products. The majority of its products are sold nationwide in all channels serving retail markets, mass merchandisers, the U.S. military, certain export markets, the foodservice industry and food processors.
On October 6, 2008, pursuant to the Purchase Agreement dated June 29, 2008 among DMC, Dongwon Enterprise Co., Ltd., Dongwon Industries Co., Ltd., Dongwon F&B Co., Ltd., Starkist Co. ( collectively, the “Dongwon Entities”), and StarKist Samoa Co. (“Acquisition Sub”), DMC (i) sold to Starkist Co. all of the outstanding stock of Galapesca S.A., Panapesca Fishing, Inc. and Marine Trading Pacific, Inc., (ii) caused Star-Kist Samoa, Inc. to be merged with and into Acquisition Sub and (iii) sold to Starkist Co. certain assets that are primarily related to the business of manufacturing, marketing, selling and distributing StarKist brand products and private label seafood products (such business, the “StarKist Seafood Business”). Under the terms of the Purchase Agreement, the Dongwon Entities paid a purchase price of approximately $359 million at closing and an additional $23 million related to the final working capital adjustment. The financial results of the StarKist Seafood Business were previously reported within the Consumer Products segment.
For all periods presented, the operating results related to the StarKist Seafood Business have been classified as discontinued operations. The Company has combined cash flows from discontinued operations with cash flows from continuing operations within the operating, investing and financing categories in the Statement of Cash Flows for all periods presented.
For reporting purposes, the Company has two segments: Pet Products and Consumer Products. The Pet Products segment includes the Pet Products operating segment, which manufactures, markets and sells branded and private label dry and wet pet food and pet snacks. The Consumer Products segment includes the Consumer Products operating segment, which manufactures, markets and sells branded and private label shelf-stable products, including fruit, vegetable, tomato and broth products.
All amounts discussed in these Notes to the Consolidated Financial Statements represent continuing operations, unless otherwise noted.
Note 2. Significant Accounting Policies
Trade Promotions: Accruals for trade promotions are recorded primarily at the time a product is sold to the customer based on expected levels of performance. Settlement of these liabilities typically occurs in subsequent periods primarily through an authorized process for deductions taken by a customer from amounts otherwise due to the Company. Deductions are offset against related trade promotion accruals. The original estimated costs of trade promotions are reasonably likely to change in the future. Evaluations of the trade promotion liability are performed monthly and adjustments are made where appropriate to reflect changes in the Company’s estimates. Trade spending is recorded as a reduction to net sales.
61
Table of Contents
DEL MONTE CORPORATION AND SUBSIDIARIES
(previously reported as DEL MONTE FOODS COMPANY AND SUBSIDIARIES)
NOTES TO THE CONSOLIDATED FINANCIAL STATEMENTS—(Continued)
May 1, 2011
Goodwill and Intangibles with Indefinite Lives: The Company does not amortize goodwill and intangible assets with indefinite lives, but instead tests for impairment at least annually. Additional impairment tests may be performed between annual tests if circumstances indicate that a potential impairment exists. The Company has designated the first day of the fourth fiscal quarter as the annual impairment testing date, at which time the Company engages third-party valuation experts to assist in the valuation of its intangible assets with indefinite lives and reporting units that have goodwill assigned to them.
When conducting the annual impairment test for goodwill, the Company compares the estimated fair value of a reporting unit containing goodwill to its book value. The estimated fair value is computed using two approaches: the income approach, which is the present value of expected cash flows, discounted at a risk-adjusted weighted-average cost of capital; and the market approach, which is based on using market multiples of companies in similar lines of business. If the fair value of the reporting unit is determined to be more than its book value, no goodwill impairment is recognized.
If the fair value of the reporting unit is determined to be less than its book value, actual goodwill impairment, if any, is computed using a second step of the impairment test. The second step requires the fair value of the reporting unit to be allocated to all the assets and liabilities of the reporting unit as if the reporting unit had been acquired in a business combination at the date of the impairment test. The excess of the fair value of the reporting unit over the fair value of assets less liabilities is the implied value of goodwill and is used to determine the amount of impairment.
For intangible assets with indefinite lives, estimated fair value is determined using the relief from royalty method, which is based upon the estimated rent or royalty the Company would pay for the use of a brand name if the Company did not own it and discounted at a risk-adjusted weighted-average cost of capital.
In estimating discounted future cash flows, management uses historical financial information as well as the Company’s operating plans and projections, which include assumptions regarding sales trends and profitability, as well as macroeconomic factors. Considerable judgment is necessary in estimating future cash flows, market interest rates, discount rates, and other factors used in the income approach, market approach or relief from royalty method used to value goodwill and intangible assets with indefinite lives. Different assumptions regarding future performance, discount rates or other factors could result in future impairment losses.
Retirement Benefits: The Company sponsors a qualified defined benefit pension plan and several unfunded defined benefit postretirement plans, providing certain medical, dental and life insurance and other benefits to eligible retired, salaried, non-union hourly and union employees. Under the direction of the Company, third-party actuaries utilize statistical and other factors to anticipate future events in calculating an estimate of the expense and liabilities related to these plans. The actuarial reports are used by the Company in estimating the expenses and liabilities related to these plans. The factors utilized by the Company’s actuaries include assumptions about the discount rate, expected return on plan assets, the health care cost trend rate, withdrawal and mortality rates and the rate of increase in compensation levels. These assumptions may differ materially from actual results due to changing market and economic conditions, higher or lower withdrawal rates or longer or shorter mortality of participants. These differences may impact the amount of retirement benefit expense recorded by the Company in future periods. The funded status of the Company’s pension and other postretirement plans is recorded as a liability, and all unrecognized gains or losses, net of tax, are recorded as a component of accumulated other comprehensive income (loss) (“AOCI”) within stockholder’s equity.
Stock-based Compensation: The Company expenses employee stock option grants and other stock-based compensation over the vesting period, based on the fair value on the date the stock-based compensation was granted.
Cash Equivalents: The Company considers all highly liquid investments with an original maturity date of three months or less to be cash equivalents. The book value reported in the balance sheet for cash equivalents approximates its fair value.
Inventories: The cost of finished products inventories includes raw materials, direct labor, certain freight and warehousing costs and indirect production and overhead costs. Inventories are stated at the lower of cost or market. The Company uses the first-in, first-out (“FIFO”) and last-in, first-out (“LIFO”) methods to value its inventories. The determination of FIFO or LIFO depends on the production location of the inventories. Each production facility is designated as either a LIFO or FIFO inventory facility. Generally, the Pet Products locations use the FIFO method and the Consumer Products locations use the LIFO method to value inventories. For the LIFO facilities, the Company has established LIFO pools for containers and finished goods inventories.
62
Table of Contents
DEL MONTE CORPORATION AND SUBSIDIARIES
(previously reported as DEL MONTE FOODS COMPANY AND SUBSIDIARIES)
NOTES TO THE CONSOLIDATED FINANCIAL STATEMENTS—(Continued)
May 1, 2011
For fiscal 2010 there was a liquidation of the LIFO layers which resulted in a net decrease to cost of products sold of $2.0 million. There was no liquidation of the LIFO layers in fiscal 2009.
As the Company manufactures new inventories, new current year costs are developed. The difference between the inventory value based on the current year costs and the inventory value based on historical LIFO costs resulted in a credit balance LIFO reserve of $42.2 million as of May 2, 2010.
As a result of the Merger, inventory was recorded at its estimated fair value which resulted in the elimination of the LIFO reserve on March 8, 2011.
In accordance with acquisition method of accounting, inventories as of March 8, 2011 were recorded at estimated fair value which exceeded book value by $103.5 million. Cost of products sold in the accompanying statements of income (loss) for the period March 8, 2011 through May 1, 2011 included noncash charges of $33.8 million related to the excess of estimated fair value over book value of the inventory sold during this period.
Property, Plant and Equipment and Depreciation: Property, plant and equipment are stated at cost (adjusted to estimated fair value as a result of the Merger) and are depreciated over their estimated useful lives, using the straight-line method. Maintenance and repairs are expensed as incurred. Significant expenditures that increase useful lives are capitalized. The principal estimated useful lives generally are: land improvements—5 to 40 years; buildings and leasehold improvements—10 to 50 years; machinery and equipment—10 to 20 years; and computers and software—3 to 7 years. Depreciation of plant and equipment and leasehold amortization was $9.5 million, $70.4 million, $87.1 million and $90.8 million (including depreciation and amortization related to discontinued operations) for the periods March 8, 2011 through May 1, 2011, May 3, 2010 through March 7, 2011, fiscal 2010 and fiscal 2009, respectively.
The Company’s capitalization of software development costs for internal use begins in the application development stage and ends when the asset is placed into service. The Company amortizes such costs using the straight-line method over estimated useful lives. Including costs paid to third-party vendors, the Company capitalized $1.4 million, $10.4 million, $11.2 million and $15.3 million of software development costs for the periods March 8, 2011 through May 1, 2011, May 3, 2010 through March 7, 2011, fiscal 2010 and fiscal 2009, respectively, related to systems supporting the Company’s infrastructure.
Included in prepaid expenses and other current assets are certain real properties with a book value of $0.4 million which the Company has classified as assets held for sale as of May 1, 2011. There were no real properties that met the criteria of assets held for sale as of May 2, 2010.
Long-lived Assets: The Company reviews long-lived assets held and used, intangible assets with finite lives and assets held for sale for impairment whenever events or changes in circumstances indicate that the book value of an asset may not be recoverable. If an evaluation of recoverability was required, the estimated undiscounted future cash flows associated with the asset would be compared to the asset’s book value to determine if a write-down was required. If the undiscounted cash flows are less than the book value, an impairment loss is recorded to the extent that the book value exceeds the fair value. If management has committed to a plan to dispose of long-lived assets, the assets to be disposed of are reported at the lower of book value or fair value less estimated costs to sell.
The Company’s intangible assets with estimable lives generally have lives ranging between 5 and 25 years and are amortized on a straight-line basis.
Deferred Debt Issuance Costs: The Company capitalizes costs associated with the issuance of debt instruments and amortizes these costs as interest expense over the term of the debt agreements. Amortization expense for deferred charges for the periods March 8, 2011 through May 1, 2011, May 3, 2010 through March 7, 2011, fiscal 2010 and fiscal 2009 was $3.8 million, $4.6 million, $5.7 million and $6.3 million, respectively (including amortization expense related to discontinued operations). Deferred debt issuance costs are included in other assets in the Consolidated Balance Sheets. In fiscal 2010, the Company wrote off $8.3 million of debt issuance costs in connection with refinancing activities. Refer to Note 7 for a discussion of the debt issuance costs for the periods March 8, 2011 through May 1, 2011 and May 3, 2010 through March 7, 2011.
63
Table of Contents
DEL MONTE CORPORATION AND SUBSIDIARIES
(previously reported as DEL MONTE FOODS COMPANY AND SUBSIDIARIES)
NOTES TO THE CONSOLIDATED FINANCIAL STATEMENTS—(Continued)
May 1, 2011
Derivative Financial Instruments: The Company uses derivative financial instruments for the purpose of managing risks associated with interest rate, currency, commodity, transportation and other price exposures. The Company does not trade or use instruments with the objective of earning financial gains on interest rate, foreign currency, commodity or other fluctuations alone, nor does it use instruments where there are not underlying exposures. All derivative instruments are recorded in the Consolidated Balance Sheet at fair value.
The Company utilizes hedging instruments whose change in fair value acts as an economic hedge but does not meet the requirements to receive hedge accounting treatment (“Economic Hedge”). For derivatives designated as Economic Hedges, all changes in fair value are reported immediately in other (income) expense. In the past, the Company has utilized, and in the future may again utilize, derivative contracts designated as a hedge of a forecasted transaction or of the variability of cash flows to be received or paid related to a recognized asset or liability (“Cash Flow Hedge”). The effective portion of the change in the fair value of a derivative that was designated as a Cash Flow Hedge was reported in other comprehensive income (“OCI”). The gain or loss included in OCI was subsequently reclassified into net income on the same line in the Consolidated Statements of Income (Loss) as the hedged item in the same period that the hedge transaction affected net income. The ineffective portion of a change in fair value of a Cash Flow Hedge was reported in other (income) expense. The settlement of a cash flow hedging instrument was classified as an operating activity in the Statement of Cash Flows. Subsequent to the Merger, the Company made a policy decision to no longer seek hedge accounting for its derivative contracts, and thus all derivative contracts as of May 1, 2011 were Economic Hedges.
Fair Value of Financial Instruments: The book value of certain of the Company’s financial instruments, including cash and cash equivalents, accounts receivable and accounts payable and accrued expenses, approximates fair value due to the relatively short maturity of such instruments. The book value of the Company’s floating rate debt instruments approximates fair value. The following table provides the book value and fair value of the Company’s fixed rate notes (in millions):
| Successor | Predecessor | |||||||||||||||||
| May 1, 2011 | May 2, 2010 | |||||||||||||||||
| Book value | Fair value | Book value | Fair value | |||||||||||||||
| 6 3/4% Senior Subordinated Notes |
N/A | N/A | $ | 250.0 | $ | 257.8 | ||||||||||||
| 7 1/2% Senior Subordinated Notes |
N/A | N/A | $ | 450.0 | $ | 474.8 | ||||||||||||
| 7.625% Senior Notes |
$ | 1,300.0 | $ | 1,332.5 | N/A | N/A | ||||||||||||
Fair values were estimated based on quoted market prices from the trading desk of a nationally recognized investment bank.
Income Taxes: The Company accounts for income taxes under the asset and liability method. Deferred tax assets and liabilities are recognized for the future tax consequences attributable to differences between the financial statement book values of existing assets and liabilities and their respective tax bases, and for tax losses and tax credit carryforwards. Deferred tax assets and liabilities are measured using enacted tax rates expected to apply to taxable income in the years in which those temporary differences are expected to be recovered or settled. The effect on deferred tax assets and liabilities of a change in tax rates is recognized in income in the period that includes the enactment date. In assessing the realizability of deferred tax assets, management considers whether it is more likely than not that some portion or all of the deferred tax assets will not be realized. An uncertain tax position is recognized if it is determined that it is more likely than not to be sustained upon examination. The tax position is measured as the largest amount of benefit that is greater than fifty percent likely of being realized upon ultimate settlement. The Company will file a consolidated return with Parent. The Company allocates current and deferred taxes to each member as if it were a separate taxpayer.
Asset Retirement Obligations: Asset retirement obligations generally apply to legal obligations associated with the retirement of a tangible long-lived asset that result from the acquisition, construction or development and the normal operation of a long-lived asset. The Company assesses asset retirement obligations on a periodic basis. If a reasonable estimate of fair value can be made, the fair value of a liability for an asset retirement obligation is recognized in the period in which it is incurred or a change in estimate occurs. Associated asset retirement costs are capitalized as part of the book value of the long-lived asset. Over time, the liability increases, reflecting the accretion of the obligation from its present value to the amount the Company will pay to extinguish the liability and the capitalized asset retirement costs are depreciated over the useful lives of the related assets. As of May 1, 2011 and May 2, 2010, the asset retirement obligation totaled $7.4 million and $7.5 million, respectively. In addition, certain of the Company’s production facilities contain asbestos that would have to be removed if such facilities were to be demolished or undergo a major renovation and certain of the Company’s production facilities utilize wastewater ponds that would require closure activities should the ponds’ use be discontinued. The Company cannot reasonably estimate the fair value of the liability for asbestos removal or wastewater pond closure at its production facilities and accordingly has not recorded an asset retirement obligation for these matters.
64
Table of Contents
DEL MONTE CORPORATION AND SUBSIDIARIES
(previously reported as DEL MONTE FOODS COMPANY AND SUBSIDIARIES)
NOTES TO THE CONSOLIDATED FINANCIAL STATEMENTS—(Continued)
May 1, 2011
Environmental Remediation: The Company accrues for losses associated with environmental remediation obligations when such losses are probable and the amounts of such losses are reasonably estimable. Accruals for estimated losses from environmental remediation obligations are recognized no later than the completion of the remedial feasibility study. Such accruals are adjusted as further information develops or circumstances change.
Comprehensive Income (Loss): Comprehensive income (loss) is comprised of net income (loss) and OCI. OCI is comprised of pension and other postretirement employee benefit adjustments, net of tax, currency translation adjustments and (prior to the Merger) net unrealized gains or losses on cash flow hedging instruments, net of tax. As of the Merger date, all AOCI accounts were reset to zero.
The components of AOCI, as shown in the Consolidated Balance Sheets, are as follows (in millions):
| Successor | Predecessor | |||||||||
| May 1, 2011 |
May 2, 2010 |
|||||||||
| Currency translation adjustments |
$ | 0.4 | $ | (5.8 | ) | |||||
| Pension and other postretirement employee benefit adjustments |
5.1 | (57.9 | ) | |||||||
| Gain on cash flow hedging instruments |
— | 3.9 | ||||||||
| Total accumulated other comprehensive income (loss) |
$ | 5.5 | $ | (59.8 | ) | |||||
Revenue Recognition: The Company recognizes revenue from sales of products, and related costs of products sold, where persuasive evidence of an arrangement exists, delivery has occurred, the seller’s price is fixed or determinable and collectability is reasonably assured. This generally occurs when the customer receives the product or at the time title passes to the customer. Customers generally do not have the right to return product unless damaged or defective. Net sales is comprised of gross sales reduced by customer returns, consumer promotion costs relating to coupon redemption, trade promotions, performance allowances, customer pick-up allowances and discounts.
Concentration of Credit Risk: A relatively limited number of customers account for a large percentage of the Company’s total sales. For the periods March 8, 2011 through May 1, 2011, May 3, 2010 through March 7, 2011, fiscal 2010 and fiscal 2009, one customer accounted for approximately 32%, 34%, 35% and 34% of the Company’s list sales, which approximates gross sales, respectively. This customer accounted for approximately 35% and 37% of trade accounts receivable as of May 1, 2011 and May 2, 2010, respectively. This customer is also the most significant customer of each of the Company’s segments. The top ten customers represented approximately 61%, 63%, 63% and 62% of the Company’s list sales for the periods March 8, 2011 through May 1, 2011, May 3, 2010 through March 7, 2011, fiscal 2010 and fiscal 2009, respectively. The Company closely monitors the credit risk associated with its customers.
Coupon Redemption: Coupon redemption costs are accrued in the period in which the coupons are offered, based on estimates of redemption rates that are developed by management. Management estimates are based on recommendations from independent coupon redemption clearing-houses as well as historical information. Should actual redemption rates vary from amounts estimated, adjustments to accruals may be required. Coupon redemption costs are recorded as a reduction to sales.
Cost of Products Sold: Cost of products sold represents expenses incurred that are directly connected with bringing the products to a salable condition. These costs include raw material, packaging, labor, certain transportation and warehousing costs as well as overhead expenses.
Foreign Currency Translation: For the Company’s operations in countries where the functional currency is other than the U.S. dollar, revenue and expense accounts are translated at the average exchange rates during the period, and balance sheet items are translated at period-end exchange rates. Translation adjustments arising from the use of differing exchange rates from period to period are included in AOCI, a component of stockholder’s equity. Gains and losses from foreign currency transactions (transactions denominated in a currency other than the functional currency) are included in earnings. Based upon the three-year cumulative inflation rate, the Company began treating Venezuela as a highly inflationary economy effective with the beginning of the fourth quarter of fiscal 2010. Accordingly, the functional currency for the Company’s Venezuelan subsidiary is the U.S. dollar and beginning in the fourth quarter of fiscal 2010 the impact of Venezuelan currency fluctuations is recorded in earnings.
65
Table of Contents
DEL MONTE CORPORATION AND SUBSIDIARIES
(previously reported as DEL MONTE FOODS COMPANY AND SUBSIDIARIES)
NOTES TO THE CONSOLIDATED FINANCIAL STATEMENTS—(Continued)
May 1, 2011
Advertising Expense: All costs associated with advertising are generally expensed as incurred. Marketing expense, which includes advertising expenses, was $22.0 million, $118.2 million, $216.8 million and $140.6 million for the periods March 8, 2011 through May 1, 2011, May 3, 2010 through March 7, 2011, fiscal 2010 and fiscal 2009, respectively, and is included in selling, general and administrative expenses.
Research and Development: Research and development costs are included as a component of selling, general and administrative expenses. Research and development costs were $5.1 million, $25.1 million, $26.8 million and $23.7 million for the periods March 8, 2011 through May 1, 2011, May 3, 2010 through March 7, 2011, fiscal 2010 and fiscal 2009, respectively.
Principles of Consolidation: The consolidated financial statements include the accounts of the Company and its subsidiaries. All intercompany accounts and transactions have been eliminated upon consolidation. The Company accounts for its investments in joint ventures under the equity method of accounting, under which the investment in the joint venture is adjusted for the Company’s share of the profit or loss of the joint venture.
Use of Estimates: The preparation of the financial statements, in conformity with accounting principles generally accepted in the U.S. requires management to make estimates and assumptions that affect the reported amounts of assets and liabilities, the disclosure of contingent liabilities at the date of the financial statements and the reported amounts of revenues and expenses during the reporting period. Actual results could differ from these estimates.
Note 3. Merger
On March 8, 2011, DMFC was acquired by an investor group led by funds affiliated with KKR, Vestar and Centerview. Under the terms of the merger agreement, DMFC’s stockholders received $19.00 per share in cash. The acquisition was effected by the merger of Blue Sub with and into DMFC, with DMFC being the surviving corporation. As a result of the Merger, DMFC became a wholly-owned subsidiary of Parent. DMFC stockholders approved the transaction on March 7, 2011. DMFC’s common stock ceased trading on the New York Stock Exchange before the opening of the market on March 9, 2011.
The aggregate purchase price was approximately $4.0 billion and was funded primarily through debt financings as described further in Note 7 and equity contributions from affiliates of KKR, Vestar, Centerview and other equity investors.
On January 19, 2011 Blue Sub launched tender offers and consent solicitations for any and all of DMC’s $250.0 million aggregate principal amount of 6 3/4% Senior Subordinated Notes due 2015 (the “6 3/4% Notes”) and $450.0 million aggregate principal amount of 7 1/2% Senior Subordinated Notes due 2019 (the “7 1/2% Notes”). The tender offers expired on March 8, 2011 and the Company redeemed the untendered 6 3/4% Notes and 7 1/2% Notes on April 8, 2011.
The Merger was accounted for under the acquisition method of accounting. Accordingly, the effect of the Merger has been included in the Company’s Consolidated Statement of Income (Loss) subsequent to the Merger, and the respective assets and liabilities have been recorded at their estimated fair values in the Company’s Consolidated Balance Sheet as of the Merger, with the excess purchase price recorded as goodwill. Goodwill of $2,124.0 million is not expected to be deductible for tax purposes.
66
Table of Contents
DEL MONTE CORPORATION AND SUBSIDIARIES
(previously reported as DEL MONTE FOODS COMPANY AND SUBSIDIARIES)
NOTES TO THE CONSOLIDATED FINANCIAL STATEMENTS—(Continued)
May 1, 2011
The following table sets forth the initial allocation of purchase price with respect to the Merger (in millions):
| Assets acquired: |
||||
| Cash and cash equivalents |
$ | 147.6 | ||
| Trade accounts receivable |
224.6 | |||
| Inventories |
915.8 | |||
| Prepaid expenses and other current assets |
93.6 | |||
| Property, plant and equipment |
694.7 | |||
| Goodwill |
2,124.0 | |||
| Intangible assets |
2,835.7 | |||
| Other assets |
16.9 | |||
| Fair value of assets acquired |
7,052.9 | |||
| Liabilities assumed: |
||||
| Accounts payable and accrued expenses |
454.8 | |||
| Deferred tax liabilities |
974.2 | |||
| Other non-current liabilities |
1,584.2 | |||
| Fair value of liabilities assumed |
3,013.2 | |||
| Purchase price |
$ | 4,039.7 | ||
As a result of the allocation of the purchase price to the fair value of assets acquired and liabilities assumed, the book value of intangible assets, consisting of trademarks and customer relationships, increased by $1,679.0 million. Trademarks were valued using the relief from royalty method, which is based upon the estimated rent or royalty the Company would pay for the use of a brand name if it did not own it. Customer relationships were valued using the multi-period excess earnings method, which is a specific application of the discounted cash flow method that values an intangible asset based upon the present value of the incremental after-tax cash flows attributable to the intangible asset after deducting contributory asset charges. See Note 6 for further information regarding the Company’s intangible assets.
The Company expects the purchase price allocation to be modified in future periods, primarily with respect to contingencies, goodwill and deferred income taxes.
Fees and expenses related to the Merger were $82.8 million for the period from March 8, 2011 through May 1, 2011, primarily consisting of deal fees, financial advisory fees and legal and other professional services fees. Fees and expenses related to the Merger were $68.8 million for the period from May 3, 2010 through March 7, 2011, primarily consisting of accelerated stock compensation expense, investment banking fees and legal fees. Fees and expenses related to the Merger (whether paid or accrued) are included in the Consolidated Statements of Income (Loss) for the respective periods.
Pro forma Results
The following unaudited pro forma consolidated results of operations have been prepared as if the Merger had occurred on May 4, 2009. The selected unaudited pro forma consolidated results of operations presented have primarily been adjusted for the estimated changes in depreciation and amortization expense on property, plant and equipment and intangible assets and for changes in interest expense resulting from changes in the Company’s capital structure. Income taxes have also been adjusted to reflect an estimated annual effective tax rate. Transaction and related costs are not included in the unaudited pro forma results. The unaudited pro forma information should not be relied upon as necessarily being indicative of the historical results that would have been obtained if the Merger had actually occurred on that date, nor of the results that may be obtained in the future.
| Fiscal 2011 |
Fiscal 2010 |
|||||||
| (in millions, unaudited) | ||||||||
| Net sales |
$ | 3,666.1 | $ | 3,739.8 | ||||
| Income from continuing operations |
$ | 151.6 | $ | 135.0 | ||||
67
Table of Contents
DEL MONTE CORPORATION AND SUBSIDIARIES
(previously reported as DEL MONTE FOODS COMPANY AND SUBSIDIARIES)
NOTES TO THE CONSOLIDATED FINANCIAL STATEMENTS—(Continued)
May 1, 2011
Note 4. Discontinued Operations
As described in Note 1, on October 6, 2008 Del Monte completed the divestiture of the StarKist Seafood Business. As a result of the sale, the Company recognized a gain of $42.6 million, included in income from discontinued operations, and taxes of $12.8 million included in provision for income taxes from discontinued operations. At the time of sale, Del Monte entered into a two-year Operating Services Agreement (which was completed in September 2010) pursuant to which the Company provided operational services to Starkist Co. such as warehousing, distribution, transportation, sales, information technology and administration. Del Monte concluded that the continuing cash flows related to the Operating Services Agreement were not direct cash flows because such cash flows were not significant to the StarKist Seafood Business; accordingly, the operating results of the StarKist Seafood Business are appropriately reported as discontinued operations.
Star-Kist Samoa, Inc., which merged with and into Acquisition Sub in connection with the sale of the StarKist Seafood Business as described in Note 1, was party to a 10-year supply agreement with Tri-Marine International, Inc. (“Tri-Marine”) to purchase annual quantities of raw tuna from various vessels owned by or contracted to Tri-Marine. Total purchases by the Company under this agreement were approximately $72.8 million for fiscal 2009 (for the period prior to the sale).
Additionally, in connection with the sale of the StarKist Seafood Business, DMC entered into a Bifurcation and Partial Assignment and Assumption Agreement with Impress Group, B.V. (“Impress”) and Starkist Co. to bifurcate and assign to Starkist Co. specified rights and obligations under the Amended and Restated Supply Agreement between Impress and DMC dated as of January 23, 2008 (the “Supply Agreement”). Total purchases by the Company under the bifurcated and assigned portion of the Supply Agreement (including under its predecessor agreement) were approximately $22.7 million for fiscal 2009 (for the period prior to the sale).
Net sales from discontinued operations were $0.0 million, $0.0 million, $2.0 million and $283.9 million for the periods March 8, 2011 through May 1, 2011, May 3, 2011 through March 7, 2011, fiscal 2010 and fiscal 2009, respectively. Net sales from discontinued operations for fiscal 2010 were primarily related to changes in estimates as the Company performed the wind-down of the StarKist Seafood Business.
In October 2008, the Company applied $305.0 million from the divestiture of the StarKist Seafood Business toward the reduction of term loans. The interest expense allocated to discontinued operations represents the portion of total interest expense related to the debt repaid.
68
Table of Contents
DEL MONTE CORPORATION AND SUBSIDIARIES
(previously reported as DEL MONTE FOODS COMPANY AND SUBSIDIARIES)
NOTES TO THE CONSOLIDATED FINANCIAL STATEMENTS—(Continued)
May 1, 2011
Note 5. Supplemental Financial Statement Information
| Successor | Predecessor | |||||||||||
| May 1, 2011 |
May 2, 2010 |
|||||||||||
| (in millions) | (in millions) | |||||||||||
| Trade accounts receivable: |
||||||||||||
| Trade |
$ | 201.5 | $ | 187.3 | ||||||||
| Allowance for doubtful accounts |
— | (0.3 | ) | |||||||||
| Total |
$ | 201.5 | $ | 187.0 | ||||||||
| Inventories: |
||||||||||||
| Finished products |
$ | 613.4 | $ | 616.8 | ||||||||
| Raw materials and in-process materials |
44.3 | 43.5 | ||||||||||
| Packaging materials and other |
109.2 | 108.3 | ||||||||||
| LIFO reserve |
— | (42.2 | ) | |||||||||
| Total |
$ | 766.9 | $ | 726.4 | ||||||||
| Prepaid expenses and other current assets: |
||||||||||||
| Prepaid expenses |
$ | 71.4 | $ | 85.0 | ||||||||
| Other current assets |
94.0 | 43.5 | ||||||||||
| Total |
$ | 165.4 | $ | 128.5 | ||||||||
| Property, plant and equipment, net: |
||||||||||||
| Land and land improvements |
$ | 44.9 | $ | 33.9 | ||||||||
| Buildings and leasehold improvements |
242.3 | 304.7 | ||||||||||
| Machinery and equipment |
363.0 | 784.4 | ||||||||||
| Computers and software |
36.4 | 112.9 | ||||||||||
| Construction in progress |
55.0 | 50.9 | ||||||||||
| 741.6 | 1,286.8 | |||||||||||
| Accumulated depreciation |
(9.9 | ) | (628.0 | ) | ||||||||
| Total |
$ | 731.7 | $ | 658.8 | ||||||||
| Accounts payable and accrued expenses: |
||||||||||||
| Accounts payable—trade |
$ | 157.3 | $ | 172.1 | ||||||||
| Marketing and advertising |
70.4 | 84.2 | ||||||||||
| Accrued payroll and related costs |
51.1 | 57.3 | ||||||||||
| Accrued interest |
30.1 | 5.6 | ||||||||||
| Income tax payable |
0.5 | 0.5 | ||||||||||
| Current portion of pension liability |
29.7 | 44.5 | ||||||||||
| Other current liabilities |
147.6 | 105.3 | ||||||||||
| Total |
$ | 486.7 | $ | 469.5 | ||||||||
| Other non-current liabilities: |
||||||||||||
| Accrued postretirement benefits |
$ | 142.7 | $ | 137.3 | ||||||||
| Pension liability |
18.6 | 38.1 | ||||||||||
| Other non-current liabilities |
99.2 | 84.8 | ||||||||||
| Total |
$ | 260.5 | $ | 260.2 | ||||||||
69
Table of Contents
DEL MONTE CORPORATION AND SUBSIDIARIES
(previously reported as DEL MONTE FOODS COMPANY AND SUBSIDIARIES)
NOTES TO THE CONSOLIDATED FINANCIAL STATEMENTS—(Continued)
May 1, 2011
| Successor | Predecessor | |||||||||||||||||
| March 8, 2011 through May 1, 2011 |
May 3, 2010 through March 7, 2011 |
Fiscal 2010 |
Fiscal 2009 |
|||||||||||||||
| (in millions) | (in millions) | |||||||||||||||||
| Allowance for doubtful accounts rollforward: |
||||||||||||||||||
| Allowance for doubtful accounts at beginning of period |
$ | — | $ | (0.3 | ) | $ | (0.2 | ) | $ | (0.1 | ) | |||||||
| Additions: charged to costs and expenses |
— | — | (0.1 | ) | (0.1 | ) | ||||||||||||
| Deductions: write-offs or reversals |
— | 0.1 | — | — | ||||||||||||||
| Allowance for doubtful accounts at end of period |
$ | — | $ | (0.2 | ) | $ | (0.3 | ) | $ | (0.2 | ) | |||||||
Note 6. Goodwill and Intangible Assets
The following table presents the Company’s goodwill and intangible assets (in millions):
| Successor | Predecessor | |||||||||
| May 1, 2011 |
May 2, 2010 |
|||||||||
| Goodwill |
$ | 2,124.0 | $ | 1,337.7 | ||||||
| Non-amortizable intangible assets: |
||||||||||
| Trademarks |
$ | 1,871.6 | $ | 1,060.5 | ||||||
| Amortizable intangible assets: |
||||||||||
| Trademarks |
82.3 | 40.7 | ||||||||
| Customer relationships |
881.8 | 89.0 | ||||||||
| Other |
— | 11.0 | ||||||||
| 964.1 | 140.7 | |||||||||
| Accumulated amortization |
(7.0 | ) | (38.8 | ) | ||||||
| Amortizable intangible assets, net |
957.1 | 101.9 | ||||||||
| Intangible assets, net |
$ | 2,828.7 | $ | 1,162.4 | ||||||
As of May 1, 2011, the Company’s goodwill was comprised of $1,980.2 million related to the Pet Products segment and $143.8 million related to the Consumer Products segment. As of May 2, 2010, the Company’s goodwill was comprised of $1,187.5 million related to the Pet Products segment and $150.2 million related to the Consumer Products segment.
During the second quarter of fiscal 2010, the Company recognized an impairment charge of $3.0 million related to one of its Pet Products non-amortizable intangible assets and moved this brand from non-amortizable intangible assets to amortizable intangible assets. This impairment charge is included in selling, general and administrative expenses in the Consolidated Statements of Income (Loss) for the year ended May 2, 2010.
Amortization expense for the periods March 8, 2011 through May 1, 2011, May 3, 2010 through March 7, 2011, fiscal 2010 and fiscal 2009 was $7.0 million, $5.7 million, $6.1 million and $7.8 million, respectively. The following table presents expected amortization of intangible assets as of May 1, 2011, for each of the five succeeding fiscal years (in millions):
| 2012 |
$ | 49.3 | ||
| 2013 |
49.2 | |||
| 2014 |
49.1 | |||
| 2015 |
49.0 | |||
| 2016 |
48.9 |
As of May 1, 2011, the weighted-average life of the Company’s amortizable intangible assets was 19.9 years.
70
Table of Contents
DEL MONTE CORPORATION AND SUBSIDIARIES
(previously reported as DEL MONTE FOODS COMPANY AND SUBSIDIARIES)
NOTES TO THE CONSOLIDATED FINANCIAL STATEMENTS—(Continued)
May 1, 2011
Note 7. Short-Term Borrowings and Long-Term Debt
The Company’s debt consists of the following, as of the dates indicated (in millions):
| Successor | Predecessor | |||||||||
| May 1, 2011 |
May 2, 2010 |
|||||||||
| Short-term borrowings: |
||||||||||
| Revolver |
$ | — | $ | — | ||||||
| Other |
8.6 | 5.6 | ||||||||
| $ | 8.6 | $ | 5.6 | |||||||
| Long-term debt: |
||||||||||
| Term A Loan |
$ | — | $ | 592.5 | ||||||
| Term B Loan |
2,700.0 | — | ||||||||
| Total Term Loans |
2,700.0 | 592.5 | ||||||||
| 6 3/4% Senior Subordinated Notes |
— | 250.0 | ||||||||
| 7 1/2% Senior Subordinated Notes |
— | 450.0 | ||||||||
| 7.625% Senior Notes |
1,300.0 | — | ||||||||
| 4,000.0 | 1,292.5 | |||||||||
| Less unamortized discount1 |
6.6 | 7.3 | ||||||||
| Less current portion |
20.3 | 30.0 | ||||||||
| $ | 3,973.1 | $ | 1,255.2 | |||||||
| 1 | Unamortized discount on the Term B Loan as was $6.6 million as of May 1, 2011 and $7.3 million on the 7 1/2% Senior Subordinated Notes as of May 2, 2010. |
Senior Secured Term Loan Credit Agreement
On March 8, 2011, in connection with the Merger, DMFC entered into a new senior secured term loan credit agreement (the “Senior Secured Term Loan Credit Agreement”) with the lenders party thereto, JPMorgan Chase Bank, N.A., as administrative agent and collateral agent, and the other agents named therein, that provides for a $2,700.0 million senior secured term loan B facility (with all related loan documents, and as amended from time to time, the “Term Loan Facility”) with a term of seven years. As discussed in Note 1, on April 26, 2011, DMFC merged with and into DMC and DMC assumed all of the obligations of DMFC under the Term Loan Facility.
Interest Rates. Loans under the Term Loan Facility bear interest at a rate equal to an applicable margin, plus, at the Company’s option, either (i) a LIBOR rate (with a floor of 1.50%) or (ii) a base rate (with a floor of 2.50%) equal to the highest of (a) the federal funds rate plus 0.50%, (b) JPMorgan Chase Bank, N.A.’s “prime rate” and (c) the one-month LIBOR rate plus 1.00%. The applicable margin with respect to LIBOR borrowings is 3.00% and with respect to base rate borrowings is 2.00%. See Note 8 for a discussion of the Company’s interest rate swaps.
Principal Payments. The Term Loan Facility requires quarterly scheduled principal payments of 0.25% of the outstanding principal (which is currently $6.75 million) per quarter from September 30, 2011 to December 31, 2017. The balance is due in full on the maturity date of March 8, 2018. Scheduled principal payments with respect to the Term Loan Facility are subject to reduction on a pro rata basis upon mandatory and voluntary prepayments on terms and conditions set forth in the Senior Secured Term Loan Credit Agreement. As of May 1, 2011, the amount of outstanding loans under the Term Loan Facility was $2,700.0 million and the interest rate payable was 4.62%.
71
Table of Contents
DEL MONTE CORPORATION AND SUBSIDIARIES
(previously reported as DEL MONTE FOODS COMPANY AND SUBSIDIARIES)
NOTES TO THE CONSOLIDATED FINANCIAL STATEMENTS—(Continued)
May 1, 2011
The Senior Secured Term Loan Credit Agreement also requires the Company to prepay outstanding loans under the Term Loan Facility, subject to certain exceptions, with, among other things:
| • | Commencing with the Company’s fiscal year ending April 29, 2012, 50% (which percentage will be reduced to 25% if the Company’s leverage ratio is 5.5x or less and to 0% if the Company’s leverage ratio is 4.5x or less) of the Company’s annual excess cash flow, as defined in the Senior Secured Term Loan Credit Agreement; |
| • | 100% of the net cash proceeds of certain casualty events; |
| • | 100% of the net cash proceeds of all non-ordinary course asset sales or other dispositions of property of the Company, subject to the Company’s right to reinvest the proceeds; and |
| • | 100% of the net cash proceeds of any incurrence of debt, other than proceeds from the debt permitted under the Senior Secured Term Loan Credit Agreement. |
Ability to Incur Additional Indebtedness. The Company has the right to request an additional $500.0 million plus an additional amount of secured indebtedness under the Term Loan Facility. Lenders under this facility are under no obligation to provide any such additional loans, and any such borrowings will be subject to customary conditions precedent, including satisfaction of a prescribed leverage ratio, subject to the identification of willing lenders and other customary conditions precedent.
Senior Secured Asset-Based Revolving Facility
On March 8, 2011, in connection with the Merger, DMFC entered into a credit agreement (the “Senior Secured Asset-Based Revolving Credit Agreement”) with Bank of America, N.A., as administrative agent, and the other lender and agent parties thereto, that provides for senior secured financing of up to $750.0 million (with all related loan documents, and as amended from time to time, the “ABL Facility”) with a term of five years. As discussed in Note 1, on April 26, 2011, DMFC merged with and into DMC, and DMC, which was already a borrower under the Senior Secured Asset-Based Revolving Credit Agreement, assumed all of the obligations of DMFC under the ABL Facility.
Interest Rates. Borrowings under the ABL Facility bear interest at an initial interest rate equal to an applicable margin, plus, at the Company’s option, either (i) a LIBOR rate, or (ii) a base rate equal to the highest of (a) the federal funds rate plus 0.50%, (b) Bank of America, N.A.’s “prime rate” and (c) the one-month LIBOR rate plus 1.00%. The applicable margin with respect to LIBOR borrowings will initially be 2.25% (and may decrease to 2.00% or increase to 2.50% depending on average excess availability) and with respect to base rate borrowings will initially be 1.25% (and may decrease to 1.00% or increase to 1.50% depending on average excess availability).
Commitment Fees. In addition to paying interest on outstanding principal under the ABL Facility, the Company is required to pay a commitment fee at an initial rate of 0.500% per annum in respect of the unutilized commitments thereunder. The commitment fee rate may be reduced to 0.375% depending on the amount of excess availability under the ABL Facility. The Company must also pay customary letter of credit fees and fronting fees for each letter of credit issued.
Availability under the ABL Facility. Availability under the ABL Facility is subject to a borrowing base. The borrowing base, determined at the time of calculation, is an amount equal to: (a) 85% of eligible accounts receivable and (b) the lesser of (1) 75% of the book value of eligible inventory and (2) 85% of the net orderly liquidation value of eligible inventory, of the borrowers under the facility at such time, less customary reserves. The ABL Facility will mature, and the commitments thereunder will terminate, on March 8, 2016. As of May 1, 2011, there were no loans outstanding under the ABL Facility, the amount of letters of credit issued under the ABL Facility was $35.3 million and the net availability under the ABL Facility was $506.2 million.
The ABL Facility includes a sub-limit for letters of credit and for borrowings on same-day notice, referred to as “swingline loans.” No new letters of credit were issued under the ABL Facility on March 8, 2011 but certain letters of credit outstanding under a prior credit facility were deemed to be outstanding under the ABL Facility. The Company is the lead borrower under the ABL Facility and other domestic subsidiaries of the Company may be designated as borrowers on a joint and several basis.
72
Table of Contents
DEL MONTE CORPORATION AND SUBSIDIARIES
(previously reported as DEL MONTE FOODS COMPANY AND SUBSIDIARIES)
NOTES TO THE CONSOLIDATED FINANCIAL STATEMENTS—(Continued)
May 1, 2011
Ability to Incur Additional Indebtedness. The commitments under the ABL Facility may be increased, subject only to the consent of the new or existing lenders providing such increases, such that the aggregate principal amount of commitments does not exceed $1.0 billion. The lenders under this facility are under no obligation to provide any such additional commitments, and any increase in commitments will be subject to customary conditions precedent. Notwithstanding any such increase in the facility size, the Company’s ability to borrow under the facility will remain limited at all times by the borrowing base (to the extent the borrowing base is less than the commitments).
Guarantee of Obligations under the Senior Secured Term Loan Credit Agreement and Senior Secured Asset-Based Revolving Credit Agreement.
All obligations of the Company under the Senior Secured Term Loan Credit Agreement and Senior Secured Asset-Based Revolving Credit Agreement are unconditionally guaranteed by Parent and by substantially all existing and future, direct and indirect, wholly-owned material restricted domestic subsidiaries of the Company, subject to certain exceptions. Currently, there are no guarantor subsidiaries under any of the Company’s debt agreements.
Senior Notes Due 2019
On February 16, 2011, Blue Sub consummated a private placement offering of senior notes due February 16, 2019 with an aggregate principal amount of $1,300.0 million and a stated interest rate of 7.625% (the “7.625% Notes”). Upon consummation of the Merger, DMFC assumed Blue Sub’s obligations under the 7.625% Notes and related indenture (the indenture hereinafter referred to as the “Senior Notes Indenture”). As discussed in Note 1, on April 26, 2011, DMFC merged with and into DMC, and DMC, which was already a guarantor under the Senior Notes Indenture, assumed all of the obligations of DMFC under the Senior Notes Indenture and all related documents.
Interest Rate. Interest on the 7.625% Notes is payable semi-annually on February 15 and August 15 of each year commencing August 15, 2011.
Guarantee. The 7.625% Notes are fully and unconditionally guaranteed by each of the Company’s existing and future domestic restricted subsidiaries that guarantee its obligations under the Term Loan Facility and ABL Facility.
Redemption Rights. Prior to February 15, 2014, the Company has the option of redeeming (a) all or a part of the 7.625% Notes at 100% of the principal amount plus a “make whole” premium, or, using the proceeds from certain equity offerings and subject to certain conditions, (b) up to 35% of the then-outstanding 7.625% Notes at a premium of 107.625% of the aggregate principal amount and a special interest payment. Beginning on February 15, 2014, the Company may redeem all or a part of the 7.625% Notes at a premium ranging from 103.813% to 101.906% of the aggregate principal amount. Finally, beginning on February 15, 2016, the Company may redeem all or a part of the 7.625% Notes at face value. Any redemption as described above is subject to the concurrent payment of accrued and unpaid interest, if any, upon redemption.
Registration Obligations. Pursuant to the terms of a registration rights agreement, the Company is obligated, among other things, to use its commercially reasonable efforts to file and cause to become effective an exchange offer registration statement with the Securities and Exchange Commission (“SEC”) with respect to a registered offer (the “Exchange Offer”) to exchange the 7.625% Notes for freely tradable notes having substantially identical terms as the 7.625% Notes. Under certain circumstances, in lieu of a registered exchange offer, the Company is obligated to file a shelf registration statement with the SEC with respect to the resale of the 7.625% Notes. In the event that the Exchange Offer is not consummated (or, as applicable the shelf registration statement is not declared effective) on or prior to the 365th day from the issue date of the 7.625% Notes, the annual interest rate borne by the 7.625% Notes will be increased by 0.25%. The annual interest rate on the 7.625% Notes will increase by an additional 0.25% for each subsequent 90-day period during which the registration default continues, up to a maximum additional interest rate of 1.0% per year over the applicable interest rate described above. If the registration default is corrected, the applicable interest rate on such 7.625% Notes will revert to the original level.
73
Table of Contents
DEL MONTE CORPORATION AND SUBSIDIARIES
(previously reported as DEL MONTE FOODS COMPANY AND SUBSIDIARIES)
NOTES TO THE CONSOLIDATED FINANCIAL STATEMENTS—(Continued)
May 1, 2011
Security Interests. Indebtedness under the Term Loan Facility is generally secured by a first priority lien on substantially all of the Company’s assets, and by a second priority lien with respect to inventories and accounts receivable. The ABL Facility is generally secured by a first priority lien on the Company’s inventories and accounts receivable and a second priority lien on substantially all of the Company’s other assets. The 7.625% Notes are the Company’s senior unsecured obligations and rank senior in right of payment to the existing and future indebtedness and other obligations that expressly provide for their subordination to the 7.625% Notes; rank equally in right of payment to all of the existing and future unsecured indebtedness; are effectively subordinated to all of the existing and future secured debt (including obligations under the Term Loan Facility and ABL Facility described above) to the extent of the value of the collateral securing such debt; and are structurally subordinated to all existing and future liabilities, including trade payables, of the non-guarantor subsidiaries, to the extent of the assets of those subsidiaries.
Prior Credit Facility
The Company’s prior credit facility consisted of a $500.0 million five-year revolving credit facility (the “Revolver”) that was scheduled to mature on January 30, 2015 and a $600.0 million five-year Term A facility (the “Term A Facility”) that was scheduled to mature on January 30, 2015 (the “Prior Credit Facility”). The Revolver included a letter of credit subfacility of $150.0 million. The interest rate spread for the Revolver and the Term A Facility was adjusted periodically based on the total debt ratio and was a maximum of 2.75% over the Eurodollar rate or 1.75% over the base rate. To maintain availability of funds under the Revolver, the Company paid a 0.50% commitment fee on the unused portion of the revolving credit facility. The commitment fee had been reduced to 0.375% prior to the termination of the credit facility. The Company borrowed $491.6 million under the Revolver, and repaid a total of $491.6 million for the period May 3, 2010 through March 7, 2011. On March 8, 2011, in connection with the Merger, the Company repaid in full all outstanding loans together with interest and all other amounts due under the Prior Credit Facility and terminated the Prior Credit Facility.
Tender Offer for Senior Subordinated Notes
In connection with the Merger, Blue Sub commenced a cash tender offer for the outstanding 6 3/4% Notes and the outstanding 7 1/2% Notes. Upon consummation of the Merger, DMFC assumed Blue Sub’s obligations in connection with the tender offer. Pursuant to the tender offer, $241.6 million aggregate principal amount of the 6 3/4% Notes and $447.9 million aggregate principal amount of the 7 1/2% Notes were purchased. Aggregate principal amounts of $8.4 million for the 6 3/4% Notes and $2.1 million for the 7 1/2% Notes were not tendered and remained outstanding until April 8, 2011, when DMC redeemed them.
Deferred Debt Issuance and Debt Extinguishment Costs
In connection with entering into the Senior Secured Term Loan Credit Agreement, the Senior Secured Asset-Based Revolving Credit Agreement and the Senior Notes Indenture, the Company capitalized $164.2 million of deferred debt issuance costs; these costs will be amortized as interest expense over the term of the related debt instrument. In connection with the tender offers for the 6 3/4% Notes and 7 1/2% Notes, the Company recognized $15.8 million of expense (included in other (income) expense for the Successor period) which represents the excess cash consideration paid in connection with the tender offers and redemption of the remaining senior subordinated notes over the fair value of the senior subordinated notes as of the Merger date. In addition, in accordance with the acquisition method of accounting described in Note 3, outstanding debt immediately prior to the Merger was recorded on the opening balance sheet for the Successor period at fair value. Because the Company adjusted the book value of the Prior Credit Facility and senior subordinated notes to fair value, $25.2 million of deferred financing costs and $94.2 million of deferred debt issuance costs (including tender offer premiums) were reflected as a fair value adjustment rather than being written off by the Company.
74
Table of Contents
DEL MONTE CORPORATION AND SUBSIDIARIES
(previously reported as DEL MONTE FOODS COMPANY AND SUBSIDIARIES)
NOTES TO THE CONSOLIDATED FINANCIAL STATEMENTS—(Continued)
May 1, 2011
Maturities
As of May 1, 2011, scheduled maturities of long-term debt for each of the five succeeding fiscal years (representing debt under the Term Loans and 7.625% Notes) are as follows (in millions) 1:
| 2012 |
$ | 20.3 | ||
| 2013 |
27.0 | |||
| 2014 |
27.0 | |||
| 2015 |
27.0 | |||
| 2016 |
27.0 | |||
| Thereafter |
3,871.7 |
| 1 | Does not include any excess cash flow or other principal prepayments that may be required under the terms of the Senior Secured Term Loan Credit Agreement, as described above. |
Restrictive and Financial Covenants
The Term Loan Facility, ABL Facility and the Senior Notes Indenture contain restrictive covenants that limit the Company’s ability and the ability of its subsidiaries to take certain actions.
Term Loan Facility and ABL Facility Restrictive Covenants. The restrictive covenants in the Senior Secured Term Loan Credit Agreement and the Senior Secured Asset-Based Revolving Credit Agreement include covenants limiting the Company’s ability, and the ability of its restricted subsidiaries, to incur additional indebtedness, create liens, engage in mergers or consolidations, sell or transfer assets, pay dividends and distributions or repurchase its capital stock, make investments, loans or advances, prepay certain indebtedness, engage in certain transactions with affiliates, amend agreements governing certain subordinated indebtedness adverse to the lenders, and change its lines of business.
75
Table of Contents
DEL MONTE CORPORATION AND SUBSIDIARIES
(previously reported as DEL MONTE FOODS COMPANY AND SUBSIDIARIES)
NOTES TO THE CONSOLIDATED FINANCIAL STATEMENTS—(Continued)
May 1, 2011
Senior Notes Indenture Restrictive Covenants. The restrictive covenants in the Senior Notes Indenture include covenants limiting the Company’s ability to, among other things, pay dividends or make other payments, incur additional debt, issue stock, create certain liens or encumbrances, enter into transactions with affiliates, sell, lease or transfer substantially all of its assets and to allow its restricted subsidiaries to make payments to DMC or incur indebtedness.
Financial Maintenance Covenants. The Term Loan Facility, ABL Facility and Senior Notes Indenture generally do not require that the Company comply with financial maintenance covenants. The ABL Facility, however, contains a financial covenant that applies if availability under the ABL Facility falls below a certain level.
Effect of Restrictive and Financial Covenants. The restrictive and financial covenants in the Senior Secured Term Loan Credit Agreement, the Senior Secured Asset-Based Revolving Credit Agreement and Senior Notes Indenture may adversely affect the Company’s ability to finance its future operations or capital needs or engage in other business activities that may be in its interest, such as acquisitions.
Supplemental Disclosure of Cash Flow Information
The Company made cash interest payments of $25.8 million, $51.5 million, $98.4 million and $111.0 million for the periods March 8, 2011 through May 1, 2011, May 3, 2010 through March 7, 2011, fiscal 2010 and fiscal 2009, respectively. Cash interest paid during the periods March 8, 2011 through May 1, 2011 and May 3, 2010 through March 7, 2011 does not include costs related to the tender offers for the 6 3/4% Notes and 7 1/2% Notes and redemption of the remaining 6 3/4% Notes and 7 1/2% Notes. Cash interest paid in fiscal 2010 does not include cash costs paid in connection with entering into the Prior Credit Facility, refinancing the credit facility that existed before the Prior Credit Facility, the issuance of the 7 1/2% Notes or the tender offer for previously outstanding 8 5/8% senior subordinated notes due 2012, which are included in interest expense in the Consolidated Statements of Income (Loss).
Note 8. Derivative Financial Instruments
The Company uses interest rate swaps, commodity swaps, futures, option and swaption (an option on a swap) contracts as well as forward foreign currency contracts to hedge market risks relating to possible adverse changes in interest rates, commodity, transportation and other prices and foreign currency exchange rates. As of May 1, 2011 all of the Company’s derivative contracts were economic hedges.
Interest Rates: The Company’s debt primarily consists of floating rate term loans and fixed rate notes. The Company also uses its floating rate revolver to fund seasonal working capital needs and other uses of cash. Interest expense on the Company’s floating rate debt is typically calculated based on a fixed spread over a reference rate, such as LIBOR (also known as the Eurodollar rate). Therefore, fluctuations in market interest rates will cause interest expense increases or decreases on a given amount of floating rate debt.
The Company from time to time manages a portion of its interest rate risk related to floating rate debt by entering into interest rate swaps in which the Company receives floating rate payments and makes fixed rate payments. On April 12, 2011, DMFC entered into interest rate swaps with a total notional amount of $900.0 million, as the fixed rate payer. The interest rate swaps fix LIBOR at 3.029% for the term of the swaps. The swaps have an effective date of September 4, 2012 and a maturity date of September 1, 2015. On August 13, 2010, the Company entered into an interest rate swap, with a notional amount of $300.0 million, as the fixed rate payer. The interest rate swap fixes LIBOR at 1.368% for the term of the swap. The swap has an effective date of February 1, 2011 and a maturity date of February 3, 2014. The fair value of the Company’s interest rate swaps was recorded as a current liability of $3.2 million and a non-current liability of $14.0 million at May 1, 2011.
On September 6, 2007, the Company entered into an interest rate swap, with a notional amount of $400.0 million, as the fixed rate payer. The swap had an effective date of October 26, 2007 and a maturity date of October 29, 2010. A formal cash flow hedge accounting relationship was established between the swap and a portion of the Company’s interest payment on floating rate debt. On January 29, 2010, in conjunction with the repayment of a prior credit facility, the interest rate swap was deemed ineffective due to the repayment of the underlying hedged liability. In fiscal 2010, the $13.4 million loss associated with the swap being deemed ineffective was reclassified from OCI into earnings and is included in other (income) expense in the Consolidated Statements of Income (Loss). The interest rate cash flow hedges had an impact of $12.5 million on interest expense for fiscal 2010. On April 27, 2010, the Company terminated this interest rate swap and made a final payment to the counterparty of $13.4 million.
76
Table of Contents
DEL MONTE CORPORATION AND SUBSIDIARIES
(previously reported as DEL MONTE FOODS COMPANY AND SUBSIDIARIES)
NOTES TO THE CONSOLIDATED FINANCIAL STATEMENTS—(Continued)
May 1, 2011
Swaps are recorded as an asset or liability in the Company’s consolidated balance sheet at fair value. Any gains and losses on economic hedges as well as ineffectiveness of cash flow hedges are recorded as an adjustment to other (income) expense. Derivative gains and losses for cash flow hedges were included in OCI (pre-Merger) and reclassified to interest expense as the underlying transaction occurred.
Commodities: Certain commodities such as soybean meal, corn, wheat, soybean oil, diesel fuel and natural gas (collectively, “commodity contracts”) are used in the production and transportation of the Company’s products. Generally these commodities are purchased based upon market prices that are established with the vendor as part of the purchase process. The Company uses futures, swaps, swaption or option contracts, as deemed appropriate, to reduce the effect of price fluctuations on anticipated purchases. The Company accounted for these commodities derivatives as either economic or cash flow hedges. Changes in the value of economic hedges are recorded directly in earnings. For cash flow hedges, the effective portion of derivative gains and losses was deferred in equity and recognized as part of cost of products sold in the appropriate period and the ineffective portion was recognized as other (income) expense. These contracts may have a term of up to 24 months.
On May 1, 2011, the fair values of the Company’s commodities hedges were recorded as current assets of $8.0 million and current liabilities of $2.2 million. The fair values of the Company’s commodities hedges were recorded as current assets of $11.1 million and current liabilities of $2.5 million at May 2, 2010.
The notional amounts of the Company’s commodity contracts as of the dates indicated (in millions):
| Successor | Predecessor | |||||||||
| May 1, 2011 |
May 2, 2010 |
|||||||||
| Commodity contracts |
$ | 71.2 | $ | 145.2 | ||||||
Foreign Currency: The Company manages its exposure to fluctuations in foreign currency exchange rates by entering into forward contracts to cover a portion of its projected expenditures paid in local currency. The Company accounted for these contracts as either economic hedges or cash flow hedges. Changes in the value of the economic hedges are recorded directly in earnings. For cash flow hedges, the effective portion of derivative gains and losses was deferred in equity (pre-Merger) and recognized as part of cost of products sold in the appropriate period and the ineffective portion was recognized as other (income) expense. As of May 1, 2011, the fair values of the Company’s foreign currency hedges were recorded as current assets of $3.0 million and current liabilities of $1.0 million. As of May 2, 2010, the fair values of the Company’s foreign currency hedges were recorded as current assets of $4.5 million and current liabilities of $0.5 million. These contracts may have a term of up to 24 months.
The notional amounts of the Company’s foreign currency derivative contracts as of May 1, 2011 and May 2, 2010 were as follows (in millions):
| Successor | Predecessor | |||||||||
| May 1, 2011 |
May 2, 2010 |
|||||||||
| Contract amount (Mexican pesos) |
$ | 20.0 | $ | 22.5 | ||||||
| Contract amount ($CAD) |
15.3 | 29.0 | ||||||||
77
Table of Contents
DEL MONTE CORPORATION AND SUBSIDIARIES
(previously reported as DEL MONTE FOODS COMPANY AND SUBSIDIARIES)
NOTES TO THE CONSOLIDATED FINANCIAL STATEMENTS—(Continued)
May 1, 2011
Fair Value of Derivative Instruments:
The fair value of derivative instruments (all of which are not designated as hedging instruments) recorded in the Consolidated Balance Sheet as of May 1, 2011 was as follows:
| Asset derivatives |
Liability derivatives |
|||||||||||
| Derivatives in economic hedging relationships |
Balance Sheet location |
Fair value |
Balance Sheet location |
Fair value |
||||||||
| (in millions) | ||||||||||||
| Interest rate contracts |
Other non-current assets | $ | — | Other non-current liabilities | $ | 14.0 | ||||||
| Interest rate contracts |
Prepaid expenses and other current assets | — | Accounts payable and accrued expenses | 3.2 | ||||||||
| Commodity and other contracts |
Prepaid expenses and other current assets | 8.0 | Accounts payable and accrued expenses | 2.2 | ||||||||
| Foreign currency exchange contracts |
Prepaid expenses and other current assets | 3.0 | Accounts payable and accrued expenses | 1.0 | ||||||||
| Total |
$ | 11.0 | $ | 20.4 | ||||||||
The fair value of derivative instruments recorded in the Consolidated Balance Sheet as of May 2, 2010 was as follows:
| Asset derivatives |
Liability derivatives |
|||||||||||
| Derivatives in cash flow hedging relationships |
Balance Sheet location |
Fair value |
Balance Sheet location |
Fair value |
||||||||
| (in millions) | ||||||||||||
| Interest rate contracts |
Other non-current assets | $ | — | Other non-current liabilities | $ | — | ||||||
| Commodity and other contracts |
Prepaid expenses and other current assets | 11.1 | 1 | Accounts payable and accrued expenses | 2.5 | |||||||
| Foreign currency exchange contracts |
Prepaid expenses and other current assets | 4.5 | Accounts payable and accrued expenses | 0.5 | ||||||||
| Total |
$ | 15.6 | $ | 3.0 | ||||||||
| 1 | Includes $6.4 million of commodity contracts not designated as hedging instruments. |
The effect of the Company’s economic hedges on other (income) expense for the period March 8, 2011 through May 1, 2011, in the Consolidated Statements of Income (Loss) was as follows:
| (in millions) | ||||
| Interest rate contracts |
$ | 16.9 | ||
| Commodity and other contracts |
(4.8 | ) | ||
| Foreign currency exchange contracts |
0.4 | |||
| Total |
$ | 12.5 | ||
78
Table of Contents
DEL MONTE CORPORATION AND SUBSIDIARIES
(previously reported as DEL MONTE FOODS COMPANY AND SUBSIDIARIES)
NOTES TO THE CONSOLIDATED FINANCIAL STATEMENTS—(Continued)
May 1, 2011
The effect of derivative instruments recorded for the period May 3, 2010 through March 7, 2011, in the Consolidated Statements of Income (Loss) was as follows:
| Derivatives in cash flow hedging relationships |
Gain (loss) recognized in AOCI |
Location of gain (loss) reclassified in AOCI |
Gain (loss) reclassified from AOCI into income |
Location of gain (loss) recognized in income (ineffective portion and amount excluded from effectiveness testing) |
Gain (loss) recognized in income (ineffective portion and amount excluded from effectiveness testing) |
|||||||||||
| (in millions) | ||||||||||||||||
| Interest rate contracts |
$ | — | Interest expense | $ | (0.3 | ) | Other income (expense) | $ | — | |||||||
| Commodity and other contracts |
19.3 | Cost of products sold | 12.0 | Other income (expense) | (0.6 | )1 | ||||||||||
| Foreign currency exchange contracts |
(1.8 | ) | Cost of products sold | 3.2 | Other income (expense) | 0.2 | ||||||||||
| Total |
$ | 17.5 | $ | 14.9 | $ | (0.4 | ) | |||||||||
| 1 | Includes a loss of $0.1 million for commodity contracts not designated as hedging instruments. |
The effect of derivative instruments recorded for the fiscal year ended May 2, 2010 in the Consolidated Statements of Income (Loss) was as follows:
| Derivatives in cash flow hedging relationships |
Gain (loss) recognized in AOCI |
Location of gain (loss) reclassified in AOCI |
Gain (loss) reclassified from AOCI into income |
Location of gain (loss) recognized in income (ineffective portion and amount excluded from effectiveness testing) |
Gain (loss) recognized in income (ineffective portion and amount excluded from effectiveness testing) |
|||||||||||
| (in millions) | ||||||||||||||||
| Interest rate contracts |
$ | 12.8 | Interest expense | $ | (12.5 | ) | Other income (expense) | $ | (13.4 | ) | ||||||
| Commodity and other contracts |
1.5 | Cost of products sold | (11.5 | ) | Other income (expense) | 3.3 | 1 | |||||||||
| Foreign currency exchange contracts |
2.5 | Cost of products sold | 0.5 | Other income (expense) | 0.4 | |||||||||||
| Total |
$ | 16.8 | $ | (23.5 | ) | $ | (9.7 | ) | ||||||||
| 1 | Includes a gain of $6.3 million for commodity contracts not designated as hedging instruments. |
Note 9. Fair Value Measurements
A three-tier fair value hierarchy is used to prioritize the inputs used in measuring fair value. The hierarchy gives the highest priority to quoted prices in active markets (Level 1) and the lowest priority to unobservable inputs (Level 3). The three levels are defined as follows:
| • | Level 1 Inputs—unadjusted quoted prices in active markets for identical assets or liabilities; |
| • | Level 2 Inputs—quoted prices for similar assets and liabilities in active markets or inputs that are observable for the asset or liability, either directly or indirectly through market corroboration, for substantially the full term of the financial instrument; and |
| • | Level 3 Inputs—unobservable inputs reflecting the Company’s own assumptions in measuring the asset or liability at fair value. |
79
Table of Contents
DEL MONTE CORPORATION AND SUBSIDIARIES
(previously reported as DEL MONTE FOODS COMPANY AND SUBSIDIARIES)
NOTES TO THE CONSOLIDATED FINANCIAL STATEMENTS—(Continued)
May 1, 2011
The Company uses interest rate swaps, commodity contracts and forward foreign currency contracts to hedge market risks relating to possible adverse changes in interest rates, commodity prices, diesel fuel prices and foreign exchange rates.
The following table provides the fair values hierarchy for financial assets and liabilities measured on a recurring basis (in millions):
| Successor | Predecessor | Successor | Predecessor | Successor | Predecessor | |||||||||||||||||||||||||||||
| Level 1 | Level 2 | Level 3 | ||||||||||||||||||||||||||||||||
| Fair value | ||||||||||||||||||||||||||||||||||
| Description |
May 1, 2011 |
May 2, 2010 |
May 1, 2011 |
May 2, 2010 |
May 1, 2011 |
May 2, 2010 |
||||||||||||||||||||||||||||
| Assets |
||||||||||||||||||||||||||||||||||
| Interest rate contracts |
$ | — | $ | — | $ | — | $ | — | $ | — | $ | — | ||||||||||||||||||||||
| Commodity contracts |
7.5 | 3.5 | 0.5 | 7.6 | — | — | ||||||||||||||||||||||||||||
| Foreign currency contracts |
— | — | 3.0 | 4.5 | — | — | ||||||||||||||||||||||||||||
| Total |
$ | 7.5 | $ | 3.5 | $ | 3.5 | $ | 12.1 | $ | — | $ | — | ||||||||||||||||||||||
| Liabilities |
||||||||||||||||||||||||||||||||||
| Interest rate contracts |
$ | — | $ | — | $ | 17.2 | $ | — | $ | — | $ | — | ||||||||||||||||||||||
| Commodity contracts |
2.2 | 2.2 | — | 0.3 | — | — | ||||||||||||||||||||||||||||
| Foreign currency contracts |
— | — | 1.0 | 0.5 | — | — | ||||||||||||||||||||||||||||
| Total |
$ | 2.2 | $ | 2.2 | $ | 18.2 | $ | 0.8 | $ | — | $ | — | ||||||||||||||||||||||
The Company’s determination of the fair value of its interest rate swaps was calculated using a discounted cash flow analysis based on the terms of the swap contracts and the observable interest rate curve. The Company’s futures and options contracts are traded on regulated exchanges such as the Chicago Board of Trade, Kansas City Board of Trade and the New York Mercantile Exchange. The Company values these contracts based on the daily settlement prices published by the exchanges on which the contracts are traded. The Company’s commodities swap and swaption contracts are traded over-the-counter and are valued based on the Chicago Board of Trade quoted prices for similar instruments in active markets or corroborated by observable market data available from the Energy Information Administration. The Company measures the fair value of foreign currency forward contracts using an income approach based on forward rates (obtained from market quotes for futures contracts with similar terms) less the contract rate multiplied by the notional amount.
The book value of certain of the Company’s financial instruments, including cash and cash equivalents, accounts receivable and accounts payable and accrued expenses, approximates fair value due to the relatively short maturity of such instruments. The fair values of the senior subordinated notes and senior notes are disclosed in Note 2. The fair values of the retirement plan’s investments are disclosed in Note 11.
Note 10. Stock Plans
Current Equity Compensation Plans
The 2011 Stock Incentive Plan for Key Employees of Blue Acquisition Group, Inc. and its Affiliates was adopted by the Board of Directors of Parent (the “Parent Board”) effective February 16, 2011 (the “2011 Plan”). The 2011 Plan provides for the grant of stock options and other stock based awards to key service providers of Parent and its affiliates, including the Company. 18,777,653 shares of common stock of Parent were initially reserved for grant under the plan, with such number to be automatically increased in the event the Parent Board and the Company’s Chief Executive Officer (“CEO”) make grant allocations that exceed such amount. As of May 1, 2011, 12,515,981 shares of common stock were available for future grant subject to the automatic increase provision described above. Following the termination of employment of an optionholder, shares received pursuant to the exercise of options generally remain subject to certain put and call rights which vary depending on the nature of the termination.
80
Table of Contents
DEL MONTE CORPORATION AND SUBSIDIARIES
(previously reported as DEL MONTE FOODS COMPANY AND SUBSIDIARIES)
NOTES TO THE CONSOLIDATED FINANCIAL STATEMENTS—(Continued)
May 1, 2011
Certain options granted under the 2011 Plan were issued in exchange for options to purchase DMFC’s common stock granted under the Company’s previous equity plans (the “Rollover Options”). There were a total of 9,385,492 Rollover Options granted with a fair value of $3.75 per share. The Company did not incur any expense in connection with the issuance of the Rollover Options because they were granted in exchange for options of equal value. The Rollover Options are fully vested, and generally remain subject to their original terms under the Company’s previous equity plans, with applicable adjustments to convert the exercise price and number of shares of such options. Further, Rollover Options do not count toward the shares of common stock available for grant under the 2011 Plan.
During the period March 8, 2011 through May 1, 2011, Parent granted 3,130,824 performance-based options with a grant date fair value of $1.40 per share to employees of the Company. Options subject to performance-based vesting generally vest at the end of each of fiscal years 2012 through 2016 if Parent achieves a pre-determined EBITDA- related financial target with respect to such fiscal year. In the event any such annual target is not achieved, those options that would have become vested pursuant to the achievement of such target may nevertheless vest at the end of the subsequent fiscal year if Parent achieves the applicable cumulative EBITDA-related financial target. In addition, upon the occurrence of an event or transaction pursuant to which the Sponsors realize a cash return on their interests in the Parent greater that a predetermined threshold, an additional portion of the performance-based options may vest depending on the extent to which the realized return exceeds such threshold. The term of any performance-based option granted under the 2011 Plan may not be more than ten years from the date of its grant.
The fair value of performance-based options that vest as described above was determined based on an option pricing model. Key inputs were an expected life of 7.5 years, expected volatility of 40% and a risk-free rate of 2.22%.
During the period March 8, 2011 through May 1, 2011, Parent granted 3,130,848 service-based options with a grant date fair value of $2.42 per share to employees of the Company. Generally, options granted under the 2011 Plan that are subject to service-based vesting vest in five equal installments on each of the first five anniversaries of March 8, 2011. The term of any service-based option granted under the 2011 Plan may not be more than ten years from the date of its grant.
Options granted under the 2011 Plan that are subject to service-based vesting are generally subject to partial accelerated vesting upon certain terminations of employment of the optionholder. In the event of the termination of an optionholder’s employment due to death or disability or, in the event of the termination of an optionholder’s employment by the Company without cause or by the optionholder for good reason after March 8, 2013, that portion of the service-based options that would have become vested upon the next annual vesting date will vest as of the employment termination date. Following the termination of employment of an optionholder, shares received pursuant to the exercise of options generally remain subject to certain put and call rights which vary depending on the nature of the termination. In addition, in the event of certain change in control transactions, any outstanding portion of service-based options will become vested and exercisable, and, in the event of a certain change in control transaction pursuant to an event wherein the Sponsors realize a cash return on their interests in Parent greater than a predetermined target, all options subject to performance-based vesting will vest.
The fair value for service-based stock options granted was estimated at the date of grant using a Black-Scholes option-pricing model. The expected term of options granted was based on the “simplified” method. Expected stock price volatility was determined based on the historical volatility of DMFC and implied volatilities of comparable companies over a historical period that matches the expected life of the options. The risk-free interest rate was based on the expected U.S. Treasury rate over the expected life. The dividend yield was based on the expectation that no dividends will be paid. The following table presents the weighted-average assumptions for service-based options granted for the period March 8, 2011 through May 1, 2011:
| Successor | ||||
| March 8, 2011 through May 1, 2011 |
||||
| Expected life (in years) |
6.5 | |||
| Expected volatility |
45.0 | % | ||
| Risk-free interest rate |
2.8 | % | ||
| Dividend yield |
0.0 | % | ||
81
Table of Contents
DEL MONTE CORPORATION AND SUBSIDIARIES
(previously reported as DEL MONTE FOODS COMPANY AND SUBSIDIARIES)
NOTES TO THE CONSOLIDATED FINANCIAL STATEMENTS—(Continued)
May 1, 2011
The following table represents the stock option activity for the period March 8, 2011 through May 1, 2011:
| Options Outstanding |
Weighted- Average Exercise Price |
Options Exercisable |
Exercisable Weighted- Average Exercise Price |
|||||||||||||
| Balance at March 8, 2011 |
— | N/A | — | N/A | ||||||||||||
| Granted |
15,647,164 | $ | 2.75 | 9,385,492 | $ | 1.25 | ||||||||||
| Forfeited |
— | — | ||||||||||||||
| Exercised |
— | — | ||||||||||||||
| Balance at May 1, 2011 |
15,647,164 | $ | 2.75 | 9,385,492 | $ | 1.25 | ||||||||||
As of May 1, 2011, all of the options outstanding are equity classified. As of May 1, 2011, there was approximately $11.6 million of unrecognized compensation cost, which is expected to be recognized over a weighted-average period of 4.9 years. As of May 1, 2011, the weighted-average remaining contractual life of options outstanding was 8.7 years.
Prior Equity Compensation Plans
On March 8, 2011, in connection with the closing of the Merger, each outstanding share of DMFC’s common stock, par value $.01 per share, was cancelled and automatically converted into the right to receive $19.00 per share in cash. Also effective as of the closing of the Merger on March 8, 2011, outstanding awards under the Del Monte Foods Company Non-Employee Director and Independent Contractor 1997 Stock Incentive Plan, as amended through November 15, 2000; the Del Monte Foods Company 1997 Stock Incentive Plan, as amended October 21, 1999; the Del Monte Foods Company 1998 Stock Incentive Plan, as amended through November 15, 2000; the Del Monte Foods Company 2002 Stock Incentive Plan, as amended and restated, effective July 28, 2009 and approved by the stockholders September 24, 2009; and the Del Monte Corporation AIP Deferred Compensation Plan (collectively, the “Plans”), vested in full and were converted to either immediate cash payments or fully vested new options to purchase common stock of Parent. No additional shares are available to be granted under any of the above named plans.
The Del Monte Foods Company Non-Employee Director and Independent Contractor 1997 Stock Incentive Plan (“the 1997 Non-Employee Plan”) permitted grants of non-qualified stock options to certain non-employee directors and independent contractors of the Company. The term of any option was limited to ten years from the date of its grant and options generally vested over a four-year period.
The Del Monte Foods Company 1998 Stock Incentive Plan (the “1998 Plan”) permitted grants of incentive and nonqualified stock options (“Options”), stock appreciation rights (“SARs”) and stock bonuses to certain employees, non-employee directors and consultants of Del Monte. The term of any Option or SAR was limited to ten years from the date of its grant. Options generally vested over four or five years.
The Del Monte Foods Company 2002 Stock Incentive Plan (the “2002 Plan”) as amended through July 28, 2009, authorized 42,978,385 shares for grant pursuant to awards of incentive and nonqualified stock options, stock appreciation rights, stock bonuses and other stock-based compensation, including performance units or shares (together with Options, SARs and stock bonuses, “Stock-based Incentive Awards”) to certain employees, non-employee directors and independent contractors. The 2002 Plan also allowed cash awards. The term of any Option or SAR was limited to ten years from the date of its grant, with options generally vesting over a four-year period.
The Del Monte Foods Company Non-Employee Director Compensation Plan, as amended and restated, generally provided, among other things, that each eligible director annually receive $0.11 million worth of restricted DMFC common stock or restricted stock units (“Non-Employee Director RSUs”) under the 2002 Plan. Such Non-Employee Director RSUs generally were granted promptly after each annual meeting of stockholders, and vested over three years from the date of grant. Non-Employee Directors appointed between annual meetings were granted a prorated award upon appointment. During the period May 3, 2010 through March 7, 2011, the Company granted 69,648 Non-Employee Director RSUs after the 2010 annual meeting based on the average of the high and low price on September 23, 2010 of $12.64 per share.
82
Table of Contents
DEL MONTE CORPORATION AND SUBSIDIARIES
(previously reported as DEL MONTE FOODS COMPANY AND SUBSIDIARIES)
NOTES TO THE CONSOLIDATED FINANCIAL STATEMENTS—(Continued)
May 1, 2011
During the period May 3, 2010 through March 7, 2011, the Company granted up to a maximum of 1,024,050 performance shares (682,700 shares at the target amount) at a grant date fair value of $7.67 per share. Performance shares granted during the period May 3, 2010 through March 7, 2011 were subject to vesting in connection with the attainment of predetermined relative total shareholder return for the period from the beginning of fiscal 2012 to the end of fiscal 2014. Performance shares granted in fiscal 2010 were subject to vesting in connection with the attainment of predetermined relative total shareholder return for the period from the beginning of fiscal 2011 to the end of fiscal 2013. Performance shares granted in fiscal 2009 were subject to vesting in connection with the attainment of predetermined relative total shareholder return for the period from the beginning of fiscal 2010 to the end of fiscal 2012. During the period May 3, 2010 through March 7, 2011, the Company granted 308,300 restricted stock units to employees at a grant date fair value of $11.57 per share. The restricted stock units were designed to vest over a four-year period, with one-quarter of the units vesting on each of the first two anniversaries of the grant date, and the remainder vesting on the fourth anniversary of the grant date. The Company did not grant any performance accelerated restricted stock units (“PARs”) to employees during the period May 3, 2010 through March 7, 2011.
Under the Del Monte Foods Company 2003 Non-Employee Director Deferred Compensation Plan and the 2005 Non-Employee Director Deferred Compensation Plan, non-employee directors could elect to defer 0%, 50% or 100% of their cash compensation, stock-based compensation or both, which amount would instead be converted to deferred stock units each representing one share of DMFC’s common stock. Upon termination from the Board, the deferred stock units are converted to shares of DMFC’s common stock and distributed in shares as a lump sum or installments for up to 15 years, as elected by the non-employee director. These deferred stock units and related distributed shares were issued under the 2002 Plan.
The Del Monte Corporation Annual Incentive Program Deferred Compensation Plan (“the AIP Deferred Compensation Plan”) permitted, through the date it was frozen on October 2, 2009, participants to defer part or all of their annual cash incentive award. The AIP Deferred Compensation Plan provided that such cash deferrals were to be converted into vested deferred stock units, and those participants received an additional Company match grant of deferred stock units that vested over a three-year period. The deferred stock units and related distributed shares of DMFC common stock issued in connection with deferrals under the Old Plan were issued under the 2002 Plan.
The fair value for DMFC’s stock options granted was estimated at the date of grant using a Black-Scholes option-pricing model. The following table presents the weighted-average assumptions for options granted for the period May 3, 2010 through March 7, 2011, fiscal 2010 and fiscal 2009:
| Predecessor | ||||||||||||
| May 3, 2010 through March 7, 2011 |
Fiscal 2010 |
Fiscal 2009 |
||||||||||
| Expected life (in years) |
6.0 | 6.0 | 6.1 | |||||||||
| Expected volatility |
29.4 | % | 28.5 | % | 26.4 | % | ||||||
| Risk-free interest rate |
1.7 | % | 2.7 | % | 3.2 | % | ||||||
| Dividend yield |
2.4 | % | 2.6 | % | 1.8 | % | ||||||
The expected life is the average length of time in which the Company expects its employees to exercise their options. Expected stock volatility reflects movements in DMFC’s stock price over a historical period that matches the expected life of the options. The risk-free interest rate is based on the expected U.S. Treasury rate over the expected life. The dividend yield assumption is based on the Company’s expectation regarding the future payment of dividends.
The weighted-average fair value per share of options granted for the period May 3, 2010 through March 7, 2011, fiscal 2010 and fiscal 2009 was $2.90, $2.69 and $2.04, respectively. Except for performance shares that vest based on relative total shareholder return, the fair value of other stock-based compensation was determined by the market value of DMFC’s common stock on the date of grant. Performance shares that vest based on relative total shareholder return are considered to contain a market condition; the fair value of these shares was determined based on a model which considered the estimated probabilities of possible outcomes. For stock awards that are not credited with dividends during the vesting period, the value is reduced by the present value of the expected dividend stream during the vesting period in order to calculate the grant date fair value. The total intrinsic value of options exercised for the period May 3, 2010 through March 7, 2011, fiscal 2010 and fiscal 2009 was $56.5 million, $6.5 million and $0.2 million, respectively.
83
Table of Contents
DEL MONTE CORPORATION AND SUBSIDIARIES
(previously reported as DEL MONTE FOODS COMPANY AND SUBSIDIARIES)
NOTES TO THE CONSOLIDATED FINANCIAL STATEMENTS—(Continued)
May 1, 2011
The Company recognized total stock compensation expense of $45.3 million, $21.3 million and $12.2 million for the period May 3, 2010 through March 7, 2011, fiscal 2010 and fiscal 2009, respectively. Because the Merger constituted a change of control, the vesting of all stock awards was accelerated resulting in an incremental $33.2 million of stock compensation expense for the period May 3, 2010 through March 7, 2011. The total income tax benefit recognized in the Consolidated Statements of Income (Loss) for stock-based compensation arrangements was $17.7 million, $8.4 million and $4.3 million for the period May 3, 2010 through March 7, 2011, fiscal 2010 and fiscal 2009, respectively. No stock compensation cost was capitalized as part of inventory and fixed assets for the twelve months ended May 1, 2011, fiscal 2010 and fiscal 2009.
Stock option activity and related information during the periods indicated was as follows:
| Options Outstanding |
Weighted- Average Exercise Price |
Options Exercisable |
Exercisable Weighted- Average Exercise Price |
|||||||||||||
| Balance at April 27, 2008 |
16,460,664 | $ | 9.72 | 10,761,811 | $ | 9.35 | ||||||||||
| Granted |
3,483,800 | 7.90 | ||||||||||||||
| Forfeited |
(2,323,051 | ) | 11.31 | |||||||||||||
| Exercised |
(236,600 | ) | 7.81 | |||||||||||||
| Balance at May 3, 2009 |
17,384,813 | 9.17 | 10,993,068 | 9.23 | ||||||||||||
| Granted |
3,001,000 | 11.37 | ||||||||||||||
| Forfeited |
(207,249 | ) | 10.12 | |||||||||||||
| Exercised |
(1,453,058 | ) | 8.40 | |||||||||||||
| Balance at May 2, 2010 |
18,725,506 | 9.57 | 11,781,956 | 9.37 | ||||||||||||
| Granted |
2,161,300 | 12.64 | ||||||||||||||
| Forfeited |
(71,265 | ) | 9.74 | |||||||||||||
| Exercised |
(6,666,735 | ) | 8.91 | |||||||||||||
| Options vested due to the Merger |
(14,148,806 | ) | 10.35 | |||||||||||||
| Balance at March 8, 2011 |
— | N/A | N/A | N/A | ||||||||||||
As of May 2, 2010, the aggregate intrinsic value of options outstanding was $100.5 million and the aggregate intrinsic value of options exercisable was $65.6 million.
Other stock-based compensation activity and related information during the period indicated was as follows:
| Number of Shares |
Weighted- Average Grant-Date Fair Value |
|||||||
| Nonvested balance at May 2, 2010 |
4,644,483 | $ | 6.38 | |||||
| Granted |
1,710,336 | 9.75 | ||||||
| Forfeited |
(34,054 | ) | 5.62 | |||||
| Vested |
(6,320,765 | ) | 7.45 | |||||
| Nonvested balance at March 8, 2011 |
— | N/A | ||||||
The total grant date fair value of shares vested for the period May 3, 2010 through March 7, 2011, fiscal 2010 and fiscal 2009, was $47.1 million, $4.0 million and $5.3 million, respectively.
For the period May 3, 2010 through March 7, 2011, the Company received cash of $59.6 million and realized a reduction in cash taxes payable of $25.4 million from the exercise of stock options.
84
Table of Contents
DEL MONTE CORPORATION AND SUBSIDIARIES
(previously reported as DEL MONTE FOODS COMPANY AND SUBSIDIARIES)
NOTES TO THE CONSOLIDATED FINANCIAL STATEMENTS—(Continued)
May 1, 2011
Supplemental Disclosure of Non-cash Financing Activities
As described above, in connection with the Merger, certain stock options of the Company’s previous equity plans were exchanged for 9,385,492 Rollover Options for a total value of $35.2 million.
Note 11. Retirement Benefits
Defined Benefit Plans. Del Monte sponsors a qualified defined benefit pension plan (during the third quarter of fiscal 2010, the Company merged its three qualified defined benefit pension plans into a single plan) and several unfunded defined benefit postretirement plans providing certain medical, dental and life insurance benefits to eligible retired, salaried, non-union hourly and union employees. The details of such plans, including discontinued operations, are as follows (in millions):
| Successor | Predecessor | Successor | Predecessor | |||||||||||||||||||||||||||
| Pension Benefits | Other Benefits | |||||||||||||||||||||||||||||
| May 1, 2011 |
March 7, 2011 |
May 2, 2010 |
May 1, 2011 |
March 7, 2011 |
May 2, 2010 |
|||||||||||||||||||||||||
| Change in benefit obligation: |
||||||||||||||||||||||||||||||
| Benefit obligation at beginning of period |
$ | 435.7 | $ | 441.8 | $ | 359.4 | $ | 154.6 | $ | 144.0 | $ | 115.8 | ||||||||||||||||||
| Service cost |
1.9 | 11.9 | 10.9 | 0.3 | 1.3 | 1.6 | ||||||||||||||||||||||||
| Interest cost |
3.5 | 19.6 | 26.7 | 1.3 | 7.2 | 8.5 | ||||||||||||||||||||||||
| Actuarial (gain)/loss |
6.3 | (6.1 | ) | 75.6 | (6.1 | ) | 5.1 | 21.6 | ||||||||||||||||||||||
| Benefits paid |
(7.2 | ) | (31.5 | ) | (31.2 | ) | (0.5 | ) | (3.0 | ) | (3.5 | ) | ||||||||||||||||||
| Plan amendment |
— | — | 0.4 | — | — | — | ||||||||||||||||||||||||
| Benefit obligation at end of period |
$ | 440.2 | $ | 435.7 | $ | 441.8 | $ | 149.6 | $ | 154.6 | $ | 144.0 | ||||||||||||||||||
| Accumulated benefit obligation |
$ | 421.9 | $ | 418.1 | $ | 423.8 | ||||||||||||||||||||||||
| Change in plan assets: |
||||||||||||||||||||||||||||||
| Fair value of plan assets at beginning of period |
$ | 442.5 | $ | 399.8 | $ | 268.2 | $ | — | $ | — | $ | — | ||||||||||||||||||
| Actual gain on plan assets |
13.8 | 34.2 | 66.1 | — | — | — | ||||||||||||||||||||||||
| Employer contributions |
— | 40.0 | 96.7 | 0.5 | 3.0 | 3.5 | ||||||||||||||||||||||||
| Benefits paid |
(7.2 | ) | (31.5 | ) | (31.2 | ) | (0.5 | ) | (3.0 | ) | (3.5 | ) | ||||||||||||||||||
| Fair value of plan assets at end of period |
$ | 449.1 | $ | 442.5 | $ | 399.8 | $ | — | $ | — | $ | — | ||||||||||||||||||
| Funded status at end of period |
$ | 8.9 | $ | 6.8 | $ | (42.0 | ) | $ | (149.6 | ) | $ | (154.6 | ) | $ | (144.0 | ) | ||||||||||||||
| Amounts recognized in the Consolidated Balance Sheets consist of: |
||||||||||||||||||||||||||||||
| Other assets, net |
$ | 8.9 | $ | 6.8 | $ | — | $ | — | $ | — | $ | — | ||||||||||||||||||
| Accounts payable and accrued expenses |
— | — | (40.0 | ) | (6.9 | ) | (7.3 | ) | $ | (6.7 | ) | |||||||||||||||||||
| Other non-current liabilities |
— | — | (2.0 | ) | (142.7 | ) | (147.3 | ) | (137.3 | ) | ||||||||||||||||||||
| Total |
$ | 8.9 | $ | 6.8 | $ | (42.0 | ) | $ | (149.6 | ) | $ | (154.6 | ) | $ | (144.0 | ) | ||||||||||||||
| Amounts recognized in accumulated other comprehensive income/(loss) consist of: |
||||||||||||||||||||||||||||||
| Actuarial net gain/(loss) |
$ | 2.6 | $ | (59.4 | ) | $ | (77.3 | ) | $ | 6.1 | $ | (13.8 | ) | $ | (8.8 | ) | ||||||||||||||
| Net prior service credit/(cost) |
— | (6.0 | ) | (6.8 | ) | — | 6.5 | 13.6 | ||||||||||||||||||||||
| Total |
$ | 2.6 | $ | (65.4 | ) | $ | (84.1 | ) | $ | 6.1 | $ | (7.3 | ) | $ | 4.8 | |||||||||||||||
85
Table of Contents
DEL MONTE CORPORATION AND SUBSIDIARIES
(previously reported as DEL MONTE FOODS COMPANY AND SUBSIDIARIES)
NOTES TO THE CONSOLIDATED FINANCIAL STATEMENTS—(Continued)
May 1, 2011
The components of net periodic pension cost for the qualified defined benefit pension plan and other benefit plans for the periods March 8, 2011 through May 1, 2011, May 3, 2010 through March 7, 2011, fiscal 2010 and fiscal 2009 are as follows (in millions):
| Successor | Predecessor | Successor | Predecessor | |||||||||||||||||||||||||||||||||||
| Pension Benefits | Other Benefits | |||||||||||||||||||||||||||||||||||||
| March 8, 2011 through May 1, 2011 |
May 3, 2010 through March 7, 2011 |
Fiscal 2010 |
Fiscal 2009 |
March 8, 2011 through May 1, 2011 |
May 3, 2010 through March 7, 2011 |
Fiscal 2010 |
Fiscal 2009 |
|||||||||||||||||||||||||||||||
| Components of net periodic benefit cost |
||||||||||||||||||||||||||||||||||||||
| Service cost for benefits earned during the period |
$ | 1.9 | $ | 11.9 | $ | 10.9 | $ | 12.2 | $ | 0.3 | $ | 1.3 | $ | 1.6 | $ | 1.8 | ||||||||||||||||||||||
| Interest cost on projected benefit obligation |
3.5 | 19.6 | 26.7 | 25.1 | 1.3 | 7.2 | 8.5 | 8.3 | ||||||||||||||||||||||||||||||
| Expected return on plan assets |
(4.8 | ) | (25.7 | ) | (20.5 | ) | (26.7 | ) | — | — | — | — | ||||||||||||||||||||||||||
| Amortization of prior service cost/(credit) |
— | 3.3 | 0.9 | 1.0 | — | (7.1 | ) | (8.4 | ) | (8.3 | ) | |||||||||||||||||||||||||||
| Amortization of loss/(gain) |
— | 0.8 | 1.9 | (0.2 | ) | — | — | (0.2 | ) | — | ||||||||||||||||||||||||||||
| Curtailment loss |
— | — | — | 0.2 | — | — | — | — | ||||||||||||||||||||||||||||||
| Net periodic benefit cost |
$ | 0.6 | $ | 9.9 | $ | 19.9 | $ | 11.6 | $ | 1.6 | $ | 1.4 | $ | 1.5 | $ | 1.8 | ||||||||||||||||||||||
Since the defined benefits plan and other benefits liabilities are measured on a discounted basis, the discount rate is a significant assumption. The discount rate was determined based on an analysis of interest rates for high-quality, long-term corporate debt at each measurement date. In order to appropriately match the bond maturities with expected future cash payments, the Company utilizes differing bond portfolios to estimate the discount rates for the defined benefits plan and for the other benefits. The discount rate used to determine the defined benefits plan and other benefits projected benefit obligation as of the balance sheet date is the rate in effect at the measurement date. The same rate is also used to determine the defined benefits plan and other benefits expense for the following fiscal year. The long-term rate of return for the defined benefits plan’s assets is based on the Company’s historical experience, the defined benefits plan’s investment guidelines and the Company’s expectations for long-term rates of return. The defined benefits plan’s investment guidelines are established based upon an evaluation of market conditions, tolerance for risk and cash requirements for benefit payments.
Weighted-average assumptions used in computing the benefit obligations and net periodic benefit costs for the qualified defined benefit pension plan and other benefit plans are as follows:
| Successor | Predecessor | Successor | Predecessor | |||||||||||||||||
| Pension Benefits | Other Benefits | |||||||||||||||||||
| May 1, 2011 |
May 2, 2010 |
May 1, 2011 |
May 2, 2010 |
|||||||||||||||||
| Assumptions used to determine projected benefit obligation |
||||||||||||||||||||
| Discount rate used in determining projected benefit obligation |
5.50 | % | 5.50 | % | 5.75 | % | 6.00 | % | ||||||||||||
| Rate of increase in compensation levels |
4.69 | % | 4.68 | % | ||||||||||||||||
86
Table of Contents
DEL MONTE CORPORATION AND SUBSIDIARIES
(previously reported as DEL MONTE FOODS COMPANY AND SUBSIDIARIES)
NOTES TO THE CONSOLIDATED FINANCIAL STATEMENTS—(Continued)
May 1, 2011
| Successor | Predecessor | Successor | Predecessor | |||||||||||||||||||||||||||||||||||
| Pension Benefits | Other Benefits | |||||||||||||||||||||||||||||||||||||
| March 8, 2011 through May 1, 2011 |
May 3, 2010 through March 7, 2011 |
Fiscal 2010 |
Fiscal 2009 |
March 8, 2011 through May 1, 2011 |
May 3, 2010 through March 7, 2011 |
Fiscal 2010 |
Fiscal 2009 |
|||||||||||||||||||||||||||||||
| Assumptions used to determine periodic benefit cost |
||||||||||||||||||||||||||||||||||||||
| Discount rate used in determining periodic benefit cost |
5.50 | % | 5.50 | % | 7.90 | % | 6.75 | % | 5.75 | % | 6.00 | % | 7.55 | % | 6.90 | % | ||||||||||||||||||||||
| Rate of increase in compensation levels |
4.69 | % | 4.69 | % | 4.68 | % | 4.26 | % | ||||||||||||||||||||||||||||||
| Long-term rate of return on assets |
7.50 | % | 7.50 | % | 7.60 | % | 8.00 | % | ||||||||||||||||||||||||||||||
No amounts will be amortized from AOCI into net periodic benefit cost over the next fiscal year for both the qualified defined benefit pension plan and other benefit plans.
The Company made contributions to its defined benefit pension plan of $40 million for the period May 3, 2010 through March 7, 2011. No contributions to the Company’s defined benefit pension plan were made for the period March 8, 2011 through May 1, 2011. The Company currently meets and plans to continue to meet the minimum funding levels required under the Pension Protection Act of 2006 (the “Act”). The Act imposes certain consequences on the Company’s defined benefit plan if it does not meet the minimum funding levels. The Company has made contributions in excess of its required minimum amounts for the period May 3, 2010 through March 7, 2011 and during fiscal 2010. Although the Company’s qualified pension plan is overfunded as of May 1, 2011, due to uncertainties of future funding levels as well as plan financial returns, the Company cannot predict whether it will continue to be fully funded. The Company currently expects to make contributions of approximately $15 million in fiscal 2012.
The projected future benefit payments are as follows:
| Pension Benefits |
Other Benefits |
|||||||
| (in millions) | ||||||||
| 2012 |
$ | 44.4 | $ | 6.9 | ||||
| 2013 |
42.6 | 7.4 | ||||||
| 2014 |
42.0 | 8.0 | ||||||
| 2015 |
41.6 | 8.5 | ||||||
| 2016 |
41.0 | 9.0 | ||||||
| Years 2017-2021 |
198.3 | 50.8 | ||||||
The weighted-average asset allocation of the pension plan assets as of the measurement date for the twelve months ended May 1, 2011 and fiscal 2010 and weighted-average target allocation are as follows:
| Successor | Predecessor | |||||||||||||
| May 1, 2011 |
May 2, 2010 |
Target Allocation Range |
||||||||||||
| Equity securities |
41 | % | 42 | % | 31-51 | % | ||||||||
| Debt securities |
54 | % | 49 | % |
|
47-64 |
% | |||||||
| Other |
5 | % | 9 | % | 2-9 | % | ||||||||
| Total |
100 | % | 100 | % | ||||||||||
Plan assets: The Company has adopted the fair value provisions (as described in Note 9) for the plan assets of its defined benefit pension plan. As required by the standard, the Company categorized plan assets within a three level fair value hierarchy.
87
Table of Contents
DEL MONTE CORPORATION AND SUBSIDIARIES
(previously reported as DEL MONTE FOODS COMPANY AND SUBSIDIARIES)
NOTES TO THE CONSOLIDATED FINANCIAL STATEMENTS—(Continued)
May 1, 2011
The following is a description of the valuation methodologies used for assets measured at fair value at May 1, 2011:
Investments stated at fair value as determined by quoted market prices (Level 1) include:
Interest bearing cash: valued based on cost, which approximates fair value;
Mutual funds: valued at quoted market prices on the last business day of the fiscal year; and
Corporate stock: valued at the last reported sales price on the last business day of the fiscal year.
Investments stated at estimated fair value using significant observable inputs (Level 2) include:
Common collective trust funds: valued based on the net asset value of the fund and is redeemable daily;
Corporate debt securities: valued based on yields currently available on comparable securities of issuers with similar credit ratings;
U.S. government securities: securities traded on a national securities exchange are valued at the last reported sales price on the last business day of the fiscal year. Securities traded in the over-the-counter market and listed securities for which no sale was reported on the last business day of the fiscal year are valued at the average of the last reported bid and ask price; and
Limited partnership interests: valued based on the net asset value of the fund and is redeemable monthly.
Investments stated at estimated fair value using significant unobservable inputs (Level 3) include:
Limited partnership interests: valued at their estimated fair value based on audited financial statements of the partnerships.
The following table sets forth by level, within the fair value hierarchy, the plan’s assets at fair value as of May 1, 2011:
| Investments at Fair Value | ||||||||||||||||
| Level 1 | Level 2 | Level 3 | Total | |||||||||||||
| (in millions) | ||||||||||||||||
| Plan investments in Master Trust |
||||||||||||||||
| Interest bearing cash |
$ | 10.4 | $ | — | $ | — | $ | 10.4 | ||||||||
| Common collective trust funds: |
||||||||||||||||
| Fixed income |
— | 126.5 | — | 126.5 | ||||||||||||
| Equity index funds |
— | 88.1 | — | 88.1 | ||||||||||||
| Equity fund |
— | 30.9 | — | 30.9 | ||||||||||||
| Other funds |
— | 22.5 | — | 22.5 | ||||||||||||
| Mutual funds: |
||||||||||||||||
| Equity fund |
30.4 | — | — | 30.4 | ||||||||||||
| Corporate debt securities |
— | 43.1 | — | 43.1 | ||||||||||||
| Corporate stock |
19.1 | — | — | 19.1 | ||||||||||||
| Government securities |
— | 58.7 | — | 58.7 | ||||||||||||
| Limited partnership interests |
— | 10.2 | 4.9 | 15.1 | ||||||||||||
| Other |
— | 4.3 | — | 4.3 | ||||||||||||
| Total Investments |
$ | 59.9 | $ | 384.3 | $ | 4.9 | $ | 449.1 | ||||||||
88
Table of Contents
DEL MONTE CORPORATION AND SUBSIDIARIES
(previously reported as DEL MONTE FOODS COMPANY AND SUBSIDIARIES)
NOTES TO THE CONSOLIDATED FINANCIAL STATEMENTS—(Continued)
May 1, 2011
The following table sets forth by level, within the fair value hierarchy, the plan’s assets at fair value as of May 2, 2010:
| Investments at Fair Value | ||||||||||||||||
| Level 1 | Level 2 | Level 3 | Total | |||||||||||||
| (in millions) | ||||||||||||||||
| Plan investments in Master Trust |
||||||||||||||||
| Interest bearing cash |
$ | 61.7 | $ | — | $ | — | $ | 61.7 | ||||||||
| Common collective trust funds: |
||||||||||||||||
| Fixed income |
— | 129.1 | — | 129.1 | ||||||||||||
| Equity index funds |
— | 75.0 | — | 75.0 | ||||||||||||
| Equity fund |
— | 12.8 | — | 12.8 | ||||||||||||
| Other funds |
— | 11.1 | — | 11.1 | ||||||||||||
| Mutual funds: |
||||||||||||||||
| Equity fund |
14.3 | — | — | 14.3 | ||||||||||||
| Other funds |
0.1 | — | — | 0.1 | ||||||||||||
| Corporate debt securities |
— | 25.1 | — | 25.1 | ||||||||||||
| Corporate stock |
24.1 | — | — | 24.1 | ||||||||||||
| U.S. government securities |
— | 28.8 | — | 28.8 | ||||||||||||
| Limited partnership interests |
— | 9.1 | 6.8 | 15.9 | ||||||||||||
| Other |
— | 1.8 | — | 1.8 | ||||||||||||
| Total Investments |
$ | 100.2 | $ | 292.8 | $ | 6.8 | $ | 399.8 | ||||||||
The Company’s investment objectives are to ensure that the assets of its qualified defined benefit plan are invested to provide an optimal rate of investment return on the total investment portfolio, consistent with the assumption of a reasonable risk level, and to ensure that pension funds are available to meet the plan’s benefit obligations as they become due. The Company believes that a well-diversified investment portfolio, including both equity and fixed income components, will result in the highest attainable investment return with an acceptable level of overall risk. The Company’s investment policies and procedures are designed to ensure that the plan’s investments are in compliance with the Employment Retirement Income Security Act of 1974.
For measurement purposes, an 8.7%, 9% and 9% annual rate of increase in the per capita cost of covered health care benefits was assumed for the preferred provider organization plan and associated indemnity plans for the periods March 8, 2011 through May 1, 2011, May 3, 2010 through March 7, 2011 and fiscal 2010, respectively. The rate of increase is assumed to decline gradually to 4.5%. For health maintenance organization plans, a 9.5%, 10% and 10% annual rate of increase in the per capita cost of covered health care benefits was assumed for the periods March 8, 2011 through May 1, 2011, May 3, 2010 through March 7, 2011 and fiscal 2010, respectively. The rate of increase is assumed to decline gradually to 4.5%. A 5% annual rate of increase in the per capita cost of covered health care benefits was assumed for the dental and vision plans for the periods March 8, 2011 through May 1, 2011, May 3, 2010 through March 7, 2011 and fiscal 2010, respectively.
The health care cost trend rate assumption has a significant effect on the amounts reported. An increase in the assumed health care cost trend of 1% in each year would increase the postretirement benefit obligation as of May 1, 2011 by $19.2 million and the aggregate of the service and interest cost components of net periodic postretirement benefit cost for the twelve-month period then ended by $1.8 million. A decrease in the assumed health care cost trend of 1% in each year would decrease the postretirement benefit obligation as of May 1, 2011 by $15.8 million and the aggregate of the service and interest cost components of net periodic postretirement benefit cost for the twelve-month period then ended by $1.4 million.
Defined Contribution Plans. Del Monte participates in two defined contribution plans. Company contributions to these defined contribution plans are based on employee contributions and compensation. Company contributions under these plans totaled $1.0 million, $6.7 million, $7.6 million and $7.4 million for the periods March 8, 2011 through May 1, 2011, May 3, 2010 through March 7, 2011 fiscal 2010 and fiscal 2009, respectively.
Multi-employer Plans. Del Monte participates in several multi-employer pension plans, which provide defined benefits to certain union employees. The Company made contributions to multi-employer plans of $0.8 million, $7.3 million, $8.3 million and $7.9 million for the periods March 8, 2011 through May 1, 2011, May 3, 2010 through March 7, 2011, fiscal 2010 and fiscal 2009, respectively.
89
Table of Contents
DEL MONTE CORPORATION AND SUBSIDIARIES
(previously reported as DEL MONTE FOODS COMPANY AND SUBSIDIARIES)
NOTES TO THE CONSOLIDATED FINANCIAL STATEMENTS—(Continued)
May 1, 2011
Other Plans. The Company has various other nonqualified retirement plans and supplemental retirement plans for executives, designed to provide benefits in excess of those otherwise permitted under the Company’s qualified retirement plans. These plans are unfunded and comply with IRS rules for nonqualified plans.
Note 12. Other (Income) Expense
The components of other (income) expense are as follows (in millions):
| Successor | Predecessor | |||||||||||||||||
| March 8, 2011 through May 1, 2011 |
May 3, 2010 through March 7, 2011 |
Fiscal 2010 |
Fiscal 2009 |
|||||||||||||||
| (Gain) loss on hedging contracts |
$ | 12.5 | $ | 0.4 | $ | (3.7 | ) | $ | 18.9 | |||||||||
| Foreign currency transaction (gains) losses |
(2.2 | ) | (6.1 | ) | (0.3 | ) | 3.9 | |||||||||||
| Discontinuation of hedge accounting for interest rate swap |
— | — | 13.4 | — | ||||||||||||||
| Redemption premium over the fair value of senior subordinated notes tendered/redeemed |
15.8 | — | — | — | ||||||||||||||
| Other |
(0.4 | ) | 0.5 | 0.4 | 1.3 | |||||||||||||
| Other (income) expense |
$ | 25.7 | $ | (5.2 | ) | $ | 9.8 | $ | 24.1 | |||||||||
Note 13. Provision for Income Taxes
The provision for income taxes from continuing operations consists of the following (in millions):
| Successor | Predecessor | |||||||||||||||||
| March 8, 2011 through May 1, 2011 |
May 3, 2010 through March 7, 2011 |
Fiscal 2010 |
Fiscal 2009 |
|||||||||||||||
| Income (loss) from continuing operations before income taxes: |
||||||||||||||||||
| U.S. federal and U.S. possessions |
$ | (152.6 | ) | $ | 349.4 | $ | 373.3 | $ | 219.7 | |||||||||
| Foreign |
(1.3 | ) | 12.3 | 8.6 | 6.8 | |||||||||||||
| $ | (153.9 | ) | $ | 361.7 | $ | 381.9 | $ | 226.5 | ||||||||||
| Income tax provision (benefit): |
||||||||||||||||||
| Current: |
||||||||||||||||||
| U.S. federal and U.S. possessions |
$ | 0.1 | $ | 28.1 | $ | 70.8 | $ | 37.2 | ||||||||||
| State and foreign |
0.1 | 13.3 | 14.7 | 12.6 | ||||||||||||||
| Total current |
0.2 | 41.4 | 85.5 | 49.8 | ||||||||||||||
| Deferred: |
||||||||||||||||||
| U.S. federal and U.S. possessions |
$ | (44.4 | ) | $ | 95.8 | $ | 52.1 | $ | 33.4 | |||||||||
| State and foreign |
(4.8 | ) | 2.6 | 2.3 | (4.4 | ) | ||||||||||||
| Total deferred |
(49.2 | ) | 98.4 | 54.4 | 29.0 | |||||||||||||
| Provision (benefit) from income taxes |
$ | (49.0 | ) | $ | 139.8 | $ | 139.9 | $ | 78.8 | |||||||||
The above amounts do not include a tax benefit of $35.3 million and $1.7 million for the period from May 3, 2010 through March 7, 2011 and fiscal 2010, respectively, and a tax expense of $0.1 million in fiscal 2009 from stock-based compensation, which for accounting purposes are recorded in additional paid-in capital.
90
Table of Contents
DEL MONTE CORPORATION AND SUBSIDIARIES
(previously reported as DEL MONTE FOODS COMPANY AND SUBSIDIARIES)
NOTES TO THE CONSOLIDATED FINANCIAL STATEMENTS—(Continued)
May 1, 2011
Significant components of the Company’s deferred tax assets and liabilities are as follows (in millions):
| Successor | Predecessor | |||||||||
| May 1, 2011 |
May 2, 2010 |
|||||||||
| Deferred tax assets: |
||||||||||
| Post employment benefits |
$ | 57.3 | $ | 56.4 | ||||||
| Pension liability |
17.7 | 31.8 | ||||||||
| Workers’ compensation |
13.6 | 13.9 | ||||||||
| Net operating loss and tax credit carry forwards |
55.8 | 2.6 | ||||||||
| Stock-based compensation |
13.6 | 23.4 | ||||||||
| Other |
37.4 | 36.7 | ||||||||
| Gross deferred tax assets |
195.4 | 164.8 | ||||||||
| Valuation allowance |
— | (1.5 | ) | |||||||
| Net deferred tax assets |
195.4 | 163.3 | ||||||||
| Deferred tax liabilities: |
||||||||||
| Depreciation and amortization |
129.7 | 95.5 | ||||||||
| Intangible assets |
956.4 | 466.4 | ||||||||
| Inventory |
52.0 | 34.7 | ||||||||
| Other |
10.4 | 5.7 | ||||||||
| Gross deferred tax liabilities |
1,148.5 | 602.3 | ||||||||
| Net deferred tax liability |
$ | (953.1 | ) | $ | (439.0 | ) | ||||
At May 1, 2011, the Company has not provided for any valuation allowance on its deferred tax assets. The net change in valuation allowance for the twelve months ended May 1, 2011 was a decrease of $1.5 million from the release of valuation allowance on Mexico Asset Tax credits. In evaluating the Company’s ability to realize its deferred tax assets, the Company considers all available positive and negative evidence and recognizes a benefit for those deferred tax assets that it believes will more likely than not be realized in the future.
The differences between the expected provision for income taxes and the actual provision for income taxes computed at the statutory U.S. federal income tax rate for continuing operations is explained as follows (in millions):
| Successor | Predecessor | |||||||||||||||||
| March 8, 2011 through May 1, 2011 |
May 3, 2010 through March 7, 2011 |
Fiscal 2010 |
Fiscal 2009 |
|||||||||||||||
| Expected income taxes computed at the statutory U.S. federal income tax rate |
$ | (53.8 | ) | $ | 126.6 | $ | 133.7 | $ | 79.3 | |||||||||
| State taxes, net of federal benefit |
(4.6 | ) | 9.6 | 15.8 | 9.0 | |||||||||||||
| Benefit of state tax law change |
— | — | (3.9 | ) | (5.0 | ) | ||||||||||||
| Benefit of law change on U.S. possessions’ subsidiaries |
— | — | — | (4.6 | ) | |||||||||||||
| Valuation allowance reversal |
— | (1.5 | ) | (1.0 | ) | (0.2 | ) | |||||||||||
| Non-deductible transaction costs |
9.2 | 6.3 | — | — | ||||||||||||||
| Other |
0.2 | (1.2 | ) | (4.7 | ) | 0.3 | ||||||||||||
| Actual provision for income taxes |
$ | (49.0 | ) | $ | 139.8 | $ | 139.9 | $ | 78.8 | |||||||||
As of May 1, 2011, the Company had federal net operating loss carryforwards of $133.7 million and state net operating loss carryforwards of $81.3 million. The federal net operating loss carryforwards will expire between 2029 and 2030 and the state net operating loss carryforwards will expire between 2014 and 2030. The Company also had $1.2 million of federal tax credits, $5.1 million of state tax credits, and $2.3 million of Mexican Asset Tax credits. The federal tax credits will expire between 2029 and 2030,
91
Table of Contents
DEL MONTE CORPORATION AND SUBSIDIARIES
(previously reported as DEL MONTE FOODS COMPANY AND SUBSIDIARIES)
NOTES TO THE CONSOLIDATED FINANCIAL STATEMENTS—(Continued)
May 1, 2011
$1.0 million of state tax credits will expire in 2019 and the remaining has no expiration date, and the Mexican Asset Tax credits will expire between 2011 and 2017. The net operating loss and tax credit carryforwards may be subject to limitations under Section 382 of the Internal Revenue Code.
Cumulative undistributed earnings of foreign subsidiaries, for which no U.S. income or foreign withholding taxes have been recorded, were approximately $34.9 million at May 1, 2011. It is not practical to assess the tax amount on the cumulative undistributed earnings because the computation would depend on a number of factors that are not known until a decision to repatriate the earnings is made. The Company intends to reinvest such earnings indefinitely.
The Company had gross unrecognized tax benefits of $10.6 million and $18.0 million as of May 1, 2011 and May 2, 2010 respectively.
Reconciliations of the beginning and ending balance of total unrecognized tax benefits for the twelve months ended May 1, 2011 and fiscal 2010 are as follows:
| May 1, 2011 |
May 2, 2010 |
|||||||
| (in millions) | ||||||||
| Balance at beginning of year |
$ | 18.0 | $ | 15.6 | ||||
| Additions based on tax positions related to the current year |
1.3 | 1.6 | ||||||
| Additions based on tax positions of prior years |
— | 1.1 | ||||||
| Reductions for tax positions of prior years |
— | — | ||||||
| Settlements |
(3.7 | ) | — | |||||
| Lapse of statute of limitations issues |
(5.0 | ) | (0.3 | ) | ||||
| Balance at end of year |
$ | 10.6 | $ | 18.0 | ||||
If recognized, $6.6 million of the Company’s unrecognized tax benefits would impact the effective tax rate on income from continuing operations. The Company’s continuing practice is to recognize interest on uncertain tax positions in income tax expense and penalties in selling, general and administrative expenses. For the periods March 8, 2011 through May 1, 2011, May 3, 2010 through March 7, 2011, fiscal 2010 and fiscal 2009, the amount of interest recorded in the consolidated statement of income (loss) was $0.1 million, $0.3 million, $0.5 million and $0.5 million, respectively. As of May 1, 2011 and May 2, 2010, the amount of accrued interest included in the non-current income tax liability account was $0.8 million and $1.8 million, respectively. The Company has no amounts accrued for penalties.
The Company files income tax returns in the U.S. and in many foreign and state jurisdictions. A number of years may elapse before an uncertain tax position, for which the Company has unrecognized tax benefits, is audited and finally resolved. Favorable resolution would be recognized in the period of effective settlement. The Company believes it is reasonably possible it will close a tax year to audit during the next 12 months. Should this occur, the liability for unrecognized tax benefits would decrease by approximately $2.7 million.
The Company has open tax years from primarily 2006 to 2010 with various significant taxing jurisdictions including the U.S., American Samoa and Canada. These open years contain matters that could be subject to differing interpretations of applicable tax laws and regulations as they relate to the amount, timing or inclusion of revenue and expenses as determined by the various taxing jurisdictions.
Supplemental Disclosure of Cash Flow Information. The Company made income tax payments of $38.0 million, $92.3 million and $70.6 million for the period May 3, 2010 through March 7, 2011, fiscal 2010 and fiscal 2009, respectively. The Company received net income tax refunds of $2.5 million for the period March 8, 2011 through May 1, 2011.
Note 14. Commitments and Contingencies
As part of its ongoing operations, the Company enters into arrangements that obligate it to make future payments to various parties. Some of these contractual and other cash obligations are not reflected on the balance sheet due to their nature. Such obligations include operating leases, grower commitments and purchase commitments.
92
Table of Contents
DEL MONTE CORPORATION AND SUBSIDIARIES
(previously reported as DEL MONTE FOODS COMPANY AND SUBSIDIARIES)
NOTES TO THE CONSOLIDATED FINANCIAL STATEMENTS—(Continued)
May 1, 2011
Lease Commitments. The Company leases certain property, equipment and office and plant facilities. At May 1, 2011, the aggregate minimum rental payments required under non-cancelable operating leases were as follows (in millions):
| 2012 |
$ | 50.2 | ||
| 2013 |
40.5 | |||
| 2014 |
33.0 | |||
| 2015 |
30.6 | |||
| 2016 |
22.3 | |||
| Thereafter |
58.8 |
Rent expense related to operating leases was comprised of the following (in millions):
| Successor | Predecessor | |||||||||||||||||
| March 8, 2011 through May 1, 2011 |
May 3, 2010 through March 7, 2011 |
Fiscal 2010 |
Fiscal 2009 |
|||||||||||||||
| Minimum rentals |
$ | 7.2 | $ | 49.4 | $ | 53.3 | $ | 49.9 | ||||||||||
| Contingent rentals |
2.4 | 17.4 | 20.2 | 20.2 | ||||||||||||||
| $ | 9.6 | $ | 66.8 | $ | 73.5 | $ | 70.1 | |||||||||||
Supply Agreements. The Company has long-term supply agreements with two suppliers covering the purchase of metal cans and ends. The agreement with Impress was amended and restated January 23, 2008, and as described in Note 4, this agreement was bifurcated in connection with the sale of the StarKist Seafood Business in October 2008. Currently, this agreement grants Impress the exclusive right, subject to certain specified exceptions, to supply metal cans and ends for pet products. The agreement included certain minimum volume purchase requirements and guaranteed a certain minimum financial return to Impress until August 13, 2010. Total expenditures for cans and ends for pet food products under this agreement, were $10.0 million, $68.1 million, $87.1 million and $96.1 million for the periods March 8, 2011 through May 1, 2011, May 3, 2010 through March 7, 2011, fiscal 2010 and fiscal 2009, respectively. As of May 1, 2011, the Company has committed to make purchases of approximately $14.0 million in fiscal 2012. The Impress agreement expires December 31, 2015.
The Company is a party to a supply agreement, effective as of January 1, 2010, with Silgan Containers LLC (“Silgan”) which relates to Silgan’s provision of metal cans and ends used for fruit, vegetable, tomato and broth products. Under the agreement and subject to certain specified exceptions, the Company must purchase all of its United States metal food and beverage container requirements for fruit, vegetable, tomato and broth products from Silgan. Total purchases made under this agreement, which expires December 31, 2021, were $14.3 million, $199.7 million, $230.9 million and $249.9 million for the periods March 8, 2011 through May 1, 2011, May 3, 2010 through March 7, 2011, fiscal 2010 and fiscal 2009, respectively. As of May 1, 2011, the Company has committed to make purchases of approximately $41.1 million in fiscal 2012.
Pricing under the Impress agreement and Silgan agreement is adjusted up to twice a year to reflect changes in metal costs and annually to reflect changes in the costs of manufacturing.
Grower Commitments. The Company has entered into non-cancelable agreements with growers, with terms ranging from one year to ten years, to purchase certain quantities of raw products, including fruit, vegetables and tomatoes. Total purchases under these agreements were $0.4 million, $153.3 million, $197.8 million and $178.3 million for the periods March 8, 2011 through May 1, 2011, May 3, 2010 through March 7, 2011, fiscal 2010 and fiscal 2009, respectively.
93
Table of Contents
DEL MONTE CORPORATION AND SUBSIDIARIES
(previously reported as DEL MONTE FOODS COMPANY AND SUBSIDIARIES)
NOTES TO THE CONSOLIDATED FINANCIAL STATEMENTS—(Continued)
May 1, 2011
At May 1, 2011, aggregate purchase commitments under non-cancelable agreements with growers (priced at May 1, 2011 estimated costs) are estimated as follows (in millions):
| 2012 |
$ | 138.8 | ||
| 2013 |
44.8 | |||
| 2014 |
31.9 | |||
| 2015 |
30.0 | |||
| 2016 |
29.9 | |||
| Thereafter |
73.8 |
Co-pack and Service Commitments. The Company has entered into non-cancelable agreements with co-packers and other service providers with commitments ranging from one year to five years. Total purchases under these agreements were $50.2 million, $281.1 million, $348.7 million and $323.8 million, for the periods March 8, 2011 through May 1, 2011, May 3, 2010 through March 7, 2011, fiscal 2010 and fiscal 2009, respectively.
The Company also has a co-pack and supply agreement to source the majority of its pineapple requirements. The agreement has an indefinite term subject to termination on three years’ notice. Total purchases under this agreement were $4.8 million, $43.2 million, $48.7 million and $46.9 million for the periods March 8, 2011 through May 1, 2011, May 3, 2010 through March 7, 2011, fiscal 2010 and fiscal 2009, respectively.
At May 1, 2011, aggregate purchase commitments under non-cancelable agreements with co-packers and other service providers (including pineapple requirements) are estimated as follows (in millions):
| 2012 |
$ | 251.2 | ||
| 2013 |
148.4 | |||
| 2014 |
57.8 | |||
| 2015 |
38.1 | |||
| 2016 |
0.3 |
Ingredients and other. The Company has purchase commitments with vendors for various ingredients and other items. Total commitments under these agreements were approximately $180.7 million as of May 1, 2011.
Union Contracts. As of May 1, 2011, the Company has 16 collective bargaining agreements with 15 union locals covering approximately 72% of its hourly full-time and seasonal employees. Of these employees, approximately 21% are covered under collective bargaining agreements scheduled to expire in fiscal 2012 and approximately 50% are covered under collective bargaining agreements scheduled to expire in fiscal 2013. These agreements are subject to negotiation and renewal.
Legal Proceedings
Shareholder Litigation Involving the Company
On November 25, 2010, Del Monte Foods Company announced that it had signed a definitive agreement (the “Merger Agreement”) under which an investor group led by funds affiliated with Kohlberg Kravis Roberts & Co. L.P. (“KKR”), Vestar Capital Partners (“Vestar”) and Centerview Capital L.P. (“Centerview”) agreed to acquire all of the outstanding stock of Del Monte Foods Company for $19.00 per share in cash (the “Transaction”), subject to the conditions set forth in the Merger Agreement. Following the announcement of the Transaction, fifteen putative class action lawsuits (the “Shareholder Cases”) relating to the Transaction were filed against Del Monte Foods Company, certain of its now-former officers and directors, and other parties including (in certain cases) Blue Merger Sub. Inc. (“Blue Sub”), the acquisition entity which, upon consummation of the Transaction, merged with and into Del Monte Foods Company, with Del Monte Foods Company continuing as the surviving corporation (the “Merger”).
94
Table of Contents
DEL MONTE CORPORATION AND SUBSIDIARIES
(previously reported as DEL MONTE FOODS COMPANY AND SUBSIDIARIES)
NOTES TO THE CONSOLIDATED FINANCIAL STATEMENTS—(Continued)
May 1, 2011
Two previously disclosed cases, which were among the original fifteen Shareholder Cases arising from the Transaction were voluntarily dismissed on June 6, 2011:
| • | Heintz v. Wolford, et al.. The Heintz case was filed by Sarah P. Heintz on behalf of herself and a putative class of shareholders against the Directors, Del Monte Foods Company, Parent and Blue Sub on December 20, 2010 in the United States District Court, Northern District of California; and |
| • | Faulkner v. Wolford, et al.. The Faulkner case was filed by Dallas Faulkner on behalf of himself and a putative class of shareholders against the Directors, Del Monte Foods Company, Parent and Blue Sub on January 21, 2011 in the United States District Court, Northern District of California. |
In addition, plaintiffs in two previously disclosed cases, which were also among the original fifteen Shareholder Cases arising from the Transaction filed requests for dismissal on March 4, 2011 and June 13, 2011, respectively:
| • | Sinor v. Wolford, et al.. The Sinor case was filed by James Sinor on behalf of himself and a putative class of shareholders against Del Monte Foods Company, the Directors, KKR, Vestar, Centerview (named as Centerview partners; together with KKR and Vestar, the “Sponsor Defendants”), Parent and Blue Sub on December 1, 2010 in Superior Court in San Francisco, California; and |
| • | Kaiman v. Del Monte Foods Co., et al.. The Kaiman case was filed by Libby Kaiman on behalf of herself and a putative class of shareholders against Del Monte Foods Company, the Directors, the Sponsor Defendants, Parent and Blue Sub on December 1, 2010 in Superior Court in San Francisco, California. |
As a result of the voluntary dismissals and orders consolidating other shareholder cases, only two of the original fifteen Shareholder Cases arising from the Transaction remain pending one of which has been stayed:
| • | In re Del Monte Foods Company Shareholders Litigation (the “Delaware Shareholder Case”). The Delaware Shareholder Case was filed in the Delaware Court of Chancery and consolidated with other related cases filed in the same court. The latest complaint filed in the case asserts claims on behalf of lead Plaintiff NECA-IBEW Pension Fund and a putative class of shareholders against each of the now-former directors of Del Monte Foods Company (together, the “Directors”), the Company’s former Chief Executive Officer in his capacity as such, Barclays Capital, Inc. (“Barclays”), the Sponsor Defendants, Blue Acquisition Group, Inc. (“Parent”) and Blue Sub; and |
| • | Franklin v. Del Monte Foods Co., et al.. The Franklin case was filed by Elisa J. Franklin on behalf of herself and a putative class of shareholders against the Directors, Del Monte Foods Company and the Sponsor Defendants on December 10, 2010 in Superior Court in San Francisco, California. On February 28, 2011, the Court in the Franklin case granted the motion of Del Monte Foods Company and the Directors to stay the proceeding pending resolution of the Delaware Shareholder Case, and the case remains stayed. |
The plaintiff in the Delaware Shareholder Case, which is the only active and pending Shareholder Case, alleges that the Directors breached their fiduciary duties to the stockholders by agreeing to sell Del Monte Foods Company at a price that was unfair and inadequate and by agreeing to certain preclusive deal protection devices in the Merger Agreement. The plaintiff further alleges that the Sponsor Defendants, Parent, Blue Sub and Barclays aided and abetted the Directors’ alleged breaches of fiduciary duties. In addition, the plaintiff asserts a claim for breach of fiduciary duty against the former Chief Executive Officer of Del Monte Foods Company in his capacity as an officer. The plaintiff also alleges that the Sponsor Defendants violated certain Confidentiality Agreements with Del Monte Foods Company, and that Barclays induced the Sponsor Defendants to violate the Confidentiality Agreements, committing tortious interference with contract. The plaintiff in the Franklin case asserts similar claims against the Directors, alleging that they breached their fiduciary duties of care and loyalty by, among other acts, agreeing to sell Del Monte Foods Company at an inadequate price, running an ineffective sale process that relied on conflicted financial advisors, agreeing to preclusive deal protection measures, and pursuing the Transaction for their own financial ends. The plaintiff in the Franklin case also asserts claims against the Sponsor Defendants and Del Monte Foods Company for aiding and abetting these alleged breaches of fiduciary duty.
Each of the complaints seeks injunctive relief, rescission of the Merger Agreement, compensatory damages, and attorneys’ fees. The Company denies the plaintiffs’ allegations and plans, as the successor to Del Monte Foods Company and Blue Sub, to vigorously defend against these claims.
95
Table of Contents
DEL MONTE CORPORATION AND SUBSIDIARIES
(previously reported as DEL MONTE FOODS COMPANY AND SUBSIDIARIES)
NOTES TO THE CONSOLIDATED FINANCIAL STATEMENTS—(Continued)
May 1, 2011
The Company has a continuing obligation to defend and indemnify the Directors and the Company’s former Chief Executive Officer for their legal fees and potential liability in the Shareholder Cases, subject to certain limitations under Delaware law or contract. Similarly, the Company may have contractual obligations to indemnify other parties to the Shareholder Cases and other matters arising out of the Transaction, subject to certain limitations under applicable law or contract. The Company has $50 million of director and officer insurance coverage for itself and the former directors and officers of Del Monte Foods Company. The insurers have reserved their rights with respect to coverage and have not agreed at this point that coverage is available for losses the Company may sustain as a result of the Shareholder Cases. The Company has accrued in the accompanying financial statements an amount equal to the current estimate of the Company’s exposure in this matter. Given the inherent uncertainty associated with legal matters, the actual costs of resolving the Shareholder Cases may be substantially higher or lower than the established accrual. The amount that the Company may ultimately be responsible for in connection with the Shareholder Cases may vary based on a number of factors, including, final settlement or award amounts, the allocation of such amounts among the various parties to the litigation, insurance coverage and resolution with its carriers, indemnification obligations, the discovery of new or additional facts that impact the strength or weakness of the parties’ claims and defenses and other factors.
On February 14, 2011, following expedited discovery and a preliminary injunction hearing in the Delaware Shareholder Case, the Court of Chancery entered an order preliminarily enjoining the shareholder vote on the Merger, which was scheduled to occur at a special meeting on February 15, 2011, for a period of 20 days. In addition, the Court of Chancery enjoined the parties, pending the vote on the Merger, from enforcing various provisions in the Merger Agreement, including the no-solicitation and match right provisions in Sections 6.5(b), 6.5(c), and 6.5(h), and the termination fee provisions relating to topping bids and changes in the board of directors’ recommendations on the Merger in Section 8.5(b). The Court’s order was conditioned upon the lead plaintiff’s posting a bond in the amount of $1.2 million, which was posted on February 15, 2011.
The scheduled special meeting was convened on February 15, 2011. At such meeting, a quorum was determined to be present and, in accordance with the Court’s ruling, the meeting was adjourned until March 7, 2011, without a vote on the Merger proposal. The special meeting was reconvened on March 7, 2011. At such meeting, a quorum was determined to be present and the Merger was approved. The Merger closed on March 8, 2011.
Following the closing of the Merger, on March 25, 2011, the plaintiff in the Delaware Shareholder Case filed an application for an interim attorneys’ fee award in the amount of $12 million. On June 27, 2011, the Court of Chancery awarded the plaintiff’s attorneys an interim fee award in the amount of $2.75 million for the supplemental disclosures that Del Monte Foods Company made in connection with the Merger. The Court of Chancery deferred decision regarding the balance of the fee application, which seeks fees in connection with the preliminary injunction and suspension of deal protections.
SEC Investigation
On February 18, 2011, the SEC directed the Company to preserve documents and records relating to recent potential or actual business combinations and preparation of Del Monte Foods Company’s proxy statement relating to the Transaction. On March 4, 2011 the SEC requested that the Company voluntarily produce certain documents and records, which the Company has done on an ongoing basis. On May 23, 2011, the Company received a subpoena from the SEC requesting the same documents. The Company intends to continue to cooperate with the SEC in its investigation. The Company cannot at this time reasonably estimate a range of exposure, if any, of the potential liability.
96
Table of Contents
DEL MONTE CORPORATION AND SUBSIDIARIES
(previously reported as DEL MONTE FOODS COMPANY AND SUBSIDIARIES)
NOTES TO THE CONSOLIDATED FINANCIAL STATEMENTS—(Continued)
May 1, 2011
Commercial Litigation Involving the Company
On December 17, 2010, a putative class action complaint was filed against us by Lydia Littlefield, on behalf of herself and all others similarly situated, in the U.S. District Court for the District of Massachusetts, alleging intentional misrepresentation, fraud, negligent misrepresentation, breach of express warranty, breach of the implied warranty of merchantability and unjust enrichment. Specifically, the complaint alleges that the Company engaged in false and misleading representation of certain of our canned fruit products in representing that these products are safe and healthy, when they allegedly contain substances that are not safe and healthy. The plaintiffs seek certification of the class, injunctive relief, damages in an unspecified amount and attorneys’ fees. The Company intends to deny these allegations and vigorously defend itself. On April 19, 2011, the U.S. Judicial Panel on Multidistrict Litigation issued an order consolidating Littlefield with several similar consumer class actions filed in other jurisdictions (in which the Company is not a defendant) in U.S. District Court for the District of Massachusetts. The Company cannot at this time reasonably estimate a range of exposure, if any, of the potential liability.
On September 30, 2010, a putative class action complaint was served against the Company, to be filed in Hennepin County, Minnesota, alleging wage and hour violations of the Fair Labor Standards Act (“FLSA”). The complaint was served on behalf of five named plaintiffs and all others similarly situated at a manufacturing facility in Minnesota. Specifically, the complaint alleges that the Company violated the FLSA and state wage and hour laws by failing to compensate plaintiffs and other similarly situated workers unpaid overtime. The plaintiffs are seeking compensatory and statutory damages. Additionally, the plaintiffs are seeking class certification. On November 5, 2010, in connection with the Company’s removal of this case to the U.S. District Court for the District of Minnesota, the complaint was filed along with the Company’s answer. The Company also filed a motion for partial dismissal on November 5, 2010. On November 30, 2010, the parties jointly stipulated that the causes of action in plaintiff’s complaint for unjust enrichment and quantum meruit would be dismissed without prejudice and further stipulated that the cause of action under the Minnesota minimum wage law would be dismissed without prejudice. The Company denies plaintiffs’ allegations and plans to vigorously defend itself. The Company cannot at this time reasonably estimate a range of exposure, if any, of the potential liability.
On October 13, 2009, Kara Moline and Debra Lowe filed a class action complaint against the Company in San Francisco Superior Court, alleging violations of California’s False Advertising Act, Unfair Competition Law, and Consumer Legal Remedies Act. Specifically, the plaintiffs alleged that the Company engaged in false and misleading advertising in the labeling of Nature’s Recipe Farm Stand Selects dog food. The plaintiffs sought injunctive relief, disgorgement of profits in an undisclosed amount, and attorneys’ fees. Additionally, the plaintiffs sought class certification. The parties reached a settlement agreement that was approved by the Court on November 9, 2010. Under the settlement, the Company paid $0.2 million and agreed to modify the labels of the relevant products in the future.
On October 14, 2008, Fresh Del Monte Produce Inc. (“Fresh Del Monte”) filed a complaint against the Company in U.S. District Court for the Southern District of New York. Fresh Del Monte amended its complaint on November 5, 2008. Under a trademark license agreement with the Company, Fresh Del Monte holds the rights to use the Del Monte name and trademark with respect to fresh fruit, vegetables and produce throughout the world (including the United States). Fresh Del Monte alleges that the Company breached the trademark license agreement through the marketing and sale of certain of its products sold in the refrigerated produce section of customers’ stores, including Del Monte Fruit Naturals products and the more recently introduced Del Monte Refrigerated Grapefruit Bowls. Additionally, Fresh Del Monte alleges that it has the exclusive right under the trademark license agreement to sell Del Monte branded pineapple, melon, berry, papaya and banana products in the refrigerated produce section. Fresh Del Monte also alleges that the Company’s advertising for certain of the alleged infringing products was false and misleading. Fresh Del Monte is seeking damages of $10.0 million, treble damages with respect to its false advertising claim, and injunctive relief. On October 14, 2008, Fresh Del Monte filed a motion for a preliminary injunction, asking the Court to enjoin the Company from making certain claims about its refrigerated products. On October 23, 2008, the Court denied that motion. The Company denies Fresh Del Monte’s allegations and is vigorously defending itself. Additionally, on November 21, 2008, the Company filed counter-claims against Fresh Del Monte, alleging that Fresh Del Monte has breached the trademark license agreement. Specifically, the Company alleges, among other things, that Fresh Del Monte’s “medley” products (vegetables with a dipping sauce or fruit with a caramel sauce) violate the trademark license agreement. On November 10, 2010, Fresh Del Monte filed a motion for partial summary judgment. On December 8, 2010, the Company filed an opposition to that motion. The Court has not scheduled a hearing date. The Company cannot at this time reasonably estimate a range of exposure, if any, of the potential liability.
97
Table of Contents
DEL MONTE CORPORATION AND SUBSIDIARIES
(previously reported as DEL MONTE FOODS COMPANY AND SUBSIDIARIES)
NOTES TO THE CONSOLIDATED FINANCIAL STATEMENTS—(Continued)
May 1, 2011
Pet Food Products-Related Litigation
Beginning with the pet food recall announced by Menu Foods, Inc. in March 2007, many major pet food manufacturers, including the Company, announced recalls of select products. The Company believes there have been over 90 class actions and purported class actions relating to these pet food recalls. The Company was named as a defendant in seven class actions or purported class actions related to its pet food and pet snack recall, which it initiated March 31, 2007.
The Company was a defendant in the following cases:
| • | Carver v. Del Monte filed on April 4, 2007 in the U.S. District Court for the Eastern District of California; |
| • | Ford v. Del Monte filed on April 7, 2007 in the U.S. District Court for the Southern District of California; |
| • | Hart v. Del Monte filed on April 10, 2007 in state court in Los Angeles, California; |
| • | Picus v. Del Monte filed on April 30, 2007 in state court in Las Vegas, Nevada; |
| • | Blaszkowski v. Del Monte filed on May 9, 2007 in the U.S. District Court for the Southern District of Florida; |
| • | Schwinger v. Del Monte filed on May 15, 2007 in the U.S. District Court for the Western District of Missouri; and |
| • | Tompkins v. Del Monte filed on July 13, 2007 in the U.S. District Court for the District of Colorado. |
The named plaintiffs in these seven cases alleged that their pets suffered injury and/or death as a result of ingesting the Company’s and other defendants’ allegedly contaminated pet food and pet snack products. The Picus and Blaszkowski cases also contained allegations of false and misleading advertising by the Company.
By order dated June 28, 2007, the Carver, Ford, Hart, Schwinger, and Tompkins cases were transferred to the U.S. District Court for the District of New Jersey and consolidated with other purported pet food class actions under the federal rules for multi-district litigation. The Blaszkowski and Picus cases were not consolidated.
The Multi-District Litigation Cases. The plaintiffs and defendants in the multi-district litigation cases, including the five consolidated cases in which we were a defendant, tentatively agreed to a settlement that was submitted to the U.S. District Court for the District of New Jersey on May 22, 2008. On May 30, 2008, the Court granted preliminary approval to the settlement. Pursuant to the Court’s order, notice of the settlement was disseminated to the public by mail and publication beginning June 16, 2008. Members of the class were allowed to opt-out of the settlement until August 15, 2008. On November 19, 2008, the Court entered orders approving the settlement, certifying the class and dismissing the complaints against the defendants, including the Company. The total settlement was $24.0 million. The portion of the Company’s contribution to this settlement was $0.25 million, net of insurance recovery, which the Company has paid. Four class members have filed objections to the settlement, which objections have been denied by the Court. On December 3, 2008 and December 12, 2008, these class members filed Notices of Appeal. After the Court of Appeals granted the appeal in part, denied the appeal in part and remanded the matter for further proceedings, the District Court approved the settlement on April 5, 2011.
The Blaszkowski Case. On April 11, 2008, the plaintiffs in the Blaszkowski case filed their fourth amended complaint. On September 12, 2008 and October 9, 2008, plaintiffs filed stipulations of dismissal with respect to their complaint against certain of the defendants, including the Company. The U.S. District Court for the Southern District of Florida entered such requested dismissals on such dates, resulting in the dismissal of all claims against the Company.
The Picus Case. The plaintiffs in the Picus case sought certification of a class action as well as unspecified damages and injunctive relief against further distribution of the allegedly defective products. On October 12, 2007, the Company filed a motion to dismiss in the Picus case. The state court in Las Vegas, Nevada granted the Company’s motion in part and denied the Company’s motion in part. On December 14, 2007, other defendants in the case filed a motion to deny class certification. On March 16, 2009, the Court granted the motion to deny class certification. On March 25, 2009, the plaintiffs filed an appeal of the Court’s decision. On June 30, 2009, the Court of Appeals denied plaintiffs’ appeal. By order dated February 1, 2011, the Company was dismissed from this lawsuit.
98
Table of Contents
DEL MONTE CORPORATION AND SUBSIDIARIES
(previously reported as DEL MONTE FOODS COMPANY AND SUBSIDIARIES)
NOTES TO THE CONSOLIDATED FINANCIAL STATEMENTS—(Continued)
May 1, 2011
Other
Del Monte is also involved from time to time in various legal proceedings incidental to its business, including proceedings involving product liability claims, workers’ compensation and other employee claims, tort claims and other general liability claims, for which the Company carries insurance, as well as trademark, copyright, patent infringement and related litigation. Additionally, Del Monte is involved from time to time in claims relating to environmental remediation and similar events. While it is not feasible to predict or determine the ultimate outcome of these matters, the Company believes that none of these legal proceedings will have a material adverse effect on its financial position.
Note 15. Segment Information
The Company has the following reportable segments:
| • | The Pet Products reportable segment includes the Pet Products operating segment, which manufactures, markets and sells branded and private label dry and wet pet food and pet snacks. |
| • | The Consumer Products reportable segment includes the Consumer Products operating segment, which manufactures, markets and sells branded and private label shelf-stable products, including fruit, vegetable, tomato and broth products. |
The Company’s chief operating decision-maker, its CEO or Interim CEO, reviews financial information presented on a consolidated basis accompanied by disaggregated information on net sales and operating income, by operating segment, for purposes of making decisions about resources to be allocated and assessing financial performance. The chief operating decision-maker reviews assets of the Company on a consolidated basis only. The accounting policies of the individual operating segments are the same as those of the Company.
The following table presents financial information about the Company’s reportable segments (in millions):
| Successor | Predecessor | |||||||||||||||||
| March 8, 2011 through May 1, 2011 |
May 3, 2010 through March 7, 2011 |
Fiscal 2010 |
Fiscal 2009 |
|||||||||||||||
| Net sales: |
||||||||||||||||||
| Pet Products |
$ | 271.0 | $ | 1,513.2 | $ | 1,750.0 | $ | 1,673.4 | ||||||||||
| Consumer Products |
293.8 | 1,588.1 | 1,989.8 | 1,953.5 | ||||||||||||||
| Total |
$ | 564.8 | $ | 3,101.3 | $ | 3,739.8 | $ | 3,626.9 | ||||||||||
| Operating income (loss): |
||||||||||||||||||
| Pet Products |
$ | 26.2 | $ | 351.5 | $ | 355.5 | $ | 219.9 | ||||||||||
| Consumer Products |
9.1 | 170.9 | 222.6 | 195.1 | ||||||||||||||
| Corporate (a) |
(119.2 | ) | (99.2 | ) | (70.1 | ) | (54.1 | ) | ||||||||||
| Total |
(83.9 | ) | 423.2 | 508.0 | 360.9 | |||||||||||||
| Reconciliation to income (loss) from continuing operations before income taxes: |
||||||||||||||||||
| Interest expense |
44.3 | 66.7 | 116.3 | 110.3 | ||||||||||||||
| Other (income) expense |
25.7 | (5.2 | ) | 9.8 | 24.1 | |||||||||||||
| Income (loss) from continuing operations before income taxes |
$ | (153.9 | ) | $ | 361.7 | $ | 381.9 | $ | 226.5 | |||||||||
| (a) | Corporate represents expenses not directly attributable to reportable segments. For the periods March 8, 2011 through May 1, 2011, May 3, 2010 through March 7, 2011, fiscal 2010 and fiscal 2009 Corporate includes $82.8 and $68.8, $0.0 and $0.0 of transaction and related costs, respectively. |
See Note 6 for goodwill detailed by reportable segment.
99
Table of Contents
DEL MONTE CORPORATION AND SUBSIDIARIES
(previously reported as DEL MONTE FOODS COMPANY AND SUBSIDIARIES)
NOTES TO THE CONSOLIDATED FINANCIAL STATEMENTS—(Continued)
May 1, 2011
Geographic Information
The following table presents domestic and foreign sales (in millions, except percentages):
| Successor | Predecessor | |||||||||||||||||
| March 8, 2011 through May 1, 2011 |
May 3, 2010 through March 7, 2011 |
Fiscal 2010 |
Fiscal 2009 |
|||||||||||||||
| Net sales—domestic |
$ | 531.2 | $ | 2,917.2 | $ | 3,514.2 | $ | 3,420.0 | ||||||||||
| Net sales—foreign |
33.6 | 184.1 | 225.6 | 206.9 | ||||||||||||||
| Total |
$ | 564.8 | $ | 3,101.3 | $ | 3,739.8 | $ | 3,626.9 | ||||||||||
| Percentage of sales: |
||||||||||||||||||
| Domestic |
94.1 | % | 94.1 | % | 94.0 | % | 94.3 | % | ||||||||||
| Foreign |
5.9 | % | 5.9 | % | 6.0 | % | 5.7 | % | ||||||||||
The following table presents domestic and foreign property, plant and equipment (in millions, except percentages):
| Successor | Predecessor | |||||||||||||||
| May 1, 2011 | Fiscal 2010 | Fiscal 2009 |
||||||||||||||
| Net property, plant and equipment—domestic |
$ | 694.6 | $ | 629.7 | $ | 613.5 | ||||||||||
| Net property, plant and equipment—foreign |
37.1 | 29.1 | 29.1 | |||||||||||||
| Total |
$ | 731.7 | $ | 658.8 | $ | 642.6 | ||||||||||
| Percentage of long-lived assets: |
||||||||||||||||
| Domestic |
94.9 | % | 95.6 | % | 95.5 | % | ||||||||||
| Foreign |
5.1 | % | 4.4 | % | 4.5 | % | ||||||||||
Note 16. Related Party Transactions
As described in Note 1, on March 8, 2011, DMFC completed the Merger with Blue Sub pursuant to the terms of the Merger Agreement and consequently became a direct wholly-owned subsidiary of Parent. As is also described in Note 1, on April 26, 2011, DMC merged with and into DMFC with DMC as the surviving entity, and as a result, DMC is now directly wholly-owned by Parent. Substantially all of Parent’s outstanding common stock is held by Blue Holdings I, L.P., a partnership that is controlled by funds affiliated with the Sponsors. Blue Holdings GP, LLC is the general partner of Blue Holdings I, L.P. Funds affiliated with the Sponsors control Blue Holdings GP, LLC. The following provides a summary of material transactions that involve DMFC, DMC, the management of DMFC and DMC, the Sponsors and entities affiliated with the Sponsors, Blue Sub, Parent, Blue Holdings I, L.P. and Blue Holdings GP, LLC.
Transactions with the Sponsors
Monitoring Agreement
On March 8, 2011, in connection with the Merger, entities affiliated with the Sponsors and an entity affiliated with AlpInvest Partners (the “AlpInvest Manager,” together with the affiliates of the Sponsors, collectively, the “Managers”) entered into a monitoring agreement (the “Monitoring Agreement”) with DMC, Parent and Blue Holdings I, L.P., pursuant to which the Managers provide management, consulting, financial and other advisory services to DMC and to its divisions, subsidiaries, parent entities and controlled affiliates. Pursuant to the Monitoring Agreement, the Managers, other than the AlpInvest Manager, are entitled to receive an aggregate annual advisory fee to be allocated among the Sponsors in accordance with their respective equity holdings in Blue Holdings I, L.P. in an amount equal to the greater of (i) $6.5 million and (ii) 1.00% of DMC’s “Adjusted EBITDA” (as defined in the Senior Notes Indenture) less an annual advisory fee of approximately $0.25 million paid to the AlpInvest Manager. As of May 1, 2011, there was a payable of $1.1 million due to the Managers related to the Monitoring Agreement, which amount is included in accounts payable and accrued expenses on the Consolidated Balance Sheets.
100
Table of Contents
DEL MONTE CORPORATION AND SUBSIDIARIES
(previously reported as DEL MONTE FOODS COMPANY AND SUBSIDIARIES)
NOTES TO THE CONSOLIDATED FINANCIAL STATEMENTS—(Continued)
May 1, 2011
The Managers also receive reimbursement of reasonable out-of-pocket expenses incurred in connection with the provision of services pursuant to the Monitoring Agreement. The Monitoring Agreement will continue indefinitely unless terminated by the consent of all the parties thereto. In addition, the Monitoring Agreement will terminate automatically upon an initial public offering of Parent, unless the Company elects by prior written notice to continue the Monitoring Agreement. Upon a change of control of Parent, the Company may terminate the Monitoring Agreement.
Consulting Arrangements with Capstone Consulting LLC
The Company has engaged Capstone Consulting LLC (“Capstone”) to provide consulting services with respect to the Company’s operations. These engagements may be terminated at any time at the discretion of management of the Company. For the period March 8, 2011 through May 1, 2011, the total fees payable to Capstone under these arrangements were approximately $0.4 million. One of the Company’s directors holds an equity interest in Capstone. Neither KKR nor any entity affiliated with KKR owns any of the equity of Capstone. Capstone provides dedicated consulting services to KKR and its affiliated funds’ portfolio companies. As of May 1, 2011, there was a payable of $0.3 million due to Capstone, which amount is included in accounts payable and accrued expenses on the Consolidated Balance Sheets.
Indemnification Agreement
On March 8, 2011, DMFC, Parent, Blue Holdings I, L.P. and Blue Holdings GP, LLC, entered into an indemnification agreement with the Managers. This indemnification agreement contains customary exculpation and indemnification provisions in favor of the Managers and their affiliates.
Transaction Fee Arrangements
Pursuant to transaction fee letters entered into with each respective Sponsor, each dated March 8, 2011, Blue Sub agreed to pay each of the Sponsors one-time fees aggregating to $46.85 million in consideration of the structuring, financial and consultation services that the Sponsors provided to Blue Sub in connection with the Merger. Blue Sub also paid for the reasonable out-of-pocket expenses of the Sponsors. In connection with these agreements, and concurrently with the consummation of the Merger, Blue Sub paid fees of $28.9 million, $3.1 million and $14.85 million, to KKR, Centerview and Vestar, respectively. As of May 1, 2011, there was a payable of $0.2 million due to Centerview for transaction-related out-of-pocket expenses, which amount is included in accounts payable and accrued expenses on the Consolidated Balance Sheets.
Pursuant to an engagement letter dated March 8, 2011, Blue Sub engaged KKR Capital Markets LLC, an affiliate of KKR (“KCM”), to act as syndication agent in connection with the placement of equity securities to persons who were not affiliated with the Sponsors. For such syndication services, Blue Sub paid KCM a one-time syndication fee of $9.2 million upon the completion of the Merger in addition to reasonable out-of-pocket expenses.
Pursuant to a facilitation fee letter agreement and an M&A fee letter agreement, each dated March 8, 2011, Blue Sub agreed to pay to Centerview (i) a one-time fee of $5.0 million for services provided to Blue Sub by Centerview and its affiliates, including services in connection with the placement of equity securities to persons who were not affiliated with the Sponsors and assistance in the due diligence process to facilitate the acceptance by Parent of certain investments and (ii) a one-time fee of $8.0 million for services provided to Blue Sub by Centerview and its affiliates, including financial advisory services in connection with the structuring, negotiation and consummation of the Merger and the preparation, negotiation and finalization of the Agreement and Plan of Merger, dated as of November 24, 2010 (“Merger Agreement”) and other documents executed in connection therewith. Both of these payments were made concurrently with the consummation of the Merger.
Financing Arrangements
KCM and certain of its capital markets affiliates played a number of roles in connection with the arrangement of financing related to the Merger, including providing financing commitments to Blue Sub, acting as a joint manager and arranger of the Term Loan Facility, an initial purchaser in the initial offering of 7.625% Notes and as dealer-manager in connection with our tender offer for outstanding 6 ¾% Notes and 7 ½ % Notes. KCM received approximately $10.2 million for these services.
101
Table of Contents
DEL MONTE CORPORATION AND SUBSIDIARIES
(previously reported as DEL MONTE FOODS COMPANY AND SUBSIDIARIES)
NOTES TO THE CONSOLIDATED FINANCIAL STATEMENTS—(Continued)
May 1, 2011
Transactions with Management
Equity Contributions
Pursuant to an equity contribution agreement dated March 8, 2011, and an equity contribution and subscription agreement, dated February 16, 2011, Blue Holdings I, L.P. contributed to Parent the sum of approximately $1,564.2 million and received from Parent 312,829,237 shares of common stock of Parent. The Company’s Executive Vice President and Chief Financial Officer and Chief Operating Officer, contributed approximately $0.6 million in the aggregate in cash to Parent and received 125,644 shares of common stock of Parent. Parent then contributed to Blue Sub the sum of approximately $1,550.7 million and paid $14.2 million in expenses on behalf of Blue Sub, and received from Blue Sub 10 shares of common stock of Blue Sub, which represented 100% of Blue Sub’s outstanding common stock.
Note 17. Quarterly Results of Operations (unaudited)
| Predecessor | Successor | |||||||||||||||||||||
| January 31,
2011 through March 7, 2011 |
March 8, 2011 through May 1, 2011 |
|||||||||||||||||||||
| First (1) | Second | Third | Fourth | Fourth | ||||||||||||||||||
| (in millions) | (in millions) | |||||||||||||||||||||
| Twelve months ended May 1, 2011 |
||||||||||||||||||||||
| Net sales |
$ | 804.6 | $ | 940.9 | $ | 969.4 | $ | 386.4 | $ | 564.8 | ||||||||||||
| Operating income (loss) |
119.4 | 148.0 | 145.4 | 10.4 | (83.9 | ) | ||||||||||||||||
| Net income (loss) |
59.4 | 81.1 | 87.1 | (4.8 | ) | (104.5 | ) | |||||||||||||||
| First (1) | Second | Third | Fourth | |||||||||||||||||||
| (in millions) | ||||||||||||||||||||||
| Fiscal 2010 |
||||||||||||||||||||||
| Net sales |
$ | 813.7 | $ | 958.9 | $ | 1,013.2 | $ | 954.0 | ||||||||||||||
| Operating income |
120.9 | 140.6 | 138.4 | 108.1 | ||||||||||||||||||
| Net income |
58.6 | 62.6 | 59.4 | 63.7 | ||||||||||||||||||
| (1) | The Company’s net sales have exhibited seasonality, with the first fiscal quarter typically having the lowest net sales. Lower levels of promotional activity, the availability of fresh produce, the timing of price increases and other factors have historically affected net sales in the first quarter. |
Note 18. Share Repurchases
On June 10, 2010, DMFC announced that its board had authorized the repurchase of up to $350.0 million of DMFC’s common stock over the next 36 months. The new authorization superseded and replaced DMFC’s previous $200.0 million share repurchase authorization that was scheduled to expire in September 2010. On June 22, 2010, DMFC entered into an accelerated stock buyback agreement (“ASB”) with Goldman, Sachs & Co. (“Goldman Sachs”). Under the ASB, DMFC paid $100 million to Goldman Sachs on June 25, 2010 from available cash on hand to purchase outstanding shares of its common stock, and it received 6,215,470 shares of its common stock from Goldman Sachs on that date. Final settlement of the ASB occurred on August 2, 2010, resulting in DMFC receiving an additional 885,413 shares of its common stock. The total number of shares that DMFC ultimately repurchased under the ASB was based generally on the average of the daily volume-weighted average share price of DMFC’s common stock over the duration of the transaction.
Note 19. Supplemental Disclosures
The following information is intended to comply with the requirements in the Wisconsin Agriculture Producer Security Statute 126 and Agriculture, Trade and Consumer Protection Chapter 101.
102
Table of Contents
DEL MONTE CORPORATION AND SUBSIDIARIES
(previously reported as DEL MONTE FOODS COMPANY AND SUBSIDIARIES)
NOTES TO THE CONSOLIDATED FINANCIAL STATEMENTS—(Continued)
May 1, 2011
Financial Ratios
The following table represents the Company’s current ratio and debt to equity ratio as of May 1, 2011 (in millions, except ratios):
| Current Ratio: |
||||||||||||
| Current assets\ Current liabilities |
$ | 1,339.0 | = | 2.60 | ||||||||
| $ | 515.6 | |||||||||||
| Debt to Equity Ratio: |
||||||||||||
| Total liabilities \ Total stockholder's equity |
$ | 5,718.3 | = | 3.85 | ||||||||
| $ | 1,485.4 |
Allowance for Doubtful Accounts
The Company has an allowance for doubtful accounts at May 1, 2011 of $0.0 million. The method for determining the allowance is “specific identification” such that the Company reviews the accounts receivable balances and the aging and reserves for any balances that are determined to be uncollectible. Such balances may include those due from companies that are having financial trouble or filing bankruptcy, balances older than a year or balances that the Company has determined to be uncollectible for another reason. The Company does not have any accounts receivable balances that are older than a year that are not covered by the allowance for doubtful accounts. The Company does not have any non-trade notes or accounts receivables from an officer, director, employee, partner, or stockholder, or from a member of the family of any of those individuals. The Company does not have any notes or accounts receivables from a parent organization, a subsidiary, or affiliates.
| Item 9. | Changes in and Disagreements with Accountants on Accounting and Financial Disclosure |
None.
| Item 9A. | Controls and Procedures |
Evaluation of Disclosure Controls and Procedures
We conducted an evaluation of the effectiveness of the design and operation of our disclosure controls and procedures, or “Disclosure Controls,” as of the end of the period covered by this Annual Report on Form 10-K. This evaluation, or “Controls Evaluation” was performed under the supervision and with the participation of management, including our Interim Chief Executive Officer and Vice Chairman of the Board (our “CEO,” who was appointed March 8, 2011) and our Executive Vice President and Chief Financial Officer (our “CFO”). Disclosure Controls are controls and procedures designed to provide reasonable assurance that information required to be disclosed in our reports filed under the Securities Exchange Act of 1934 (the “Exchange Act”), such as this annual report, is recorded, processed, summarized and reported within the time periods specified in the U.S. Securities and Exchange Commission’s rules and forms. Disclosure Controls include, without limitation, controls and procedures designed to ensure that information required to be disclosed in our reports filed under the Exchange Act, as amended, is accumulated and communicated to our management, including our CEO and CFO, or persons performing similar functions, as appropriate, to allow timely decisions regarding required disclosure. Our Disclosure Controls include some, but not all, components of our internal control over financial reporting. Our internal control over financial reporting was also separately evaluated as of the end of the period covered by this Annual Report on Form 10-K in connection with the Management’s Report on Internal Control Over Financial Reporting which is set forth below.
Based upon the Controls Evaluation, and subject to the limitations noted in this Part II, Item 9A, our CEO and CFO have concluded that as of the end of the period covered by this Annual Report on Form 10-K, our Disclosure Controls were effective to provide reasonable assurance that information required to be disclosed in our Exchange Act reports is recorded, processed, summarized and reported within the time periods specified by the Securities and Exchange Commission, and that material information relating to Del Monte Corporation and its consolidated subsidiaries is made known to management, including our CEO and CFO, particularly during the period when our periodic reports are being prepared.
103
Table of Contents
Management’s Report on Internal Control Over Financial Reporting
Our management is responsible for establishing and maintaining internal control over financial reporting to provide reasonable assurance regarding the reliability of our financial reporting and the preparation of financial statements for external purposes in accordance with generally accepted accounting principles. Internal control over financial reporting includes those policies and procedures that (1) pertain to the maintenance of records that in reasonable detail accurately and fairly reflect the transactions and dispositions of our assets; (2) provide reasonable assurance that transactions are recorded as necessary to permit preparation of financial statements in accordance with generally accepted accounting principles, and that our receipts and expenditures are being made only in accordance with authorizations of our management and directors; and (3) provide reasonable assurance regarding prevention or timely detection of unauthorized acquisition, use or disposition of our assets that could have a material effect on the financial statements.
Management assessed our internal control over financial reporting as of May 1, 2011, the end of our fiscal year. Management based its assessment on criteria established in the Internal Control—Integrated Framework issued by the Committee of Sponsoring Organizations of the Treadway Commission (COSO). Management’s assessment included evaluation of such elements as the design and operating effectiveness of key financial reporting controls, process documentation, accounting policies, and our overall control environment. This assessment is supported by testing and monitoring performed by our Internal Audit and Finance departments.
Based on our assessment, management has concluded that our internal control over financial reporting was effective as of the end of the fiscal year to provide reasonable assurance regarding the reliability of financial reporting and the preparation of financial statements for external reporting purposes in accordance with generally accepted accounting principles. We reviewed the results of management’s assessment with the Audit Committee of our Board of Directors.
As a result of the enactment in July 2010 of the Dodd-Frank Wall Street Reform and Consumer Protection Act, “Exemption for Non-accelerated Filers,” and in accordance with Section 989G of that act, we are not required to provide an attestation report of our independent registered public accounting firm regarding internal control over financial reporting for this fiscal year or thereafter, until such time as we are no longer eligible for the exemption set forth therein.
Limitations on the Effectiveness of Controls
Our management, including our CEO and CFO, does not expect that our Disclosure Controls or our internal controls will prevent all error and all fraud. A control system, no matter how well designed and operated, can provide only reasonable, not absolute, assurance that the control system’s objectives will be met. Further, the design of a control system must reflect the fact that there are resource constraints, and the benefits of controls must be considered relative to their costs. Because of the inherent limitations in all control systems, no evaluation of controls can provide absolute assurance that all control issues and instances of fraud, if any, within Del Monte have been detected. These inherent limitations include the realities that judgments in decision-making can be faulty, and that breakdowns can occur because of simple error or mistake. Controls can also be circumvented by the individual acts of some persons, by collusion of two or more people, or by management override of the controls. The design of any system of controls is based in part upon certain assumptions about the likelihood of future events, and there can be no assurance that any design will succeed in achieving its stated goals under all potential future conditions. Over time, controls may become inadequate because of changes in conditions or deterioration in the degree of compliance with associated policies or procedures. Because of the inherent limitations in a cost-effective control system, misstatements due to error or fraud may occur and not be detected.
Changes in Internal Control Over Financial Reporting
There have not been any changes in our internal control over financial reporting (as such term is defined in Rules 13a-15(f) and 15d-15(f) of the Exchange Act, as amended) during the most recent fiscal quarter that have materially affected or are reasonably likely to materially affect our internal control over financial reporting.
Changes in Company Management
Effective immediately following the closing of the Merger on March 8, 2011, the Company’s Chief Executive Officer retired and Chief Financial Officer resigned. At that time, Mr. Neil Harrison, an affiliate of the Sponsors, was appointed CEO and Mr. Bodner was promoted to CFO from his position as Executive Vice President, Finance. Thus, approximately eight weeks before May 1, 2011, the end of our fiscal year, these individuals became responsible for establishing and maintaining the Company’s disclosure controls and procedures, as well as its internal control over financial reporting.
CEO and CFO Certifications
The certifications of the CEO and the CFO required by Rule 15d-14 of the Exchange Act, as amended, or the “Rule 15d-14 Certifications” are filed as Exhibits 31.1 and 31.2 of this Annual Report on Form 10-K. This Part II, Item 9A of this Annual Report on Form 10-K should be read in conjunction with the Rule 13a-14 Certifications for a more complete understanding of the topics presented.
| Item 9B. | Other Information |
None.
104
Table of Contents
| Item 10. | Directors, Executive Officers and Corporate Governance |
Directors
Our current Board of Directors consists of ten members. Pursuant to an amended and restated limited liability company agreement (the “LLC Agreement”) among the members of Blue Holdings GP, LLC, the general partner of Blue Holdings I, L.P. (which owns substantially all of the shares of Parent), affiliates of each of KKR and Vestar have the right to designate three managers of Blue Holdings GP, LLC, affiliates of Centerview have the right to designate two managers of Blue Holdings GP, LLC and affiliates of AlpInvest Partners have the right to designate one manager of Blue Holdings GP, LLC. In addition, the LLC Agreement provides that the Chief Executive Officer of the Company is a manager of Blue Holdings GP, LLC. Pursuant to the LLC Agreement, Mr. Kilts shall serve as Chairman of the Board so long as he is a member of the Board. The LLC Agreement further provides that the members of Blue Holdings GP, LLC will seek to ensure, to the extent permitted by law, that each of the managers of Blue Holdings GP, LLC also is a member of the board of directors of Parent and of the Company. Because of these requirements and because our equity is privately held, we do not currently have a policy or procedures with respect to shareholder recommendations for nominees to our Board of Directors.
As a result of the LLC Agreement, Messrs. Brown, Ko and Nelson were designated as members of our Board by KKR; Messrs. Ratzan, Harrison and Mundt were designated by Vestar; Messrs. Hooper and Kilts were designated by Centerview; and Mr. Leigh was designated by AlpInvest. All of the directors other than Mr. West, who is an employee of the Company, are affiliated with the investment fund that designated them and are considered “affiliates” of the Company.
The names of our current directors, along with their present positions and qualifications, their principal occupations and directorships held with public corporations during the past five years and their ages as of July 11, 2011 are set forth below. To the Company’s knowledge, there are no family relationships between any director or executive officer and any other director or executive officer of the Company.
| Name |
Age | Positions with the Company | ||||
| Simon E. Brown |
40 | Director | ||||
| Neil Harrison |
58 | Interim Chief Executive Officer and Vice Chairman of the Board | ||||
| David M. Hooper |
43 | Director | ||||
| James M. Kilts |
63 | Chairman of the Board | ||||
| Stephen Ko |
37 | Director | ||||
| Iain Leigh |
55 | Director | ||||
| Kevin A. Mundt |
57 | Director | ||||
| Dean B. Nelson |
52 | Director | ||||
| Brian K. Ratzan |
41 | Director | ||||
| David J. West |
48 | Director and executive employee (effective August 15, 2011, Chief Executive Officer) | ||||
Simon E. Brown, Director. Mr. Brown became a director of the Company in March 2011 in connection with the Merger. Mr. Brown is a Member of KKR and heads the Consumer Products and Services team in North America. At KKR, he has been involved in a variety of investments in the Consumer Products, Media and Technology sectors. Prior to joining KKR in 2003, Mr. Brown was with the private equity firms Madison Dearborn Partners, LLC, Thomas H. Lee Partners, L.P. and Morgan Stanley Capital Partners (now Metalmark Capital).
| • | Other Directorships: Mr. Brown currently serves as a non-executive director of Nielsen Holdings N.V., a publicly held information and measurement company, on the Supervisory Board of The Nielsen Company B.V., a subsidiary of Nielsen Holdings N.V., and as a board member of Sealy Corporation, a publicly held bedding manufacturer. |
Neil Harrison, Interim Chief Executive Officer; Director; Vice-Chairman of the Board. Mr. Harrison was appointed Interim Chief Executive Officer and became a director of the Company in March 2011 in connection with the Merger. Mr. Harrison is a Senior Advisor of Vestar Capital Partners and joined the firm in August 2010. From July 2008 to December 2009, he served as Chairman and Chief Executive Officer of Birds Eye Foods, Inc., a food company. From September 2005 to July 2008, Mr. Harrison served as Chairman, President and Chief Executive Officer of Birds Eye Foods, Inc. From 2002 to 2004, he served as Executive Vice President of H.J. Heinz Company, a publicly held food company, and President and Chief Executive Officer of Heinz North America, a division of the H.J. Heinz Company. From 1999 to 2002, he served as Senior Vice President and President and Chief Executive Officer of Heinz Frozen Food Company a division of the H.J. Heinz Company. Prior to joining H.J. Heinz Company, Mr. Harrison held a variety of positions at the consumer products companies Miller Brewing Company, PepsiCo, Inc., General Foods Corporation and Unilever PLC.
105
Table of Contents
| • | Other Directorships: Mr. Harrison currently serves as a director of Solo Cup Company, a publicly reporting consumer products company, and The Sun Products Corporation, a consumer products manufacturer. During the last five years, Mr. Harrison also served on the board of Birds Eye Foods, Inc. |
David M. Hooper, Director. Mr. Hooper became a director of the Company in March 2011 in connection with the Merger. Mr. Hooper is Partner and the Head of Private Equity at Centerview Capital. Prior to co-founding Centerview Capital in 2006, Mr. Hooper was a Managing Director, Head of the Consumer Group and Chairman of the U.S. Investment Committee at Vestar Capital Partners. Prior to joining Vestar in 1994, Mr. Hooper served as a financial consultant to GPA Group plc, and was a member of the Principal Investment Group of The Blackstone Group, and the M&A department of Drexel Burnham Lambert Inc.
| • | Other Directorships: Mr. Hooper currently serves as a director of Richelieu Foods, Inc., a private label food manufacturing company. During the last five years, Mr. Hooper also served on the board of Birds Eye Foods, Inc. |
James M. Kilts, Director; Chairman of the Board. Mr. Kilts became a director of the Company in March 2011 in connection with the Merger. He has served as Chairman of the Board since March 8, 2011. Mr. Kilts is a founding Partner of Centerview Partners. Prior to joining Centerview Partners in 2006, Mr. Kilts was Vice Chairman of the Board of The Procter & Gamble Company, a publicly held consumer products company, and was Chairman of the Board, Chief Executive Officer and President of The Gillette Company, a consumer products manufacturer, before its merger with Procter & Gamble in October 2005. Prior to Gillette, Mr. Kilts served at different times with various food manufacturing companies as President and Chief Executive Officer of Nabisco, Executive Vice President of the Worldwide Food Group of Philip Morris, and President of Kraft USA and Oscar Mayer, President of Kraft Limited in Canada and Senior Vice President of Kraft International, divisions of Kraft Food Inc. Mr. Kilts is also a member of the Board of Overseers of Weill Cornell Medical College, serves on the Board of Trustees of Knox College and the University of Chicago and is a member of the Advisory Council of the University of Chicago Booth School of Business.
| • | Other Directorships: Mr. Kilts currently serves as a non-executive director and Chairman of Nielsen Holdings N.V. and The Nielsen Company B.V., and a director of MetLife, Inc., a publicly held insurance company, MeadWestvaco Corporation, a publicly held packaging company, and Pfizer Inc., a publicly held biopharmaceutical company. During the last five years, Mr. Kilts also served on the boards of The Procter & Gamble Co., and The New York Times Co., a publicly held media company. |
Stephen Ko, Director. Mr. Ko became a director of the Company in March 2011 in connection with the Merger. Mr. Ko is a Director of KKR. At KKR, he has worked on investments in the Consumer Products, Industrial and Healthcare sectors. Prior to joining KKR in 2005, he was with the Private Equity group of The Blackstone Group L.P., a private equity firm, Clayton, Dubilier & Rice, a private equity firm, and the Investment Banking Division of Goldman, Sachs & Co., a publicly held investment banking firm.
| • | Other Directorships: Mr. Ko currently serves as a director of Biomet, Inc., a public reporting medical device company and Oriental Brewery Co. Ltd, a beer brewer. During the last five years, Mr. Ko also served on the boards of Sealy Corporation, a publicly held bedding manufacturer, and Weld North LLC, an investment company. |
Iain Leigh, Director. Mr. Leigh became a director of the Company in March 2011 in connection with the Merger. Mr. Leigh is a Managing Partner and Head of the U.S. office of AlpInvest Partners. Prior to joining AlpInvest Partners in 2000, Mr. Leigh was Managing Investment Partner and a member of the Executive Committee of Dresdner Kleinwort Benson’s global private equity business. Prior to that time, he led the Restructuring Department within Kleinwort Benson’s Investment Banking division focusing on U.S. leveraged buy-outs and venture capital investments. Before moving to the U.S., Mr. Leigh held a number of senior operating positions in Kleinwort Benson in Western Europe and Asia. Mr. Leigh is a Fellow of the Chartered Association of Certified Accountants, U.K.
| • | Other Directorships: Mr. Leigh currently serves as a non-executive director of Nielsen Holdings N.V. and on the Supervisory Board of The Nielsen Company B.V. |
Kevin A. Mundt, Director. Mr. Mundt became a director of the Company in March 2011 in connection with the Merger. Mr. Mundt is a Managing Director of Vestar Capital Partners and President of the Vestar Resources Group. Prior to joining Vestar in 2004, he spent 24 years in management consulting, including various management positions with Mercer Oliver Wyman, a management consulting firm, and its predecessors.
| • | Other Directorships: Mr. Mundt currently serves as Chairman of the Board of Solo Cup Company, a publicly reporting consumer products company, and as director of National Mentor Holdings, Inc., a publicly reporting human services company, MediMedia USA, Inc., a healthcare communications company, and The Sun Products Corporation, a consumer products manufacturer. During the last five years, Mr. Mundt also served on the board(s) of Sunrise Medical, Duff & Phelps, Gold Toe Socks and Birds Eye Foods. |
106
Table of Contents
Dean B. Nelson, Director. Mr. Nelson became a director of the Company in March 2011 in connection with the Merger. Mr. Nelson is a partner at KKR and has been Chief Executive Officer of KKR Capstone since March 2000. Prior to joining KKR Capstone in 2000, he was a senior partner and member of the management committee at The Boston Consulting Group, a global consulting firm, where he focused primarily on the Consumer Products and Retail, Industrials and the Technology industries. Mr. Nelson previously worked at Shell Oil Company, a petroleum refining company. At KKR Capstone, he has worked on investments in the Consumer Products, Retail, Media, Energy and Financial Services sectors.
| • | Other Directorships: Mr. Nelson currently serves as Chairman of PRIMEDIA Inc., a publicly held targeted media company, and as director of Sealy Corporation, a publicly held bedding manufacturer. During the last five years, Mr. Nelson also served on the boards of Dollar General Corporation, a publicly held discount retailer, and Toys ‘R’ Us, Inc., a global toy retailer. |
Brian K. Ratzan, Director. Mr. Ratzan became a director of the Company in March 2011 in connection with the Merger. Mr. Ratzan is a Managing Director and Head of the Consumer group of Vestar Capital Partners. Prior to joining Vestar in 1998, he was a Vice President with ‘21’ International Holdings, Inc., a private investment firm, and was previously in the Investment Banking Group at Donaldson, Lufkin & Jenrette, Inc., an investment banking firm.
| • | Other Directorships: Mr. Ratzan currently serves as a director of The Sun Products Corporation, a consumer products manufacturer. During the last five years, Mr. Ratzan also served on the board of National Mentor Holdings, Inc., a publicly reporting human services company, and Birds Eye Foods, Inc., a food company. |
David J. West, Director, Chief Executive Officer, effective August 15, 2011. Mr. West has been appointed to the position of Chief Executive Officer of the Company and Parent, effective August 15, 2011. Mr. West joined the Board of Directors on June 12, 2011 and became an executive employee of the Company on June 10, 2011. Mr. West will replace Neil Harrison, the current interim Chief Executive Officer of both the Company and Parent, who will continue to serve as the Vice Chairman of the Board of Directors of both the Company and Parent. Mr. West previously served as the President and Chief Executive Officer of The Hershey Company (“Hershey”), a publicly held confectionery and chocolate products manufacturer, a position he held from December 2007 to May 2011. Prior to being appointed as President and Chief Executive Officer, from October 2007 to November 2007, Mr. West was President of Hershey, while from January 2007 until October 2007, he served as Executive Vice President, Chief Operating Officer. From January 2005 to January 2007, Mr. West served as Senior Vice President, Chief Financial Officer of Hershey and continued to hold the role of Chief Financial Officer until July 2007.
| • | Other Directorships: During the last five years, Mr. West served as a director of Hershey and of Tasty Baking Company, a privately held food company. |
We believe that our directors have the experience and qualifications that will allow them to make substantial contributions to the Board. As former chief executive officers of The Hershey Company, Birds Eye Foods and The Gillette Company, respectively, Messrs. West, Harrison and Kilts have experience in, and possess an understanding of, business issues applicable to the success of a large consumer goods companies. Messrs. Brown, Hooper, Ko, Mundt, Nelson and Ratzan have expertise in consumer products as a result of their experience working on investments in the consumer products area at Centerview, KKR and Vestar. All of our directors, other than Mr. West, have had positions at global private equity firms and possess experience in owning and managing enterprises like the Company and are familiar with corporate finance, strategic business planning activities and issues involving stakeholders more generally. Messrs. Brown, Hooper, Ko, Harrison, Mundt, Kilts, Nelson, Ratzan and West have working experience in corporate governance through their experience serving as directors of other public and private companies.
107
Table of Contents
Executive Officers
The following table sets forth the name, age and positions, as of July 11, 2011, of individuals who are currently executive officers of DMC. To our knowledge, there are no family relationships between any director or executive officer and any other director or executive officer of DMC. Executive officers serve at the discretion of DMC’s Board of Directors. Additionally, executive officers may be elected to DMC’s Board.
| Name |
Age | Position | ||||
| Neil Harrison |
58 | Interim Chief Executive Officer, Vice-Chairman of the Board | ||||
| Nils Lommerin |
46 | Chief Operating Officer | ||||
| Larry E. Bodner |
48 | Executive Vice President and Chief Financial Officer | ||||
| David W. Allen |
50 | Executive Vice President, Operations | ||||
| Timothy A. Cole |
54 | Executive Vice President, Sales | ||||
| Richard W. Muto |
60 | Executive Vice President and Chief Human Resources Officer | ||||
| Marc L. Brown |
51 | Senior Vice President, Corporate Service Center and Chief Information Officer | ||||
| Richard L. French |
54 | Senior Vice President, Treasurer, Chief Accounting Officer and Controller | ||||
| David J. Lee |
39 | Senior Vice President, Consumer Products | ||||
| Robert M. Leibowitz |
49 | Senior Vice President, Pet Products | ||||
| James G. Potter |
53 | Senior Vice President, General Counsel and Secretary | ||||
Neil Harrison, Interim Chief Executive Officer; Vice-Chairman of the Board. Mr. Harrison was appointed Interim Chief Executive Officer and became a director of the Company in March 2011 in connection with the Merger. Mr. Harrison is a Senior Advisor of Vestar Capital Partners and joined the firm in August 2010. From July 2008 to December 2009, he served as Chairman and Chief Executive Officer of Birds Eye Foods, Inc., a food company. From September 2005 to July 2008, Mr. Harrison served as Chairman, President and Chief Executive Officer of Birds Eye Foods, Inc. From 2002 to 2004, he served as Executive Vice President of H.J. Heinz Company, a publicly held food company, and President and Chief Executive Officer of Heinz North America, a division of the H.J. Heinz Company. From 1999 to 2002, he served as Senior Vice President and President and Chief Executive Officer of Heinz Frozen Food Company a division of the H.J. Heinz Company. Prior to joining H.J. Heinz Company, Mr. Harrison held a variety of positions at the consumer products companies Miller Brewing Company, PepsiCo, Inc., General Foods Corporation and Unilever PLC. Mr. Harrison currently serves as a director of Solo Cup Company, a publicly reporting consumer products company, and The Sun Products Corporation, a consumer products manufacturer.
Nils Lommerin, Chief Operating Officer. Mr. Lommerin was appointed Chief Operating Officer in January 2008. He joined the Company in March 2003 as Executive Vice President, Human Resources and was appointed Executive Vice President, Operations in July 2004. From March 1999 to July 2002, he was with Oxford Health Plans, Inc., a managed care company, where he most recently served as Executive Vice President, Operations and Corporate Services. From November 1991 to February 1999, Mr. Lommerin held a variety of senior Human Resources positions with PepsiCo, Inc., a consumer products company.
Larry E. Bodner, Executive Vice President and Chief Financial Officer. Mr. Bodner joined the Company in July 2003 and was appointed to his current position in March 2011. Mr. Bodner was Executive Vice President, Finance from April 2010 to March 2011; Senior Vice President, Finance and Investor Relations from October 2007 to April 2010; Vice President, Finance and Investor Relations from July 2006 to October 2007; and Vice President, Internal Reporting and Financial Analysis from July 2003 to July 2006. Prior to joining the Company, he was Chief Operating Officer of Market Compass, Inc., a consulting and software development company, from May 2001 to July 2003 and Chief Operating Officer/ Chief Financial Officer of SelfCare from 1998 to 2001. From 1995 to 1997, Mr. Bodner held a variety of senior financial positions with The Walt Disney Company, a publicly held media and entertainment company. From 1986 to 1994, Mr. Bodner held a variety of finance positions with The Procter & Gamble Company, a publicly held consumer products company.
David W. Allen, Executive Vice President, Operations. Mr. Allen was appointed to his current position in April 2010. Mr. Allen was Senior Vice President, Operations and Supply Chain from June 2006 to April 2010, having served previously as a consultant to the Company beginning in November 2005. Prior to that, Mr. Allen was Chief Operating Officer of U.S. Foodservice, Inc., a food distribution division of Royal Ahold, from 2004 to 2005 and Chief Executive Officer of WorldChain, Inc., a supply chain services company, from 2001 to 2004. He served as Vice President, Worldwide Operations of Dell Inc., a publicly held computer and technology services company, from 1999 to 2000. From 1991 to 1999, Mr. Allen held a variety of positions at Frito-Lay North America, a division of PepsiCo, Inc., a consumer products company, most recently as its Senior Vice President, Operations. Mr. Allen also served on the board of directors of American Italian Pasta Company, a food manufacturing company, from 2006 to 2010.
Timothy A. Cole, Executive Vice President, Sales. Mr. Cole joined the Company in September 2004. From 1979 to September 2004, Mr. Cole held a variety of positions with The Quaker Oats Company, a packaged food company and now a unit of PepsiCo, Inc., a consumer products company, where he became Vice President of National Accounts for the United States.
Richard W. Muto, Executive Vice President and Chief Human Resources Officer. Mr. Muto joined Del Monte in 1974 and was appointed to his current position in September 2010. Mr. Muto was Senior Vice President, Human Resources from June 2008 to September 2010, Vice President, Human Resources from June 2007 to June 2008 and Vice President, Human Resources, U.S. and International Operations of Del Monte from December 1992 through June 2007. Prior to December 1992, he held a variety of positions within Del Monte’s human resources organization and, from 1986 to 1989, he held positions at RJR Nabisco.
108
Table of Contents
Marc L. Brown, Senior Vice President, Corporate Service Center and Chief Information Officer. Mr. Brown joined the Company in December 2002 and was appointed Senior Vice President, Corporate Service Center and Chief Information Officer in May 2008.
Mr. Brown was Vice President, Chief Information Officer from May 2004 to May 2008 and Vice President, Information Technology from April 2003 to May 2004, and Mr. Brown served as Vice President, Information Systems from December 2002 to April 2003. From August 1996 to December 2002, he held a variety of information technology positions with the Heinz North America and Heinz Frozen Foods divisions of the H.J. Heinz Company, a publicly held food company. Prior to August 1996, Mr. Brown was with Andersen Consulting, LLP (now Accenture plc), a management consulting firm.
Richard L. French, Senior Vice President, Treasurer, Chief Accounting Officer and Controller. Mr. French joined the Company in 1980 and was elected to his current position in June 2008. Mr. French was Senior Vice President, Chief Accounting Officer and Controller of the Company from May 1998 through June 2008 and Vice President and Chief Accounting Officer from August 1993 through May 1998. Prior to August 1993, he held a variety of positions within the Company’s financial organization.
David J. Lee, Senior Vice President, Consumer Products. Mr. Lee joined the Company in February 2004 and was appointed to his current position in March 2011. Mr. Lee was Vice President, Consumer Products Marketing from September 2010 to March 2011; Vice President, Strategic Planning and Business Development from October 2008 to September 2010; Vice President, Consumer Products Finance from July 2006 to October 2008; and Vice President, Sales Finance from July 2004 to July 2006. Prior to joining the Company, from 2001 to 2004, he was both Director, Strategic Planning at PG&E Corporation, a publicly held power and natural gas company, and a partner at Pacific Venture Capital, LLC, an affiliate of PG&E Corporation. From 1998 to 2000, he was a Senior Associate at McKinsey & Company. From 1994 to 1998, Mr. Lee held a variety of senior marketing positions at the Leo Burnett Company, an advertising agency.
Robert M. Leibowitz, Senior Vice President, Pet Products. Mr. Leibowitz was appointed to his current position in March 2011. Mr. Leibowitz was Vice President, Pet Products Marketing from September 2010 to March 2011; and Vice President, Marketing, Pet Food/Specialty from November 2009 to September 2010, having served previously as a consultant to the Company beginning in January 2009. Prior to joining the Company, Mr. Leibowitz was with Mars, Incorporated, a consumer products company, where as Vice President, Marketing, he was head of marketing for Mars Petcare U.S. from 2006 to 2008 and held a variety of marketing and sales positions in the petcare, ice cream and snack food divisions from 1988 to 2006. Prior to 1988, Mr. Leibowitz held a variety of sales positions at both Unilever, a consumer products company and Orval Kent Food Company.
James G. Potter, Senior Vice President, General Counsel and Secretary. Mr. Potter joined the Company in October 2001 and was elected to his current position in September 2002. From December 1997 to December 2000, he was Executive Vice President, General Counsel and Secretary of Provident Mutual Life Insurance Company. From 1989 to November 1997, Mr. Potter was the Chief Legal Officer of The Prudential Bank and Trust Company and The Prudential Savings Bank, current and former subsidiaries of The Prudential Insurance Company of America.
Board Committees
Our Board of Directors has established an Audit Committee and a Compensation and Benefits Committee. Three directors currently comprise the Audit Committee: Messrs. Ratzan, Hooper and Ko. Mr. Ratzan currently serves as the Chair of the Audit Committee. The Audit Committee recommends the annual appointment of auditors with whom the Audit Committee reviews the scope of audit and non-audit assignments and related fees, accounting principles we use in financial reporting, internal auditing procedures and the adequacy of our internal control procedures. Though not formally considered by our Board given that our securities are not traded on any national securities exchange, based upon the listing standards of the New York Stock Exchange, the national securities exchange upon which DMFC’s common stock was listed prior to the Merger, we do not believe that the members of our Audit Committee would be considered independent.
Because our equity is privately held and in the absence of a public listing or trading market for our common stock, our Board has not designated any member of the Audit Committee as an “audit committee financial expert.”
Three directors currently comprise the Compensation and Benefits Committee: Messrs. Brown, Kilts and Mundt. Mr. Brown currently serves as the Chair of the Compensation and Benefits Committee. The Compensation and Benefits Committee establishes or recommends compensation plans and programs for senior executives and other employees, reviews the adequacy of such plans and programs, reviews the Company’s compensation policies and practices for all employees, and authorizes employment and related agreements. Though not formally considered by our Board given that our securities are not traded on any national securities exchange, based upon the listing standards of the New York Stock Exchange, the national securities exchange upon which DMFC’s common stock was listed prior to the Merger, we do not believe that the members of our Compensation and Benefits Committee would be considered independent.
109
Table of Contents
Code of Ethics
The Company generally continues to operate under the Standards of Business Conduct adopted by the board of directors of DMFC, which continue to apply to former subsidiaries of DMFC, including the Company. The Standards of Business Conduct apply to all of the Company’s officers, directors and employees and encompass the Company’s code of ethics applicable to its Chief Executive Officer, Chief Financial Officer, and Principal Accounting Officer and Controller. The Standards of Business Conduct are available on the Company’s website at www.delmontefoods.com. A printed copy of the Standards of Business Conduct is also available to any security holder upon written request to the Corporate Secretary, Del Monte Corporation, P.O. Box 193575, San Francisco, California 94119-3575. The Company intends to make any required disclosures regarding any amendments of its code of ethics applicable to its Chief Executive Officer, Chief Financial Officer, and Principal Accounting Officer and Controller or waivers granted to any such officers on its website at www.delmontefoods.com. The Company is in the process of reviewing the Standards of Business Conduct and in the future may revise such standards to reflect the fact that the Company is now a privately held reporting company.
| Item 11. | Executive Compensation |
For purposes of this section of the Annual Report on Form 10-K, fiscal 2011 refers to the combination of the Predecessor period of May 3, 2010 through March 7, 2011 and the Successor period of March 8, 2011 through May 1, 2011.
Compensation Discussion and Analysis
This section of the Annual Report on Form 10-K explains how Del Monte’s executive compensation programs are designed and operate with respect to Neil Harrison, Interim Chief Executive Officer (“Interim CEO”), Larry E. Bodner, Executive Vice President (“EVP”) and Chief Financial Officer (“CFO”), Richard G. Wolford, Former Chief Executive Officer (“Former CEO”), David L. Meyers, Former Chief Financial Officer (“Former CFO”), Nils Lommerin, Chief Operating Officer (“COO”), Timothy A. Cole, EVP, Sales and David W. Allen, EVP, Operations (who are together referred to as our named executive officers). This section also identifies the material elements and objectives of compensation provided to the named executive officers in fiscal 2011, and the reasons supporting such compensation. For a complete understanding of our executive compensation program, this Compensation Discussion and Analysis should be read in conjunction with the Summary Compensation Table and other compensation disclosures included in this Annual Report on Form 10-K.
Other than as specified herein, this discussion primarily reflects the decisions made and actions taken with respect to our compensation programs for fiscal 2011 as conducted by the Compensation Committee of the Board as it existed prior to the consummation of the Merger on March 8, 2011. All references to the “Compensation Committee” in this Compensation Discussion and Analysis are references to the Compensation Committee of our Board as constituted immediately prior to the consummation of the Merger. Following the end of the fiscal year, on June 8, 2011, a new compensation committee of our Board was appointed, the Compensation and Benefits Committee, consisting of Messrs. Brown, Kilts and Mundt. Although we anticipate that the Compensation and Benefits Committee will continue to emphasize similar objectives and philosophies with respect to our compensation plans and programs as discussed herein, we expect that such objectives and philosophies will continue to evolve to reflect our transition to a privately-held company.
Note that the discussion below describes processes applicable in determining the compensation of our named executive officers other than Mr. Harrison, a member of our Board who has served as our Interim CEO following the consummation of the Merger. Mr. Harrison is compensated at a rate of $100,000 per month for his services as Interim CEO and is not entitled to any other compensation.
Overview
Fiscal 2011 Summary
Other than as a result of the impact of the Merger on certain compensation programs and awards, as further described below, the material elements and objectives of Del Monte’s executive compensation program generally did not change from fiscal 2010 to fiscal 2011. In fiscal 2011, Del Monte continued to provide a compensation package for its executive officers consisting generally of base pay, performance-based annual cash incentives, long-term equity incentives (including performance-based equity grants), a limited cash perquisite allowance and supplemental retirement, deferred compensation, severance and change-of-control benefits. Executive compensation packages continued to be based on compensation principles and objectives focused on providing competitive pay opportunities generally targeted at or above the market median (if performance meets target levels) that also served to align executive officers’ efforts with the interests of stockholders.
110
Table of Contents
Effect of the Merger on Certain Compensation Arrangements
Immediately prior to the effective time of the Merger, pursuant to the terms of the applicable plans, all outstanding equity awards became fully vested and exercisable with respect to the maximum number of shares issuable pursuant to such awards. With the exception of the Rollover Options (discussed below under the heading “How were the fiscal 2011 amounts of long-term incentive awards determined?”), each equity award was cancelled as of the effective time of the Merger and converted into the right to receive, for each share subject to the award, an amount in cash equal to the per share merger consideration ($19.00) minus, with respect to options, the applicable exercise price. In addition, the Del Monte Foods Company Deferred Compensation Plan, and that portion of the Del Monte Corporation AIP Deferred Compensation Plan attributable to employee elections, each allowing for deferrals of awards under our Annual Incentive Plan or Program (“AIP”), were terminated and deferral accounts thereunder were distributed.
In connection with the Merger, the Sponsors established a new equity incentive plan at the Parent level. This plan provides for grants of equity awards with respect to Parent common stock to serve as long-term incentives to key employees of Parent and its affiliates, including the Company. Grants made pursuant to this plan in fiscal 2011 are described below. In addition, following negotiations between the applicable executive and the Sponsors, the Company entered into employment agreements with Messrs. Bodner and Allen, similar to the agreements in place with our other named executive officers. Finally, the Merger Agreement provides that, through the end of fiscal 2012, the Company shall continue to provide to employees annual cash compensation levels (including salary and target cash incentive awards) and health, welfare, and retirement benefits that are no less favorable than those provided immediately prior to the closing of the Merger.
Compensation Objectives, Principles and Process
What are Del Monte’s executive compensation program objectives and principles?
The primary objective of Del Monte’s executive compensation program was, in fiscal 2011, and continues to be, to attract and retain executives of exceptional caliber who will provide strong, competitive leadership in the branded-food industry, drive security holders’ value through superior performance, and align their interests with those of our security holders. Toward that end, in fiscal 2011, executive compensation at Del Monte consisted of a portfolio of cash and equity-based elements designed to reward both corporate and individual performance, provide short and long-term incentives and compensate our executives both currently and upon retirement. The following compensation principles developed by the Compensation Committee, approved by our Board of Directors and contained in the Compensation Committee’s Charter prior to the consummation of the Merger, supplemented the compensation objectives described above with respect to fiscal 2011:
| • | Executive compensation packages should be competitive and take into account an individual’s leadership competencies, skills, experience, and sustained performance; |
| • | Base salary generally will be managed to the market median; however, actual incumbent pay may be above or below this standard in order to recognize individual abilities, including performance, job requirements and other factors described above; |
| • | Annual incentive awards should be targeted at the market median, and result in variable pay levels that are linked to corporate and individual performance; |
| • | Long-term incentives should be targeted above the market median (50th-75th percentile) with individual equity awards that recognize an executive’s impact, overall corporate success and the creation of stockholder value; |
| • | The percentage of total compensation that is variable or “at risk” should increase with an executive officer’s overall compensation and grade level; and |
| • | The overall compensation program should align executive officers’ efforts with the interests of stockholders by focusing results on Del Monte’s long-term stock performance and facilitating and encouraging ownership of Del Monte Foods Company common stock. |
What were the Compensation Committee’s processes for setting executive compensation in fiscal 2011?
Historically, including in fiscal 2011, the Compensation Committee reviewed and approved our overall compensation strategy and policies, and annually set the compensation of executive officers. The Compensation Committee made decisions regarding executive compensation with input from the Former CEO, other members of management and an executive compensation consultant engaged
111
Table of Contents
directly by the Compensation Committee for executive compensation purposes. Hewitt Associates, LLC, served as this consultant until January 2010. Thereafter, Exequity, LLP served as the Compensation Committee’s compensation consultant. Under the terms of their engagement by the Compensation Committee, in the event Exequity provided other services to the Company, such services (other than any services on behalf of the Nominating and Corporate Governance Committee) were subject to prior notification and approval of the Compensation Committee or its Chairman. Exequity performed no such services in fiscal 2011.
Benchmarking and Peer Group Comparison. To be able to attract and retain top-level executive officers as we compete for customer programs and mindshare, in fiscal 2011 we aimed to provide total target direct compensation packages (including base salary, an annual incentive award at target and long-term incentive awards at target) to our executive officers, including our named executive officers, that were competitive and consistent with those provided by (1) major branded food and consumer products companies that are similar in size to Del Monte and require comparable leadership competencies, skills, and experiences, and (2) other similar sized organizations that operate in the markets in which we compete for executive talent.
Working with its compensation consultant, the Compensation Committee approved the compensation comparator group, comprising publicly-traded and privately-held companies for such comparison purposes. The Compensation Committee has historically reviewed the compensation comparator group annually, making adjustments as it deemed appropriate. In March 2010, upon consultation with its compensation consultant, the Compensation Committee added Treehouse Foods Inc. to the compensation comparator group, which addition was consistent with criteria applicable to such group, to expand and further balance the peer group. With this adjustment, in fiscal 2011, the compensation comparator group for purposes of target total direct compensation comprised the following companies having median annual revenues of $4.6 billion:
| • Stanley Black & Decker, Inc. |
• Flowers Foods, Inc. |
• Kellogg Company | ||
| • Campbell Soup Company |
• Fortune Brands, Inc. |
• Levi Strauss & Co. | ||
| • Chiquita Brands International, Inc. |
• General Mills, Inc. |
• McCormick & Company, Incorporated | ||
| • Church & Dwight Co., Inc. |
• H.J. Heinz Company |
• Molson Coors Brewing Company | ||
| • The Clorox Company |
• The Hershey Company |
• Ralcorp Holdings, Inc. | ||
| • Corn Products International, Inc. |
• Hormel Foods Corporation |
• Treehouse Foods, Inc. | ||
| • Dole Food Company, Inc. |
• The J.M. Smucker Company |
• Williams-Sonoma, Inc. |
Determinations of total target direct compensation for Del Monte’s executive officers began with management’s identification of the responsibilities, leadership competencies, technical skills and experience required for each particular executive position. The Compensation Committee then reviewed a comparative analysis with respect to each executive position, based on the competitive data, analysis and advice supplied by its compensation consultant for the compensation comparator group. If no comparable position was identified in the compensation comparator group, the Compensation Committee looked to other publicly available or survey data provided by its compensation consultant, as well as internal comparisons to other executives, to determine an appropriate competitive compensation level. For example, a Del Monte executive position may be mapped to a general industry position with similar impact, scope and rank in the corporate hierarchy. In general, the average total target direct compensation of our named executive officers (excluding Mr. Harrison) fell slightly above the median of the compensation comparator group.
Individual and Corporate Performance Assessment. The Compensation Committee also considered an executive officer’s individual performance, experience and contribution to overall corporate success in adjusting base salaries and establishing incentive compensation. For the named executive officers (other than Messrs. Harrison and Bodner who were not then named executive officers), the Compensation Committee reviewed tally sheets detailing the value, earnings and accumulated potential payout of each element of the executive’s compensation, including equity awards. Each tally sheet also summarized retirement benefits and quantified the benefits we are required to provide under various employment termination scenarios, including termination upon change of control. The tally sheets were informational and helped the Compensation Committee to track changes in each named executive officer’s total direct compensation from year-to-year and to remain aware of the compensation historically paid to each executive officer. Company performance, while considered in adjusting base salaries and granting equity awards, was more specifically reflected in annual incentive award determinations as described in more detail below in the discussion under the heading “How were the fiscal 2011 cash annual incentive awards determined?”
112
Table of Contents
What percentage of a named executive officer’s target total direct compensation is at-risk?
In fiscal 2011, the percentage of target total direct compensation allocated to “at-risk” compensation (in the form of targeted annual and long-term incentive awards) for our named executive officers was approximately as follows:
| • CFO |
67 | % | ||
| • Former CEO |
83 | % | ||
| • Former CFO |
69 | % | ||
| • COO |
76 | % | ||
| • EVP, Sales |
69 | % | ||
| • EVP, Operations |
68 | % |
The Compensation Committee did not apply specific allocations between cash and equity-based compensation or between short-term and long-term compensation when setting each year’s total direct compensation package. However, the at-risk allocations approved for fiscal 2011 reflected the Company’s intention that a large majority of the total direct compensation of Del Monte’s executives should be tied to the Company’s performance and that at-risk allocation should increase based on compensation and grade level.
What were the roles of the Compensation Committee, compensation consultant and management in determining executive compensation?
In fiscal 2011, executive compensation was set by the Compensation Committee, with support provided by its compensation consultant, the Former CEO and other members of management. In fiscal 2011, both the compensation consultant and the Former CEO attended portions of all the regularly scheduled Compensation Committee meetings. The processes of the compensation comparator group analysis and performance assessments described above were used to evaluate the compensation of our executive officers. Generally, this process included any necessary updates to executive position descriptions based upon management’s (including the Former CEO’s) identification of the responsibilities, leadership competencies, technical skills and experience required for each executive officer position. Any changes made to these executive position descriptions were discussed with and approved by the Compensation Committee. The compensation consultant then compiled the compensation peer group comparator data and market survey data relevant to the executive position descriptions provided by management and submitted them to the Compensation Committee for its consideration. The Compensation Committee determined base salary and target levels of annual and long-term incentives for each of the named executive officers (other than Mr. Harrison) after considering the compensation comparator group data and other individual and Company factors, as discussed further below in “Components of Executive Compensation.” In connection with the Compensation Committee’s determination, the Former CEO typically provided the Compensation Committee with his insights regarding these other individual and Company factors that may impact base salary and annual incentive and long-term incentive targets for the other executive officers. The Former CEO’s base salary and incentive compensation were determined during an executive session where only the Compensation Committee members and the compensation consultant were present. The Former CEO’s annual base salary and target annual and long-term incentive awards were further subject to review and approval by the independent members of the Board.
113
Table of Contents
Components of Executive Compensation
What were the key elements of Del Monte’s executive compensation program in fiscal 2011?
For fiscal 2011, named executive officer compensation consisted principally of the elements identified in the following chart in addition to the health, welfare and retirement plans and programs generally available to all salaried employees:
| Compensation Element | Objectives in Fiscal 2011 | Key Features in Fiscal 2011 | ||||
| Base Salaries |
• Provide a fixed-level of cash compensation upon which executives can rely. |
• Targeted to the median of the base salaries of the compensation comparator group.
• Individual salaries may be above or below the compensation comparator group median to reflect the individual competencies, skills, experience and sustained performance of the executive holding this position.
| ||||
|
Performance-Based, Cash Annual Incentives (Annual Incentive Plan) |
• Link annual corporate and business priorities with individual and group performance goals.
• Tie financial rewards to measurable achievements, reinforcing pay-for-performance.
• Reward individual performance.
• Provide a variable award opportunity that attracts, retains and motivates our leadership and key employees. |
• Cash incentive payments based on a fixed target percentage of base salary during the fiscal year.
• Target awards (established as a percentage of base salary) were targeted at the median of the annual incentive opportunities of the compensation comparator group.
• Corporate performance objectives were based on measurable financial metrics (i.e., adjusted EPS, net sales and cash flow).
• Individual performance objectives were designed to reward an executive’s execution against critical business priorities.
| ||||
114
Table of Contents
| Compensation Element | Objectives in Fiscal 2011 | Key Features in Fiscal 2011 | ||||
| Long-Term Equity Incentives |
• Align the interests of management with those of our stockholders.
• Retain the services of our executive team for an extended term.
• Reward achievement of our strategic objectives. |
• Long-term incentives were provided by annual grants of three types of equity awards under the Del Monte Foods Company 2002 Stock Incentive Plan. The targeted value mix of these three types of awards in fiscal 2011 was: 40% stock options, 20% restricted stock units, and 40% performance share units.
• Target value was intended to provide compensation above the market median (50th-75th percentile) of the long-term incentive values of the compensation comparator group, reflecting Del Monte’s compensation philosophy’s emphasis on at-risk compensation.
• In connection with the Merger, equity awards under the Del Monte Foods Company 2002 Stock Incentive Plan were vested in full and converted to immediate cash payments, with the exception of certain options rolled into a new equity incentive plan.
• Following the consummation of the Merger, long-term incentives are provided by Parent, which makes grants of Parent stock options under the 2011 Stock Incentive Plan for Key Employees of Blue Acquisition Group, Inc. and its Affiliates.
| ||||
| Perquisites—Cash Allowance |
• Generally eliminate and replace previously-offered in-kind perquisites.
• Provide a limited cash allowance to executives to compensate for certain in-kind perquisites provided by peer companies and for certain in-kind perquisites eliminated by Del Monte.
|
• Certain limited in-kind perquisites were also provided.
• Cash perquisite allowances are excluded from an executive’s fiscal year earnings when calculating annual incentive awards or other benefits.
| ||||
| Retirement Benefits |
• Offer competitive retirement income for executive officers in order to attract and retain experienced executive talent.
• Supplement benefits provided under our qualified retirement plans, so that each executive officer receives the full benefit commitment that Del Monte intended.
• Provide executives with a value of retirement benefits closer to the Company’s total compensation philosophy of paying at the 50th percentile among the compensation comparator group. |
• Additional Benefits Plan provides executive officers with benefits that may not be provided under our qualified pension plan or 401(k) plan because of the limits on compensation and benefits imposed by the Internal Revenue Code.
• Supplemental Executive Retirement Plan (SERP) provides a defined retirement benefit for executives based on a multiple of the executive’s final average compensation, less the amount of any other accrued pension benefits.
• Generally, SERP benefits vest after a minimum of 5 years of service and attainment of age 55.
| ||||
115
Table of Contents
| Compensation Element | Objectives in Fiscal 2011 | Key Features in Fiscal 2011 | ||||
| Deferred Compensation Benefits |
• Provide a voluntary, unfunded capital accumulation benefit to defer payment and taxation of earned income to a future date—a benefit commonly provided at the peer companies. |
• Del Monte Foods Company Deferred Compensation Plan allowed executives to defer from 5% to 100% of the amount of executive’s AIP payment.
• The plan was terminated in connection with the Merger and all deferral accounts were distributed.
| ||||
|
Termination and Change-of-Control Benefits |
• Retain the services of our executive team through competitive total compensation packages.
• Avoid the disruption of business associated with litigation (even if groundless) or change of control uncertainty.
• Maintain commitment and focus of executives during periods of uncertainty and ease transition of service for executives impacted by change of control. |
• Severance benefits paid pursuant to a named executive officer’s Employment Agreement or, if applicable, Del Monte’s Executive Severance Plan.
• Cash lump sum payment equal to a multiple of base pay, target AIP and, for certain executives, perquisite allowance based on executive’s level in the Company.
• Pro-rata AIP payment for year of termination.
• Continuation of health benefits for period of severance.
• Pro-rata vesting of equity awards.
| ||||
How were the fiscal 2011 base salaries determined?
As described above, in September 2010, base salaries for three of our named executive officers – our Former CEO, Former CFO, and COO—were compared to the median salaries, by position, of our compensation comparator group. Based on information provided by Exequity and management, our EVP, Sales, our then EVP, Finance (who was appointed in March 2011 to the role of EVP and CFO), and our EVP, Operations were determined by the Compensation Committee to hold positions having a unique combination of functional scope and high level executive impact on Del Monte’s broader corporate strategy, as compared to the top similar positions identified in Del Monte’s compensation comparator group companies (which typically report at the group or division level and not the entire company). Therefore, the Compensation Committee targeted the EVP, Sales compensation to the fifth highest paid proxy position from Del Monte’s compensation comparator group, and relied on internal comparisons in setting compensation with respect to our then EVP, Finance and our EVP, Operations.
Pursuant to this process, and also taking into consideration each named executive officer’s individual performance, experience and contribution to overall corporate success, the Compensation Committee reviewed, with the assistance of its compensation consultant, all elements of total direct compensation for the Company’s named executive officers and approved salary increases for the named executive officers in fiscal 2011 as follows:
| • Former CEO |
0 | % | ||
| • Former CFO |
2.8 | % | ||
| • COO |
4.0 | % | ||
| • EVP, Sales |
2.6 | % | ||
| • EVP, Finance (subsequently appointed CFO) |
3.5 | % | ||
| • EVP, Operations |
3.5 | % |
Effective March 8, 2011, our EVP, Finance was appointed as EVP and CFO. In connection with such promotion and his entry into a new employment agreement negotiated with the Sponsors, his base salary was increased by an additional 14.77%.
Mr. Harrison’s compensation for his services as Interim CEO (at a rate of $100,000 per month) was determined pursuant to agreement between Mr. Harrison and Parent, negotiated by the Sponsors.
116
Table of Contents
How were the fiscal 2011 cash annual incentive awards determined?
Under the AIP, management employees, including the named executive officers (other than Mr. Harrison), were eligible to earn cash incentive payments based on a fixed target percentage of base salary during the fiscal year if corporate and individual performance objectives for the fiscal year were attained. The target percentage of any executive’s base pay increased with the scope of the executive’s responsibility. The Compensation Committee approved the corporate performance objectives and related targets, as well as the executive officers’ individual performance objectives, within the first quarter of the fiscal year.
For fiscal 2011, the Compensation Committee chose adjusted EPS from continuing operations, net sales and adjusted cash flow as the AIP corporate objectives because it believed that these metrics were critical to Del Monte’s overall corporate and operational performance, reinforced management focus on the annual business plan and, together, drove long-term stockholder value creation. Consistent with its compensation principles, the Compensation Committee weighted corporate objectives higher than individual objectives for more senior executives. In fiscal 2011, at its regularly scheduled June 2010 meeting, the Compensation Committee reviewed the relative weighting of the AIP corporate and individual performance objectives and the target award percentages for AIP participants and determined that no changes to the target award percentages from fiscal 2010 were warranted.
The following table shows each named executive officers’ fiscal 2011 target award, which is expressed as a percentage of his base salary. The target award is the projected amount the executive would receive for scores of 100% for each of the corporate performance objectives plus achieving a score of 100% for his individual objectives. The table also includes the relative weighting of each objective as a percentage of the total award opportunity.
Target Annual Incentive Award Percentages and Relative Weight of Objectives.
| Target Award as a Percentage of Base Salary (1) |
Corporate Performance Objectives | |||||||||||||||||||||||
| Name |
Adjusted EPS | Net Sales | Adjusted Cash Flow (2) |
Individual Performance Objectives |
||||||||||||||||||||
| Richard G. Wolford |
110.0% | 51.0% | 8.5 | % | 25.5 | % | 15.0 | % | ||||||||||||||||
| Nils Lommerin |
80.0% | 51.0% | 8.5 | % | 25.5 | % | 15.0 | % | ||||||||||||||||
| David L. Meyers |
70.0% | 51.0% | 8.5 | % | 25.5 | % | 15.0 | % | ||||||||||||||||
| Timothy A. Cole |
70.0% | 51.0% | 8.5 | % | 25.5 | % | 15.0 | % | ||||||||||||||||
| Larry E. Bodner (3) |
63.75% | 51.0% | 8.5 | % | 25.5 | % | 15.0 | % | ||||||||||||||||
| David W. Allen |
62.5% | 51.0% | 8.5 | % | 25.5 | % | 15.0 | % | ||||||||||||||||
| 85.0 | % | 15.0 | % | 100.0 | % | |||||||||||||||||||
| (1) | For purposes of calculating AIP awards, base salary is an executive’s total fiscal year base pay earnings. This excludes annual incentive awards, perquisites and perquisite allowances, special awards, and other non-base salary compensation. |
| (2) | Adjusted cash flow, a non-GAAP measure, is cash provided by operating activities less cash used in investing activities, adjusted to exclude the impact on the period’s consolidated statement of cash flows of large acquisition or divestiture transactions, including the Merger. In fiscal 2011, cash provided by operating activities and cash used in investing activities were adjusted by adding back $86 million and $3,857 million, respectively, to adjust for the impact of expenditures in connection with the Merger. |
| (3) | Mr. Bodner’s target award as a percentage of base salary was increased from 62.5% to 70% on March 8, 2011 in connection with his appointment as CFO. 63.75% represents the pro-rata blended target percentage. |
Fiscal 2011 Performance against Corporate and Individual Objectives. Although target award amounts under the AIP generally were intended to provide compensation at the median of the compensation comparator group, actual payouts could vary depending upon the extent to which corporate and individual performance objectives were achieved and upon an executive’s unique contributions, if any. In addition, the Compensation Committee could reduce the amount of any award payable to an executive officer under the AIP.
Corporate Performance Objectives—When setting corporate objectives and the related targets, the Compensation Committee also established threshold and maximum achievement levels, creating a performance range for each component of the corporate objective portion of the AIP as identified in the graphs below. For fiscal 2011, the Compensation Committee approved the performance range for adjusted EPS and adjusted cash flow at 85% to 115% of target, while establishing the range for net sales at 96% to 104% of target. Actual performance below the threshold would have resulted in no payout for that particular objective. Additionally, the Company’s actual adjusted EPS was required to meet or exceed the adjusted EPS threshold for any payment to be made with respect to the net sales target, regardless of whether or not the net sales threshold was achieved. If none of the corporate objective thresholds had been achieved, no AIP award would have been made, regardless of whether or not individual objectives had been achieved. This design feature reinforced our priority for achieving overall results and sustained profitability for stockholders before any incentives are awarded. Potential scores for the corporate objectives ranged from 0% to 200% of the target award; however, for fiscal 2011, no individual payment under the AIP could exceed $3 million.
117
Table of Contents
Overall, the Compensation Committee sought to establish target corporate performance objectives that would be challenging yet attainable, based on the Company’s annual operating plan for the year, which in turn reflected the Company’s strategies and long-term plans. For fiscal 2011, the Compensation Committee established an adjusted EPS target of $1.40, a net sales target of $3,874.4 million, and a cash flow target of $265.0 million.
As a result of the Merger, the Company no longer reported EPS at the end of fiscal 2011. Accordingly, for purposes of scoring the adjusted EPS measure applicable under the AIP, a representative adjusted EPS was calculated by dividing net income, adjusted to exclude the impact from the Merger, by a share number consisting of the actual outstanding number of shares at the end of the second quarter of fiscal 2011, plus the projected number of dilutive shares from the Company’s last internal forecast prior to the announcement of the Merger. The Company believes these adjustments and estimated shares best estimate the exclusion of the impact from the Merger on the adjusted EPS. As scored by the current Compensation and Benefits Committee of the Board, the representative adjusted EPS result was $1.47, exceeding target and resulting in a score of 133%. The Compensation and Benefits Committee scored adjusted cash flow at $333.8 million, significantly in excess of target and resulting in a score of 200%. Net sales were $3,662.5 million, resulting in a score of 0%. In total, these results culminated in a total corporate performance score exceeding target at 140%.
The following graphs illustrate the actual scores associated with achieving the fiscal 2011 corporate performance objectives compared to the established threshold, target, and maximum goals:
| Adjusted Earnings Per Share |
Net Sales | |||
|
|
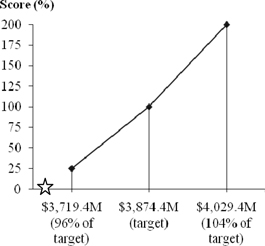
|
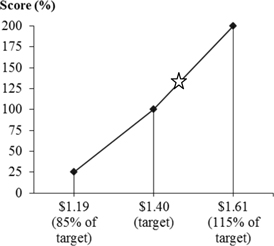
| Adjusted Cash Flow |
||||
|
|
||||
|
|
||||
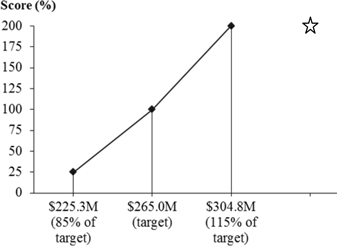
 Fiscal 2011 Performance
118
Table of Contents
Individual Performance Objectives—Like corporate objectives, individual performance objectives were intended to challenge executives with goals that contribute to the achievement of the annual operating plan and improve Company performance. The named executive officers’ individual performance objectives reflected their areas of responsibility. Historically, individual performance for each AIP participant was individually assessed and scored over a six-week period following the end of the fiscal year. However, in June 2011, with input from management, the Compensation and Benefits Committee agreed to assign a common individual performance score of 110% to all AIP participants, including the participating named executive officers, with the exception of select individuals below the senior executive level whose scores were adjusted upward in recognition of key individual contributions. This was done in recognition of the significant time and effort expended company-wide throughout the second half of fiscal 2011 in connection with the Merger, as well as to ease administrative burden by eliminating the scoring process during a time when the transition to our new corporate structure following the Merger continued to require considerable focus on the part of management.
What were the fiscal 2011 AIP Payments for the named executive officers?
The Compensation and Benefits Committee determined the payout of awards under the AIP with respect to fiscal 2011. Based on weighting of the corporate and individual objective scores, the named executive officers received overall AIP scores and awards for fiscal 2011 as set forth below.
| Name |
Overall Annual Incentive Plan Score |
Target Award as a Percentage of Base Salary |
Actual Award as a Percentage of Base Salary |
|||||||||
| Richard G. Wolford |
135.5 | % | 110.00 | % | 149.05 | % | ||||||
| Nils Lommerin |
135.5 | % | 80.00 | % | 108.40 | % | ||||||
| David L. Meyers |
135.5 | % | 70.00 | % | 94.85 | % | ||||||
| Timothy A. Cole |
135.5 | % | 70.00 | % | 94.85 | % | ||||||
| Larry E. Bodner |
135.5 | % | 63.75 | % | 86.38 | % | ||||||
| David W. Allen |
135.5 | % | 62.50 | % | 84.69 | % | ||||||
Mr. Harrison did not participate in the AIP. The dollar amounts of the actual AIP awards to the named executive officers for fiscal 2011 are reported in the Non-Equity Incentive Plan Compensation column in the Summary Compensation Table.
How were the fiscal 2011 amounts of long-term incentive awards determined?
After a review of competitive long-term incentive market practice trends, in September 2010, the Compensation Committee determined that equity awards for the named executive officers would be split between stock options, restricted stock units, and performance share units. The targeted value mix of these three types of awards in fiscal 2011 was: 40% stock options, 20% restricted stock units, and 40% performance share units. The Compensation Committee believed this mix of options, restricted stock units and performance share units provided a balanced risk and reward structure, with various vesting horizons and an emphasis on performance. Overall, the Compensation Committee determined that this equity mix, with a total value targeted to provide long-term incentive award compensation above the market median (50th – 75th percentile), served to further align the goals of management with those of our stockholders and reinforce the principles of pay for performance. Prior to fiscal 2011, long-term incentive awards included grants of performance accelerated restricted stock awards (“PARS”), structured as restricted stock units subject to service-based vesting with potential for accelerated vesting based on pre-established relative total shareholder return (“RTSR”) targets. In fiscal 2011, in recognition of the fact that the RTSR-based vesting triggers under the PARS and performance shares were duplicative, the Compensation Committee replaced PARS awards with awards of restricted stock units subject to service-based vesting.
In determining the grant size of the Company’s option, restricted stock unit and performance share unit awards, the Compensation Committee also considered each named executive officer’s level of responsibility and individual performance, impact, potential, and existing awards, in addition to long-term incentives available at our peer companies. Equity grants for the named executive officers in fiscal 2011 are listed in the table under “— Fiscal 2011 Grants of Plan-Based Awards.”
The Compensation Committee did not make any changes in fiscal 2011 to the structure of our option grants, which provided four-year vesting in equal annual installments with ten-year terms. The restricted stock units were subject to service-based vesting over a four-year period, with one-quarter of the units vesting on each of the second and third anniversaries of the grant date, and the remainder vesting on the fourth anniversary of the grant date. The fiscal 2011 performance share unit awards provided cliff vesting or forfeiture upon the filing of the Company’s Annual Report on Form 10-K for fiscal 2014, depending on Del Monte’s achievement over the three-year performance period of fiscal 2011 through fiscal 2014 of pre-established RTSR targets.
119
Table of Contents
As further discussed below under the heading “Was there any vesting of long-term incentive awards in fiscal 2011?,” the terms of all of Del Monte’s then-outstanding equity awards provided for full acceleration upon the occurrence of a change in control transaction. Accordingly, all equity awards accelerated and vested in full in connection with the Merger.
In connection with the Merger, the Sponsors established, at the Parent level, the 2011 Stock Incentive Plan for Key Employees of Blue Acquisition Group, Inc. and its Affiliates (“2011 Plan”), providing for grants of equity incentive awards to key employees of Parent and its affiliates, including Del Monte. A portion of their Del Monte stock options were rolled by members of management (including Messrs. Bodner, Lommerin, Cole, and Allen) into the 2011 Plan and converted into options to purchase common shares of Parent (“Rollover Options”), which together with shares purchased (in the case of Messrs. Bodner and Lommerin) were intended to fulfill investment expectations set forth by the Sponsors. In recognition of their investment, Parent granted each such member of management a stock option to purchase a number of shares of Parent common stock (“Matching Options”). The number of Matching Options granted was determined by dividing the value of the prior Del Monte options rolled into the 2011 Plan by such member of management (calculated as the option spread) by the fair market value of Parent common shares. With respect to half of the underlying shares of Parent common stock, the Matching Options are subject to service-based vesting in five equal installments on each of the first five anniversaries of the closing of the Merger, March 8, 2011. With respect to the remainder of the underlying shares, the Matching Options generally vest at the end of each of fiscal years 2012 through 2016 if Parent achieves a pre-determined EBITDA-related financial target with respect to such fiscal year. In the event any such annual target is not achieved with respect to fiscal years 2012 through 2015, that portion of the Matching Options that would have become vested pursuant to the achievement of such target may nevertheless vest at the end of the subsequent fiscal year if Parent achieves the applicable cumulative EBITDA-related financial target. In addition, pursuant to the terms of the Rollover Option agreements, each individual who entered into such an agreement (including Messrs. Bodner, Lommerin, Cole, and Allen) is entitled to receive an additional grant of options under the 2011 Plan. The number of such options to be received by each individual will be determined by the Board, in consultation with the CEO, and will fall within a predetermined range set forth in such individual’s Rollover Option agreement.
Was there any vesting of long-term incentive awards in fiscal 2011?
Pursuant to the terms and conditions of the equity awards, immediately prior to the effective time of the Merger, all outstanding equity awards became fully vested and exercisable with respect to the maximum number of shares issuable pursuant to such awards. With the exception of the options converted into Rollover Options, each equity award was cancelled as of the effective time of the Merger and converted into the right to receive, for each share subject to the award, an amount in cash equal to the per share merger consideration ($19.00) minus, with respect to options, the applicable exercise price.
What is Del Monte’s process regarding the timing of stock option grants?
Prior to the Merger, the Compensation Committee generally granted stock options to current executive officers and key employees annually at the time of the Annual Meeting of Stockholders. The exercise price of all options was the fair market value of our common stock on the grant date, determined in accordance with our equity incentive plan to be the average of the high and low prices of Del Monte Foods Company (“DMFC”) common stock on the New York Stock Exchange on such date. In addition to the annual long-term incentive awards, the Compensation Committee typically awarded “new hire” option grants to executive officers. In fiscal 2011, there were no “new hire” grants made to any named executive officer.
As described above, certain members of management rolled a portion of their Del Monte stock options into the new 2011 Plan. These options were converted into Rollover Options under the 2011 Plan upon the consummation of the Merger. The exercise price and number of shares subject to such Rollover Options were determined in accordance with applicable tax rules governing the conversion of options in the context of a change in control transaction. In addition, upon consummation of the Merger, such members of management were granted Matching Options, as further described above under “How were the fiscal 2011 amounts of long-term incentive awards determined?,” with an exercise price equal to the then-current fair market value of Parent common stock.
How were fiscal 2011 perquisite allowances determined?
Del Monte’s perquisite cash allowance plan for executive officers was established in fiscal 2005 with specific annual, cash allowance tiers based on an executive’s level in the Company. In subsequent years, the Compensation Committee continued to administer the perquisite plan pursuant to the allowance tiers and amounts established in 2005, which remained unchanged. Accordingly, in fiscal 2011, the named executive officers were entitled to annual cash perquisite allowances in the following amounts:
| • CEO |
$ | 42,000 | ||
| • COO/CFO/EVP |
$ | 36,000 |
Messrs. Wolford and Meyers received pro-rata portions of their annual allowances reflecting service through March 8, 2011. Mr. Harrison did not participate in the perquisite cash allowance plan.
120
Table of Contents
In addition to the cash allowances described above, the Company provided supplemental group health care benefits, pursuant to employment agreements, to Messrs. Wolford and Meyers and their covered dependents through its Executive Medical Reimbursement Plan (EMRP), and, in connection with the Merger, provided outside legal counsel to the senior management team, including the named executive officers (but excluding Messrs. Harrison, Wolford, and Meyers), to assist with negotiation of post-Merger compensatory and related arrangements. These items are reflected in the Summary Compensation Table as All Other Compensation.
Our executives received certain benefits that are deemed to be taxable income to the individuals by the IRS. When we believe that such income is incurred for purposes more properly characterized as Company business than personal benefit, we provide further payments to the executives to reimburse the cost of the inclusion of such item in the executives’ taxable income. Most often, these tax gross-up payments are provided for travel by a family member or other personal guest of an executive to attend a meeting or function in furtherance of Company business, such as annual sales meetings or Grocery Manufacturers Association meetings where spouses or other guests are invited or expected to attend.
Does Del Monte provide supplemental retirement and deferred compensation benefits to its executives?
In addition to qualified plan retirement benefits, executive officers also are eligible to participate in nonqualified excess and supplemental executive retirement programs, specifically, the Additional Benefits Plan and Supplemental Executive Retirement Plan (“SERP”), and in fiscal 2011, were eligible to participate in a deferred compensation plan—the Del Monte Foods Company Deferred Compensation Plan. As described above in “Components of Executive Compensation—What are the key elements of Del Monte’s executive compensation program?,” these executive retirement benefits, taken together, were intended to be competitive with market practice and provide executives with a target value of benefits closer to our total compensation philosophy of paying at the 50th percentile among our compensation comparator group.
In fiscal 2011, executives were able to defer all or part of their AIP award under the Del Monte Foods Company Deferred Compensation Plan (“DMFC Deferred Compensation Plan”); however, in connection with the consummation of the Merger, the DMFC Deferred Compensation Plan was terminated and all deferred accounts thereunder were distributed.
The Additional Benefits Plan is discussed in detail under “—Fiscal 2011 Pension Benefits—Narrative Discussion of Plans Reflected in Fiscal 2011 Pension Benefits Table” and “—Fiscal 2011 Nonqualified Deferred Compensation—Narrative Discussion of Plans Reflected in Fiscal 2011 Nonqualified Deferred Compensation Table.” The SERP is discussed further under “—Fiscal 2011 Pension Benefits—Narrative Discussion of Plans Reflected in Fiscal 2011 Pension Benefits Table.” The DMFC Deferred Compensation Plan is discussed further under “—Fiscal 2011 Nonqualified Deferred Compensation—Narrative Discussion of Plans Reflected in Fiscal 2011 Nonqualified Deferred Compensation Table.”
How are severance and change-of-control benefits for executives determined?
As described more fully in “—Potential Payments upon Employment Termination and Change-of-Control Events,” Messrs. Bodner, Lommerin, Cole, and Allen are entitled to certain benefits in the event of an employment termination or change in control of the Company pursuant to the terms of their respective employment agreements and the Company’s annual and long-term incentive plans. The severance benefits offered to our named executive officers serve our overall compensation objectives by providing a total competitive compensation package that assists in recruiting and retaining executive officers. Likewise, our change-of-control benefits are expected to align executive efforts and stockholder interests by retaining key executives as needed during any transition period.
In general, for our named executive officers, our change-of-control benefits have included a tax gross-up payment in connection with Internal Revenue Code Section 280G (referred to as the 280G gross-up). The Company periodically reviews its severance and change in control policies in light of evolving market practices. In fiscal 2010, the Company amended the Executive Severance Plan to eliminate the 280G gross-up for all employees who become subject to the plan after September 25, 2008 (the date of Del Monte’s 2008 Annual Meeting of Stockholders), unless such employee was party to an employment agreement on September 25, 2008 that provided for a 280G gross-up. In fiscal 2011, the Company amended all gross-up arrangements to clarify that the gross-ups apply to all payments that may be deemed parachute payments, regardless of form.
In connection with Mr. Wolford’s retirement and Mr. Meyers’ resignation from Del Monte following the consummation of the Merger, Messrs. Wolford and Meyers each received severance and change in control benefits, as described more fully in “— Potential Payments upon Employment Termination and Change-of-Control Events.”
121
Table of Contents
Other Executive Compensation Matters
Are executives subject to any stock ownership guidelines?
Consistent with Del Monte’s commitment to aligning the interests of its executives and stockholders, prior to the consummation of the Merger, the Compensation Committee maintained stock ownership guidelines for executive officers. Pursuant to these guidelines, executives were encouraged, within five years of adoption of the guidelines or their subsequent date of hire or promotion to an executive position, to own shares of Del Monte Foods Company common stock generally equal in value to a multiple of annual base salary depending on their level in the Company. The executive officer stock ownership guidelines, as applicable to the named executive officers, were as follows:
| • CEO |
Five times annual base salary in effect on July 1, 2004 | |
| • COO |
Three times annual base salary in effect on January 1, 2008 | |
| • CFO |
Three times annual base salary in effect on July 1, 2004 | |
| • EVP, Sales |
One times annual base salary in effect on September 6, 2004 | |
| • EVP, Operations |
One times annual base salary in effect on June 5, 2006 | |
These guidelines also encouraged executives to hold shares acquired upon exercise of stock options or vesting of restricted stock units, equal to the profit (net of taxes) attributable to such exercises or vesting, for one year after such exercise or vesting. Following the Merger and the merger of Del Monte Foods Company with and into Del Monte Corporation, these guidelines ceased to apply to our executives.
What is Del Monte’s policy on “clawback” or recovery of compensation?
Pursuant to the terms of the AIP, AIP payments are subject to a recoupment policy allowing the Company to recover compensation from executive officers of the Company, including the named executive officers, if the Company restates any financial report that, due to such officers’ misconduct, was materially noncompliant with federal securities laws when filed. The Compensation Committee also retains the discretion to determine whether any portion of the AIP payments or profits of the executive officers who did not engage in the misconduct resulting in a restatement should be subject to repayment in order to prevent unjust enrichment.
What is Del Monte’s policy on Internal Revenue Code Section 162(m)?
During fiscal 2011, prior to the consummation of the Merger, the Company’s ability to deduct compensation it paid to each named executive officer was generally limited, under Section 162(m) of the Internal Revenue Code, to $1 million annually. However, compensation above $1 million was eligible for deduction if it met certain technical requirements to be classified as “performance-based compensation.”
Stock options and certain other awards, such as the performance share units granted in fiscal 2011, as well as that portion of the AIP awards relating to corporate performance objectives, generally were designed to qualify as performance-based compensation. The Compensation Committee’s policy with respect to Section 162(m) sought to balance the interests of the Company in maintaining flexible incentive plans and the Company’s benefit from the compensation package paid to any executive officer against the possible loss of a tax deduction relating to such compensation and the Company’s obligations under binding employment agreements with its executives. Following the consummation of the Merger, Del Monte is no longer subject to the limitations imposed by Section 162(m) as it is no longer a publicly traded company.
122
Table of Contents
REPORT OF THE COMPENSATION AND BENEFITS COMMITTEE
The Compensation and Benefits Committee has reviewed and discussed the materials under the caption “Compensation Discussion and Analysis” included in this Annual Report on Form 10-K with the management of Del Monte. Based on such review and discussion, the Compensation and Benefits Committee has recommended to the Board of Directors that such Compensation Discussion and Analysis be included in this Annual Report on Form 10-K for the twelve months ended May 1, 2011.
The Compensation and Benefits Committee
Simon E. Brown
James M. Kilts
Kevin A. Mundt
The foregoing Report is not soliciting material, is not deemed filed with the SEC and is not to be incorporated by reference in any filing of the Company under the Securities Act of 1933, as amended, or the Securities Exchange Act of 1934, as amended, whether made before or after the date hereof and irrespective of any general incorporation language in any such filing.
Compensation Risk Assessment
A significant portion of our executive compensation program consists of performance-based compensation, including cash awards tied to corporate performance and equity awards, the vesting of which is determined according to company performance goals. In addition, we maintain various incentive programs for our non-executive employee population intended to motivate and reward exceptional performance. We believe that these structures help ensure that our compensation programs do not encourage inappropriate risk-taking that may harm the Company or its security holders.
The Compensation and Benefits Committee monitors compensation-related risk and strives to ensure that our compensation programs are designed and administered in a way that will not encourage excessive or unnecessary risk-taking or exacerbate the risks inherent in any performance-based incentive program. In designing executive compensation packages, our prior Compensation Committee historically sought, and the Compensation and Benefits Committee currently seeks, to mitigate the potential for unnecessary risk-taking by creating an appropriate mix of fixed compensation and variable incentives that depend on both short-term and long-term performance goals intended to align the interests of our executives with those of the Company, drive performance against our annual operating plan, and reflect necessary market-competitive pay levels and practices. In such design process, the Compensation and Benefits Committee considers the input of internal compensation, risk and audit specialists, and an outside compensation consultant.
In calendar 2011, several members of our management team, including members of our Law, Human Resources and Internal Audit departments, in conjunction with an outside compensation consultant, conducted an assessment of our compensation programs, policies, and practices, both at the executive and non-executive level, in order to evaluate the risk profile of such arrangements and determine whether any of our compensation policies or practices create risks that are reasonably likely to have a material adverse effect on the Company. The Compensation and Benefits Committee reviewed the result of the assessment, specifically considering the governance structure and approval mechanisms of compensation elements, whether incentives are appropriately linked to security holder value and overall corporate success, the function of a particular award within an individual’s compensation mix, what controls exist on participant action and payout (including whether we retain discretion to reduce award amounts), and what other specific risk-mitigating factors are in place with respect to each compensation element.
In its review of the assessment, the Compensation and Benefits Committee noted multiple risk-mitigating features and effective safeguards against imprudent or unnecessary risk-taking, including the following:
| • | Balanced Compensation Mix |
We provide a balanced mix of fixed versus variable, and short-term versus long-term, compensation elements. Our target annual cash incentive awards do not comprise a disproportionate share of target total direct annual executive compensation (base salary, annual incentive, estimated value of long-term incentive awards), protecting against over-emphasis of short-term results and promoting sustainability of performance.
– Base salary: We provide market-competitive base salaries in order to provide a fixed level of cash compensation upon which employees can rely and ensure meaningful compensation amounts that do not encourage inappropriate risk taking.
123
Table of Contents
– Annual incentive awards: Annual cash incentive awards under our Annual Incentive Program (AIP) are tied to corporate financial targets designed to reflect our strategies, business priorities and long-term plans, and do not rely on a single performance measure.
– Long-term incentive awards: Our long-term incentive awards are designed to provide a balanced risk and reward framework, and to reward achievement of our strategic objectives. The service-based vesting aspect of these awards promotes retention and encourages continued service according to our values and Standards of Business Conduct, while the performance-based aspect of these awards places an emphasis on significant and sustainable performance over various long-term time horizons, reducing the possibility of achieving gains through short-term risk-taking.
| • | Attainability of Performance Targets |
Overall, the Compensation and Benefits Committee seeks to establish target corporate performance objectives that, while challenging, are attainable through sound executive behavior focused on value creation and growth reflective of our annual business plan, without engaging in inappropriate risk-taking to achieve target payout.
| • | Maximum AIP Payouts |
There is a maximum limit to each eligible individual’s annual cash incentive payout opportunity under the AIP, which in turn limits an individual’s ability to increase payout by engaging in inappropriate risk-taking.
| • | Annual Incentive Awards at-Risk |
The Compensation and Benefits Committee (with respect to any executive officer) and the Company (with respect to any other individual) has the discretion to reduce the amount of any annual incentive award payout for any reason, including a determination that unreasonably risky behavior has occurred.
| • | Third-Party Compensation Consultant |
The prior Compensation Committee utilized the advice of an outside compensation consultant in determining current compensation pay structures and amounts. Among other services, the compensation consultant advised with respect to compensation practices and procedures that can help minimize risks presented by our compensation program.
As illustrated by the Compensation and Benefits Committee’s 2011 determination in connection with the risk assessment review, as well as the more detailed description of our executive compensation arrangements under “—Compensation Discussion and Analysis,” Del Monte believes the Company’s compensation programs and practices effectively link compensation to reasonable and prudent risk management and encourage behaviors aligned with long-term company welfare, and do not create unreasonable risks likely to have a material adverse effect on the Company.
Summary Compensation Table
The following table sets forth compensation paid by Del Monte for the fiscal years indicated to:
| • | the individuals who served as its Chief Executive Officer during fiscal 2011; |
| • | the individuals who served as its Chief Financial Officer during fiscal 2011; and |
| • | each of the three other most highly compensated executive officers of Del Monte as of the end of fiscal 2011. |
124
Table of Contents
These seven individuals are collectively referred to as the “named executive officers.” For purposes of the following table and other disclosures regarding executive compensation, references to “fiscal 2011” refer to the combination of the Predecessor period of May 3, 2010 through March 7, 2011 and the Successor period of March 8, 2011 through May 1, 2011.
| Name and Principal Position (1) |
Year | Salary ($) |
Stock Awards ($)(4) |
Option Awards ($)(5) |
Non-Equity Incentive Plan Compensation ($) |
Change in Pension Value and Nonqualified Deferred Compensation Earnings ($) |
All Other Compensation ($)(6) |
Total ($) |
||||||||||||||||||||||||
| Neil Harrison |
2011 | $ | 178,261 | $ | — | $ | — | $ | — | $ | — | $ | — | $ | 178,261 | |||||||||||||||||
| Interim Chief Executive Officer | ||||||||||||||||||||||||||||||||
| Larry E. Bodner |
2011 | 480,907 | 416,052 | 893,805 | 386,114 | 101,401 | 5,039,938 | 7,318,217 | ||||||||||||||||||||||||
| Executive Vice President and Chief Financial Officer | ||||||||||||||||||||||||||||||||
| Richard G. Wolford (2) |
2011 | 1,133,128 | 2,552,783 | 1,400,163 | 1,423,837 | 1,657,061 | 41,744,773 | 49,911,745 | ||||||||||||||||||||||||
| Former Chairman of the Board, President and Chief Executive Officer | 2010 | 1,155,333 | 2,217,043 | 1,917,862 | 2,240,840 | 1,311,129 | 70,490 | 8,912,697 | ||||||||||||||||||||||||
| 2009 | 1,122,000 | 1,505,845 | 1,472,025 | 2,000,000 | 836,628 | 62,953 | 6,999,451 | |||||||||||||||||||||||||
| David L. Meyers (3) |
2011 | 596,365 | 500,187 | 273,995 | 445,260 | 816,990 | 9,530,727 | 12,163,524 | ||||||||||||||||||||||||
| Former Executive Vice President, Administration and Chief Financial Officer | 2010 | 571,000 | 635,271 | 401,338 | 673,868 | 956,944 | 42,963 | 3,281,384 | ||||||||||||||||||||||||
| 2009 | 555,000 | 431,426 | 331,151 | 685,708 | 311,900 | 43,078 | 2,358,263 | |||||||||||||||||||||||||
| Nils Lommerin |
2011 | 682,667 | 957,728 | 2,528,394 | 700,978 | 228,015 | 12,481,352 | 17,579,134 | ||||||||||||||||||||||||
| Chief Operating Officer | 2010 | 656,000 | 994,991 | 669,166 | 888,215 | 297,529 | 23,308 | 3,529,209 | ||||||||||||||||||||||||
| 2009 | 624,334 | 664,263 | 551,985 | 887,827 | 7,292 | 19,363 | 2,755,064 | |||||||||||||||||||||||||
| Timothy A. Cole |
2011 | 509,000 | 457,541 | 917,767 | 448,635 | 183,658 | 6,448,970 | 8,965,571 | ||||||||||||||||||||||||
| Executive Vice President, Sales | 2010 | 496,000 | 470,944 | 356,924 | 578,555 | 216,896 | 17,206 | 2,136,525 | ||||||||||||||||||||||||
| 2009 | 479,000 | 333,017 | 294,444 | 586,459 | 49,325 | 15,255 | 1,757,500 | |||||||||||||||||||||||||
| David W. Allen |
2011 | 471,000 | 416,052 | 1,158,042 | 368,386 | 88,963 | 5,014,177 | 7,516,620 | ||||||||||||||||||||||||
| Executive Vice President, Operations | 2010 | 435,083 | 348,594 | 245,217 | 470,266 | 140,929 | 12,588 | 1,652,677 | ||||||||||||||||||||||||
| 2009 | 413,333 | 240,373 | 197,349 | 437,573 | 31,092 | 11,583 | 1,331,303 | |||||||||||||||||||||||||
| (1) | This table reflects principal positions held by the individuals as of May 1, 2011 or upon their retirement or resignation, as applicable. |
| (2) | Mr. Wolford retired from his positions with Del Monte effective March 8, 2011. Prior to such date, he served both as an executive officer of Del Monte (as President and Chief Executive Officer) and as the Chairman of our Board of Directors. He did not receive any incremental compensation for his service as a director of Del Monte. |
| (3) | Mr. Meyers resigned from his positions with Del Monte effective March 8, 2011. |
| (4) | For all stock awards (other than the relative total shareholder return (RTSR) based performance share units), Del Monte calculated the fair value of such stock awards in accordance with FASB ASC Topic 718 by multiplying the average of the high and low price of Del Monte’s common stock on the date of grant by the number of shares subject to such stock award. Del Monte assumed zero anticipated forfeitures in connection with valuing such stock awards for purposes of FASB ASC Topic 718. For the RTSR based performance share units, Del Monte estimated fair value based on a model that considered the average of the high and low price of Del Monte’s common stock on the date of grant, the number of shares subject to such stock award, and the estimated probabilities of possible vesting outcomes. In addition, for stock awards that are not credited with dividends during the vesting period (such as performance accelerated restricted stock units (PARS) and performance share units), Del Monte reduced the value of the stock award by the present value of the expected dividend stream during the vesting period using the risk-free interest rate in accordance with FASB ASC Topic 718. Accordingly, to the extent holders of stock awards were entitled to dividends during the vesting period, dividends were factored into the FASB ASC Topic 718 fair value of the stock awards. For additional information regarding the assumptions we used in valuing stock awards, see “Note 10. Stock Plans” of our consolidated financial statements in this Annual Report on Form 10-K. |
| (5) | The amounts reported as Option Awards reflect the grant date fair value calculated in accordance with FASB ASC Topic 718 of options (other than Rollover Options) granted in the applicable fiscal year but without giving effect to anticipated forfeitures. Del Monte did not incur expense in connection with the grant of the Rollover Options. For additional information regarding the grant date fair value of the Rollover Options, see footnote 12 to the Fiscal 2011 Grants of Plan-Based Awards table. |
125
Table of Contents
| The fair value of performance-based options was determined based on an option pricing model. Key inputs were an expected life of 7.5 years, expected volatility of 40% and a risk-free rate of 2.22%. The table below presents the material stock option valuation assumptions for options (other than the performance-based options granted March 8, 2011) granted on the dates indicated. |
| Fiscal Year of Grant |
Grant Date | Dividend Yield | Expected Volatility |
Risk-free Interest Rate |
Expected Life (in years) |
|||||||||||||||
| 2011 |
3/8/2011 | 0.0 | % | 45.0 | % | 2.8 | % | 6.5 | ||||||||||||
| 2011 |
9/23/2010 | 2.4 | % | 29.4 | % | 1.7 | % | 6.0 | ||||||||||||
| 2010 |
9/24/2009 | 2.6 | % | 28.5 | % | 2.7 | % | 6.0 | ||||||||||||
| 2009 |
9/25/2008 | 1.8 | % | 26.2 | % | 3.2 | % | 6.0 | ||||||||||||
For additional information regarding our calculation of the FASB ASC Topic 718 grant date fair value of options granted in fiscal 2011, see “Note 10. Stock Plans” in the Notes to our consolidated financial statements included in this Annual Report on Form 10-K.
| (6) | For more information regarding the amounts reported as All Other Compensation, see “—Narrative Discussion of Summary Compensation Table—All Other Compensation” below. |
Narrative Discussion of Summary Compensation Table
Salary
The salaries listed for fiscal 2011 reflect the following:
| • | the adjustments to executive officer salaries, effective September 1, 2010, made by the Compensation Committee in connection with its review of such salaries; and |
| • | the increase in Mr. Bodner’s salary in connection with his appointment to the position of CFO. |
The amounts reported in the Salary column also include amounts that were paid in lieu of in-kind perquisites. For information regarding such amounts paid in fiscal 2011, see “—Compensation Discussion and Analysis—Components of Executive Compensation—How were the fiscal 2011 perquisite allowances determined?” The Company does not consider such cash allowances as eligible salary for purposes of the Del Monte Foods Company Annual Incentive Program or similar plans.
Stock Awards
Stock Awards include:
| • | restricted stock units (in fiscal 2011 only); |
| • | performance accelerated restricted stock units (PARS) (other than in fiscal 2011); |
| • | performance share units with performance targets based on relative total shareholder return (RTSR); and |
| • | if applicable, deferred stock units issued as Company matching payments pursuant to the Del Monte Corporation AIP Deferred Compensation Plan with respect to the deferral of the prior year’s annual incentive award payments (for fiscal 2010 and fiscal 2009 only). |
All Stock Awards related to Del Monte Foods Company common stock. See “—Fiscal 2011 Grants of Plan Based Awards” for information regarding the stock awards granted in fiscal 2011.
Option Awards
In fiscal 2011, fiscal 2010, and fiscal 2009, the named executive officers received options to purchase Del Monte Foods Company common stock under the Del Monte Foods Company 2002 Stock Incentive Plan (“2002 Stock Plan”) with a standard four-year vesting term. In addition, in fiscal 2011, Messrs. Bodner, Lommerin, Cole, and Allen also received Rollover Options and Matching Options to purchase Parent common stock as described above in “—Compensation Discussion and Analysis—Components of Executive Compensation—How were the fiscal 2011 amounts of long-term incentive awards determined?”
126
Table of Contents
See “—Fiscal 2011 Grants of Plan Based Awards” for information regarding the options granted in fiscal 2011 and “—Potential Payments upon Employment Termination and Change-of-Control Events” for additional information regarding matters that could affect the vesting of outstanding options.
Non-Equity Incentive Plan Compensation
The amounts reported in the Non-Equity Incentive Plan Compensation column of the Summary Compensation Table reflect annual incentive awards earned under the Del Monte Foods Company Annual Incentive Program, including amounts deferred at the election of the named executive officer pursuant to the Del Monte Foods Company Deferred Compensation Plan or Del Monte Corporation AIP Deferred Compensation Plan, as applicable.
For information regarding the Del Monte Foods Company Annual Incentive Program and amounts earned thereunder by the named executive officers for fiscal 2011, see “—Compensation Discussion and Analysis—Components of Executive Compensation—How were the fiscal 2011 cash annual incentive awards determined?” and “—What were the fiscal 2011 AIP Payments for the named executive officers?”
Deferral of Non-Equity Incentive Plan Compensation. As a result of the termination of the DMFC Deferred Compensation Plan as described in “—Compensation Discussion and Analysis—Components of Executive Compensation—Does Del Monte provide supplemental retirement and deferred compensation benefits to its executives?”, no deferrals of fiscal 2011 annual incentive payments occurred. The following table sets forth the percentage of annual incentive awards earned in fiscal 2010 and fiscal 2009 deferred by each named executive officer and that were reported as Non-Equity Incentive Plan Compensation in the Summary Compensation Table for fiscal 2010 or fiscal 2009:
| Name |
Fiscal Year |
% of Award Deferred |
$ Amount Deferred |
DMC AIP Deferred Compensation Plan Deferred Stock Units Issued with respect to Amount Deferred by Executive (1) |
||||||||||||||
| Richard G. Wolford |
2010 | — | $ | — | NA | (2) | ||||||||||||
| 2009 | — | — | — | |||||||||||||||
| David L. Meyers |
2010 | 100 | % | 673,868 | NA | (2) | ||||||||||||
| 2009 | 100 | % | 685,708 | 73,456 | ||||||||||||||
| Nils Lommerin |
2010 | 100 | % | 888,215 | NA | (2) | ||||||||||||
| 2009 | 100 | % | 887,827 | 95,108 | ||||||||||||||
| Timothy A. Cole |
2010 | — | — | NA | (2) | |||||||||||||
| 2009 | 40 | % | 234,583 | 25,130 | ||||||||||||||
| David W. Allen |
2010 | — | — | NA | (2) | |||||||||||||
| 2009 | 60 | % | 262,544 | 28,125 | ||||||||||||||
| (1) | Deferrals of fiscal 2009 annual incentive payments were made under the Del Monte Corporation AIP Deferred Compensation Plan. Under that Plan, amounts deferred were converted to fully vested deferred stock units based on the average of the high and low price of Del Monte Foods Company’s common stock on the date Annual Incentive Program payments were made. |
| Del Monte matched 25% of the amounts deferred, in the form of deferred stock units vesting over three fiscal years beginning with the fiscal year of issuance. The grant date fair values of such match amounts have been included under Stock Awards in the Summary Compensation Table for the fiscal year in which the matching payment was issued and accordingly the foregoing table does not include such matching payments. |
| (2) | Deferrals of fiscal 2010 annual incentive payments were made under the Del Monte Foods Company Deferred Compensation Plan. Under that Plan, deferred amounts were not converted into deferred stock units and Del Monte did not provide a match. |
For additional information regarding the Del Monte Foods Company Deferred Compensation Plan and the Del Monte Corporation AIP Deferred Compensation Plan, see “—Fiscal 2011 Nonqualified Deferred Compensation—Narrative Discussion of Plans Reflected in Fiscal 2011 Nonqualified Deferred Compensation Table.”
Change in Pension Value and Nonqualified Deferred Compensation Earnings
There were no above-market or preferential earnings on nonqualified deferred compensation. Accordingly, all amounts reported reflect solely the change in the actuarial pension value under:
| • | the Del Monte Corporation Retirement Plan; |
127
Table of Contents
| • | the portion of the Del Monte Corporation Additional Benefits Plan that relates to the Del Monte Corporation Retirement Plan; and |
| • | the Del Monte Corporation Supplemental Executive Retirement Plan. |
Generally, the change in actuarial pension value reflects the difference between the actuarial present value of accumulated benefits at the end of the fiscal year and at the end of the prior fiscal year, based on the applicable measurement date. However, in fiscal 2009 in accordance with GAAP, we moved our applicable measurement date to the end of our fiscal year (in prior fiscal years, we had used the end of March). Accordingly, the change in actuarial pension value between the end of fiscal 2008 and the end of fiscal 2009 reflects 13 (rather than 12) months of growth. The change in pension value reported in the Summary Compensation Table for fiscal 2009 has been annualized by pro-ration to provide comparability between fiscal years. Additionally, the fiscal 2011 change in actuarial pension values for Messrs. Wolford and Meyers reflects the difference between the actual value of their benefits, determined in connection with the termination of their service on March 8, 2011, and the value at the end of fiscal 2010.
For additional information regarding the Del Monte Corporation Retirement Plan; the portion of the Del Monte Corporation Additional Benefits Plan that relates to the Del Monte Corporation Retirement Plan; and the Del Monte Corporation Supplemental Executive Retirement Plan, see “—Fiscal 2011 Pension Benefits.” For information regarding Del Monte’s nonqualified deferred compensation plans, see “—Fiscal 2011 Nonqualified Deferred Compensation.”
All Other Compensation
Amounts reported in the All Other Compensation column for fiscal 2011 include the amounts detailed in the following tables:
| Acceleration of Vesting of Equity Awards ($)(1) |
Make-Whole Payments ($)(2) |
Transaction Bonus ($)(3) |
Severance Payments ($) |
|||||||||||||
| Neil Harrison |
$ | — | $ | — | $ | — | $ | — | ||||||||
| Larry E. Bodner |
4,544,986 | 45,085 | 400,000 | — | ||||||||||||
| Richard G. Wolford |
33,850,234 | 656,040 | — | 7,179,271 | ||||||||||||
| David L. Meyers |
7,564,154 | 12,654 | — | 1,916,000 | ||||||||||||
| Nils Lommerin |
12,199,293 | 224,077 | — | — | ||||||||||||
| Timothy A. Cole |
6,385,257 | — | — | — | ||||||||||||
| David W. Allen |
4,884,790 | 80,812 | — | — | ||||||||||||
| (1) | These amounts reflect the value of the equity awards held by each individual that were subject to acceleration of vesting in connection with the Merger, in accordance with the terms of such awards. For options, this value is the difference between the per-share Merger consideration ($19.00) minus the applicable exercise price, times the number of shares subject to the option. For all other equity awards, the value is the per-share Merger consideration ($19.00) times the number of shares subject to the award. |
| (2) | These amounts reflect make-whole payments made in connection with the sale of shares pursuant to options exercised in an effort to reduce Del Monte’s obligation to pay parachute payment excise tax gross-ups to the executives. |
| (3) | This amount reflects a bonus paid by Del Monte to Mr. Bodner in connection with the Merger. |
| Name |
Employer Contributions to Defined Contribution Plans |
Term Life Insurance Premiums ($) |
Tax Gross- Ups ($)(1) |
Perquisites and Other Personal Benefits ($)(2) |
||||||||||||||||
| Company Matching Contribution Pursuant to the Del Monte Savings Plan (the 401(k) plan)($) |
Amounts Contributed under the Del Monte Corporation Additional Benefits Plan relating to the Del Monte Savings Plan (the 401(k) plan)($) |
|||||||||||||||||||
| Larry E. Bodner |
$ | 7,541 | $ | 5,189 | $ | 773 | $ | — | $ | 36,364 | ||||||||||
| Richard G. Wolford |
4,238 | 26,704 | 1,620 | 1,548 | 25,119 | |||||||||||||||
| David L. Meyers |
4,884 | 9,035 | 990 | — | 23,010 | |||||||||||||||
| Nils Lommerin |
6,781 | 11,852 | 1,165 | — | 38,184 | |||||||||||||||
| Timothy A. Cole |
5,836 | 6,742 | 851 | 5,495 | 44,790 | |||||||||||||||
| David W. Allen |
5,975 | 5,452 | 784 | — | 36,364 | |||||||||||||||
| (1) | Tax gross-ups were paid in connection with tax obligations associated with Del Monte-related travel for the named executive officers’ spouses. Del Monte provides tax gross-ups for executive spousal travel when the travel is determined to have a business benefit to Del Monte and has been approved by the Executive Vice President and Chief Human Resources Officer. In fiscal 2011, tax gross-ups were provided in connection with spousal travel to Del Monte’s annual sales masters program and the Grocery Manufacturers Association Executive Conference. |
128
Table of Contents
| (2) | Reflects the aggregate incremental cost of perquisites and other personal benefits provided as follows: |
| • | The portion attributable to each of Messrs. Bodner, Lommerin, Cole and Allen of the cost of outside legal counsel provided to the senior executive team in connection with the Merger; |
| • | $22,680 for each of Messrs. Wolford and Meyers in connection with the Del Monte Corporation Executive Medical Reimbursement Plan; |
| • | Limited use by Messrs. Meyers and Lommerin of company tickets to sporting events; |
| • | $2,039 for Mr. Wolford and $8,026 for Mr. Cole in connection with spousal travel; and |
| • | $400 for each of Messrs. Wolford and Cole in connection with Grocery Manufacturers Association Executive Conference registration fees for spouse. |
Fiscal 2011 Grants of Plan-Based Awards
| Name |
Grant Date |
Estimated Possible Payouts Under Non-Equity Incentive Plan Awards (1) |
Estimated Future Payouts Under Equity Incentive Plan Awards (5) |
All Other Stock Awards: Number of Shares of Stock or Units (#)(6) |
All
Other Option Awards: Number of Securities Underlying Options (#) |
Exercise or Base Price of Option Awards ($/Sh)(10) |
Closing Market Price on Date of Grant ($/Sh) |
Grant Date Fair Value of Stock and Option Awards ($)(11) |
||||||||||||||||||||||||||||||||||||||||
| Threshold ($)(2) |
Target ($)(3) |
Maximum ($)(4) |
Threshold (#) |
Target (#) |
Maximum (#) |
|||||||||||||||||||||||||||||||||||||||||||
| Neil Harrison |
— | $ | — | $ | — | $ | — | — | — | — | — | — | $ | — | $ | — | $ | — | ||||||||||||||||||||||||||||||
| Larry E. Bodner |
9/23/2010 | 12,450 | 24,900 | 37,350 | 286,410 | |||||||||||||||||||||||||||||||||||||||||||
| 9/23/2010 | 11,200 | 129,642 | ||||||||||||||||||||||||||||||||||||||||||||||
| 9/23/2010 | 78,700 | (7) | 12.64 | 228,426 | ||||||||||||||||||||||||||||||||||||||||||||
| 3/8/2011 | 34,837 | 174,183 | 174,183 | 5.00 | 243,856 | |||||||||||||||||||||||||||||||||||||||||||
| 3/8/2011 | 174,183 | (8) | 5.00 | 421,523 | ||||||||||||||||||||||||||||||||||||||||||||
| 3/8/2011 | 454,453 | (9) | 1.25 | — | (12) | |||||||||||||||||||||||||||||||||||||||||||
| 50,224 | 284,958 | 569,917 | ||||||||||||||||||||||||||||||||||||||||||||||
| Richard G. Wolford |
9/23/2010 | 76,400 | 152,800 | 229,200 | 1,757,567 | |||||||||||||||||||||||||||||||||||||||||||
| 9/23/2010 | 68,700 | 795,216 | ||||||||||||||||||||||||||||||||||||||||||||||
| 9/23/2010 | 482,400 | (7) | 12.64 | 1,400,163 | ||||||||||||||||||||||||||||||||||||||||||||
| 187,277 | 1,062,565 | 2,125,130 | ||||||||||||||||||||||||||||||||||||||||||||||
| David L. Meyers |
9/23/2010 | 14,950 | 29,900 | 44,850 | 343,922 | |||||||||||||||||||||||||||||||||||||||||||
| 9/23/2010 | 13,500 | 156,265 | ||||||||||||||||||||||||||||||||||||||||||||||
| 9/23/2010 | 94,400 | (7) | 12.64 | 273,995 | ||||||||||||||||||||||||||||||||||||||||||||
| 57,917 | 328,605 | 657,210 | ||||||||||||||||||||||||||||||||||||||||||||||
| Nils Lommerin |
9/23/2010 | 28,650 | 57,300 | 85,950 | 659,088 | |||||||||||||||||||||||||||||||||||||||||||
| 9/23/2010 | 25,800 | 298,640 | ||||||||||||||||||||||||||||||||||||||||||||||
| 9/23/2010 | 180,900 | (7) | 12.64 | 525,061 | ||||||||||||||||||||||||||||||||||||||||||||
| 3/8/2011 | 104,886 | 524,432 | 524,432 | 5.00 | 734,205 | |||||||||||||||||||||||||||||||||||||||||||
| 3/8/2011 | 524,433 | (8) | 5.00 | 1,269,128 | ||||||||||||||||||||||||||||||||||||||||||||
| 3/8/2011 | 1,190,182 | (9) | 1.25 | — | (12) | |||||||||||||||||||||||||||||||||||||||||||
| 91,180 | 517,333 | 1,034,667 | ||||||||||||||||||||||||||||||||||||||||||||||
| Timothy A. Cole |
9/23/2010 | 13,700 | 27,400 | 41,100 | 315,166 | |||||||||||||||||||||||||||||||||||||||||||
| 9/23/2010 | 12,300 | 142,375 | ||||||||||||||||||||||||||||||||||||||||||||||
| 9/23/2010 | 86,500 | (7) | 12.64 | 251,066 | ||||||||||||||||||||||||||||||||||||||||||||
| 3/8/2011 | 34,906 | 174,529 | 174,529 | 5.00 | 244,341 | |||||||||||||||||||||||||||||||||||||||||||
| 3/8/2011 | 174,529 | (8) | 5.00 | 422,360 | ||||||||||||||||||||||||||||||||||||||||||||
| 3/8/2011 | 638,842 | (9) | 1.25 | — | (12) | |||||||||||||||||||||||||||||||||||||||||||
| 58,356 | 331,100 | 662,200 | ||||||||||||||||||||||||||||||||||||||||||||||
| David W. Allen |
9/23/2010 | 12,450 | 24,900 | 37,350 | 286,410 | |||||||||||||||||||||||||||||||||||||||||||
| 9/23/2010 | 11,200 | 129,642 | ||||||||||||||||||||||||||||||||||||||||||||||
| 9/23/2010 | 78,700 | (7) | 12.64 | 228,426 | ||||||||||||||||||||||||||||||||||||||||||||
| 3/8/2011 | 48,671 | 243,355 | 243,355 | 5.00 | 340,697 | |||||||||||||||||||||||||||||||||||||||||||
| 3/8/2011 | 243,355 | (8) | 5.00 | 588,919 | ||||||||||||||||||||||||||||||||||||||||||||
| 3/8/2011 | 47,918 | 271,875 | 543,750 | 648,946 | (9) | 1.25 | — | (12) | ||||||||||||||||||||||||||||||||||||||||
129
Table of Contents
| (1) | These amounts reflect possible payouts of amounts that could have been earned with respect to fiscal 2011 at threshold, target and maximum levels, respectively, under the Del Monte Foods Company Annual Incentive Plan (“AIP”). Actual amounts earned for fiscal 2011 under the AIP have been reported in the Summary Compensation Table as Non-Equity Incentive Plan Compensation for fiscal 2011. |
| (2) | Reflects the smallest possible payout, if any payout is made, under the AIP for the applicable fiscal year. The threshold amount reflects the amount that would have been paid under the AIP with respect to fiscal 2011 if: |
| • | adjusted EPS had been less than 85% of target, resulting in a score of zero with respect to this objective and the net sales objective; |
| • | adjusted cash flow had been 85% of target, resulting in a score of 25% with respect to this objective; and |
| • | the named executive officer had received a score of 75% with respect to his individual objectives. |
The threshold amount is not a minimum amount; AIP awards may be zero. If Del Monte’s adjusted cash flow had been less than 85% of the target established under the AIP for fiscal 2011 (in addition to an adjusted EPS less than 85% of target), none of the named executive officers would have been entitled to receive an award under the AIP for fiscal 2011. Additionally, if a named executive officer had received a score of less than 75% with respect to his individual objectives, such named executive officer would not have received an award for fiscal 2011.
| (3) | Reflects the target payout under the AIP for fiscal 2011. The target amount reflects the amount that would have been paid under the AIP with respect to fiscal 2011 if: |
| • | adjusted EPS had been 100% of target; |
| • | net sales had been 100% of target; |
| • | adjusted cash flow had been 100% of target; and |
| • | the named executive officer had received a score of 100% with respect to his individual objectives. |
For additional information regarding the Del Monte Foods Company Annual Incentive Plan, including fiscal 2011 targets, see “—Compensation Discussion and Analysis.”
| (4) | Reflects the maximum possible payout under the AIP for fiscal 2011. The maximum amount reflects the amount that would have been paid under the AIP with respect to fiscal 2011 if: |
| • | adjusted EPS had been at or above 115% of target, resulting in a score of 200% with respect to this objective; |
| • | net sales had been at or above 104% of target, resulting in a score of 200% with respect to this objective; |
| • | adjusted cash flow had been at or above 115% of target, resulting in a score of 200% with respect to this objective; and |
| • | the named executive officer had received a score of 200% with respect to his individual objectives. |
200% is the maximum score that may be associated with any objective under the AIP. Accordingly, the maximum possible amount payable under the AIP is twice an executive’s target amount, subject to the maximum specified payout of $3 million per person that was applicable in fiscal 2011.
130
Table of Contents
| (5) | The September 23, 2010 grants in this column reflect performance share units granted pursuant to the 2002 Stock Plan that were subject to vesting based on DMFC’s achievement of relative total shareholder return (RTSR) over fiscal 2012 through fiscal 2014. DMFC’s total shareholder return over the performance period (using the first and last months of the performance period to calculate the total shareholder return) would have been compared to the total shareholder return of the established comparator companies. The RTSR would have been the percentile ranking of DMFC’s total shareholder return as compared to that of its RTSR performance comparator group. Performance share units were subject to vesting (calculated as a percentage of the target award) based on relative total shareholder return as follows: |
| Relative Total Shareholder Return: Company Performance Percentile |
Percentage of Target Award Vested | |||||
| ³75th percentile |
150 | % | (Maximum) | |||
| ³68.75, but <75 |
125 | |||||
| ³62.5, but <68.75 |
100 | (Target) | ||||
| ³56.5, but <62.5 |
75 | |||||
| ³50, but <56.5 |
50 | (Threshold) | ||||
| <50 |
— | |||||
The March 8, 2011 grants reflect shares of Parent common stock underlying performance-based options granted pursuant to the 2011 Stock Plan. Such options generally vest at the end of each of fiscal years 2012 through 2016 if Parent achieves a pre-determined EBITDA-related financial target with respect to such fiscal year. With respect to the targets for fiscal 2012 through fiscal 2015, in the event any such annual target is not achieved, those options that would have become vested pursuant to the achievement of such target may nevertheless vest at the end of the subsequent fiscal year if Parent achieves the applicable cumulative EBITDA-related financial target.
| (6) | These amounts reflect shares of DMFC common stock underlying restricted share units granted pursuant to the 2002 Stock Plan. The restricted stock units were subject to vesting over a four-year period, with one-quarter of the units vesting on each of the second and third anniversaries of the grant date, and the remainder vesting on the fourth anniversary of the grant date. |
| (7) | These amounts reflect shares of DMFC common stock underlying options granted in fiscal 2011 under the 2002 Stock Plan. Options were subject to a vesting at the rate of 25% annually over four years. |
| (8) | These amounts reflect shares of Parent common stock underlying options granted pursuant to the 2011 Stock Plan. Options generally vest at the rate of 20% annually over five years. |
| (9) | These amounts reflect shares of Parent common stock underlying vested options (“Rollover Options”) granted pursuant to the 2011 Stock Plan in connection with the rollover of outstanding options previously granted under the 2002 Stock Plan. |
| (10) | The exercise price for options granted under the 2002 Stock Plan was the fair market value of DMFC’s common stock on the grant date, determined in accordance with the 2002 Stock Incentive Plan based on the average of the high and low price of DMFC’s common stock on the New York Stock Exchange on such date. The exercise price for options, other than the Rollover Options granted pursuant to the 2011 Stock Plan, is the fair market value of Parent’s common stock on the grant date. The exercise price of the Rollover Options was determined in accordance with applicable tax rules governing the conversion of options in the context of a change-in-control transaction. |
| (11) | These amounts reflect the aggregate grant date fair value of the awards, computed in accordance with FASB ASC Topic 718. |
| (12) | There was no incremental expense associated with the Rollover Options, as the Rollover Option grants represented a value-for-value exchange of options in connection with the Merger. The grant date fair value of the Rollover Options is as follows: Mr. Bodner: $2,272,265, Mr. Lommerin: $5,950,910, Mr. Cole: $3,194,210, Mr. Allen: $3,244,730. |
See “—Potential Payments upon Employment Termination and Change-of-Control Events” for additional information that could affect the payment of awards reported in the Fiscal 2011 Grants of Plan-Based Awards Table.
131
Table of Contents
Outstanding Equity Awards at Fiscal 2011 Year End
| Name |
Option Grant Date |
Option Awards | ||||||||||||||||||||||
| Number of Securities Underlying Unexercised Options (#) Exercisable (1) |
Number of Securities Underlying Unexercised Options (#) Unexercisable (2) |
Equity Incentive Plan Awards: Number of Securities Underlying Unexercised Unearned Options (#)(3) |
Option Exercise Price ($) |
Option Expiration Date (4) |
||||||||||||||||||||
| Neil Harrison |
— | — | — | — | — | — | ||||||||||||||||||
| Larry E. Bodner |
3/8/2011 | 32,773 | 1.25 | 9/27/2017 | ||||||||||||||||||||
| 3/8/2011 | 149,733 | 1.25 | 9/25/2018 | |||||||||||||||||||||
| 3/8/2011 | 138,472 | 1.25 | 9/24/2019 | |||||||||||||||||||||
| 3/8/2011 | 133,475 | 1.25 | 9/23/2020 | |||||||||||||||||||||
| 3/8/2011 | 174,183 | 174,183 | 5.00 | 3/8/2021 | ||||||||||||||||||||
| Richard G. Wolford |
— | — | — | — | — | — | ||||||||||||||||||
| David L. Meyers |
— | — | — | — | — | — | ||||||||||||||||||
| Nils Lommerin |
3/8/2011 | 86,700 | 1.25 | 9/27/2017 | ||||||||||||||||||||
| 3/8/2011 | 418,804 | 1.25 | 9/25/2018 | |||||||||||||||||||||
| 3/8/2011 | 377,872 | 1.25 | 9/24/2019 | |||||||||||||||||||||
| 3/8/2011 | 306,806 | 1.25 | 9/23/2020 | |||||||||||||||||||||
| 3/8/2011 | 524,433 | 524,432 | 5.00 | 3/8/2021 | ||||||||||||||||||||
| Timothy A. Cole |
3/8/2011 | 223,402 | 1.25 | 9/25/2018 | ||||||||||||||||||||
| 3/8/2011 | 268,736 | 1.25 | 9/24/2019 | |||||||||||||||||||||
| 3/8/2011 | 146,704 | 1.25 | 9/23/2020 | |||||||||||||||||||||
| 3/8/2011 | 174,529 | 174,529 | 5.00 | 3/8/2021 | ||||||||||||||||||||
| David W. Allen |
3/8/2011 | 31,375 | 1.25 | 9/27/2017 | ||||||||||||||||||||
| 3/8/2011 | 299,467 | 1.25 | 9/25/2018 | |||||||||||||||||||||
| 3/8/2011 | 184,629 | 1.25 | 9/24/2019 | |||||||||||||||||||||
| 3/8/2011 | 133,475 | 1.25 | 9/23/2020 | |||||||||||||||||||||
| 3/8/2011 | 243,355 | 243,355 | 5.00 | 3/8/2021 | ||||||||||||||||||||
| (1) | These amounts reflect shares of Parent common stock underlying vested options (“Rollover Options”) granted pursuant to the 2011 Stock Plan in connection with the rollover and conversion of outstanding options previously granted under the 2002 Stock Plan. |
| (2) | These amounts reflect shares of Parent common stock underlying options granted pursuant to the 2011 Stock Plan. Options generally vest at the rate of 20% annually over five years. |
| (3) | These amounts reflect shares of Parent common stock underlying performance-based options granted pursuant to the 2011 Stock Plan. Such options generally vest at the end of each of fiscal years 2012 through 2016 if Parent achieves a pre-determined EBITDA-related financial target with respect to such fiscal year. With respect to the targets for fiscal years 2012 through 2015, in the event any such annual target is not achieved, those options that would have become vested pursuant to the achievement of such target may nevertheless vest at the end of the subsequent fiscal year if Parent achieves the applicable cumulative EBITDA-related financial target. |
| (4) | Options generally have a 10-year term. With respect to the Rollover Options, the term commencement date was the grant date of the original option which was granted under the 2002 Stock Plan and rolled into the 2011 Stock Plan. All or a portion of an option may expire prior to its stated expiration date in the event of the optionee’s termination of employment. |
132
Table of Contents
Additionally, see “—Potential Payments upon Employment Termination and Change-of-Control Events” for additional information that could affect the vesting of options.
Fiscal 2011 Option Exercises and Stock Vested
| Option Awards (1) | Stock Awards (2) | |||||||||||||||
| Name |
Number of Shares Acquired on Exercise (#) |
Value Realized on Exercise ($) |
Number of Shares Acquired on Vesting (#) |
Value Realized on Vesting ($) |
||||||||||||
| Neil Harrison |
— | — | — | $ | — | |||||||||||
| Larry E. Bodner |
280,300 | 2,169,445 | 176,483 | 3,225,189 | ||||||||||||
| Richard G. Wolford |
6,721,100 | 60,259,137 | 1,579,912 | 27,844,681 | ||||||||||||
| David L. Meyers |
1,788,600 | 14,216,487 | 360,583 | 6,360,970 | ||||||||||||
| Nils Lommerin |
1,047,500 | 9,133,656 | 507,894 | 9,167,275 | ||||||||||||
| Timothy A. Cole |
449,600 | 2,839,078 | 278,766 | 4,978,467 | ||||||||||||
| David W. Allen |
471,430 | 3,519,074 | 192,587 | 3,528,911 | ||||||||||||
| (1) | In connection with the Merger, each option outstanding under the 2002 Stock Plan, other than certain options which were converted into new options to buy Parent common stock, was cancelled in exchange for a cash payment equal to the product of (x) the number of shares subject to the option and (y) the difference between the per-share Merger consideration ($19.00) and the option exercise price. For options subject to such cashout in connection with the Merger, the Number of Shares Acquired on Exercise column reflects the number of shares underlying such options. |
| (2) | Amounts reported in the Number of Shares Acquired on Vesting column reflect the vesting, pursuant to the achievement of applicable financial performance targets, of shares of common stock subject to performance share units granted in fiscal 2006 and 2007, as well as the vesting of shares subject to performance accelerated restricted stock units (PARS) granted in fiscal 2006, fiscal 2007, and fiscal 2008. In addition, in connection with the Merger, all outstanding stock awards became fully vested. Accordingly, the Number of Shares Acquired on Vesting column also reflects the vesting of all stock awards that remained outstanding immediately prior to the closing of the Merger. |
Fiscal 2011 Pension Benefits
| Name |
Plan Name (1) | Number of Years Credited Service (#) |
Present Value of Accumulated Benefit ($)(3) |
Payments During Last Fiscal Year ($) |
||||||||||
| Neil Harrison |
— | — | — | — | ||||||||||
| Larry E. Bodner |
Qualified Pension Plan | 7.81 | 132,498 | — | ||||||||||
| Additional Benefits Plan—Qualified Pension Plan Portion |
7.81 | 139,832 | — | |||||||||||
| SERP | 7.81 | 77,795 | — | |||||||||||
| Richard G. Wolford |
Qualified Pension Plan | 13.88 | — | 442,145 | ||||||||||
| Additional Benefits Plan—Qualified Pension Plan Portion |
13.88 | 3,179,904 | — | |||||||||||
| SERP | 13.88 | 4,043,752 | — | |||||||||||
| David L. Meyers |
Qualified Pension Plan | 37.77 | (2) | — | 1,139,027 | |||||||||
| Additional Benefits Plan—Qualified Pension Plan Portion |
37.77 | (2) | 1,411,433 | — | ||||||||||
| SERP | 37.77 | (2) | 2,644,390 | — | ||||||||||
| Nils Lommerin |
Qualified Pension Plan | 8.14 | 131,872 | — | ||||||||||
| Additional Benefits Plan—Qualified Pension Plan Portion |
8.14 | 365,266 | — | |||||||||||
| SERP | 8.14 | 221,560 | — | |||||||||||
133
Table of Contents
| Name |
Plan Name (1) | Number of Years Credited Service (#) |
Present Value of Accumulated Benefit ($)(3) |
Payments During Last Fiscal Year ($) |
||||||||||
| Timothy A. Cole |
Qualified Pension Plan | 6.65 | 155,679 | — | ||||||||||
| Additional Benefits Plan—Qualified Pension Plan Portion |
6.65 | 340,057 | — | |||||||||||
| SERP | 6.65 | 126,764 | — | |||||||||||
| David W. Allen |
Qualified Pension Plan | 4.90 | 102,007 | — | ||||||||||
| Additional Benefits Plan—Qualified Pension Plan Portion |
4.90 | 182,544 | — | |||||||||||
| SERP | 4.90 | 48,689 | — | |||||||||||
| (1) | For purposes of the above table: |
| • | Qualified Pension Plan is the Del Monte Corporation Retirement Plan; |
| • | Additional Benefits Plan—Qualified Pension Plan Portion is the portion of the Del Monte Corporation Additional Benefits Plan that relates to the Del Monte Corporation Retirement Plan; and |
| • | SERP is the Del Monte Corporation Supplemental Executive Retirement Plan. |
| (2) | Mr. Meyers’ credited years of service correspond to his aggregate actual service with various entities that were or became affiliated with Del Monte, beginning with his May 29, 1973 hire date with Standard Brands, Inc. Mr. Meyers transferred to Del Monte Corporation in May 1989. |
| Del Monte’s general policy is to recognize all actual years of service with Del Monte and any predecessor employers where the pension liability is transferred to Del Monte or as otherwise negotiated for acquired employees generally in an acquisition agreement. In general, it is Del Monte’s policy not to grant any extra years of credited service above such actual service. |
| (3) | The Present Value of Accumulated Benefit generally represents the lump sum amount that would be required to be invested as of May 1, 2011 at a fixed interest rate of 5.5% per annum in order to pay the named executive officer upon retirement at age 65 a lump sum equal to: |
| • | the named executive officer’s accrued benefit under the applicable plan as of the pension plan measurement date used for purposes of preparing Del Monte’s financial statements in accordance with generally accepted accounting principles in the U.S. (which for fiscal 2011 was May 1, 2011); and |
| • | for the Qualified Pension Plan and Additional Benefits Plan—Qualified Pension Plan Portion, interest credits on such accrued benefit amount until the named executive officer reaches age 65, calculated at 4.75% per annum. |
| The Present Value of Accumulated Benefit has been calculated using the same methods and assumptions as those used by Del Monte in the production of its GAAP financial statements as included in this Annual Report on Form 10-K, except retirement age is assumed to be age 65 and no pre-retirement decrements are assumed. Additionally, for any named executive officer who is age 65 or over as of January 1, 2011, employment status used for calculating the Present Value is determined as of the last day of the fiscal year. |
| The Present Value of Accumulated Benefit has been calculated in accordance with applicable SEC rules and, other than with respect to Messrs. Wolford and Meyers, does not represent actual amounts payable to the named executive officers under each plan. For example, at the end of fiscal 2011, no amounts were payable to Mr. Allen under the Del Monte Corporate Supplemental Executive Retirement Plan (or SERP) because Mr. Allen did not have five years of service on such date. Amounts reported for Messrs. Wolford and Meyers represent the actual amount of their benefits to be paid as determined in connection with their termination of service on March 8, 2011. Pursuant to the terms of the applicable plan, amounts for Messrs. Wolford and Meyers are payable in the seventh month following the termination of their employment or, with respect to the Additional Benefits Plan—Qualified Pension Plan Portion, in January of the year following the year of their termination, if later. |
134
Table of Contents
Narrative Discussion of Plans Reflected in Fiscal 2011 Pension Benefits Table
Del Monte currently sponsors three defined benefit pension plans that apply to the named executive officers:
| • | the Del Monte Corporation Retirement Plan (the “Qualified Pension Plan”), which provides funded, tax-qualified benefits up to the limits on compensation and benefits under the Internal Revenue Code; |
| • | the portion of the Del Monte Corporation Additional Benefits Plan relating to the Qualified Pension Plan, which provides unfunded, nonqualified benefits in excess of the limits applicable to the Qualified Pension Plan; and |
| • | the Del Monte Corporation Supplemental Executive Retirement Plan (“SERP”), which provides unfunded, nonqualified benefits that are reduced by benefits under the Qualified Pension Plan and the portion of the Additional Benefits Plan relating to the Qualified Pension Plan. |
The information below describes the material factors necessary to understand the pension benefits that are provided to the named executive officers under these three plans. For a discussion of the
reasons for Del Monte providing these plans, please see
“—Compensation Discussion and Analysis.”
Del Monte Corporation Retirement Plan
The Qualified Pension Plan was formed pursuant to the merger of Del Monte’s three qualified defined benefit pension plans, including the Del Monte Corporation Retirement Plan for Salaried Employees which became effective January 1, 1990. As applicable to non-seasonal salaried employees, the Qualified Pension Plan is a non-contributory, cash balance defined benefit retirement plan covering eligible employees of Del Monte. Under the plan as applicable to non-seasonal salaried employees, a participant becomes fully vested in his benefits after completing three years of service, and from that time, a participant is entitled to receive benefits upon termination of employment for any reason. In general, a non-seasonal salaried employee becomes a participant in the Qualified Pension Plan after completion of one year of service.
Benefit Amount. Monthly credits equal to a percentage of eligible compensation are made to each participant’s Personal Retirement Account (“PRA”) within the Qualified Pension Plan. The PRA, which is a hypothetical account, accumulates these compensation credits as well as interest credits on the participant’s account balance. Upon becoming a participant, a “catch-up” amount is credited. This catch-up amount is the sum of compensation credits and interest credits that would have been made under the Qualified Pension Plan if the participant had been eligible to participate starting at his date of employment with Del Monte.
Prior to January 1, 2005, the monthly compensation credits were determined in accordance with the following schedule:
| Participant Age |
All Monthly Compensation |
Monthly Compensation Above Social Security Wage Base |
||||||
| Below age 35 |
4.0 | % | 3.0 | % | ||||
| 35 but below 45 |
5.0 | % | 3.0 | % | ||||
| 45 but below 55 |
6.0 | % | 3.0 | % | ||||
| 55 and over |
7.0 | % | 3.0 | % | ||||
The calculation of compensation credits under the Qualified Pension Plan was changed to the following schedule for all active participants on and after January 1, 2005:
| Participant Age |
Percentage of Monthly Compensation |
|||
| Below 30 |
3.0 | % | ||
| 30 but below 35 |
4.0 | % | ||
| 35 but below 40 |
5.0 | % | ||
| 40 but below 45 |
6.0 | % | ||
| 45 but below 50 |
8.0 | % | ||
| 50 but below 55 |
10.0 | % | ||
| 55 but below 60 |
11.0 | % | ||
| 60 but below 65 |
12.0 | % | ||
| Age 65 and over |
13.0 | % | ||
135
Table of Contents
Eligible compensation for the named executive officers primarily includes:
| • | base pay; and |
| • | awards under the Del Monte Foods Company Annual Incentive Plan or Program that are not deferred by the executive. |
Eligible compensation does not include, among other items:
| • | equity compensation, or |
| • | severance payments in any form. |
Notwithstanding the foregoing, compensation used to calculate benefits under the Qualified Pension Plan may not exceed the compensation limit under the Internal Revenue Code. In calendar 2010, this limit was $245,000. In addition, benefits provided under the Qualified Pension Plan may not exceed the benefit amount limit under the Internal Revenue Code. In calendar 2010, this limit was $195,000 payable as a single life annuity beginning at normal retirement age or its equivalent. Benefits that cannot be provided under the Qualified Pension Plan due to these limits are instead provided under the portion of the Del Monte Corporation Additional Benefits Plan that relates to the Qualified Pension Plan, which is discussed below.
The rate used for calculating interest credits under the Qualified Pension Plan was 110% of the interest rate published by Pension Benefit Guaranty Corporation until January 1, 1998 when it changed to 1.5% plus the yield on the 12-month Treasury Bill rate, which was replaced as of June 1, 2001 by 1.5% plus the yield on the 6-month Treasury Bill rate. Effective January 1, 2008, the annual effective rate may not be less than 4.5%. If 1.5% plus the yield on the 6-month Treasury Bill rate results in an annual effective rate of less than 4.5%, a year-end adjustment is made for participants in the plan during that year.
Distribution of Benefits. As a cash balance pension plan, the Qualified Pension Plan provides a lump sum benefit equal to the participant’s PRA account balance. The benefit is payable at any age, provided a participant is vested. However, no benefits are paid prior to termination of employment. Benefits are also available in the form of actuarially equivalent annuities. The factors for converting PRA account balances to annuities are based on the 30-Year Treasury Bond rates or, effective January 1, 2008, the segmented rates provided under the Pension Protection Act of 2006, as well as an IRS specified mortality table.
Del Monte Corporation Additional Benefits Plan—Portion Relating to the Del Monte Corporation Retirement Plan
The portion of the Del Monte Corporation Additional Benefits Plan that relates to the Qualified Pension Plan (the “Additional Benefits Plan—Qualified Pension Plan Portion”) is a nonqualified benefit plan that provides supplemental benefits equal to certain benefits that cannot be paid under the Qualified Pension Plan due to Internal Revenue Code limits, as described above under “Del Monte Corporation Retirement Plan.” Additionally, the Additional Benefits Plan—Qualified Pension Plan Portion provides benefits with respect to awards under the Del Monte Foods Company Annual Incentive Plan or Program that were deferred under the Del Monte Corporation AIP Deferred Compensation Plan or the Del Monte Foods Company Deferred Compensation Plan, because such deferred amounts are not included as eligible compensation under the Qualified Pension Plan. Benefits under the Additional Benefits Plan—Qualified Pension Plan Portion vest at the same time as benefits under the Qualified Pension Plan and are determined using a hypothetical account balance as in the Qualified Pension Plan. Participation in the Additional Benefits Plan—Qualified Pension Plan Portion does not begin until the employee is a participant in the Qualified Pension Plan.
No funds are set aside in a trust for payment of benefits under the Additional Benefits Plan. Rather, benefits are paid from Del Monte’s general assets. Accordingly, participants in the Additional Benefits Plan are general creditors of Del Monte with respect to the payment of these benefits.
Benefit Amount. Benefits are determined in the same manner, including the catch-up upon becoming a participant, as under the Qualified Pension Plan, but based on compensation and benefit amounts in excess of the qualified plan limits under the Internal Revenue Code and including deferred Del Monte Foods Company Annual Incentive Plan or Program awards.
For Mr. Meyers, the Additional Benefits Plan—Qualified Pension Plan Portion also provided an additional retirement benefit with respect to resignation for good reason that applied the Qualified Pension Plan formula and the Additional Benefits Plan—Qualified Pension Plan Portion formula to all cash severance pay as if it were pensionable compensation and credits such calculated amounts under the Additional Benefits Plan. This provision of the Additional Benefits Plan largely reflects a contractual obligation Del Monte has to Mr. Meyers, which has been in place for a number of years.
Distribution of Benefits. Vested benefits under the Additional Benefits Plan—Qualified Pension Plan Portion are paid in the seventh full calendar month after termination of employment for any reason (including death). Benefits are paid as a lump sum equal to the participant’s hypothetical account balance under the Plan.
136
Table of Contents
Del Monte Corporation Supplemental Executive Retirement Plan (SERP)
The Del Monte Corporation Supplemental Executive Retirement Plan (“SERP”) was established effective December 20, 2002 for named former Heinz employees (“Heinz Participants”), as required in connection with Del Monte’s acquisition of certain former businesses of H.J. Heinz Company. Effective as of January 1, 2005, the SERP was amended and restated to also include all employees at the level of vice president or above who are not otherwise Heinz Participants (“Del Monte Participants”). A Del Monte Participant generally was required to remain employed until at least December 20, 2007 (five years following the consummation of the merger with the former Heinz businesses) in order for such Del Monte Participant to vest in the SERP benefit. Messrs. Bodner, Wolford, Meyers, Lommerin, Cole, and Allen are Del Monte Participants.
Like the Additional Benefits Plan—Qualified Pension Plan Portion, the SERP is a nonqualified benefit plan. No funds are set aside in a trust for payment of benefits under the SERP. Rather, benefits are paid from Del Monte’s general assets. Accordingly, participants in the SERP are general creditors of Del Monte with respect to the payment of these benefits.
A participant vests in his SERP benefit upon attaining age 55 and at least 5 years of service. Additionally, in order to vest in his SERP benefit, a Del Monte Participant must be employed at the level of vice president or higher for at least three years.
Benefit Amount. The SERP benefit is a lump sum benefit equal to a multiple of final average compensation (which, for purposes of the SERP, is the average of the highest five calendar years of compensation out of the last 10 years), offset by other benefits as described below. Eligible compensation under the SERP includes all eligible compensation under the Qualified Pension Plan, without regard to Internal Revenue Code limits. Additionally, as under the Additional Benefits Plan—Qualified Pension Plan Portion, awards under the Del Monte Foods Company Annual Incentive Plan or Program that are deferred under the Del Monte Corporation AIP Deferred Compensation Plan are also included as eligible compensation under the SERP.
The multiple of final average compensation used is based on years of service:
| Years of Service (1) |
Multiple of Final Average Compensation |
|||
| Less than 5 years |
— | |||
| 5 years |
1.0 | |||
| 10 years |
2.0 | |||
| 15 years |
3.0 | |||
| 20 years |
3.5 | |||
| 25 years |
4.0 | |||
| 30 years |
4.5 | |||
| 35 years |
5.0 Maximum | |||
| (1) | For ease of presentation, years of service and the corresponding multiple of final average compensation are presented in the table above in five-year increments. However, between five and thirty-five years of service, the multiple actually increases based on one-year increments. |
The SERP benefit is reduced by any benefits payable to the named executive officer under Del Monte’s qualified and other nonqualified pension plans. Notwithstanding the foregoing, the SERP benefit is not reduced by benefits based on employee contributions under any plan or employer matching contributions in any 401(k) plan, including the Del Monte Savings Plan.
Distribution of Benefits. For each named executive officer, a SERP benefit is paid in a lump sum in the seventh full calendar month after termination of employment for any reason other than death or cause, provided he is vested in his benefit. If a participant dies while actively employed but after vesting in his SERP benefit, a benefit of 85% of the SERP benefit is paid to the designated beneficiary on the thirtieth day following the date of death. Termination for cause (as defined in the SERP) results in complete forfeiture of SERP benefits. “Cause” is based on the definition of “cause” in the executive’s employment agreement.
137
Table of Contents
Fiscal 2011 Nonqualified Deferred Compensation
| Name |
Plan Name (1) |
Executive Contributions in Last Fiscal Year ($) |
Registrant Contributions in Last Fiscal Year ($) |
Aggregate Earnings in Last Fiscal Year ($) |
Aggregate Withdrawals/ Distributions ($) |
Aggregate Balance at Last Fiscal Year-End ($) |
||||||||||||||||
| Neil Harrison |
— | $ | — | $ | — | $ | — | $ | — | $ | — | |||||||||||
| Larry E. Bodner |
DMC AIP Deferred Compensation Plan |
— | — | 39,437 | 132,365 | 34,361 | ||||||||||||||||
| DMFC Deferred Compensation Plan |
— | — | — | — | — | |||||||||||||||||
| Additional Benefits Plan—401(k) Plan Portion |
— | 5,189 | — | 5,189 | — | |||||||||||||||||
| Deferred PARS |
— | — | — | — | — | |||||||||||||||||
| Richard G. Wolford |
DMC AIP Deferred Compensation Plan |
— | — | 641,439 | 2,181,014 | 543,946 | ||||||||||||||||
| DMFC Deferred Compensation Plan |
— | — | — | — | — | |||||||||||||||||
| Additional Benefits Plan—401(k) Plan Portion |
— | 26,704 | 3,096 | 26,704 | 201,427 | |||||||||||||||||
| Deferred PARS |
— | — | 715,529 | 2,866,545 | — | |||||||||||||||||
| David L. Meyers |
DMC AIP Deferred Compensation Plan |
— | — | 747,968 | 2,524,789 | 651,026 | ||||||||||||||||
| DMFC Deferred Compensation Plan |
673,868 | — | — | 673,868 | — | |||||||||||||||||
| Additional Benefits Plan—401(k) Plan Portion |
— | 9,035 | — | 9,035 | — | |||||||||||||||||
| Deferred PARS |
— | — | 160,005 | 641,012 | — | |||||||||||||||||
| Nils Lommerin |
DMC AIP Deferred Compensation Plan |
— | — | 1,303,418 | 4,571,743 | 1,122,576 | ||||||||||||||||
| DMFC Deferred Compensation Plan |
888,215 | — | — | 888,215 | — | |||||||||||||||||
| Additional Benefits Plan—401(k) Plan Portion |
— | 11,852 | — | 11,852 | — | |||||||||||||||||
| Deferred PARS |
— | — | — | — | — | |||||||||||||||||
| Timothy A. Cole |
DMC AIP Deferred Compensation Plan |
— | — | 316,492 | 1,064,798 | 275,612 | ||||||||||||||||
| DMFC Deferred Compensation Plan |
— | — | — | — | — | |||||||||||||||||
| Additional Benefits Plan—401(k) Plan Portion |
— | 6,742 | 380 | — | 31,432 | |||||||||||||||||
| Deferred PARS |
— | — | — | — | — | |||||||||||||||||
| David W. Allen |
DMC AIP Deferred Compensation Plan |
— | — | 297,848 | 999,744 | 259,482 | ||||||||||||||||
| DMFC Deferred Compensation Plan |
— | — | — | — | — | |||||||||||||||||
| Additional Benefits Plan—401(k) Plan Portion |
— | 5,452 | — | 5,452 | — | |||||||||||||||||
| Deferred PARS |
— | — | — | — | — | |||||||||||||||||
| (1) | For purposes of the above table: |
| • | DMC AIP Deferred Compensation Plan is the Del Monte Corporation AIP Deferred Compensation Plan (which was frozen in fiscal 2010); |
| • | DMFC Deferred Compensation Plan is the Del Monte Foods Company Deferred Compensation Plan (which replaced the frozen Del Monte Corporation AIP Deferred Compensation Plan); |
| • | Additional Benefits Plan—401(k) Plan Portion is the portion of the Del Monte Corporation Additional Benefits Plan that relates to the Del Monte Savings Plan, a 401(k) plan; and |
| • | Deferred PARS represent performance accelerated restricted stock units (PARS) awarded under the Del Monte Foods Company 2002 Stock Incentive Plan that have vested but were deferred. |
138
Table of Contents
Narrative Discussion of Fiscal 2011 Nonqualified Deferred Compensation Table
DMC AIP Deferred Compensation Plan
Executive Contributions in Last Fiscal Year. The DMC AIP Deferred Compensation Plan was frozen in fiscal 2010, and no new deferrals with respect to fiscal 2010 or any plan year thereafter were permitted.
Registrant Contributions in Last Fiscal Year. There were no registrant contributions with respect to the DMC AIP Deferred Compensation Plan in fiscal 2011.
Aggregate Earnings in Last Fiscal Year. With respect to the DMC AIP Deferred Compensation Plan, the Aggregate Earnings in Last Fiscal Year column reflects the crediting of dividends, which are converted into additional deferred stock units. The dollar amount of dividends that were converted during fiscal 2011 and the related deferred stock units issued to the named executive officers are set forth below. These deferred stock units were subject to vesting to the same extent as the deferred stock units with respect to which they were issued.
| Name |
Dividends Credited in Fiscal 2011 with respect to Deferred Stock Units Issued under the DMC AIP Deferred Compensation Plan ($) |
Deferred Stock Units Issued in Fiscal 2011 in Lieu of Dividends (#) |
||||||
| Neil Harrison |
$ | — | — | |||||
| Larry E. Bodner |
2,752 | 189 | ||||||
| Richard G. Wolford |
45,034 | 3,088 | ||||||
| David L. Meyers |
52,477 | 3,599 | ||||||
| Nils Lommerin |
94,907 | 6,508 | ||||||
| Timothy A. Cole |
22,131 | 1,518 | ||||||
| David W. Allen |
20,780 | 1,425 | ||||||
With respect to the DMC AIP Deferred Compensation Plan, the Aggregate Earnings in Last Fiscal Year column also reflects the impact of changes in the value of the DMFC common stock underlying the deferred stock units credited to each named executive officer. Such impact has been calculated as follows:
| • | With respect to any deferred stock units issued in fiscal 2011, the per-share Merger consideration paid in connection with the Merger ($19.00) minus the value used to determine the number of deferred stock units to be issued (i.e., the average of the high and low price of DMFC common stock on the applicable issuance date); and |
| • | With respect to any deferred stock units issued prior to fiscal 2011, the per-share Merger consideration paid in connection with the Merger ($19.00) minus the closing price on May 2, 2010 (the last business day of fiscal 2010). |
On March 8, 2011, following the consummation of the Merger, the deferred stock units allocated to the employer contribution accounts were converted to cash and allocated to hypothetical investment accounts selected by the executive and credited with gains or losses according to the gains or losses of the investments to which the hypothetical investment accounts are linked. Aggregate Earnings in Last Fiscal Year column also reflects the impact of changes in the value of such investments.
Aggregate Withdrawals / Distributions. In connection with the Merger, all deferred stock units allocated to employee contribution accounts were converted to cash, based on the per-share Merger consideration of $19.00, and distributed upon the closing of the Merger. Deferred stock units allocated to employer contribution accounts were converted to cash and remain subject to deferral.
Aggregate Balance at Last Fiscal Year-End. With respect to the DMC AIP Deferred Compensation Plan, the Aggregate Balance at Last Fiscal Year-End column represents the value of the employer contribution accounts held by the named executive officers at the end of fiscal 2011. No funds are set aside in a trust for payment of benefits under the DMC AIP Deferred Compensation Plan. Rather, benefits are paid from Del Monte’s general assets. Accordingly, participants in the DMC AIP Deferred Compensation Plan are general creditors of Del Monte with respect to the payment of these benefits.
DMFC Deferred Compensation Plan
Executive Contributions in Last Fiscal Year. The amount reported under the Executive Contributions in Last Fiscal Year column with respect to the DMFC Deferred Compensation Plan represents the portion of the Annual Incentive Program payment relating to fiscal 2010 that was deferred by the named executive officer. Annual Incentive Program payments typically occur in late June/early July, following completion of Del Monte’s fiscal year and determination by the Compensation Committee of the appropriate award amount for each executive officer. Accordingly, such amounts did not become executive contributions and were not credited under the DMFC
139
Table of Contents
Deferred Compensation Plan until fiscal 2011. Amounts contributed by each named executive officer in fiscal 2011 under the DMFC Deferred Compensation Plan have been reported in the Summary Compensation Table as Non-Equity Incentive Plan Compensation for fiscal 2010.
Registrant Contributions in Last Fiscal Year. There are no registrant contributions under the DMFC Deferred Compensation Plan.
Aggregate Earnings in Last Fiscal Year. Cash amounts deferred under the DMFC Deferred compensation Plan are allocated to hypothetical investment accounts selected by the executive and credited with gains or losses according to the gains or losses of the investments to which the hypothetical investment accounts are linked.
Aggregate Withdrawals / Distributions. As described above in “—Compensation Discussion and Analysis—Overview—Effect of the Merger on Certain Compensation Arrangements,” all deferral accounts under the DMFC Deferred Compensation Plan were distributed in connection with the closing of the Merger.
Additional Benefits Plan—401(k) Plan Portion
Executive Contributions in Last Fiscal Year. There are no executive contributions under the portion of the Del Monte Corporation Additional Benefits Plan that relates to the Del Monte Savings Plan (a 401(k) plan).
Registrant Contributions in Last Fiscal Year. The amount reported under the Registrant Contributions in Last Fiscal Year column with respect to the Additional Benefits Plan—401(k) Plan Portion represents supplemental matching contributions made by Del Monte that cannot be provided under the Del Monte Savings Plan due to Internal Revenue Code limits. All such amounts have been included in the Summary Compensation Table as All Other Compensation for fiscal 2011.
Under the Additional Benefits Plan—401(k) Plan Portion, supplemental matching contributions based on the matching contribution terms of the Del Monte Savings Plan are paid in a lump sum in the calendar year after the Internal Revenue Code limitation would have been applied, or, if the participant elects before the beginning of that calendar year, supplemental matching contributions are deferred. Del Monte’s contributions under this Plan are not impacted by whether a participant elects to defer such contributions or not. Additionally, Del Monte’s contributions under this Plan are not impacted by whether a participant elects to defer compensation under the 401(k) Plan or not.
Aggregate Earnings in Last Fiscal Year. With respect to the Additional Benefits Plan—401(k) Plan Portion, reported amounts in the Aggregate Earnings in Last Fiscal Year column represent earnings on amounts deferred by the participant in prior years. For information regarding how these earnings are calculated, see “—Narrative Discussion of Plans Reflected in Fiscal 2011 Nonqualified Deferred Compensation Table—Del Monte Corporation Additional Benefits Plan – Portion Relating to the Del Monte Savings Plan—Earnings” below.
If a participant did not elect to defer supplemental matching contributions under the Additional Benefits Plan—401(k) Plan Portion, such contributions are withdrawn soon after contribution and there are no earnings with respect to such amounts.
Aggregate Withdrawals / Distributions. With respect to the Additional Benefits Plan—401(k) Plan Portion, the Aggregate Withdrawals/Distributions column for Messrs. Bodner, Wolford, Meyers, Lommerin and Allen represents amounts paid during fiscal 2011 because Messrs. Bodner, Wolford, Meyers, Lommerin and Allen did not elect to defer the supplemental matching contributions for calendar 2010. Mr. Cole elected to defer such supplemental matching contributions for calendar 2010 and accordingly had no distributions under this Plan in fiscal 2011.
Aggregate Balance at Last Fiscal Year-End. With respect to the Additional Benefits Plan—401(k) Plan Portion, the Aggregate Balance at Last Fiscal Year-End column reflects amounts deferred by the named executive officer, together with aggregate earnings. Because Messrs. Bodner, Meyers, Lommerin and Allen have never deferred their supplemental matching contributions, none of them currently has a balance under the Additional Benefits Plan—401(k) Plan Portion. Although Mr. Wolford did not defer his supplemental matching contribution for calendar 2010, he had deferred such contributions for certain previous calendar years, generating (with earnings) the aggregate balance reflected in the Fiscal 2010 Nonqualified Deferred Compensation Table. Mr. Cole deferred his supplemental matching contribution for calendar 2010 and for prior years, generating the aggregate balance reflected in the table.
Deferred PARS
Executive Contributions in Last Fiscal Year. The Deferred PARS resulted from a one-time deferral in fiscal 2010 of vested PARS. There were no executive contributions in connection with the Deferred PARS in fiscal 2011.
140
Table of Contents
Registrant Contributions in Last Fiscal Year. There were no registrant contributions in connection with the Deferred PARS in fiscal 2011.
Aggregate Earnings in Last Fiscal Year. With respect to the Deferred PARS, the Aggregate Earnings in Last Fiscal Year column reflects the crediting of dividends, which were converted into additional deferred stock units. The dollar amount of dividends that were converted during fiscal 2011 and the related deferred stock units issued to the named executive officers are set forth below.
| Name |
Dividends Credited in Fiscal 2011 with respect to Deferred Stock Units Issued under the Deferred PARS ($) |
Deferred Stock Units Issued in Fiscal 2011 in Lieu of Dividends (#) |
||||||
| Neil Harrison |
$ | — | — | |||||
| Larry E. Bodner |
— | — | ||||||
| Richard G. Wolford |
26,556 | 1,940 | ||||||
| David L. Meyers |
5,938 | 434 | ||||||
| Nils Lommerin |
— | — | ||||||
| Timothy A. Cole |
— | — | ||||||
| David W. Allen |
— | — | ||||||
With respect to the Deferred PARS, the Aggregate Earnings in Last Fiscal Year column also reflects the impact of changes in the value of the DMFC common stock underlying the deferred stock units credited to each named executive officer, calculated as the per-share Merger consideration paid in connection with the Merger ($19.00) minus the value used to determine the number of deferred stock units to be issued (i.e., the average of the high and low price of Del Monte’s common stock on the applicable issuance date).
Aggregate Withdrawals / Distributions. In connection with the Merger, all deferred stock units underlying Deferred PARS were converted to cash, based on the per-share Merger consideration of $19.00, and distributed upon the closing of the Merger.
Aggregate Balance at Last Fiscal Year-End. There was no outstanding balance of Deferred PARS at the end of fiscal 2011.
Narrative Discussion of Plans Reflected in Fiscal 2011 Nonqualified Deferred Compensation Table
In fiscal 2011, Del Monte tracked nonqualified deferred compensation for its named executive officers under four plans:
| • | the Del Monte Corporation AIP Deferred Compensation Plan, which allowed for deferrals of Annual Incentive Plan or Program payments, up to and including the fiscal 2009 AIP payment; |
| • | the Del Monte Foods Company Deferred Compensation Plan, which allowed for deferrals of Annual Incentive Plan or Program payments, beginning with the fiscal 2010 AIP payment; |
| • | the portion of the Additional Benefits Plan relating to the Del Monte Savings Plan, which provides supplemental matching contributions that cannot be provided under the Del Monte Savings Plan due to Internal Revenue Code limits; and |
| • | the 2002 Stock Plan, pursuant to which the vested but deferred performance accelerated restricted stock units (Deferred PARS) were awarded. |
Del Monte Corporation AIP Deferred Compensation Plan
On September 24, 2009, the Board of Directors of Del Monte Foods Company and the Board of Directors of Del Monte Corporation (Del Monte Foods Company’s wholly owned subsidiary) froze the Del Monte Corporation AIP Deferred Compensation Plan (the “DMC AIP Deferred Compensation Plan”) effective October 1, 2009. Accordingly, on and after October 1, 2009, no new deferrals could be made under the DMC AIP Deferred Compensation Plan and no new participants could be admitted under the Plan. The freezing of the DMC AIP Deferred Compensation Plan did not affect amounts held in the Plan as of October 1, 2009 for the benefit of participants in the Plan as of October 1, 2009.
As described above in “—Compensation Discussion and Analysis —Overview—Effect of the Merger on Certain Compensation Arrangements,” the elective deferral accounts (i.e., the portion associated with amounts deferred and therefore contributed by the executive, as opposed to Company match amounts) were terminated and all obligations thereunder were distributed. Amounts associated with the employer contribution accounts (i.e., the Company match amounts and earnings thereon) became fully vested and remain outstanding and deferred.
141
Table of Contents
Contributions. Eligible employees were able to elect to defer from 5% to 100% of their annual incentive award paid under the Del Monte Foods Company Annual Incentive Plan or Program. Del Monte provided a matching contribution of up to 25% of the employee’s deferral amount. The employee deferral and the Del Monte match were converted to deferred stock units at the fair market value of DMFC common stock on the day the annual incentive award was otherwise paid, specifically the average of the high and low price for DMFC common stock on such date. The employee deferrals were always 100% vested. Del Monte’s matching contributions were subject to vesting in equal installments over three fiscal years. In connection with the Merger, participants became 100% vested in Del Monte’s matching contribution.
Earnings. Prior to the Merger, deferred stock units issued pursuant to the terms of the DMC AIP Deferred Compensation Plan were credited with dividends in the form of additional deferred stock units. The number of additional deferred stock units credited was determined by multiplying the number of deferred stock units held by the named executive officer on the applicable dividend record date by the per share cash dividend declared, and then dividing such amount by the average of the high and low price of Del Monte’s common stock on the applicable dividend payment date. These additional deferred stock units were subject to vesting to the same extent as the deferred stock units with respect to which they were issued. In connection with the Merger, deferred stock units remaining outstanding under the DMC AIP Deferred Compensation Plan (i.e., amounts allocated to the employer contribution accounts) were converted to cash amounts credited to bookkeeping accounts; with respect to such amounts, employees may select from a range of phantom investment alternatives that mirror the gains and/or losses of the investment choices offered under the Del Monte Savings Plan (Del Monte’s 401(k) plan). Employees may make changes to their selection of phantom investment alternatives on a daily basis.
Distributions. As described above in “—Compensation Discussion and Analysis—Overview—Effect of the Merger on Certain Compensation Arrangements,” the amounts allocated to elective deferral accounts were distributed to the participants. Generally, vested amounts remaining deferred in the DMC AIP Deferred Compensation Plan (i.e., amounts allocated to Company match accounts) are paid following the earliest to occur of the executive officer’s termination of employment, death, or disability. Generally, payment is made in the form of either a lump sum or installments, depending on the type of event triggering payment, and any applicable executive officer elections.
Del Monte Foods Company Deferred Compensation Plan
On September 24, 2009, the Board of Directors of Del Monte Foods Company adopted the Del Monte Foods Company Deferred Compensation Plan (the “DMFC Deferred Compensation Plan”) effective October 1, 2009. Generally, employees at a vice president level or above, including executive officers, were eligible to participate in the DMFC Deferred Compensation Plan. In connection with the Merger, the DMFC Deferred Compensation Plan was terminated and all amounts outstanding thereunder were distributed to participants.
Contributions. Eligible employees were able to defer from 5% to 100% of their annual incentive award paid under the Del Monte Foods Company Annual Incentive Plan or Program. Such deferred amounts were credited to a bookkeeping account established in the name of the employee on the day the annual incentive award was otherwise paid. The employee was always 100% vested in his contribution and any earnings thereon. Del Monte did not make any matching or discretionary contributions to the DMFC Deferred Compensation Plan.
Earnings. At the time of deferral, with respect to the allocation of amounts credited to their bookkeeping accounts, employees selected from a range of phantom investment alternatives that mirrored the gains and/or losses of the investment choices (other than DMFC common stock) offered under the Del Monte Savings Plan.
Distributions. In connection with the Merger, the DMFC Deferred Compensation Plan was terminated and all amounts outstanding thereunder were distributed to participants.
Del Monte Corporation Additional Benefits Plan—Portion Relating to the Del Monte Savings Plan
The portion of the Del Monte Corporation Additional Benefits Plan that relates to the Del Monte Savings Plan (the “Additional Benefits Plan—401(k) Plan Portion”) is an “excess” benefit plan designed to provide supplemental matching contributions that cannot be provided under the Del Monte Savings Plan due to Internal Revenue Code limits. In fiscal 2011, each named executive officer other than Mr. Harrison participated in the Additional Benefits Plan—401(k) Plan Portion.
No funds are set aside in a trust for payment of benefits under the Additional Benefits Plan. Rather, benefits are paid from Del Monte’s general assets. Accordingly, participants in the Additional Benefits Plan are general creditors of Del Monte with respect to the payment of these benefits.
Contributions. There are no executive contributions under the Additional Benefits Plan.
142
Table of Contents
Contributions by Del Monte are awarded once a year as of the end of the calendar year. In order to receive a contribution under the Additional Benefits Plan—401(k) Plan Portion, an executive must be eligible to participate in the Del Monte Savings Plan (one year of employment required). Additionally, an executive must be entitled to vesting of his Company matching contributions under the Del Monte Savings Plan if he were to participate in the Del Monte Savings Plan (two years of employment required). Accordingly, no amounts are contributed with respect to any executive officer until the calendar year-end following the second anniversary of an executive’s date of hire.
In general, contributions are determined by multiplying the amount of the executive’s compensation recognized for Del Monte Savings Plan purposes that exceeds applicable IRS limits ($245,000 for calendar 2011), by the maximum percentage of employee pre-tax contribution that can attract Company match amounts under the Del Monte Savings Plan (currently 6%) and by the percentage level of Company match under the Del Monte Savings Plan (currently 50%). Currently, this results in a contribution equal to 3% of compensation in excess of applicable IRS limits. Phantom interest is then applied to such amount to arrive at the actual contribution amount. The phantom interest is credited with respect to the period compensation exceeded the IRS limit and accordingly amounts could not be credited under the Del Monte Savings Plan. The rate used for such phantom interest is the same as the rate used to credit earnings under the Additional Benefits Plan—401(k) Plan Portion (as discussed below). In general, only base salary is treated as compensation under the Del Monte Savings Plan. Equity compensation and Annual Incentive Plan or Program payments are not included as compensation.
At the end of the calendar year following the second anniversary of an executive’s date of hire, a “catch-up” amount is also contributed. This catch-up amount is the amount that would have been contributed at the end of the calendar year following the first anniversary of the executive’s date of hire, had the executive been eligible to participate in the Additional Benefits Plan—401(k) Plan Portion at that time, increased by the applicable phantom interest since such calendar year-end.
Earnings. If a participant elects to defer supplemental matching contributions under the Additional Benefits Plan—401(k) Plan Portion, such deferred amounts are credited with earnings. Such earnings are based on the stable value fund available under the Del Monte Savings Plan. Interest is credited for each calendar year by applying the interest rate to the January 1 account balance (if any) for each month during that year. During fiscal 2011, the average monthly rate reflected by such stable value fund was 0.13%.
Distributions. Supplemental matching contributions based on the Del Monte Savings Plan are paid in a lump sum in the calendar year after the IRS limitation would have been applied (i.e., such amounts are withdrawn soon after contribution). Alternatively, if the participant elects before the beginning of that calendar year, supplemental matching contributions are deferred, with earnings as described above, typically until the January after the year of termination of employment (regardless of cause), or if later (with respect to any termination other than death), in the seventh full calendar month after termination of employment, and then paid in a lump sum.
Deferred PARS
Contributions. Our performance accelerated restricted stock units (PARS) provided for cliff vesting on the fifth-anniversary of the grant date, with an opportunity to accelerate vesting upon the achievement of established relative total shareholder return (RTSR) targets. Our RTSR performance through fiscal 2010 resulted in the vesting of the fiscal 2007 and fiscal 2008 PARS grants at the end of fiscal 2010. The application of Section 409A to the resulting vested PARS required the deferral of receipt of a portion of those vested PARS held by employees who were retirement-eligible (defined as having attained age 55 with at least 10 years of service). Such deferred PARS were deemed to be contributions made by the executive officer, where applicable, and were recorded as deferred stock units. Such deferrals were permitted under the terms of the PARS grants as well as under the 2002 Stock Incentive Plan pursuant to which such grants were made.
Earnings. The deferred PARS were credited with dividends in the form of additional deferred stock units, beginning after the date on which such deferred PARS were credited to the executive officers’ deferral accounts, which was May 27, 2010. The number of additional deferred stock units credited was determined by multiplying the number of deferred stock units held by the named executive officer on the applicable dividend record date by the per share cash dividend declared, and then dividing such amount by the average of the high and low price of Del Monte’s common stock on the applicable dividend payment date. These additional deferred stock units were vested upon issuance because the deferred PARS with respect to which they were issued were vested.
Distributions. In connection with the Merger, pursuant to the terms of the Deferred PARS, all deferred stock units relating to the deferred PARS were converted to cash based on the per-share Merger consideration ($19.00) and distributed to participants.
Potential Payments Upon Employment Termination and Change-of-Control Events
Neil Harrison
Mr. Harrison does not participate in any arrangements with the Company providing for payments or benefits as a result of a termination of employment or a change of control of the Company.
143
Table of Contents
Richard G. Wolford
Mr. Wolford retired from Del Monte on March 8, 2011, effective immediately following the closing of the Merger. Mr. Wolford’s employment agreement provided that, in the event of his retirement within two years after a Change of Control, the Company must pay or provide Mr. Wolford:
| • | a cash severance amount equal to 2.99 times (2.99x) his current annual base salary and target AIP Award; |
| • | a portion of his target AIP Award for the year in which termination occurs, prorated for his actual employment during such year and based on the greater of target or performance, paid in a lump sum; |
| • | a cash perquisite payment equal to two times (2x) his annual perquisite allowance paid in a lump sum; |
| • | executive health and welfare benefit continuation for two years—including executive medical and dental, prescription drug, life, accidental death and disability (AD&D), and short- and long-term disability insurance plans, programs and arrangements, or programs that are no less favorable in the aggregate; |
| • | a 280G gross-up payment, if applicable; and |
| • | pursuant to the 2002 Stock Plan and the AIP Deferred Compensation Plan, full vesting of all of his outstanding equity awards as of the effective date of the Change of Control. |
The table below summarizes payments and benefits Mr. Wolford received, or became entitled to receive, in connection with the Merger and his subsequent retirement. Amounts shown in the table below represent vesting triggered or affected by the Merger and his subsequent retirement only. Accordingly, amounts paid with respect to previously vested stock options, which are reflected in the table set forth above under Fiscal 2011 Option Exercises and Stock Vested, are not reflected in the table below.
| Cash Compensation: |
||||
| Severance Multiple of Base Salary and Target Annual Incentive Plan (AIP) Award |
$ | 7,095,271 | ||
| Severance Perquisite Allowance |
84,000 | |||
| Severance Pro-rata Target AIP Award |
1,439,757 | |||
| Equity Compensation |
||||
| Performance Shares |
16,524,300 | |||
| Performance Accelerated Restricted Stock (PARS) and RSUs |
4,687,300 | |||
| Stock Options - Accelerated |
12,638,634 | |||
| Stock Options - Vested |
20,700,903 | |||
| Retirement Deferred Compensation |
||||
| Supplemental Executive Retirement Plan (SERP) |
4,043,752 | |||
| ABP—Qualified Pension Plan Portion |
3,179,904 | |||
| ABP—401(k) Plan Portion |
202,174 | |||
| AIP Deferred Compensation Plan |
— | |||
| Other Benefits: |
||||
| Post-termination Health and Welfare Benefit Continuation |
69,114 | |||
| 280G Excise Tax Gross-up |
— | |||
| Total: |
$ | 70,665,109 | ||
David L. Meyers
David Meyers resigned from Del Monte on March 8, 2011, effective immediately following the closing of the Merger. His resignation constituted resignation for Good Reason as defined in his employment agreement. Mr. Meyers’ employment agreement provided that, in the event of his resignation for Good Reason within two years after a Change of Control, the Company must pay or provide Mr. Meyers:
| • | a cash severance amount equal to two times (2x) his current annual base salary and target AIP Award, paid in a lump sum; |
| • | a portion of his target AIP Award for the year in which termination occurs (adjusted to reflect performance), prorated for Mr. Meyers’ actual employment during such year paid in a lump sum; |
144
Table of Contents
| • | a cash perquisite payment equal to his annual perquisite allowance paid in a lump sum; |
| • | health and welfare benefit continuation for 36 months—including executive medical and dental, prescription drug, life, and AD&D insurance plans, programs and arrangements; |
| • | an additional benefit under the Additional Benefits Plan—Qualified Pension Plan portion relating to Mr. Meyers’ cash severance; |
| • | full accelerated vesting of all outstanding equity awards pursuant to the 2002 Stock Plan; |
| • | a 280G gross-up payment, if applicable; |
| • | executive-level outplacement services for 18 months in an amount not to exceed in any calendar year 18% of Mr. Meyers’ base salary and target AIP Award; and |
| • | office and secretarial services for a six-month period immediately following termination of employment. |
The table below summarizes payments and benefits Mr. Meyers received, or became entitled to receive, in connection with the Merger and his subsequent resignation. Amounts shown in the tables below represent vesting triggered or affected by the Merger and his subsequent resignation only. Accordingly, amounts paid with respect to previously vested stock options, which are reflected in the table set forth above under Fiscal 2011 Option Exercises and Stock Vested, are not reflected in the table below.
| Cash Compensation: |
||||
| Severance Multiple of Base Salary and Target Annual Incentive Plan (AIP) Award |
$ | 1,880,000 | ||
| Severance Perquisite Allowance |
36,000 | |||
| Severance Pro-rata Target AIP Award |
445,254 | |||
| Equity Compensation |
||||
| Performance Shares |
3,545,400 | |||
| Performance Accelerated Restricted Stock (PARS) and RSUs |
991,800 | |||
| Stock Options - Accelerated |
2,695,901 | |||
| Stock Options - Vested |
5,888,066 | |||
| Retirement Deferred Compensation |
||||
| Supplemental Executive Retirement Plan (SERP) |
2,644,390 | |||
| ABP—Qualified Pension Plan Portion |
1,411,433 | |||
| ABP—401(k) Plan Portion |
— | |||
| AIP Deferred Compensation Plan |
331,053 | |||
| Other Benefits: |
||||
| Post-termination Health and Welfare Benefit Continuation |
107,051 | |||
| 280G Excise Tax Gross-up |
— | |||
| Total: |
$ | 19,976,348 | ||
Larry E. Bodner, Nils Lommerin, Tim A. Cole, David W. Allen
Each of Messrs. Bodner, Lommerin, Cole, and Allen currently have employment agreements with the Company that provide for payments and benefits in connection with their respective terminations of employment under various circumstances, including a Change of Control. These benefits are summarized in the narrative and table below. As a condition of receiving any severance benefits, each named executive officer must execute a full waiver and release of all claims against the Company and its affiliates and agree to abide by certain covenants regarding confidentiality, non-solicitation of Company employees, non-interference with the Company’s business relationships and non-disparagement of the Company and its products.
In addition to the benefits described below, upon termination of employment the named executive officers may also be eligible for other benefits that are generally available to all salaried employees, such as life insurance, long-term disability, and qualified plan benefits (pension and 401(k)). For information regarding benefits under the Del Monte Corporation Retirement Plan, see “Fiscal 2011 Pension Benefits.”
145
Table of Contents
For purposes of the employment arrangements with each of these executive officers, the following definitions apply:
“Change of Control” generally means the occurrence of any one of the following:
| • | the sale of all or substantially all of the assets of Blue Holdings I, L.P., Parent, or the Company; |
| • | a merger, recapitalization or other sale transaction by Blue Holdings I, L.P., Parent, the Company, the Sponsors, or any of their respective affiliates, of equity interests or voting power that results in any person owning more than 50% of the equity interests or voting power of Blue Holdings I, L.P., Parent, or the Company, as applicable; or |
| • | any event which results in the Sponsors or affiliates ceasing to hold the ability to elect a majority of the managers of the General Partner of Blue Holdings I, L.P., or members of the board of directors of Blue Holdings I., L.P., or members of the board of directors of Parent, as applicable. |
“Cause,” as determined by the Board, generally means the occurrence of one of the following:
| • | a material breach by the executive of the terms of his agreement; |
| • | any act of theft, misappropriation, embezzlement, intentional fraud or similar conduct by the executive involving Del Monte or any affiliate; |
| • | the conviction or the plea of nolo contendere or the equivalent in respect of a felony involving an act of dishonesty, moral turpitude, deceit or fraud by the executive; |
| • | any damage of a material nature to the business or property of Del Monte or any affiliate caused by the executive’s willful or grossly negligent conduct; or |
| • | the executive’s failure to act in accordance with any specific lawful instructions given to the executive in connection with the performance of the executive’s duties. |
“Disability,” as determined by the Board, generally means that for a period of six consecutive months or more the executive has suffered a disability that renders him unable to perform the essential functions of his position, even with a reasonable accommodation.
“Good Reason,” to terminate employment generally exists, as determined by the Board, upon the occurrence of any one of the following events without the executive’s written consent or the failure of the Company to cure the event within ten business days of executive’s notice:
| • | a material adverse change in the executive’s position causing it to be of materially less stature, responsibility, or authority without the executive’s written consent, and such a materially adverse change shall in all events be deemed to occur if the executive no longer serves in the position of his current title; |
| • | a reduction, without the executive’s written consent, in the executive’s base salary or the amount the executive is eligible to earn under the AIP (or successor plan thereto), or for Messrs. Cole and Lommerin, the executive’s incentive or equity opportunity under any material Del Monte incentive or equity program; |
| • | a material reduction without the executive’s consent in the aggregate health and welfare benefits provided to the executive pursuant to the health and welfare plans, programs and arrangements in which the executive is eligible to participate; |
| • | with respect to Mr. Bodner’s employment agreement, the relocation of his principal place of employment beyond 50 miles from its current location without his consent; or |
| • | the failure of Del Monte to obtain a satisfactory agreement from any successor to assume and agree to perform the executive’s employment agreement. |
146
Table of Contents
If the executive’s employment is terminated due to his death, the Company shall pay his estate or designated beneficiary a portion of his target AIP Award for the year in which termination occurs (to the extent the performance objectives for such year are attained), prorated for the executive’s actual employment during such year. If the executive’s employment is terminated by the Company due to his Disability, the Company shall pay him a cash severance amount equal to his current annual base salary and target AIP Award in a lump sum. If the executive’s employment is terminated due to his death or Disability, the executive shall vest with respect to that portion of his options subject to service-based vesting that would have become vested on the next annual vesting date (i.e., the next anniversary of the closing of the Merger).
If the executive’s employment is terminated due to his voluntary resignation without Good Reason or for Cause, he is not entitled to any severance benefits.
If the executive’s employment is terminated by the Company without Cause or he resigns for Good Reason, the Company shall pay or provide him:
| • | a cash severance amount equal to one and one-half times (1 1/2x) his current annual base salary and target AIP Award paid in a lump sum; |
| • | a portion of his target AIP Award for the year in which termination occurs (adjusted to reflect performance), prorated for his actual employment during such year paid in a lump sum; |
| • | a cash perquisite payment equal to one and one-half times (1 1/2x) his annual perquisite allowance paid in a lump sum; |
| • | with respect to Messrs. Lommerin and Cole, health and welfare benefit continuation for 18 months—including medical, dental, prescription drug, life, and AD&D insurance plans, programs and arrangements and, with respect to Messrs. Bodner and Allen, a lump sum in an amount up to the cost of COBRA premiums for participation in such health and welfare benefit programs for 18 months; |
| • | executive-level outplacement services for 18 months in an amount not to exceed in any calendar year 18% of the executive’s base salary and target AIP Award; |
| • | with respect to Mr. Cole, if such termination or resignation occurs prior to December 31, 2012, accelerated vesting of his accrued benefit under the SERP; and |
| • | if the termination or resignation occurs after March 8, 2013 (the second anniversary of the closing of the Merger, pursuant to the 2011 Stock Plan and applicable option agreements, the executive shall vest with respect to that portion of his options subject to service-based vesting that would have become vested on the next annual vesting date (i.e., the next anniversary of the closing of the Merger). |
If the executive’s employment is terminated by the Company without Cause or he resigns for Good Reason within two years after a Change of Control or the Merger, the Company shall provide him the same benefits as provided in the event of his termination without Cause by the Company, with the following exceptions:
| • | the cash severance amount equal to one and one-half times (1 1/2x) his current annual base salary and target AIP Award shall be increased to two times (2x); |
| • | the Company shall pay a 280G gross-up payment on parachute payments provided to the executive; provided that, other than for Mr. Bodner, such gross-up payment shall only be paid if the parachute payments exceed the 280G excess parachute payment criterion by 5% or more; and |
| • | pursuant to the 2011 Stock Plan, upon a Change in Control, all outstanding options subject to service-based vesting shall vest immediately prior to the Change in Control, and, if such Change in Control is pursuant to a transaction wherein the Sponsors realize a cash return on their interests in Parent greater that a predetermined threshold, all outstanding options subject to performance-based vesting shall vest immediately prior to such Change in Control. |
As required, the tables below assume that the termination of employment and/or Change of Control event occurred on the last day of fiscal 2011 (May 1, 2011) and assumes that the price per share of Parent common stock was $5. Also, the tables assume that a year-end adjustment will be necessary at the end of calendar 2011 in order to meet the 4.5% minimum interest rate required under the Del Monte Corporation Retirement Plan for Salaried Employees, and accordingly, the tables below assume that the effective annual rate for interest credits used in estimating the benefit under the Del Monte Corporation Retirement Plan for Salaried Employees and the Del Monte Additional Benefits Plan—Pension Portion is 4.5% for the 2011 calendar year.
Amounts shown in the tables below represent vesting or distributions triggered by termination event only. Accordingly, previously vested stock options, which are reflected in the table set forth under “Outstanding Equity Awards at Fiscal 2011 Year End,” are not reflected in the table below. If achievement of future performance measures is required for vesting purposes, no amount is represented in the table. Retirement and deferred compensation amounts below reflect the estimated lump-sum present value of such benefits.
147
Table of Contents
A Change of Control without a termination event will result in 100% vesting of all the executive’s outstanding service-based options, and, if such Change of Control is pursuant to a transaction wherein the Sponsors realize a cash return on their interests in Parent greater that a predetermined threshold, of all performance-based options. The exercise prices of all options held by our named executive officers that would become vested as a result of a termination or Change of Control event are equal to $5 and accordingly the Stock Option amounts shown in the tables below are zero even under those scenarios in which vesting is triggered.
Table for Larry E. Bodner
| Death ($) | Resignation ($) | Resignation for Good Reason ($) |
Resignation for Good Reason within Two Years After a Change of Control ($) |
Involuntary Termination by Company |
||||||||||||||||||||||||||||
| Permanent Disability ($) |
For Cause ($) |
Without Cause ($) |
Within Two Years After a Change of Control ($) |
|||||||||||||||||||||||||||||
| Cash Compensation: |
||||||||||||||||||||||||||||||||
| Severance Multiple of Base Salary and Target Annual Incentive Plan (AIP) Award |
$ | — | $ | — | $ | 1,287,750 | $ | 1,717,000 | $ | 858,500 | $ | — | $ | 1,287,750 | $ | 1,717,000 | ||||||||||||||||
| Severance Perquisite Allowance |
— | — | 54,000 | 54,000 | — | — | 54,000 | 54,000 | ||||||||||||||||||||||||
| Severance Pro-rata Target AIP Award |
386,114 | — | 386,114 | 386,114 | — | — | 386,114 | 386,114 | ||||||||||||||||||||||||
| Equity Compensation |
||||||||||||||||||||||||||||||||
| Stock Options |
— | — | — | — | — | — | — | — | ||||||||||||||||||||||||
| Retirement Deferred Compensation |
||||||||||||||||||||||||||||||||
| Supplemental Executive Retirement Plan (SERP) |
— | — | — ` | — | — | — | — | — | ||||||||||||||||||||||||
| ABP—Qualified Pension Plan Portion |
141,012 | 141,012 | 141,012 | 141,012 | 141,012 | 141,012 | 141,012 | 141,012 | ||||||||||||||||||||||||
| ABP—401(k) Plan Portion |
— | — | — | — | — | — | — | — | ||||||||||||||||||||||||
| AIP Deferred Compensation Plan |
— | — | — | — | — | — | — | — | ||||||||||||||||||||||||
| Other Benefits: |
||||||||||||||||||||||||||||||||
| Post-termination Health and Welfare Benefit Continuation |
— | — | 22,667 | 22,667 | — | — | 22,667 | 22,667 | ||||||||||||||||||||||||
| 280G Excise Tax Gross-up |
— | — | — | 2,089,525 | — | — | — | 2,089,525 | ||||||||||||||||||||||||
| Total: |
$ | 527,126 | $ | 141,012 | $ | 1,891,543 | $ | 4,410,318 | $ | 999,512 | $ | 141,012 | $ | 1,891,543 | $ | 4,410,318 | ||||||||||||||||
148
Table of Contents
Table for Nils Lommerin
| Death ($) | Resignation ($) | Resignation for Good Reason ($) |
Resignation for Good Reason within Two Years After a Change of Control ($) |
Involuntary Termination by Company | ||||||||||||||||||||||||||||
| Permanent Disability ($) |
For Cause ($) |
Without Cause ($) |
Within Two Years After a Change of Control ($) |
|||||||||||||||||||||||||||||
| Cash Compensation: |
||||||||||||||||||||||||||||||||
| Severance Multiple of Base Salary and Target Annual Incentive Plan (AIP) Award |
$ | — | $ | — | $ | 1,768,500 | $ | 2,358,000 | $ | 1,179,000 | $ | — | $ | 1,768,500 | $ | 2,358,000 | ||||||||||||||||
| Severance Perquisite Allowance |
— | — | 54,000 | 54,000 | — | — | 54,000 | 54,000 | ||||||||||||||||||||||||
| Severance Pro-rata Target AIP Award |
700,978 | — | 700,978 | 700,978 | — | — | 700,978 | 700,978 | ||||||||||||||||||||||||
| Equity Compensation |
||||||||||||||||||||||||||||||||
| Stock Options |
— | — | — | — | — | — | — | — | ||||||||||||||||||||||||
| Retirement Deferred Compensation |
||||||||||||||||||||||||||||||||
| Supplemental Executive Retirement Plan (SERP) |
— | — | — | — | — | — | — | — | ||||||||||||||||||||||||
| ABP—Qualified Pension Plan Portion |
379,183 | 379,183 | 379,183 | 379,183 | 379,183 | 379,183 | 379,183 | 379,183 | ||||||||||||||||||||||||
| ABP—401(k) Plan Portion |
— | — | — | — | — | — | — | — | ||||||||||||||||||||||||
| AIP Deferred Compensation Plan |
— | — | — | — | — | — | — | — | ||||||||||||||||||||||||
| Other Benefits: |
||||||||||||||||||||||||||||||||
| Post-termination Health and Welfare Benefit Continuation |
— | — | 20,169 | 20,169 | — | — | 20,169 | 20,169 | ||||||||||||||||||||||||
| 280G Excise Tax Gross-up |
— | — | — | 4,104,445 | — | — | — | 4,104,445 | ||||||||||||||||||||||||
| Total: |
$ | 1,080,161 | $ | 379,183 | $ | 2,922,830 | $ | 7,616,775 | $ | 1,558,183 | $ | 379,183 | $ | 2,922,830 | $ | 7,616,775 | ||||||||||||||||
149
Table of Contents
Table for Timothy A. Cole
| Death ($) |
Resignation ($) |
Resignation |
Resignation for Good Reason within Two Years After a Change of Control ($) |
Involuntary Termination by Company | ||||||||||||||||||||||||||||
| Permanent Disability ($) |
For Cause ($) |
Without Cause ($) |
Within Two Years After a Change of Control ($) |
|||||||||||||||||||||||||||||
| Cash Compensation: |
||||||||||||||||||||||||||||||||
| Severance Multiple of Base Salary and Target Annual Incentive Plan (AIP) Award |
$ | — | $ | — | $ | 1,216,350 | $ | 1,621,800 | $ | 810,900 | $ | — | $ | 1,216,350 | $ | 1,621,800 | ||||||||||||||||
| Severance Perquisite Allowance |
— | — | 54,000 | 54,000 | — | — | 54,000 | 54,000 | ||||||||||||||||||||||||
| Severance Pro-rata Target AIP Award |
448,635 | — | 448,635 | 448,635 | — | — | 448,635 | 448,635 | ||||||||||||||||||||||||
| Equity Compensation |
||||||||||||||||||||||||||||||||
| Stock Options |
— | — | — | — | — | — | — | — | ||||||||||||||||||||||||
| Retirement Deferred Compensation |
||||||||||||||||||||||||||||||||
| Supplemental Executive Retirement Plan (SERP) |
— | — | — | — | — | — | — | — | ||||||||||||||||||||||||
| ABP—Qualified Pension Plan Portion |
336,794 | 336,794 | 336,794 | 336,794 | 336,794 | 336,794 | 336,794 | 336,794 | ||||||||||||||||||||||||
| ABP—401(k) Plan Portion |
31,583 | 31,583 | 31,583 | 31,583 | 31,583 | 31,583 | 31,583 | 31,583 | ||||||||||||||||||||||||
| AIP Deferred Compensation Plan |
— | — | — | — | — | — | — | — | ||||||||||||||||||||||||
| Other Benefits: |
||||||||||||||||||||||||||||||||
| Post-termination Health and Welfare Benefit Continuation |
— | — | 18,978 | 18,978 | — | — | 18,978 | 18,978 | ||||||||||||||||||||||||
| 280G Excise Tax Gross-up |
— | — | — | 2,357,057 | — | — | — | 2,357,057 | ||||||||||||||||||||||||
| Total: |
$ | 817,012 | $ | 368,377 | $ | 2,106,340 | $ | 4,868,847 | $ | 1,179,277 | $ | 368,377 | $ | 2,106,340 | $ | 4,868,847 | ||||||||||||||||
150
Table of Contents
Table for David W. Allen
| Death ($) | Resignation ($) | Resignation for Good Reason ($) |
Resignation for Good Reason within Two Years After a Change of Control ($) |
Involuntary Termination by Company | ||||||||||||||||||||||||||||
| Permanent Disability ($) |
For Cause ($) |
Without Cause ($) |
Within Two Years After a Change of Control ($) |
|||||||||||||||||||||||||||||
| Cash Compensation: |
||||||||||||||||||||||||||||||||
| Severance Multiple of Base Salary and Target Annual Incentive Plan (AIP) Award |
$ | — | $ | — | $ | 1,072,500 | $ | 1,430,000 | $ | 715,000 | $ | — | $ | 1,072,500 | $ | 1,430,000 | ||||||||||||||||
| Severance Perquisite Allowance |
— | — | 54,000 | 54,000 | — | — | 54,000 | 54,000 | ||||||||||||||||||||||||
| Severance Pro-rata Target AIP Award |
368,386 | — | 368,386 | 368,386 | — | — | 368,386 | 368,386 | ||||||||||||||||||||||||
| Equity Compensation |
||||||||||||||||||||||||||||||||
| Stock Options |
— | — | — | — | — | — | — | — | ||||||||||||||||||||||||
| Retirement Deferred Compensation |
||||||||||||||||||||||||||||||||
| Supplemental Executive Retirement Plan (SERP) |
— | — | — | — | — | — | — | — | ||||||||||||||||||||||||
| ABP—Qualified Pension Plan Portion |
178,901 | 178,901 | 178,901 | 178,901 | 178,901 | 178,901 | 178,901 | 178,901 | ||||||||||||||||||||||||
| ABP—401(k) Plan Portion |
— | — | — | — | — | — | — | — | ||||||||||||||||||||||||
| AIP Deferred Compensation Plan |
— | — | — | — | — | — | — | — | ||||||||||||||||||||||||
| Other Benefits: |
||||||||||||||||||||||||||||||||
| Post-termination Health and Welfare Benefit Continuation |
— | — | 18,719 | 18,719 | — | — ` | 18,719 | 18,719 | ||||||||||||||||||||||||
| 280G Excise Tax |
— | — | — | 1,977,638 | — | — | — | 1,977,638 | ||||||||||||||||||||||||
| Total: |
$ | 547,287 | $ | 178,901 | $ | 1,692,506 | $ | 4,027,644 | $ | 893,901 | $ | 178,901 | $ | 1,692,506 | $ | 4,027,644 | ||||||||||||||||
New CEO Employment Agreement
On May 13, 2011, the Company appointed David J. West as an executive employee and member of the Board of Directors of the Company and Parent and, effective August 15, 2011, as the new CEO of both the Company and Parent. At such time, Mr. West will replace Neil Harrison, the current interim CEO of the Company and Parent. Mr. Harrison will continue to serve as the Vice Chairman of the Board of Directors of both the Company and Parent.
In connection with such appointment, the Company and Parent have entered into an employment agreement with Mr. West (the “West Employment Agreement”), providing for certain benefits in connection with a termination of employment or a change of control of the Company. Upon termination of Mr. West’s employment by the Company without “cause” (other than due to death or disability) or by Mr. West for “good reason” (as such term is defined in the West Employment Agreement), after signing a release of claims against the Company and its affiliates and in addition to certain accrued amounts, Mr. West will be entitled to receive (i) a lump sum payment equal to two times the sum of his base salary and target annual bonus for the year in which termination occurs, (ii) any earned but unpaid annual bonus with respect to the fiscal year preceding the date of termination, (iii) a pro rata portion of the target annual bonus that would have otherwise been payable in respect of the year of termination if he had remained employed through such year, prorated for actual employment and adjusted for performance, (iv) a lump sum payment, on an after-tax basis, equivalent to the cost of applicable COBRA premiums for 18 months, less the sum of what Mr. West’s contributions would have been for 18 months of applicable health and welfare benefits (based on active employee rates in effect immediately prior to termination), (v) a lump sum payment equivalent to two times his annual allowance pursuant to any applicable executive perquisites arrangements, (vi) the provision of not less than 18 months of executive-level outplacement services at the Company’s expense, not to exceed in any calendar year 18% of the sum of Mr. West’s highest base salary during the 12-month period prior to termination and the target bonus for the year of termination, and (vii) accelerated vesting of any then-outstanding portion of certain shares of restricted stock granted pursuant to the West Employment Agreement (“Restricted Stock Grant”), and any accelerated vesting of equity awards that may be provided pursuant to the terms of the applicable equity arrangements.
151
Table of Contents
Upon termination of Mr. West’s employment by the Company due to death or “disability” (as such term is defined in the West Employment Agreement), in addition to certain accrued amounts, he will receive accelerated vesting of any then-outstanding portion of the Restricted Stock Grant and, in the case of a termination due to disability only, after signing a release of claims against the Company and its affiliates, Mr. West will be entitled to receive a lump sum payment equal to the sum of his highest base salary during the 12-month period prior to termination and his target annual bonus for the year in which termination occurs.
In addition, the Company will provide Mr. West with a full gross-up payment in the event that any payment or benefit arising in connection with Mr. West’s services to the Company is subject to an excise tax under Section 4999 of the Internal Revenue Code of 1986, as amended.
Fiscal 2011 Director Compensation—prior to March 8, 2011
The following table sets forth compensation for the members of the Board of Directors of the Company for fiscal 2011 during the period prior to the closing of the Merger. In addition to serving as the Company’s Board of Directors, these directors served on the board of directors of Del Monte Foods Company. Mr. Wolford, the Company’s then Chairman of the Board, President and Chief Executive Officer, did not receive any additional compensation for his service as a director. Mr. Wolford’s compensation is reported in “Executive Compensation” and accordingly, Mr. Wolford is not included in the following table.
| Name |
Fees Earned or Paid in Cash ($) |
Stock Awards ($)(2) |
All Other Compensation ($)(3) |
Total ($) |
||||||||||||
| Samuel H. Armacost |
$ | 105,000 | $ | 103,823 | $ | 353,248 | $ | 562,071 | ||||||||
| Timothy G. Bruer |
107,000 | 103,823 | 353,248 | 564,071 | ||||||||||||
| Mary R. (Nina) Henderson |
98,000 | 103,823 | 353,248 | 555,071 | ||||||||||||
| Victor L. Lund |
121,000 | 103,823 | 353,248 | 578,071 | ||||||||||||
| Terence D. Martin |
137,000 | 103,823 | 353,248 | 594,071 | ||||||||||||
| Sharon L. McCollam |
91,000 | (1) | 103,823 | 353,248 | 548,071 | |||||||||||
| Joe L. Morgan |
83,000 | 103,823 | 353,248 | 540,071 | ||||||||||||
| David R. Williams |
83,000 | 103,823 | 353,248 | 540,071 | ||||||||||||
| (1) | In accordance with Ms. McCollam’s deferral election under the Del Monte Foods Company 2005 Non-Employee Director Deferred Compensation Plan, $68,250 of the fees earned by Ms. McCollam with respect to her services to the Company in fiscal 2011 were converted into 4,498 deferred stock units, all of which were issued in fiscal 2011. |
| (2) | The Stock Awards amount represents the grant date fair value calculated in accordance with FASB ASC Topic 718 of 8,706 restricted stock units granted on September 23, 2010. |
This grant of restricted stock units to the non-employee directors was made pursuant to the Del Monte Foods Company Non-Employee Director Compensation Plan, as amended. For further information regarding such grants, see “—Narrative Discussion of Director Compensation—Del Monte Foods Company Non-Employee Director Compensation Plan —Equity Compensation” below.
Del Monte calculated the fair value of non-employee director stock awards under FASB ASC Topic 718 by first multiplying the average of the high and low price of Del Monte’s common stock on the date of grant by the number of shares subject to such stock award. Then, because the grants of restricted stock units to the non-employee directors were not credited with dividends during the vesting period, Del Monte reduced the value of the stock awards by the present value of the expected dividend stream during the vesting period using the risk-free interest rate in accordance with FASB ASC Topic 718. Del Monte assumed zero anticipated forfeitures in connection with valuing non-employee director stock awards for purposes of FASB ASC Topic 718.
| (3) | The All Other Compensation column reflects the value of unvested restricted stock units held by each individual that were outstanding immediately prior to, and subject to full acceleration of vesting in connection with, the Merger. This value is calculated as the per-share Merger consideration ($19) times the number of such restricted stock units. |
Narrative Discussion of Director Compensation Prior to March 8, 2011
Process
Prior to March 8, 2011, the Nominating and Corporate Governance Committee was responsible for making recommendations to the Board of Directors regarding the compensation of non-employee directors. The Nominating and Corporate Governance Committee was not able to delegate this responsibility, which was set forth in its Charter. The Nominating and Corporate Governance Committee engaged a compensation consultant to conduct a review of director compensation every one to two years. The review included data from other companies (generally, the comparator group then being used in connection with executive compensation) as well as market
152
Table of Contents
trends in director compensation. Del Monte executive officers played no role in recommending or determining non-employee director compensation, except that Mr. Wolford (as a member of the Board of Directors) participated in the deliberations and actions of the Board regarding the recommendations made by the Nominating and Corporate Governance Committee.
The Del Monte Foods Company Non-Employee Director Compensation Plan as in effect during fiscal 2011prior to March 8, 2011 was adopted by the Board of Directors of Del Monte Foods Company on October 23, 2009, following a fiscal 2010 review. The plan was terminated in connection with the Merger.
Del Monte Foods Company Non-Employee Director Compensation Plan
All Del Monte directors other than Richard G. Wolford, the Company’s Chief Executive Officer, were eligible participants under the Del Monte Foods Company Non-Employee Director Compensation Plan.
Cash Retainers. Prior to March 8, 2011, each eligible director earned annual cash retainers, which were paid in quarterly installments in arrears as follows:
| Position |
Annual Retainers in effect prior to March 8, 2011 in Fiscal 2011 |
|||
| Director |
$ | 75,000 | ||
| Lead Director |
$ | 22,000 | ||
| Audit Committee Chair |
$ | 22,000 | ||
| Audit Committee Member (including Chair) |
$ | 16,000 | ||
| Compensation Committee Chair |
$ | 22,000 | ||
| Compensation Committee Member (including Chair) |
$ | 8,000 | ||
| Nominating and Corporate Governance Committee Chair |
$ | 15,000 | ||
| Nominating and Corporate Governance Committee Member (including Chair) |
$ | 8,000 | ||
Meeting Fees. Prior to March 8, 2011, during fiscal 2011, each eligible director earned $2,000 for each Special Committee meeting attended. Such meeting fees were paid quarterly in cash in arrears.
Equity Compensation. Under the Del Monte Foods Company Non-Employee Director Compensation Plan, as amended and restated, each eligible director annually received $110,000 worth of restricted Del Monte Foods Company common stock or restricted stock units granted promptly after each annual meeting. These restricted stock or restricted stock units were subject to vesting over three years from the date of grant (it being understood that in the event the date of the third regularly scheduled annual meeting fell less than three full calendar years from the date of grant, such shares of restricted stock or such restricted stock units would nevertheless vest immediately prior to such annual meeting). Non-employee directors elected or appointed to the Board between annual stockholder meetings received upon election or appointment that percentage of the annual equity compensation dollar amount that equals the percentage of the year (beginning from the first day of the fiscal quarter of such director’s appointment/election) remaining until the next annual stockholders meeting. Such grants were subject to vesting in three approximately equal installments on the same vesting dates applicable to the other directors’ grants. The number of shares of restricted stock or number of restricted stock units issued was calculated by dividing the $110,000 (or such appropriate prorated amount) by the average of the high and low price of Del Monte’s common stock on the date of grant. These equity awards were issued under the Del Monte Foods Company 2002 Stock Incentive Plan. In the event of a Change of Control, as defined in the Del Monte Foods Company 2002 Stock Incentive Plan, as amended, all outstanding restricted stock and restricted stock units were subject to full accelerated vesting. Accordingly, all outstanding restricted stock and restricted stock units vested in connection with the Merger.
Other. The Del Monte Foods Company Non-Employee Director Compensation Plan, as amended, also provided for travel reimbursement, required that 100% of the “profit shares” attributable to option exercises be held for one year, and allowed non-employee directors to defer certain compensation pursuant to the Del Monte Foods Company 2005 Non-Employee Director Deferred Compensation Plan (which was not affected by the amendment to the Non-Employee Director Compensation Plan). “Profit shares” were the option profits, net of taxes, expressed as a number of shares.
Del Monte Foods Company 2005 Non-Employee Director Deferred Compensation Plan
Under the Del Monte Foods Company 2005 Non-Employee Director Deferred Compensation Plan, non-employee directors were eligible to elect to defer the receipt of 0%, 50% or 100% of either or both of the cash and stock-based components of their
153
Table of Contents
compensation. The deferred amounts were converted into deferred stock units, which were distributed upon termination of service on the Board of Directors in the form of shares of DMFC common stock. Such distribution was made, at the participant’s election with respect to each deferral period, either in a lump sum or in equal annual installments over not more than 15 years. Deferred stock units issued in connection with deferrals made under the 2005 Non-Employee Director Deferred Compensation Plan, as well as any shares distributed in respect thereof, were issued under the Del Monte Foods Company 2002 Stock Incentive Plan. Deferred stock units issued pursuant to the terms of the 2005 Non-Employee Director Deferred Compensation Plan were credited with dividends in the form of additional deferred stock units. The number of additional deferred stock units credited was determined by multiplying the number of deferred stock units held by the director on the applicable dividend record date by the per share cash dividend declared, and then dividing such amount by the average of the high and low price of DMFC’s common stock on the applicable dividend payment date. In connection with the Merger, each deferred stock unit was converted to the right to receive the per-share cash Merger consideration ($19.00), the 2005 Non-Employee Director Deferred Compensation Plan was terminated, and all deferred amounts thereunder were distributed to the directors.
Fiscal 2011 Director Compensation—on and after March 8, 2011
Consistent with the terms of the Merger Agreement, each of Richard G. Wolford, Samuel H. Armacost, Timothy G. Bruer, Mary R. Henderson, Victor L. Lund, Terence D. Martin, Sharon L. McCollam, Joe L. Morgan and David R. Williams resigned from the Board of Directors of DMFC on March 8, 2011 and were replaced with directors appointed by the Sponsors and AlpInvest. These same directors were appointed to the Board of DMC. Our directors did not receive any separate compensation for their service on the Board of DMFC or DMC in fiscal 2011.
Compensation Committee Interlocks and Insider Participation
Each of Samuel H. Armacost, Terence D. Martin and David R. Williams was a member of the Compensation Committee of the Board of Directors of the Company during fiscal 2011 prior to the Merger. None of these committee members were officers or employees of the Company during fiscal year 2011, were formerly Company officers or had any relationship otherwise requiring disclosure.
Following the Merger, a new Board of Directors and Compensation and Benefits Committee was appointed. Each of Mr. Brown, due to his relationship with KKR, Mr. Kilts, due to his relationship with Centerview, and Mr. Mundt, due to his relationship with Vestar, may be viewed as having an indirect material interest in certain relationships and transactions with KKR, Centerview and Vestar as discussed under “Item 13. Certain Relationships and Related Transactions, and Director Independence” below.
| Item 12. | Security Ownership of Certain Beneficial Owners and Management and Related Stockholder Matters |
Securities Authorized for Issuance under Equity Compensation Plans
We have no compensation plans under which equity securities of DMC are authorized to be issued. In connection with the consummation of the Merger, all compensation plans under which equity securities of DMFC were authorized for issuance during fiscal year 2011 have been terminated. In connection with the Merger, Parent established the 2011 Stock Incentive Plan for Key Employees of Blue Acquisition Group, Inc. and its Affiliates (the “2011 Plan”). The 2011 Plan provides for the grant of stock options and other stock based awards to key service providers of Parent and its affiliates, including the Company.
Equity Compensation Plan Information
| Plan category |
Number of securities to be issued upon exercise of outstanding options, warrants and rights |
Weighted-average exercise price of outstanding options, warrants and rights |
Number of securities remaining available for future issuance under equity compensation plans (excluding securities reflected in column (a)) |
|||||||||||||
| (a) | (b) | (c) | ||||||||||||||
| Equity compensation plans approved by security holders |
15,647,164 | $ | 2.75 | 12,861,199 | ||||||||||||
| Equity compensation plans not approved by security holders |
— | — | — | |||||||||||||
| Total |
15,647,164 | $ | 2.75 | 12,861,199 | ||||||||||||
For more information regarding the 2011 Stock Incentive Plan for Key Employees of Blue Acquisition Group, Inc., please see “Item 11. Executive Compensation” above.
154
Table of Contents
Security Ownership of Certain Beneficial Owners
All of the outstanding shares of capital stock of DMC are held by Parent, and Blue Holdings I, L.P. owns 99.46% of the outstanding capital stock of Parent. The following table shows the amount of common stock of Parent owned as of July 11, 2011 by those known by us to own more than 5% of Parent’s common stock.
| Name and Address of Beneficial Owner |
Amount and Nature of Beneficial Ownership |
Percent of Class | ||
| Blue Holdings I, L.P. (1) |
312,829,237 (1) | 99.46% |
| (1) | The general partner of Blue Holdings I, L.P. is Blue Holdings GP, LLC. Affiliates of KKR, Centerview and Vestar own all of the membership interest in Blue Holdings GP, LLC. The LLC Agreement governs the exercise of the voting rights with respect to the election of directors and certain other material events. The membership interests in Blue Holdings GP, LLC are held by affiliates of a number of investment funds, each of which may be deemed to share voting and dispositive power with respect to the capital stock of Parent held by Blue Holdings I, L.P. See “Item 13. Certain Relationships and Related Party Transactions, and Director Independence.” |
The address for KKR and its affiliated entities that own membership interests in Blue Holdings GP, LLC is c/o Kohlberg Kravis Roberts & Co., L.P., 9 West 57th St., Suite 4200, New York, New York 10019.
The address for Vestar is c/o Vestar Capital Partners, 245 Park Avenue, 41st Floor, New York, New York 10167.
The address for Centerview and its affiliated entities that own membership interests in Blue Holdings GP, LLC is c/o Centerview Partners, 16 School Street, Rye, New York 10580.
Security Ownership of Management
The following table shows the amount of common stock of Parent owned as of July 11, 2011 by our directors, named executive officers and our directors and named executive officers as a group. As of July 11, 2011, there were approximately 312,960,881 shares of Parent common stock outstanding. Unless otherwise indicated in a footnote, these persons may be contacted at our executive offices.
| Name of Beneficial Owner |
Amount and Nature of Beneficial Ownership |
Percent of Class | ||||||
| Simon E. Brown (1) |
— | — | ||||||
| Neil Harrison (2) |
— | — | ||||||
| David M. Hooper (3) |
— | — | ||||||
| James M. Kilts (3) |
— | — | ||||||
| Stephen Ko (1) |
— | — | ||||||
| Iain Leigh (4) |
— | — | ||||||
| Kevin Mundt (2) |
— | — | ||||||
| Dean B. Nelson (1) |
— | — | ||||||
| Brian Ratzan (2) |
— | — | ||||||
| David J. West |
1,566,199 | * | ||||||
| Nils Lommerin (5) |
1,310,182 | * | ||||||
| Larry E. Bodner (6) |
460,097 | * | ||||||
| Timothy Cole (7) |
638,842 | * | ||||||
| David Allen (8) |
648,946 | * | ||||||
| All directors and executive officers as a group (14 persons) |
4,624,266 | 1.5 | % | |||||
| * | Denotes less than 1% of class. |
| (1) | Each of Messrs. Brown, Ko and Nelson may be deemed to share dispositive and/or voting power with respect to the Company’s shares held by Parent and Parent’s shares held by Blue Holdings I, L.P. due to his status with KKR. Each of Messrs. Brown, Ko and Nelson disclaim beneficial ownership of any such interest. |
155
Table of Contents
| (2) | Each of Messrs. Harrison, Mundt and Ratzan may be deemed to share dispositive and/or voting power with respect to the Company’s shares held by Parent and Parent’s shares held by Blue Holdings I, L.P. due to his status with Vestar. Each of Messrs. Harrison, Mundt and Ratzan disclaim beneficial ownership of any such interest. |
| (3) | Each of Messrs. Hooper and Kilts may be deemed to share dispositive and/or voting power with respect to the Company’s shares held by Parent and Parent’s shares held by Blue Holdings I, L.P. due to his status with Centerview. Each of Messrs. Hooper and Kilts disclaim beneficial ownership of any such interest. |
| (4) | Mr. Leigh may be deemed to share dispositive and/or voting power with respect to the Company’s shares held by Parent and Parent’s shares held by Blue Holdings I, L.P. due to his status with AlpInvest. Mr. Leigh disclaims beneficial ownership of any such interest. |
| (5) | Includes the right to acquire 1,190,182 shares of Parent common stock, represented by options to purchase 1,190,182 shares of Parent common stock exercisable within 60 days of July 11, 2011. |
| (6) | Includes the right to acquire 454,453 shares of Parent common stock, represented by options to purchase 454,453 shares of Parent common stock exercisable within 60 days of July 11, 2011. |
| (7) | Includes the right to acquire 638,842 shares of Parent common stock, represented by options to purchase 638,842 shares of Parent common stock exercisable within 60 days of July 11, 2011. |
| (8) | Includes the right to acquire 648,946 shares of Parent common stock, represented by options to purchase 648,946 shares of Parent common stock exercisable within 60 days of July 11, 2011. |
| Item 13. | Certain Relationships and Related Transactions, and Director Independence |
Certain Relationships and Related Transactions
On March 8, 2011, DMFC completed the Merger with Blue Sub pursuant to the terms of the Merger Agreement and consequently became a wholly-owned subsidiary of Parent. As is also described in “Note 1. Business and Basis of Presentation” of our consolidated financial statements in this Annual Report on Form 10-K, on April 26, 2011, DMC merged with and into DMFC with DMC as the surviving entity, and as a result, DMC is now directly wholly-owned by Parent. Substantially all of Parent’s outstanding common stock is held by Blue Holdings I, L.P., an investment fund that is owned in its entirety by funds affiliated with the Sponsors and related entities. Blue Holdings GP, LLC is the general partner of Blue Holdings I, L.P. Funds affiliated with the Sponsors and related entities own controlling equity interests in Blue Holdings GP, LLC. The following provides a summary of material transactions and relationships that involve DMFC, DMC, the management of DMFC and DMC, the Sponsors and entities affiliated with the Sponsors, Blue Sub, Parent, Blue Holdings I, L.P., Blue Holdings GP, LLC and Blue Holdings GP, LLC.
Transactions with the Sponsors
Monitoring Agreement
On March 8, 2011, in connection with the Merger, entities affiliated with the Sponsors and an entity affiliated with AlpInvest Partners (the “AlpInvest Manager,” together with the affiliates of the Sponsors, collectively, the “Managers”) entered into a monitoring agreement (the “Monitoring Agreement”) with DMC, Parent and Blue Holdings I, L.P., pursuant to which the Managers provide management, consulting, financial and other advisory services to DMC and to its divisions, subsidiaries, parent entities and controlled affiliates. Pursuant to the Monitoring Agreement, the Managers, other than the AlpInvest Manager, are entitled to receive an aggregate annual advisory fee to be allocated among the Sponsors in accordance with their respective equity holdings in Blue Holdings I, L.P. in an amount equal to the greater of (i) $6.5 million and (ii) 1.00% of DMC’s “Adjusted EBITDA” (as defined in the Senior Notes Indenture) less an annual advisory fee of approximately $0.25 million paid to the AlpInvest Manager. As of May 1, 2011, a payable of $1.1 million was due to the Managers related to the Monitoring Agreement, which amount is included in accounts payable and accrued expenses in our consolidated financial statements in this Annual Report on Form 10-K.
156
Table of Contents
The Managers also receive reimbursement of reasonable out-of-pocket expenses incurred in connection with the provision of services pursuant to the Monitoring Agreement. The Monitoring Agreement will continue indefinitely unless terminated by the consent of all the parties thereto. In addition, the Monitoring Agreement will terminate automatically upon an initial public offering of Parent, unless the Company elects by prior written notice to continue the Monitoring Agreement. Upon a change of control of Parent, the Company may terminate the Monitoring Agreement.
Consulting Arrangements with Capstone Consulting LLC
The Company has engaged Capstone Consulting LLC (“Capstone”) to provide consulting services with respect to the Company’s operations. These engagements may be terminated at any time at the discretion of management of the Company. For the period March 8, 2011 through May 1, 2011, the total fees payable to Capstone under these arrangements were approximately $0.4 million. One of the Company’s directors holds an equity interest in Capstone. Neither KKR nor any entity affiliated with KKR owns any of the equity of Capstone. Capstone provides dedicated consulting services to KKR and its affiliated funds’ portfolio companies. As of May 1, 2011, there was a payable of $0.3 million due to Capstone, which amount is included in accounts payable and accrued expenses in our consolidated financial statements in this Annual Report on Form 10-K.
Indemnification Agreement
On March 8, 2011, DMFC, Parent, Blue Holdings I, L.P. and Blue Holdings GP, LLC, entered into an indemnification agreement with the Managers. This indemnification agreement contains customary exculpation and indemnification provisions in favor of the Managers and their affiliates.
Transaction Fee Arrangements
Pursuant to transaction fee letters entered into with each respective Sponsor, each dated March 8, 2011, Blue Sub agreed to pay each of the Sponsors one-time fees aggregating to $46.85 million in consideration of the structuring, financial and consultation services that the Sponsors provided to Blue Sub in connection with the Merger. Blue Sub also paid for the reasonable out-of-pocket expenses of the Sponsors. In connection with these agreements, concurrently with the consummation of the Merger, Blue Sub paid fees of $28.9 million, $3.1 million and $14.85 million, to KKR, Centerview and Vestar, respectively. As of May 1, 2011, there was a payable of $0.2 million due to Centerview for transaction-related out-of-pocket expenses, which amount is included in accounts payable and accrued expenses in our consolidated financial statements in this Annual Report on Form 10-K.
Pursuant to an engagement letter dated March 8, 2011, Blue Sub engaged KKR Capital Markets LLC, an affiliate of KKR (“KCM”), to act as syndication agent in connection with the placement of equity securities to persons who were not affiliated with the Sponsors. For such syndication services, Blue Sub paid KCM a one-time syndication fee of $9.2 million upon the completion of the Merger in addition to reasonable out-of-pocket expenses.
Pursuant to a facilitation fee letter agreement and an M&A fee letter agreement, each dated March 8, 2011, Blue Sub agreed to pay to Centerview (i) a one-time fee of $5.0 million for services provided to Blue Sub by Centerview and its affiliates, including services in connection with the placement of equity securities to persons who were not affiliated with the Sponsors and assistance in the due diligence process to facilitate the acceptance by Parent of certain investments and (ii) a one-time fee of $8.0 million for services provided to Blue Sub by Centerview and its affiliates, including financial advisory services in connection with the structuring, negotiation and consummation of the Merger and the preparation, negotiation and finalization of the Agreement and Plan of Merger, dated as of November 24, 2010 (“Merger Agreement”) and other documents executed in connection therewith. Both of these payments were made concurrently with the consummation of the Merger.
Financing Arrangements
KCM and certain of its capital markets affiliates played a number of roles in connection with the arrangement of financing related to the Merger, including providing financing commitments to Blue Sub, acting as a joint manager and arranger of the Term Loan Facility, an initial purchaser in the initial offering of 7.625% Notes and as a dealer-manager in connection with our tender offer for outstanding 6 3/4% Notes and 7 1/2 % Notes. KCM received approximately $10.2 million for these services.
157
Table of Contents
Term Loan Facility
Subject to certain conditions and limitations, affiliates of the Sponsors also may act as lenders under the Term Loan Facility or ABL Facility. In addition, following the consummation of the Merger and the related transactions, affiliates of certain lenders indirectly own ownership interests of the Company. Those affiliates may assign all or a portion of their interests to other affiliates of the lenders.
Transactions with Management
Equity Contributions
Pursuant to an equity contribution agreement dated March 8, 2011, and an equity contribution and subscription agreement, dated February 16, 2011, Blue Holdings I, L.P. contributed to Parent the sum of approximately $1,564.2 million and received from Parent 312,829,237 shares of common stock of Parent. The Company’s (i) Executive Vice President and Chief Financial Officer and (ii) Chief Operating Officer contributed approximately $0.6 million in the aggregate in cash to Parent and received 125,644 shares of common stock of Parent. Parent then contributed to Blue Sub approximately $1,550.7 million and paid $14.2 million in expenses on behalf of Blue Sub, and received from Blue Sub 10 shares of common stock of Blue Sub, which represented 100% of Blue Sub’s outstanding common stock.
Agreements among the Sponsors and Other Indirect Shareholders of the Company
The Sponsors (or funds affiliated with the Sponsors) and other investors entered into a limited partnership agreement with respect to their investment in Blue Holdings I, L.P. and an operating agreement (the “LLC Agreement”) with respect to their investment in Blue Holdings GP, LLC and a registration rights agreement relating to Blue Holdings I, L.P’s ownership of Parent’s common stock. These agreements contain agreements among the parties with respect to, among other things, restrictions on the issuance or transfer of interests, other special corporate governance provisions (including the right to approve various corporate actions), the election of managers of Blue Holdings GP, LLC, the election of our Board members (described in the next paragraph), and registration rights (including customary indemnification provisions).
Our current Board of Directors consists of ten members, all of whom were nominated pursuant the LLC Agreement described above. Under the terms of that agreement, affiliates of each of KKR and Vestar have the right to designate three managers of Blue Holdings GP, LLC, affiliates of Centerview have the right to designate two managers of Blue Holdings GP, LLC and affiliates of AlpInvest Partners have the right to designate one manager of Blue Holdings GP, LLC. The LLC Agreement further provides that the members of the LLC will seek to ensure, to the extent permitted by law, that each of the members of Blue Holdings GP, LLC also are members of the board of directors of Parent and of the Company. Under the LLC Agreement, some actions by Parent and DMC require approval by a super majority of the board of Blue Holdings GP, LLC, while others require unanimous approval.
Due to their affiliations with these funds, all of the Company’s current members of the Board, with the exception of the Company’s recently appointed CEO, are considered “affiliates” of the Company. In addition, with the exception of the Company’s CEO, all of the members of the Company’s current Board could be deemed to have an indirect interest in the Monitoring Agreement.
Review, Approval or Ratification of Transactions with Related Persons
Our Standards of Business Conduct set forth our general policies and procedures regarding how we will handle employee or director conflicts of interest. Under the Standards of Business Conduct, as modified by the Related Person Transactions Policy, the Board must review and approve in advance any related person transaction involving an officer or director of the Company. The Company’s Law Department may be involved in determining whether a particular transaction is a related person transaction requiring review and approval Board.
The Board of Directors adopted a written Related Person Transactions Policy on June 13, 2011, similar in many respects to the policy previously adopted by DMFC, in order to establish processes, procedures and standards regarding the review, approval and ratification of related person transactions and to provide guidelines regarding what types of transactions constitute related person transactions.
All related person transactions are prohibited unless approved or ratified by the Board, or in certain circumstances, the board of managers of Blue Holdings GP, LLC. The following types of transactions require the review and approval of the board of managers of Blue Holdings GP, LLC in addition to the review and approval by the Board: (i) any transaction with (1) a portfolio company held or managed by KKR 2006 Fund L.P., Vestar Capital Partners V, L.P., Centerview Capital, L.P. (and the permitted transferees of such entities) (each, a “Controlling Stockholder”) or (2) an affiliate of such entity in an amount in excess of $10 million (other than any transaction or series of related transactions in the ordinary course of business with Dollar General Corporation or its subsidiaries), provided that review and approval by Blue Holding GP, LLC is not required if such transaction or series of related transactions is in the ordinary course of business and on arm’s length terms with the Company; or (ii) any transaction with a Controlling Stockholder (or with an affiliate of such Controlling Stockholder, or with any officer, director, or employee of such Controlling Stockholder or its affiliates).
158
Table of Contents
The Related Person Transactions Policy reminds directors and executive officers of their obligation under our Standards of Business Conduct to update their disclosure statement to reflect any potential conflict of interest or related person transaction. Additionally, the Policy confirms that each director and executive officer of the Company must annually complete a questionnaire designed to elicit, among other things, information about potential related person transactions. Each director and executive officer must also promptly advise the Law Department of any change to the information contained in the last completed questionnaire that could relate to the identification, review, approval or ratification of transactions that may constitute related person transactions.
The Law Department reviews the information provided by the Company’s directors and executive officers and gathers the material facts and other information necessary to assess whether a proposed transaction would constitute a related person transaction for purposes of this Policy. If the Law Department determines that a transaction would be a related person transaction, the Law Department’s written assessment and the material facts of the proposed transaction would be submitted to the Board for consideration at its next meeting.
The Board is expected to review the submitted materials and consider all other relevant facts and circumstances reasonably available to it including:
| • | the benefits to the Company; |
| • | the impact on a director’s independence in the event the related person is a director, an immediate family member of a director or an entity in which a director is a partner, shareholder or executive officer; |
| • | the availability of other sources for comparable products or services; |
| • | the terms and conditions of the transaction; and |
| • | the terms available to unrelated third parties or to employees generally. |
The Related Person Transactions Policy provides that the Board shall only approve those related person transactions that are in, or are not inconsistent with, the best interests of the Company. Similar procedures apply to the ratification of related person transactions in the event a director, the Chief Executive Officer, Chief Financial Officer or General Counsel becomes aware of a related person transaction that has not been previously approved or ratified. However, in such event:
| • | If the transaction is pending or ongoing, it will be submitted to the Board promptly for assessment of all of the relevant facts and circumstances reasonably available and the Board shall, with the advice of counsel, evaluate all options with respect to the transaction, including ratification, amendment or termination of the related person transaction. The Company shall implement the option that the Board deems to be in, or not inconsistent with, the best interests of the Company. |
| • | If the related person transaction is completed, the Board shall evaluate the transaction to determine if rescission of the transaction is appropriate, and shall request that the Company’s Chief Financial Officer evaluate the Company’s controls and procedures to ascertain 1) the reason the transaction was not submitted to the Board for prior approval and 2) whether any changes to those controls and procedures are recommended. |
Under the Related Person Transactions Policy, the Board of Directors determined that certain transactions entered into in the ordinary course of the Company’s business in which the related person and his or her immediate family members are not involved in the negotiation of the terms of the transaction with the Company, do not receive any special benefits as a result of the transaction, and the amount involved in the transaction equals less than two percent (2%) of the annual net revenues of each of the Company and the other entity that is a participant in the transaction do not create a material direct or indirect interest on behalf of a related person (as such term is defined in applicable SEC rules) and accordingly are not related person transactions (as such term is defined in applicable SEC rules). In addition, transactions are not related person transactions under the Related Person Transactions Policy if they are excluded from the SEC disclosure requirements regarding related person transactions.
With the exception of the consulting agreements with Capstone Consulting LLC, the transactions described above under
“—Transactions with
the Sponsors” and “—Transactions with Management” were not approved in accordance with the Related Person Transactions Policy because these transactions were negotiated by Parent, Blue Sub or Blue Holdings I, L.P., as
applicable, prior to the effective date of the Merger.
159
Table of Contents
Independence of the Board of Directors
Though not formally considered by our Board given that our securities are not traded on any national securities exchange, based upon the listing standards of the New York Stock Exchange, the national securities exchange upon which the common stock of Del Monte Foods Company (our former parent) was listed prior to the Merger, none of our directors can be considered independent. Mr. West cannot be considered independent because he is an employee of the Company. The other directors cannot be considered independent because they are employees of or affiliated with the Managers, as described above under the heading “—Transactions with the Sponsors — Monitoring Agreement”.
| Item 14. | Principal Accounting Fees and Services |
With respect to fiscal 2011 and fiscal 2010, the aggregate fees billed by KPMG LLP to us or DMFC, as applicable, were as follows:
| Fiscal 2011 | Fiscal 2010 | |||||||
| Audit Fees (1) |
$ | 1,818,000 | $ | 1,989,900 | ||||
| Audit Related Fees (2) |
$ | 138,000 | $ | 220,050 | ||||
| Tax Fees (3) |
$ | 25,700 | $ | 23,000 | ||||
| All Other Fees (4) |
— | — | ||||||
| (1) | For fiscal 2011, reflects aggregate fees billed by KPMG LLP for the audit of the Company’s consolidated financial statements for such fiscal year and for the audit of Parent. For fiscal 2010, reflects aggregate fees billed by KPMG LLP for the audit of DMFC’s consolidated financial statements and internal control over financial reporting for such fiscal year and for the audit of the Company. Also reflects for both fiscal 2011 and fiscal 2010, aggregate fees billed for the review of the Company’s (or DMFC’s, as applicable) interim condensed consolidated financial statements, for the review of and assistance with documents filed with or submitted to the Securities and Exchange Commission, for the statutory audits of certain of the Company’s foreign subsidiaries, and $120,000 in connection with debt financing transactions. |
| (2) | For each of fiscal 2011 and fiscal 2010, reflects aggregate fees billed by KPMG LLP for services related to employee benefit plan audits as well as fees related to agreed upon procedures in accordance with SAS 93 in connection with one of the Company’s supply agreements. |
| (3) | For each of fiscal 2011 and fiscal 2010, reflects the aggregate fees billed by KPMG LLP for tax compliance. Such services generally involved assistance in preparing, reviewing or filing various tax-related filings required in foreign jurisdictions and did not involve tax planning assistance. |
| (4) | For each of fiscal 2011 and fiscal 2010, there were no fees billed by KPMG LLP for services except as already described above. |
The Audit Committee determined that the non-audit services provided by KPMG LLP during the fiscal year ended May 1, 2011 were compatible with maintaining the independence of KPMG LLP.
Consistent with SEC rules regarding auditor independence, the Audit Committee has responsibility for appointing, as well as setting the compensation and overseeing the work of, the independent registered public accounting firm. In recognition of this responsibility, the Audit Committee has adopted policies and procedures for the approval in advance, or “pre-approval,” of audit and non-audit services rendered by our independent auditor, KPMG LLP. All services provided by KPMG LLP during fiscal 2011, as described above, were approved by the Audit Committee of the Company (for services submitted for approval after the merger of DMFC and DMC) or the Audit Committee of DMFC (for services submitted for approval prior to the merger of DMFC and DMC) in advance of KPMG LLP providing such services.
160
Table of Contents
| Item 15. | Exhibits, Financial Statement Schedules |
(a) 1. Financial Statements
| (i) | The following financial statements of Del Monte Corporation and subsidiaries are included in Item 8: |
| Report of KPMG LLP, Independent Registered Public Accounting Firm |
| Consolidated Balance Sheets—May 1, 2011 (Successor) and May 2, 2010 (Predecessor) |
| Consolidated Statements of Income (Loss)—for the periods March 8, 2011 through May 1, 2011 (Successor), May 3, 2010 through March 7, 2011 (Predecessor) and fiscal years ended May 2, 2010 (Predecessor) and May 3, 2009 (Predecessor) |
| Consolidated Statements of Stockholder’s Equity and Comprehensive Income (Loss)—for the periods March 8, 2011 through May 1, 2011 (Successor), May 3, 2010 through March 7, 2011 (Predecessor) and fiscal years ended May 2, 2010 (Predecessor) and May 3, 2009 (Predecessor) |
| Consolidated Statements of Cash Flows—for the periods March 8, 2011 through May 1, 2011 (Successor), May 3, 2010 through March 7, 2011 (Predecessor) and fiscal years ended May 2, 2010 (Predecessor) and May 3, 2009 (Predecessor) |
| Notes to the Consolidated Financial Statements |
| 2. | Financial Statements Schedules |
Schedules have been omitted because they are inapplicable, not required, or the information is included elsewhere in the financial statements or notes thereto.
| 3. | Exhibits |
The exhibits listed on the accompanying Exhibit Index are incorporated in this Annual Report on Form 10-K by this reference and filed as part of this report. Each management contract or compensatory plan or arrangement required to be filed as an exhibit to this Annual Report on Form 10-K is indicated by an “**” on the accompanying Exhibit Index. See “Exhibit Index” for important information regarding our exhibits.
| (b) | See Item 15(a)3 above |
| (c) | See Item 15(a)1 and 15(a)2 above |
161
Table of Contents
Pursuant to the requirements of Section 13 or 15(d) of the Securities Exchange Act of 1934, as amended, the Registrant has duly caused this report to be signed on its behalf by the undersigned, thereunto duly authorized.
| DEL MONTE CORPORATION | ||
| By: | /S/ NEIL HARRISON | |
| Neil Harrison | ||
| Interim Chief Executive Officer; Vice Chairman of the Board | ||
| Date: | July 15, 2011 | |
162
Table of Contents
KNOWN ALL PERSONS BY THESE PRESENTS, that each person whose signature appears below constitutes and appoints Larry E. Bodner and James Potter, each of whom may act without joinder of the other, as their true and lawful attorneys-in-fact and agents, each with full power of substitution and resubstitution, for such person and in his or her name, place and stead, in any and all capacities, to sign any and all amendments to this Annual Report on Form 10-K, and to file the same, with all exhibits thereto and other documents in connection therewith, with the Securities and Exchange Commission, granting unto said attorneys-in-fact and agents full power and authority to do and perform each and every act and thing requisite and necessary to be done in and about the premises, as fully to all intents and purposes as he might or could do in person, hereby ratifying and confirming all that said attorneys-in-fact and agents, or their substitutes, may lawfully do or cause to be done by virtue hereof.
Pursuant to the requirements of the Securities Exchange Act of 1934, this report has been signed below by the following persons on behalf of the Registrant and in the capacities and on the dates indicated.
| Signature |
Title |
Date | ||
| /S/ NEIL HARRISON Neil Harrison |
Interim Chief Executive Officer; Vice Chairman of the Board |
July 15, 2011 | ||
| /S/ LARRY E. BODNER Larry E. Bodner |
Executive Vice President and Chief Financial Officer |
July 15, 2011 | ||
| /S/ RICHARD L. FRENCH Richard L. French |
Senior Vice President, Treasurer, Chief Accounting Officer and Controller |
July 15, 2011 | ||
| /S/ SIMON E. BROWN Simon E. Brown |
Director |
July 15, 2011 | ||
| /S/ DAVID HOOPER David Hooper |
Director |
July 15, 2011 | ||
| /S/ JAMES M. KILTS James M. Kilts |
Chairman of the Board |
July 15, 2011 | ||
| /S/ STEPHEN KO Stephen Ko |
Director |
July 15, 2011 | ||
| /S/ IAIN LEIGH Iain Leigh |
Director |
July 15, 2011 | ||
| /S/ KEVIN A. MUNDT Kevin A. Mundt |
Director |
July 15, 2011 | ||
| /S/ DEAN B. NELSON Dean B. Nelson |
Director |
July 15, 2011 | ||
| /S/ BRIAN K. RATZAN Brian K. Ratzan |
Director |
July 15, 2011 | ||
| /S/ DAVID J. WEST David J. West |
Director; executive employee |
July 15, 2011 | ||
163
Table of Contents
Agreements included as exhibits to this Annual Report on Form 10-K are included to provide information regarding their terms and are not intended to provide any other factual or disclosure information about Del Monte Corporation (including its consolidated subsidiaries) or the other parties to the agreements. Where an agreement contains representations and warranties by any party, those representations and warranties have been made solely for the benefit of the other parties to the agreement or express third-party beneficiaries as explicitly set forth in the agreement. Any such representations and warranties:
| • | should not be treated as categorical statements of fact, but rather as an allocation of risk; |
| • | may have been qualified by disclosures that were made to the other party in connection with the negotiation of the applicable agreement, which disclosures are not necessarily reflected in the agreement; |
| • | may apply standards of materiality in a way that is different from what may be viewed as material to you or other investors; and |
| • | were made only as of the date of the applicable agreement or such other date or dates as may be specified in the agreement and may be subject to more recent developments. |
Accordingly, any such representations and warranties may not describe the actual state of affairs as of the date they were made or at any other time.
| Exhibit |
Description |
Incorporated by Reference | ||||||||
| Filer |
Form |
Exhibit |
Filing Date | |||||||
| 2.1 | Agreement and Plan of Merger, dated November 24, 2010, by and among Blue Acquisition Group, Inc., a Delaware corporation, Blue Merger Sub Inc., a Delaware corporation, and Del Monte Foods Company, a Delaware corporation | DMFC | 8-K | 2.1 | November 30, 2010 | |||||
| 3.1 | Certificate of Ownership and Merger, dated April 26, 2011 | DMC | 8-K | 3.1 | April 26, 2011 | |||||
| 3.2 | Certificate of Incorporation of Del Monte Corporation | DMC | 8-K | 3.2 | April 26, 2011 | |||||
| 3.3 | By-laws of Del Monte Corporation | DMC | 8-K | 3.3 | April 26, 2011 | |||||
| 4.1 | Indenture, dated of February 16, 2011, among Blue Merger Sub Inc. and The Bank of New York Mellon Trust Company, N.A., as supplemented by the Supplemental Indenture, dated as of
March 8, 2011, among Del Monte Foods Company, Del Monte Corporation and The Bank of New York Mellon Trust Company, N.A. |
DMFC | 8-K | 10.10 | March 10, 2011 | |||||
| 4.2 | Second Supplemental Indenture, dated April 26, 2011, among Del Monte Foods Company, Del Monte Corporation and The Bank of New York Mellon Trust Company, N.A., as trustee, relating to the 7.625% Senior Notes due 2019 | DMC | 8-K | 10.1 | April 26, 2011 | |||||
| *4.3 | Third Supplemental Indenture, dated June 22, 2011, among Del Monte Corporation and The Bank of New York Mellon Trust Company, N.A., as trustee, relating to the 7.625% Senior Notes due 2019 | |||||||||
164
Table of Contents
| Exhibit |
Description |
Incorporated by Reference | ||||||||
| Filer |
Form |
Exhibit |
Filing Date | |||||||
| 4.4 | Registration Rights Agreement, dated as of February 16, 2011, among Blue Merger Sub Inc., Merrill Lynch, Pierce, Fenner & Smith Incorporated, Morgan Stanley & Co. Incorporated, Barclays Capital Inc., J.P. Morgan Securities LLC, KKR Capital Markets LLC, Deutsche Bank Securities Inc., Goldman, Sachs & Co. and Mizuho Securities USA Inc., as supplemented by the Joinder Agreement, dated as of March 8, 2011, among Del Monte Foods Company and Del Monte Corporation | DMFC | 8-K | 10.11 | March 10, 2011 | |||||
| 10.1 | Purchase Agreement for Del Monte Corporation 7 1/2% Senior Subordinated Notes Due 2019, dated as of September 17, 2009 | DMFC | 10-Q | 10.6 | December 9, 2009 | |||||
| 10.2 | Office Lease dated December 31, 2003, between Continental/North Shore II, L.P. (Landlord) and Del Monte Corporation (Tenant) (confidential treatment has been granted as to portions of the Exhibit) | DMFC | 10-Q | 10.2 | March 9, 2004 | |||||
| 10.3 | Office Lease Agreement between Del Monte Corporation and PPF OFF ONE MARITIME PLAZA, LP, dated October 27, 2009 (confidential treatment has been granted as to portions of the Exhibit) | DMFC | 8-K | 10.1 | October 30, 2009 | |||||
| 10.4 | First Amendment to Office Lease, dated January 21, 2011, between Del Monte Corporation and PPF OFF ONE MARITIME PLAZA, LP (confidential treatment has been granted as to portions of the Exhibit) | DMFC | 10-Q | 10.2 | March 4, 2011 | |||||
| 10.5 | Second Amendment to Office Lease, dated February 1, 2011, between Del Monte Corporation and PPF OFF ONE MARITIME PLAZA, LP | DMFC | 10-Q | 10.3 | March 4, 2011 | |||||
| 10.6 | Supply Agreement, dated as of February 2, 2011, between Silgan Containers LLC and Del Monte Corporation (confidential treatment has been granted as to portions of the Exhibit) | DMFC | 8-K | 10.23 | February 4, 2011 | |||||
| 10.7 | Amended and Restated Supply Agreement between Impress Group, B.V. and Del Monte Corporation, dated January 23, 2008 (confidential treatment has been granted as to portions of the Exhibit) | DMFC | 8-K | 10.1 | January 28, 2008 | |||||
165
Table of Contents
| Exhibit |
Description |
Incorporated by Reference | ||||||||
| Filer |
Form |
Exhibit |
Filing Date | |||||||
| 10.8 | Bifurcation and Partial Assignment and Assumption Agreement among Del Monte Corporation, Impress Group, B.V. and Starkist Co. effective as of October 6, 2008 (confidential treatment has been granted as to portions of the Exhibit) | DMFC | 8-K | 10.2 | October 9, 2008 | |||||
| 10.9 | Restated Del Monte Foods Retail Brokerage Agreement between Del Monte Corporation and Advantage Sales and Marketing LLC effective as of November 4, 2008 (confidential treatment has been granted as to portions of the Exhibit) | DMFC | 8-K | 10.1 | November 6, 2008 | |||||
| 10.10 | First Amendment to the Restated Del Monte Foods Retail Brokerage Agreement between Del Monte Corporation and Advantage Sales and Marketing LLC, dated May 4, 2009 (confidential treatment has been granted as to portions of the Exhibit) | DMFC | 10-Q | 10.15 | March 4, 2011 | |||||
| 10.11 | Second Amendment to the Restated Del Monte Foods Retail Brokerage Agreement between Del Monte Corporation and Advantage Sales and Marketing LLC, dated September 22, 2009 (confidential treatment has been granted as to portions of the Exhibit) | DMFC | 10-Q | 10.16 | March 4, 2011 | |||||
| 10.12 | Third Amendment to the Restated Del Monte Foods Retail Brokerage Agreement between Del Monte Corporation and Advantage Sales and Marketing LLC, dated September 22, 2009 | DMFC | 10-Q | 10.17 | March 4, 2011 | |||||
| 10.13 | Fourth Amendment to the Restated Del Monte Foods Retail Brokerage Agreement between Del Monte Corporation and Advantage Sales and Marketing LLC, dated August 11, 2010 (confidential treatment has been granted as to portions of the Exhibit) | DMFC | 10-Q | 10.18 | March 4, 2011 | |||||
| 10.14 | Fifth Amendment to the Restated Del Monte Foods Retail Brokerage Agreement between Del Monte Corporation and Advantage Sales and Marketing LLC, dated February 10, 2011 (confidential treatment has been granted as to portions of the Exhibit) | DMFC | 10-Q | 10.19 | March 4, 2011 | |||||
166
Table of Contents
| Exhibit |
Description |
Incorporated by Reference | ||||||||
| Filer |
Form |
Exhibit |
Filing Date | |||||||
| 10.15 | Credit Agreement, dated as of January 29, 2010, among Del Monte Corporation, as borrower, Del Monte Foods Company, as guarantor, and certain lender and agent parties thereto | DMFC | 8-K | 10.1 | February 2, 2010 | |||||
| 10.16 | Security Agreement, dated as of January 29, 2010, among Del Monte Corporation, Del Monte Foods Company and Bank of America, N.A., as Administrative Agent | DMFC | 8-K | 10.2 | February 2, 2010 | |||||
| 10.17 | Credit Agreement, dated as of March 8, 2011, among Blue Acquisition Group, Inc., Del Monte Foods Company, the Lenders from time to time parties thereto, JPMorgan Chase Bank, N.A., as Administrative Agent and Collateral Agent, and the other Agents named therein | DMFC | 8-K | 10.1 | March 10, 2011 | |||||
| 10.18 | Assumption Agreement, dated as of April 26, 2011, among Del Monte Corporation and JPMorgan Chase Bank, N.A., relating to the Term Loan Credit Agreement, dated as of March 8, 2011, among Blue Acquisition Group, Inc., Del Monte Foods Company, the lenders from time to time parties thereto, JPMorgan Chase Bank, N.A., as administrative agent and collateral agent, and the other agents named therein | DMC | 8-K | 10.2 | April 26, 2011 | |||||
| 10.19 | Guarantee, dated as of March 8, 2011, by Blue Acquisition Group, Inc., Del Monte Corporation, and each of the other entities from time to time party thereto, in favor of JPMorgan Chase Bank, N.A., as Collateral Agent | DMFC | 8-K | 10.2 | March 10, 2011 | |||||
| 10.20 | Security Agreement, dated as of March 8, 2011, among Del Monte Foods Company, Blue Acquisition Group, Inc., each of the Subsidiaries of Del Monte Foods Company from time to time party thereto, and JPMorgan Chase Bank, N.A., as Collateral Agent | DMFC | 8-K | 10.3 | March 10, 2011 | |||||
| 10.21 | Pledge Agreement, dated as of March 8, 2011, among Del Monte Foods Company, each of the Subsidiaries of Del Monte Foods Company from time to time party thereto, Blue Acquisition Group, Inc., and JPMorgan Chase Bank, N.A., as Collateral Agent | DMFC | 8-K | 10.4 | March 10, 2011 | |||||
167
Table of Contents
| Exhibit |
Description |
Incorporated by Reference | ||||||||
| Filer |
Form |
Exhibit |
Filing Date | |||||||
| 10.22 | Credit Agreement, dated as of March 8, 2011, among Blue Acquisition Group, Inc., Del Monte Foods Company, the other Borrowers from time to time parties thereto, the Lender Parties from time to time parties thereto, Bank of America, N.A., as Administrative Agent and Collateral Agent, and the other Agents named therein, as supplemented by the Credit Party Joinder Agreement, among Del Monte Corporation and Bank of America, N.A., dated as of March 9, 2011 | DMFC | 8-K | 10.5 | March 10, 2011 | |||||
| 10.23 | Assumption Agreement, dated as of April 26, 2011, among Del Monte Corporation and Bank of America, N.A., relating to the Asset-Based Revolving Credit Agreement, dated as of March 8, 2011, among Blue Acquisition Group, Inc., Del Monte Foods Company, the lenders from time to time parties thereto, Bank of America, N.A., as administrative agent and collateral agent, and the other agents named therein and as supplemented by the Joinder Agreement, among Del Monte Corporation and Bank of America, N.A., dated as of March 9, 2011 | DMC | 8-K | 10.3 | April 26, 2011 | |||||
| 10.24 | Guarantee, dated as of March 8, 2011, by Blue Acquisition Group, Inc., Del Monte Corporation, and each of the other entities from time to time party thereto, in favor of Bank of America, N.A., as Collateral Agent | DMFC | 8-K | 10.6 | March 10, 2011 | |||||
| 10.25 | Security Agreement, dated as of March 8, 2011, among Del Monte Foods Company, Blue Acquisition Group, Inc., each of the Subsidiaries of Del Monte Foods Company from time to time party thereto, and Bank of America, N.A., as Collateral Agent | DMFC | 8-K | 10.7 | March 10, 2011 | |||||
| 10.26 | Pledge Agreement, dated as of March 8, 2011, among Del Monte Foods Company, each of the Subsidiaries of Del Monte Foods Company from time to time party thereto, Blue Acquisition Group, Inc., and Bank of America, N.A., as Collateral Agent | DMFC | 8-K | 10.8 | March 10, 2011 | |||||
168
Table of Contents
| Exhibit |
Description |
Incorporated by Reference | ||||||||
| Filer |
Form |
Exhibit |
Filing Date | |||||||
| 10.27 | Purchase Agreement, dated as of February 1, 2011, among Blue Merger Sub Inc. and Merrill Lynch, Pierce, Fenner & Smith Incorporated and Morgan Stanley & Co. Incorporated as representatives of the other initial purchasers party thereto, as supplemented by the Joinder Agreement, dated as of March 8, 2011, among Del Monte Foods Company, Del Monte Corporation and Merrill Lynch, Pierce, Fenner & Smith and Morgan Stanley & Co. Incorporated as representatives of the other initial purchasers party thereto | DMFC | 8-K | 10.9 | March 10, 2011 | |||||
| 10.28 | Monitoring Agreement, dated as of March 8, 2011, among Del Monte Corporation, Blue Acquisition Group, Inc., Blue Holdings I, L.P., Kohlberg Kravis Roberts & Co. L.P., Vestar Capital Partners, Centerview Partners Management LLC and AlpInvest Partners Inc. | DMFC | 8-K | 10.15 | March 10, 2011 | |||||
| 10.29 | Indemnification Agreement, dated as of March 8, 2011, among Blue Holdings I, L.P., Blue Holdings GP, LLC, Blue Acquisition Group, Inc., Del Monte Foods Company, Kohlberg Kravis Roberts & Co. L.P., Vestar Managers V Ltd., Centerview Partners Management LLC and AlpInvest Partners Inc. | DMFC | 8-K | 10.16 | March 10, 2011 | |||||
| 10.30** | Del Monte Foods Company 2002 Stock Incentive Plan, as amended and restated effective July 28, 2009 and approved by the stockholders September 24, 2009 | DMFC | 8-K | 10.1 | September 28, 2009 | |||||
| 10.31** | Form of Del Monte Foods Company 2002 Stock Incentive Plan Performance Accelerated Restricted Stock Agreement | DMFC | 10-Q | 10.3 | December 4, 2008 | |||||
| 10.32** | Form of Del Monte Foods Company 2002 Stock Incentive Plan Non-Qualified Stock Option Agreement | DMFC | 10-Q | 10.2 | December 4, 2008 | |||||
| 10.33** | Form of Del Monte Foods Company 2002 Stock Incentive Plan Non-Qualified Stock Option Agreement | DMFC | 10-Q | 10.2 | December 7, 2010 | |||||
| 10.34** | Form of Del Monte Foods Company 2002 Stock Incentive Plan Performance Shares Agreement | DMFC | 10-Q | 10.1 | December 4, 2008 | |||||
169
Table of Contents
| Exhibit |
Description |
Incorporated by Reference | ||||||||
| Filer |
Form |
Exhibit |
Filing Date | |||||||
| 10.35** | Form of Del Monte Foods Company 2002 Stock Incentive Plan Performance Shares Agreement | DMFC | 10-Q | 10.3 | December 7, 2010 | |||||
| 10.36** | Form of Del Monte Foods Company 2002 Stock Incentive Plan Restricted Stock Unit Award Agreement | DMFC | 8-K | 10.1 | September 28, 2010 | |||||
| *10.37** | 2011 Stock Incentive Plan for Key Employees of Blue Acquisition Group, Inc. and its Affiliates | |||||||||
| *10.38** | Form of Management Stockholder Agreement entered into as of March 8, 2011 among Blue Acquisition Group, Inc., Blue Holdings I, L.P. and each specified management stockholder—Executive Vice Presidents | |||||||||
| *10.39** | Form of Option Rollover Agreement dated on or prior to February 11, 2011 between Blue Acquisition Group, Inc. and each specified management stockholder, accepted by Blue Acquisition Group, Inc. March 8, 2011 | |||||||||
| *10.40** | Form of Stock Option Agreement dated as of March 8, 2011 by and between Blue Acquisition Group, Inc. and each specified employee—Executives with Employment Agreements |
|||||||||
| *10.41** | Form of Sale Participation Agreement with Blue Holdings I, L.P. dated March 8, 2011 | |||||||||
| 10.42** | Del Monte Foods Company Annual Incentive Plan, as amended and restated effective July 28, 2009 and approved by the stockholders September 24, 2009 | DMFC | 8-K | 10.2 | September 28, 2009 | |||||
| 10.43** | Del Monte Corporation AIP Deferred Compensation Plan, as amended and restate effective April 28, 2008 and dated December 31, 2008 (frozen effective October 1, 2009) | DMFC | 10-Q | 10.3 | March 4, 2009 | |||||
| 10.44** | Amendment Number One to the Del Monte Corporation AIP Deferred Compensation Plan | DMFC | 10-Q | 10.8 | March 4, 2011 | |||||
| 10.45** | Del Monte Corporation Supplemental Executive Retirement Plan (Fourth Restatement), as amended and restated effective January 1, 2009 | DMFC | 10-Q | 10.4 | March 4, 2009 | |||||
170
Table of Contents
| Exhibit |
Description |
Incorporated by Reference | ||||||||
| Filer |
Form |
Exhibit |
Filing Date | |||||||
| 10.46** | Del Monte Corporation Additional Benefits Plan, as amended and restated effective January 1, 2009 | DMFC | 10-Q | 10.2 | March 4, 2009 | |||||
| 10.47** | Executive Medical Reimbursement Plan, as amended and restated, effective as of January 1, 2006 | DMFC | 10-K | 10.68 | July 11, 2006 | |||||
| 10.48** | Del Monte Foods Company Non-Employee Director Compensation Plan dated October 23, 2009 | DMFC | 10-Q | 10.5 | December 9, 2009 | |||||
| 10.49** | Del Monte Foods Company 2003 Non-Employee Director Deferred Compensation Plan, as amended on December 16, 2004 | DMFC | 8-K | 10.1 | December 21, 2004 | |||||
| 10.50** | Del Monte Foods Company 2005 Non-Employee Director Deferred Compensation Plan, as amended and restated December 15, 2005 | DMFC | 8-K | 10.1 | December 16, 2005 | |||||
| 10.51** | Del Monte Foods Company 2005 Non-Employee Director Deferred Compensation Plan—Plan Agreement—2006 | DMFC | 8-K | 10.2 | December 16, 2005 | |||||
| 10.52** | Amendment No. 1 to the Del Monte Foods Company 2005 Non-Employee Director Deferred Compensation Plan, effective as of January 1, 2008 and dated December 31, 2008 | DMFC | 10-Q | 10.5 | March 4, 2009 | |||||
| 10.53** | Form of Del Monte Foods Company Restricted Stock Unit Agreement for Non-Employee Directors | DMFC | 10-Q | 10.5 | December 7, 2006 | |||||
| 10.54** | Del Monte Foods Company Deferred Compensation Plan, effective October 1, 2009 | DMFC | 8-K | 10.2 | September 29, 2009 | |||||
| 10.55** | Omnibus Amendment to the Del Monte Foods Company Non-Employee Director and Independent Contractor 1997 Stock Incentive Plan; the Del Monte Foods Company 1997 Stock Incentive Plan; the Del Monte Foods Company 1998 Stock Incentive Plan; and the Del Monte Foods Company 2002 Stock Incentive Plan | DMFC | 10-Q | 10.9 | March 4, 2011 | |||||
| 10.56** | Employment Agreement and Promissory Note of Richard G. Wolford | DMFC | 10-K | 10.25 | September 22, 1998 | |||||
171
Table of Contents
| Exhibit |
Description |
Incorporated by Reference | ||||||||
| Filer |
Form |
Exhibit |
Filing Date | |||||||
| 10.57** | First Amendment to Employment Agreement of Richard G. Wolford, dated July 1, 1999 | DMFC | 10-K | 10.45 | September 30, 2002 | |||||
| 10.58** | Second Amendment to Employment Agreement of Richard G. Wolford, dated March 26, 2002 | DMFC | 10-K | 10.46 | September 30, 2002 | |||||
| 10.59** | Third Amendment to Employment Agreement by and between Del Monte Foods Company and Richard G. Wolford, executed as of November 11, 2004 | DMFC | 8-K | 10.1 | November 17, 2004 | |||||
| 10.60** | Fourth Amendment to Employment Agreement by and between Del Monte Foods Company and Richard G. Wolford, executed December 14, 2005 | DMFC | 10-Q | 10.8 | March 9, 2006 | |||||
| 10.61** | Fifth Amendment to Employment Agreement by and between Del Monte Foods Company and Richard G. Wolford, executed August 8, 2007 | DMFC | 10-Q | 10.1 | September 6, 2007 | |||||
| 10.62** | Sixth Amendment to Employment Agreement by and between Del Monte Foods Company and Richard G. Wolford, executed as of July 29, 2009 | DMFC | 10-Q | 10.1 | September 9, 2009 | |||||
| 10.63** | Letter Agreement regarding Make-Whole Payments between Del Monte Foods Company and Richard G. Wolford, dated December 20, 2010 | DMFC | 10-Q | 10.10 | March 4, 2011 | |||||
| 10.64** | Employment Agreement by and between Del Monte Corporation and David L. Meyers, executed as of November 11, 2004 | DMFC | 8-K | 10.2 | November 17, 2004 | |||||
| 10.65** | First Amendment to Employment Agreement by and between Del Monte Corporation and David L. Meyers, executed August 8, 2007 | DMFC | 10-Q | 10.2 | September 6, 2007 | |||||
| 10.66** | Letter Agreement regarding Make-Whole Payments between Del Monte Foods Company and David L. Meyers, dated December 20, 2010 | DMFC | 10-Q | 10.11 | March 4, 2011 | |||||
172
Table of Contents
| Exhibit |
Description |
Incorporated by Reference | ||||||||
| Filer |
Form |
Exhibit |
Filing Date | |||||||
| 10.67** | Employment Agreement by and between Del Monte Corporation and Nils Lommerin, executed as of November 11, 2004 | DMFC | 8-K | 10.3 | November 17, 2004 | |||||
| 10.68** | First Amendment to Employment Agreement by and between Del Monte Corporation and Nils Lommerin, executed August 8, 2007 | DMFC | 10-Q | 10.3 | September 6, 2007 | |||||
| 10.69** | Second Amendment to Employment Agreement, by and between Del Monte Corporation and Nils Lommerin, dated November 24, 2010 | DMFC | 10-Q | 10.4 | March 4, 2011 | |||||
| 10.70** | Letter Agreement regarding Make-Whole Payments between Del Monte Foods Company and Nils Lommerin, dated December 20, 2010 | DMFC | 10-Q | 10.12 | March 4, 2011 | |||||
| 10.71** | Employment Agreement by and between Del Monte Corporation and Timothy A. Cole, executed November 11, 2004 | DMFC | 10-K | 10.68 | June 25, 2008 | |||||
| 10.72** | First Amendment to Employment Agreement by and between Del Monte Corporation and Timothy A. Cole, executed August 8, 2007 | DMFC | 10-Q | 10.4 | September 6, 2007 | |||||
| 10.73** | Second Amendment to Employment Agreement, by and between Del Monte Corporation and Timothy A. Cole, dated November 24, 2010 | DMFC | 10-Q | 10.5 | March 4, 2011 | |||||
| *10.74** | Letter Agreement, dated as of April 28, 2011, between Blue Acquisition Group, Inc. (parent of Del Monte Foods Company) and Timothy A. Cole | |||||||||
| 10.75** | Employment Agreement, dated as of March 8, 2011, between Del Monte Corporation and David W. Allen | DMFC | 8-K | 10.19 | March 10, 2011 | |||||
| 10.76** | Letter Agreement regarding Make-Whole Payments between Del Monte Foods Company and David W. Allen, dated December 20, 2010 | DMFC | 10-Q | 10.13 | March 4, 2011 | |||||
173
Table of Contents
| Exhibit |
Description |
Incorporated by Reference | ||||||||
| Filer |
Form |
Exhibit |
Filing Date | |||||||
| 10.77** | Employment Agreement, dated as of March 8, 2011, between Del Monte Corporation and Larry E. Bodner | DMFC | 8-K | 10.18 | March 10, 2011 | |||||
| 10.78** | Letter Agreement regarding Make-Whole Payments between Del Monte Foods Company and Larry E. Bodner, dated December 20, 2010 | DMFC | 10-Q | 10.14 | March 4, 2011 | |||||
| *10.79** | Bonus Letter Agreement between Larry E. Bodner and Blue Acquisition Group, Inc., dated January 10, 2011 | |||||||||
| 10.80** | Letter Agreement, dated as of March 8, 2011, between Blue Acquisition Group, Inc. (parent of Del Monte Foods Company) and Neil Harrison | DMFC | 8-K | 10.17 | March 10, 2011 | |||||
| 10.81** | Employment Agreement, dated May 13, 2011, among Del Monte Corporation, Blue Acquisition Group, Inc. and David J. West | DMC | 8-K | 10.1 | May 19, 2011 | |||||
| *10.82** | Management Stockholder’s Agreement entered into as of June 17, 2011 among Blue Acquisition Group, Inc., Blue Holdings I, L.P. and David West | |||||||||
| *10.83** | Restricted Stock Award Agreement made effective as of June 17, 2011 among Blue Acquisition Group, Inc. and David West | |||||||||
| *10.84** | Form of Stock Option Agreement dated as of June 17, 2011 by and between Blue Acquisition Group, Inc. and Chief Executive Officer | |||||||||
| *10.85** | Sale Participation Agreement dated June 17, 2011 between Blue Holdings I, L.P. and David West | |||||||||
| 10.86** | Executive Severance Plan, as amended July 23, 2009 | DMFC | 10-Q | 10.2 | September 9, 2009 | |||||
| 10.87** | Amendment Number One to the Del Monte Corporation Executive Severance Plan, dated November 24, 2010 | DMFC | 10-Q | 10.7 | March 4, 2011 | |||||
| 10.88** | Executive Perquisite Plan, as amended and restated effective July 1, 2008 | DMFC | 10-K | 10.74 | June 25, 2008 | |||||
| 10.89** | Resolutions of the Board of Directors of Del Monte Foods Company Approved on November 24, 2010 relating to Code Section 280g | DMFC | 10-Q | 10.6 | March 4, 2011 | |||||
174
Table of Contents
| Exhibit |
Description |
Incorporated by Reference | ||||||||||
| Filer |
Form |
Exhibit |
Filing Date | |||||||||
| 10.90 | Master Confirmation entered into by Del Monte and Goldman Sachs on June 22, 2010 (confidential treatment has been granted as to portions of the Exhibit) | DMFC | 8-K | 10.1 | June 25, 2010 | |||||||
| 10.91 | Supplemental Confirmation entered into by Del Monte and Goldman Sachs on June 22, 2010 (confidential treatment has been granted as to portions of the Exhibit) | DMFC | 8-K | 10.2 | June 25, 2010 | |||||||
| *21 | Subsidiaries of Del Monte Corporation | |||||||||||
| *24 | Power of Attorney (see signature page to this Annual Report on Form 10-K) | |||||||||||
| *31.1 | Certification of the Chief Executive Officer pursuant to Section 302 of the Sarbanes-Oxley Act of 2002 | |||||||||||
| *31.2 | Certification of the Chief Financial Officer pursuant to Section 302 of the Sarbanes-Oxley Act of 2002 | |||||||||||
| *32.1 | Certification of the Chief Executive Officer pursuant to Section 906 of the Sarbanes-Oxley Act of 2002 | |||||||||||
| *32.2 | Certification of the Chief Financial Officer pursuant to Section 906 of the Sarbanes-Oxley Act of 2002 | |||||||||||
| * | filed or furnished herewith |
| ** | indicates a management contract or compensatory plan or arrangement |
175