Attached files
| file | filename |
|---|---|
| 8-K - FORM 8-K - CRAWFORD & CO | g27675e8vk.htm |
Exhibit 99.1

| SunTrust Robinson Humphrey Boston Marketing Trip July 12, 2011 |
| 2 Forward-looking Statements and Segment Operating Earnings Forward Looking Statements and Interim Results:This presentation contains forward-looking statements, including statements about the future financial condition, results of operations and earnings outlook of Crawford & Company. Statements, both qualitative and quantitative, that are not statements of historical fact may be "forward-looking" statements as defined in the Private Securities Litigation Reform Act of 1995 and other securities laws. Forward-looking statements involve a number of risks and uncertainties that could cause actual results to differ materially from historical experience or Crawford & Company's present expectations. Accordingly, no one should place undue reliance on forward-looking statements, which speak only as of the date on which they are made. Crawford & Company does not undertake to update forward-looking statements to reflect the impact of circumstances or events that may arise or not arise after the date the forward-looking statements are made. Results for any interim period presented herein are not necessarily indicative of results to be expected for the full year or for any other future period. For further information regarding Crawford & Company, and the risks and uncertainties involved in forward-looking statements, please read Crawford & Company's reports filed with the United States Securities and Exchange Commission and available at www.sec.gov or in the Investor Relations section of Crawford & Company's website at www.crawfordandcompany.com. Segment Operating Earnings:Under the Financial Accounting Standards Board's Accounting Standards Codification Topic 280, "Segment Reporting," the Company has defined segment operating earnings as the primary measure used by the Company to evaluate the results of each of its four operating segments. Segment operating earnings exclude income taxes, interest expense, amortization of customer-relationship intangible assets, stock option expense, earnings or loss attributable to non- controlling interests, certain unallocated corporate and shared costs, and certain other nonrecurring gains and expenses.Non-GAAP Financial Information:For additional information about certain non-GAAP financial information presented herein, see the Appendix following this presentation. |

| May 27, 2011 Since onr founding in 1941, Crawford & Company has grown from a small independent claims adjusting firm to a global provider of claims services, business process outsourcing and consulting to companies in more than 70 countries. As we mark onr platinum anniversary, Crawford would like to thank our employees, clients, partners and shareholders throughout the world whose tmst in us has contributed to our growth, innovative spirit and allowed us to gain unmatched expertise. 3 |
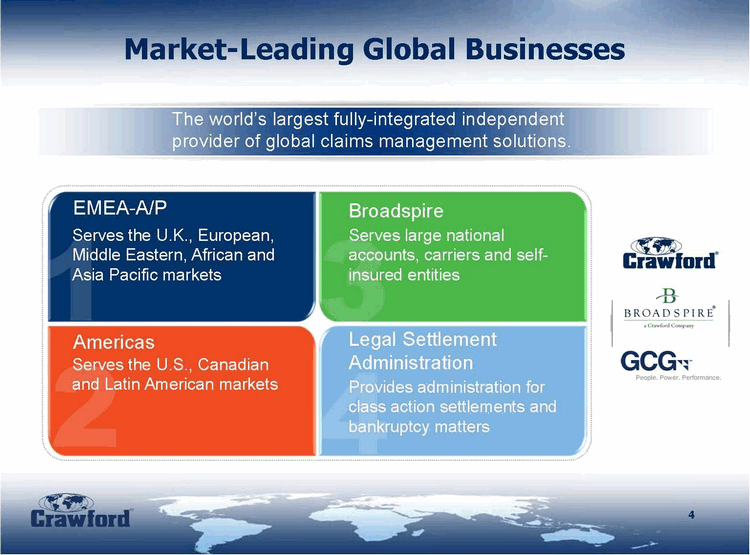
| 4 Market-Leading Global Businesses The world's largest fully-integrated independent provider of global claims management solutions. EMEA-A/P Americas Broadspire Legal Settlement Administration Serves the U.K., European, Middle Eastern, African and Asia Pacific markets Serves the U.S., Canadian and Latin American markets Serves large national accounts, carriers and self- insured entities Provides administration for class action settlements and bankruptcy matters |
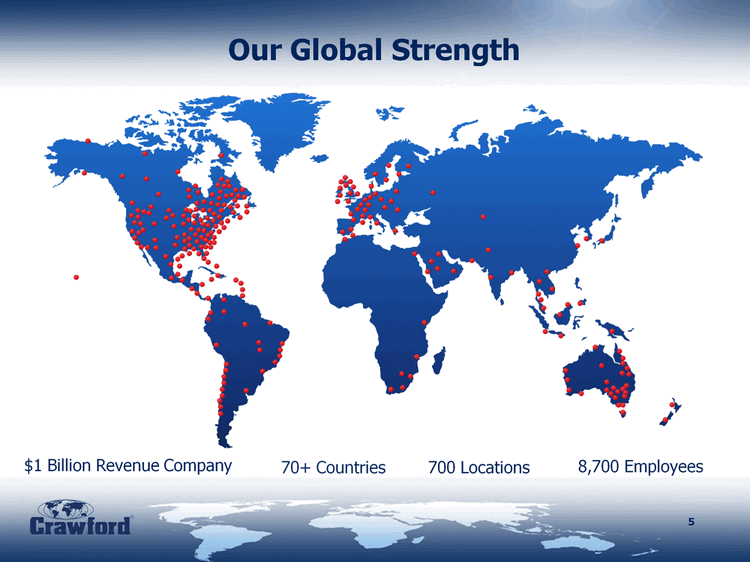
| 5 Our Global Strength $1 Billion Revenue Company 700 Locations 70+ Countries 8,700 Employees 8,700 Employees |

| Diversified Business and Clients Legal Settlement Administration Broadspire EMEA/AP Americas Revenue 0.159 0.238 0.277 0.325 Fiscal 2010 Revenues of $1.030 Billion EMEA/AP Property and Casualty Services Global Technical Services Global Marine and Transportation Global Markets 27.7% 23.8% 15.9% AmericasProperty and Casualty ServicesCatastrophe Management ServicesAuto Appraisal ServicesCentralized Claim AdministrationStrategic Warranty Services 32.6% Legal Settlement AdministrationClass Actions Securities Product LiabilityBankruptcy Administration BroadspireWorkers' Compensation and Liability Claims AdministrationMedical and Case ManagementLong-Term Care ServicesIntegrated Disability ManagementRisk Management Information Services (RSG)Claim Triage Solution (e-Triage) 6 |

| The Crawford System of Claims SolutionsSM The Crawford System is the most comprehensive global, integrated solution for all corporate, insurer, and re-insurer claims administration. 7 |

| Financial Review 8 |

| Crawford Financial Performance 2006 2007 2008 2009 2010 2011P* Consolidated Revenues 819.5 975.1 1049 970 1030 1055 $ in millions 2006 2007 2008 2009 2010 2011P* Net Income Attributable to Shareholders of Crawford and Company before Impairment Charge 15.011 16.116 32.259 25.2 38.2 36 $ in millions 1,030 820 975 1,049 15 16 32 970 25 9 38 Revenue CAGR of 5.2% from 2006 to projected 2011Strong performance in Legal Settlement Administration, organic growth in EMEA/AP, and acquisitions drove revenue growthOn a non-GAAP basis, before goodwill impairment charges in 2009 and 2010, net income CAGR of 18.8% from 2006 to projected 2011Strong cash generation from 2008 to 2010Dividend reinstated in first quarter 2011 at $0.02 per share 1,055 36 * Based on the midpoint of the company's guidance as of May 24, 2011 |
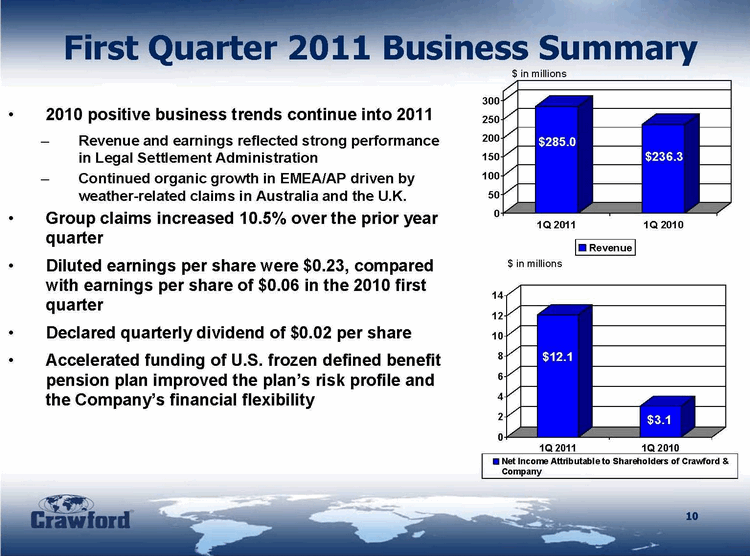
| First Quarter 2011 Business Summary 2010 positive business trends continue into 2011Revenue and earnings reflected strong performance in Legal Settlement AdministrationContinued organic growth in EMEA/AP driven by weather-related claims in Australia and the U.K.Group claims increased 10.5% over the prior year quarterDiluted earnings per share were $0.23, compared with earnings per share of $0.06 in the 2010 first quarterDeclared quarterly dividend of $0.02 per shareAccelerated funding of U.S. frozen defined benefit pension plan improved the plan's risk profile and the Company's financial flexibility 1Q 2011 1Q 2010 Revenue 285 236.3 $ in millions 1Q 2011 1Q 2010 Net Income Attributable to Shareholders of Crawford & Company 12.1 3.054 $ in millions $285.0 $236.3 $12.1 $3.1 10 |

| First Quarter 2011 Financials CRAWFORD & COMPANY Income Statement Highlights Unaudited (In Thousands, Except Earnings and Dividend Per Share Amounts and Percentages) Quarter Ended March 31 Revenues: Revenues Before Reimbursements Costs of Services Selling, General, and Administrative Expenses Corporate Interest Expense, Net Loss on Sublease Total Costs and Expenses before Reimbursements Income Before Income Taxes Provi si on for Income Taxes Net Income Net Income Attributable to Shareholders of Crawford & Company $12,147 Basic and Diluted Earnings Per Share Cash Dividends per Share: Class A and Class B Common Stock nm=not meaningful Crawford Less: Net Income Attributable to Noncontrolling Interests 2011 2010 % Change $285,038 $236,266 21% 206,942 176,546 17% 55,996 48,967 14% 4,136 4,137 0% - 2,663 nm 267,074 232,313 15% 17,964 3,953 354% 6,037 893 576% 11,927 3,060 290% (220) 6 nm $12,147 $3,054 298% $0.23 $0.06 283% $0.02 nm 11 First Quarter 2011 Financials |
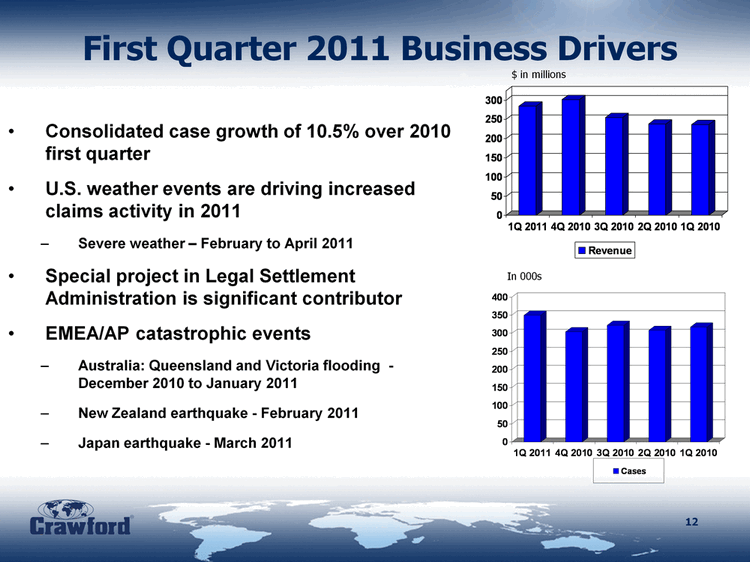
| First Quarter 2011 Business Drivers Consolidated case growth of 10.5% over 2010 first quarterU.S. weather events are driving increased claims activity in 2011Severe weather - February to April 2011Special project in Legal Settlement Administration is significant contributorEMEA/AP catastrophic eventsAustralia: Queensland and Victoria flooding - December 2010 to January 2011New Zealand earthquake - February 2011Japan earthquake - March 2011 1Q 2011 4Q 2010 3Q 2010 2Q 2010 1Q 2010 Revenue 285 301.477 254.523 238.151 236.266 $ in millions 1Q 2011 4Q 2010 3Q 2010 2Q 2010 1Q 2010 Cases 350.453 304.036 322.68 308.873 317.2 In 000s 12 |

| As of March 31, 2011 and December 31, 2010 (In Thousands} March 31, December 31, 2011 2010 Change Cash and cash equivalents $46,732 $93,540 ($46,808) Accounts receivable, net 167,832 142,521 25,311 Unbilled revenues, net 129,606 122,933 6,673 Total receivables 297,438 265,454 31,984 Goodwill 126,982 125,764 1,218 Deferred revenues, net 77,696 75,526 2,170 Pension liabilities 142,395 165,030 (22,635) Current portion of long-term debt, capital leases and short-term borrowings 16,785 2,891 13,894 Long-term debt, less current portion 219,829 220,437 (608) Total debt 236,614 223,328 13,286 Total stockholders’ equity attributable to Crawford & Company 102,029 89,516 12,513 Net debt* 189,882 129,788 60,094 * Net debt is defi ned by the Company as long-term de bt, capital leases and short-te rm borrow! rigs, net of cash and cash equivalents 13 First Quarter 2011 Financials |

| Operational Review 14 |
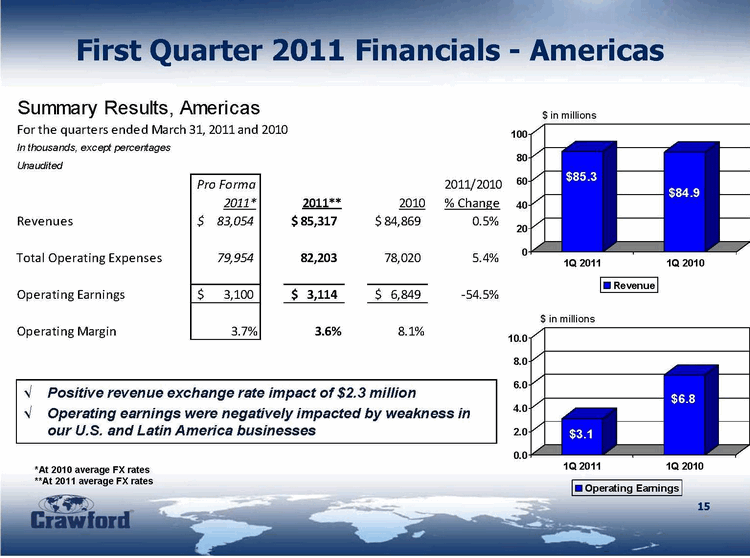
| 1Q 2011 1Q 2010 Revenue 85.3 84.9 1Q 2011 1Q 2010 Operating Earnings 3.114 6.849 Revenues Pro Forma 2011* $ 83,054 2011** $ 85,317 2010 $ 84,869 Total Operating Expenses 79,954 82,203 78,020 Operating Earnings $ 3,100 $ 3,114 $ 6,849 Operating Margin 3.7% 3.6% 8.1% 100 80 2011/2010 60 For the quarters ended March 31, 2011 and 2010 $85.3 $84.9 0.5% 5.4% - 54.5% $ in millions $ in millions $84.9 $85.3 $6.8 $3.1 Positive revenue exchange rate impact of $2.3 millionOperating earnings were negatively impacted by weakness in our U.S. and Latin America businesses First Quarter 2011 Financials - Americas 15 *At 2010 average FX rates**At 2011 average FX rates |
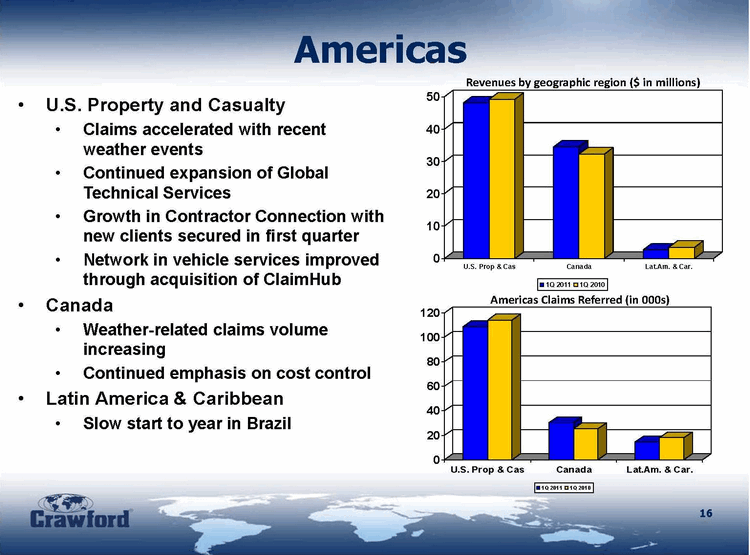
| Americas U.S. Prop & Cas Canada Lat.Am. & Car. 1Q 2011 108.72 30.288 14.567 1Q 2010 114.122 25.342 18.011 Americas Claims Referred (in 000s) U.S. Property and CasualtyClaims accelerated with recent weather eventsContinued expansion of Global Technical Services Growth in Contractor Connection with new clients secured in first quarterNetwork in vehicle services improved through acquisition of ClaimHubCanadaWeather-related claims volume increasingContinued emphasis on cost controlLatin America & CaribbeanSlow start to year in Brazil 16 U.S. Prop & Cas Canada Lat.Am. & Car. 1Q 2011 48.082 34.498 2.737 1Q 2010 49.161 32.309 3.399 Revenues by geographic region ($ in millions) |

| 17 Americas Competitive Advantages National presenceGreater scale, stewardship programs and resources to penetrate a larger national account market shareFully integrated services that deliver more effective program administration Crawford Central for centralized administration while leveraging the service center network (32 locations) for field workBest-in-class qualityBusiness Process Outsourcing solution for all claims management servicesFocused measurement and reporting on claims handling results - Performance Dashboard, client-specific key performance indicator (KPI) monitoring and reporting ExperienceGlobal Technical Services professionals for high value/complex claims in both property and liability lines of businessGreater flexibility and success in customizing programs for clients |
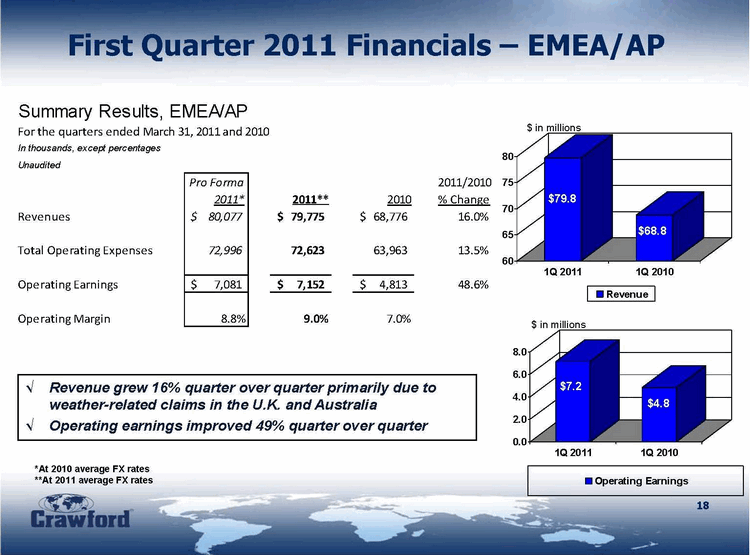
| 1Q 2011 1Q 2010 Revenue 79.775 68.776 Revenue at 2008 FX rates 1.223 1Q 2011 1Q 2010 Operating Earnings 7.152 4.813 Operating Earnings at 2008 FX rates 1 Summary Results, EMEA/AP For the quarters ended March 31, 2011 and 2010 2011** $ 79,775 72,623 $ 7,152 9.0% $ 80,077 Revenues 13.5% 48.6% Total Operating Expenses 72,996 $ 7,081 Operating Earnings In thousands, except percentages Unaudited Pro Forma 2011* 2010 $ 68,776 63,963 $ 4,813 8.8% $ in millions 8.0 6.0 4.0 2.0 0.0 1Q 2011 1Q 2010 *At 2010 average FX rates **At 2011 average FX rates Crawford I Operating Earnings 18 7.0% Operating Margin $ in millions $ in millions First Quarter 2011 Financials - EMEA/AP $79.8 $68.8 $4.8 Revenue grew 16% quarter over quarter primarily due to weather-related claims in the U.K. and AustraliaOperating earnings improved 49% quarter over quarter $7.2 *At 2010 average FX rates**At 2011 average FX rates 18 |

| EMEA/AP U.K. CEMEA Asia/Pacific 1Q 2011 55.883 41.495 40.183 1Q 2010 46.877 37.77 26.069 EMEA/AP Claims Referred (in 000s) Grow revenue and market shareNew client acquisition continuesExpansion of TPA offerings in CEMEARecruitment of GTS adjusters continuesU.K. Surge event in U.K. - small homeowner claimsExecuting work in progress reduction plan and improving DSOCEMEAClaims volume increasingWinning TPA accounts from independentsAcquisition of Studio Bolton (Italy)Asia/PacificThree catastrophes in 2011 Q1 19 U.K. CEMEA Asia/Pacific 1Q 2011 36.739 22.782 20.254 1Q 2010 33.345 21.946 13.485 Revenues by geographic region ($ in millions) |
| 20 EMEA/AP Competitive Advantages Global footprint Gateway for multinational corporations, global insurers and brokers to access global services, skills and technologyAcknowledged global market leader responding to increasing trends around catastrophic events, e.g. earthquakes, hurricanes, flooding, etc.Worldwide capabilities responding to high-profile global product recall programsExperienceMarket leader in global claims solutions with solid corporate governance practicesExperienced in handling high-value, complex industrial and marine lossesBest practices and innovation in developed markets Strong Client RelationshipsStandardized global practices, high-quality service and consistent deliveryDeveloping strategic client partnerships in key marketsLong term strategy and commitment to client relationship management - locally, regionally, globally |

| 1Q 2011 1Q 2010 Revenue 59.796 61.963 1Q 2011 1Q 2010 Operating Loss -3.16 -2.333 Revenues 2011 $ 59,796 2010 $ 61,963 % Change - 3.5% Total Operating Expenses 62,956 64,296 -2.1% Operating Loss $ (3,160) $ (2,333) 35.4% Operating Margin -5.3% -3.8% $ in millions $ in millions $59.8 $62.0 ($3.2) $(2.3) Revenue gains from casualty claim increases were more than offset by lower workers compensation revenueCost control initiatives continue First Quarter 2011 Financials - Broadspire 21 |

| Broadspire Claims referred (in 000s) Claims volume improved over Q1 2010Broadspire's fully-integrated offering continues to resonate in the marketRobust pipeline and new client wins are encouragingCost management initiatives continueStabilization of revenue during 2011 is a priorityPerformance expected to improve late in the year 22 Claims Mgmt Medical Mgmt Risk Mgmt 1Q 2011 25.437 29.887 4.472 1Q 2010 27.071 30.221 4.671 Revenues by service line ($ in millions) Worker's Comp. Casualty Other 1Q 2011 32.131 22.018 5.174 1Q 2010 32.169 14.544 4.304 |
| 23 Broadspire Competitive Advantages Fully integrated service modelImproved outcomes by teaming claims and medical managementFlexibilityAbility to work closely with clients to design programs that meet specific needs and requirementsStaff knowledge and expertiseFlawless program transition, consistent claim management and unsurpassed quality service deliverySuperior outcomes measurementQuantifiable measurements gauging our performance and providing insight for continued program improvementExceptional medical protocolsShorter durations and focused strategy drive early, successful return to work and increased productivityTechnologySingle source claim and data management of complete program history |

| 24 1Q 2011 1Q 2010 Revenue 60.15 20.658 1Q 2011 1Q 2010 Operating Earnings 16.998 3.238 Revenues 2011 $ 60,150 2010 $ 20,658 % Change 191.2% Total Operating Expenses 43,152 17,375 148.4% Operating Earnings $ 16,998 $ 3,283 417.8% Operating Margin 28.3% 15.9% $ in millions $ in millions $60.2 $20.7 $3.3 $17.0 Revenue and operating earnings increase reflects benefit of significant special projectBacklog of $110.0 million at March 31, 2011 versus $50.7 million at March 31, 2010 First Quarter 2011 Financials -Legal Settlement Administration |
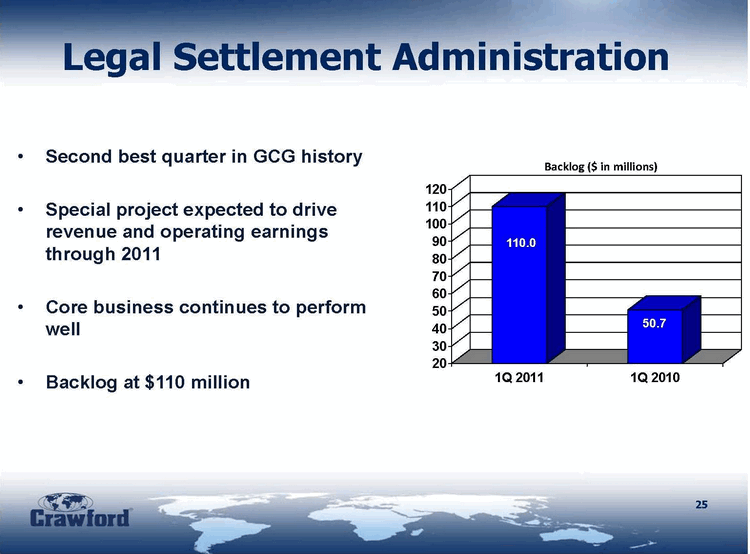
| Legal Settlement Administration 1Q 2011 1Q 2010 Backlog 110 50.7 Backlog ($ in millions) 110.0 50.7 Second best quarter in GCG historySpecial project expected to drive revenue and operating earnings through 2011Core business continues to perform wellBacklog at $110 million 25 |

| Legal Settlement Administration Products and Services The Garden City Group, Inc. (GCG) provides these core services:GCG Class Action Services provides technology-intensive administrative services for plaintiff and defense counsel and corporate defendants to expedite high-volume class action settlements. GCG Bankruptcy Services offers cost-effective, end-to-end solutions for managing the administration of bankruptcy cases under Chapter 11.GCG Communications specializes in legal notice programs for successful case administration. GCG Communications offers a range of complementary services for developing and implementing effective legal notice programs worldwide. 26 |

| 2011 Operational Focus Key account management/cross-selling through the Crawford System of Claims SolutionsGrow Business Process OutsourcingFurther expansion of Global Technical Services (GTS) and Contractor ConnectionExpansion of TPA offerings growing internationallyImprove margins through cost control in all business segments 27 |
| 2011 Guidance Full Year 2011 guidance as of May 24, 2011:Consolidated revenues before reimbursements between $1.04 billion and $1.07 billionConsolidated operating earnings between $74.0 million and $82.0 millionConsolidated cash provided by operating activities between $30.0 million and $35.0 millionAfter reflecting stock-based compensation expense, net corporate interest expense, customer-relationship intangible asset amortization expense, and income taxes, net income attributable to shareholders of Crawford & Company between $33.0 million and $38.0 million, or $0.60 to $0.70 diluted earnings per share 28 |

| Crawford is "Positioned for Growth" Access to growing global marketsIncreasing market share both domestic and internationallyCrawford expects to benefit from global consolidation of TPA vendorsDiverse customer baseHigh customer retention ratesEmphasis on quality and value provided sustains client confidenceDisciplined managementInvestment in enhanced technology in all business units 29 |
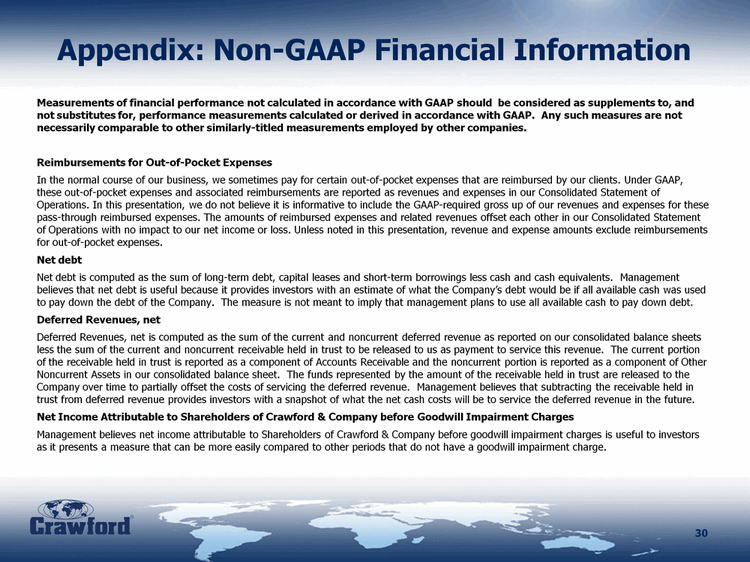
| Appendix: Non-GAAP Financial Information Measurements of financial performance not calculated in accordance with GAAP should be considered as supplements to, and not substitutes for, performance measurements calculated or derived in accordance with GAAP. Any such measures are not necessarily comparable to other similarly-titled measurements employed by other companies.Reimbursements for Out-of-Pocket ExpensesIn the normal course of our business, we sometimes pay for certain out-of-pocket expenses that are reimbursed by our clients. Under GAAP, these out-of-pocket expenses and associated reimbursements are reported as revenues and expenses in our Consolidated Statement of Operations. In this presentation, we do not believe it is informative to include the GAAP-required gross up of our revenues and expenses for these pass-through reimbursed expenses. The amounts of reimbursed expenses and related revenues offset each other in our Consolidated Statement of Operations with no impact to our net income or loss. Unless noted in this presentation, revenue and expense amounts exclude reimbursements for out-of-pocket expenses.Net debtNet debt is computed as the sum of long-term debt, capital leases and short-term borrowings less cash and cash equivalents. Management believes that net debt is useful because it provides investors with an estimate of what the Company's debt would be if all available cash was used to pay down the debt of the Company. The measure is not meant to imply that management plans to use all available cash to pay down debt.Deferred Revenues, netDeferred Revenues, net is computed as the sum of the current and noncurrent deferred revenue as reported on our consolidated balance sheets less the sum of the current and noncurrent receivable held in trust to be released to us as payment to service this revenue. The current portion of the receivable held in trust is reported as a component of Accounts Receivable and the noncurrent portion is reported as a component of Other Noncurrent Assets in our consolidated balance sheet. The funds represented by the amount of the receivable held in trust are released to the Company over time to partially offset the costs of servicing the deferred revenue. Management believes that subtracting the receivable held in trust from deferred revenue provides investors with a snapshot of what the net cash costs will be to service the deferred revenue in the future.Net Income Attributable to Shareholders of Crawford & Company before Goodwill Impairment ChargesManagement believes net income attributable to Shareholders of Crawford & Company before goodwill impairment charges is useful to investors as it presents a measure that can be more easily compared to other periods that do not have a goodwill impairment charge. 30 |

| Reconciliation of Non-GAAP Items Deferred Revenues, Net Deferred revenues, current Deferred revenues, noncurrent $ March 31, 2011 50,640 29,323 $ December 31, 2010 48,198 30,048 Total deferred revenues 79,963 78,246 Less: Receivable held in trust included in accounts receivable Receivable held in trust included in other noncurrent assets 1,661 606 1,661 1,059 Deferred revenues, net $ 77,696 $ 75,526 Net Debt Short-term borrowings Current installments of long-term debt and capital leases Long-term debt and capital leases, less current installments $ 14,000 2,785 219,829 $ 2,891 220,437 Total debt 236,614 223,328 Less: Cash and cash equivalents 46,732 93,540 Net debt $ 189,882 $ 129,788 Revenues Before Reimbursements Total Revenues Reimbursements Three Months Ended March 31, 2011 $ 304,108 (19,070) Three Months Ended March 31, 2010 $ 252,053 (15,787) Revenues Before Reimbursements $ 285,038 $ 236,266 Costs of Services Before Reimbursements Total Costs of Services Reimbursements $ 226,012 (19,070) $ 192,333 (15,787) Costs of Services Before Reimbursements $ 206,942 $ 176,546 31 |
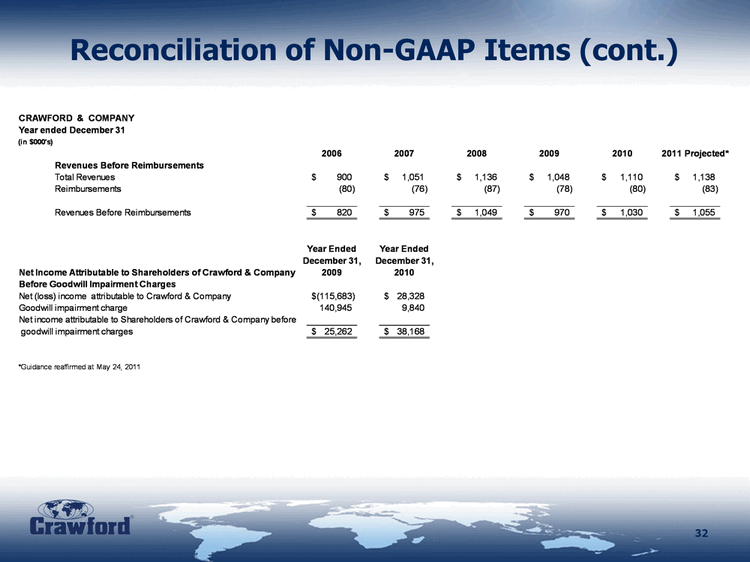
| Reconciliation of Non-GAAP Items (cont.) 32 |

| SunTrust Robison Humphrey Boston Marketing Trip July 12, 2011 |
